the Creative Commons Attribution 4.0 License.
the Creative Commons Attribution 4.0 License.
 | 20 Oct 2025
A pan-European analysis of large-scale drivers of severe convective outbreaks
Daniela I. V. Domeisen
Olivia Martius
Severe convective outbreaks have been an important driver of weather-related damages in Europe in recent years. Regional convection affecting thousands of square kilometres is driven by large-scale conditions that establish convectively favourable conditions. Systematically analysing the large-scale drivers of severe convective outbreaks helps link synoptic-scale predictability to convective-scale hazards, addressing persistent challenges in forecasting and impact assessment. We analyse the continental-scale atmospheric and land-surface conditions in the days leading up to widespread severe convective outbreaks in Europe with reanalysis data. We split Europe into regions that often experience severe convective outbreaks on the same day. Each region shows distinct dynamical and thermodynamic patterns leading up to an outbreak. Colder regions north of the Alps are associated with synoptic-scale upper-level wave patterns, accompanied by strong temperature anomalies, as they can be considered to be temperature limited. Severe convection in drier regions of eastern Europe is associated with greater moisture anomalies. Severe convection in regions bordering the Mediterranean is associated with weak upper-level flow anomalies. These regions have a climate that is favourable for convection, and convection is more frequent. The required additional contribution from the upper level is thus weaker.
- Article
(15503 KB) - Full-text XML
- BibTeX
- EndNote


Severe convective storms are one of the most expensive weather hazards in recent years, even the most expensive in Europe (Bowen et al., 2024), and have been increasing in frequency and severity over time (Rädler et al., 2019), with related costs steadily increasing (Hoeppe, 2015). Specifically, widespread outbreaks that cover thousands of square kilometres are responsible for severe weather hazards, such as widespread hail, flooding, and wind damage, causing serious societal impacts (Bowen et al., 2024). In this study, we analyse the synoptic conditions associated with widespread severe convective environments in different regions of Europe. Understanding the large-scale drivers is a key step toward learning the typical formation mechanisms of severe convective outbreaks and ultimately improving their predictability.
While previous studies have analysed the synoptic conditions tied to convection in single European regions (Wapler and James, 2014; Morris, 1986; Mohr et al., 2019; Piper et al., 2019; Feldmann et al., 2021; Barras et al., 2021; Nisi et al., 2018), there exists no systematic documentation of synoptic conditions across all of Europe, especially derived from a homogeneous dataset. Many studies use pre-classified weather regimes (Wapler and James, 2014; Feldmann et al., 2021; Barras et al., 2021; Nisi et al., 2018; Augenstein, 2025), which are very specific to the targeted region.
For western Europe, the Spanish plume is an established synoptic driver of severe convection (Morris, 1986). This pattern includes the approach of a cyclone, as well as the presence of an elevated dry layer stemming from either the Iberian Peninsula or northern Africa. This dry layer increases convective inhibition, preventing early onset of convection during the day. This evolution allows the convective environment to become more severe through surface heating before convection ultimately sets in. For central Europe, southwesterly mid-level winds are commonly associated with severe convection (Wapler and James, 2014; Mohr et al., 2019; Feldmann et al., 2021). However, hailstorms and, in particular, multi-day hail clusters are associated with westerly winds (Nisi et al., 2018; Barras et al., 2021). In the Mediterranean, short-wave cutoffs are known to cause extreme-precipitation events that are tied to stationary thunderstorms (Portal et al., 2024; Faranda et al., 2024). Mediterranean cyclones play a considerable role in the occurrence of convection, especially in autumn. Northern Italy, the most active convective region in Europe, has a climate favourable to convection (Taszarek et al., 2019; Kahraman et al., 2024; Cui et al., 2024). Severe hail is often associated with low-pressure systems north of the Alps (De Martin et al., 2025).
A typical model of severe convection, especially tornadoes, has been established for the USA, where the prefrontal zone of a cold front is particularly beneficial to severe convection and tornado formation due to the enhancement of deep-layer and low-level shear, owing to the positioning of the low-level, subtropical, and polar jet streams, as well as moisture and warm air advection in the warm sector (Doswell, 2001; Doswell and Bosart, 2001; Barnes, 1978; Barnes and Newton, 1986). While the proposed framework is not necessarily specific to the USA, we lack quantitative analyses for Europe that discuss the regional applicability of this framework.
With these regional assessments in mind, we present a comprehensive analysis of conditions associated with widespread convection in different regions of Europe based on 43 years of ERA5 reanalysis data from May to September (Hersbach et al., 2020). We focus on the extended summer months as the primary convective season in Europe (Taszarek et al., 2019; Giordani et al., 2024, autumn convection in the Mediterranean is mostly over the ocean). We split Europe into different sub-regions that experience convective conditions on the same day and compute composites of the atmospheric state on the first day of an event. Further analyses target differences between transient and persistent events. Finally, we inspect the influence of underlying trends.
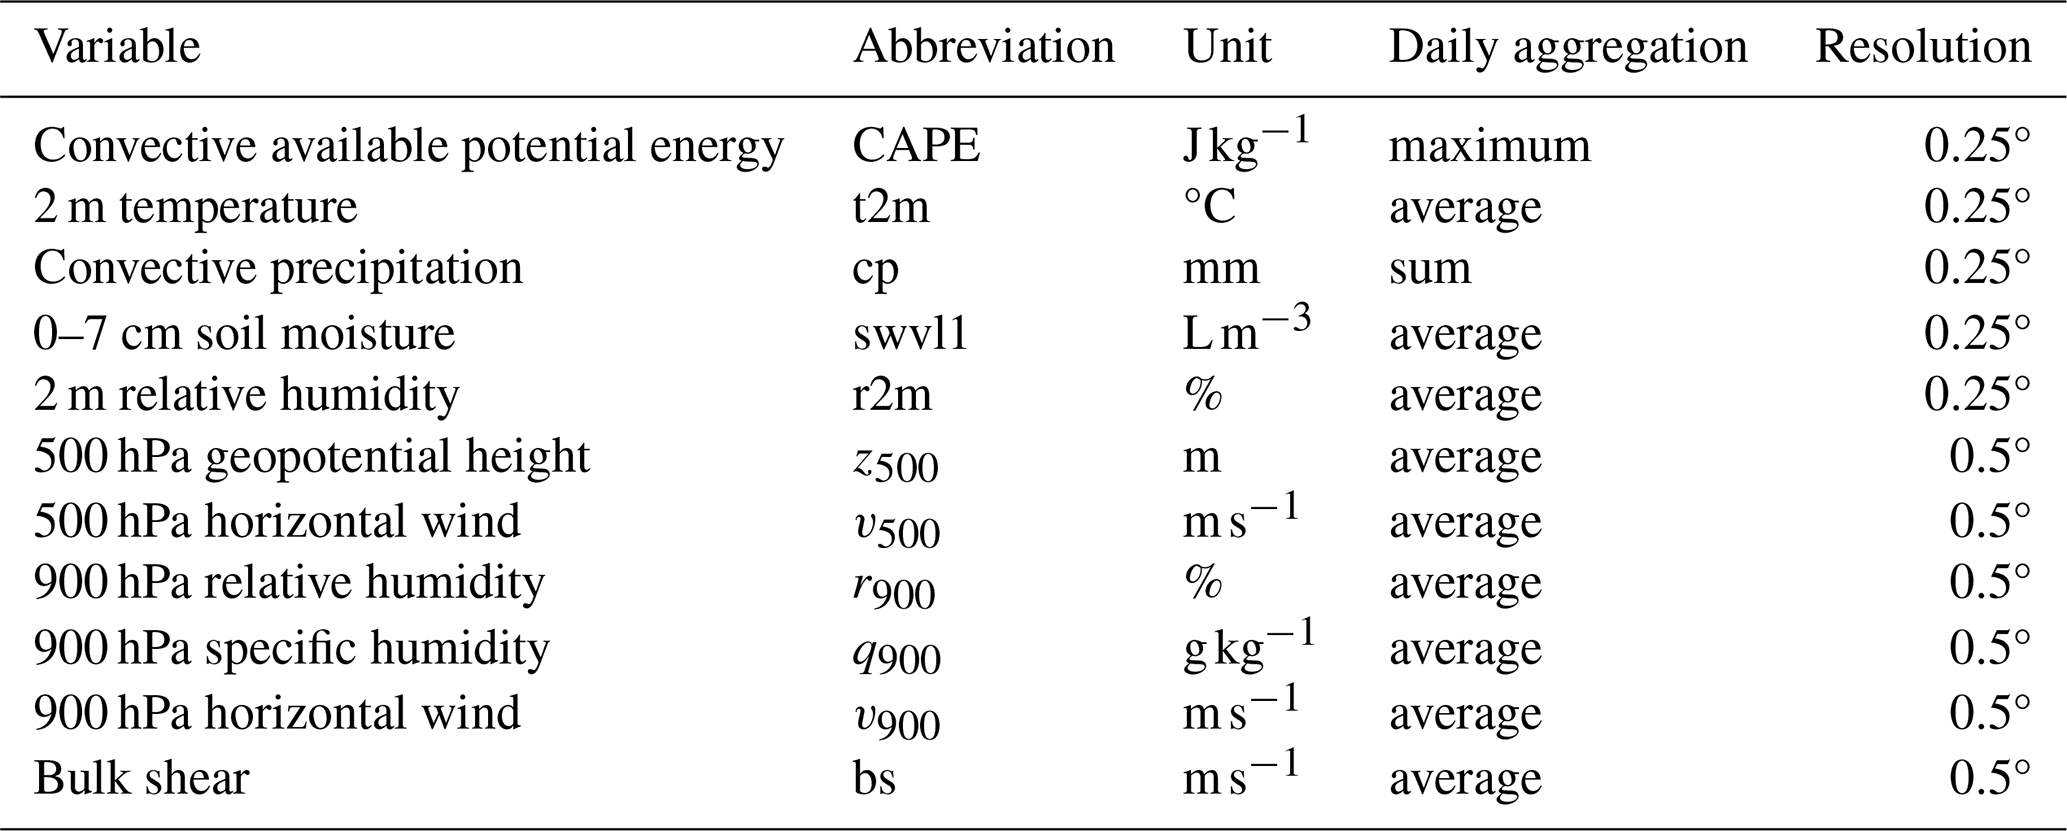
We use ERA5 reanalysis data (Hersbach et al., 2020) from 1980–2023, aggregated daily, and focus on the extended summer months from May to September. The variables, their resolution, and aggregation methods are listed in Table 1. As ERA5 parametrises convection and does not assimilate precipitation, convection itself is not well represented (Hersbach et al., 2020). We therefore define a convective proxy using maximum convective available potential energy (CAPE) and average 900–500 hPa bulk wind shear. We define a convective index (CIX) at 500 J kg−1 CAPE and 10 m s−1 bulk shear on the same day to indicate organised convection of at least multicellular mode (see Eq. 1; Taszarek et al., 2017; Brooks, 2009). We additionally use ATDnet lightning data gridded to binary days with or without lightning per grid point (Enno et al., 2020) from 2001–2023 to verify the validity of the defined convective proxy.
2.1 Convective regions in Europe
To obtain a regional division for convective events, we use k-means clustering (Hartigan and Wong, 1979). This approach differs from typical weather regimes, which are obtained by applying an aggregation method to the synoptic pressure field, specific to a particular region (Weusthoff, 2011; Hochman et al., 2021, here for Switzerland and western Europe). We strive to obtain cohesive regions throughout Europe that experience convection on the same day to subsequently identify their primary large-scale drivers associated with severe convection. By focusing on different convective regions, we can focus the synoptic-scale analysis on only convectively relevant events, rather than on all occurring weather situations. We use the binary CIX in k-means clustering (Hartigan and Wong, 1979) to identify regions that experience considerable CAPE and shear on the same day. Sensitivity experiments with a range of different numbers of clusters showed the meteorologically most cohesive regions at 10 clusters (see Sect. 3.1 for a discussion). A total of 1 out of these 10 clusters depicts convectively relatively inactive areas, and 1 cluster covers southeastern Spain and northern Africa. As we focus on Europe in this study, this cluster is not analysed further. The remaining eight clusters that we focus on here are shown in Fig. 1a. There are four regions bordering the Mediterranean and four regions located north of the Alps. We also experimented with rectangular regions based on lightning density data. These regions yielded similar results for synoptic atmospheric and land-surface anomalies, emphasising the robustness of the results. We nonetheless preferred to use a meteorologically informed, objective method of region identification over rectangular boxes.
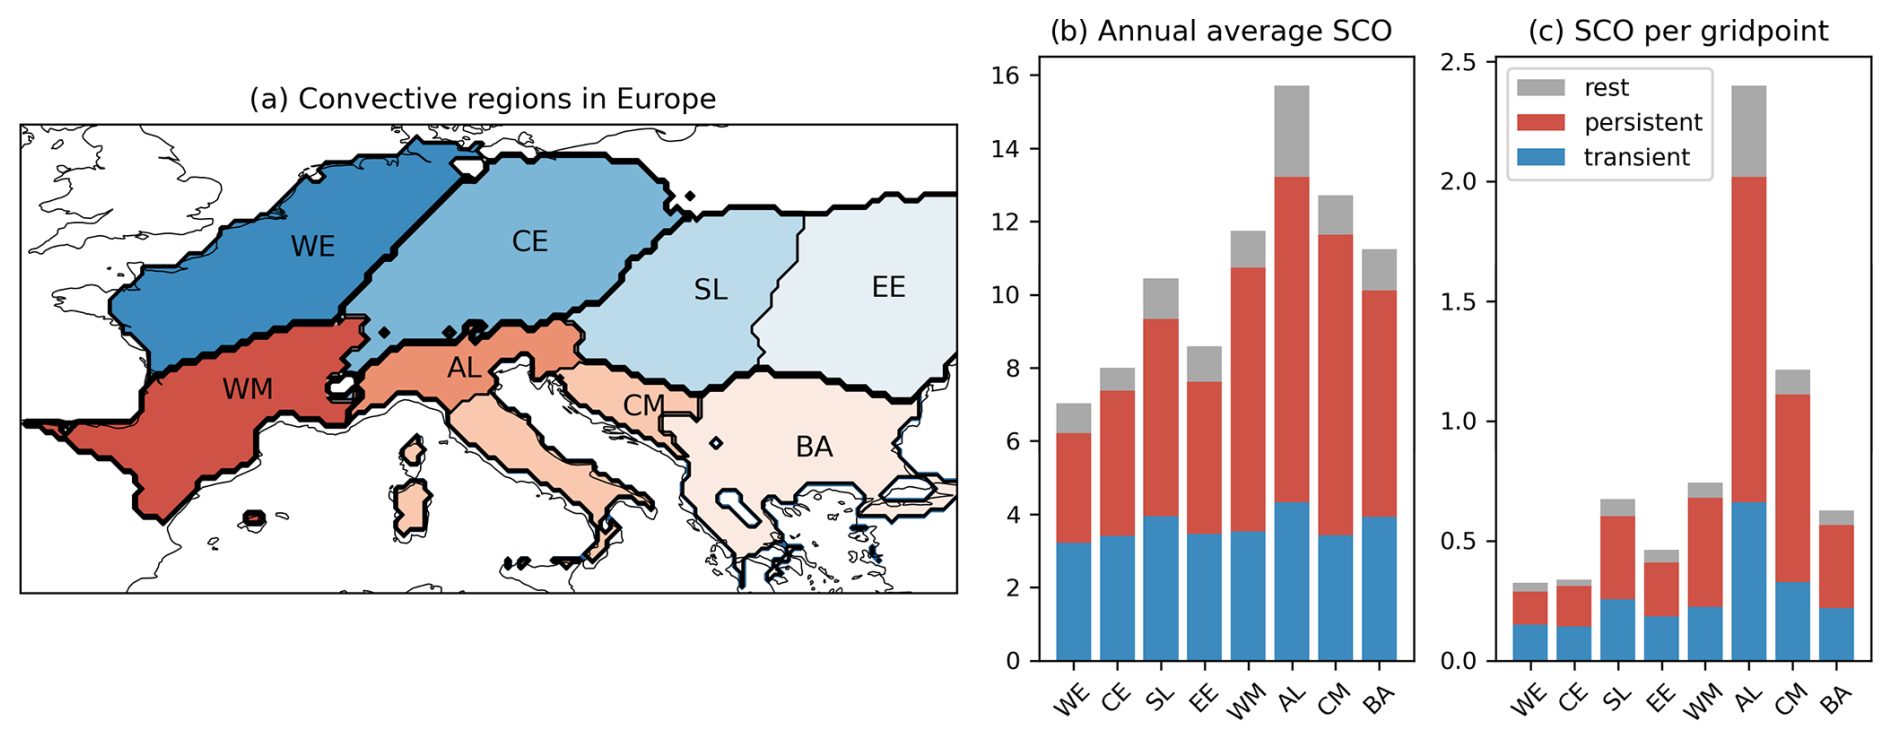
Figure 1Identified convective regions with k-means clustering and their convective activity. Panel (b) shows the number of annual SCO per aggregated region, and panel (c) shows the total number of SCO per regional grid point.
2.2 Convective event analysis
Within these regions, we define severe convective outbreaks (SCOs) as a minimum area of 100 grid points with a positive CIX, indicating widespread convection. Additionally, convective precipitation must be non-zero somewhere in the CIX area to ensure the presence of a convective trigger. Due to uncertainties regarding the convective parameterisation (Hersbach et al., 2020), we do not use convective precipitation as a direct proxy for convection; convective precipitation is only an indication of triggering (Taszarek et al., 2020). The results are not particularly sensitive to the chosen thresholds. We experimented with a range of CAPE (300–1000 J kg−1) and bulk shear values (10–20 m s−1) – all yielded qualitatively the same conclusions. The values of the thresholds modulate the number of detected events, as well as the absolute magnitude of the anomalies.
The SCO classification provides a binary daily event time series per region, showing all days that meet the SCO definition. We trim this down to only contain the first days for episodes that last multiple days. We additionally split the event dataset into single-day outbreaks and multi-day outbreaks to analyse the difference between persistent SCO and transient SCO. Transient is defined as a single SCO day followed by at least 2 non-SCO days. Persistence requires at least 2 consecutive SCO days. Events that meet neither criterion are classified as “rest”. An overview of all identified SCOs is provided in Fig. 1.
To calculate the anomalies, all descriptor variables are deseasonalised using a 10 d rolling window. For each region, we then create time-lagged composites that show the mean atmospheric conditions leading up to the first day of all SCOs for each region (see Sect. 3.2). We also derive the composites for transient and persistent SCOs separately in the same manner and depict them as Hovmöller diagrams, averaging across the latitude band of each region (see Sect. 3.3).
Statistical testing of anomalies is performed with a Mann–Whitney U test, comparing all non-SCO days to the first SCO day. Subsequently, false-discovery-rate (FDR) correction is applied to reduce artefacts introduced by repeating testing for every grid point (Ventura et al., 2004; Benjamini and Hochberg, 1995). For the Hovmöller diagrams, the aggregation of p values is performed with the Stouffer Z-score method, which accounts for spatial dependencies after the FDR correction (Stouffer et al., 1949).
Lastly, climatological trend analyses are performed using a linear trend fit on annual averages (see Sect. 3.4). Significance testing of the linear trends is done with the Hamed–Rao modification of the Mann–Kendall trend test, which accounts for annual lag-1 temporal autocorrelation (Hamed and Ramachandra Rao, 1998; Hussain and Mahmud, 2019).
3.1 Convective regions of Europe and their summer climate
Based on k-means clustering, we identify eight distinct convective regions in Europe, as shown in Fig. 1a. They can be split into regions adjoining the Mediterranean, from the western Mediterranean (WM) over Alta-Italia (AL) and the central Mediterranean (CM) to the Balkan Peninsula (BA) and regions north of the Alpine divide, including western Europe (WE), central Europe (CE), the Slavic area (SL), and eastern Europe (EE). This split aligns well with observed convective outbreaks, e.g. thunderstorms initiating in western Switzerland, moving into Germany and experiencing upscale growth, and finally decaying in Poland (e.g. Mohr et al., 2020; Wilhelm et al., 2021; Kopp et al., 2023); mesoscale convective systems in southern France (Arnould et al., 2025); derechos in northern France and Belgium (Fery and Faranda, 2024); and record-breaking hailstorms and squall lines in northern Italy (Eisenbach, 2023; De Martin et al., 2024, 2025; Manzato et al., 2022; Bagaglini et al., 2021).
The Mediterranean regions experience a higher frequency of SCOs, as well as a higher fraction of multi-day SCOs (Fig. 1b). Alta-Italia in particular is notable, as it not only has the highest number of SCOs but also has the smallest area, resulting in an exceptionally high grid-point-normalised SCO frequency (Fig. 1c). It is almost twice as high as in the neighbouring central Mediterranean. Contrastingly, the mid-latitude regions experience much lower absolute and area-normalised frequencies of SCOs. Western and central Europe shows the lowest SCO frequency. Transient events are up to half of all detected SCOs per region, whereas persistent events tend to make up the majority, especially in the Mediterranean regions. Persistent SCOs have an approximately exponential distribution regarding their duration, with 45 % of events lasting 2 d and 35 % lasting up to 4 d.
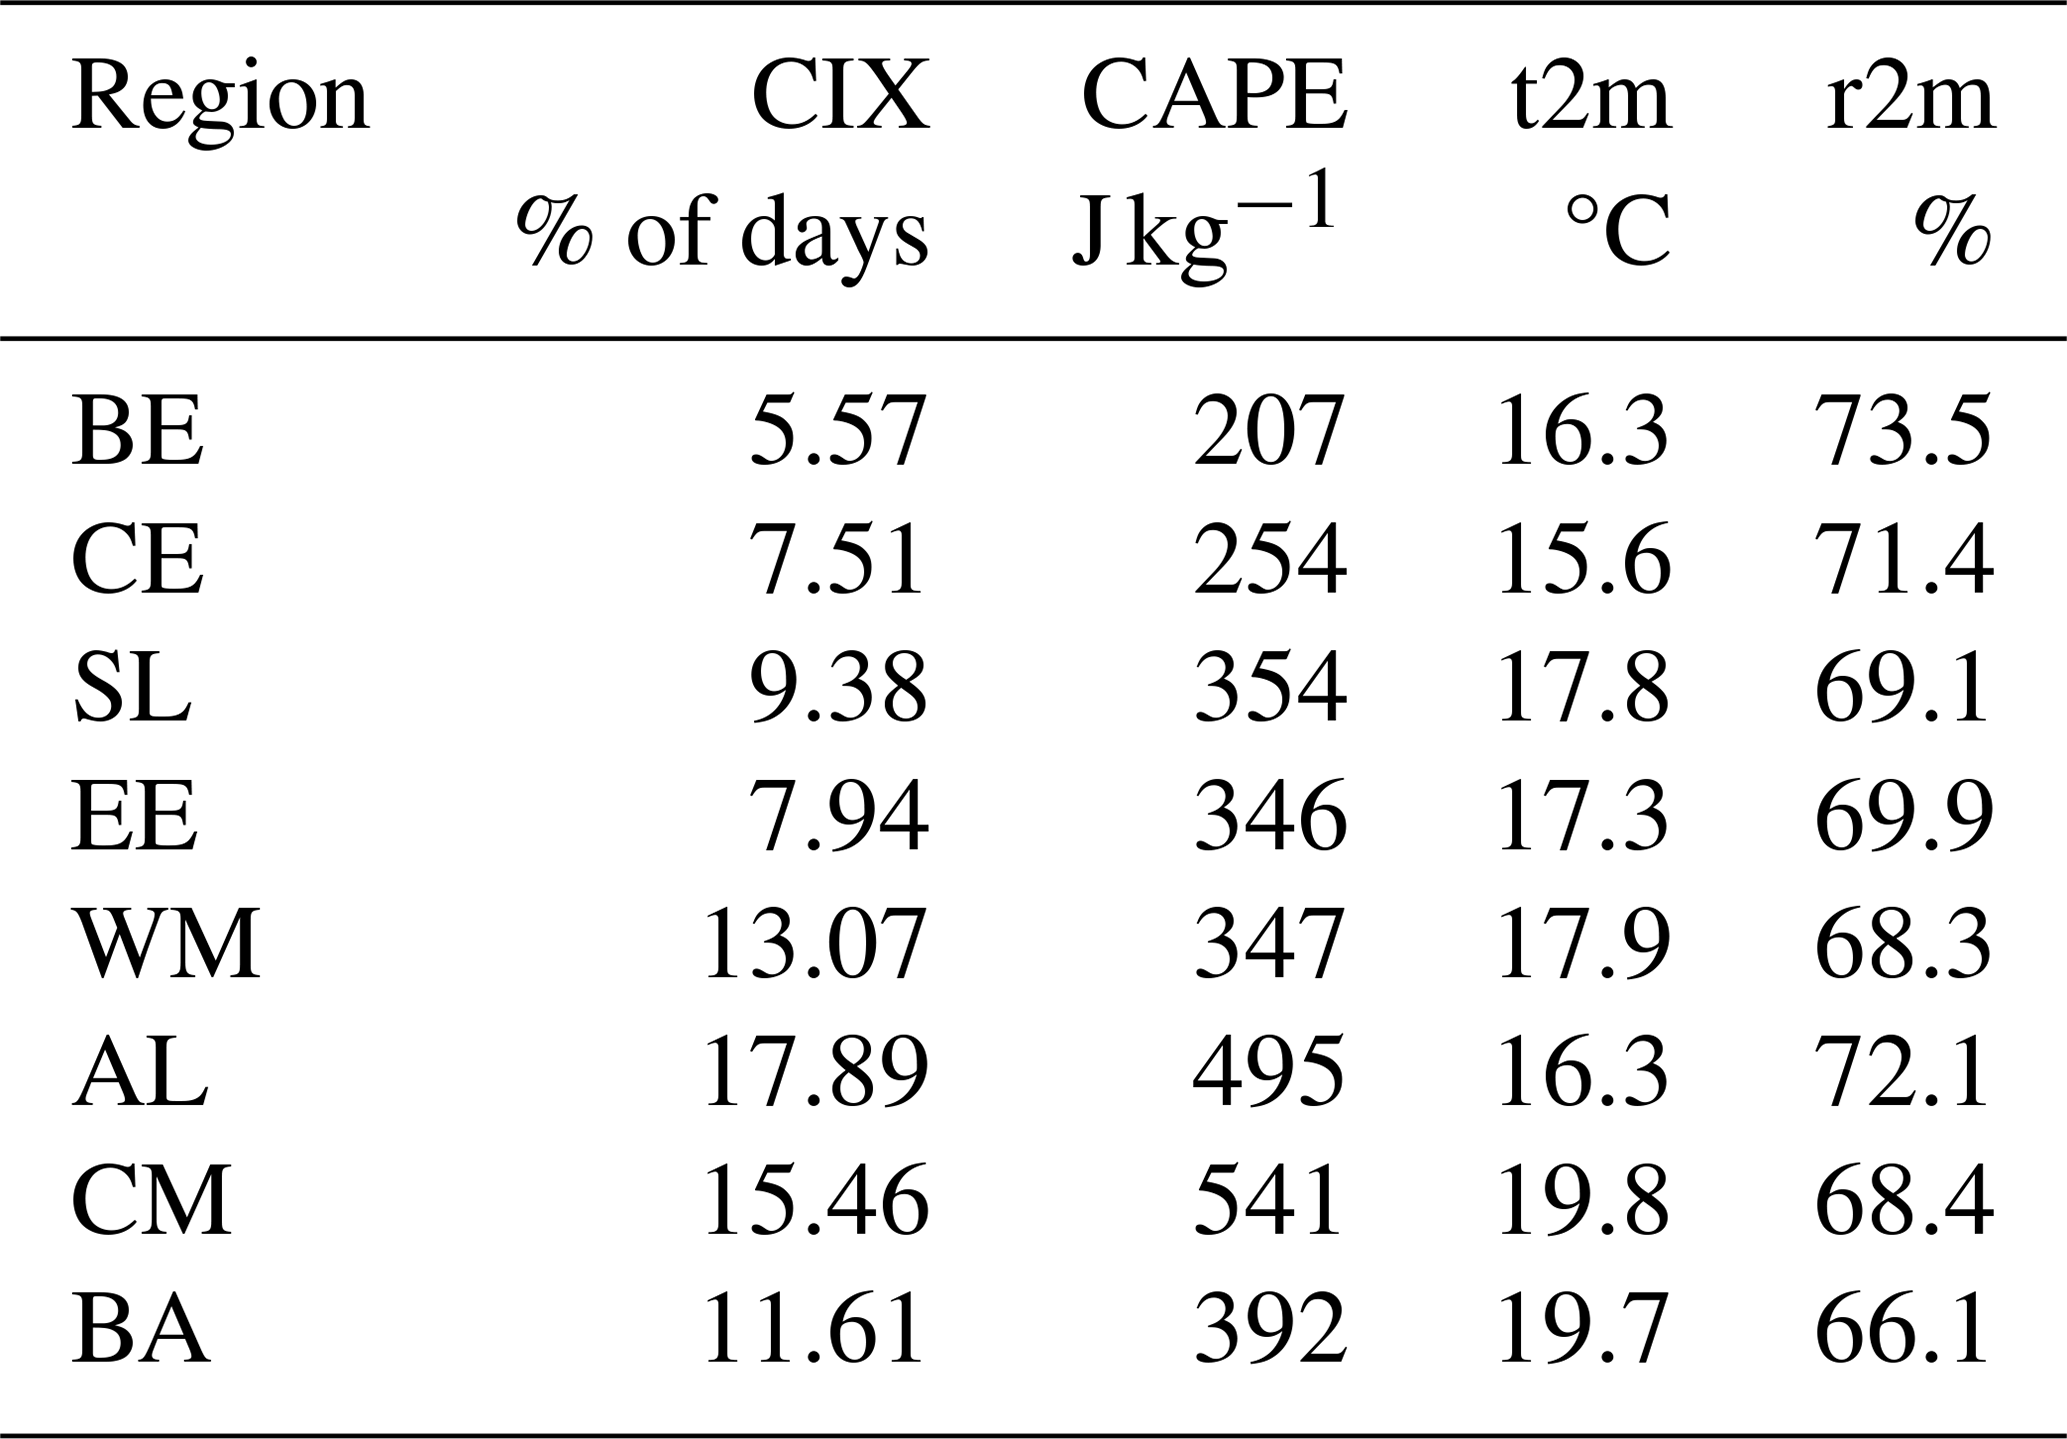
To better understand the differing magnitudes of large-scale descriptors for SCOs throughout Europe, we inspect the climatology of the CIX, CAPE, temperature, and relative humidity from May to September between 1980 and 2022 (see Fig. 2). Here, we focus on average instability and its prime ingredients: surface temperature and relative humidity. Provided that sufficient moisture is available to reach saturation early in the parcel profile, CAPE is highly correlated with surface temperature (Emanuel, 2023). Table 2 further lists the average value per region.
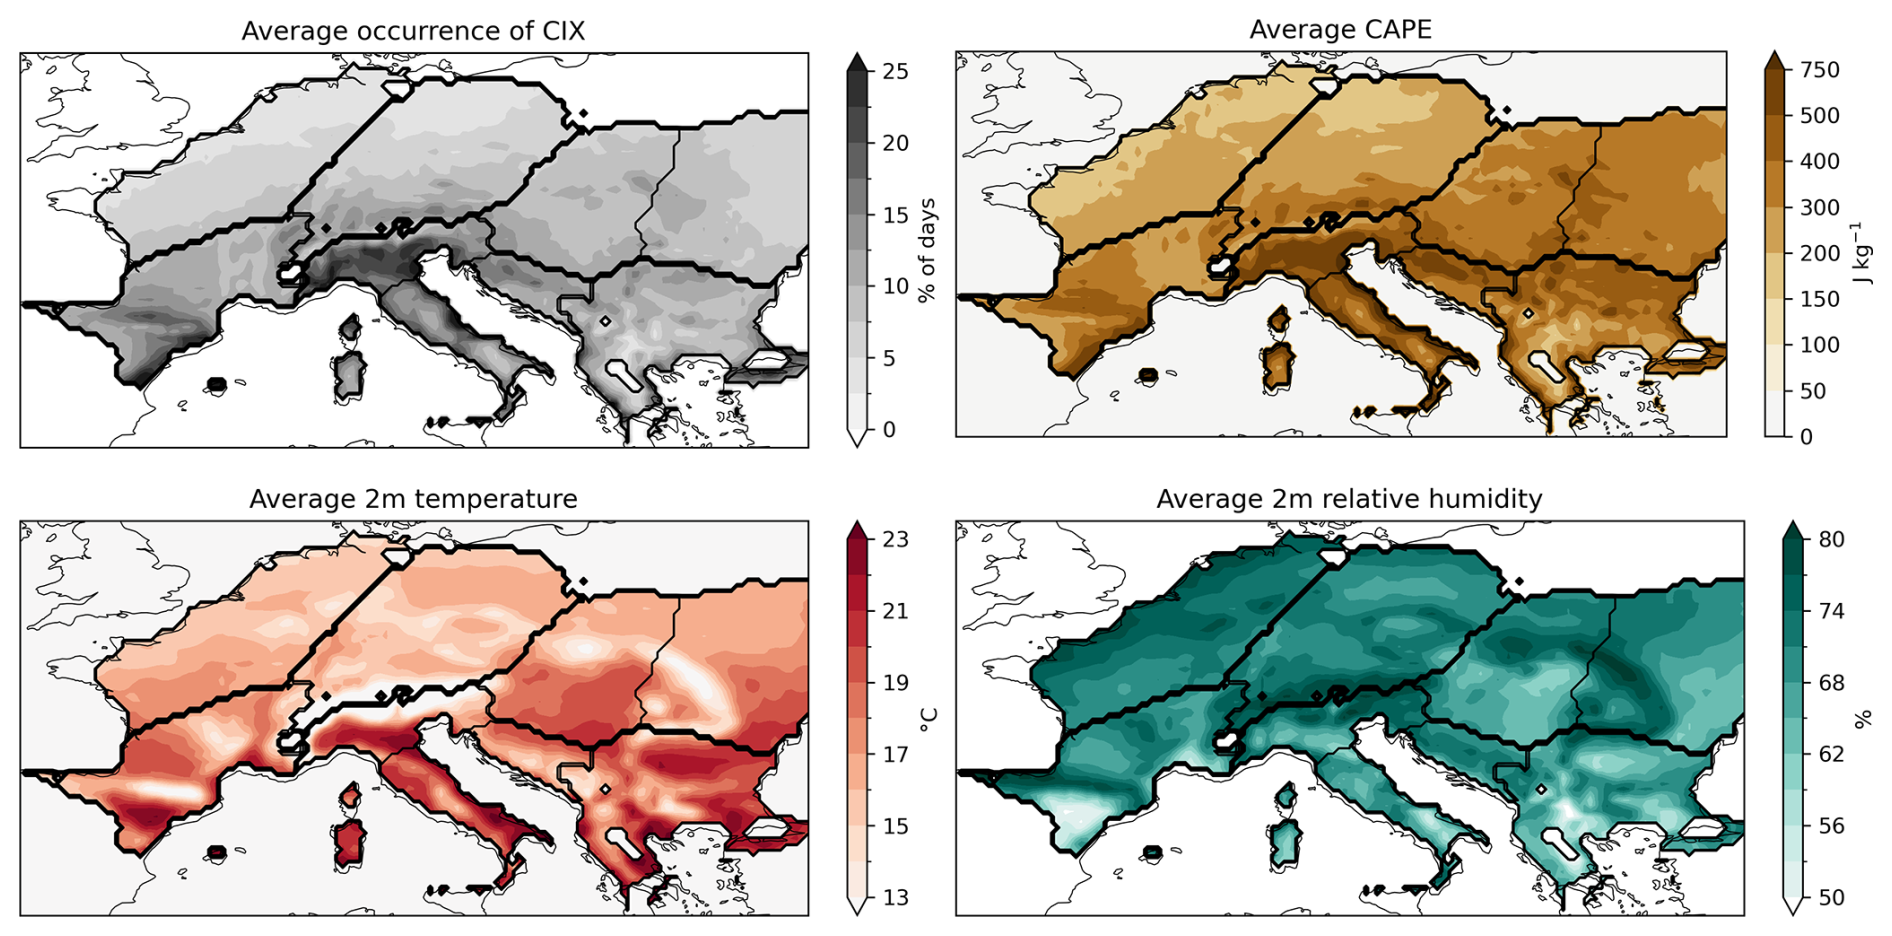
Figure 2Climatological mean convective activity, CAPE, 2 m temperature, and 2 m relative humidity.
Table 2Climatological average (1980–2023) of CIX, CAPE, 2 m temperature, and 2 m relative humidity during the convective season for the different regions.
There is a clear meridional gradient for the CIX, CAPE, and 2 m temperature, increasing southwards, whereas 2 m relative humidity is more heterogeneous, reflecting the topography (see Fig. 2). Western and central Europe has a climate that is considerably cooler than that of the Mediterranean and also than that of eastern continental Europe in the summertime. Instability is related to temperature, so the likelihood of widespread instability is greater in warmer regions (Emanuel, 2023). Consequently, average CAPE values are the smallest in western and central Europe and the highest in Alta-Italia. The low instability indicates that western Europe needs to depart far from its average conditions to support widespread convection. Surrounding the Mediterranean, unstable conditions are generally much more frequent, and the diurnal cycle alone can be a sufficient trigger for convection. The Slavic and eastern European areas are exposed to a more continental climate, with higher temperatures but less relative humidity. They have moderate amounts of convective activity and moderately warm temperatures (see Fig. 2, left column). While the western Mediterranean adjoins the Mediterranean Sea, it lies in an area that is still strongly affected by the Atlantic storm tracks and is upstream of the Mediterranean. Under predominantly westerly conditions, it lies downstream of the Atlantic and the Iberian Peninsula.
As an example of the Mediterranean region, we take a closer look at Alta-Italia, which is Europe's most active convective region. We compare Alta-Italia to western Europe, which is the least active region. Alta-Italia has the highest climatological average temperature and instability, which is approximately 5 °C warmer and 300 J kg−1 less stable than those of western Europe. At the same time, relative humidity is comparable at ∼70 %. Given the much higher climatological average, much smaller temperature anomalies and moisture advection, as well as forced lifting, are necessary to produce conditions suitable for widespread convection. In fact, the average climatological instability throughout the entire Po Valley exceeds the threshold of 500 J kg−1 CAPE. Pointwise, the CIX is met in Alta-Italia approximately 25 % of the time, while in western Europe, this ranges from 5 %–10 %.
3.2 Large-scale descriptors of convection
We first show composites of anomalous lightning occurrence on the first day of all SCOs. This allows us to verify the assumptions made in the CIX and SCO definitions. As the lightning data are only available during half of the study period (2001–2023), these are not directly comparable to the following analyses. In Fig. 3, anomalously high lightning activity for each region is evident, highlighting that an SCO defined on CAPE, bulk shear, and convective precipitation does correspond to elevated lightning activity and hence active convection.
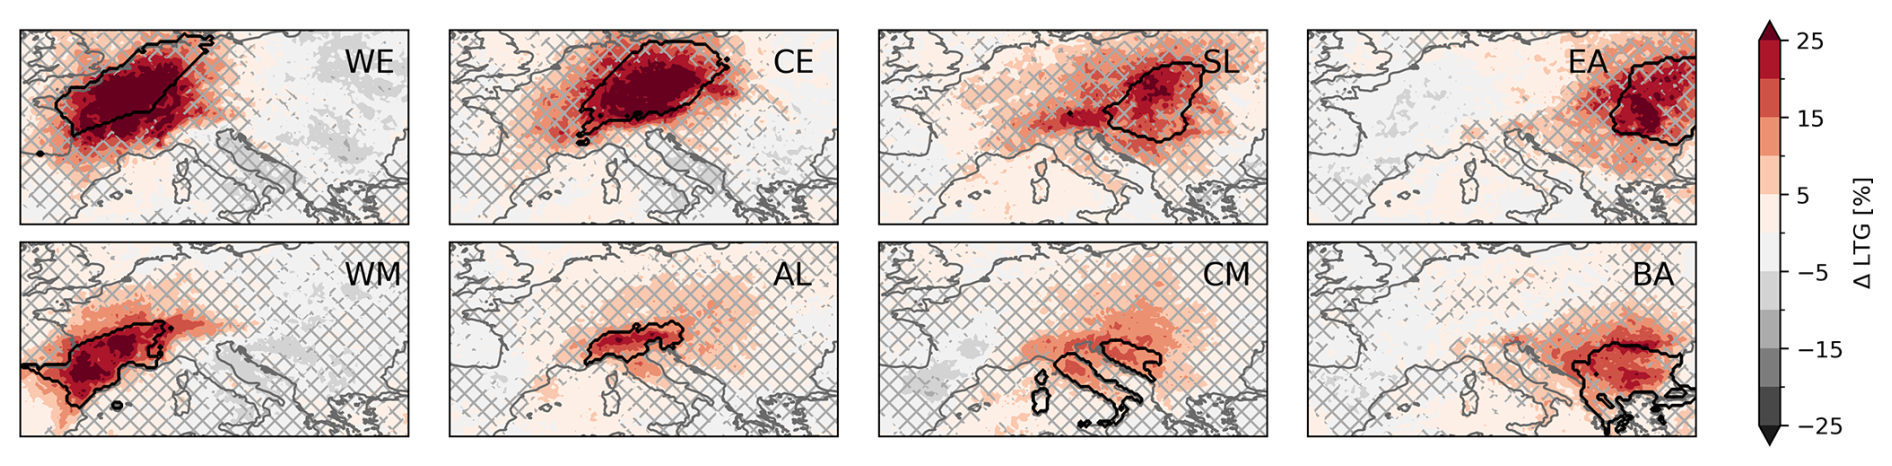
Figure 3Anomaly of lightning presence on the first day of SCO. The number of SCOs per region is depicted in Fig. 1b. Hatching is applied to non-significant areas. The convective region is outlined in black and labelled in the top-right corner of each panel.
To get an overview of the large-scale flow, we first inspect composites of convective precipitation, 500 hPa geopotential height, 2 m temperature, and sea-surface temperature (SST) on the first day of all SCOs (see Fig. 4). Convective precipitation confirms the effectiveness of the regional classification and the SCO definition with the CIX. In each region, we find a maximum in convective precipitation values on the day of an SCO (Fig. 4, top two rows). However, convective precipitation is not exclusive to SCO. Frontal zones also tend to trigger the convective parameterisation while generally not fulfilling the SCO criterion. Thus, we also find positive convective precipitation anomalies upstream of most target regions.
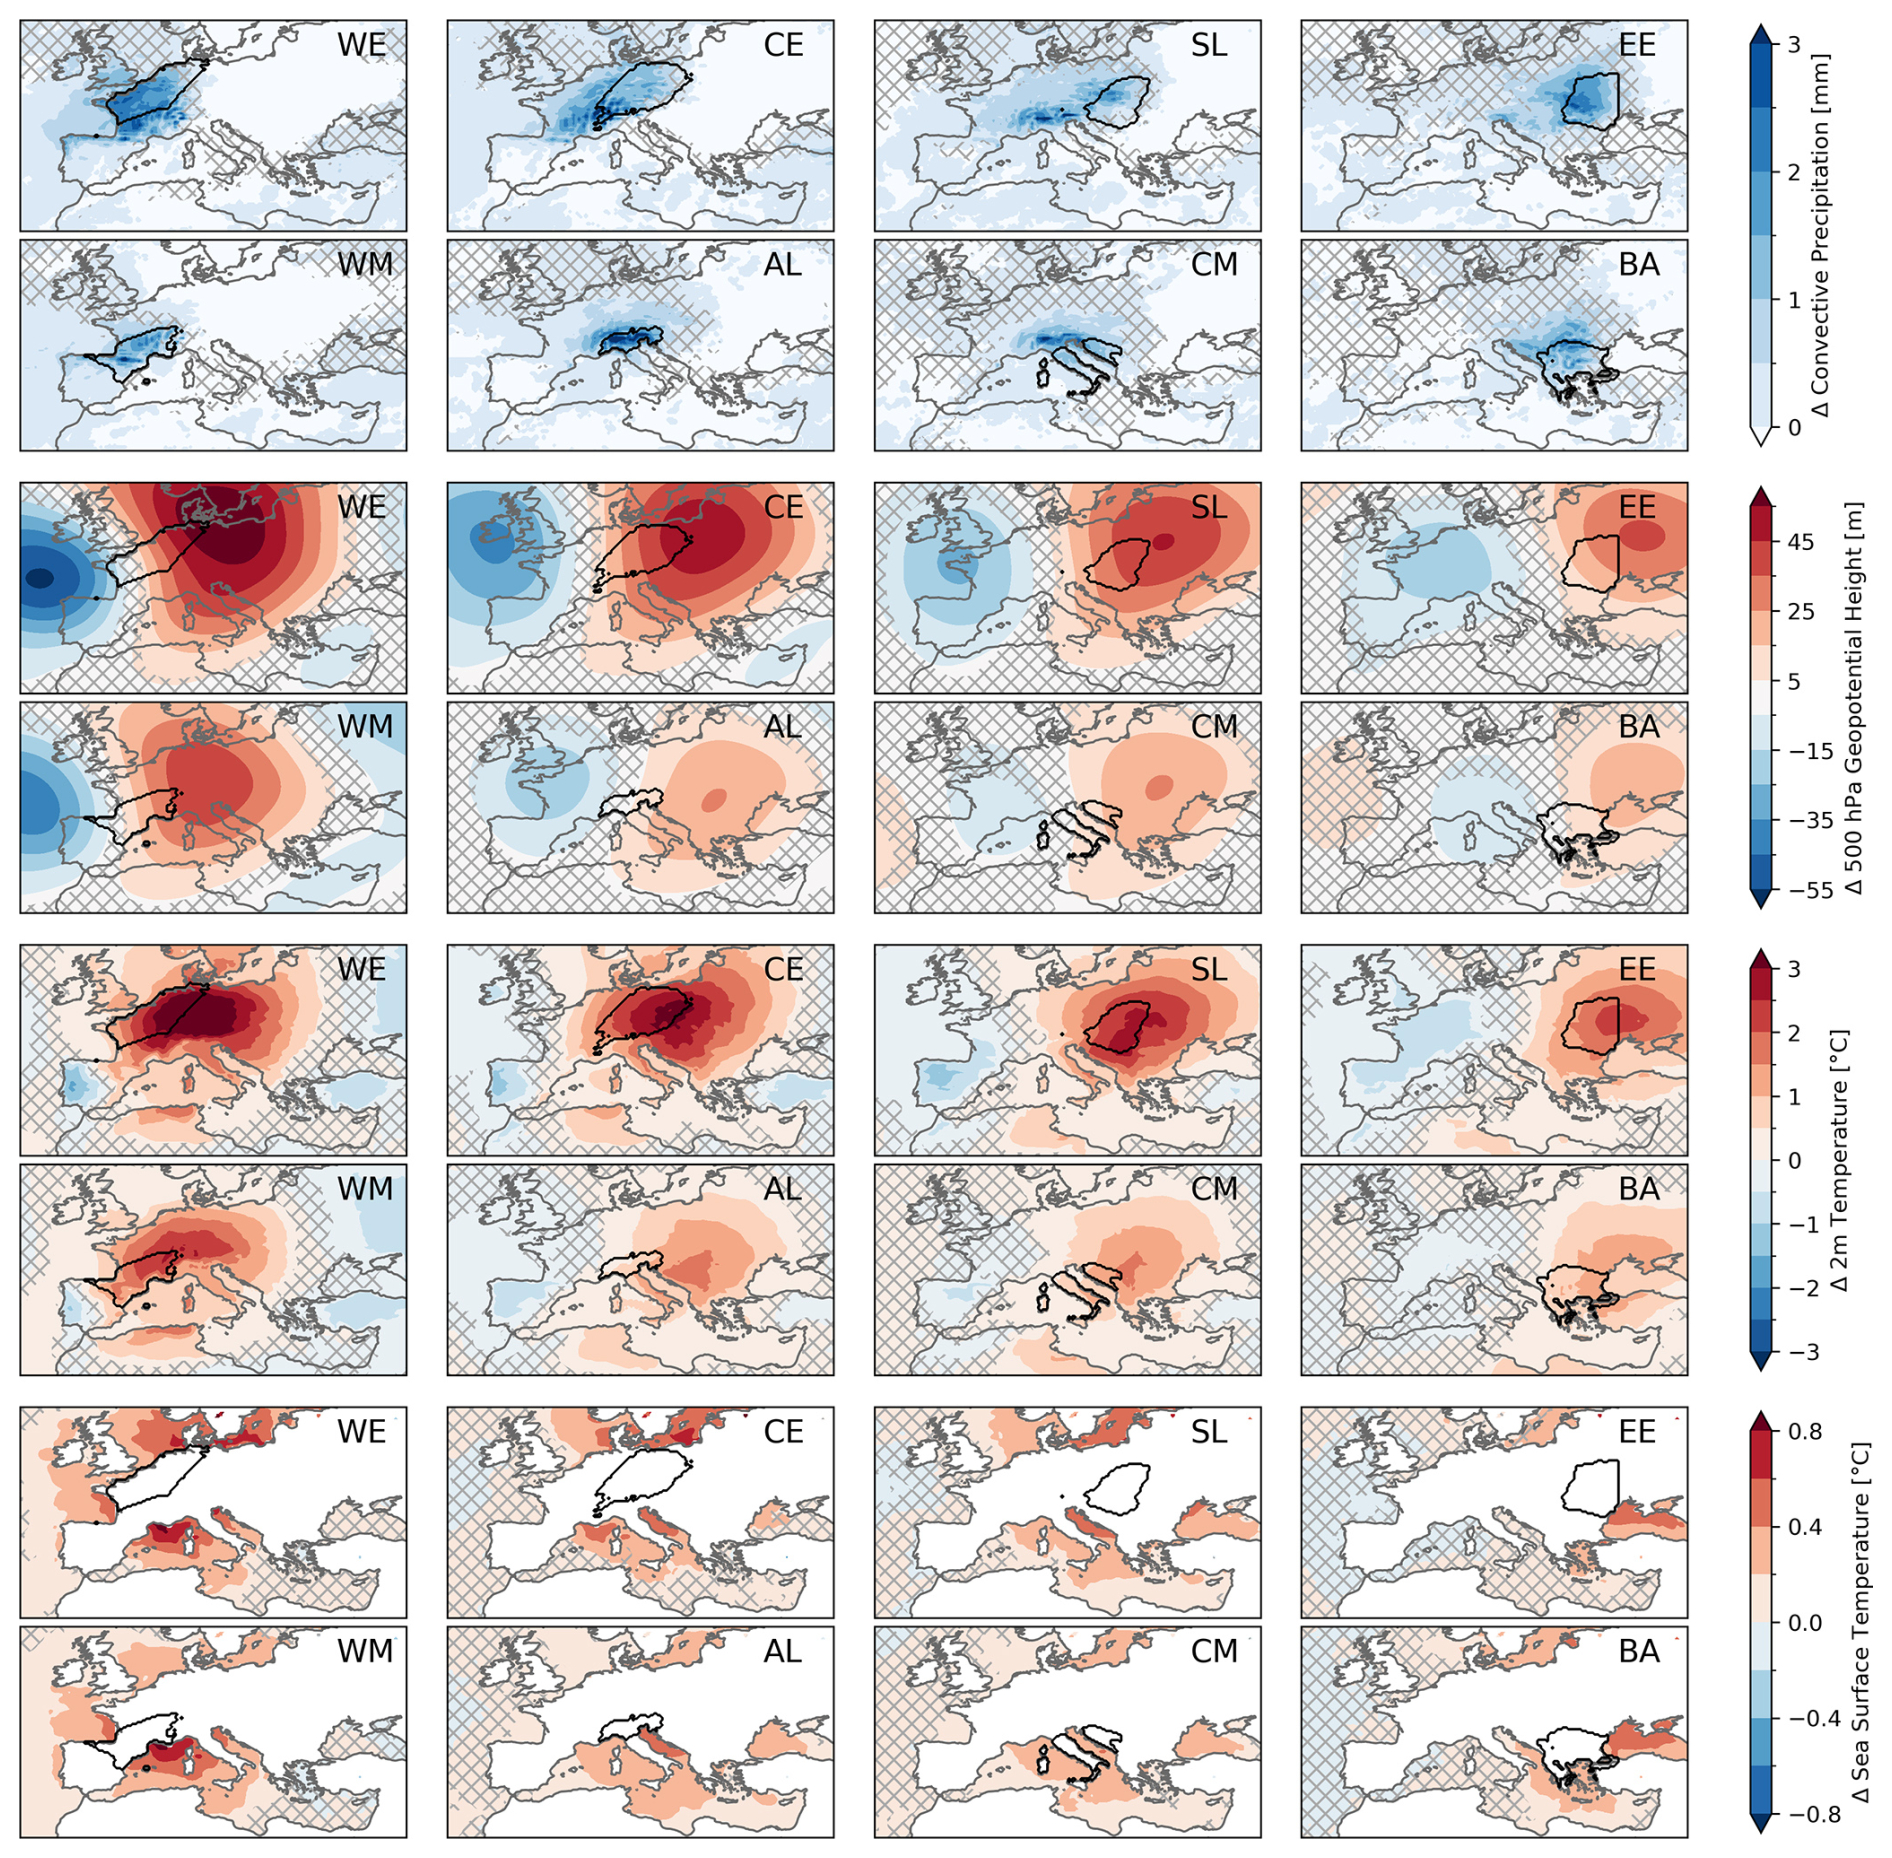
Figure 4Synoptic anomalies on the first day of SCO. The number of SCOs per region is depicted in Fig. 1b. Hatching is applied to non-significant areas. The convective region is outlined in black and labelled in the top-right corner of each panel.
The geopotential height is an effective descriptor of the synoptic weather pattern, allowing a comparison with e.g. Doswell and Bosart (2001). The 2 m temperature and SST strongly relate to instability in terms of surface heating, while SST also plays an important role as a possible moisture source.
The geopotential height anomaly reveals synoptic, dynamical differences between the mid-latitude and Mediterranean regions (Fig. 4, second two rows). Events in mid-latitude regions are associated with a strong anomaly in geopotential height, with a deep ridge situated slightly downstream of convection and a pronounced trough approaching (Fig. 4, regions WE, CE, and SL). This dynamical driver is stronger the further west the region is located. To a lesser degree, this is also evident in the Mediterranean regions, especially in the western Mediterranean. The further east the region lies, the less pronounced the geopotential height anomalies are, indicating that convection is related more to local conditions rather than synoptic conditions (Fig. 4, regions EE and CM). To obtain the relative variability of geopotential height, we compute the standard deviation of geopotential height over the entire time period, as well as only during convective events. We then normalise the event variability with the reference variability and express the deviations in percent. Positive anomalies experience more variability than normal, whereas negative areas have less variability than normal. Investigating the relative variability shows that the variability is elevated in all regions where the ridge is located, while it is slightly reduced in the location of the trough (see Fig. 5). The relative variability is the smallest for Alta-Italia and the central Mediterranean, indicating that they are consistently associated with much weaker geopotential height anomalies than other regions.
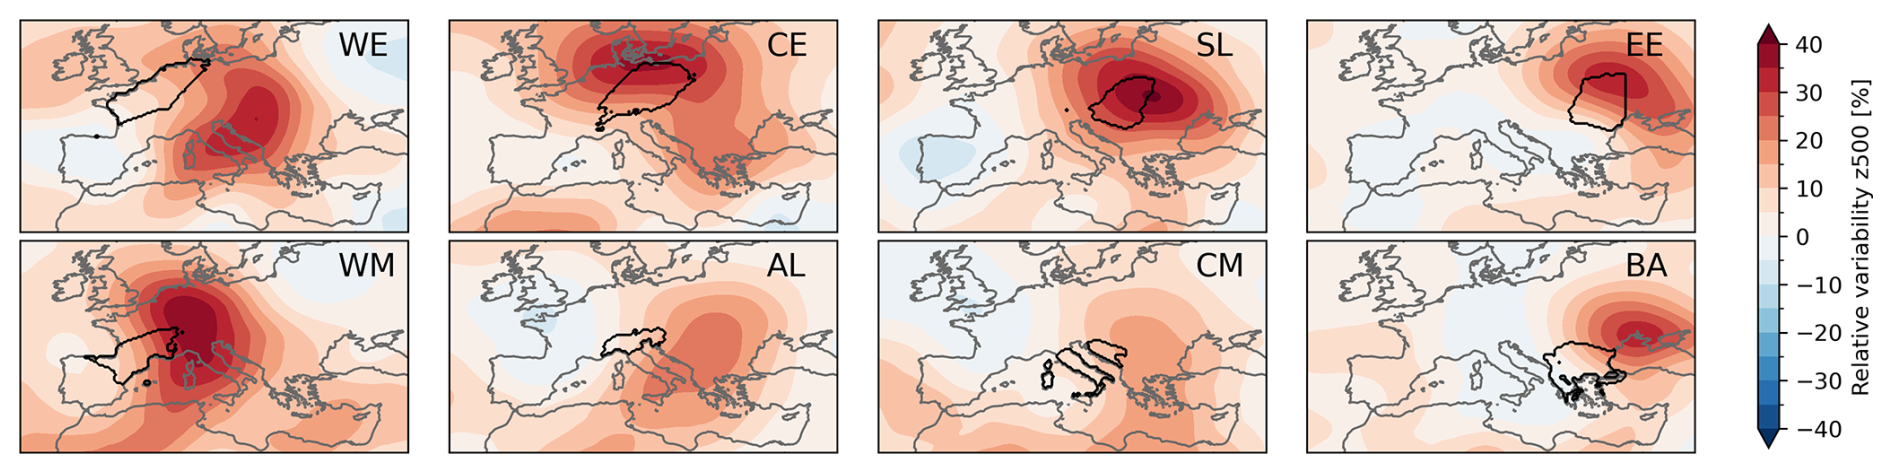
Figure 5Relative variability of z500 anomaly during an SCO compared to the rest of the analysed period in each region.
We next inspect temperature anomalies (Fig. 4, third two rows). The patterns in temperature anomalies further emphasise the divide between the northern and Mediterranean regions. SCOs in western and central Europe, the regions with the strongest geopotential anomalies, are also associated with the most substantial temperature anomalies under the ridge, reaching up to 3.8 °C. Likewise, the troughs in the upper-level wave pattern are accompanied by negative temperature anomalies, albeit less pronounced than the positive anomalies. The positive temperature anomalies are mirrored in SST (Fig. 4, bottom two rows), indicating that the anomalies have a certain persistence (see also Sect. 3.3). Based on the 800 hPa wind field (Fig. 6, wind field superposed on 800 hPa relative humidity), all regions lie downstream at the 800 hPa level of positive SST anomalies in the Mediterranean and Black seas. SCOs in western and central Europe are associated with substantial warming of the Baltic and North seas and, to a lesser extent, the Mediterranean Sea. For SCOs in the Slavic region, this anomaly shifts further east, with greater anomalies over the Baltic, Black, and Adriatic seas. For SCOs in eastern Europe, the Mediterranean SST anomaly is weaker, and positive anomalies are primarily located over the Baltic and Black seas, with a weak (not statistically significant) negative anomaly over the western Mediterranean. The Mediterranean regions show much weaker anomalies but still generally above-average SST. SCOs in the western Mediterranean are associated with the largest SST anomaly, located just off the coast. The consistently positive land-surface and sea-surface temperature anomalies highlight the positive correlation between temperature and CAPE (Emanuel, 2023). The warm seas emphasise the persistence of the positive temperature anomalies, as SST anomaly changes are relatively slow and require greater forcing. Additionally, the warm seas can act as a moisture source, with evaporation increasing at higher temperatures and correlating with convective activity (Morgenstern et al., 2023; Wapler and James, 2014).
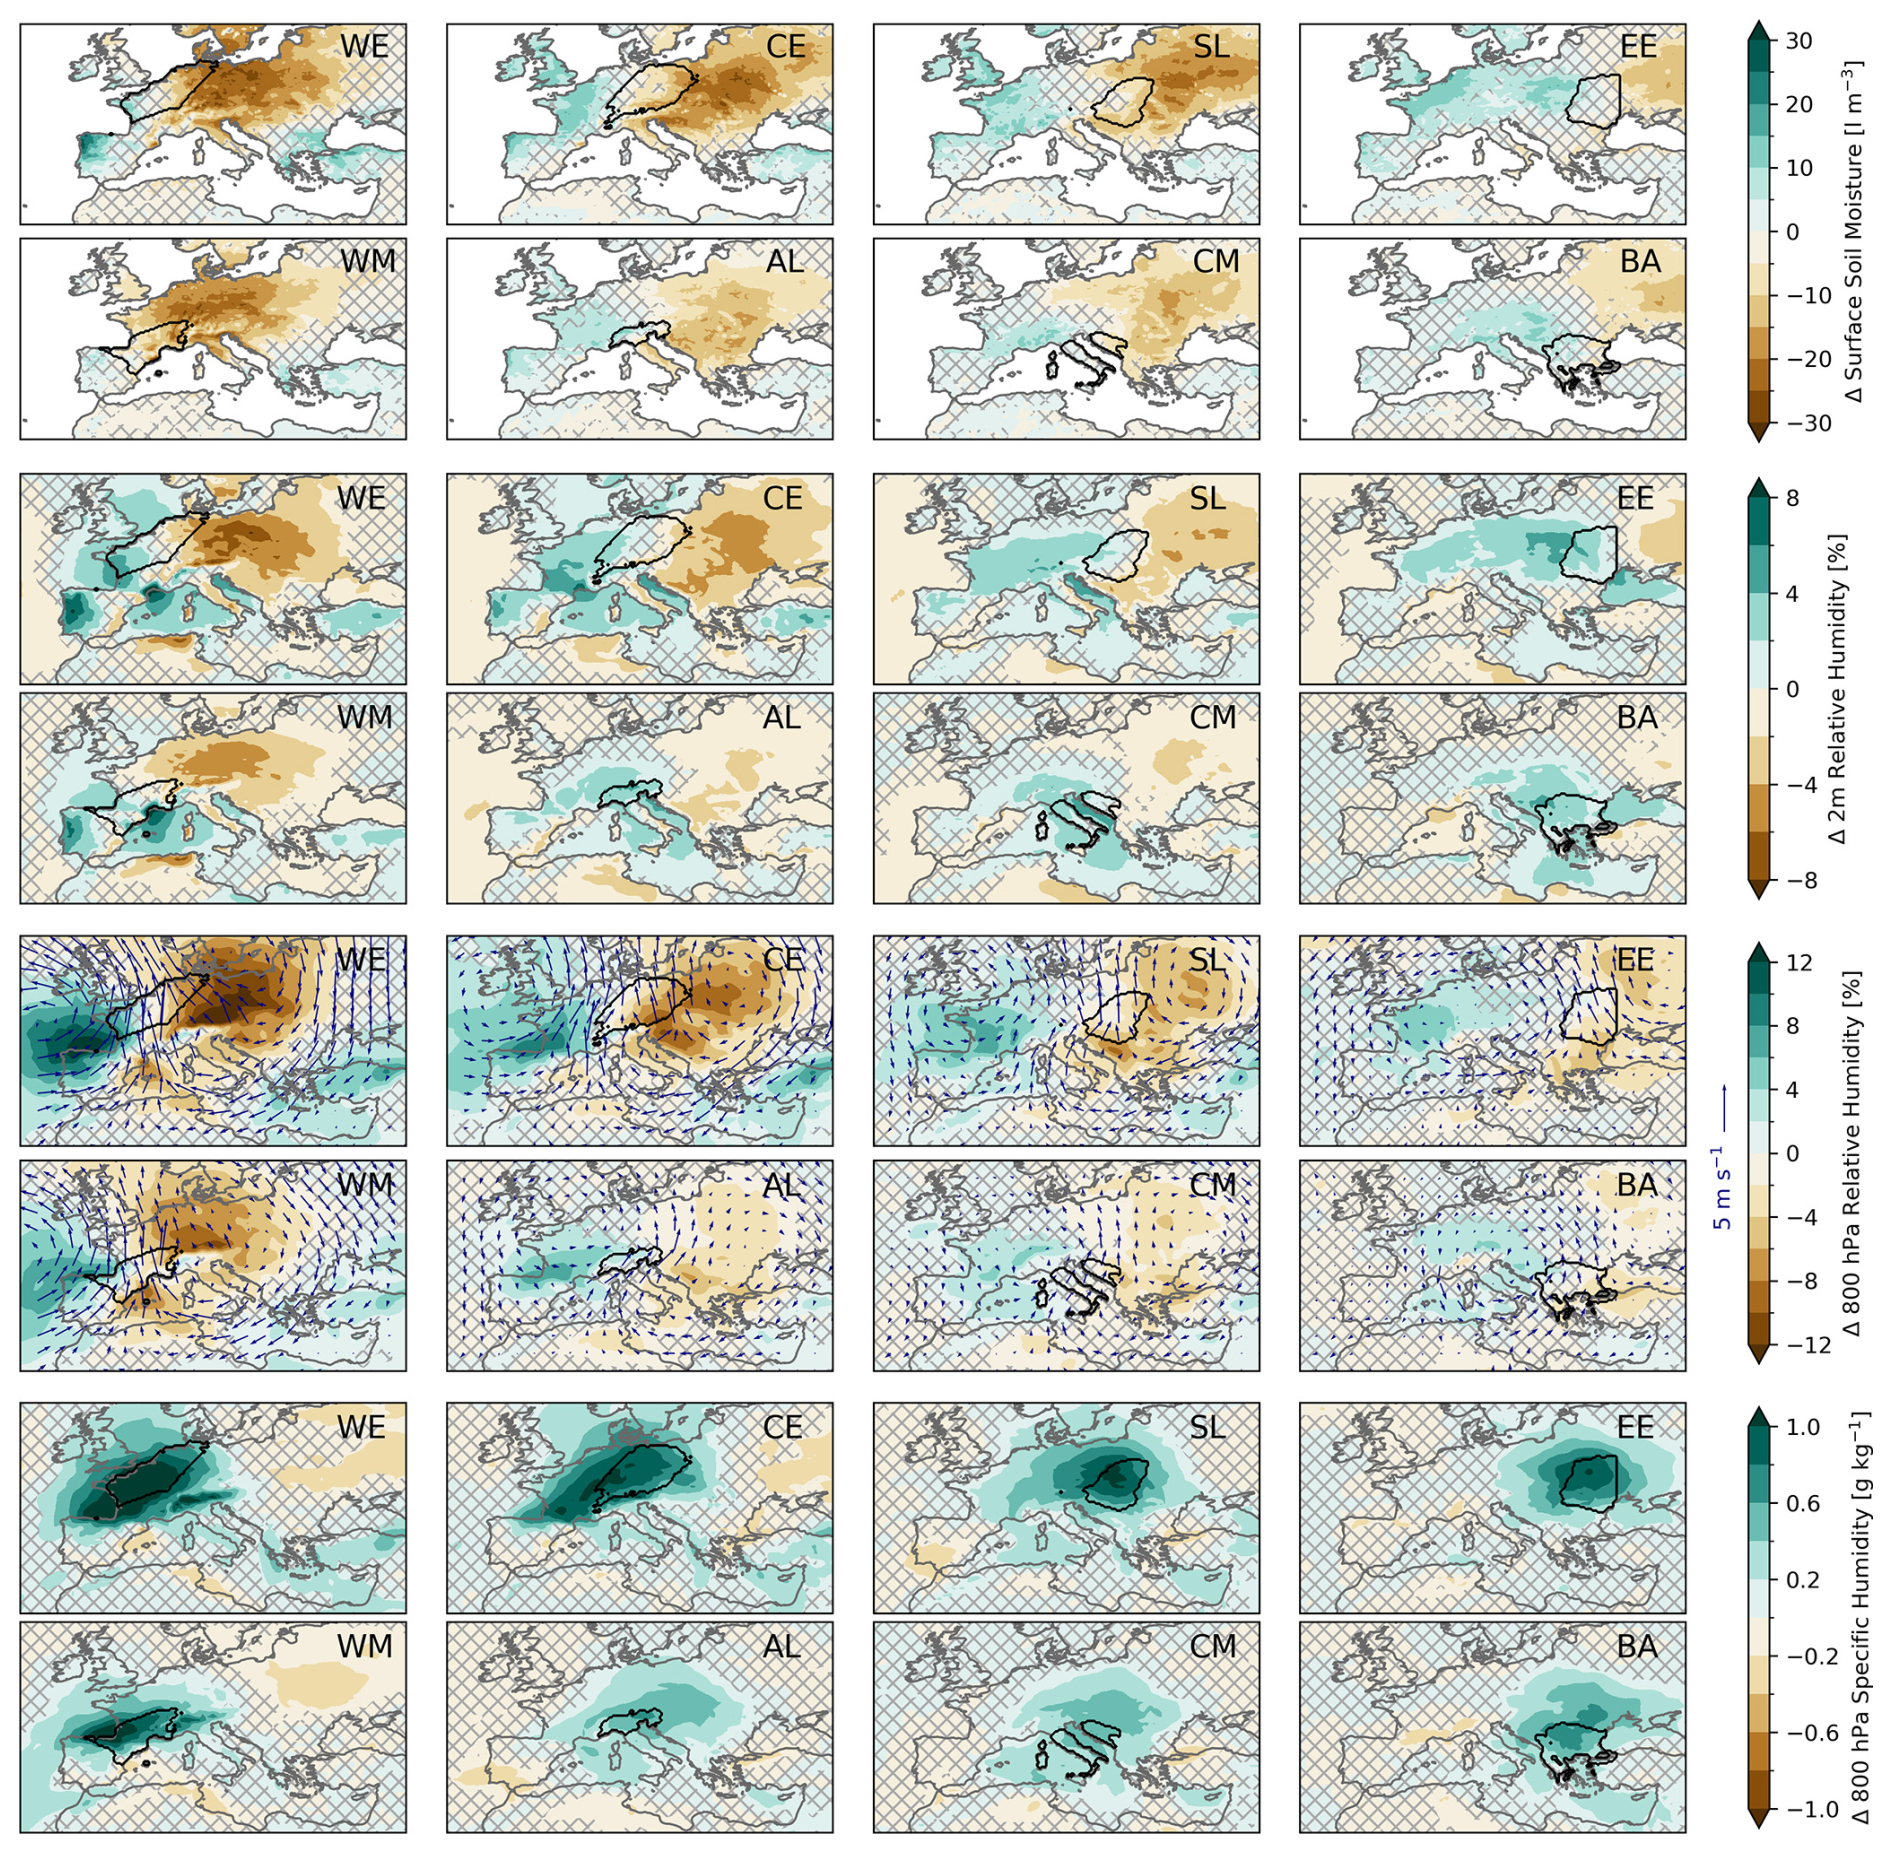
Figure 6Moisture anomalies on the first day of SCO. The number of SCOs per region is depicted in Fig. 1b. Hatching is applied to non-significant areas. The convective region is outlined in black and labelled in the top-right corner of each panel. Arrows over 800 hPa relative humidity indicate wind at 800 hPa.
As convection is driven by moisture, we next investigate 0–7 cm soil moisture, 2 m relative humidity, 800 hPa relative humidity, and 800 hPa specific humidity (see Fig. 6), providing information on evapotranspiration and atmospheric moisture profiles relevant to convective inhibition and the elevated mixed layer. Low-level moisture and saturation in particular are key to obtaining the necessary instability and precipitable water for deep moist convection. In contrast, the elevated mixed layer (Morris, 1986; Doswell and Bosart, 2001) is characterised as a relatively dry and warm air layer above the boundary layer that increases convective inhibition, allowing greater instability to build. The elevated mixed layer has low relative humidity, but as it is also very warm, it does not necessitate low specific humidity. In contrast, if specific humidity is low, deep convection may be completely inhibited.
At SCO onset, a strong soil moisture gradient is present in all regions, with a significant dry anomaly towards the east of each region, where the ridge is, and a moist anomaly approaching from the west with the beginning of precipitation (Fig. 6, top two rows). The soil moisture deficits are co-located with the positive temperature anomalies (Fig. 4, third two rows). Larger temperature anomalies correspond to stronger soil dryness, indicating persistent warm and dry conditions downstream of convective outbreaks in large-scale dynamically driven regions, such as western and central Europe (for temporal evolution, see Figs. 7 and 8). The soil moisture deficit also indicates a certain persistence of dry conditions downstream, as a deficit, even in the top soil layer, needs time to develop. Soil moisture gradients have been shown to play a role in convective initiation, as the moisture and temperature gradients favour a sea-breeze-like circulation, enhancing lift over the dry area (Froidevaux et al., 2014; Guillod et al., 2015; Liu et al., 2022) and the gradient (Barton et al., 2025).
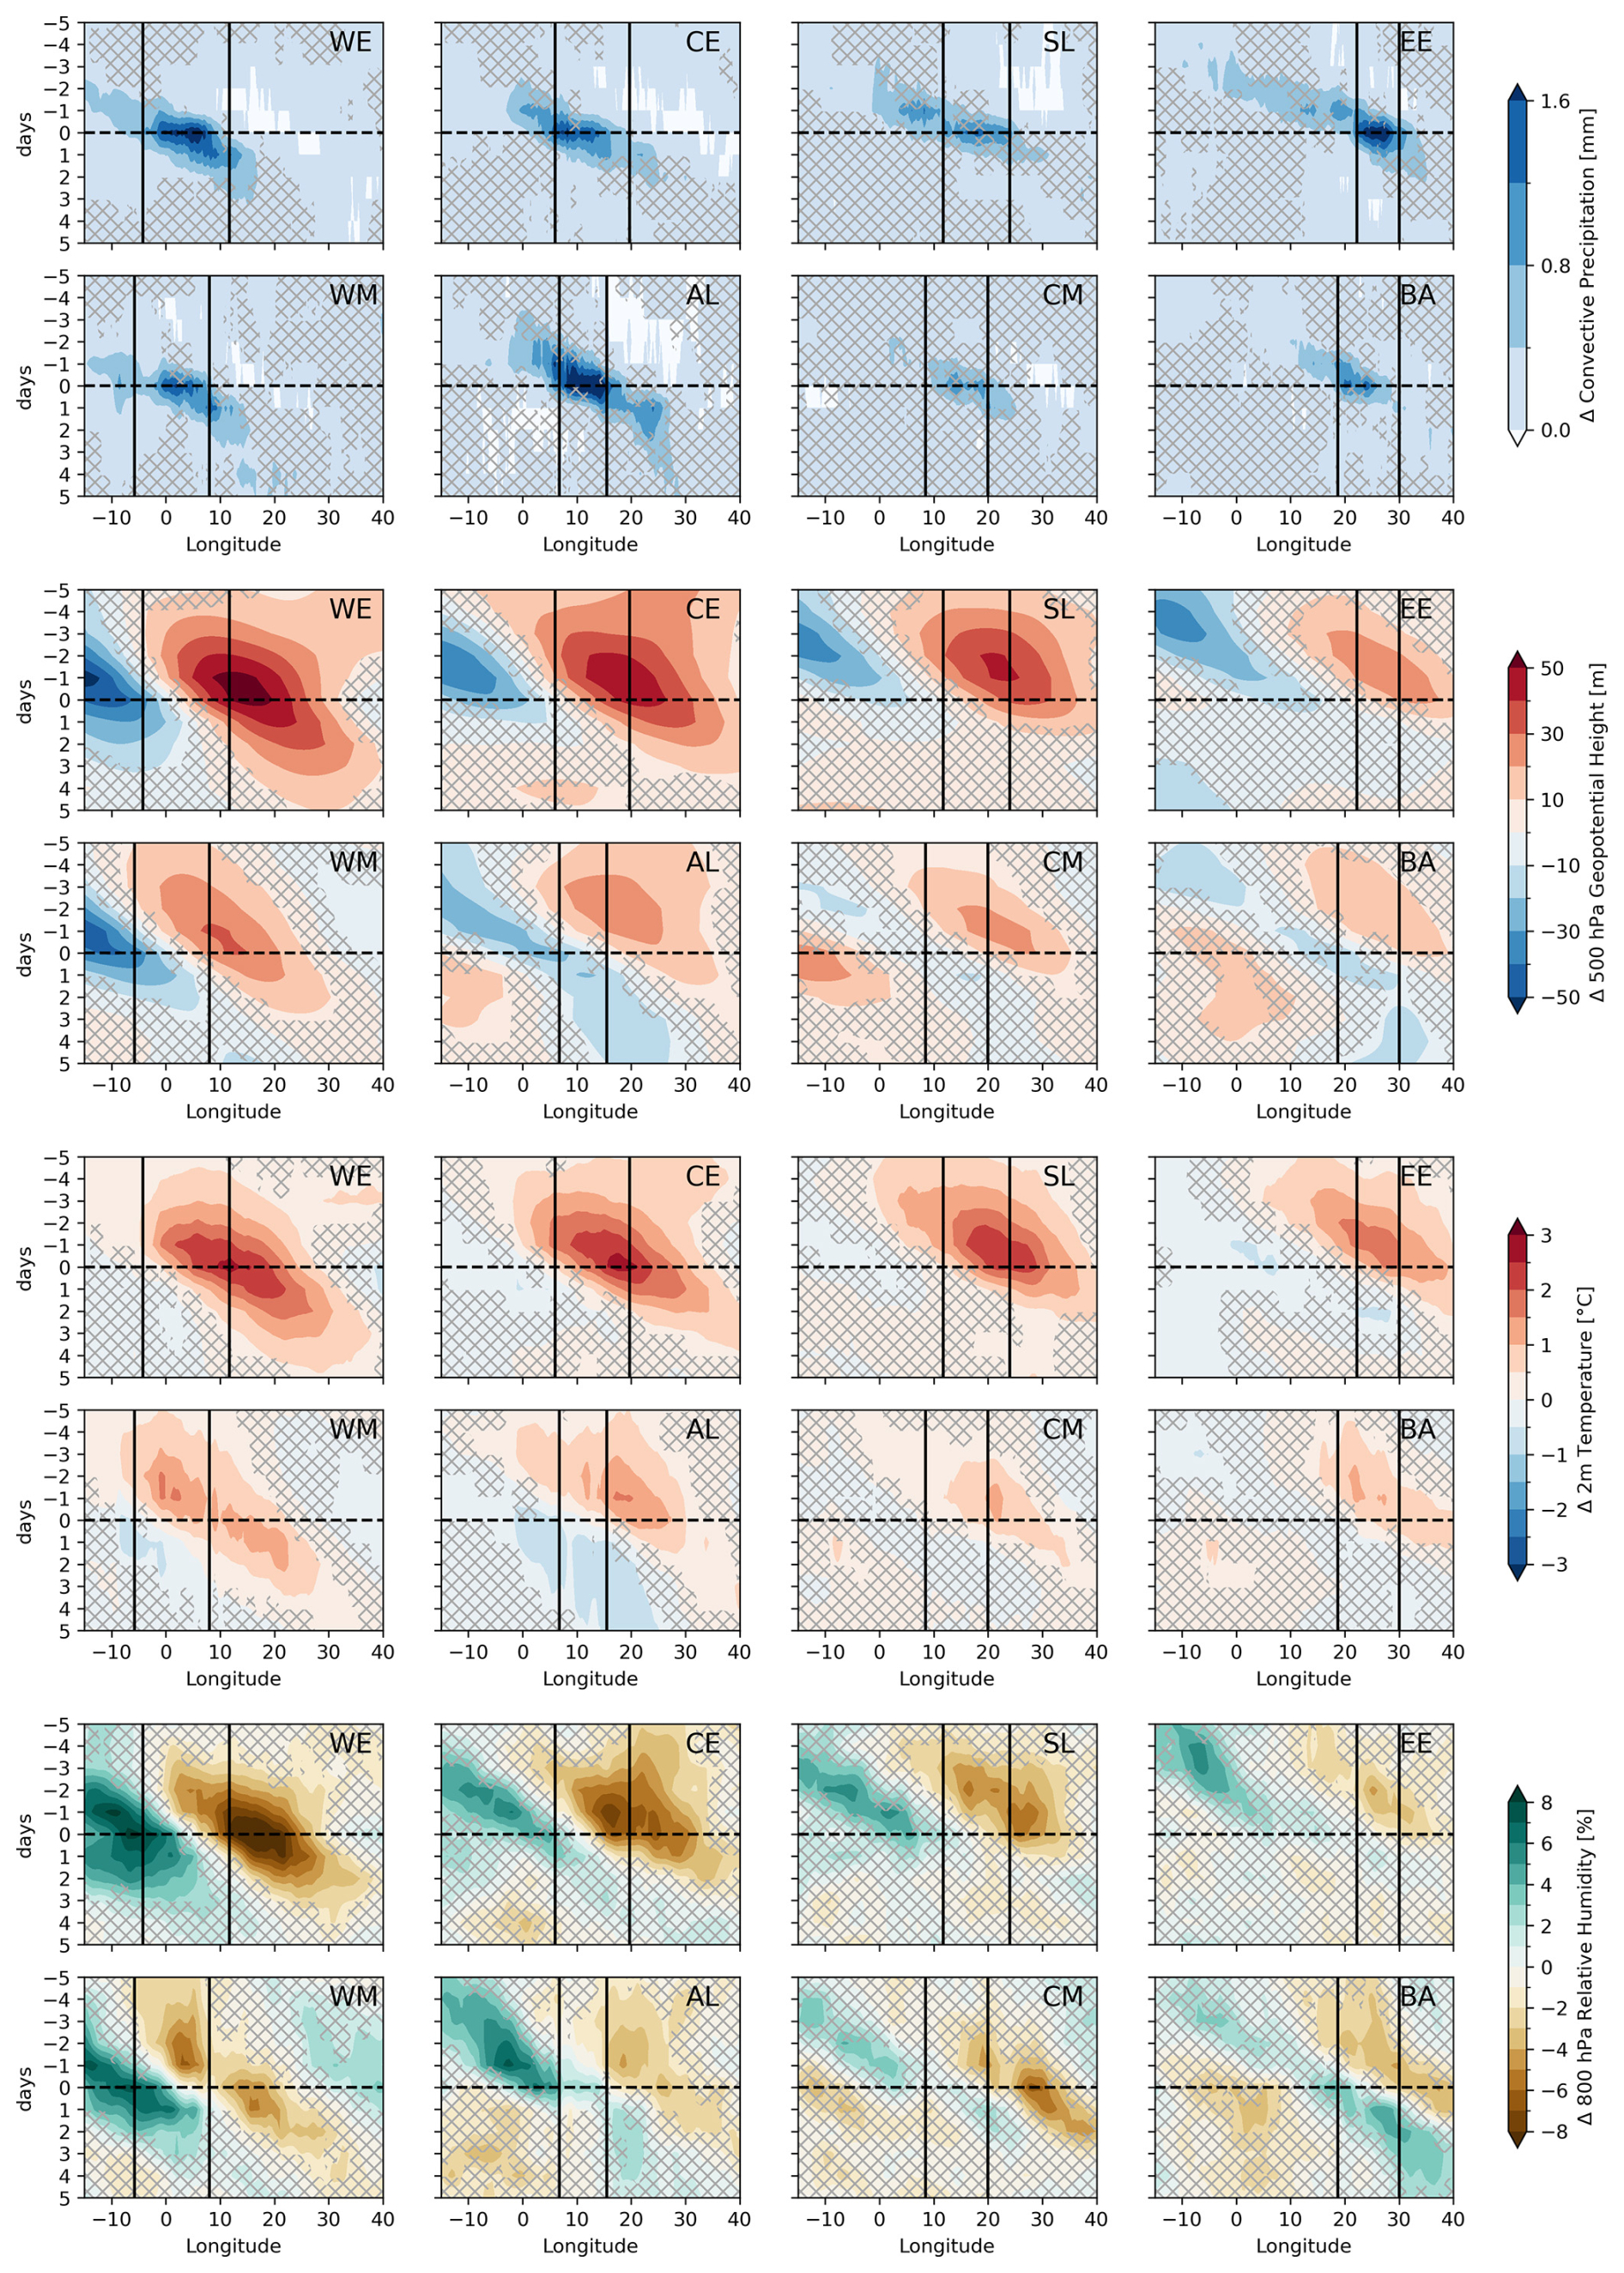
Figure 7Hovmöller diagram of anomalies in convective precipitation, geopotential height at 500 hPa, 2 m temperature, and 2 m relative humidity for transient events. The number of transient SCOs per region is depicted in Fig. 1b. Time evolution from 5 d pre-SCO onset to 5 d post-SCO onset is portrayed. The dashed line indicates SCO onset. Solid vertical lines indicate lateral region boundaries, and regions are labelled in the top-right corner of each panel.
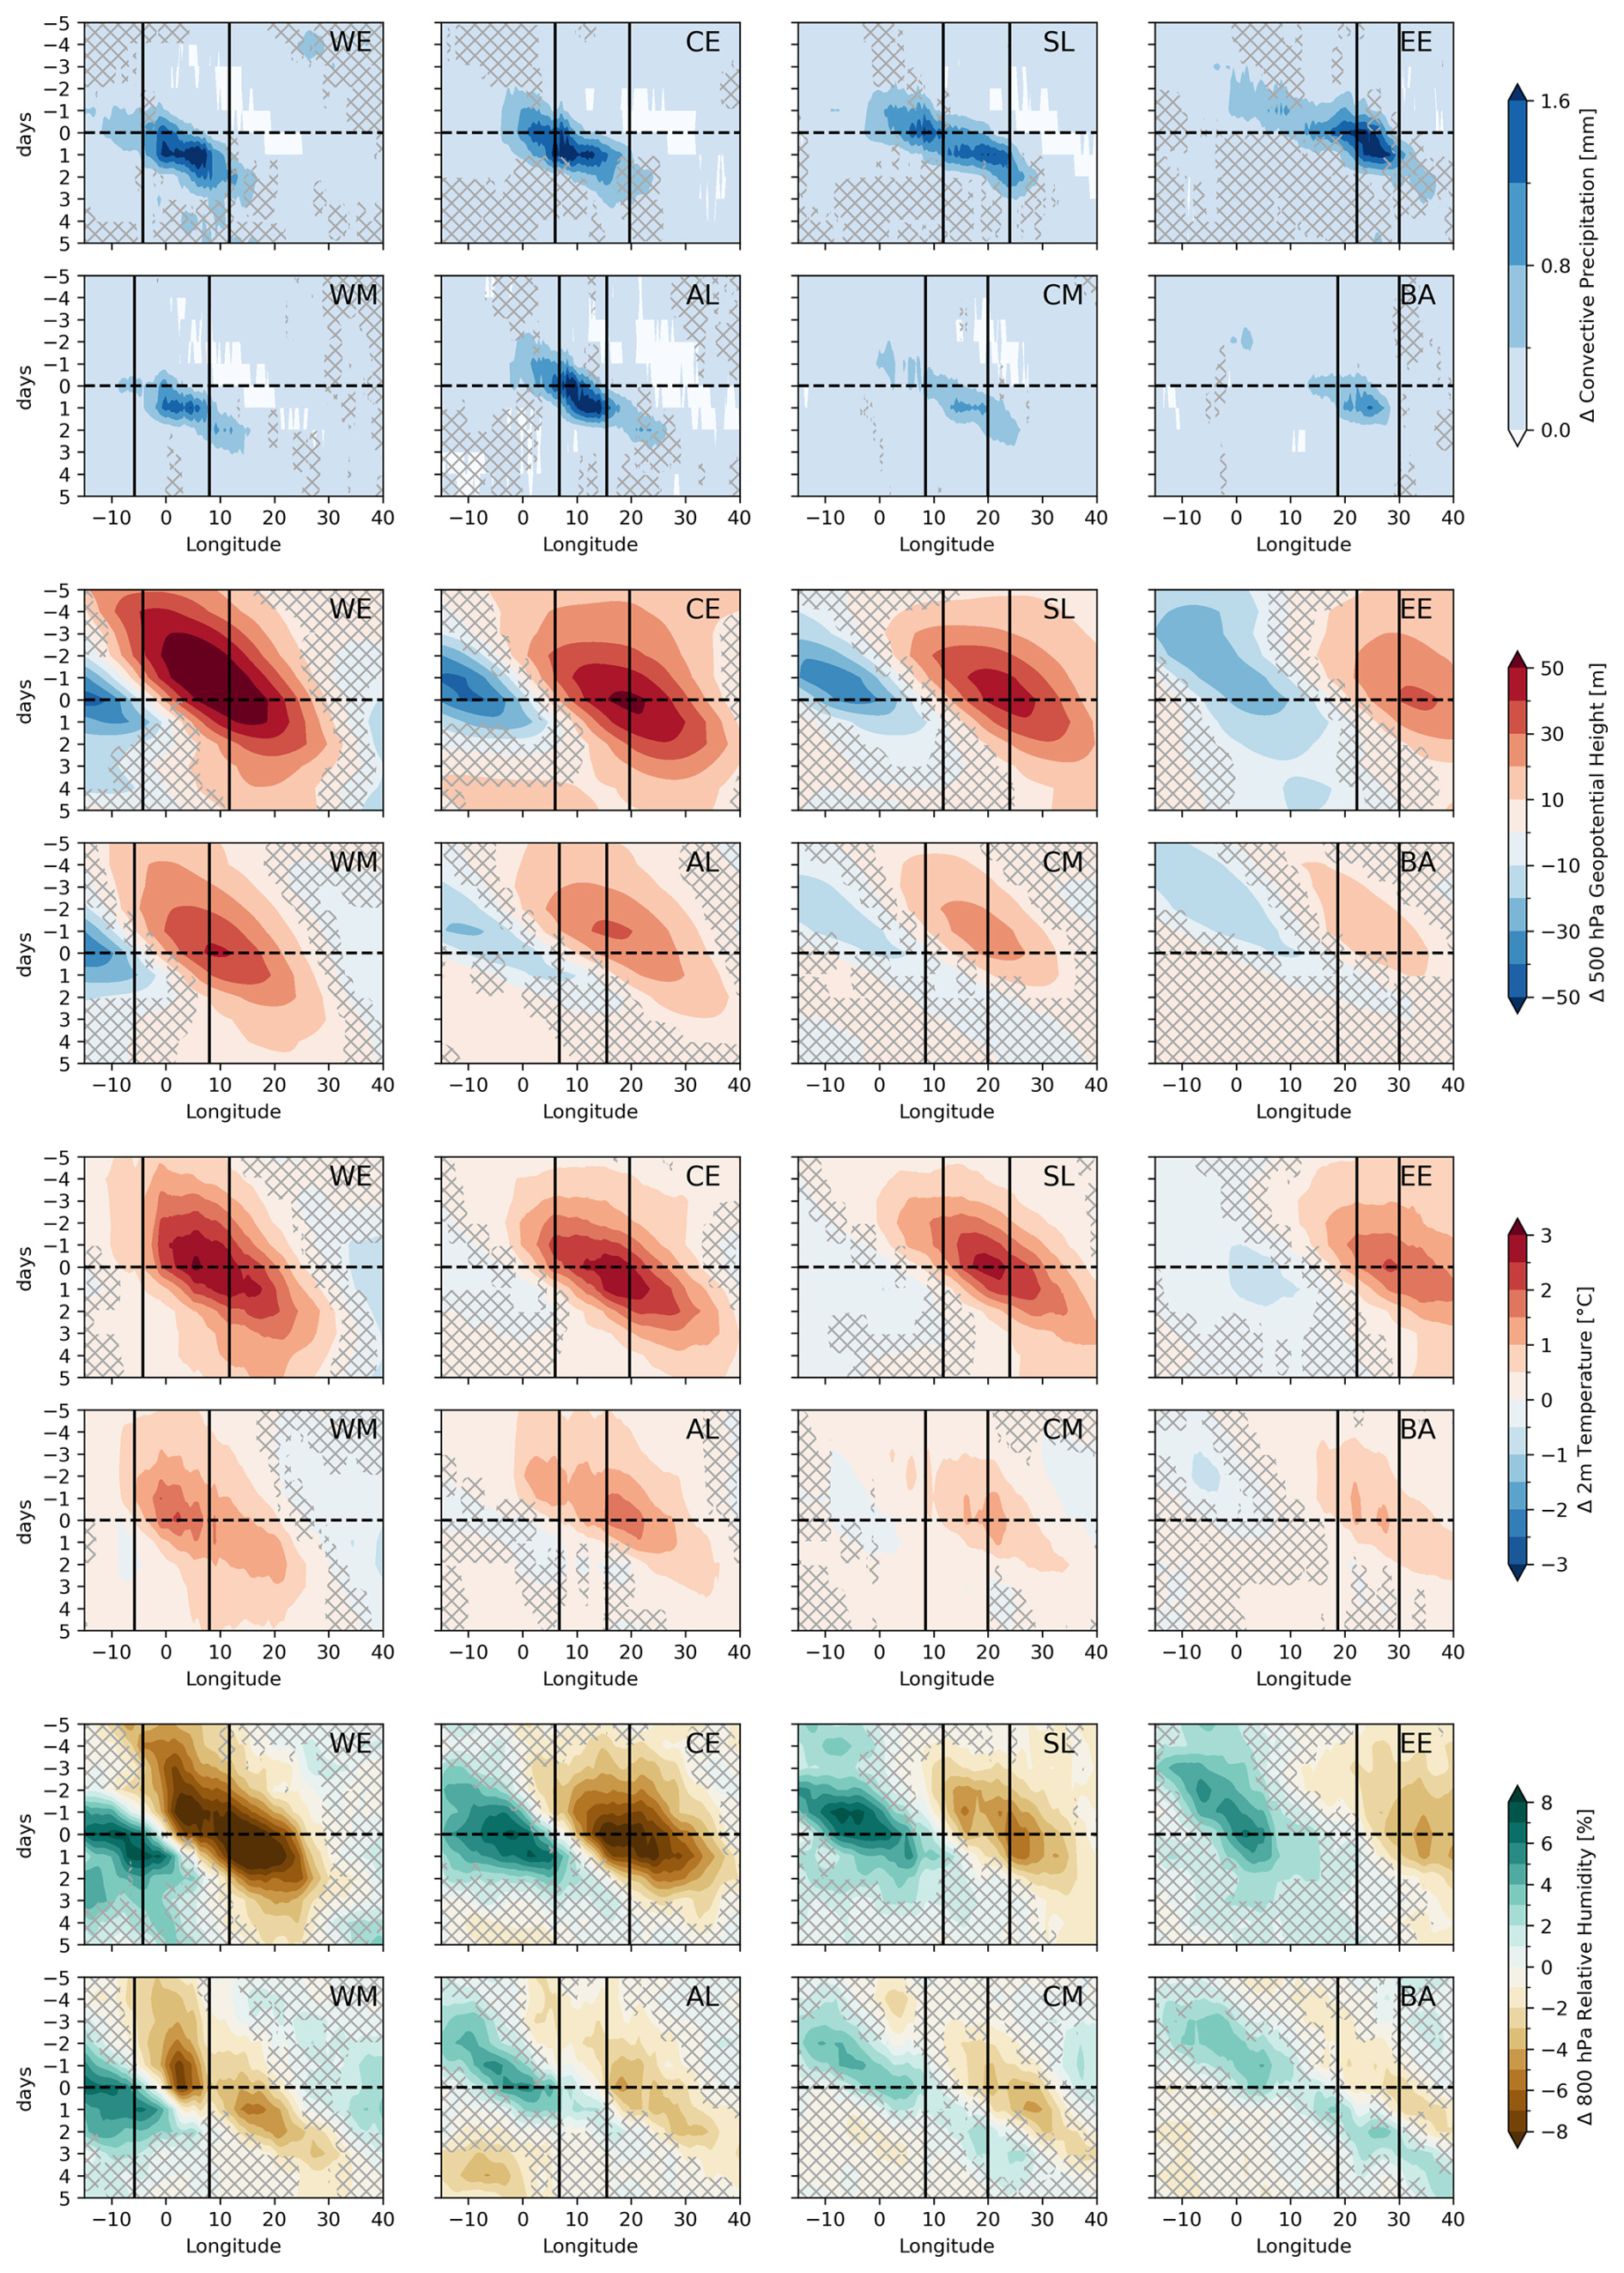
Figure 8Hovmöller diagram of anomalies in convective precipitation, geopotential height at 500 hPa, 2 m temperature, and 2 m relative humidity for persistent events. The number of persistent SCOs per region is depicted in Fig. 1b. Time evolution from 5 d pre-SCO onset to 5 d post-SCO onset is portrayed. The dashed line indicates SCO onset. Solid vertical lines indicate lateral region boundaries, and regions are labelled in the top-right corner of each panel.
The 2 m relative humidity shows similar patterns to surface soil moisture (Fig. 6, second two rows). In comparison to soil moisture, 2 m relative humidity has larger positive anomalies in the area of convection. The magnitude of both positive and negative moisture perturbations is the strongest for the western and northern regions (BE, CE, WM), moving towards weaker but more widespread positive anomalies in the southeastern regions (EE, BA). The southeastern regions (Fig. 6, EE and BA) have the lowest 2 m relative humidity in their climatology and are also associated with the largest 2 m relative humidity perturbations during SCOs.
The anomaly of the 800 hPa relative humidity, however, shows more pronounced dryness over the convective areas, indicating the presence of an elevated mixed layer (Fig. 6, third two rows). The anomalies are the strongest in western Europe, central Europe, and the western Mediterranean. For these regions, it is known that elevated dry, warm air from northern Africa or the Iberian Peninsula plays a role in allowing greater build-up of CAPE (Morris, 1986; Schultz et al., 2025). The composites also show exceptionally dry air over the Mediterranean, likely originating from the northern African coast, as indicated by the wind field. Moreover, for western and central Europe, the wind field indicates that dry air masses may also come from regions further east, under the influence of the hot, dry ridge. Similar source regions of elevated mixed layers have also been found for the British Isles (Lewis and Gray, 2010). These anomalies weaken towards the southerly and easterly regions, skewing towards less pronounced dry anomalies, in line with the findings of the 2 m relative humidity.
The specific humidity at 800 hPa is elevated for all regions, most notably for western and central Europe (Fig. 6, bottom two rows). In contrast with the relative humidity pattern, this indicates that the dryness is primarily due to the temperature anomaly and not an absolute lack of moisture, which still permits the formation of deep moist convection. Looking at the airstreams indicated by the wind field from northern Africa, they begin as dry anomalies, moisten after crossing the Mediterranean, and finally contribute to positive moisture anomalies (Fig. 6, BE and WM). The southerly winds and the change from dry anomalies over the Mediterranean to moist anomalies over the continent suggest that moisture is picked up over the anomalously warm Mediterranean Sea. The relatively dry and hot but absolutely moist layer serves the purpose of creating convective inhibition and delaying the onset of convection, allowing for greater instability to build through surface heating while still allowing deep convection to take place, as sufficient moisture is available.
To briefly summarise, we thus far find three sub-categories of regions: temperature-limited regions, such as western and central Europe, where a trough–ridge couplet induces winds advecting warm and moist air, resulting in instability. For saturation-limited regions, such as eastern Europe or, to a lesser extent, the Balkan Peninsula, a positive near-surface relative humidity anomaly plays a comparatively more important role than a strong synoptic perturbation. Lastly, convectively favourable regions, such as Alta-Italia and the central Mediterranean, show relatively small anomalies and low variability across events since their climatology already reaches favourable SCO conditions without additional perturbation but generally slightly moister conditions than on average.
3.3 Transient and persistent outbreaks
Transient outbreaks are defined as single-day SCOs with a gap of at least 3 d to the next SCO in the same target region. Conversely, persistent SCOs are defined as at least 2 consecutive days of SCOs. We investigate the temporal progression of the SCOs with Hovmöller diagrams of the 5 d leading up to an SCO and the 5 d after the SCO started. A meridional average is computed across latitudes, corresponding to each region. The zonal limits of each region are indicated in the diagram.
Transient SCOs (see Fig. 7) show a clear and regular zonal migration of convective precipitation, the related trough and ridge, the surface temperature anomaly, and the 2 m relative humidity anomaly. Convective precipitation indicates that, in many cases, an SCO is not confined to one region but migrates from west to east over time, affecting several regions successively (Fig. 7, top two rows).
Temperature-limited regions are associated with particularly strong perturbations in geopotential height emerging just before the SCO, accompanied by positive temperature anomalies and a strong surface moisture gradient (Fig. 7, BE and CE). The presence of the ridge is longer-lasting and more pronounced than that of the trough. The persistence of the ridge emphasises the importance of the warm anomaly and the potential presence of a dry layer for widespread convection. The surface moistening after the SCO indicates the onset of precipitation and the arrival of the trough.
Contrastingly, the convectively favourable regions show a suppression of convection in the days following the SCO (Fig. 7, AL and, to a lesser extent, CM). A trough resides over the region, leading to a negative temperature anomaly and a suppression of convection. In these regions, transient SCOs are also the minority fraction, with most SCOs lasting multiple days. The saturation-limited regions show a weak positive relative humidity anomaly, with no significant dry anomalies and hence no remarkable gradient (Fig. 7, EE and BA).
Persistent SCOs are characterised by more pronounced anomalies in all descriptor variables (see Fig. 8). For temperature-limited regions, persistent SCOs are associated with large-scale features suggesting blocking, such as a spatial stalling of the pattern in the geopotential height anomaly after SCO onset (Fig. 8, BE and CE). This stalling can also be found in temperature, soil moisture (not shown), surface moisture, and convective precipitation anomalies as well. The presence of a wave train combined with blocking has also been shown for hail clusters north of the Alps (Barras et al., 2021), in contrast to single-day events with smaller perturbations and no blocking anomalies. Convective precipitation persists for 2–3 d within the region but only later affects downstream areas. This local persistence contrasts with the signal in transient events, where convective precipitation is elevated downstream 1 d post-event (Fig. 7, BE and CE). The persistent SCOs are associated with a greater local persistence in convection and in the downstream moisture deficit and heat anomaly. Persistent outbreaks show hotter peaks and have stronger and longer-lasting anomalies in downstream areas than their transient counterparts (Fig. 8, BE and CE). This significant co-occurrence of persistent convection, heat, and dryness indicates a contrast in weather extremes, such as convectively induced floods contrasting with high temperatures and pronounced soil dryness on a continental scale (e.g. Tuel et al., 2022). The stalling of convection does not greatly affect its likelihood to travel from one region to the next, and the northern regions in particular show a zonal migration signal, though the migration is delayed in comparison to that of the transient events.
The convectively favourable regions now show a more transient pattern in geopotential height, with a return to the mean state of geopotential height and temperature after the first day of convection (Fig. 8, AL and CM). Given the convective favourability of the mean state (see Fig. 2a), it is the absence of explicit suppression, rather than the forcing of beneficial conditions, that produces the persistent event.
The saturation-limited regions show considerable positive relative humidity anomalies for persistent events that extend far upstream, contrasting with the rather weak anomaly for transient events. Persistent events also make up the majority of events here (see Fig. 1).
3.4 Climatological and event-based trends
Given the absolute thresholds required for convection, we refrain from a priori removing long-term trends from the data. However, the clear correlation of CAPE and convection with temperature indicates that the warming trend of the past 40 years has an effect on convection in Europe (see also Battaglioli et al., 2023; Wilhelm et al., 2024). Figure 9 shows the decadal (1980–2022) linear trend of the convective proxy, CAPE, 2 m temperature, and relative humidity, and Table 3 quantifies the trend for each region. While temperature has increased everywhere (see also Twardosz et al., 2021), CAPE trends vary regionally (see also Taszarek et al., 2021b). The regional heterogeneity of CAPE trends is primarily due to changing moisture availability as a result of CAPE's dependence on saturation. In areas where surface-level relative humidity decreases the most (France, the Iberian Peninsula, eastern Europe; see also Brogli et al., 2019, for a future climate analysis), CAPE is stable or decreases. Where relative humidity either increases (Dinaric Alps) or decreases only slightly (Alta-Italia, Adria, Slavic areas, central Europe), CAPE increases more robustly. Alta-Italia experiences the strongest positive trend, in agreement with studies highlighting the strongest observed convective trends in northern Italy (Battaglioli et al., 2023; Taszarek et al., 2021a).
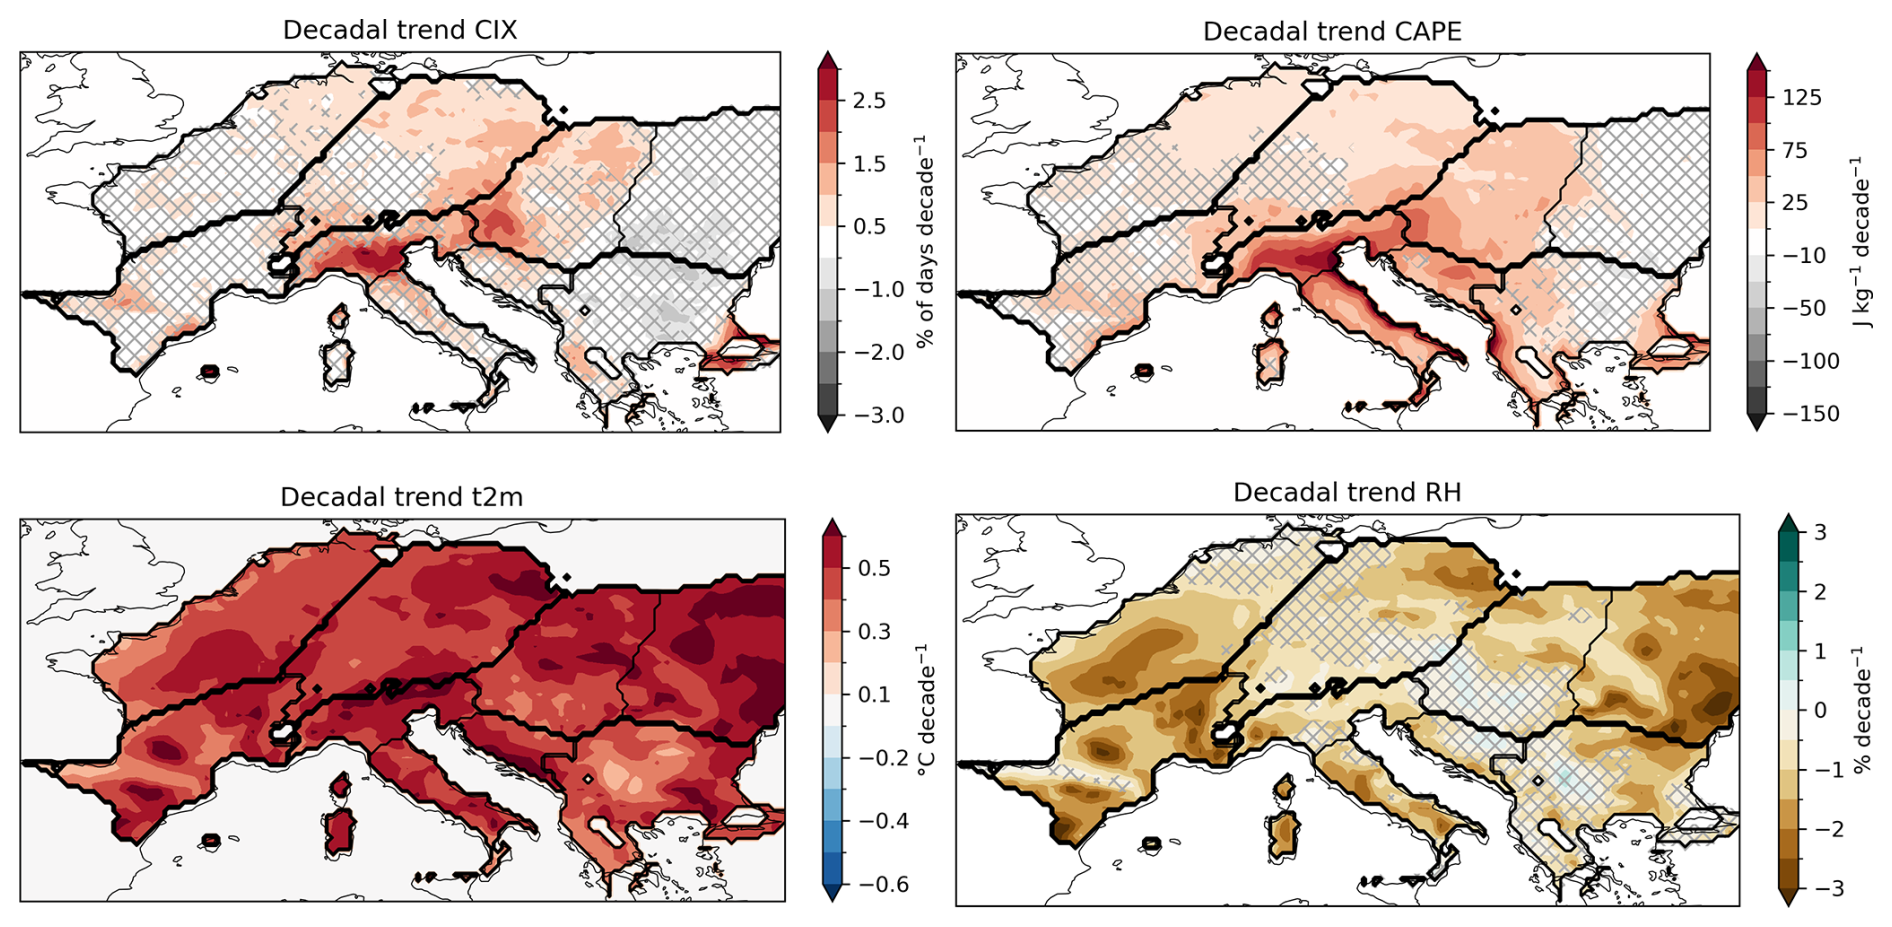
Figure 9Decadal trends in CAPE, 2 m temperature, and 2 m relative humidity. Insignificant areas at p≤0.05 are hatched.
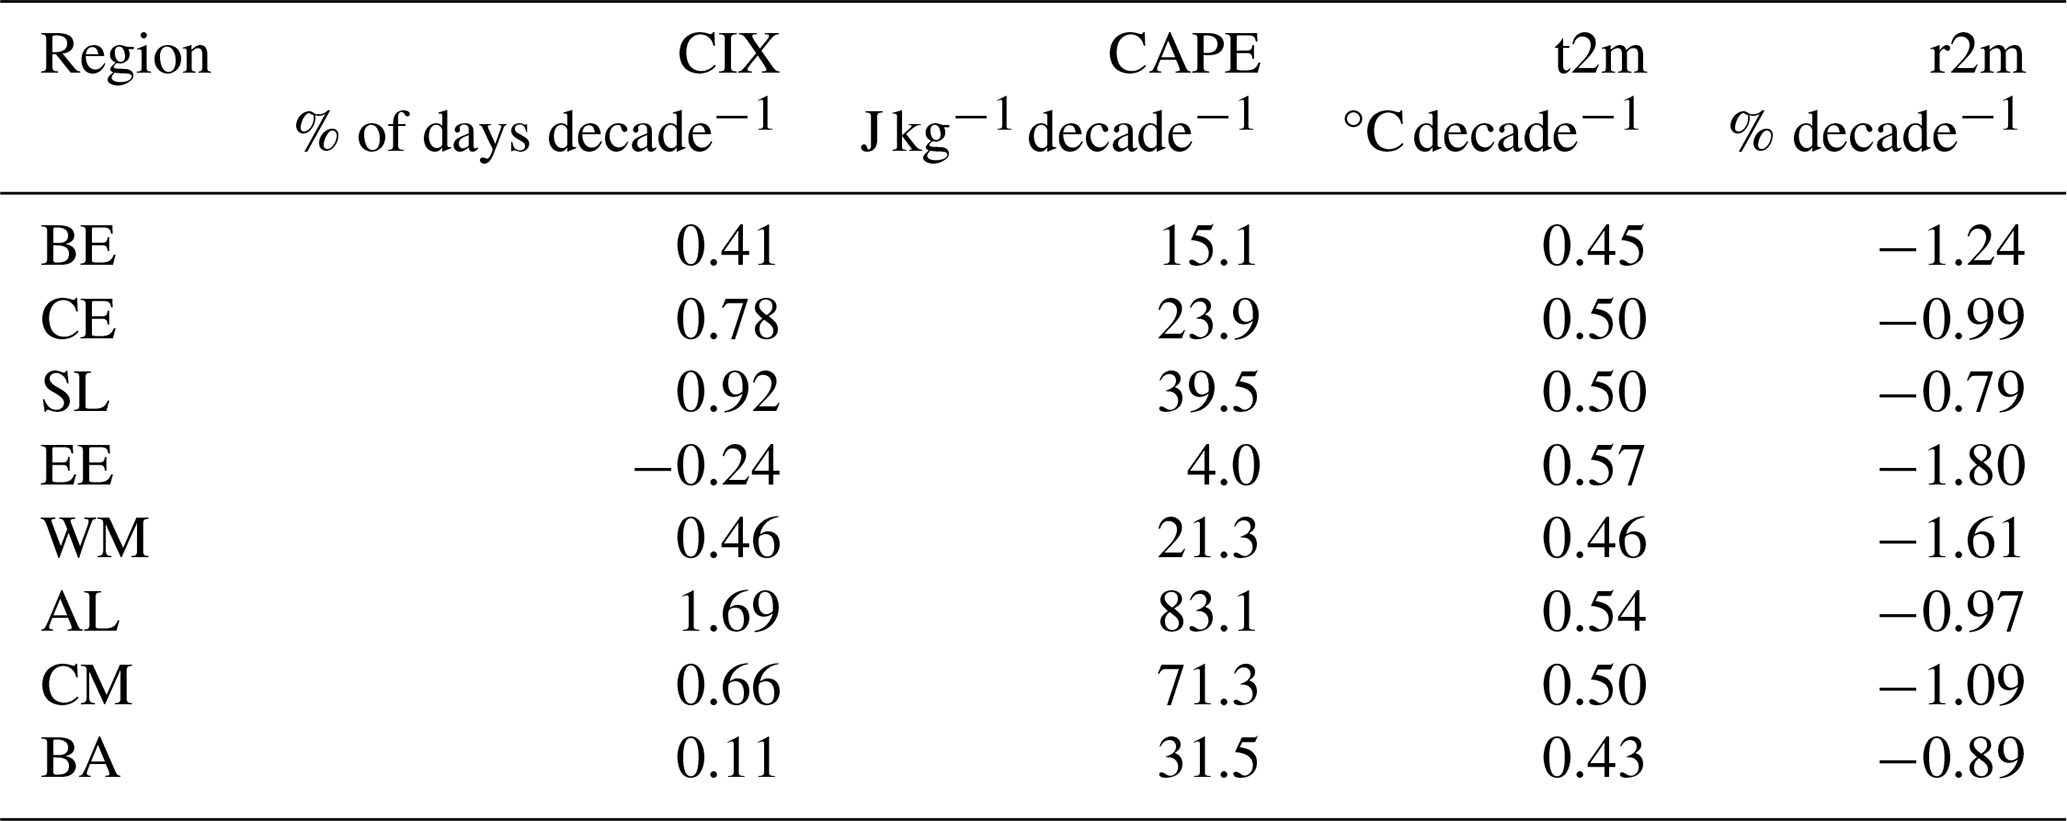
Table 3Climatological trends (1980–2023) in CIX, CAPE, 2 m temperature, and 2 m relative humidity during the convective season for the different regions.
Additionally, we calculate linear trends of temperature and geopotential height, 2 m temperature, and 2 m relative humidity during convective outbreaks (see Fig. 10). For temperature- and saturation-limited regions, a strengthening of the upstream ridge relative to the convection is evident. There may also be a broadening of the ridge. The approaching trough either remains neutral or deepens slightly. This behaviour is in agreement with the corresponding temperature trends, which are largely positive to the east of convection and neutral in the area of convection, resulting in a stronger overall temperature gradient.
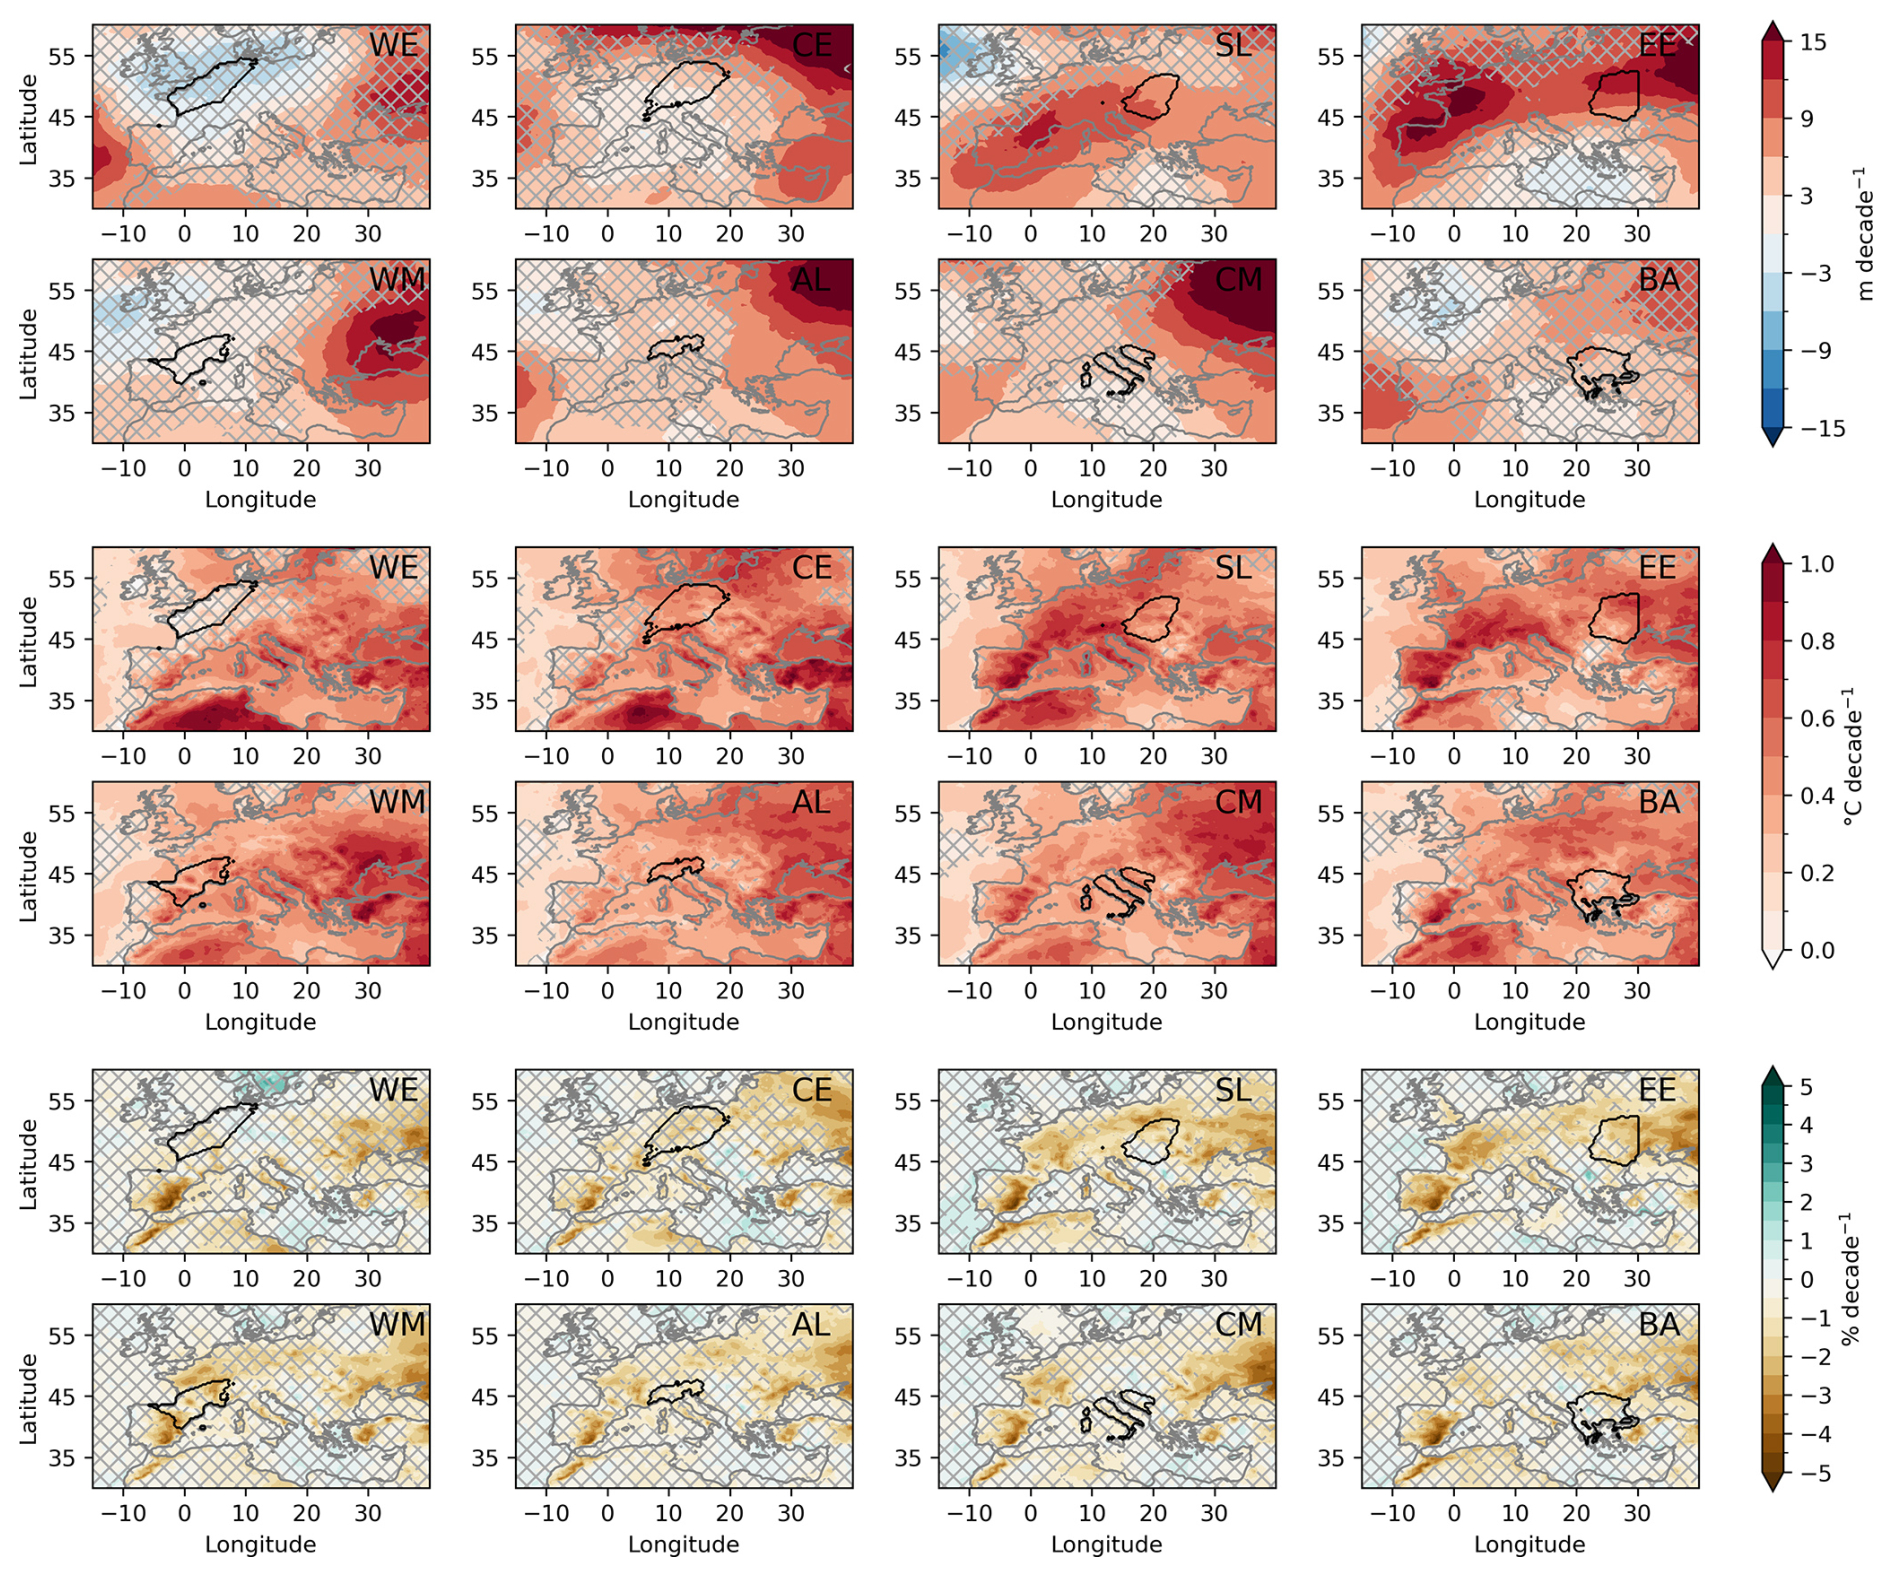
Figure 10Long-term trends (1980–2023) of geopotential height, 2 m temperature, and 2 m relative humidity during convective outbreaks. Hatching indicates non-significant areas.
Temperature-limited regions have a neutral moisture trend and almost no warming signal in the area of convection, maintaining the limitations on climatologically typical instability. Saturation-limited regions show a warming trend in addition to a drying trend in the vicinity of the target region (especially eastern Europe), amplifying the saturation limitation. Climatologically, the convective index slightly decreases in eastern Europe, indicating the less favourable convective conditions.
Convectively favourable regions have experienced only small changes to the synoptic situation, aside from a general increase in geopotential height related to the overall warming.
Overall, the changes in convective frequency are well aligned with changes in the climatology of temperature, moisture, and instability. We conclude that the primary driver of the trend is not due to changes in dynamical patterns, emphasised by the fact that the dynamical patterns do not change greatly over time, aligning with the results of Ghasemifard et al. (2024), who show that European hail trends are largely independent of large-scale weather trends.
In summary, our analyses show three different types of large-scale drivers for regional severe convective outbreaks (SCOs): temperature-limited types, saturation-limited types, and convectively favourable types. The most archetypal regions for each class are western Europe for temperature limitation, eastern Europe for saturation limitation, and northern Italy for convectively favourable. Central Europe falls into the temperature-limited group, while the Slavic area has hallmarks of both saturation and temperature limitations. The Balkan Peninsula is quite convectively favourable but also shows characteristics of saturation limitation, albeit not as strongly as eastern Europe, which is further removed from maritime moisture sources. The central Mediterranean is quite favourable for convection, though not quite as strongly as Alta-Italia. Finally, the western Mediterranean exhibits characteristics of temperature limitation while generally being more favourable for convection.
Temperature-limited SCOs are characterised by strong perturbations in the mid-level geopotential height, lying on the western flank of a pronounced ridge and at the leading edge of an approaching trough. At the surface, they are accompanied by strong positive temperature anomalies, extending from the area of SCOs into the downstream ridge. Driven by the large-scale weather situation, strong shallow soil moisture gradients are present. These gradients have been shown to locally increase shear due to amplified temperature gradients causing convergence in the area (Barton et al., 2025). While soil moisture is not the primary driver of shear here, the co-occurrence of strong gradients in soil moisture, 2 m temperature, and strong mid-level flow indicates an amplification of convection-favouring factors. The presence of a hot and dry area upstream of low-level flow (generally to the east of the SCO) is also relevant for the formation of an elevated mixed layer (Schultz et al., 2025). While transient (50 %) and persistent (50 %) events are associated with the same synoptic patterns, the synoptic patterns are more pronounced for persistent events, and the propagation speed of patterns stalls around the onset of convection, indicating stationarity.
Saturation-limited SCOs are associated with similar characteristics to temperature-limited SCOs, albeit with weaker amplitudes in the 2 m temperature, geopotential height, and soil moisture anomalies. The anomaly in 800 hPa specific humidity, however, is of the same magnitude as in the temperature-limited regions, stressing the importance of sufficient moisture in a climatologically rather dry area. Moreover, 2 m relative humidity is consistently positive in the area of convection, with transitions towards low-relative-humidity anomalies lying further eastward. The majority (∼60 %) of events are persistent events. The 2 m relative humidity anomaly is stronger for persistent events and extends further upstream in the days leading up to an SCO and persists in the region days after SCO onset. Transient events show a smaller positive 2 m relative humidity anomaly and no persistence.
Convectively favourable SCOs are tied to overall weak synoptic anomalies, as the regions they occur in are climatologically very favourable for convection. Conditions tend to be warmer and moister than normal but at smaller magnitudes than in the other regions. Transient SCOs also constitute the minority here (∼30 %), and they are associated with a cold anomaly following the SCO, preventing further widespread convection. Persistent SCOs, however, show no particular sign of persisting anomalous conditions but rather a return to the already favourable mean state.
Figure 11 summarises the identified features that are at play in all regions but with differing magnitudes.
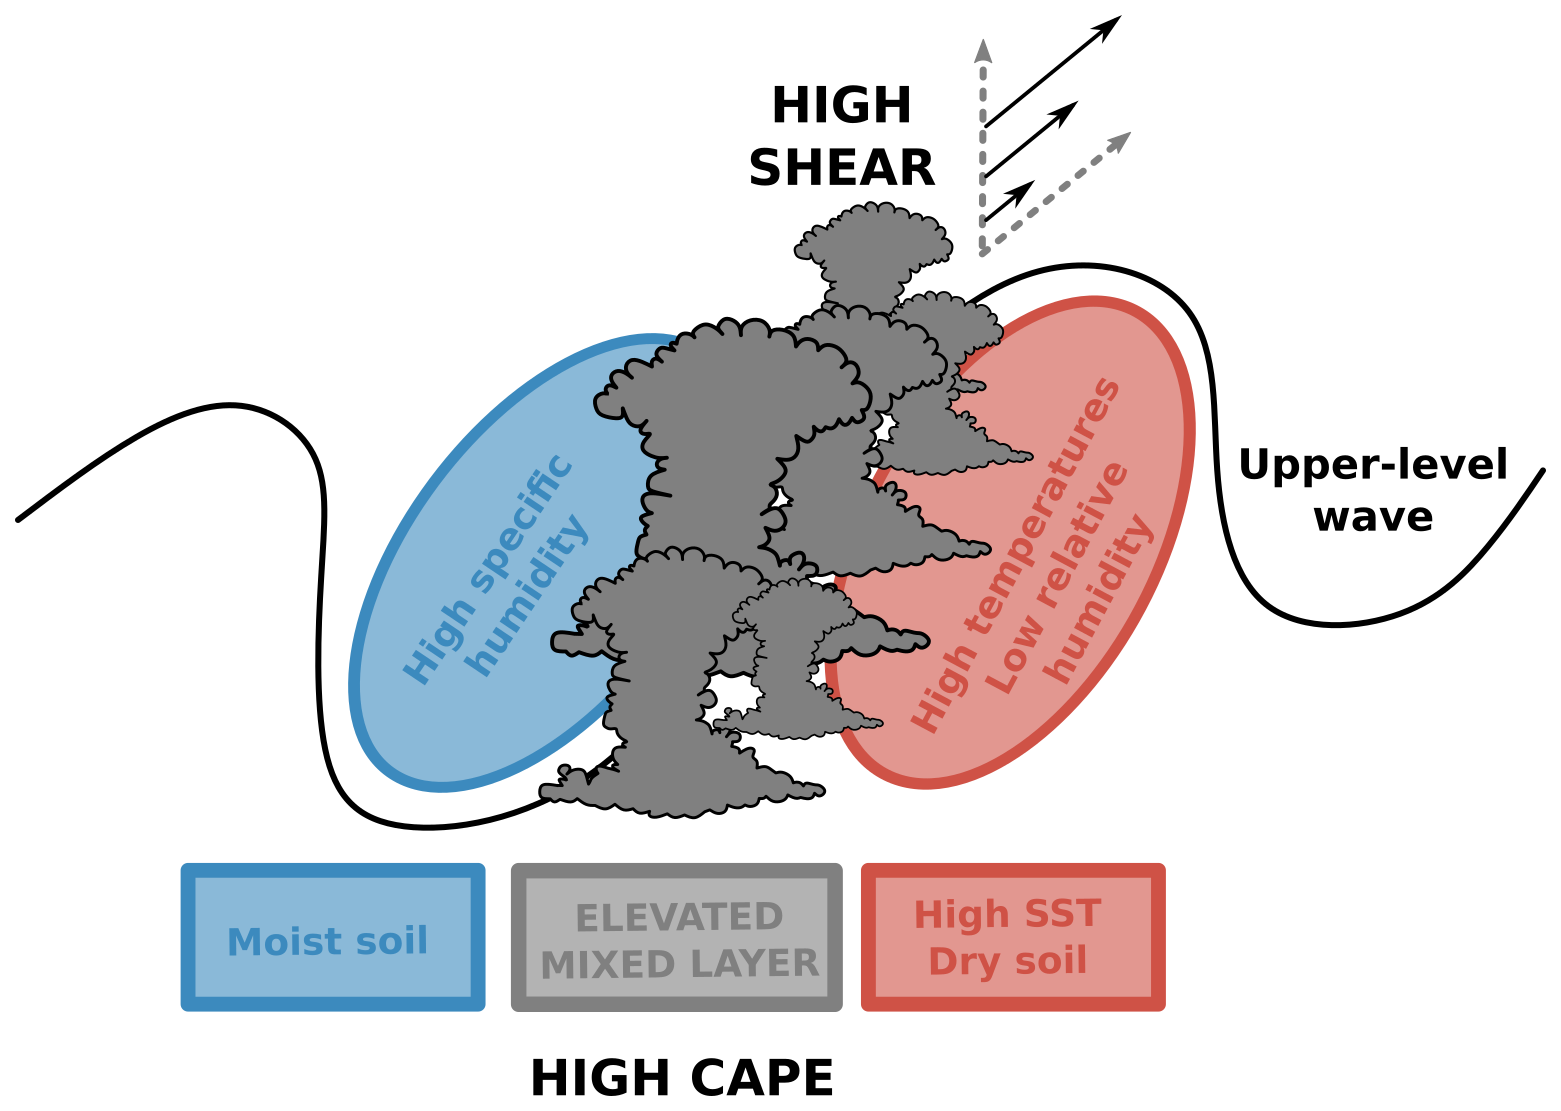
The processes relevant in temperature-limited regions in particular show great similarity to the framework presented in Doswell and Bosart (2001), with severe convection being most likely in the prefrontal zone, in between an upper-level upstream trough and a downstream ridge. We highlight the importance of changes to the instability profile in these situations, where Doswell and Bosart (2001) focus on the amplification of deep-layer and low-level shear for tornado formation. These conceptual similarities emphasise that while we focus on regional differences in Europe, the identified processes are applicable beyond this regional limitation, and similar synoptic situations can be expected to enable SCOs in appropriate regions globally.
Trend analyses show that the identified large-scale drivers do not change fundamentally in the 40-year period analysed here. While the ridge and warm anomaly downstream of an SCO tend to increase in temperature and area, the overall synoptic situation remains similar. The underlying warming and regional drying trends are consistent with trends in CAPE and frequency trends in the convective index (CIX). As proposed by Ghasemifard et al. (2024), this indicates that convective trends are governed by the background climate, rather than changes in the synoptic drivers.
This study provides a European-wide perspective on the synoptic conditions associated with SCOs, identifying three main regional patterns: temperature-limited (e.g. western and central Europe), moisture-limited (e.g. eastern Europe and the Balkan Peninsula), and convectively favourable regions (e.g. Alta-Italia and the central Mediterranean).
In temperature-limited regions, strong synoptic disturbances and elevated mixed layers support the build-up of instability. In contrast, in saturation-limited regions, weaker synoptic perturbations – in tandem with anomalously moist low-level conditions – are important. Convectively favourable regions experience more frequent SCOs under near-climatological conditions with slight positive temperature and moisture anomalies. Across all regions, SCOs often occur in the transition zone between a trough and a ridge, where positive temperature and moisture anomalies and moderate shear support convective organisation. Trend analyses show no clear changes in synoptic drivers for the different regions, indicating that the trend in CIX is related to changes in background climate, rather than changing synoptic patterns.
This analysis of the prevalent synoptic situation during SCOs in different regions of Europe provides much-needed context to better understand the regional processes leading to SCOs. While previous studies have assessed regions individually, this comprehensive analysis of all regions within the same dataset allows for a quantitative comparison of regional SCO occurrence and the involved synoptic processes. The frequency of SCOs differs considerably between the regions, owing to their differing climate regimes. The climatological conditions require different perturbations to reach sufficient temperature and humidity levels to obtain instability. Despite the regional differences, the qualitatively similar patterns, as well as similarities to conceptual frameworks from the USA (see Sect. 4), indicate that the fundamental processes driving SCOs are applicable beyond the regions analysed here.
This type of general synoptic framework for convective-scale weather events offers new opportunities in the applications of predictability and the understanding of climate processes. In particular, predictability is strongly related to the spatial scale of weather phenomena, with synoptic-scale patterns having much greater predictability than local convective precipitation. Leveraging systematic synoptic signatures as indicators of SCOs offers promising avenues for future research dedicated to improving forecasts and warnings for severe convection. Likewise, synoptic-scale processes are resolved and represented in climate simulations, especially global ensemble simulations, which currently do not support kilometre-scale, convection-permitting resolutions. Establishing a reliable synoptic proxy can be an alternative to current analyses, which are typically based on CAPE–shear proxies and heavily depend on the available spatio-temporal resolution. While more work is required to fully establish such a synoptic proxy and test its robustness in different applications, the scientific outlook is promising on temporal scales of both weather forecasting and climate change analysis.
The code is accessible at https://doi.org/10.5281/zenodo.17286914 (Feldmann, 2025).
The ERA5 dataset is available via the Copernicus Climate Data Store (https://doi.org/10.24381/cds.adbb2d47 and https://doi.org/10.24381/cds.bd0915c6).
MF and OM designed the study. MF conducted the analyses, produced the visualisations, and wrote the paper. OM and DIVD advised MF during the project. All coauthors revised and edited the paper.
At least one of the (co-)authors is a member of the editorial board of Weather and Climate Dynamics. The peer-review process was guided by an independent editor. The positions of Monika Feldmann and Olivia Martius are funded through the Mobiliar group. This funding played no role in any part of this study.
Publisher's note: Copernicus Publications remains neutral with regard to jurisdictional claims made in the text, published maps, institutional affiliations, or any other geographical representation in this paper. While Copernicus Publications makes every effort to include appropriate place names, the final responsibility lies with the authors.
We thank Shira Raveh-Rubin, Leehi Magaritz-Ronen, Edgar Dolores-Tesillos, and Duncan Pappert for the insightful discussions on the large-scale dynamics of cyclones and blocking.
We acknowledge the use of ChatGPT for code debugging and minor text revisions in a previous version of the paper.
This project has received funding from the European Research Council (ERC) under the European Union's Horizon 2020 research and innovation programme (grant agreement no. 847456). We also acknowledge the support of SNSF grant cRSii5_201792, funding the Synergia project “Seamless coupling of kilometer-resolution weather predictions and climate simulations with hail impact assessments for multiple sectors” (scClim; https://scclim.ethz.ch/, last access: 9 October 2025). The positions of Monika Feldmann and Olivia Martius are funded through the Mobiliar group.
This paper was edited by Peter Knippertz and reviewed by Flavio Pons and one anonymous referee.
Arnould, G., Montmerle, T., Rottner, L., and Moisselin, J.-M.: An object-based method to study the life cycle of mesoscale convective systems and their environment from cloud-resolving AROME-France simulations, Quarterly Journal of the Royal Meteorological Society, https://doi.org/10.1002/qj.4919, 2025. a
Augenstein, M.: Variabilität, Trends und serielles Clustering schwerer Gewitterereignisse im Bezug zu großräumigen atmosphärischen Bedingungen, Karlsruher Institut für Technologie (KIT), https://doi.org/10.5445/IR/1000179408, 2025. a
Bagaglini, L., Ingrosso, R., and Miglietta, M. M.: Synoptic patterns and mesoscale precursors of Italian tornadoes, Atmos. Res., 253, 105503, https://doi.org/10.1016/j.atmosres.2021.105503, 2021. a
Barnes, S. and Newton, C.: Thunderstorms in the synoptic setting, Thunderstorm Morphology and Dynamics, 1, ISBN 0806119365, 1986. a
Barnes, S. L.: Oklahoma thunderstorms on 29–30 April 1970. Part I: Morphology of a tornadic storm, Mon. Weather Rev., 106, 673–684, https://doi.org/10.1175/1520-0493(1978)106<0673:OTOAPI>2.0.CO;2, 1978. a
Barras, H., Martius, O., Nisi, L., Schroeer, K., Hering, A., and Germann, U.: Multi-day hail clusters and isolated hail days in Switzerland – large-scale flow conditions and precursors, Weather Clim. Dynam., 2, 1167–1185, https://doi.org/10.5194/wcd-2-1167-2021, 2021. a, b, c, d
Barton, E. J., Klein, C., Taylor, C. M., Marsham, J., Parker, D. J., Maybee, B., Feng, Z., and Leung, L. R.: Soil moisture gradients strengthen mesoscale convective systems by increasing wind shear, Nat. Geosci., 18, 330–336, https://doi.org/10.1038/s41561-025-01666-8, 2025. a, b
Battaglioli, F., Groenemeijer, P., Púčik, T., Taszarek, M., Ulbrich, U., and Rust, H.: Modeled multidecadal trends of lightning and (very) large hail in Europe and North America (1950–2021), J. Appl. Meteorol., 62, 1627–1653, https://doi.org/10.1175/JAMC-D-22-0195.1, 2023. a, b
Benjamini, Y. and Hochberg, Y.: Controlling the false discovery rate: a practical and powerful approach to multiple testing, J. Roy. Stat. Soc. B Met., 57, 289–300, https://doi.org/10.1111/j.2517-6161.1995.tb02031.x, 1995. a
Bowen, S., Kerschner, B., and Zheng Ng, J.: Natural catastrophe and climate report 2023, Gallagher Re, https://www.ajg.com/gallagherre/-/media/files/gallagher/gallagherre/news-and-insights/2024/january/natural_catastrophe_and_climate_report_2023.pdf (last access: 29 September 2025), 2024. a, b
Brogli, R., Sørland, S. L., Kröner, N., and Schär, C.: Causes of future Mediterranean precipitation decline depend on the season, Environ. Res. Lett., 14, 114017, https://doi.org/10.1088/1748-9326/ab4438, 2019. a
Brooks, H.: Proximity soundings for severe convection for Europe and the United States from reanalysis data, Atmos. Res., 93, 546–553, https://doi.org/10.1016/j.atmosres.2008.10.005, 2009. a
Cui, R., Thurnherr, I., Velasquez, P., Brennan, K., Leclair, M., Mazzoleni, A., Schmid, T., Wernli, H., and Schär, C.: A European hail and lightning climatology from an 11-year kilometer-scale regional climate simulation, Authorea Preprints, https://doi.org/10.22541/essoar.173120326.69513564, 2024. a
De Martin, F., Davolio, S., Miglietta, M. M., and Levizzani, V.: A conceptual model for the development of tornadoes in the complex orography of the Po Valley, Mon. Weather Rev., 152, 1357–1377, https://doi.org/10.1175/MWR-D-23-0222.1, 2024. a
De Martin, F., Manzato, A., Carlon, N., Setvák, M., and Miglietta, M. M.: Dynamic and statistical analysis of giant hail environments in northeast Italy, Q. J. Roy. Meteor. Soc., 151, e4945, https://doi.org/10.1002/qj.4945, 2025. a, b
Doswell, C. A.: Severe Convective Storms – An Overview, in: Severe Convective Storms, edited by: Doswell, C. A., American Meteorological Society, Boston, MA, https://doi.org/10.1007/978-1-935704-06-5_1, 1–26, 2001. a
Doswell, C. A. and Bosart, L. F.: Extratropical Synoptic-Scale Processes and Severe Convection, in: Severe Convective Storms, edited by: Doswell, C. A., American Meteorological Society, Boston, MA, https://doi.org/10.1007/978-1-935704-06-5_2, 27–69, 2001. a, b, c, d, e
Eisenbach, S.: Hail record broken again – 19cm hailstone confirmed in Italy – European Severe Storms Laboratory, https://www.essl.org/cms/hail-record-broken-again-19cm-hailstone-confirmed-in-italy/ (last access: 29 September 2025), 2023. a
Emanuel, K.: On the physics of high CAPE, J. Atmos. Sci., 80, 2669–2683, https://doi.org/10.1175/JAS-D-23-0060.1, 2023. a, b, c
Enno, S.-E., Sugier, J., Alber, R., and Seltzer, M.: Lightning flash density in Europe based on 10 years of ATDnet data, Atmos. Res., 235, 104769, https://doi.org/10.1016/j.atmosres.2019.104769, 2020. a
Faranda, D., Alvarez-Castro, M. C., Ginesta, M., Coppola, E., and Pons, F. M. E.: Heavy precipitations in October 2024 South-Eastern Spain DANA mostly strengthened by human-driven climate change, Tech. rep., ClimaMeter, Institut Pierre Simon Laplace, CNRS, Zenodo [code], https://doi.org/10.5281/zenodo.14052042, 2024. a
Feldmann, M.: feldmann-m/EU_conv: CONV_EU_V1.1 (V1.1), Zenodo [code], https://doi.org/10.5281/zenodo.17286914, 2025. a
Feldmann, M., Germann, U., Gabella, M., and Berne, A.: A characterisation of Alpine mesocyclone occurrence, Weather Clim. Dynam., 2, 1225–1244, https://doi.org/10.5194/wcd-2-1225-2021, 2021. a, b, c
Fery, L. and Faranda, D.: Analysing 23 years of warm-season derechos in France: a climatology and investigation of synoptic and environmental changes, Weather Clim. Dynam., 5, 439–461, https://doi.org/10.5194/wcd-5-439-2024, 2024. a
Froidevaux, P., Schlemmer, L., Schmidli, J., Langhans, W., and Schär, C.: Influence of the background wind on the local soil moisture–precipitation feedback, J. Atmos. Sci., 71, 782–799, https://doi.org/10.1175/JAS-D-13-0180.1, 2014. a
Ghasemifard, H., Groenemeijer, P., Battaglioli, F., and Púčik, T.: Do changing circulation types raise the frequency of summertime thunderstorms and large hail in Europe?, Environmental Research: Climate, 3, 015008, https://doi.org/10.1088/2752-5295/ad22ec, 2024. a, b
Giordani, A., Kunz, M., Bedka, K. M., Punge, H. J., Paccagnella, T., Pavan, V., Cerenzia, I. M. L., and Di Sabatino, S.: Characterizing hail-prone environments using convection-permitting reanalysis and overshooting top detections over south-central Europe, Nat. Hazards Earth Syst. Sci., 24, 2331–2357, https://doi.org/10.5194/nhess-24-2331-2024, 2024. a
Guillod, B. P., Orlowsky, B., Miralles, D. G., Teuling, A. J., and Seneviratne, S. I.: Reconciling spatial and temporal soil moisture effects on afternoon rainfall, Nat. Commun., 6, 6443, https://doi.org/10.1038/ncomms7443, 2015. a
Hamed, K. H. and Ramachandra Rao, A.: A modified Mann-Kendall trend test for autocorrelated data, J. Hydrol., 204, 182–196, https://doi.org/10.1016/S0022-1694(97)00125-X, 1998. a
Hartigan, J. A. and Wong, M. A.: Algorithm AS 136: a K-means clustering algorithm, J. Roy. Stat. Soc. C-App., 28, 100–108, http://www.jstor.org/stable/2346830, 1979. a, b
Hersbach, H., Bell, B., Berrisford, P., Hirahara, S., Horányi, A., Muñoz-Sabater, J., Nicolas, J., Peubey, C., Radu, R., Schepers, D., Simmons, A., Soci, C., Abdalla, S., Abellan, X., Balsamo, G., Bechtold, P., Biavati, G., Bidlot, J., Bonavita, M., De Chiara, G., Dahlgren, P., Dee, D., Diamantakis, M., Dragani, R., Flemming, J., Forbes, R., Fuentes, M., Geer, A., Haimberger, L., Healy, S., Hogan, R. J., Hólm, E., Janisková, M., Keeley, S., Laloyaux, P., Lopez, P., Lupu, C., Radnoti, G., de Rosnay, P., Rozum, I., Vamborg, F., Villaume, S., and Thépaut, J.-N.: The ERA5 global reanalysis, Q. J. Roy. Meteor. Soc., 146, 1999–2049, https://doi.org/10.1002/qj.3803, 2020. a, b, c, d
Hochman, A., Messori, G., Quinting, J. F., Pinto, J. G., and Grams, C. M.: Do Atlantic-European weather regimes physically exist?, Geophys. Res. Lett., 48, e2021GL095574, https://doi.org/10.1029/2021GL095574, 2021. a
Hoeppe, P.: Trends in weather related disasters – Consequences for insurers and society, Weather and Climate Extremes, 70–79, https://doi.org/10.1016/j.wace.2015.10.002, 2015. a
Hussain, M. M. and Mahmud, I.: pyMannKendall: a python package for non parametric Mann Kendall family of trend tests, Journal of Open Source Software, 4, 1556, https://doi.org/10.21105/joss.01556, 2019. a
Kahraman, A., Kendon, E. J., and Fowler, H. J.: Climatology of severe hail potential in Europe based on a convection-permitting simulation, Clim. Dynam., https://doi.org/10.1007/s00382-024-07227-w, 2024. a
Kopp, J., Schröer, K., Schwierz, C., Hering, A., Germann, U., and Martius, O.: The summer 2021 Switzerland hailstorms: weather situation, major impacts and unique observational data, Weather, 78, 184–191, https://doi.org/10.1002/wea.4306, 2023. a
Lewis, M. W. and Gray, S. L.: Categorisation of synoptic environments associated with mesoscale convective systems over the UK, Atmos. Res., 97, 194–213, https://doi.org/10.1016/j.atmosres.2010.04.001, 2010. a
Liu, W., Zhang, Q., Li, C., Xu, L., and Xiao, W.: The influence of soil moisture on convective activity: a review, Theor. Appl. Climatol., 149, 221–232, https://doi.org/10.1007/s00704-022-04046-z, 2022. a
Manzato, A., Serafin, S., Miglietta, M. M., Kirshbaum, D., and Schulz, W.: A pan–Alpine climatology of lightning and convective initiation, Mon. Weather Rev., https://doi.org/10.1175/MWR-D-21-0149.1, 2022. a
Mohr, S., Wandel, J., Lenggenhager, S., and Martius, O.: Relationship between atmospheric blocking and warm-season thunderstorms over western and central Europe, Q. J. Roy. Meteor. Soc., 145, 3040–3056, https://doi.org/10.1002/qj.3603, 2019. a, b
Mohr, S., Wilhelm, J., Wandel, J., Kunz, M., Portmann, R., Punge, H. J., Schmidberger, M., Quinting, J. F., and Grams, C. M.: The role of large-scale dynamics in an exceptional sequence of severe thunderstorms in Europe May–June 2018, Weather Clim. Dynam., 1, 325–348, https://doi.org/10.5194/wcd-1-325-2020, 2020. a
Morgenstern, D., Stucke, I., Mayr, G. J., Zeileis, A., and Simon, T.: Thunderstorm environments in Europe, Weather Clim. Dynam., 4, 489–509, https://doi.org/10.5194/wcd-4-489-2023, 2023. a
Morris, S. M.: The Spanish plume – testing the forecaster's nerve, Meteorological Magazine, 115, 349–357, 1986. a, b, c, d
Nisi, L., Hering, A., Germann, U., and Martius, O.: A 15-year hail streak climatology for the Alpine region, Q. J. Roy. Meteor. Soc., 144, 1429–1449, https://doi.org/10.1002/qj.3286, 2018. a, b, c
Piper, D. A., Kunz, M., Allen, J. T., and Mohr, S.: Investigation of the temporal variability of thunderstorms in central and western Europe and the relation to large-scale flow and teleconnection patterns, Q. J. Roy. Meteor. Soc., 145, 3644–3666, https://doi.org/10.1002/qj.3647, 2019. a
Portal, A., Angelidou, A., Rousseau-Rizzi, R., Raveh-Rubin, S., Givon, Y., Catto, J. L., Battaglioli, F., Taszarek, M., Flaounas, E., and Martius, O.: Convective environments within Mediterranean cyclones, arXiv [preprint], https://doi.org/10.48550/arXiv.2412.02590, 2024. a
Rädler, A. T., Groenemeijer, P. H., Faust, E., Sausen, R., and Púčik, T.: Frequency of severe thunderstorms across Europe expected to increase in the 21st century due to rising instability, npj Climate and Atmospheric Science, 2, 1–5, https://doi.org/10.1038/s41612-019-0083-7, 2019. a
Schultz, D. M., Young, M. V., and Kirshbaum, D. J.: The “Spanish Plume” elevated mixed layer: review of its use and misuse within the scientific literature, Mon. Weather Rev., 153, https://doi.org/10.1175/MWR-D-24-0139.1, 2025. a, b
Stouffer, S. A., Suchman, E. A., Devinney, L. C., Star, S. A., and Williams Jr., R. M.: The American Soldier: Adjustment During Army Life. (Studies in social psychology in World War II), Vol. 1, Princeton Univ. Press, Oxford, England, xii, 599, ISBN 089126034X, 1949. a
Taszarek, M., Brooks, H. E., and Czernecki, B.: Sounding-derived parameters associated with convective hazards in Europe, Mon. Weather Rev., 145, 1511–1528, https://doi.org/10.1175/MWR-D-16-0384.1, 2017. a
Taszarek, M., Allen, J., Púčik, T., Groenemeijer, P., Czernecki, B., Kolendowicz, L., Lagouvardos, K., Kotroni, V., and Schulz, W.: A climatology of thunderstorms across Europe from a synthesis of multiple data sources, J. Climate, 32, 1813–1837, https://doi.org/10.1175/JCLI-D-18-0372.1, 2019. a, b
Taszarek, M., Kendzierski, S., and Pilguj, N.: Hazardous weather affecting European airports: climatological estimates of situations with limited visibility, thunderstorm, low-level wind shear and snowfall from ERA5, Weather and Climate Extremes, 28, 100243, https://doi.org/10.1016/j.wace.2020.100243, 2020. a
Taszarek, M., Allen, J. T., Brooks, H. E., Pilguj, N., and Czernecki, B.: Differing trends in United States and European severe thunderstorm environments in a warming climate, B. Am. Meteorol. Soc., 102, E296–E322, https://doi.org/10.1175/BAMS-D-20-0004.1, 2021a. a
Taszarek, M., Allen, J. T., Marchio, M., and Brooks, H. E.: Global climatology and trends in convective environments from ERA5 and rawinsonde data, npj Climate and Atmospheric Science, 4, 1–11, https://doi.org/10.1038/s41612-021-00190-x, 2021b. a
Tuel, A., Steinfeld, D., Ali, S. M., Sprenger, M., and Martius, O.: Large-scale drivers of persistent extreme weather during early summer 2021 in Europe, Geophys. Res. Lett., 49, e2022GL099624, https://doi.org/10.1029/2022GL099624, 2022. a
Twardosz, R., Walanus, A., and Guzik, I.: Warming in Europe: recent trends in annual and seasonal temperatures, Pure Appl. Geophys., 178, 4021–4032, https://doi.org/10.1007/s00024-021-02860-6, 2021. a
Ventura, V., Paciorek, C. J., and Risbey, J. S.: Controlling the proportion of falsely rejected hypotheses when conducting multiple tests with climatological data, J. Climate, 17, 4343–4356, https://doi.org/10.1175/3199.1, 2004. a
Wapler, K. and James, P.: Thunderstorm occurrence and characteristics in Central Europe under different synoptic conditions, Atmos. Res., 158–159, 231–244, https://doi.org/10.1016/j.atmosres.2014.07.011, 2014. a, b, c, d
Weusthoff, T.: Weather Type Classification at MeteoSwiss, Arbeitsberichte der MeteoSchweiz, 46pp, https://www.meteoswiss.admin.ch/dam/jcr:ca090643-2407-49f3-9737-a3e55645cfb4/ab235.pdf (last access: 29 September 2025), 2011. a
Wilhelm, J., Mohr, S., Punge, H. J., Mühr, B., Schmidberger, M., Daniell, J. E., Bedka, K. M., and Kunz, M.: Severe thunderstorms with large hail across Germany in June 2019, Weather, 76, 228–237, https://doi.org/10.1002/wea.3886, 2021. a
Wilhelm, L., Schwierz, C., Schröer, K., Taszarek, M., and Martius, O.: Reconstructing hail days in Switzerland with statistical models (1959–2022), Nat. Hazards Earth Syst. Sci., 24, 3869–3894, https://doi.org/10.5194/nhess-24-3869-2024, 2024. a