the Creative Commons Attribution 4.0 License.
the Creative Commons Attribution 4.0 License.
 | 07 Nov 2025
Anthropogenic climate change has increased severity of mid-latitude storms and impacted airport operations
Tommaso Alberti
Davide Faranda
Philippe Drobinski
The impact of extreme weather events, particularly those associated with tropical and extra-tropical cyclones (TC and ETC), on aviation can rise serious concerns in the context of the ongoing climate change. These events often lead to significant disruptions, including flight cancellations, delays, re-routing, and impacts on airport infrastructure resilience to adverse weather conditions. This study conducts an analysis of the influence of anthropogenic climate change on four recent major storm events that occurred over Europe, the USA, and East Asia, with an in-depth analysis on the Storm Eunice, a powerful ETC that affected the UK and Ireland. Using climate reanalysis data we assess the dynamics of these extreme storms and their implications for aviation operations, particularly during critical phases such as take-off and landing. Our research underscores the growing intensity of extreme storms, particularly stronger winds, driven by human-induced climate change, and stresses the need for taking into account growing climate hazards to optimize planes and airport operations.
- Article
(7802 KB) - Full-text XML
- BibTeX
- EndNote


The Sixth Assessment Report (AR6) of the Intergovernmental Panel on Climate Change (IPCC) states that anthropogenic climate change is intensifying extreme weather events (Masson-Delmotte et al., 2021). Global warming is altering atmospheric patterns, leading to an increase in the frequency and severity of extreme events (Archer and Caldeira, 2008; Marvel and Bonfils, 2013). Among these events, thunderstorms and strong winds associated with tropical and extra-tropical cyclones (TC and ETC) are particularly impactful (Cheung and Chu, 2023). For the aviation sector, they pose significant risks both considering on-ground and in-flight effects, enhancing episodes of both Clear Air Turbulence (CAT) and Convectively Induced Turbulence (CIT). These events affect fuel efficiency, passenger comfort, and operational safety, particularly in the lower atmosphere where most commercial aircraft operate (Sharman and Lane, 2016). Specifically, CIT has been estimated to account for 60 % of turbulence-related aircraft accidents (e.g., Cornman and Carmichael, 1993; Gisinger et al., 2024; Storer et al., 2019). Storms can also create unfavourable weather conditions at airports, leading to flight cancellations, delays and, consequently, economic losses (International Civil Aviation Organization, 2018). For instance, visibility issues due to rain or fog can hinder take-off, while strong wind shear gradients can alter the lift an airplane experiences during take-off. According to the Federal Aviation Administration guidelines (Federal Aviation Administration, 2022), landing or taking off should be avoided during an approaching storm, as sudden gust fronts and low level turbulence can lead to a loss of control (Williams, 2014).
As extreme weather events become more frequent and intense, understanding their operational impacts on airports becomes increasingly crucial. Several studies have highlighted the effects of adverse weather on worldwide airport and airline operations. For example, Robinson (1989) found that over 165 000 min of delays per year (around 115 d yr−1) at Atlanta Hartsfield International Airport were attributable to adverse weather. Changnon (1996) noted that increased rainfall in the late 1970s led to more departures with delays over 30 min at Chicago O'Hare Airport. Sasse and Hauf (2003) reported that thunderstorms significantly raised delays at Frankfurt Airport by a factor of 6.3 in 1997 and 1.1 in 1998. Hsiao and Hansen (2006) observed that average delays on days with adverse weather conditions were 14 min longer than on clear days. Borsky and Unterberger (2019), covering 10 large US airports, concluded that flights which face rapid weather changes are delayed by up to 23 min. In the Republic of Korea, Kim et al. (2023) showed that rainfall had a greater impact on aircraft cancellations compared with wind speed. Oo and Oo (2022) found that thunderstorm rain poses the largest risk for aviation operation at the Yangon International Airport in Myanmar. These studies collectively demonstrate the significant sensitivity of airport operations to adverse weather conditions. Furthermore, it is also important to note that such impacts are modulated by large-scale climate variability. Interannual to decadal fluctuations, such as those affecting the North Atlantic jet and storm-track regimes, can substantially alter the frequency and intensity of extratropical atmospheric regimes (and, also cyclones) (Dorrington and Strommen, 2020; Fragkoulidis, 2022; Massacand and Davies, 2001). In some cases, the contribution of internal variability has been shown to be of comparable magnitude to forced climate signals (e.g., Hay et al., 2023), complicating the attribution of observed changes to anthropogenic drivers, especially over relatively short comparison periods. These findings suggest that aviation operations are exposed to a dual challenge: disruptions from current extreme weather and the added uncertainty from internal climate variability, both of which may be amplified in a warming climate. In fact, under the ongoing global warming, these impacts can be exacerbated by changes in the characteristics of TC and ETC (Seneviratne et al., 2021), including increased intensity, altered storm tracks (Priestley et al., 2020; Priestley and Catto, 2022), and enhanced atmospheric instability (Lockwood et al., 2024). In particular, variations in wind shear, both vertical and horizontal, can become more pronounced near cyclonic systems, posing significant risks for aviation safety. These changes may affect aircraft performance by increasing turbulence during flight, altering take-off and landing distances, and modifying climb and descent angles (Gratton et al., 2022). The influence of climate change on extratropical cyclones has been addressed by numerous studies, which highlight both regional and dynamical changes in their characteristics. For instance, Zappa et al. (2013) used CMIP5 model simulations to show a projected poleward shift and reduction in frequency of extratropical cyclones in the North Atlantic and European sectors, particularly during the storm track season. Ulbrich et al. (2009) reviewed multiple model projections and emphasized a likely decrease in cyclone frequency in the mid-latitudes, accompanied by a potential intensification of the most extreme events, especially in the North Atlantic. More recently, Priestley and Catto (2022) provided an updated synthesis indicating that while mean cyclone activity may decline, there is increasing evidence that intense cyclones may become more frequent, with enhanced associated precipitation and wind extremes. These projected changes are linked to modifications in baroclinicity, jet stream dynamics, and low-level temperature gradients driven by anthropogenic warming. The IPCC report (Lee et al., 2021) suggests that, while the overall intensity and number of ETC may not change, the associated precipitation and impacts will likely increase, particularly in the North Atlantic during winter, although with regional variations. Similarly, while some studies suggest that tornadoes – particularly those associated with land-falling tropical cyclones – may become more common in the USA (Wu et al., 2022), the evidence remains mixed, with other analyses finding no robust trend in overall tornado frequency (Brooks et al., 2014). Nonetheless, tornado outbreaks could become more dangerous due to increased duration, clustering, and a higher likelihood of occurring at night (Forbis et al., 2024). Understanding these changes is crucial for the aviation industry, as it navigates the evolving risks posed by a changing climate. Several recent studies have provided evidence of increasing turbulence levels and episodes, especially at mid-latitudes (Williams and Joshi, 2013; Williams, 2017; Storer et al., 2017, 2019; Alberti et al., 2024). Nevertheless, an observation-based (analogues) attribution approach to investigate how the weather systems that contributed and forced to airport closures, disruptions, delays, and cancellations, have changed compared to similar synoptic-scale situations and conditions occurred in the past is still missing. These studies can be helpful for stakeholders to be better prepared for the challenges ahead and implement strategies to mitigate the associated risks. These risks are particularly relevant in regions such as Europe, the USA, and Asia which have dense air traffic networks and significant economic activities (Burbidge, 2023). In this context, the framework of attribution science (Otto, 2016, 2019; Yiou et al., 2017) represents the most powerful tool for assessing changes in the frequency and spatial patterns of specific extreme events, as well as the probability that climate change influences these events (e.g., Faranda et al., 2023, 2024). In fact, although similar large-scale patterns are observed historically, their effects and impacts, as measured, among other things, by changing wind patterns and intensity, bulk wind difference, turbulence-related metrics, are now different with respect to the past, thus suggesting a possible link with anthropogenic climate change.
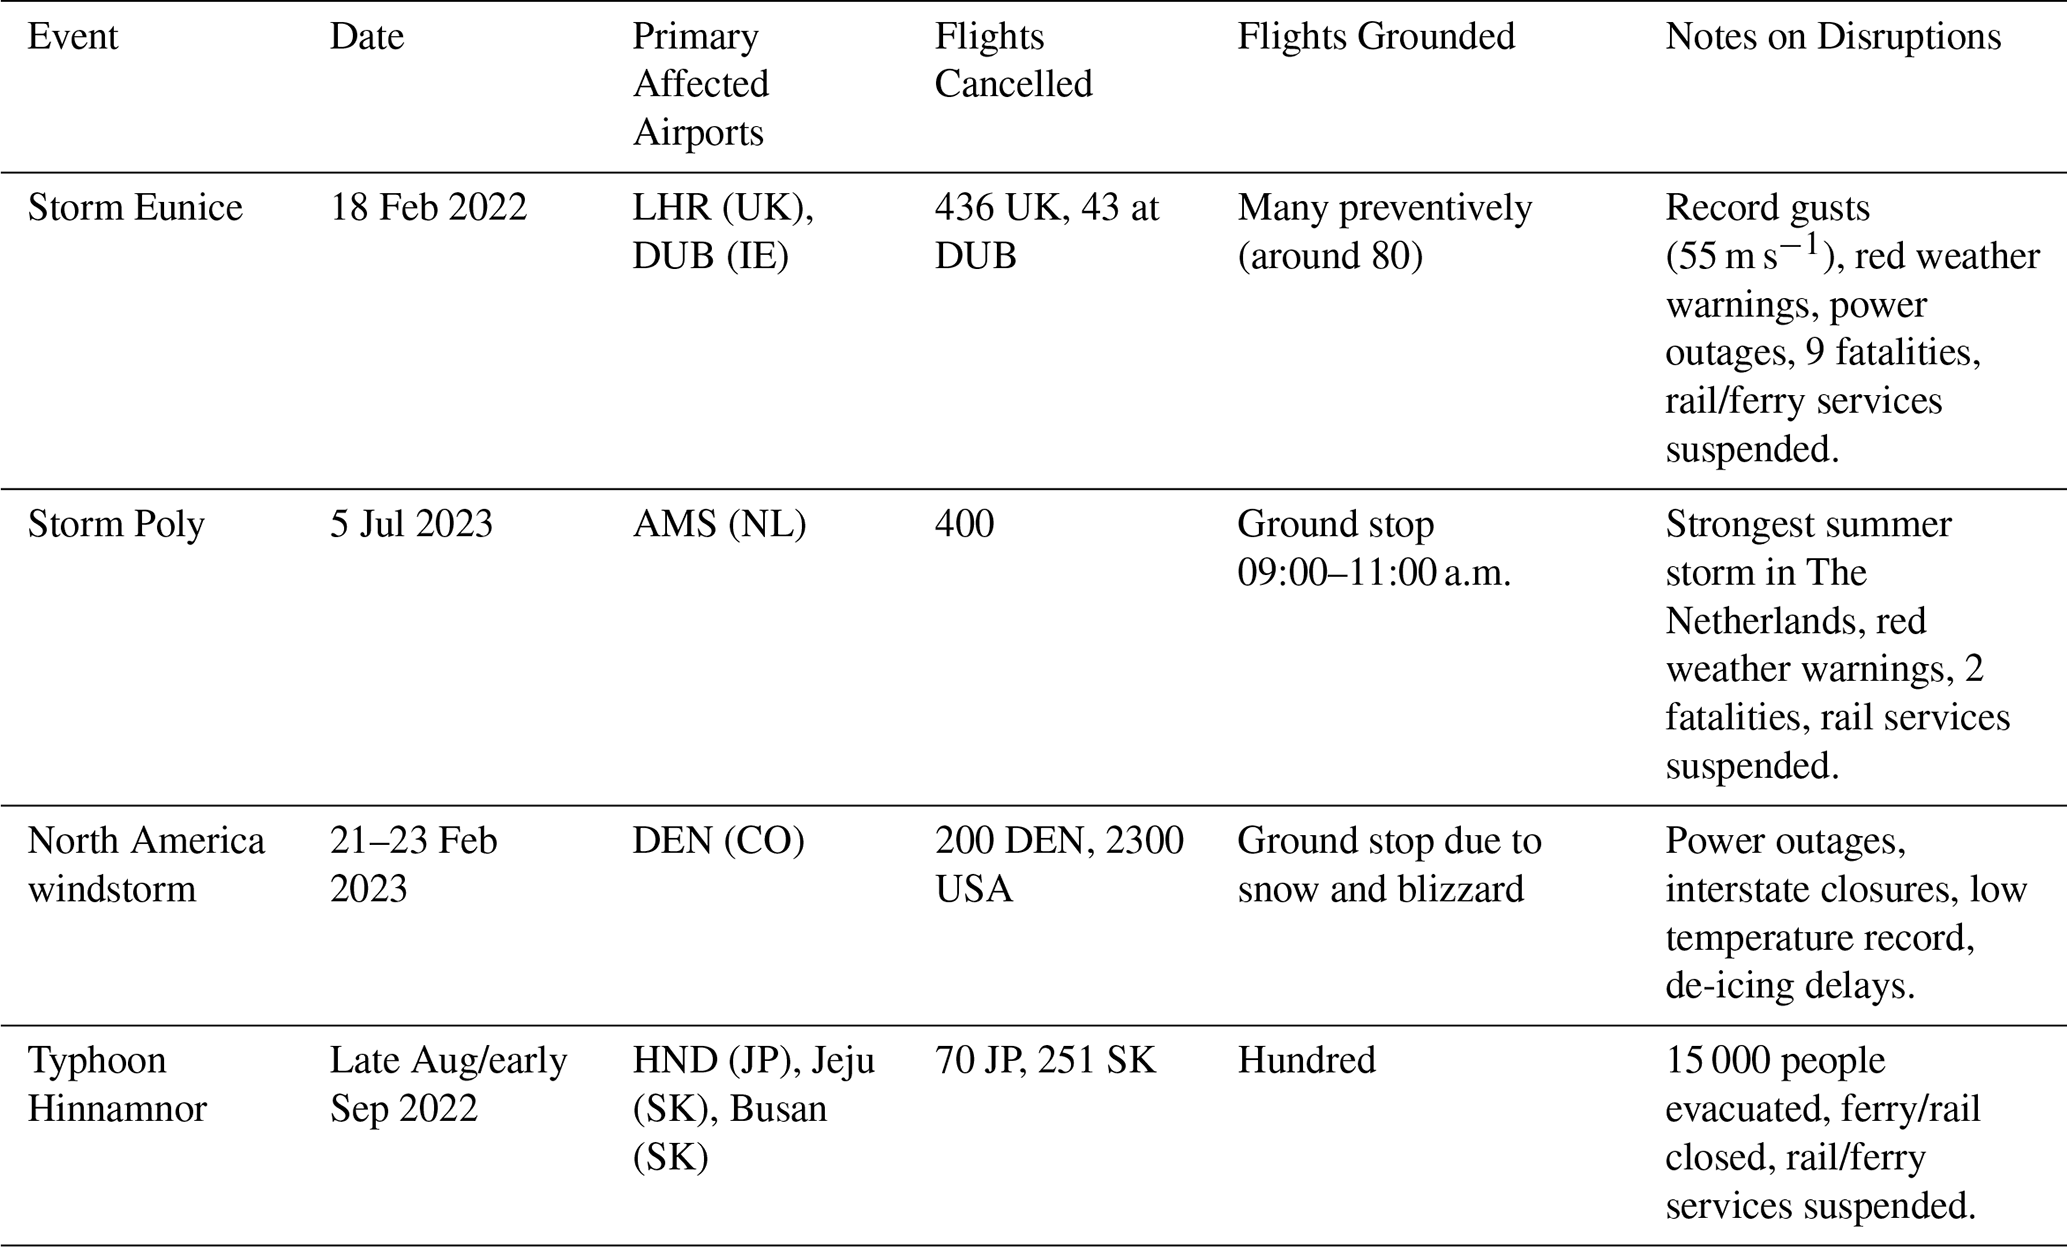
The present study aims to propose a way to detect the influence of anthropogenic climate change on four notable storms events associated with ETC/TC that occurred over Europe, the USA, and East Asia between 2022 and 2023 (see Table 1 for more details). Our aim is to offer a first observation-based framework to attribute impacts of four high-impact weather events that forced airports' disruptions to find if these impacts belongs to the same class of previously-observed ones. In particular, we focus on storm Eunice, a powerful ETC that mainly affected UK and Ireland in February 2022, providing a detailed analysis to illustrate the methodology. Additionally, we examine storm Poly, a severe windstorm impacting northwest Europe in early July 2023; a strong North American windstorm, responsible for widespread impacts across much of the USA in late February 2023; and Typhoon Hinnamnor, which affected the western Pacific in late August 2022. We decided to focus on these events as they had significant impacts on aviation, resulting in numerous flight cancellations and delays. Furthermore, they are also characterized by higher wind speeds near airports, compared to similar events over the period 1989–2023, thus being representatives of extreme events with high impact on airport operations within the current climate. In our analysis, we assess atmospheric variables at ground level (or close to it) since our focus is on issues that could prevent airports' operations, including take-off and/or disrupt landings, as well as, forcing flight cancellations and airports' closures, rather than on challenges that may arise during flight as in previous studies (e.g., Alberti et al., 2024). We need to emphasize that our analysis aims at investigating how the weather systems that forced airports' disruptions were affected by climate change, rather than how climate change actually affected air travel. Indeed, while natural mode variability and climate change trends can be quantified using indices and the long-term behaviour of key meteorological parameters – thus supporting an attribution-based framework widely employed across various sectors (e.g., Faranda et al., 2024) – directly assessing their impacts on air travel, such as costs, delays, and weather-related disruptions, requires additional considerations. In particular, such an analysis would necessitate the inclusion of more data, some of which must span short time intervals to ensure statistical robustness when comparing present and past conditions. Furthermore, it is essential to account for other factors, including the substantial increase in the number of flights over recent decades, as well as the evolution in aircraft technology. The paper is organized as follows. In Sect. 2, we present the data and the methods which we will use in our forthcoming analysis. In Sect. 3 we first present detailed results for storm Eunice, followed by main results for the other events. We draw our conclusion in Sect. 4.
Table 1Operational impacts on airports for the four events analysed. The airports abbreviations used are: LHR (London Heathrow), DUB (Dublin), AMS (Amsterdam Schipol), DEN (Denver International) and Haneda (HND).
2.1 ERA5 reanalysis data
For our analysis, we use the ERA5 reanalysis dataset (Soci et al., 2024), which has a spatial resolution of 0.25°×0.25°, covering the period from 1950 to 2023, at 6-hourly temporal resolution. Specifically, we use different variables in our analysis: the mean sea level pressure, SLP [hPa], the geopotential height at 500 hPa, Z500 [m], the 2 m air temperature, T [°C], the total precipitation, TP [mm d−1], and the 10 m wind speed, V [m s−1] to characterize the event from a meteorological point of view. Additionally, the velocity field at the two pressure levels closest to the ground, namely 1000 and 975 hPa, is used to quantify its impacts on airport operations, not only in terms of adverse weather conditions featured by airports' infrastructures but also during take-off and landing operations. To the latter purpose, we evaluate the velocity field gradient as it affect the the climb/descent angle/gradient required for an aircraft to take off/landing, together with turbulence-related metrics, i.e., the Ellrod's indices TI1 and TI2, operationally developed to assist in forecasting CAT and potentially CIT in the atmosphere (Ellrod and Knapp, 1992). TI1 provides a measure of turbulence generation due to bulk wind difference-induced strain. It is the product of vertical wind shear (VWS) and horizontal deformation (DEF):
with
and
Here, u and v are the zonal and meridional components of the horizontal wind, respectively, extracted from ERA5 data; z denotes the vertical coordinate, while x and y denote the zonal and meridional horizontal coordinates, respectively. TI2 incorporates the presence of frontal zones, accounting for both dynamic and thermodynamic properties of the atmosphere, and is particularly useful for identifying regions prone to aviation turbulence (Ellrod and Knox, 2010). It is computed as:
where the divergent flow term is
so that −DIV represents the convergent component. In both cases, larger values of TI1 or TI2 are usually associated with areas of increased potential for CAT or CIT development. As an additional metric, we also evaluated the eddy dissipation rate (EDR) based on ERA5 data (Alberti et al., 2024). The EDR quantifies the rate at which turbulent kinetic energy is transferred down to smaller scales and ultimately dissipated as heat due to viscous effects (International Civil Aviation Organization, 2018). This metric provides insight into the energy cascade process in turbulence, reflecting the intensity of mixing and the efficiency of kinetic energy conversion into thermal energy within the atmosphere. The EDR is computed as
where denotes the root-mean-square (RMS) of the velocity field, and Δt is the temporal resolution. We need to underline that this EDR is not calibrated to aircraft-specific measurements, unlike values derived from AMDAR observations (International Civil Aviation Organization, 2018). Nevertheless, its statistical properties (e.g., Alberti et al., 2024) show good consistency with values reported in the literature, supporting its use for classifying aviation turbulence into standard intensity categories (International Civil Aviation Organization, 2018). Indeed, EDR is widely used to classify turbulence into different classes/levels (International Civil Aviation Organization, 2018): when EDR ≤0.2, turbulence is light, moderate turbulence occurs when 0.2< EDR ≤0.45, while severe turbulence is experienced when EDR >0.45.
ERA5 provides a suitable basis for assessing trends in our impact variables, particularly when analyses are anchored in the well-observed satellite era and supported by basic robustness checks. Large-scale circulation trends since 1979 are physically consistent, dynamically plausible, and cross-supported by other reanalyses. As an example, Simmons (2022) showed strengthened and meridionally expanded tropical easterlies, shifts in the North Atlantic jet, and increases in extreme jet-stream winds, with patterns coherent across vertical levels and datasets. The recent back-extensions of ERA5 substantially increase temporal coverage, but their stability is lower because they rely on much sparser and evolving observations, especially before the satellite era (Bell et al., 2021; Soci et al., 2024). Surface-impact variables are of course particularly sensitive to the evolving surface observing network, such as changes in station density over land or the transition from ship to buoy observations over ocean, which feed the assimilation system. These factors underscore the need for sensitivity tests and cross-dataset comparisons when interpreting ERA5-based trends, especially outside the satellite era and in regions with limited observational coverage. However, at the present time ERA5 represents the best-suited product to investigate long-term variability and to perform attribution studies (Faranda et al., 2024). Of course, the temporal stability of reanalysis products such as ERA5 is not guaranteed, as discontinuities related to evolving assimilation systems and observational inputs can affect long-term consistency, which need further assessment for future releases.
2.2 Method
In this section we present the procedure we use to detect the influence of climate change on ETCs. To detect recurring patterns in large-scale weather events we follow the methodology presented by Faranda et al. (2024), based on the analogues methodology outlined by Yiou et al. (2017); Ginesta et al. (2024). Each event is represented through its synoptic conditions via the SLP (or the Z500) field over a specific spatial domain that contains the low-pressure area associated with the storm/cyclone1. We designate as the “cyclone time” the time-step corresponding to the SLP minimum over this area. Then, the SLP field of the event is compared with all others in the database to find its weather analogues, i.e., a sample of events minimizing their Euclidean distances with the event itself (Faranda et al., 2024). The analogues are searched in the same fixed area where we look for the SLP minimum. The full database is then divided into two non-overlapping periods of equal duration and long enough for statistical characterization of extreme events, natural variability but short enough to assume that extreme events have similar characteristics in each period. We choose 35-year periods – as customary in attribution studies (Luu et al., 2018; Vautard et al., 2019) – to strike a balance between ensuring the climate state remains relatively stable and being long enough to smooth out short-term fluctuations in atmospheric dynamics. The less recent period [1950–1984] is representative of climate conditions less impacted by global warming, usually defined as “factual period”; the most recent period [1989–2023] reflects a stronger anthropogenic influence (Gulev et al., 2021), usually defined as “counterfactual period”. For both factual and counterfactual periods, we select the thirty best analogues (Tables A1, A2). As is typical for attribution studies, the cyclone itself is not included in the list, and analogues overlapping over a 7 d consecutive period are also excluded. Furthermore, we search analogues only over the months of the extended season during which the cyclone time occurred, i.e., December–January–February–March (DJFM) as the winter season and June–July–August–September (JJAS) as the summer season. This accounts for potential shifts in atmospheric circulation due to climate change and to restrict the analysis to events typical of a specific season, which are more likely to present similar patterns and characteristics (Faranda et al., 2024). This also prevents mixing the distinct physical processes that contribute to storms in warm versus cold seasons.
For each period, we compute SLP, Z500 and T anomalies over the time-steps corresponding to the identified analogues. Specifically, we removed at each grid-point and for each time-step the average of SLP, Z500 and T values for all the corresponding calendar values in the period 1950–2023. We then calculate a weighted average of the anomalies over the two time windows. The weights are calculated as the reciprocal of the logarithm of the Euclidean distance of each specific analogue, which gives more importance to the analogues closer to the event. Finally, we take the difference between the two averages, to assess whether changes occurred between a climate with and without climate change. The analysis extends to impact-oriented variables, i.e., TP, V, TI1, TI2, and EDR. For these variables, composite maps are generated directly through weighted logarithmic averaging of the data, along with the difference maps between factual and counterfactual scenarios. To test the significance of the differences, we apply the bootstrap method at the 95th level of confidence (Faranda et al., 2024). Finally, to account for the potential influence of low-frequency modes of natural variability, we use the El Niño-Southern Oscillation (ENSO), the Atlantic Multi-decadal Oscillation (AMO), the Pacific Decadal Oscillation (PDO), the East Atlantic (EA), the Scandinavian pattern (SCAN) and the North-Atlantic Oscillation (NAO) monthly indices values. These tele-connection patterns are known to influence, both directly and indirectly, the Euro-Mediterranean weather and climate extremes. In particular, the NAO is the principal mode of atmospheric variability in the North Atlantic/European region, it is strongly linked to the position of the storm track, especially during winter, and its positive phase is associated to a higher occurrence of extreme ETCs (Pinto et al., 2009). The monthly indices are computed from the NOAA/ERSSTv5 data and retrieved from KNMI's climate explorer. In particular, the ENSO index is the 3.4 version as defined by Huang et al. (2017), the AMO index is computed as described in Trenberth and Shea (2006) and the NAO index is the rotated empirical orthogonal function of Z500. We applied a two-sided Kolmogorov-Smirnov test to assess the significance of changes in the distributions of analogues between the two periods. If the p-value is below 0.05, we reject the null hypothesis, indicating distinct distributions. If low-frequency variability is excluded, changes in analogues between present and past period are attributed to climate change. Moreover, we also examine changes in the monthly occurrence of analogues to determine whether there is a shift in atmospheric circulation within the season.
We present a detailed case study for the Storm Eunice to provide a comprehensive overview of the methodology. For the other events, we will directly focus on the impacts at airports.
3.1 Storm Eunice
Storm Eunice, the second of three named storms that affected the UK within a week in February 2022, brought severe weather across the UK and Ireland, causing fatalities and significant transport disruptions (Kendon, 2022). A significant disruption in air traffic led to the cancellation of more than 400 flights across the UK, with the majority involving Heathrow Airport (Timmins, 2022). In Ireland, Dublin Airport was also heavily impacted, with a large number of both incoming and outgoing flights being cancelled (The Sun, 2022). European insurance costs were estimated to be around 2.5 billions euros (Rosanes, 2022). Initially a weak system around 40° N, 50° W at 06:00 UTC on 16 February Eunice rapidly intensified over the next 24 h, deepening explosively to a central pressure of 975 hPa, positioned southwest of Ireland, by 00:00 UTC on 18 February. At its peak, 11:00 UTC on 18 February, the storm produced a record-breaking wind gust of 55 m s−1 at the Needles Old Battery on the Isle of Wight. Surface wind speeds reached 28 m s−1 in the English Channel and remained strong across land, with most stations recording speeds over 15 m s−1. This intensity was partially attributed to a sting jet, a narrow air stream within the storm capable of producing exceptionally strong winds over localized areas (e.g. Volonté et al., 2024a). This phenomenon occurs in some cyclones classified as Shapiro-Keyser. For a detailed explanation of this phenomenon during storm Eunice, we refer to Volonté et al. (2024b). As our focus is on impacts on airports disruptions, we have selected the British Islands as the spatial domain for the attribution analysis, given the significant disruptions experienced in this region (Kendon, 2022).
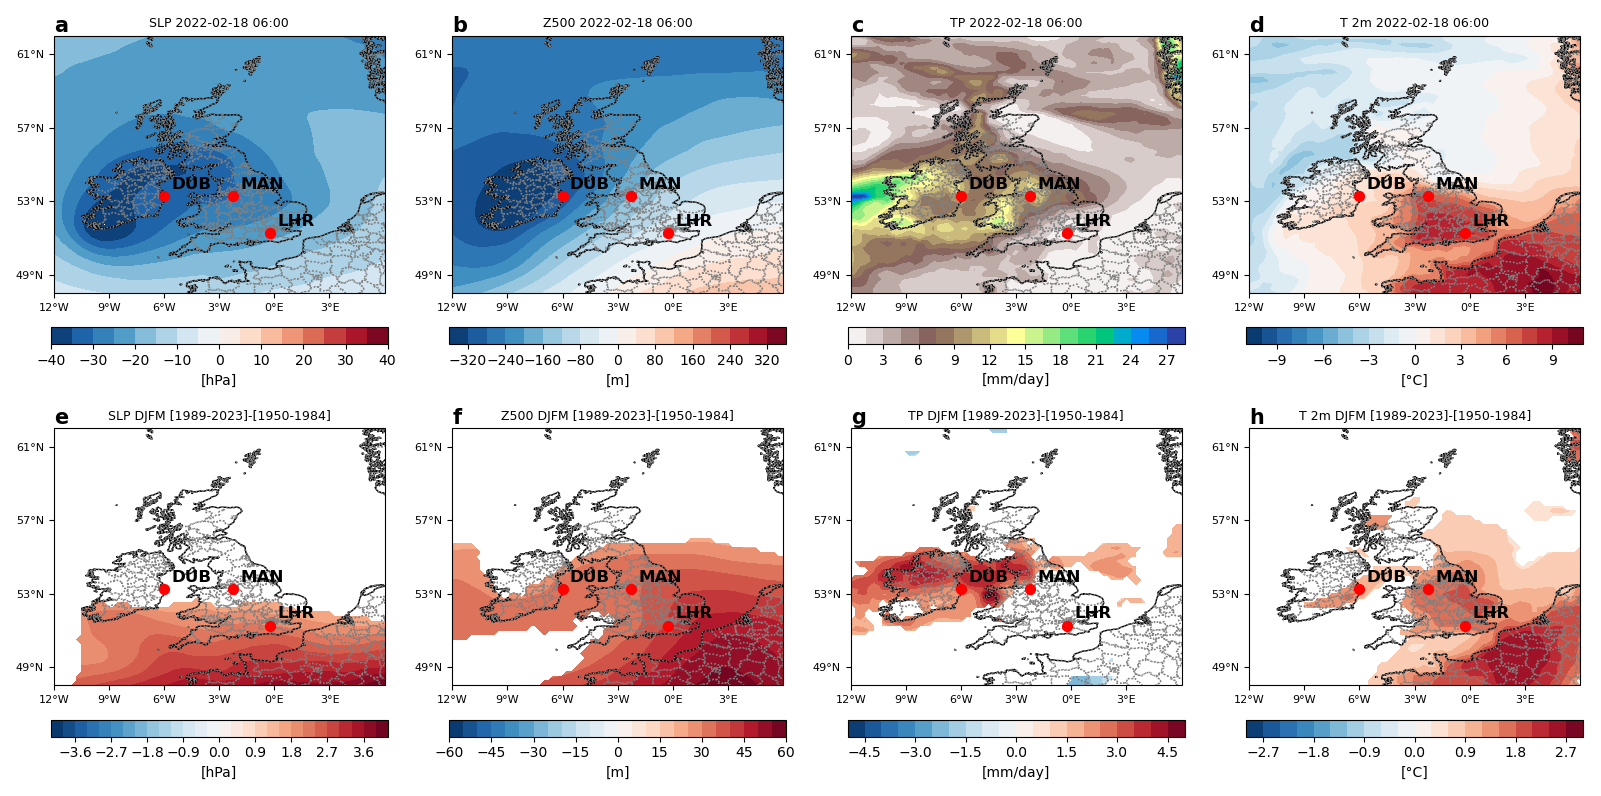
Figure 1Analogue-based results for the Storm Eunice. SLP (a) anomaly, Z500 (b) anomaly, TP (c) and 2 m T (d) anomaly at the cyclone time. Red dots indicate major airports in the region: Dublin Airport (DUB), Manchester Airport (MAN) and London Heathrow Airport (LHR). Difference between factual [1989–2023] and counterfactual [1950–1984] period of the average anomalies at the time-steps corresponding to the analogues for SLP (e), Z500 (f), TP (g) and 2 m temperature (h). In the second row, shadings indicate significant changes.
This area fully contains the low pressure area associated with the cyclone, with the cyclone time identified at 06:00 UTC on 18 February 2022, when the storm's centre was located just south of Ireland. This can be easily located by the minimum in the SLP anomaly (Fig. 1a), showing a wide depression up to −40 hPa. At that time, Eunice was still in its early stages, reaching its mature phase only around 11:00 on the same day, while crossing southern UK before continuing its track eastward. During these early stages, the sting jet remained strong over the area, clearly visible in satellite images (see Fig. 3 in Volonté et al., 2024a). This is also consistent with the Z500 and T anomaly patterns displaying a strong positive gradients of approximately 500 m and 12 °C, respectively, between the area around the cyclone centre and northern France (Fig. 1b, d). At the cyclone time, the heaviest rainfall was observed over western Ireland and Wales (Fig. 1c), with peak values reaching up to 27 mm d−1. The comparison between past and present period suggests that this type of cyclone are now shallower than in the past (Fig. 1e), showing increased anomalies up to ∼4 hPa over continental Europe and up to ∼ 1 hPa close to the centre of the cyclone. Similarly, increased geopotential height anomalies (up to 50–60 m) and air temperatures anomalies (up to 2.7 °C) are also observed in the present compared to the past (Fig. 1f, h), although no changes are observed close to the cyclone centre. This could indicate a north-east shift of the cyclone core in the present climate, suggesting changes in the storm trajectory. Nevertheless, present-day cyclones bring more precipitation (up to 4.5 mm d−1) with respect to the past (Fig. 1g), significantly higher upstream of the centre, over Ireland and few areas in central UK. Looking at impacts on wind speed variations, we can observe that during the event the strongest winds were concentrated below the cyclone centre, reaching up to 30 m s−1 (Fig. 2a) on ground and up to 40 m s−1 (Fig. 2b) at 975 hPa (around 400 m). Furthermore, present-day cyclones are characterized by higher-than-normal wind speeds, with anomalies of up to 2 m s−1 on ground (Fig. 2c) and 4 m s−1 at 975 hPa (Fig. 2d), particularly over regions such as the southern UK and the Dublin area. These wind speed increases align with the Z500 anomaly pattern observed during the event and in the analogues scenarios. Specifically, a gradient in Z500 anomalies at the cyclone time was detected between the area around the cyclone centre and northern France, with the pressure gradient increasing toward the southwest part of the domain (Fig. 1b). In the present climate, the same areas are characterized by a steeper gradient in geopotential height, as suggested by the larger Z500 values over the high-pressure region, corresponding to increased wind speed intensity. At the cyclone time these areas experienced wind speeds exceeding 7 m s−1, a critical threshold for aviation disturbances (International Civil Aviation Organization, 2008). This suggests that more extensive regions during Eunice-like storms in the present climate will be exposed to winds surpassing this threshold. This results aligns with recent literature, which has identified an extended wind footprint south-east of the centre of strong cyclones – an area where wind speed tends to intensify in a warmer climate (Priestley et al., 2024; Dolores-Tesillos et al., 2022). Such condition may amplify challenges for aviation operations. In particular, they could promote stronger vertical bulk wind difference that could potentially affect aviation operations, especially during take-off or landing phases, creating crosswinds.
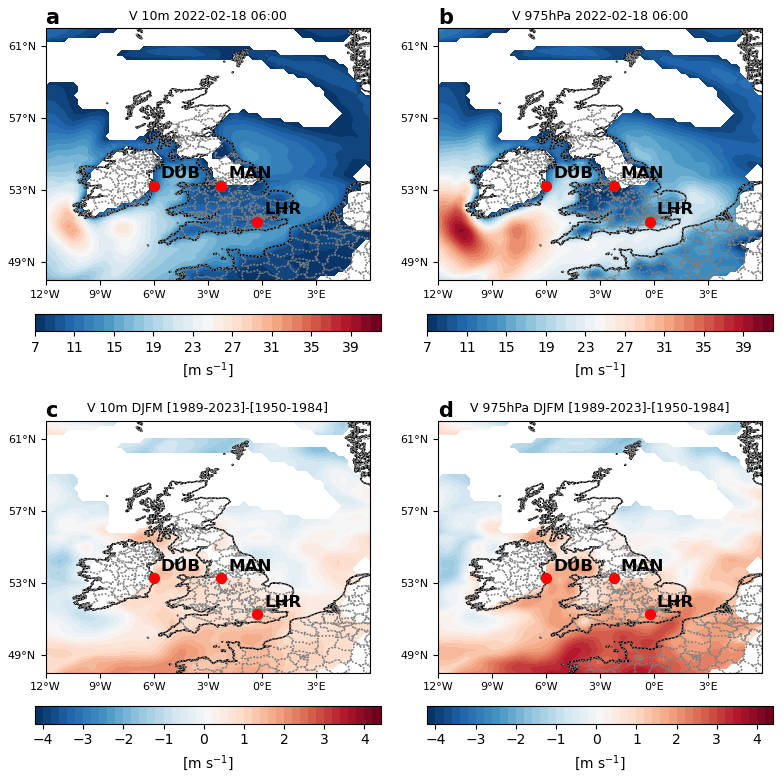
Figure 2Analogue-based results on the wind speed for the Storm Eunice. 10 m (a) and 975 hPa (b) wind speed at the cyclone time. Difference between factual [1989–2023] and counterfactual [1950–1984] period of the average field at the time-steps corresponding to the analogues for 10 m (c) and 975 hPa (d) wind speed, respectively. Red dots indicate major airports in the region: Dublin Airport (DUB), Manchester Airport (MAN) and Heathrow Airport (LHR).
The storm Eunice generated stronger (up to 11 m s−1) vertical wind speed bulk differences (Fig. 3a) in a region further south than the centre of the cyclone, as well as over the English Channel, the southern coasts of the UK and the northern French coasts. Over the same regions larger values of all turbulence-related metrics, i.e., TI1, TI2, and EDR, are observed (Fig. 3b–d), thus suggesting enhanced risks for coastal airports during take-off or landing. By comparing present episodes with past events we observe increased bulk wind differences up to 2 m s−1 over the sea and Northern France (Fig. 3e), with localised increases in TI1 over Southern coasts of Ireland, Eastern and Southern coasts of UK, and Northern coasts of France (Fig. 3f). Larger increases in TI2 (Fig. 3g) are observed over Northern French coasts and Eastern coasts of UK, while an overall increase in the EDR (Fig. 3h) is observed over almost the Southern part of the analysed domain.
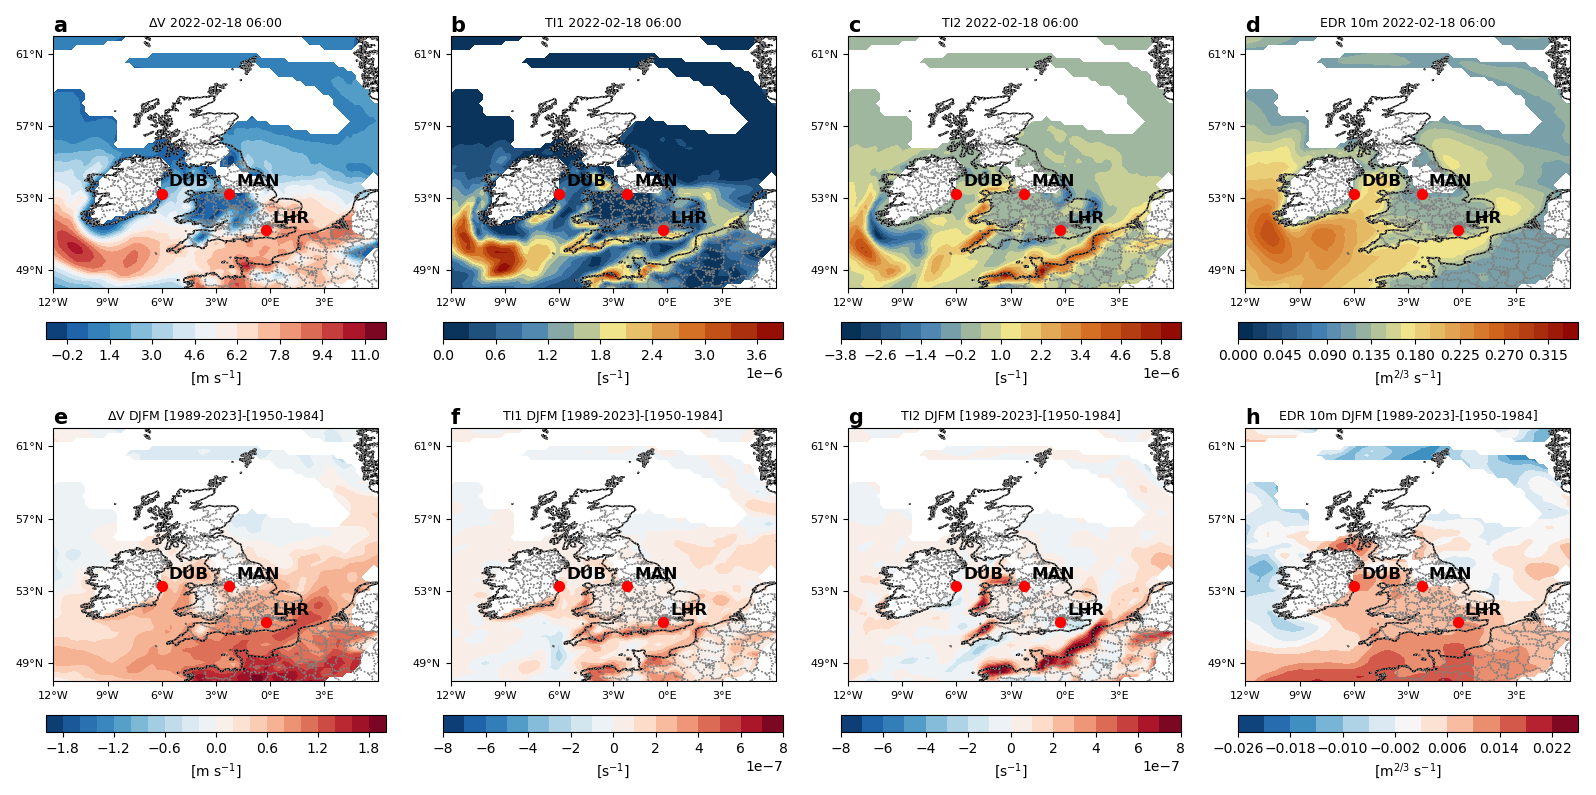
Figure 3Analogue-based results on aviation-related metrics for the Storm Eunice. Vertical wind speed difference hPa (a), Ellrod index TI1 (b), Ellrod index TI2 (c), and EDR (d) at the cyclone time. Difference between factual [1989–2023] and counterfactual [1950–1984] period of the average composites at the time-steps corresponding to the analogues for vertical wind speed difference (e), Ellrod index TI1 (f), Ellrod index TI2 (g), and EDR (h). White areas indicate regions with V at the cyclone time lower than 7 m s−1. Red dots indicate major airports in the region: Dublin Airport (DUB), Manchester Airport (MAN) and Heathrow Airport (LHR).
Among the modes considered to analyse the influence of natural climate variability (ENSO, AMO, PDO, EA, SCAN and NAO), only EA shows significant changes in its distribution for the analogues between the counterfactual and the factual periods over the considered extended season (Fig. 4a–f). This suggests a very minor role of natural low-frequency variability in this event (one mode over six). Within the DJFM season, the analogues frequency is higher in December and March, while decreasing during the colder months of January and February (Fig. 4g).
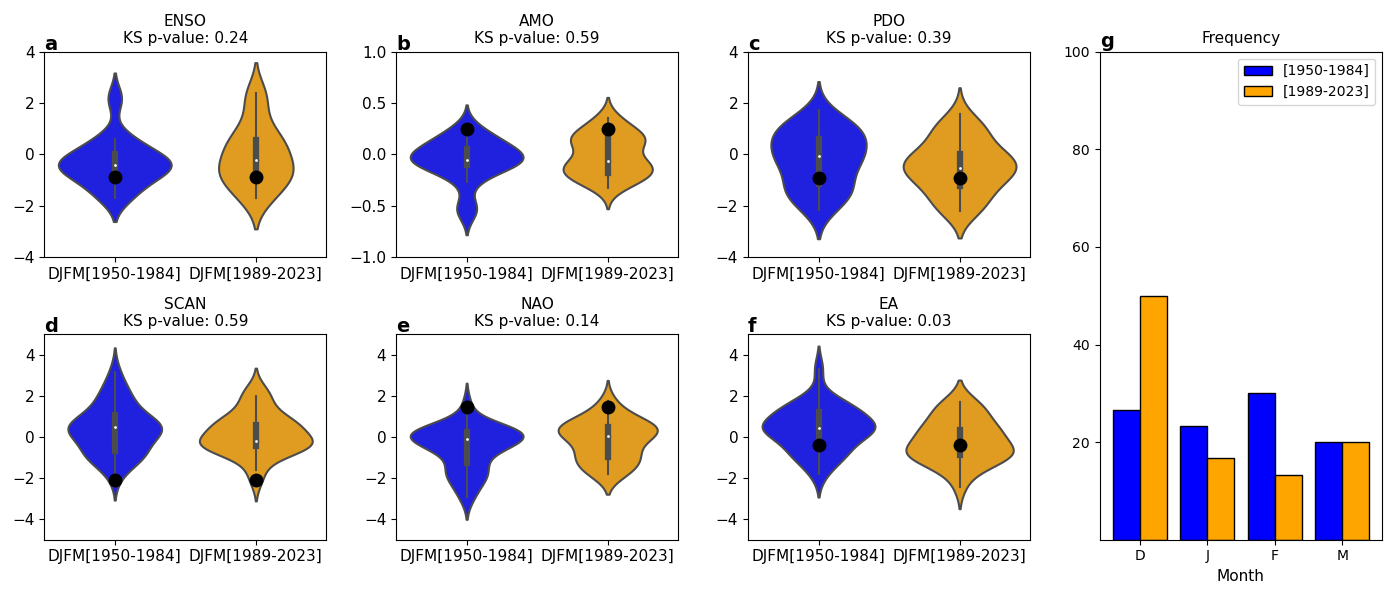
Figure 4Violin plots showing the distribution of monthly index values for ENSO (a), AMO (b), PDO (c), SCAN (d), NAO (e) and EA (f) during the past (blue) and present (yellow) periods for Storm Eunice. The monthly values correspond to the months in which the analogues occurred in each period; the value corresponding to the month of occurrence of the cyclone-time (February 2022) is marked by a black dot. Panel (g): distribution of the frequency (%) of analogues occurring in each sub-period.
The analysis of Storm Eunice indicates a noticeable shift towards December for Eunice-like storms in the current climate. Eunice-like storms are not only becoming more frequent at the beginning of the winter season, but also more severe in a warming climate, likely due to the impacts of climate change. Indeed, the potential influences of ENSO, AMO, PDO, SCAN and NAO have been ruled out as significant factors in these changes, with only the EA pattern playing a minor role. An examination of the different stages of Eunice's development (Figs. A1, A2, A3 and A4) reveals consistency with the results obtained from the cyclone time analysis, showing increased precipitation in Eunice-like storm analogues during the present period, along with stronger winds in the southern part of the selected domain. These findings align with the results of Ginesta et al. (2024), who also observed an increase in precipitation and wind severity associated with Eunice-like storm analogues in future climate scenarios, and support the conclusion that climate change is playing a key role in the intensification of these storms throughout their stages.
3.2 Storm Poly, USA windstorm on February 2023, and Typhoon Hinnamnor
As mentioned in Sect. 1, besides storm Eunice, we applied the analogue-based methodology to three other events, associated with ETC/TC, responsible for huge impacts on aviation, whose results are reported below.
Storm Poly, an exceptionally intense summer ETC, that struck Germany, the Netherlands, and Denmark on 5 July 2023, caused extensive damage, and severe air travel disruptions. With hurricane-force gusts reaching 146 km h−1, it became the strongest summer storm ever recorded in the Netherlands. The storm developed rapidly over the North Atlantic on 4 July and intensified over the North Sea, bringing heavy rain and strong winds, particularly to the Netherlands, where over 400 flights were cancelled at Amsterdam Airport due to extreme conditions. The SLP anomalies (Fig. A5a) show a large negative anomaly, up to −20 hPa over the coast nearby Amsterdam, with Z500 anomalies (Fig. A5b) displaying up to −250 m over the same area. Precipitation data (Fig. A5c) show high daily amounts of precipitation over the Amsterdam region and along the Norwegian coast, reaching up to 20 mm d−1. Temperature data (Fig. A5d) show negative anomalies over the coast, from Amsterdam to the Copenhagen, while showing positive anomalies in the mainland of Germany (up to 4 °C). Wind speed data (Fig. A5e) indicates strong winds over the coast nearby Amsterdam. These winds, combined with heavy precipitation over the same area, likely contributed to operational disruptions at Amsterdam Airport. When analysing how meteorological conditions similar to those that led to Storm Poly have changed in the present period compared to how they occurred in the past, we observe a slightly deeper pressure (−1 hPa, Fig. A5f), with shallower geopotential heights up to 50 m (Fig. A5g), leading to increased precipitation over the sea up to 6 mm d−1 (Fig. A5h), with higher temperature gradients (Fig. A5i) over the coast (+2 °C) and the sea (+1 °C), and stronger winds over the coast up to 2 m s−1 (Fig. A5j). Beyond these changes, we detect the influence of natural climate variability on the event, specifically the ENSO, AMO and EA tele-connection patterns (Fig. A6a–f). This means that the changes we see in the events compared to the past are also partially driven by natural variability. Furthermore, we observe that similar events are now more probable to occur in June, while previously mostly occurring in July and August (Fig. A6g).
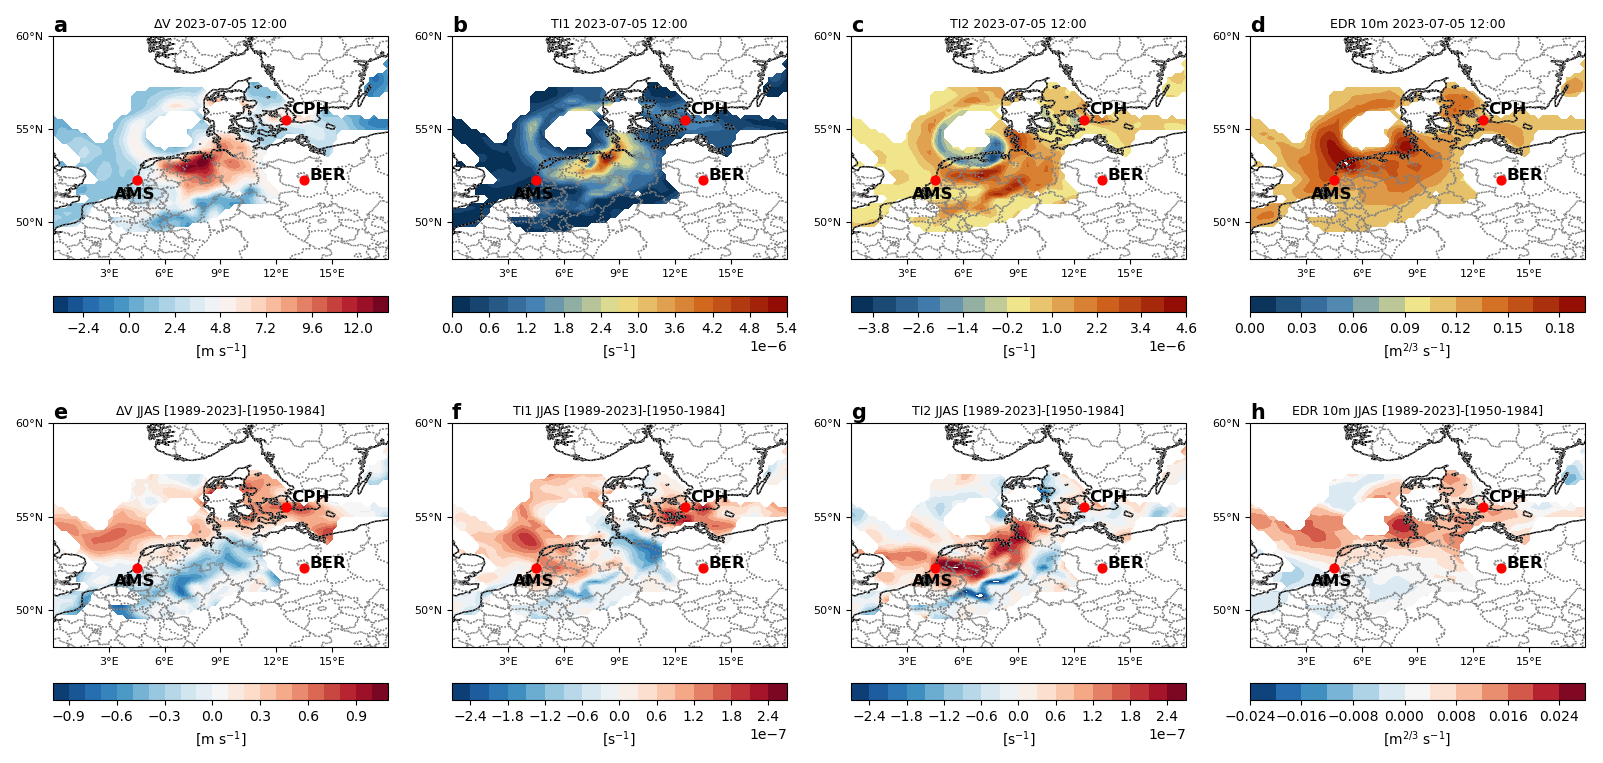
Figure 5Analogue-based results on aviation-related metrics for the Storm Poly. Vertical wind speed difference (a), Ellrod index TI1 (b), Ellrod index TI2 (c), and EDR (d) at the cyclone time. Difference between factual [1989–2023] and counterfactual [1950–1984] period of the average composites at the time-steps corresponding to the analogues for vertical wind speed difference (e), Ellrod index TI1 (f), Ellrod index TI2 (g), and EDR (h). White areas indicate regions with V at the cyclone time lower than 7 m s−1. Red dots indicate major airports in the region: Amsterdam Airport Shipol (AMS), Copenhagen Airport (CPH) and Berlin Brandenburg Airport (BER).
A strong North American windstorm brought heavy snow, freezing rain and strong winds in February 2023, causing flight disruptions and leading to numerous cancellations and delays at major airports, especially in the Midwest and Northeast. The SLP anomalies (Fig. A7a) show a large negative anomaly, up to −40 hPa, in a region between Las Vegas and Denver, with Z500 anomalies (Fig. A7b) displaying up to −320 m slightly westerly with respect to the same area. Precipitation data (Fig. A7c) show extremely high daily amounts of precipitation over the same region, reaching up to 30 mm d−1. Temperature data (Fig. A7d) show negative temperature anomalies over the inner regions. Wind speed data (Fig. A7e) indicates strong winds easterly to the cyclone centre up to 18 m s−1. A comparison of meteorological conditions similar to those that led to the North American windstorm between the present and the past reveals that no significant changes in pressure (Fig. A7f) and geopotential heights (Fig. A7g) occurred. We do not observe increased precipitation, apart from some northward regions where up to 4 mm d−1 increases are detected (Fig. A7h), with no changes in temperature (Fig. A7i), while stronger winds, close to the cyclone centre, are observed up to 2 m s−1 (Fig. A7j). Beyond these changes, we detect influence only in the EA tele-connection pattern (Fig. A8a–f), suggesting that, as with Storm Eunice, the detected changes are likely due to anthropogenic climate change. Additionally, we do not detect any significant changes in their seasonal occurrence, apart a slight increase in the occurrence of similar events in February while previously occurring mostly in January (Fig. A8g).
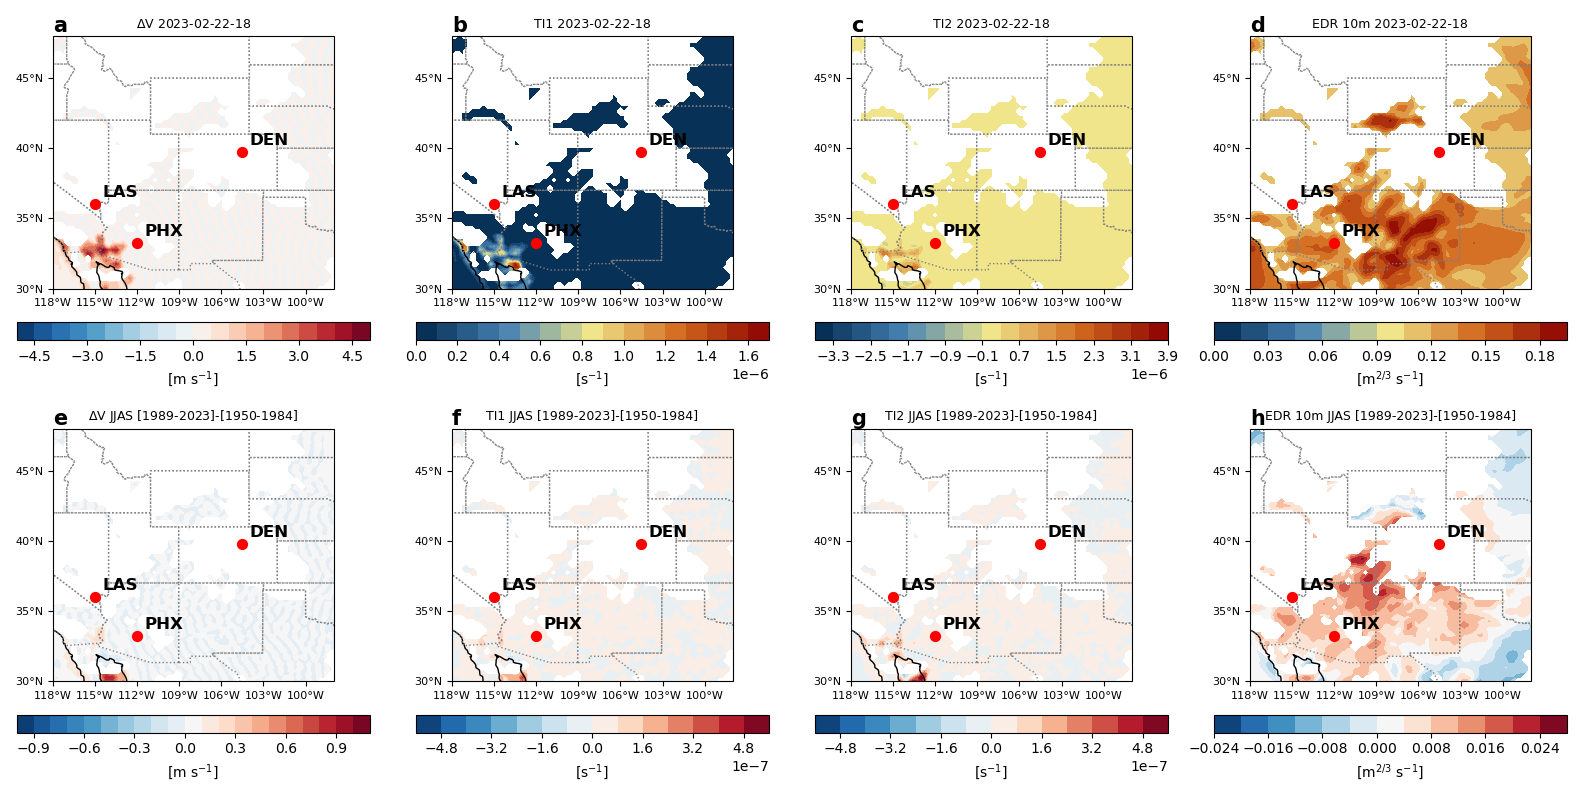
Figure 6Analogue-based results on aviation-related metrics for the 2023 February North American windstorm. Vertical wind speed difference (a), Ellrod index TI1 (b), Ellrod index TI2 (c), and EDR (d) at the cyclone time. Difference between factual [1989–2023] and counterfactual [1950–1984] period of the average composites at the time-steps corresponding to the analogues for vertical wind speed difference (e), Ellrod index TI1 (f), Ellrod index TI2 (g), and EDR (h). White areas indicate regions with V at the cyclone time lower than 7 m s−1. Red dots indicate major airports in the region: McCarran International Airport (LAS), Phoenix Sky Harbor International Airport (PHX) and Denver International Airport (DEN).
Typhoon Hinnamnor, a powerful and destructive TC, impacted East Asia in late August/early September 2022 (Kim et al., 2024). Hinnamnor caused significant disruption, including power outages, and damage to infrastructure, due to high winds and heavy rain. Airports such as Gimhae International in South Korea and Kansai International in Japan saw widespread delays and closures. The SLP anomalies (Fig. A9a) show a large negative anomaly, up to −20 hPa southerly to Japan, where the cyclone eye is located, with associated Z500 anomalies (Fig. A9b) up to −200 m over the same area. Precipitation data (Fig. A9c) show daily amounts of precipitation in the southern-easterly region, reaching up to 180 mm d−1. Temperature data (Fig. A9d) show high temperature anomalies (up to 7 °C) in the southern-easterly region, while no significant changes are observed near the typhoon region. Close to the cyclone eye, wind speed data (Fig. A9e) indicate strong winds up to 18 m s−1. Comparing past and present analogues of Typhoon Hinnamnor, we do not find significant changes in pressure (Fig. A9f), although larger geopotential heights (Fig. A9g) up to 24 m are observed. We also observe increased precipitation up to 18 mm d−1 (Fig. A9h), higher temperatures up to 2–2.5 °C (Fig. A9i), and stronger winds, close to the cyclone centre, up to 3 m s−1 (Fig. A9j). Beyond these changes, we detect the likely influence of the AMO and EA natural tele-connection patterns (Fig. A10a–f). Therefore, as with Storm Poly, the contribution of internal climate variability cannot be neglected. Meanwhile we do not detect any significant changes in their seasonal occurrence (Fig. A10g).
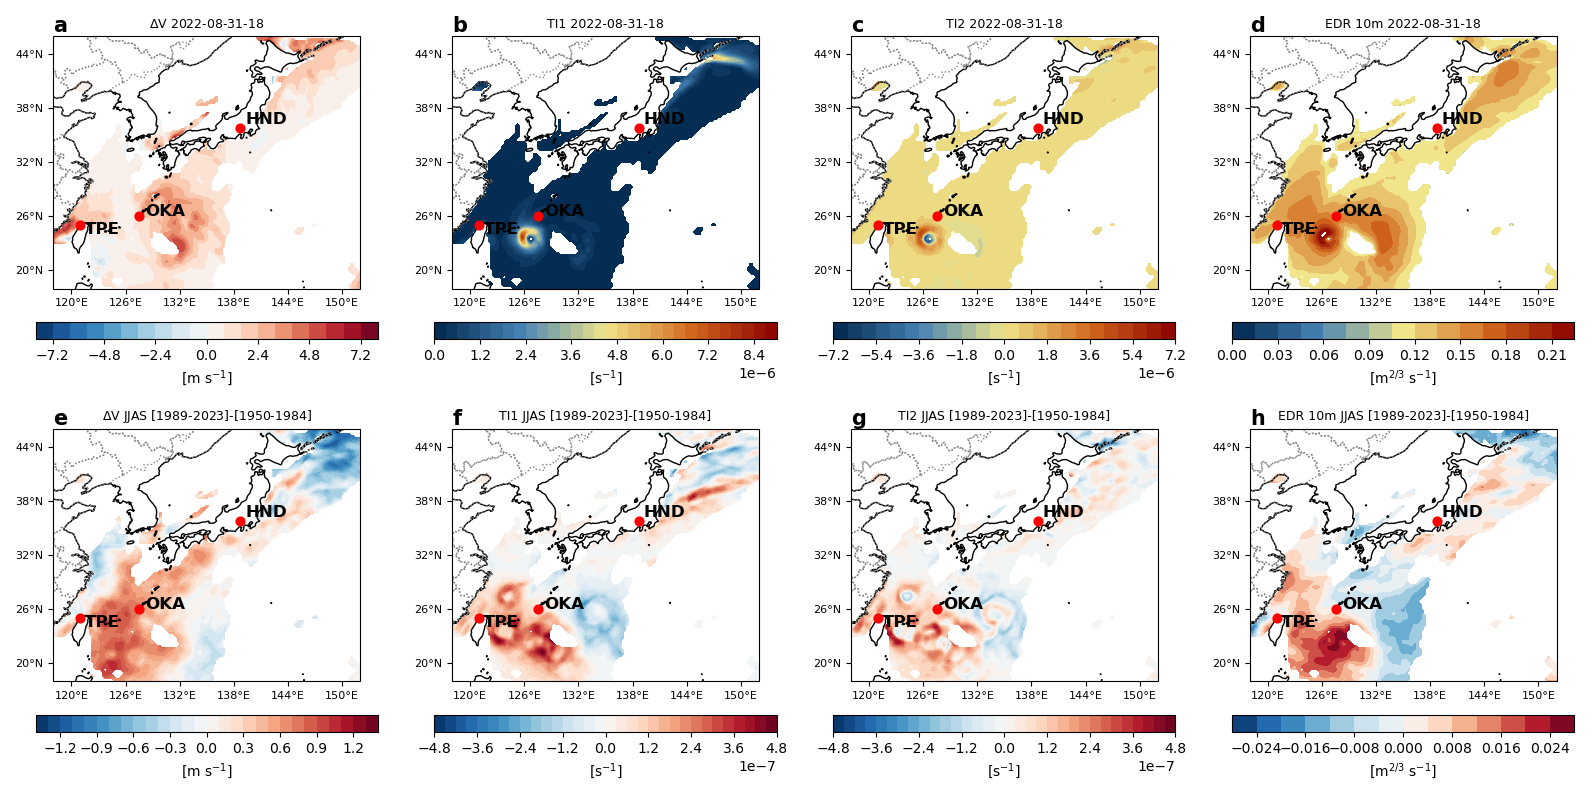
Figure 7Analogue-based results on aviation-related metrics for the Typhoon Hinnamnor. Vertical wind speed difference (a), Ellrod index TI1 (b), Ellrod index TI2 (c), and EDR (d) at the cyclone time. Difference between factual [1989–2023] and counterfactual [1950–1984] period of the average composites at the time-steps corresponding to the analogues for vertical wind speed difference (e), Ellrod index TI1 (f), Ellrod index TI2 (g), and EDR (h). White areas indicate regions with V at the cyclone time lower than 7 m s−1. Red dots indicate major airports in the region: Taipei-Taiwan Taoyuan International Airport (TPE), Naha International Airport (OKA) and Haneda Airport (HND).
Despite the unique characteristics of each event in terms of meteorological variables, a common trend emerges when inspecting aviation-related impact variables. Specifically, turbulence-related metrics (TI1, TI2) (see Figs. 5–7) show a significant increase over a wide area within the selected domain during the present period. An exception is the 2023 February North American windstorm (Fig. 6), for which no significant increase in turbulence-related metrics is observed. For the affected events, the intensification in TI1 and TI2 is often associated with higher EDR values and stronger bulk wind differences. In details, the storm Poly generated strong (up to 14 m s−1) vertical wind speed differences (Fig. 5a) in a region further south than the centre of the cyclone, nearby Amsterdam. Over the same regions large values of all turbulence-related metrics, i.e., TI1, TI2, and EDR, are observed (Fig. 5b–d). By comparing present episodes with past events we observe increased bulk velocity differences up to 1 m s−1 manifested as a horizontal belt stretching from the west coast of the UK to northern Poland (Fig. 5e), likely affecting huge airports such as Amsterdam and Copenhagen. Over the same regions but with different localized effects, larger increases are found in TI1, TI2, and EDR (Fig. 5f–h). Specifically, TI1 is larger close to Copenhagen airport, thus suggesting stronger bulk wind differences far away from the cyclone eye; conversely, TI2 increases close to Amsterdam airport. Finally, for the Typhoon Hinnamnor (Fig. 7) we observe strongest winds impacted the northeastern coasts of Japan and the East China Sea, particularly near the eastern coast of Taiwan. Larger wind speed differences (up to +1.5 m s−1), along with higher TI1, TI2 and EDR values, are found in the same region, thus highlighting more turbulent scenarios in the present climate compared to past conditions. By further inspecting significant changes in the observed variables at selected airports (see Fig. A11) we observe that Storm Eunice generated larger impacts than the other considered storms. In particular, windier conditions and larger bulk wind differences in the present than in the past are observed for all UK airports (Fig. A11a), with larger TI1 values at MAN and DUB. For storm Poly (Fig. A11b) we detect windier, larger bulk wind differences, and more turbulent conditions at AMS and CPH, while no significant changes are observed for USA airports during the February 2023 storm (Fig. A11c). Finally, for the Typhoon Hinnamnor (Fig. A11d) larger variations are observed for OKA airport.
This study performs an analysis of four recent storms – Eunice, Poly, a North American windstorm, and Typhoon Hinnamnor – that occurred over Europe, the USA, and East Asia between 2022 and 2023, with a focus on Storm Eunice. We show how storms likely causing flight disruptions are becoming more intense, with analogues in the present period exhibiting stronger ground winds and bulk wind differences, thereby increasing risks for the aviation sector.
The analogue-based analysis of Storm Eunice provides compelling evidence of how extratropical cyclones impacting Europe are evolving under current climate conditions. Our results indicate that Eunice-like storms display stronger wind speeds and turbulence indices in the present climate but also more frequent during the early winter season, shifting towards December. This finding aligns with previous studies (e.g., Ginesta et al., 2024), reinforcing the notion that climate change is influencing the characteristics of extreme storm events. According to the AR6 of IPCC (Masson-Delmotte et al., 2021) the intensification of extratropical cyclones is closely linked to ongoing atmospheric and oceanic warming. As warmer air can retain more moisture, storms are able to draw in greater amounts of water vapour, resulting in heavier precipitation. Simultaneously, rising sea surface temperatures increase the energy available to these systems, effectively turning the ocean into a more efficient heat engine. The contrast between warming at the surface and relatively cooler upper atmospheric layers enhances this energy conversion, ultimately raising the potential intensity of storms (Madin, 2011; Risser and Wehner, 2017).
The analysis of meteorological variables reveals a systematic increase in geopotential height anomalies and surface-level pressure patterns, suggesting a north-eastward shift in storm trajectories compared to past analogues. This shift, in turn, influences precipitation distribution, leading to enhanced rainfall over Ireland and parts of the UK. These changes indicate a potential increase in flood risk and infrastructural stress due to more intense and frequent storm activity. Our assessment of wind speed anomalies further supports the hypothesis that present-day storms exhibit stronger wind fields, particularly over key aviation hubs such as Heathrow and Dublin airports. The increase in wind speeds, combined with enhanced vertical bulk wind difference, presents substantial challenges for aviation operations. The analysis of turbulence indices (TI1, TI2, and EDR) highlights increased turbulence intensity over the southern UK and northern France, particularly near coastal regions. These factors contribute to heightened risks for aircraft during take-off and landing, necessitating improved forecasting tools and operational strategies to mitigate the impacts on air traffic. One of the most significant implications of our findings is the potential influence of climate change on the intensification of extreme weather events. The fact that no significant changes were observed in five out of six of the distributions of the low-frequency climate variability modes for the analogues of Storm Eunice suggests that the detected variations are primarily driven by anthropogenic climate change rather than natural climate variability. We underline that the same result was found for the North American windstorm, whereas for Storm Poly and Typhoon Hinnamor natural climate variability plays an important role. However, we acknowledge that internal variability exists within each phase of these modes -such as the NAO- which can modulate storm tracks and intensities. Therefore, part of the observed risk changes may also arise from internal variability in storm behaviour, independently of large-scale mode phase changes. This conclusion underscores the urgency of incorporating evolving storm characteristics into risk assessment frameworks for transportation infrastructure, particularly for aviation safety. Future research should focus on refining methodologies for storm attribution by integrating high-resolution models, such as convection-permitting models (Ban et al., 2021), that better capture the mesoscale processes involved in storm evolution. In fact, the relatively coarse resolution of ERA5 has a limited capability to accurately represent local-scale processes that may be critical in airport environments. For example, extreme precipitation and convective events are smoothed out and boundary-layer processes are often under-resolved. Additionally, further studies should investigate the impact of these changing storm patterns on other sectors, such as energy supply, emergency response, and insurance risk assessment. A broader multi-disciplinary approach will be essential for developing adaptive strategies that enhance resilience against increasingly extreme weather events.
In summary, our findings demonstrate that Eunice-like storms are becoming more severe in the current climate, with significant implications for transportation systems and public safety. By enhancing predictive capabilities and implementing adaptive measures, stakeholders can mitigate the risks associated with these evolving meteorological threats.
Table A1Selected analogues time-steps in the factual period, for each event. The order follows a closeness criterium with respect to the cyclone time, i.e. the first time-steps correspond to the analogues closest to the event.
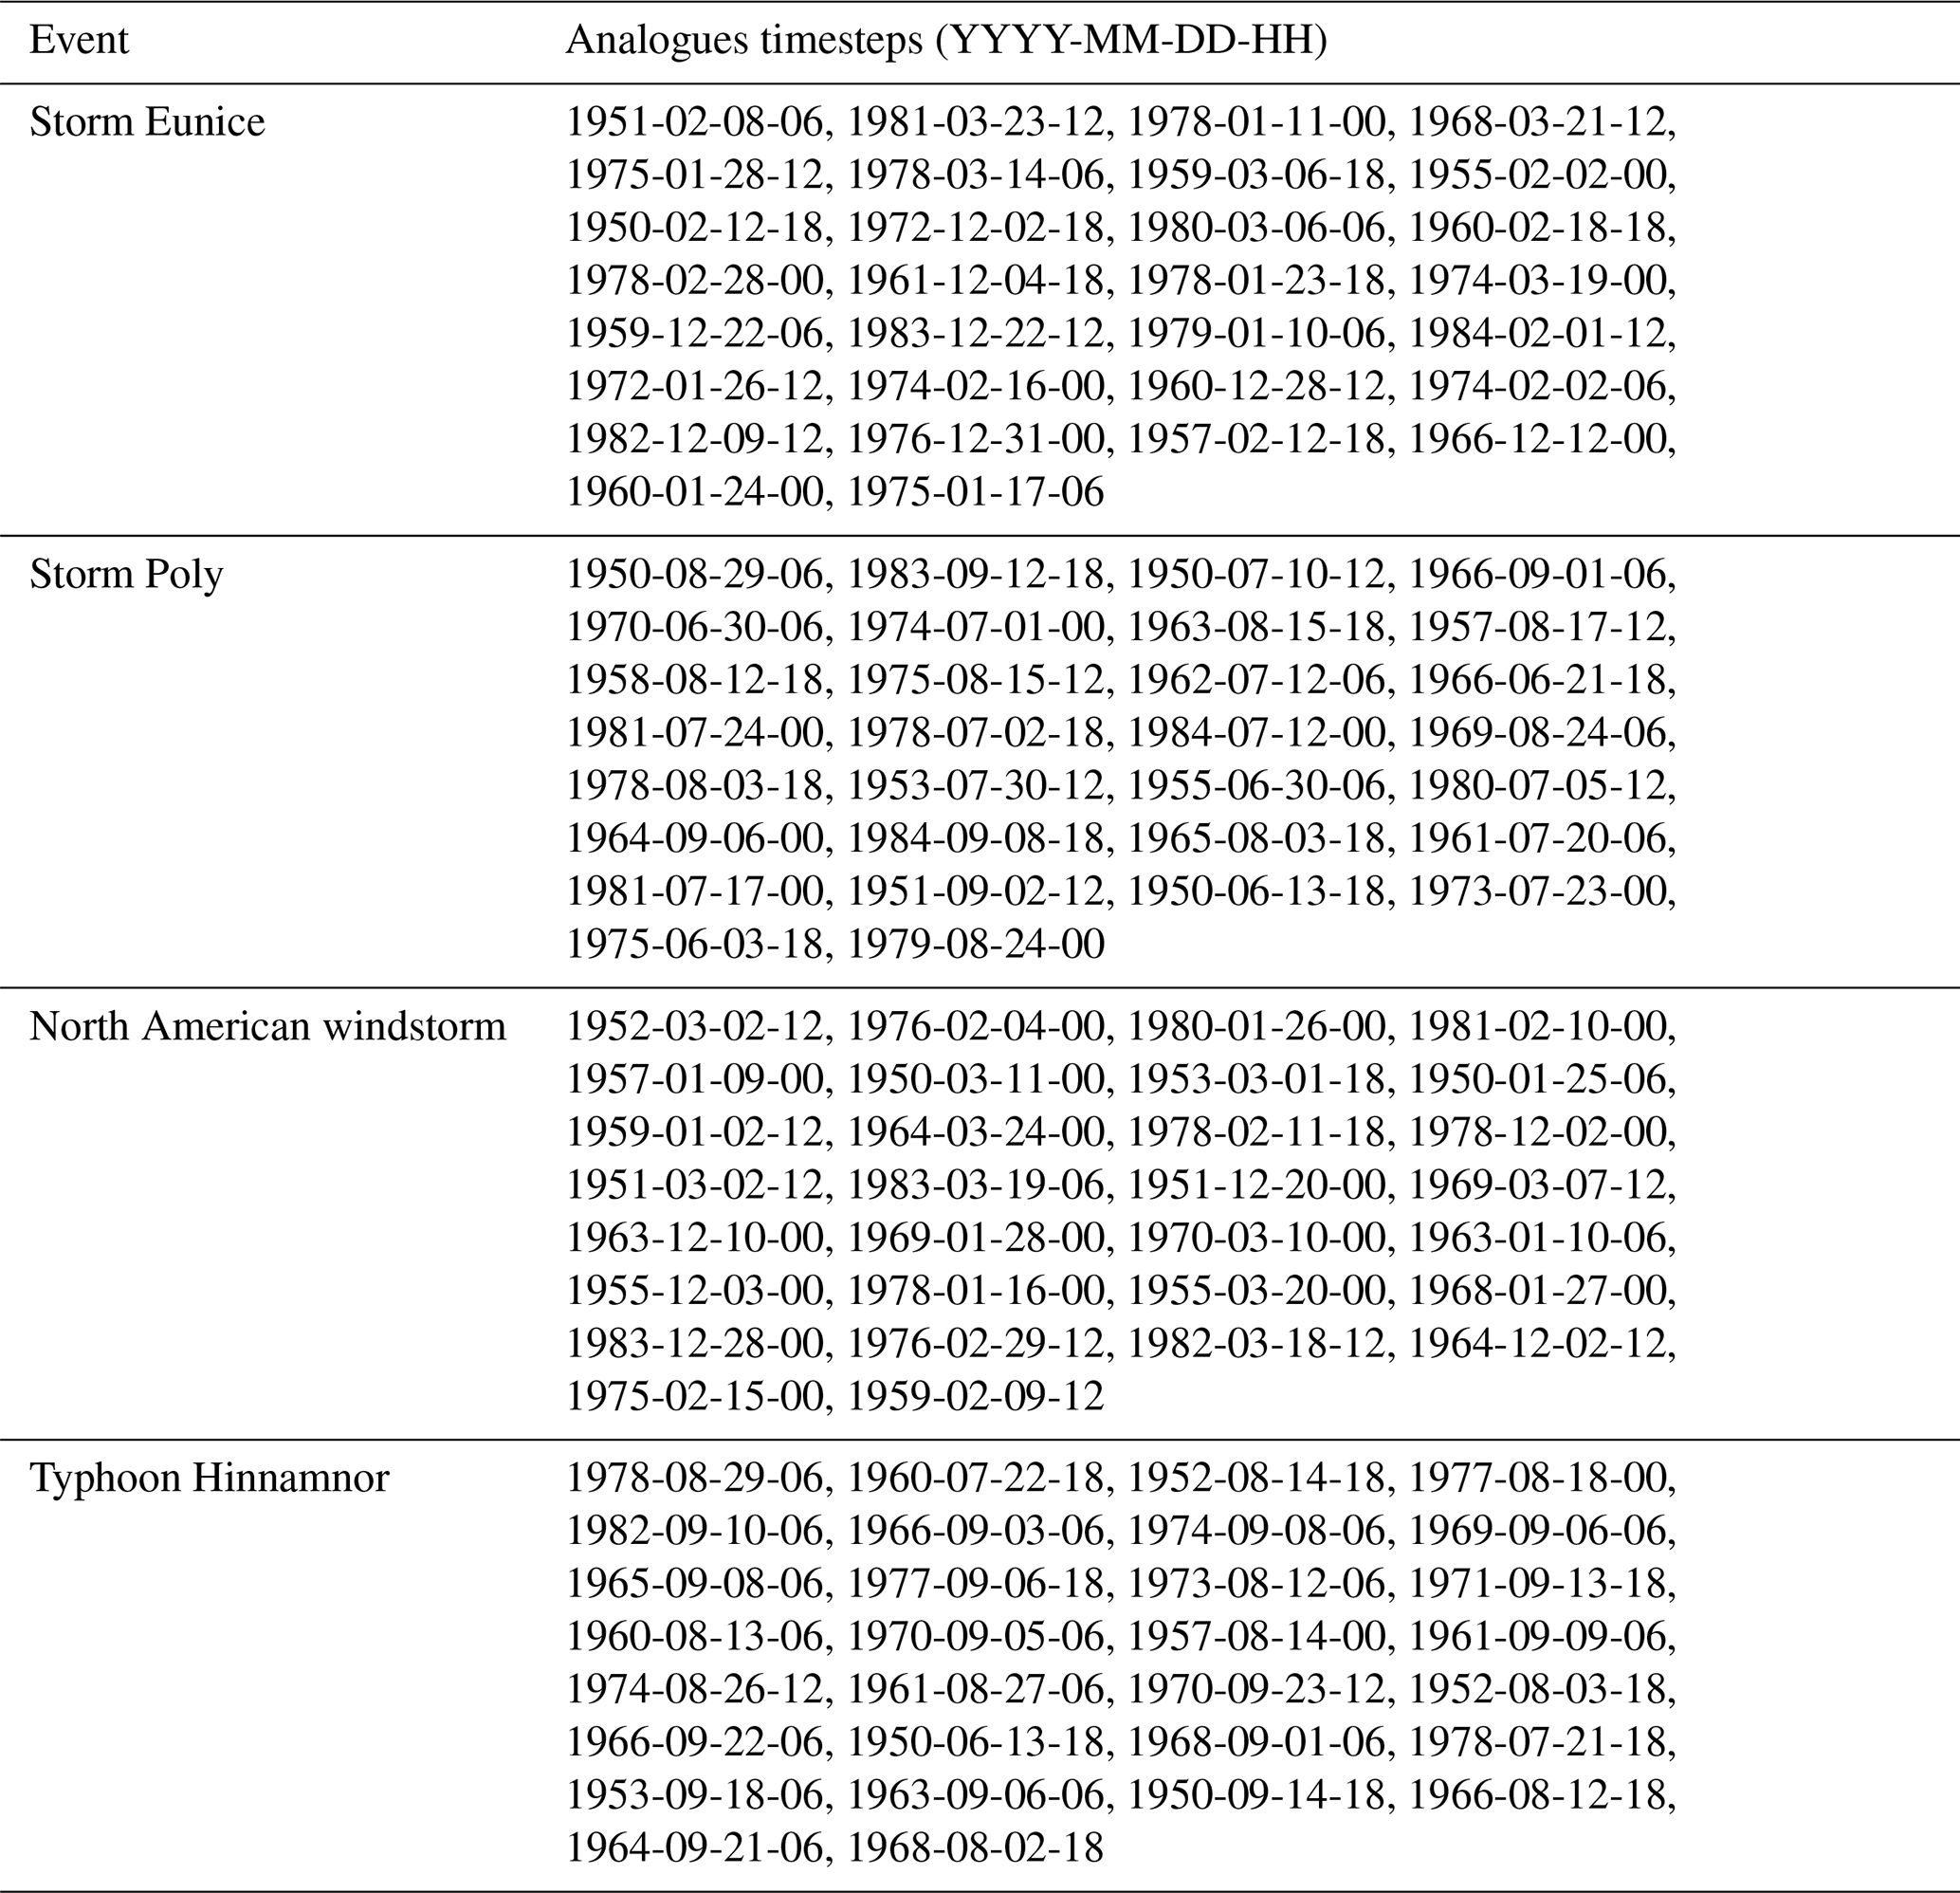
Table A2Selected analogues time-steps in the counterfactual period, for each event. The order follows a closeness criterium with respect to the cyclone time, i.e. the first time-steps correspond to the analogues closest to the event.
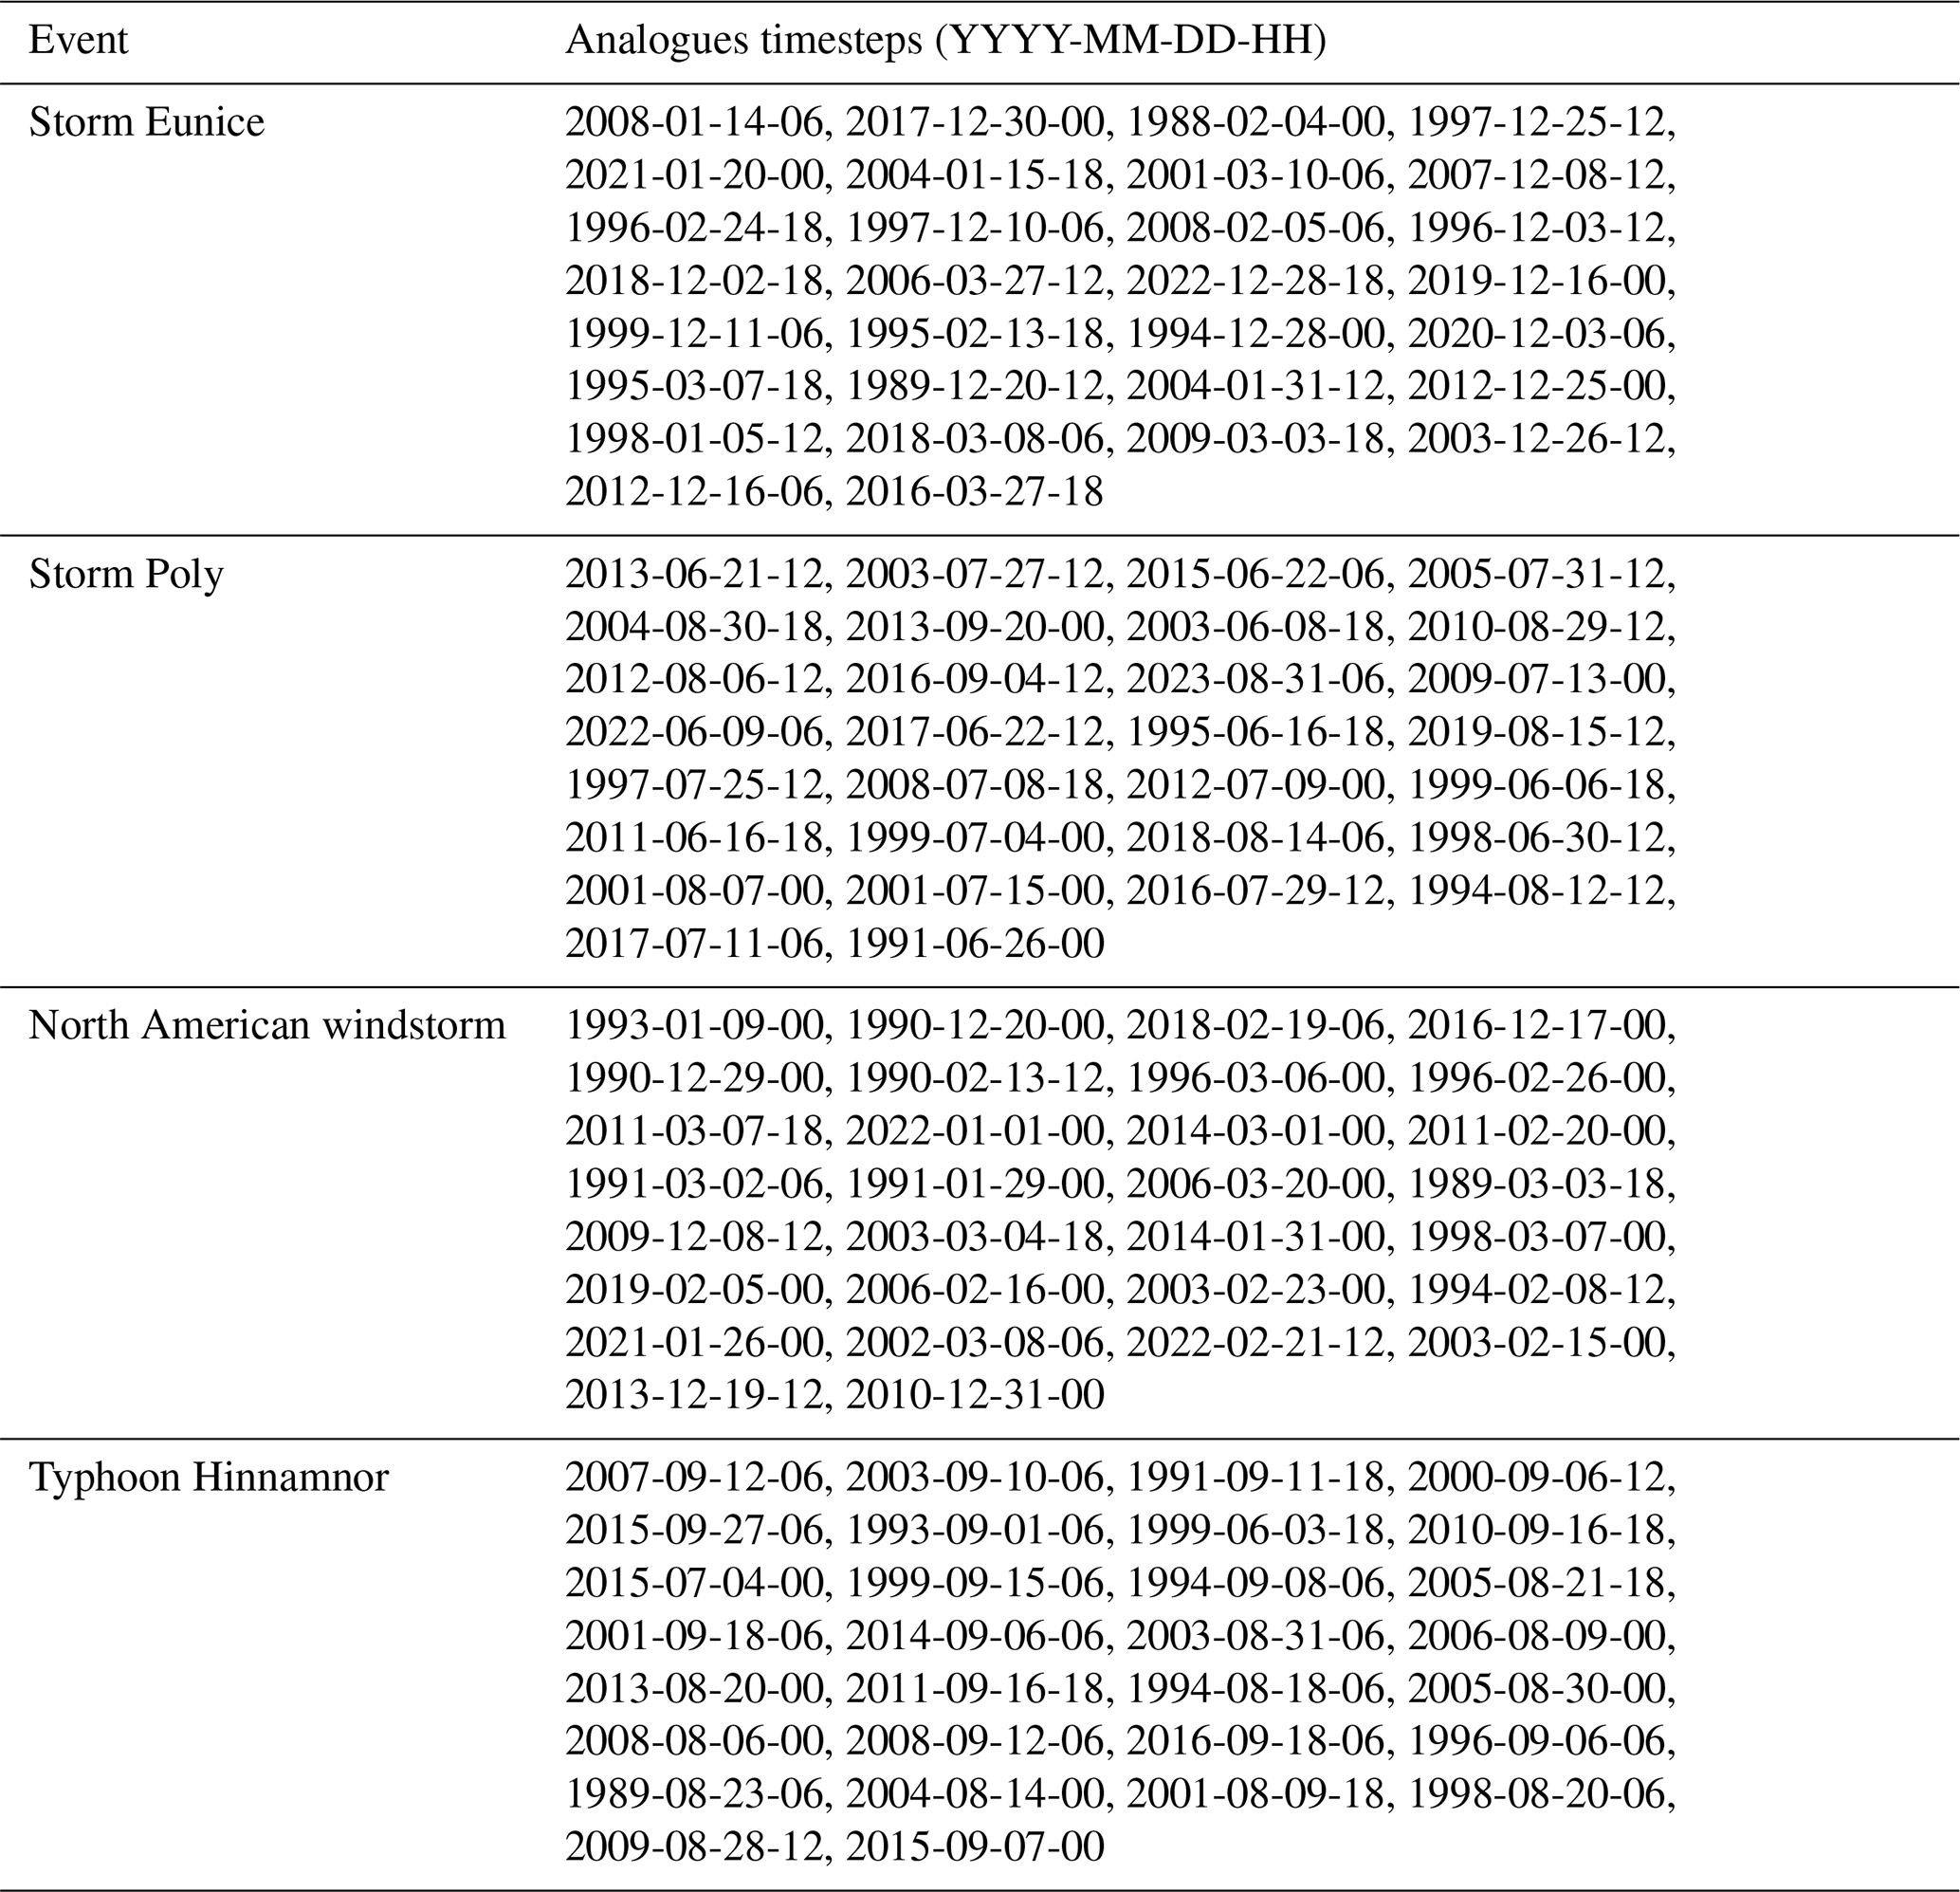
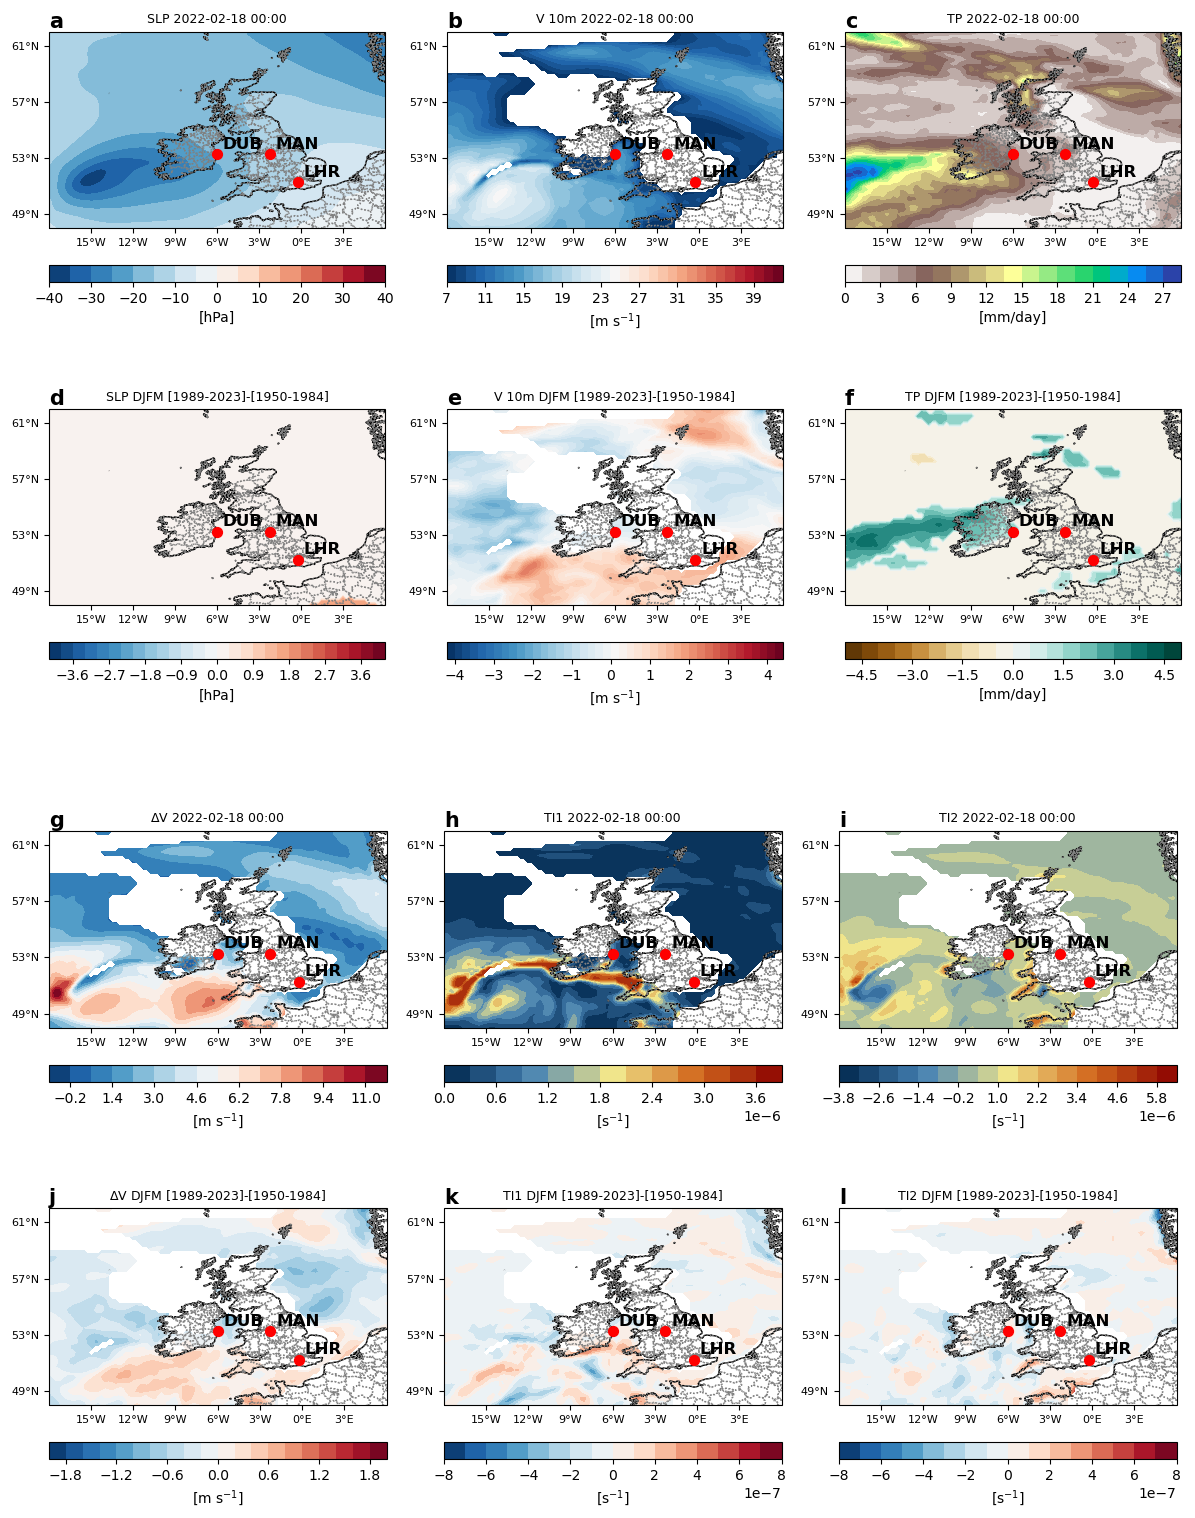
Figure A1Analogue-based results for the Storm Eunice. SLP (a) anomaly, V 10 m (b), TP (c), ΔV (g), TI1 (h) and TI2 (i) at the time-step preceding the cyclone time (18 February 2022 00:00). Difference between factual [1989–2023] and counterfactual [1950–1984] period of the average composites at the time-steps corresponding to the analogues for SLP (d) anomalies, V 10 m (e), TP (f), ΔV (j), TI1 (k) and TI2 (l). In the second row, shadings indicate significant changes.
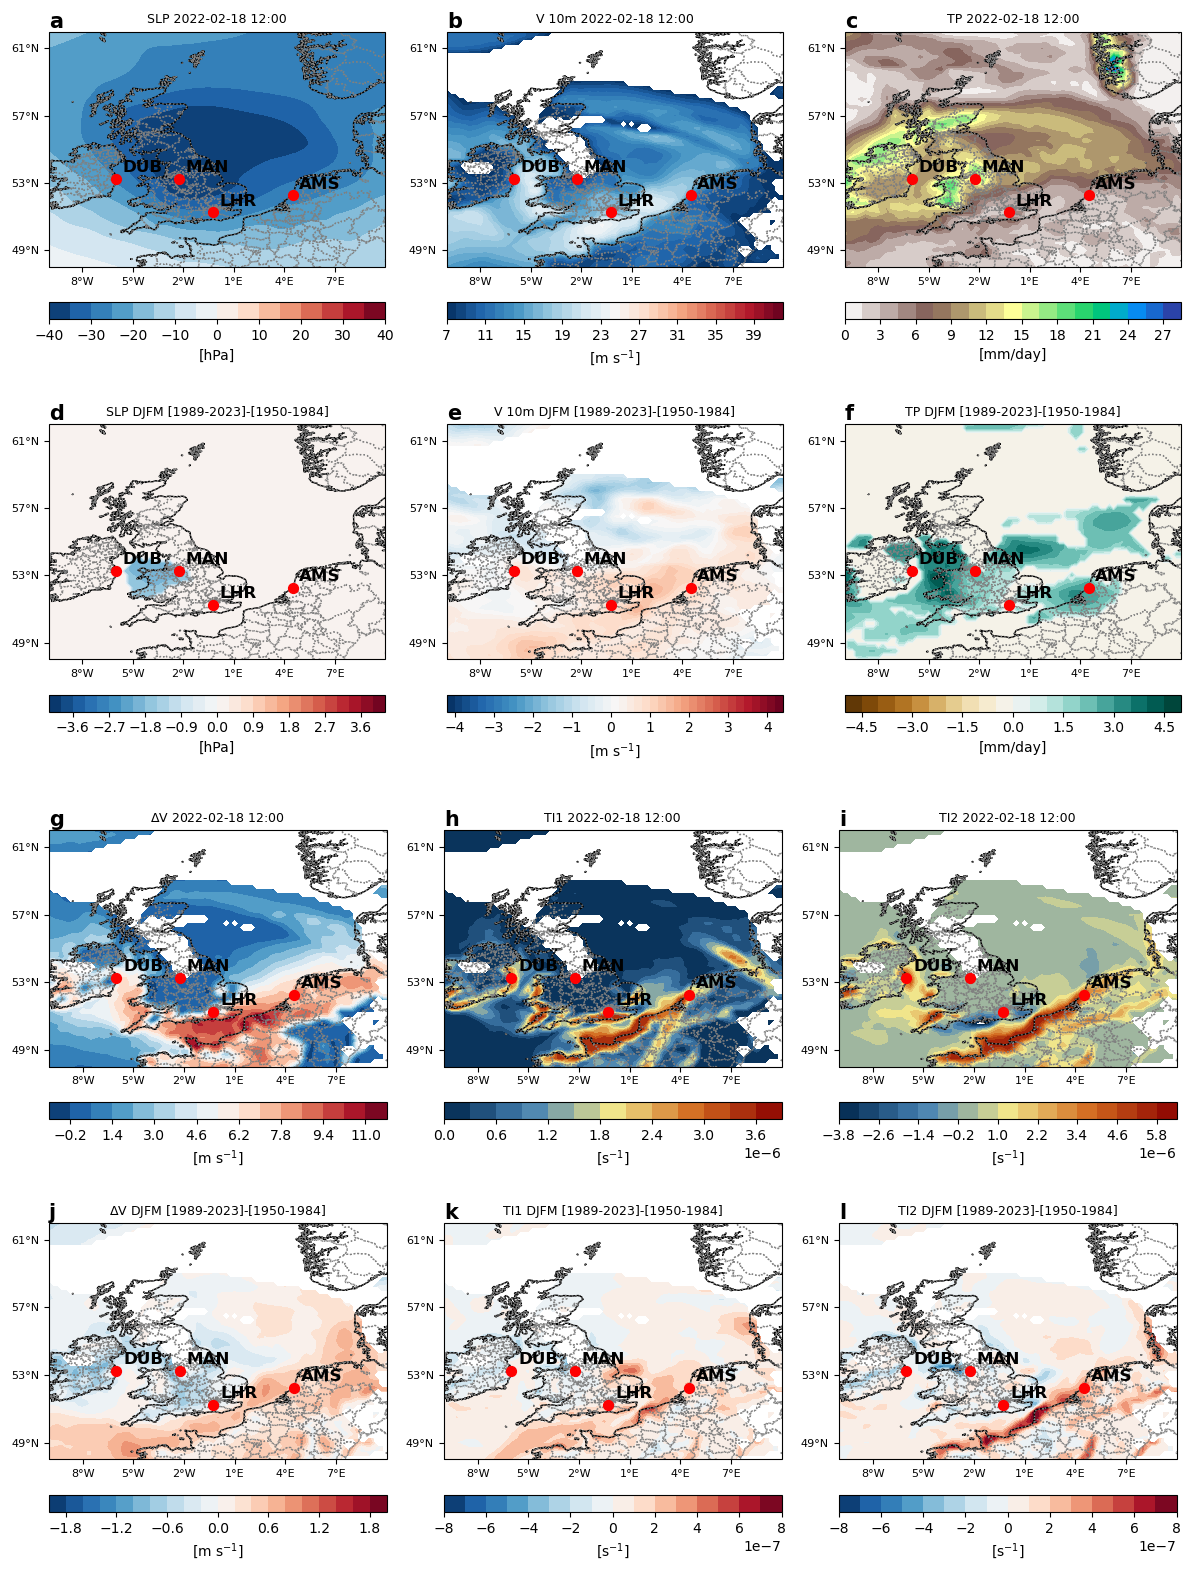
Figure A2Analogue-based results for the Storm Eunice. SLP (a) anomaly, V 10 m (b), TP (c), ΔV (g), TI1 (h) and TI2 (i) at the time-step after the cyclone time (18 February 2022 12:00). Difference between factual [1989–2023] and counterfactual [1950–1984] period of the average composites at the time-steps corresponding to the analogues for SLP (d) anomalies, V 10 m (e), TP (f), ΔV (j), TI1 (k) and TI2 (l). In the second row, shadings indicate significant changes.
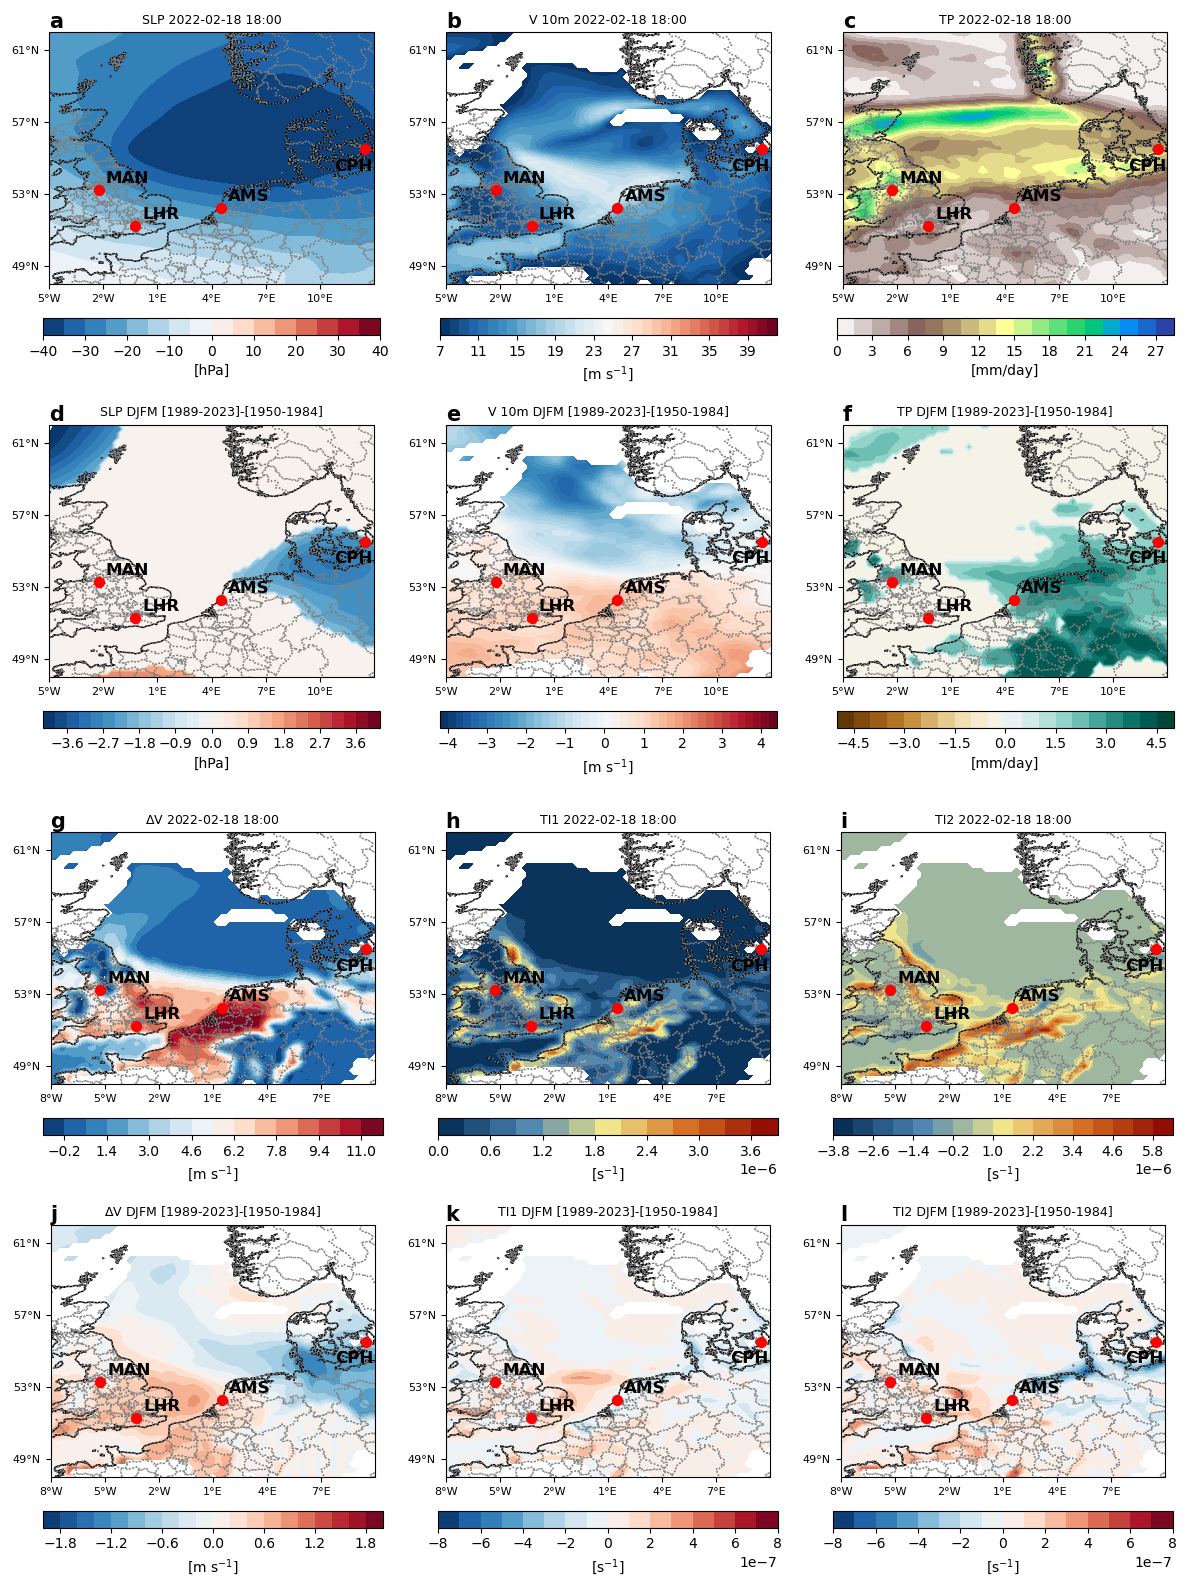
Figure A3Analogue-based results for the Storm Eunice. SLP (a) anomaly, V 10 m (b), TP (c), ΔV (g), TI1 (h) and TI2 (i) 12 h after the cyclone time (18 February 2022 18:00). Difference between factual [1989–2023] and counterfactual [1950–1984] period of the average composites at the time-steps corresponding to the analogues for SLP (d) anomalies, V 10 m (e), TP (f), ΔV (j), TI1 (k) and TI2 (l). In the second row, shadings indicate significant changes.
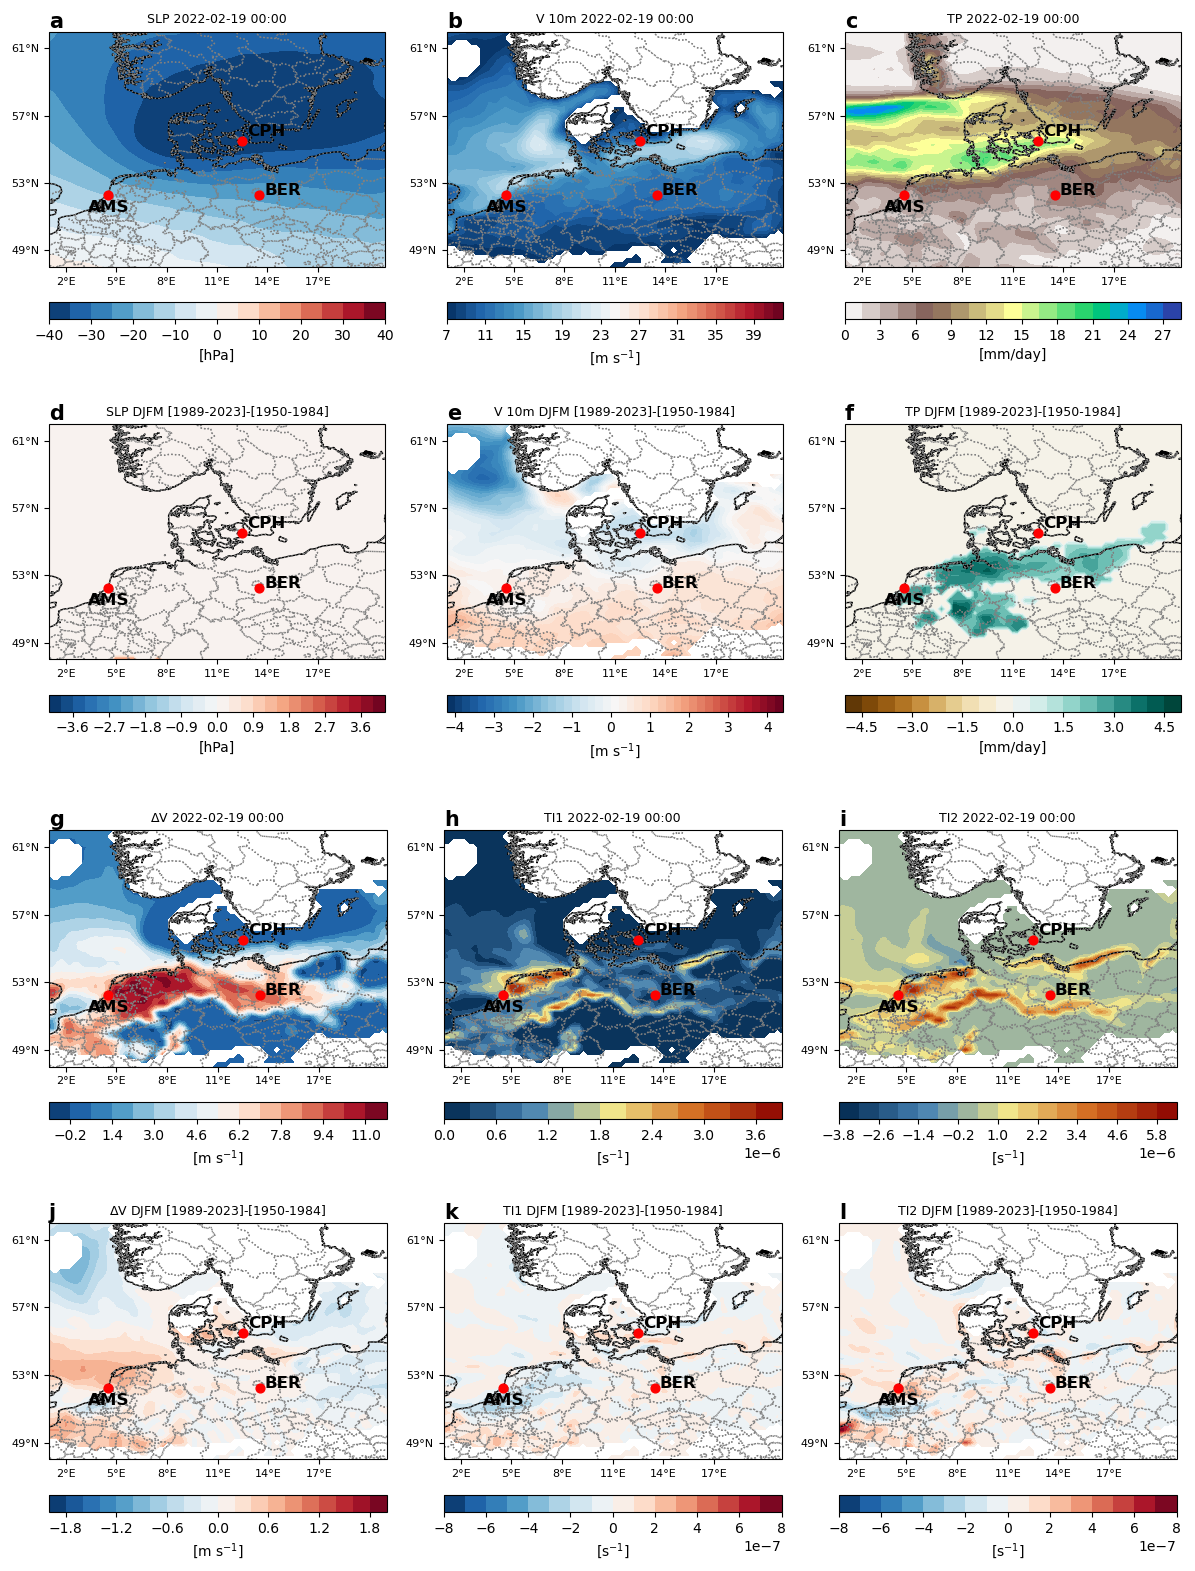
Figure A4Analogue-based results for the Storm Eunice. SLP (a) anomaly, V 10 m (b), TP (c), ΔV (g), TI1 (h) and TI2 (i) 18 h after the cyclone time (19 February 2022 00:00). Difference between factual [1989–2023] and counterfactual [1950–1984] period of the average composites at the time-steps corresponding to the analogues for SLP (d) anomalies, V 10 m (e), TP (f), ΔV (j), TI1 (k) and TI2 (l). In the second row, shadings indicate significant changes.
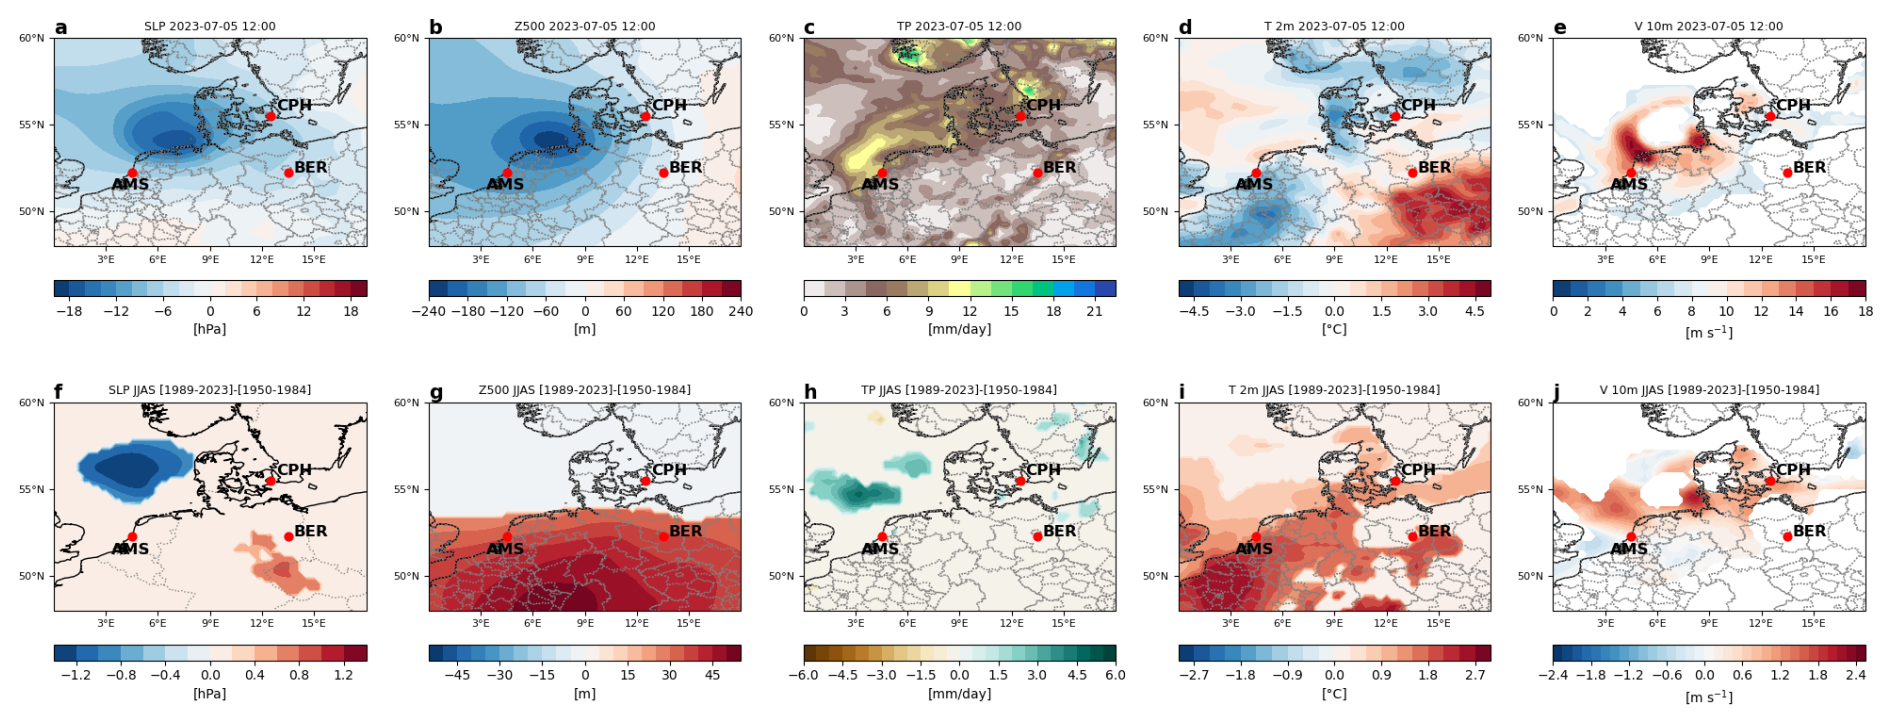
Figure A5Analogue-based results for the Storm Poly. SLP (a) anomaly, Z500 (b) anomaly, TP (c), 2 m T (d) anomaly and 10 m wind speed (e) at the cyclone time. Difference between factual [1989–2023] and counterfactual [1950–1984] period of the average anomalies at the time-steps corresponding to the analogues for SLP (f), Z500 (g), TP (h), 2 m temperature (i) and 10 m wind speed (j). In the second row, shadings indicate significant changes. Red dots indicate major airports in the region: Amsterdam Airport Shipol (AMS), Copenhagen Airport (CPH) and Berlin Brandenburg Airport (BER).
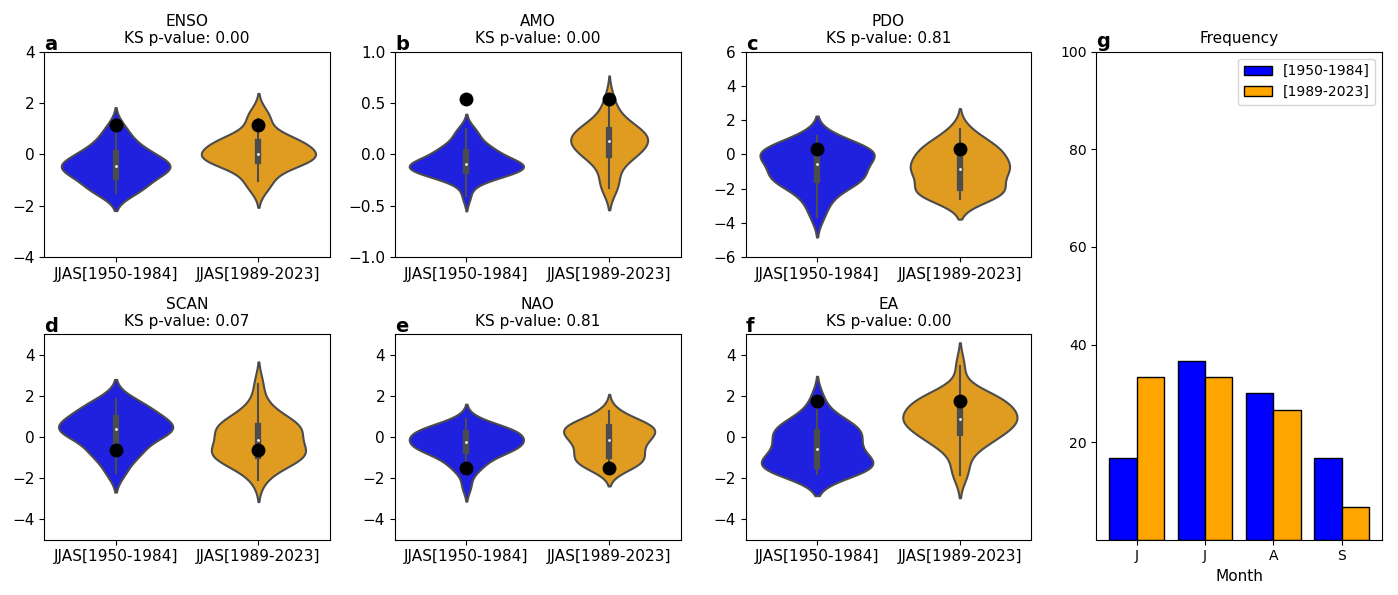
Figure A6Analogue-based results for the Storm Poly. Violin plots showing the distribution of monthly index values for ENSO (a), AMO (b), PDO (c), SCAN (d), NAO (e) and EA (f) during the past (blue) and present (yellow) periods. The monthly values correspond to the months in which the analogues occurred in each period; the value corresponding to the month of occurrence of the cyclone-time (July 2023) is marked by a black dot. Panel (g): distribution of the frequency (%) of analogues occurring in each sub-period.
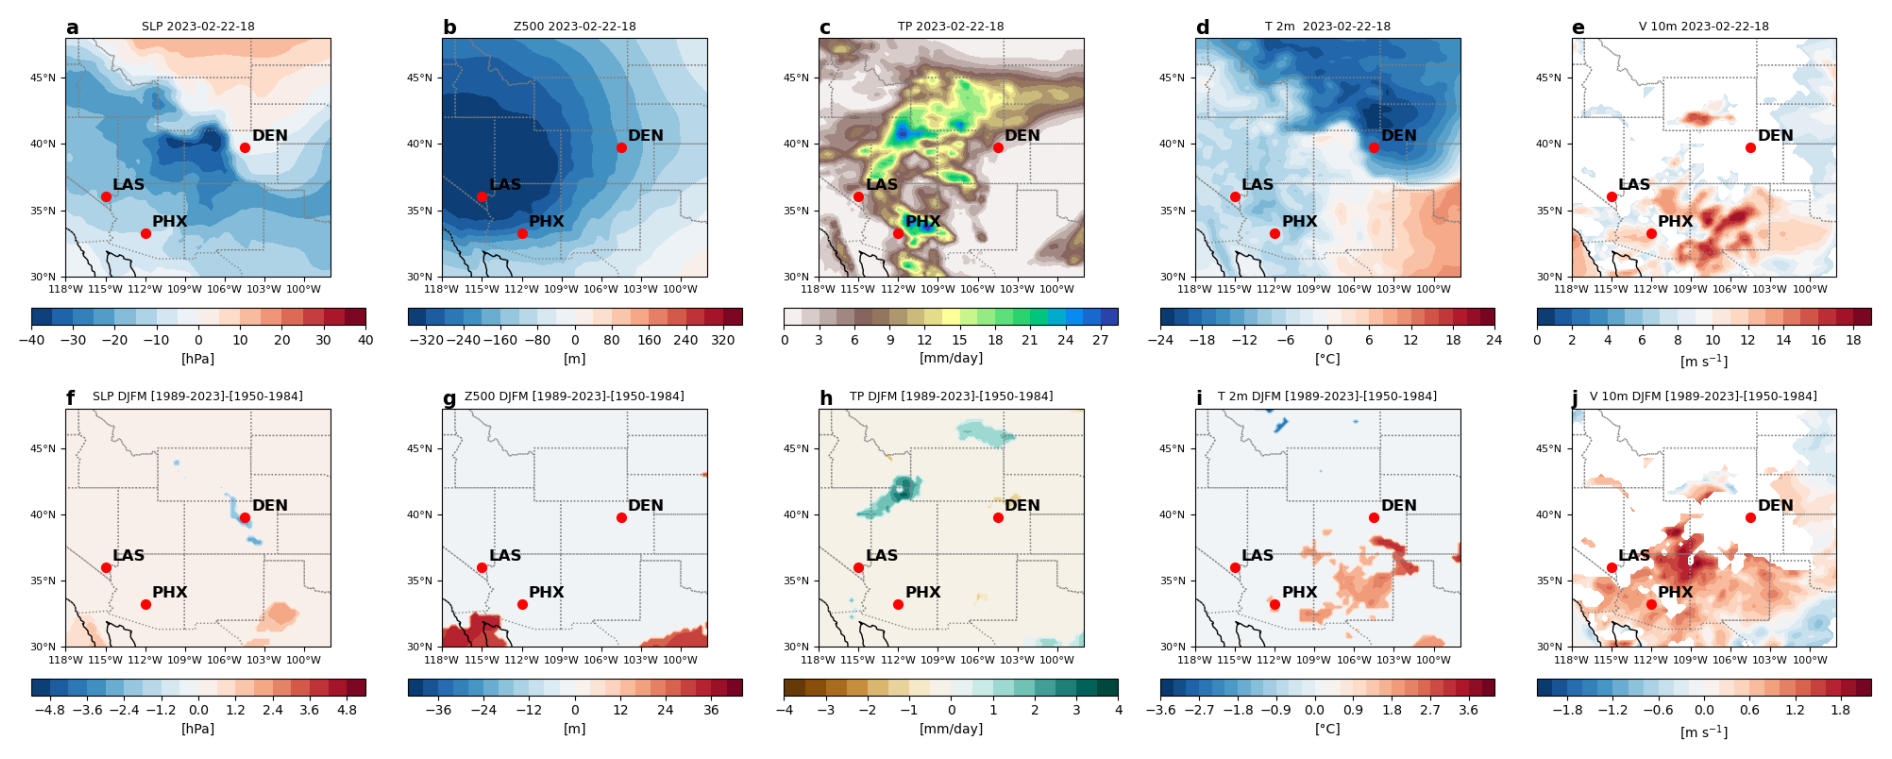
Figure A7Analogue-based results for the February 2023 USA windstorm. SLP (a) anomaly, Z500 (b) anomaly, TP (c), 2 m T (d) anomaly and 10 m wind speed (e) at the cyclone time. Difference between factual [1989–2023] and counterfactual [1950–1984] period of the average anomalies at the time-steps corresponding to the analogues for SLP (f), Z500 (g), TP (h), 2 m temperature (i) and 10 m wind speed (h). In the second row, shadings indicate significant changes. Red dots indicate major airports in the region: McCarran International Airport (LAS), Phoenix Sky Harbor International Airport (PHX) and Denver International Airport (DEN).
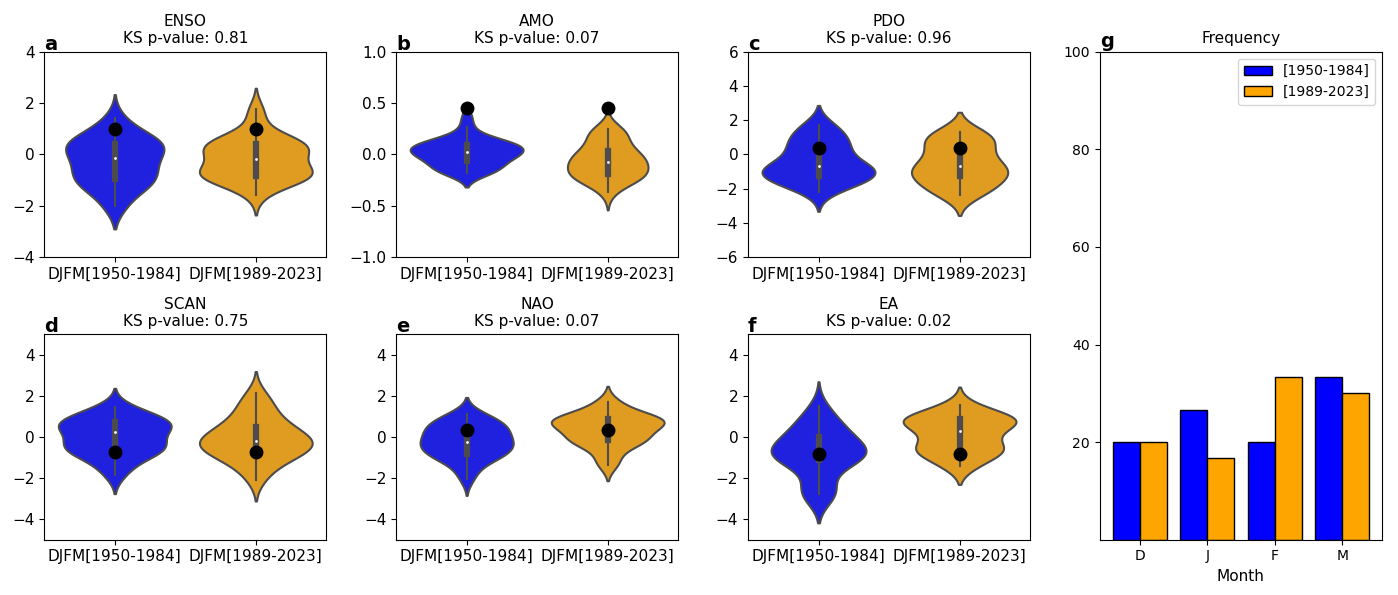
Figure A8Analogue-based results for the February 2023 USA windstorm. Violin plots showing the distribution of monthly index values for ENSO (a), AMO (b), PDO (c), SCAN (d), NAO (e) and EA (f) during the past (blue) and present (yellow) periods. The monthly values correspond to the months in which the analogues occurred in each period; the value corresponding to the month of occurrence of the cyclone-time (February 2023) is marked by a black dot. Panel (g): distribution of the frequency (%) of analogues occurring in each sub-period.
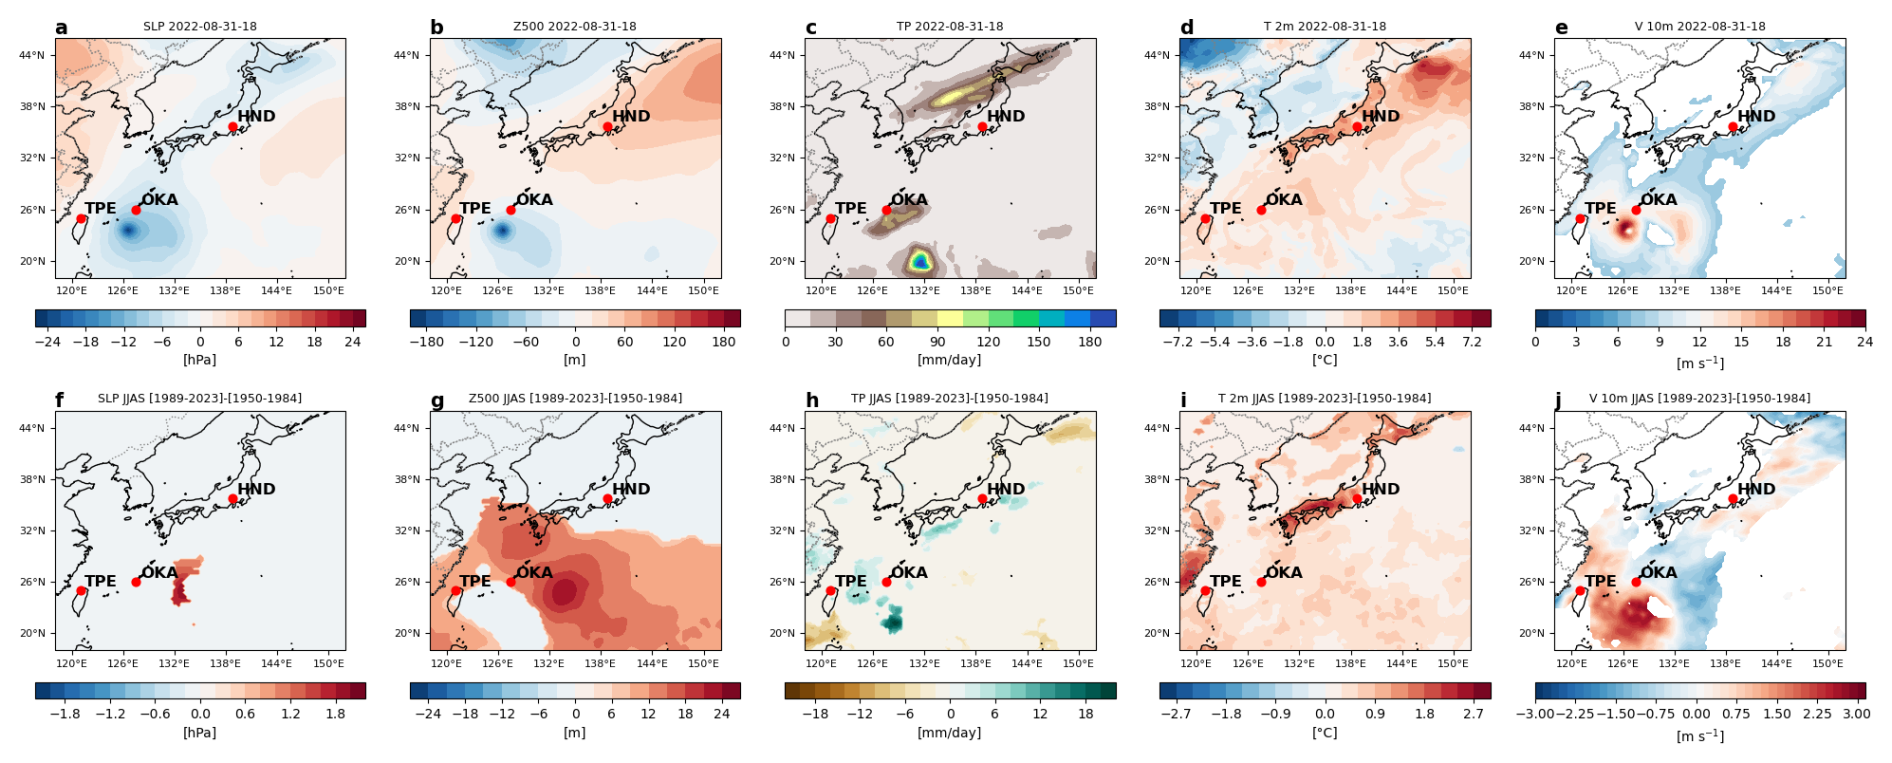
Figure A9Analogue-based results for the Typhoon Hinnamnor. SLP (a) anomaly, Z500 (b) anomaly, TP (c), 2 m T (d) anomaly and 10 m wind speed (e) at the cyclone time. Difference between factual [1989–2023] and counterfactual [1950–1984] period of the average anomalies at the time-steps corresponding to the analogues for SLP (f), Z500 (g), TP (h), 2 m temperature (i) and 10 m wind speed (j). In the second row, shadings indicate significant changes. Red dots indicate major airports in the region: Taipei-Taiwan Taoyuan International Airport (TPE), Naha International Airport (OKA) and Haneda Airport (HND).
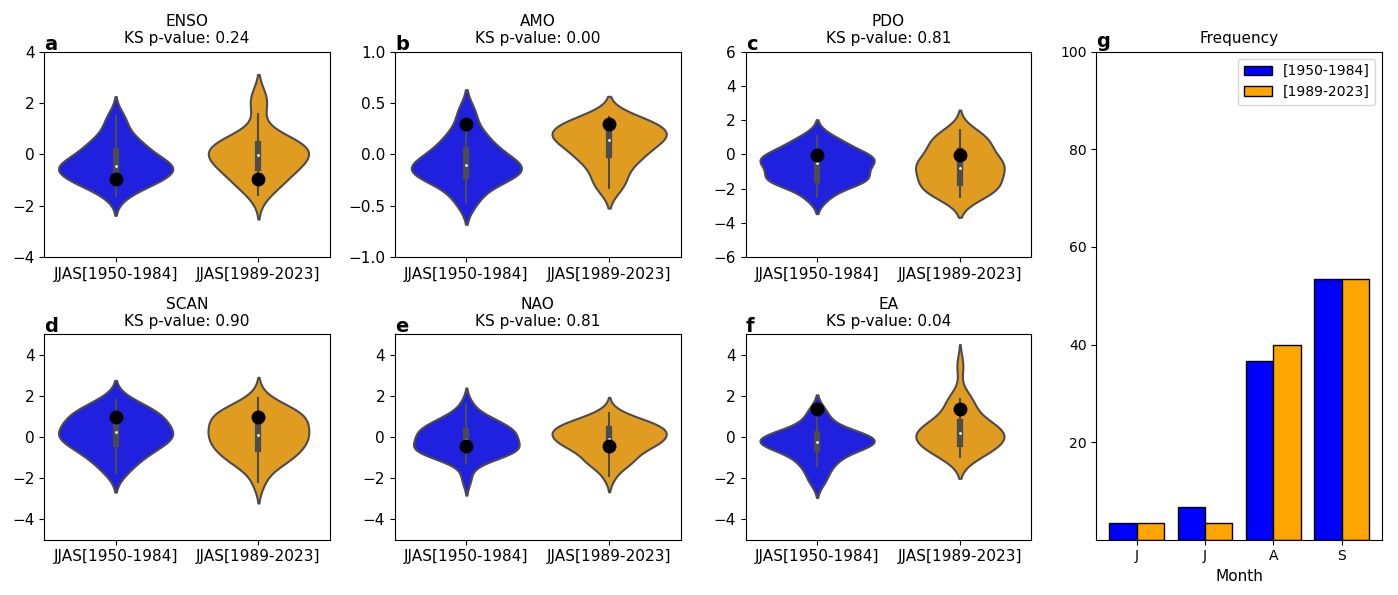
Figure A10Analogue-based results for the Typhoon Hinnamnor. Violin plots showing the distribution of monthly index values for ENSO (a), AMO (b), PDO (c), SCAN (d), NAO (e) and EA (f) during the past (blue) and present (yellow) periods. The monthly values correspond to the months in which the analogues occurred in each period; the value corresponding to the month of occurrence of the cyclone-time (August 2022) is marked by a black dot. Panel (g): distribution of the frequency (%) of analogues occurring in each sub-period.
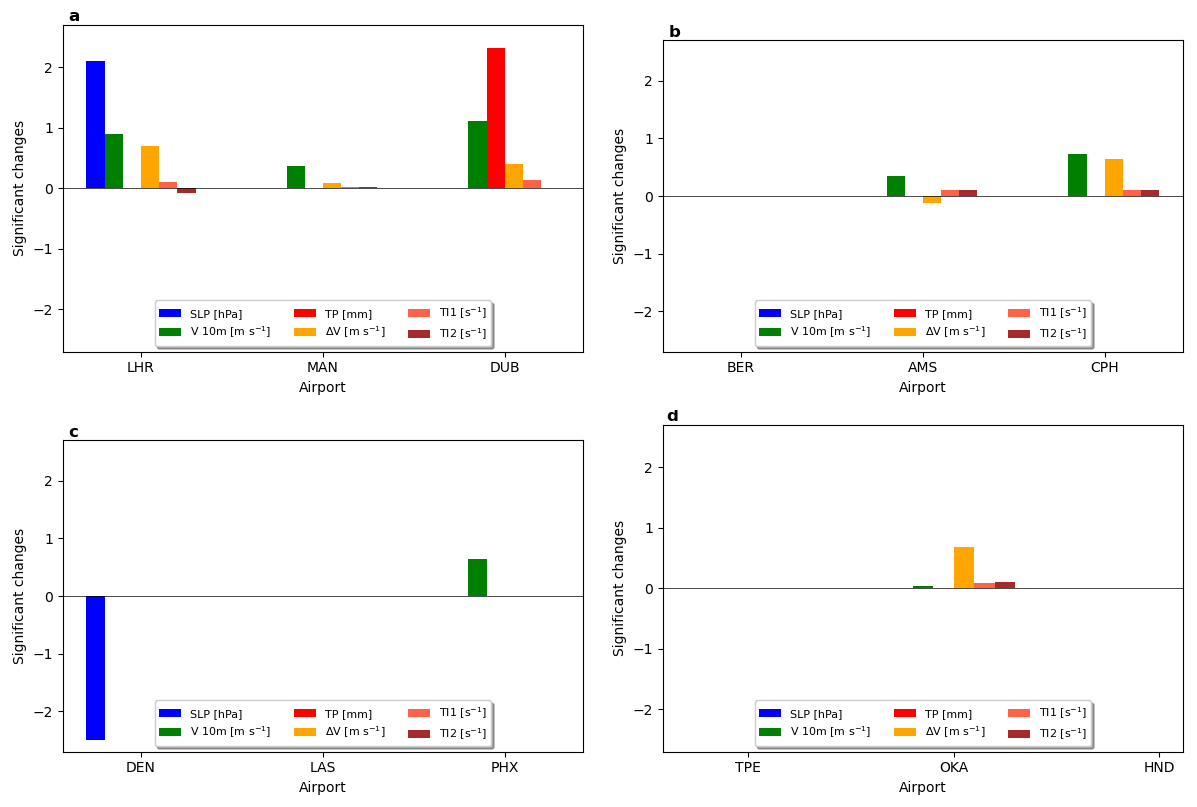
Figure A11Significant changes between factual [1989–2023] and counterfactual [1950–1984] period of the average composites at the time-steps corresponding to the analogues for SLP anomalies, V 10 m, TP, ΔV, TI1 and TI2 at the major airports in the region selected for Storm Eunice (a), Storm Poly (b), February 2023 USA windstorm (c) and Typhoon Hinnamnor (d). For visual purposes, significant changes for TI1 and TI2 are multiplied by a factor of 106.
All codes used for the analysis and generating the figures can be obtained from the authors upon request.
The data that support the findings of this study are openly available. ERA5 is the latest climate reanalysis being produced by ECMWF as part of implementing the EU- funded Copernicus Climate Change Service (C3S), providing hourly data on atmospheric, land-surface and sea-state parameters together with estimates of uncertainty from 1950 to present day. ERA5 data are available on the C3S Climate Data Store on regular latitude-longitude grids at 0.25°×0.25° resolution at https://cds.climate.copernicus.eu/#!/home (last access: 27 February 2025). The monthly indices are computed from the NOAA/ERSSTv5 data and retrieved from KNMI's climate explorer at https://climexp.knmi.nl/start.cgi (last access: 20 July 2025).
LR performed the analyses, analyzed the results and wrote the draft of the manuscript. TA and DF conceived the study. All authors contributed to discuss the results and to write the paper.
The contact author has declared that none of the authors has any competing interests.
Publisher’s note: Copernicus Publications remains neutral with regard to jurisdictional claims made in the text, published maps, institutional affiliations, or any other geographical representation in this paper. While Copernicus Publications makes every effort to include appropriate place names, the final responsibility lies with the authors. Views expressed in the text are those of the authors and do not necessarily reflect the views of the publisher.
TA and DF acknowledge useful discussions within the MedCyclones COST Action (CA19109) and the FutureMed COST Action (CA22162) communities. We sincerely acknowledge three anonymous reviewers and the editor for insightful comments and suggestions that helped us in improving our manuscript.
This research has been supported by the EU Horizon 2020 (grant no. 101003469).
This paper was edited by Christian Grams and reviewed by three anonymous referees.
Alberti, T., Faranda, D., Rapella, L., Coppola, E., Lepreti, F., Dubrulle, B., and Carbone, V.: Impacts of Changing Atmospheric Circulation Patterns on Aviation Turbulence Over Europe, Geophysical Research Letters, 51, 10475, https://doi.org/10.1038/s41598-023-36816-8, 2024. a, b, c, d
Archer, C. L. and Caldeira, K.: Historical trends in the jet streams, Geophysical Research Letters, 35, L08803, https://doi.org/10.1029/2008GL033614, 2008. a
Ban, N., Caillaud, C., Coppola, E., Pichelli, E., Sobolowski, S., Adinolfi, M., Ahrens, B., Alias, A., Anders, I., Bastin, S., Belušić, D., Berthou, S., Brisson, E., Cardoso, R. M., Chan, S. C., Christensen, O. B., Fernándz, J., Fita, L., Frisius, T., Gašparac, G., Giorgi, F., Goergen, K., Haugen, J. E., Hodnebrog, Ø., Kartsios, S., Katragkou, E., Kendon, E. J., Keuler, K., Lavin-Gullon, A., Lenderink, G., Leutwyler, D., Lorenz, T., Maraun, D., Mercogliano, P., Milovac, J., Panitz, H., Raffa, M., Remedio, A. R., Schär, C., Soares, P. M. M., Srnec, L., Steensen, B. M., Stocchi, P., Tölle, M. H., Truhetz, H., Vergara-Temprado, J., de Vries, H., Warrach-Sagi, K., Wulfmeyer, V., and Zander, M. J.: The first multi-model ensemble of regional climate simulations at kilometer-scale resolution, part I: evaluation of precipitation, Climate Dynamics, 57, 275–302, https://doi.org/10.1007/s00382-021-05708-w, 2021. a
Bell, B., Hersbach, H., Simmons, A., Berrisford, P., Dahlgren, P., Horányi, A., Muñoz-Sabater, J., Nicolas, J., Radu, R., Schepers, D., Soci, C., Villaume, S., Bidlot, J.-R., Haimberger, L., Woollen, J., Buontempo, C., and Thépaut, J.-N.: The ERA5 global reanalysis: Preliminary extension to 1950, Quarterly Journal of the Royal Meteorological Society, 147, 4186–4227, https://doi.org/10.1002/qj.4174, 2021. a
Borsky, S. and Unterberger, C.: Bad weather and flight delays: The impact of sudden and slow onset weather events, Economics of Transportation, 18, 10–26, 2019. a
Brooks, H. E., Carbin, G. W., and Marsh, P. T.: Increased variability of tornado occurrence in the United States, Science, 346, 349–352, https://doi.org/10.1126/science.1257460, 2014. a
Burbidge, R.: Climate change risks and resilience for European aviation, Transportation Research Procedia, 72, 3276–3282, 2023. a
Changnon, S. A.: Effects of summer precipitation on urban transportation, Climatic Change, 32, 481–494, 1996. a
Cheung, H. M. and Chu, J.-E.: Global increase in destructive potential of extratropical transition events in response to greenhouse warming, npj Climate and Atmospheric Science, 6, 137, https://doi.org/10.1038/s41612-023-00470-8, 2023. a
Cornman, L. B. and Carmichael, B.: Varied research efforts are under way to find means of avoiding air turbulence, ICAO Journal, 48, 10–15, 1993. a
Dolores-Tesillos, E., Teubler, F., and Pfahl, S.: Future changes in North Atlantic winter cyclones in CESM-LE – Part 1: Cyclone intensity, potential vorticity anomalies, and horizontal wind speed, Weather Clim. Dynam., 3, 429–448, https://doi.org/10.5194/wcd-3-429-2022, 2022. a
Dorrington, J. and Strommen, K. J.: Jet Speed Variability Obscures Euro-Atlantic Regime Structure, Geophysical Research Letters, 47, e2020GL087907, https://doi.org/10.1029/2020GL087907, 2020. a
Ellrod, G. P. and Knapp, D. I.: An Objective Clear-Air Turbulence Forecasting Technique: Verification and Operational Use, Weather and Forecasting, 7, 150–165, https://doi.org/10.1175/1520-0434(1992)007<0150:AOCATF>2.0.CO;2, 1992. a
Ellrod, G. P. and Knox, J. A.: Improvements to an Operational Clear-Air Turbulence Diagnostic Index by Addition of a Divergence Trend Term, Weather and Forecasting, 25, 789–798, https://doi.org/10.1175/2009WAF2222290.1, 2010. a
Faranda, D., Ginesta, M., Alberti, T., Coppola, E., and Anzidei, M.: Attributing Venice Acqua Alta events to a changing climate and evaluating the efficacy of MoSE adaptation strategy, npj Climate and Atmospheric Science, 6, 181, https://doi.org/10.1038/s41612-023-00513-0, 2023. a
Faranda, D., Messori, G., Coppola, E., Alberti, T., Vrac, M., Pons, F., Yiou, P., Saint Lu, M., Hisi, A. N. S., Brockmann, P., Dafis, S., Mengaldo, G., and Vautard, R.: ClimaMeter: contextualizing extreme weather in a changing climate, Weather Clim. Dynam., 5, 959–983, https://doi.org/10.5194/wcd-5-959-2024, 2024. a, b, c, d, e, f, g, h
Federal Aviation Administration: Advisory Circular AC 00-24C: Thunderstorms, Federal Aviation Administration, https://www.faa.gov/documentlibrary/media/advisory_circular/ac 00-24c.pdf (last access: 26 November 2024), 2022. a
Forbis, D. C., Patricola, C. M., Bercos-Hickey, E., and Gallus Jr., W. A.: Mid-century climate change impacts on tornado-producing tropical cyclones, Weather and Climate Extremes, 44, 100684, https://doi.org/10.1016/j.wace.2024.100684, 2024. a
Fragkoulidis, G.: Decadal variability and trends in extratropical Rossby wave packet amplitude, phase, and phase speed, Weather Clim. Dynam., 3, 1381–1398, https://doi.org/10.5194/wcd-3-1381-2022, 2022. a
Ginesta, M., Flaounas, E., Yiou, P., and Faranda, D.: Anthropogenic climate change will intensify European explosive storms analogous to Alex, Eunice, and Xynthia, Journal of Climate, 37, 5427–5452, 2024. a, b, c
Gisinger, S., Bramberger, M., Dörnbrack, A., and Bechtold, P.: Severe Convectively Induced Turbulence Hitting a Passenger Aircraft and Its Forecast by the ECMWF IFS Model, Geophysical Research Letters, 51, e2024GL113037, https://doi.org/10.1029/2024GL113037, 2024. a
Gratton, G. B., Williams, P. D., Padhra, A., and Rapsomanikis, S.: Reviewing the impacts of climate change on air transport operations, The Aeronautical Journal, 126, 209–221, 2022. a
Gulev, S. K., Thorne, P. W., Ahn, J., Dentener, F. J., Domingues, C. M., Gerland, S., Gong, D., Kaufman, D. S., Nnamchi, H. C., Quaas, J., Rivera, J. A., Sathyendranath, S., Smith, S. L., Trewin, B., von Schuckmann, K., Vose, R. S., Allan, R. , Collins, B. , Turner, A., and Hawkins, E.: Changing state of the climate system, edited by: Masson-Delmotte, V., Zhai, P., Pirani, A., Connors, S. L., Péan, C., Berger, S., Caud, N., Chen, Y., Goldfarb, L., Gomis, M. I., Huang, M., Leitzell, K., Lonnoy, E., Matthews, J. B. R., Maycock, T. K., Waterfield, T., Yelekçi, O., Yu, R., and Zhou, B.: Climate Change 2021: The Physical Science Basis, Contribution of Working Group I to the Sixth Assessment Report of the Intergovernmental Panel on Climate Change, Cambridge University Press, Cambridge, UK, 287–422, 2021. a
Hay, S., Priestley, M. D. K., Yu, H., Catto, J. L., and Screen, J. A.: The Effect of Arctic Sea-Ice Loss on Extratropical Cyclones, Geophysical Research Letters, 50, e2023GL102840, https://doi.org/10.1029/2023GL102840, 2023. a
Hsiao, C.-Y. and Hansen, M.: Econometric analysis of US airline flight delays with time-of-day effects, transportation research Record, 1951, 104–112, 2006. a
Huang, B., Thorne, P. W., Banzon, V. F., Boyer, T., Chepurin, G., Lawrimore, J. H., Menne, M. J., Smith, T. M., Vose, R. S., and Zhang, H.-M.: Extended Reconstructed Sea Surface Temperature, Version 5 (ERSSTv5): Upgrades, Validations, and Intercomparisons, Journal of Climate, 30, 8179–8205, https://doi.org/10.1175/JCLI-D-16-0836.1, 2017. a
International Civil Aviation Organization: Safety Aspects of Tailwind Operations, Tech. rep., ICAO, https://skybrary.aero/sites/default/files/bookshelf/1148.pdf (last access: 20 February 2025), 2008. a
International Civil Aviation Organization: Seventh Meeting of the MOG, https://www.icao.int/airnavigation/METP/Seventh Meeting of the MOG/METPWGMOG-7_Attachment_SN_35_METP_4_WP.xxxx.Revised_EDR_values_Amd_79_vs_1.0_22mar2018.docx (last access: 12 July 2024), 2018. a, b, c, d, e
Kendon, M.: Storms Dudley, Eunice and Franklin February 2022, Tech. rep., Technical Report, Met Office, https://www.metoffice.gov.uk/binaries/content/assets/metofficegovuk/pdf/weather/learn-about/uk-past-events/interesting/2022/2022_01_storms_dudley_eunice_franklin_r1.pdf (last access: 20 February 2025), 2022. a, b
Kim, K., Lee, H., Lee, M., Bae, Y. H., Kim, H. S., and Kim, S.: Analysis of weather factors on aircraft cancellation using a multilayer complex network, Entropy, 25, 1209, https://doi.org/10.21203/rs.3.rs-2567120/v1, 2023. a
Kim, Y.-H., Lee, M., Min, S.-K., Park, D.-S. R., Cha, D.-H., Byun, Y.-H., and Heo, J.: Global Warming–Induced Warmer Surface Water over the East China Sea Can Intensify Typhoons like Hinnamnor, Bulletin of the American Meteorological Society, 105, E1416–E1421, https://doi.org/10.1175/BAMS-D-23-0240.1, 2024. a
Lee, J.-Y., Marotzke, J., Bala, G., Cao, L., Corti, S., Dunne, J. P., Engelbrecht, F., Fischer, E., Fyfe, J. C., Jones, C., Maycock, A., Mutemi, J., Ndiaye, O., Panickal, S., and Zhou, T.: Future global climate: scenario-based projections and near-term information, in: Climate change 2021: The physical science basis. Contribution of working group I to the sixth assessment report of the intergovernmental panel on climate change, 553–672, Cambridge University Press, https://doi.org/10.1017/9781009157896.006, 2021. a
Lockwood, J. W., Lin, N., Gori, A., and Oppenheimer, M.: Increasing flood hazard posed by tropical cyclone rapid intensification in a changing climate, Geophysical Research Letters, 51, e2023GL105624, https://doi.org/10.1029/2023GL105624, 2024. a
Luu, L. N., Vautard, R., Yiou, P., van Oldenborgh, G. J., and Lenderink, G.: Attribution of extreme rainfall events in the south of France using EURO-CORDEX simulations, Geophysical Research Letters, 45, 6242–6250, 2018. a
Madin, J.: Climate Change: Increasing Storm Activity, Springer Netherlands, Dordrecht, 218–221, ISBN 978-90-481-2639-2, https://doi.org/10.1007/978-90-481-2639-2_57, 2011. a
Marvel, K. and Bonfils, C.: Identifying external influences on global precipitation, Proceedings of the National Academy of Sciences, 110, 19301–19306, 2013. a
Massacand, A. C. and Davies, H. C.: Interannual variability of the extratropical northern hemisphere and the potential vorticity wave guide, Atmospheric Science Letters, 2, 61–71, https://doi.org/10.1006/asle.2001.0036, 2001. a
Masson-Delmotte, V., Zhai, P., Pirani, A., Connors, S. L., Péan, C., Berger, S., Caud, N., Chen, Y., Goldfarb, L., Gomis, M., Huang, K., Leitzell, M., Lonnoy, E., Matthews, J. B. R., Maycock, T. K., Waterfield, T., Yelekçi, O., Yu, R., and Zhou B.: Climate Change 2021: The Physical Science Basis. Contribution of Working Group I to the Sixth Assessment Report of the Intergovernmental Panel on Climate Change, vol. 2, Cambridge University Press, Cambridge, United Kingdom and New York, NY, USA, https://doi.org/10.1017/9781009157896, 2021. a, b
Oo, K. T. and Oo, K. L.: Analysis of the most common aviation weather hazard and its key mechanisms over the Yangon flight information region, Advances in Meteorology, 2022, 5356563, https://doi.org/10.1155/2022/5356563, 2022. a
Otto, F.: Attribution of extreme weather events: how does climate change affect weather?, Weather, 74, 325–326, 2019. a
Otto, F. E. L.: Extreme events: The art of attribution, Nat. Clim. Chang., 6, 342–343, 2016. a
Pinto, J., Zacharias, S., Fink, A., Leckebusch, G. C., and Ulbrich, U.: Factors contributing to the development of extreme North Atlantic cyclones and their relationship with the NAO, Climate Dynamics, 32, 711–737, https://doi.org/10.1007/s00382-008-0396-4, 2009. a
Priestley, M. D. and Catto, J. L.: Improved representation of extratropical cyclone structure in HighResMIP models, Geophysical Research Letters, 49, e2021GL096708, https://doi.org/10.1029/2021GL096708, 2022. a, b
Priestley, M. D., Ackerley, D., Catto, J. L., Hodges, K. I., McDonald, R. E., and Lee, R. W.: An overview of the extratropical storm tracks in CMIP6 historical simulations, Journal of Climate, 33, 6315–6343, 2020. a
Priestley, M. D. K., Stephenson, D. B., Scaife, A. A., Bannister, D., Allen, C. J. T., and Wilkie, D.: Forced trends and internal variability in climate change projections of extreme European windstorm frequency and severity, Quarterly Journal of the Royal Meteorological Society, 150, 4933–4950, https://doi.org/10.1002/qj.4849, 2024. a
Risser, M. D. and Wehner, M. F.: Attributable Human-Induced Changes in the Likelihood and Magnitude of the Observed Extreme Precipitation during Hurricane Harvey, Geophysical Research Letters, 44, 12457–12464, https://doi.org/10.1002/2017GL075888, 2017. a
Robinson, P. J.: The influence of weather on flight operations at the Atlanta Hartsfield International Airport, Weather and Forecasting, 4, 461–468, 1989. a
Rosanes, M.: Storms Dudley and Eunice: insured loss estimates revealed, Insurance Business, https://www.insurancebusinessmag.com/uk/news/catastrophe/storms-dudley-and-eunice-insured-loss-estimates-revealed-326851.aspx (last access: 22 January 2025), 2022. a
Sasse, M. and Hauf, T.: A study of thunderstorm-induced delays at Frankfurt Airport, Germany, Meteorological Applications, 10, 21–30, 2003. a
Seneviratne, S. I., Zhang, X., Adnan, M., Badi, W., Dereczynski, C., Di Luca, A., Ghosh, S., Iskandar, I., Kossin, J., Lewis, S., Otto, F., Pinto, I., Satoh, M., Vicente-Serrano, S. M., Wehner, M., and Zhou, B.: Weather and Climate Extreme Events in a Changing Climate, in: Climate Change 2021: The Physical Science Basis. Contribution of Working Group I to the Sixth Assessment Report of the Intergovernmental Panel on Climate Change, edited by: Masson-Delmotte, V., Zhai, P., Pirani, A., Connors, S. L., Péan, C., Berger, S., Caud, N., Chen, Y., Goldfarb, L., Gomis, M. I., Huang, M., Leitzell, K., Lonnoy, E., Matthews, J. B. R., Maycock, T. K., Waterfield, T., Yelekçi, O., Yu, R., and Zhou, B., Cambridge University Press, Cambridge, United Kingdom and New York, NY, USA, 1513–1766, https://doi.org/10.1017/9781009157896.013, 2021. a
Sharman, R. and Lane, T.: Aviation turbulence, Springer International Publishing, ISBN 978-3-31-923629-2, ISBN 978-3-31-923630-8, https://doi.org/10.1007/978-3-319-23630-8, 2016. a
Simmons, A. J.: Trends in the tropospheric general circulation from 1979 to 2022, Weather Clim. Dynam., 3, 777–809, https://doi.org/10.5194/wcd-3-777-2022, 2022. a
Soci, C., Hersbach, H., Simmons, A., Poli, P., Bell, B., Berrisford, P., Horányi, A., Muñoz-Sabater, J., Nicolas, J., Radu, R., Schepers, D., Villaume, S., Haimberger, L., Woollen, J., Buontempo, C., and Thépaut, J.-N.: The ERA5 global reanalysis from 1940 to 2022, Quarterly Journal of the Royal Meteorological Society, 150, 4014–4048, https://doi.org/10.1002/qj.4803, 2024. a, b
Storer, L. N., Williams, P. D., and Joshi, M. M.: Global response of clear-air turbulence to climate change, Geophysical Research Letters, 44, 9976–9984, 2017. a
Storer, L. N., Williams, P. D., and Gill, P. G.: Aviation turbulence: dynamics, forecasting, and response to climate change, Pure and Applied Geophysics, 176, 2081–2095, 2019. a, b
The Sun: Storm Eunice Ireland – Flights cancelled and roads closed as red alert issued, https://www.thesun.ie/news/8384038/storm-eunice-ireland-flights-cancelled-roads/ (last access: 20 February 2025-02-20), 2022. a
Timmins, B.: Storm Eunice: Flights and train services cancelled, BBC, https://www.bbc.com/news/business-60430197 (last access: 22 January 2025), 2022. a
Trenberth, K. E. and Shea, D. J.: Atlantic hurricanes and natural variability in 2005, Geophysical Research Letters, 33, https://doi.org/10.1029/2006GL026894, 2006. a
Ulbrich, U., Leckebusch, G. C., and Pinto, J. G.: Extra-tropical cyclones in the present and future climate: a review, Theoretical and Applied Climatology, 96, 117–131, 2009. a
Vautard, R., Christidis, N., Ciavarella, A., Alvarez-Castro, C., Bellprat, O., Christiansen, B., Colfescu, I., Cowan, T., Doblas-Reyes, F., Eden, J., Hauser, M., Hegerl, G., Hempelmann, N., Klehmet, K., Lott, F., Nangini, C., Orth, R., Radanovics, S., Seneviratne, S. I., van Oldenborgh, G. J., Stott, P., Tett, S., Wilcox L., and Yiou, P.: Evaluation of the HadGEM3-A simulations in view of detection and attribution of human influence on extreme events in Europe, Climate Dynamics, 52, 1187–1210, 2019. a
Volonté, A., Gray, S. L., Clark, P. A., Martínez-Alvarado, O., and Ackerley, D.: Strong surface winds in Storm Eunice. Part 1: storm overview and indications of sting jet activity from observations and model data, Weather, 79, 40–45, 2024a. a, b
Volonté, A., Gray, S. L., Clark, P. A., Martínez-Alvarado, O., and Ackerley, D.: Strong surface winds in Storm Eunice. Part 2: airstream analysis, Weather, 79, 54–59, 2024b. a
Williams, J. K.: Using random forests to diagnose aviation turbulence, Machine Learning, 95, 51–70, 2014. a
Williams, P. D.: Increased light, moderate, and severe clear-air turbulence in response to climate change, Advances in Atmospheric Sciences, 34, 576–586, 2017. a
Williams, P. D. and Joshi, M. M.: Intensification of winter transatlantic aviation turbulence in response to climate change, Nature Climate Change, 3, 644–648, https://doi.org/10.1038/nclimate1866, 2013. a
Wu, L., Zhao, H., Wang, C., Cao, J., and Liang, J.: Understanding of the effect of climate change on tropical cyclone intensity: A Review, Advances in Atmospheric Sciences, 39, 205–221, 2022. a
Yiou, P., Jézéquel, A., Naveau, P., Otto, F. E. L., Vautard, R., and Vrac, M.: A statistical framework for conditional extreme event attribution, Adv. Stat. Clim. Meteorol. Oceanogr., 3, 17–31, https://doi.org/10.5194/ascmo-3-17-2017, 2017. a, b
Zappa, G., Shaffrey, L. C., Hodges, K. I., Sansom, P. G., and Stephenson, D. B.: A multimodel assessment of future projections of North Atlantic and European extratropical cyclones in the CMIP5 climate models, Journal of Climate, 26, 5846–5862, 2013. a
The method is robust with respect to changes in the domain size, provided that the storm/cyclone is fully contained in the domain (Faranda et al., 2024).