the Creative Commons Attribution 4.0 License.
the Creative Commons Attribution 4.0 License.
 | 06 Nov 2025
Drivers and impacts of westerly moisture transport events in East Africa
Robert Peal
Emily Collier
Equatorial East Africa (EEA) experiences strong intraseasonal precipitation variations. A better understanding of the processes that drive these variations can improve predictability and help local populations better prepare for extremes. Previous research has highlighted anomalous westerly moisture transport from the Congo basin as an important driver of enhanced precipitation in EEA. Here, we have developed the first spatially unconstrained, objective framework to detect what we refer to as westerly moisture transport events (WMTEs) in ERA5 reanalysis data from 1980 to 2022, revealing new insights into potential drivers of these westerlies and their impact on EEA precipitation. We show that over EEA, WMTEs were most common in January and February between about 5 and 15° S, where there were typically 4 to 6 WMTE days per month, with each individual event persisting in the region for around 2 to 4 d. During the main wet seasons in EEA, March to May and October to December, there was on average around 1 WMTE day per month. Using an established precipitation attribution algorithm, we estimate that WMTEs were associated with up to 60 % of precipitation during January and February in Tanzania, and up to 20 % of precipitation during March–May to the east of Lake Victoria. WMTEs over EEA with higher integrated moisture transport were associated with more intense precipitation. Consistent with previous work, we found that WMTEs were more likely during phases 2–4 of the Madden-Julian Oscillation (MJO). However, we extend previous case study investigations, by showing that WMTEs tend to have longer lifetimes when close to a tropical cyclone (TC). We also found that the presence of a TC anywhere in the south-west Indian Ocean made WMTEs in EEA up to three times more likely, even during inactive or unfavourable phases of the MJO. This work builds on previous studies of the westerly wind feature by developing an objective framework to describe them and providing new insights into the complex nature of the interactions between different features of tropical meteorology that drive these intraseasonal phenomena.
- Article
(8949 KB) - Full-text XML
-
Supplement
(63981 KB) - BibTeX
- EndNote


Precipitation in Equatorial East Africa (EEA) displays strong intra-seasonal variability, with even the core rainy seasons characterised by alternating periods of wetter and drier conditions (Camberlin and Wairoto, 1997; Pohl and Camberlin, 2006). At their extremes, these wet and dry spells lead to drought and flooding events (e.g., Wainwright et al., 2021) that can devastate the lives and livelihoods of local populations (e.g., Jones, 2020; Parry et al., 2012; Wright, 2024).
EEA experiences strong hygric seasonality, with the main and secondary wet seasons from March to May (MAM) and October to December (OND), referred to as the long and short rains, respectively; and, the main and secondary dry seasons from June to September (JJAS) and January to February (JF), respectively. Intraseasonal precipitation variability has been mainly studied for the MAM season and has been linked to the activity of the Madden Julian Oscillation (MJO), which is characterised by an eastward propagating disturbance in zonal winds, surface pressure, convection, and precipitation, with an average periodicity of 30 to 60 d (Madden and Julian, 1994). Previous research has shown that precipitation is enhanced over the East African highlands as the centre of convection traverses the Indian Ocean (phases 2–4) and suppressed as it traverses the Pacific Ocean (phases 6–8; e.g., Pohl and Camberlin, 2006; Hogan et al., 2015; Finney et al., 2020). The key mechanism through which the MJO leads to enhanced and even extreme rainfall over the Highlands is the development of anomalous westerly winds that advect moisture from the Congo basin into the region and lead to moisture convergence and deep convection (e.g., Nakamura, 1968; Camberlin and Wairoto, 1997; Pohl and Camberlin, 2006; Finney et al., 2020; Walker et al., 2020).
Until recently, the MJO was the only form of intraseasonal atmospheric variability associated with these anomalous westerlies. However, recent case studies of extreme seasons have also linked them to tropical cyclone (TC) activity in the western Indian Ocean (Kilavi et al., 2018; Collier et al., 2019; Finney et al., 2020; Walker et al., 2020; Kebacho, 2024; Gudoshava et al., 2024). TC activity is itself influenced by the MJO phase: TC genesis in the Indian Ocean is enhanced when the centre of MJO convection lies over the Indian Ocean and suppressed as the mode traverses the Pacific (Liebmann et al., 1994; Bessafi and Wheeler, 2006; Ho et al., 2006; Klotzbach, 2014). In the most comprehensive, and only multi-decadal, study to date, Finney et al. (2020) found that the westerly circulation during MAM was more common not only in MJO phases 2–4 but also when a TC was located to the north-east of Madagascar, but found no evidence that TCs can act independent triggers. However, this study focused only on MAM and relied on area-averaged zonal wind anomalies over a fixed region centred over Lake Victoria to identify events. Thus, several aspects of the westerlies remain poorly understood, including their exact spatial location and extent, seasonal characteristics outside of MAM, and the long-term nature of their relationship with the MJO and TCs in driving precipitation variability in EEA.
To address these methodological and knowledge gaps, in this study we present a spatially flexible and systematic framework for detecting what we refer to as “westerly moisture transport events” (WMTEs) in the field of moisture transport over eastern Africa. Systematic frameworks for more objective studies of moisture transport exist for atmospheric rivers (ARs). However, existing algorithms largely exclude purely zonal AR-like structures by requiring components of poleward moisture transport (Guan and Waliser, 2015) and, despite recent improvements, detect ARs over eastern Africa on less than 1 % of days (Guan and Waliser, 2024). Using the generated time-series of WMTEs as well as an established precipitation attribution algorithm, we present the first analysis of these events considering all seasons, revealing new insights into their characteristics and their multi-decadal impacts on precipitation in EEA. These insights will contribute to better forecasting of intraseasonal variations, allowing local populations to be better prepared for extreme events.
The algorithm for detecting WMTEs is described in Sect. 2.2. Then, in Sect. 3.1, we present the first analysis of the basic characteristics of these events including their seasonal cycle and typical duration. In Sect. 3.2, we show how the frequency of WMTEs is altered by MJO phase and the presence of TCs, and then finally in Sect. 3.3, we use the timeseries of WMTEs to estimate how much EEA precipitation can be attributed to them in each season.
2.1 Data
For our detection algorithm and analysis of regional circulation, we used the ERA5 reanalysis, which is provided by the European Center for Medium-Range Weather Forecasts on a 0.25° × 0.25° latitude and longitude grid from 1940 to present (Hersbach et al., 2020). For detection, we used daily moisture transport fields at 700 hPa, which we calculated using the product of the daily averaged wind vector u and the daily averaged specific humidity q. We focused on the 700 hPa level as it is correlated with both sub-seasonal and interannual variations in precipitation during the long rains (Walker et al., 2020).
We quantified MJO activity using the Australian Bureau of Meteorology's all-season real-time multivariate MJO index (Wheeler and Hendon, 2004), which provides phase and amplitude information from 1979 to the present day (, ). We found that the patterns of WMTE activity were similar in phases 2–4, and 5–1, which previous research identified as favourable and unfavourable, respectively, for westerly winds and enhanced precipitation in EEA (Pohl and Camberlin, 2006; Finney et al., 2020). Therefore, when investigating the role of the MJO in WMTE characteristics, we grouped our analysis into favourable, unfavourable, and inactive phases of the MJO.
We quantified TC activity using the International Best Track Archive for Climate Stewardship global storm archive (IBTrACS) (Knapp et al., 2010). IBTrACS provides information about TC position, intensity, and structure at three-hourly temporal resolution since 1842. We used the archived storm data from both the northern and southern Indian Ocean basins. We used IBTrACS reports from mid-day to aggregate the data to daily timescales. IBTrACS may suffer from missing events prior to the availability of satellite observations in the 1960s, and from temporal heterogeneities in the methods used for estimating intensity prior to the 1980s (Kossin et al., 2013). Therefore, we focused our analysis on the period from 1980 to 2022.
We investigated the precipitation response to WMTEs using daily totals provided by ERA5. Due to potential inaccuracies in ERA5 precipitation totals (Lavers et al., 2022), we compared the ERA5 precipitation response with that from two other products: the Climate Hazards Group InfraRed Precipitation with Station data (CHIRPS), which provides daily totals at 0.05° × 0.05° resolution, obtained through interpolation of satellite and rain gauge observations from 1998 to the present (Funk et al., 2015); and, Integrated Multi-satellitE Retrievals for GPM (IMERG), which provides daily totals at 0.1° × 0.1° from infra-red and microwave satellite observations, from 1998 to the present (Huffman et al., 2023).
The area used in our detection algorithm extended from 22° W to 102° E and from 40° N to 37° S, thus including all of Africa and the Indian Ocean as well as the eastern part of the Atlantic. However, we focus our results and discussion on the regions of eastern Africa and south-west Indian Ocean where our phenomenon of interest primarily occurs.
The detection code and resulting timeseries of WMTEs are available at https://doi.org/10.5281/zenodo.15173985 (Peal and Collier, 2025).
2.2 Detection of westerly moisture transport events
We identified westerly events using a method adapted from a detection algorithm for ARs (Guan and Waliser, 2015). Following this approach, we first identified grid points in the field of daily mean moisture transport where (i) the direction of the moisture transport vector was within the range of ±45°, and (ii) the magnitude of moisture transport exceeded the 70th percentile of all magnitudes recorded at that location, for that month, from 1980 to 2022 (including non-westerly days). We then identified contiguous regions comprising at least 1000 ERA5 grid points, approximately 560 000 km2 at the equator, satisfying these conditions. In this paper, we refer to the identified events as “westerly moisture transport events” (WMTEs). The outline of a specific WMTE on a given day is referred to as a “WMTE polygon”, and a day where a WMTE was present at a certain location is referred to as a “WMTE day”.
We assessed the robustness of our detection algorithm by performing a sensitivity analysis of the three free parameters: the directional coherency (±45°), the minimum area (exceeding 1000 ERA5 grid points), and the transport magnitude (exceeding the month-dependent 70th percentile; see detailed discussion in Sect. S1 of the Supplement). Briefly summarised, the number of WMTE days per year over EEA was most sensitive to the transport magnitude threshold, decreasing by about 26 % in response to a 10 % increase in the threshold, while changes in the direction and size thresholds had smaller to negligible impacts on the number of WMTE days per year.
To study the lifetime of WMTEs, we followed the approach used by Guan and Waliser (2024) to track ARs, whereby if any pixel that was inside a WMTE polygon in a given timestep t also lay inside a WMTE polygon in the next timestep t + 1, those two polygons were tracked as being part of the same WMTE. If a WMTE split into multiple objects (a single WMTE polygon at time t overlapping with multiple WMTE polygons at time t + 1), the WMTE polygon in t + 1 with the largest overlap with the WMTE polygon in t would be tracked as part of the existing WMTE, and any other WMTEs would be described as new objects. If multiple WMTEs merged (multiple WMTE polygons at time t overlapping with a single WMTE polygon at time t + 1), then the WMTE in t with the largest overlap with the WMTE polygon in t + 1 would be tracked into t + 1, while the other WMTEs would end at time t. An example of a WMTE tracked over multiple days is shown in Fig. S3 in the Supplement, and a selection of other detected polygons are shown in Fig. S4 (including an example of a WMTE splitting in Fig. S4e–f).
To evaluate how characteristics of WMTEs affected their impacts, we measured the following properties: (i) mean, maximum, and total magnitudes of both the 700 hPa moisture flux and column integrated vapour transport (IVT) between the surface and the top of atmosphere inside the WMTE polygon; (ii) the geographic position of the maximum magnitudes of 700 hPa moisture flux and IVT; and finally, (iii) both the longitudinal and latitudinal ranges and the area of the WMTE polygon.
To determine whether a given WMTE was associated with one or more TCs in the Indian Ocean, we used a 500 km distance threshold between a storm's position and any part of the polygon outlining the extent of the WMTE. A WMTE polygon lying within the 500 km threshold of a TC is referred to as a TC-WMTE polygon, and a WMTE containing at least one TC-WMTE polygon is referred to as a TC-WMTE. All other WMTEs (polygons) are referred to as noTC-WMTEs (polygons).
While the mechanism by which TCs and westerlies in EEA may be related remains unconstrained, we included this distance threshold because several case studies have shown these phenomena co-occurring (e.g., Collier et al., 2019; Kilavi et al., 2018), with the westerly feature appearing to join the northern part of the vortex (see also an example in Fig. 1a). The distance threshold therefore represented a simple way to identify events with a potential TC influence. We assessed the robustness of this parameter by comparing the fraction of days where a WMTE polygon affected our study region was classified as a TC-WMTE. Overall, varying the threshold had a small impact (Fig. S5). For example, in January and February, the months where WMTEs were most frequent in EEA and TC activity peaks (Mavume et al., 2010), varying the threshold from 250 to 750 km increased this percentage from ∼ 38 % to ∼41 %.
Figure 1 shows an example of a detection of a TC-WMTE polygon, on 9 January 2015. Westerly moisture transport is visible across EEA at around 10° S in the 700 hPa moisture flux field, while a TC is located off the coast of Madagascar (Fig. 1a).
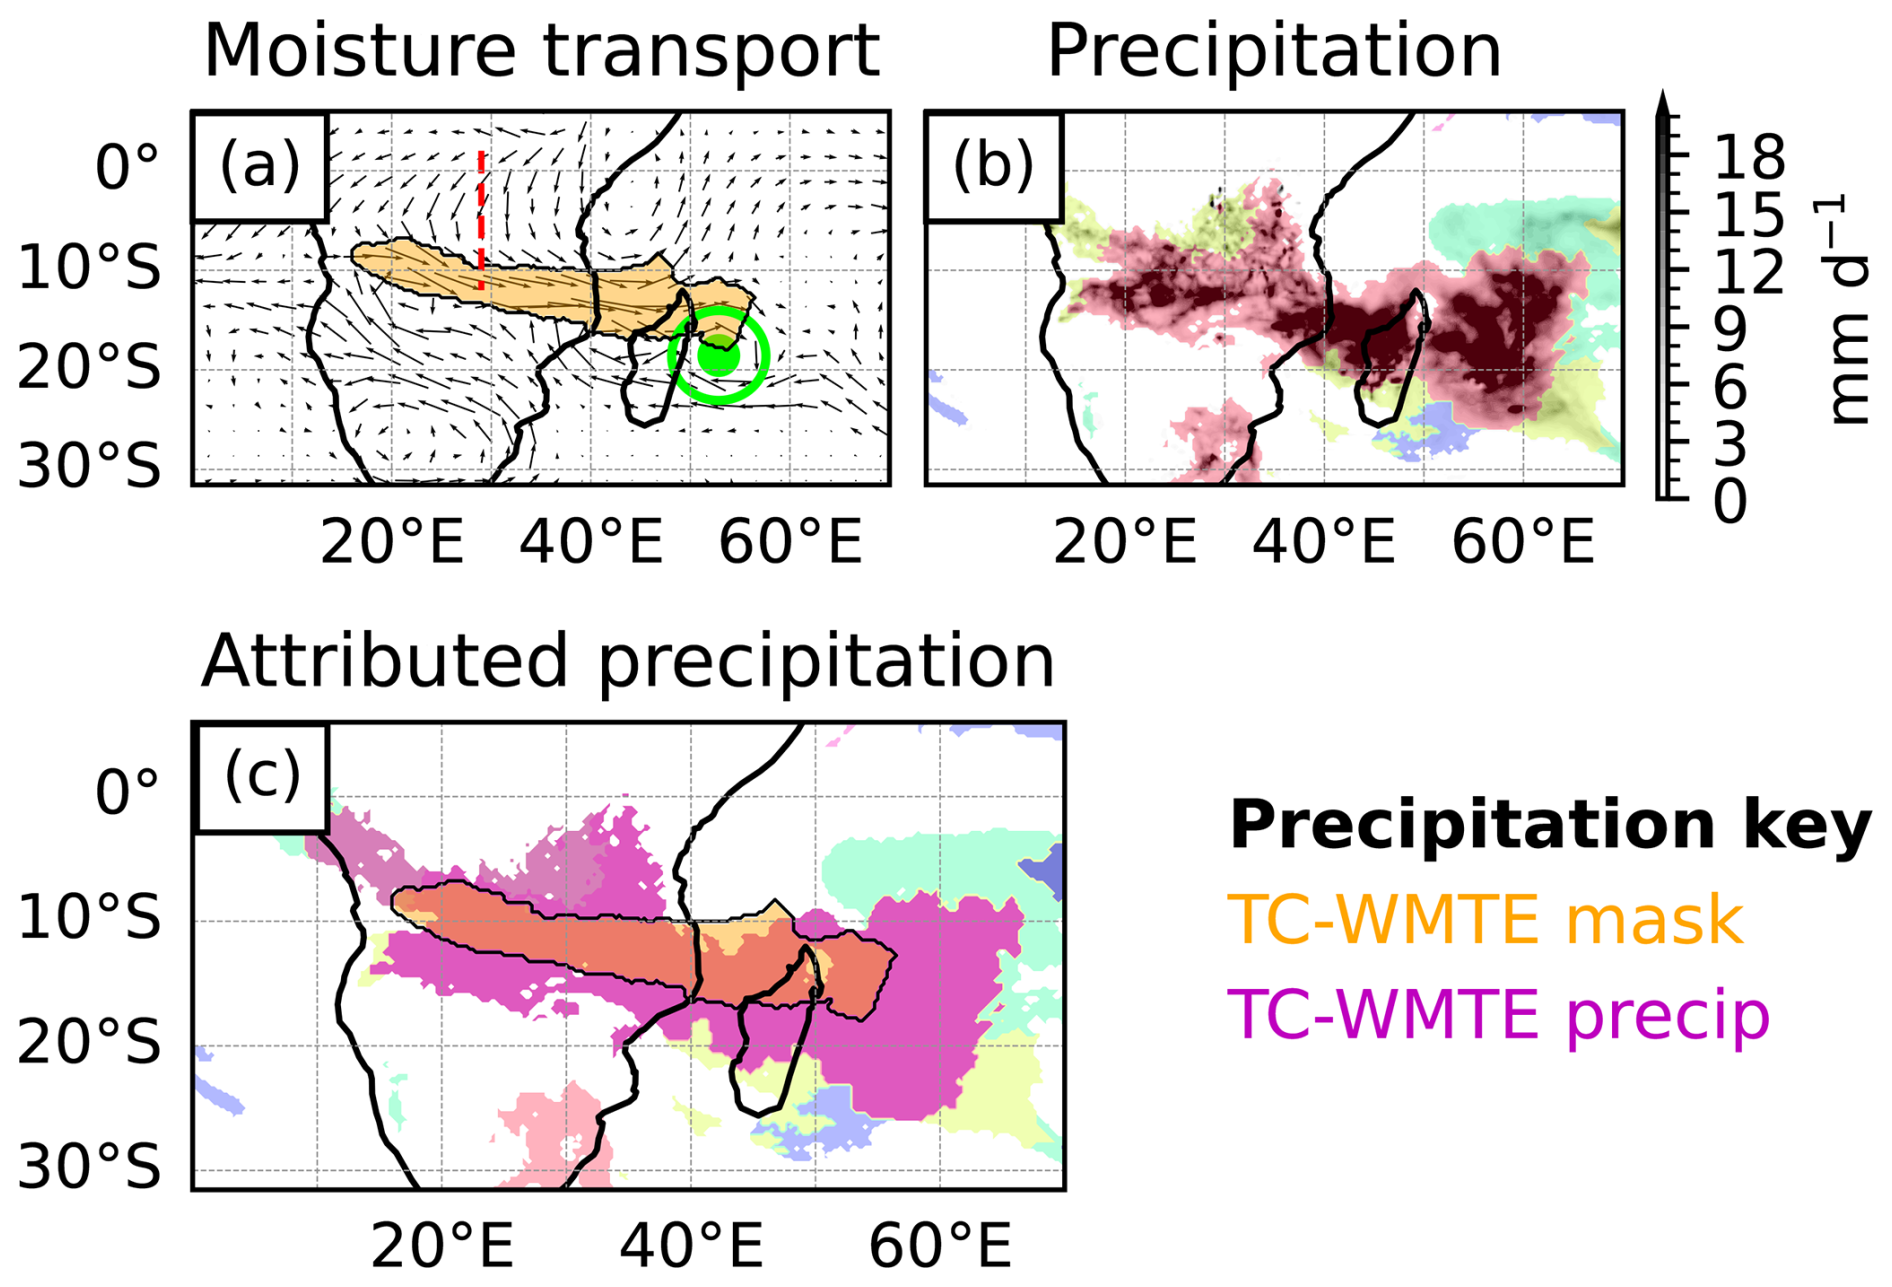
Figure 1An example of WMTE detection and precipitation attribution, on 9 January 2015. (a) Daily moisture flux at 700 hPa and the detected WMTE, which coincided with TC Bansi. The WMTE mask is shown in orange. The position of the TC is shown by the green dot while the circle around it shows the 500 km radius. The red dashed line from 2° N to 12° S at 29° E was used to identify WMTEs advecting moisture into EEA. (b) ERA5 daily precipitation total. Each differently coloured region represents a different precipitation object. (c) The precipitation attributed to the TC-WMTE, identified by overlaying the masks in panels (a) and (b), which is delineated by the purple contours.
We defined events affecting EEA as those intersecting the line extending from 2° N to 12° S at 29° E, shown by the dashed line in Fig. 1a, on at least 1 d. There is little consensus on the exact extent of EEA (Zaitchik, 2017). We chose 29° E such that Burundi, Kenya, Tanzania, and Uganda – the westernmost countries considered part of EEA – lie to the east of the line, while most of the Congo lies to the west. With this delineation, WMTEs intersecting this line by definition import moisture from the Congo basin into EEA. We selected the latitude range to capture both the region where WMTE occurrence is highest (see Sect. 3.1) and the region used in previous studies to define westerly events. A discussion of the impacts of methodological differences between this paper and existing work is provided in Sect. 3.2 and 3.3.
As we found reasonably consistent patterns of WMTE characteristics within the different hygric seasons in EEA, we present our results grouped by JF, MAM, JJAS and OND.
2.3 Attribution of precipitation
Precipitation was attributed to WMTEs following the methods of Konstali et al. (2024). For this approach, precipitation was first masked to only include grid cells with at least 1 mm d−1, a threshold commonly used to define a “wet day” (Klein Tank et al., 2009). Precipitation was then divided into contiguous areas surrounding local maxima using a watershed approach (Beucher and Lantuéjoul, 1979; Konstali et al., 2024), with maxima separated by less than 750 km placed in the same polygon. We detected the precipitation polygons using the implementation in the Dynlib software from Spensberger (2021). Finally, precipitation polygons (masks) that overlapped with WMTEs were attributed to them. For ERA5, precipitation was attributed to a WMTE if any grid cell in the precipitation mask was also inside a WMTE mask. To account for the different resolutions of CHIRPS and IMERG, precipitation masks were attributed to WMTEs if the nearest ERA5 grid point to any native grid point in the precipitation mask was part of a WMTE mask.
Konstali et al. (2024) assessed the sensitivity of this approach, which was almost insensitive to changes in the wet-day threshold. While the method was more sensitive to changing the distance threshold from 500 to 1000 km, it was half as sensitive as comparable approaches attributing precipitation using a fixed distance from a given weather feature. For comparison, we repeated our analysis using the most conservative possible approach: only attributing precipitation directly inside the WMTE mask. Using this approach, precipitation amounts inside the region where WMTEs were common were reduced by around 50 %, and as expected, precipitation outside this region decreased considerably (Fig. S6). We note that the approach of Konstali et al. (2024) can lead to large-scale areas of precipitation being attributed to a WMTE (see for example Fig. S4a, f), particularly when other features such as the MJO or TCs are also active in the region. However, this result is consistent with past work showing that WMTEs are associated with enhanced precipitation beyond the margin of the main region with enhanced moisture transport (e.g., Kilavi et al., 2018; Collier et al., 2019). To assess the precipitation associated with WMTEs, we recorded the mean and total precipitation attributed to each WMTE polygon, using both attribution methods.
Figure 1b shows the precipitation field and precipitation polygons after the watershed algorithm was applied. All the precipitation in any polygon that overlapped with the WMTE polygon was attributed to the WMTE (Fig. 1c). In this example, a large area of precipitation reaching across Africa into the south-west Indian Ocean was attributed to this TC-WMTE.
3.1 Characteristics of WMTEs
We first present some basic characteristics of WMTEs in eastern Africa, considering first their statistics at each grid point (Fig. 2). Over this region, WMTEs were most common in JF: most locations east of 20° E between about 5 and 15° S experienced a total of around 4 to 6 WMTE days per month (Fig. 2a) and associated potential moisture advection from the African interior. There was considerable interannual variation in the number of WMTE days per month in our study region mainly in JF, where the 95th percentile number of days per month exceeded 16 at some locations in EEA (Fig. 2e). Most locations in this region experienced around two separate events per month (Fig. 2i), with each event persisting for 2 to 4 d and the longest durations recorded near the coast (Fig. 2m). The median duration (Fig. 2q) in eastern Africa was typically around 1.5 d less than the mean duration, highlighting the prevalence of short events. For reference, feature tracking of WMTEs that started in JF and crossed the EEA line yielded an estimated mean lifetime of 9.3 d, although the distribution of lengths was skewed, with half of events lasting 5 d or less (Fig. S7a). Overall, these statistics confirm that WMTEs represent transient, intraseasonal phenomena.
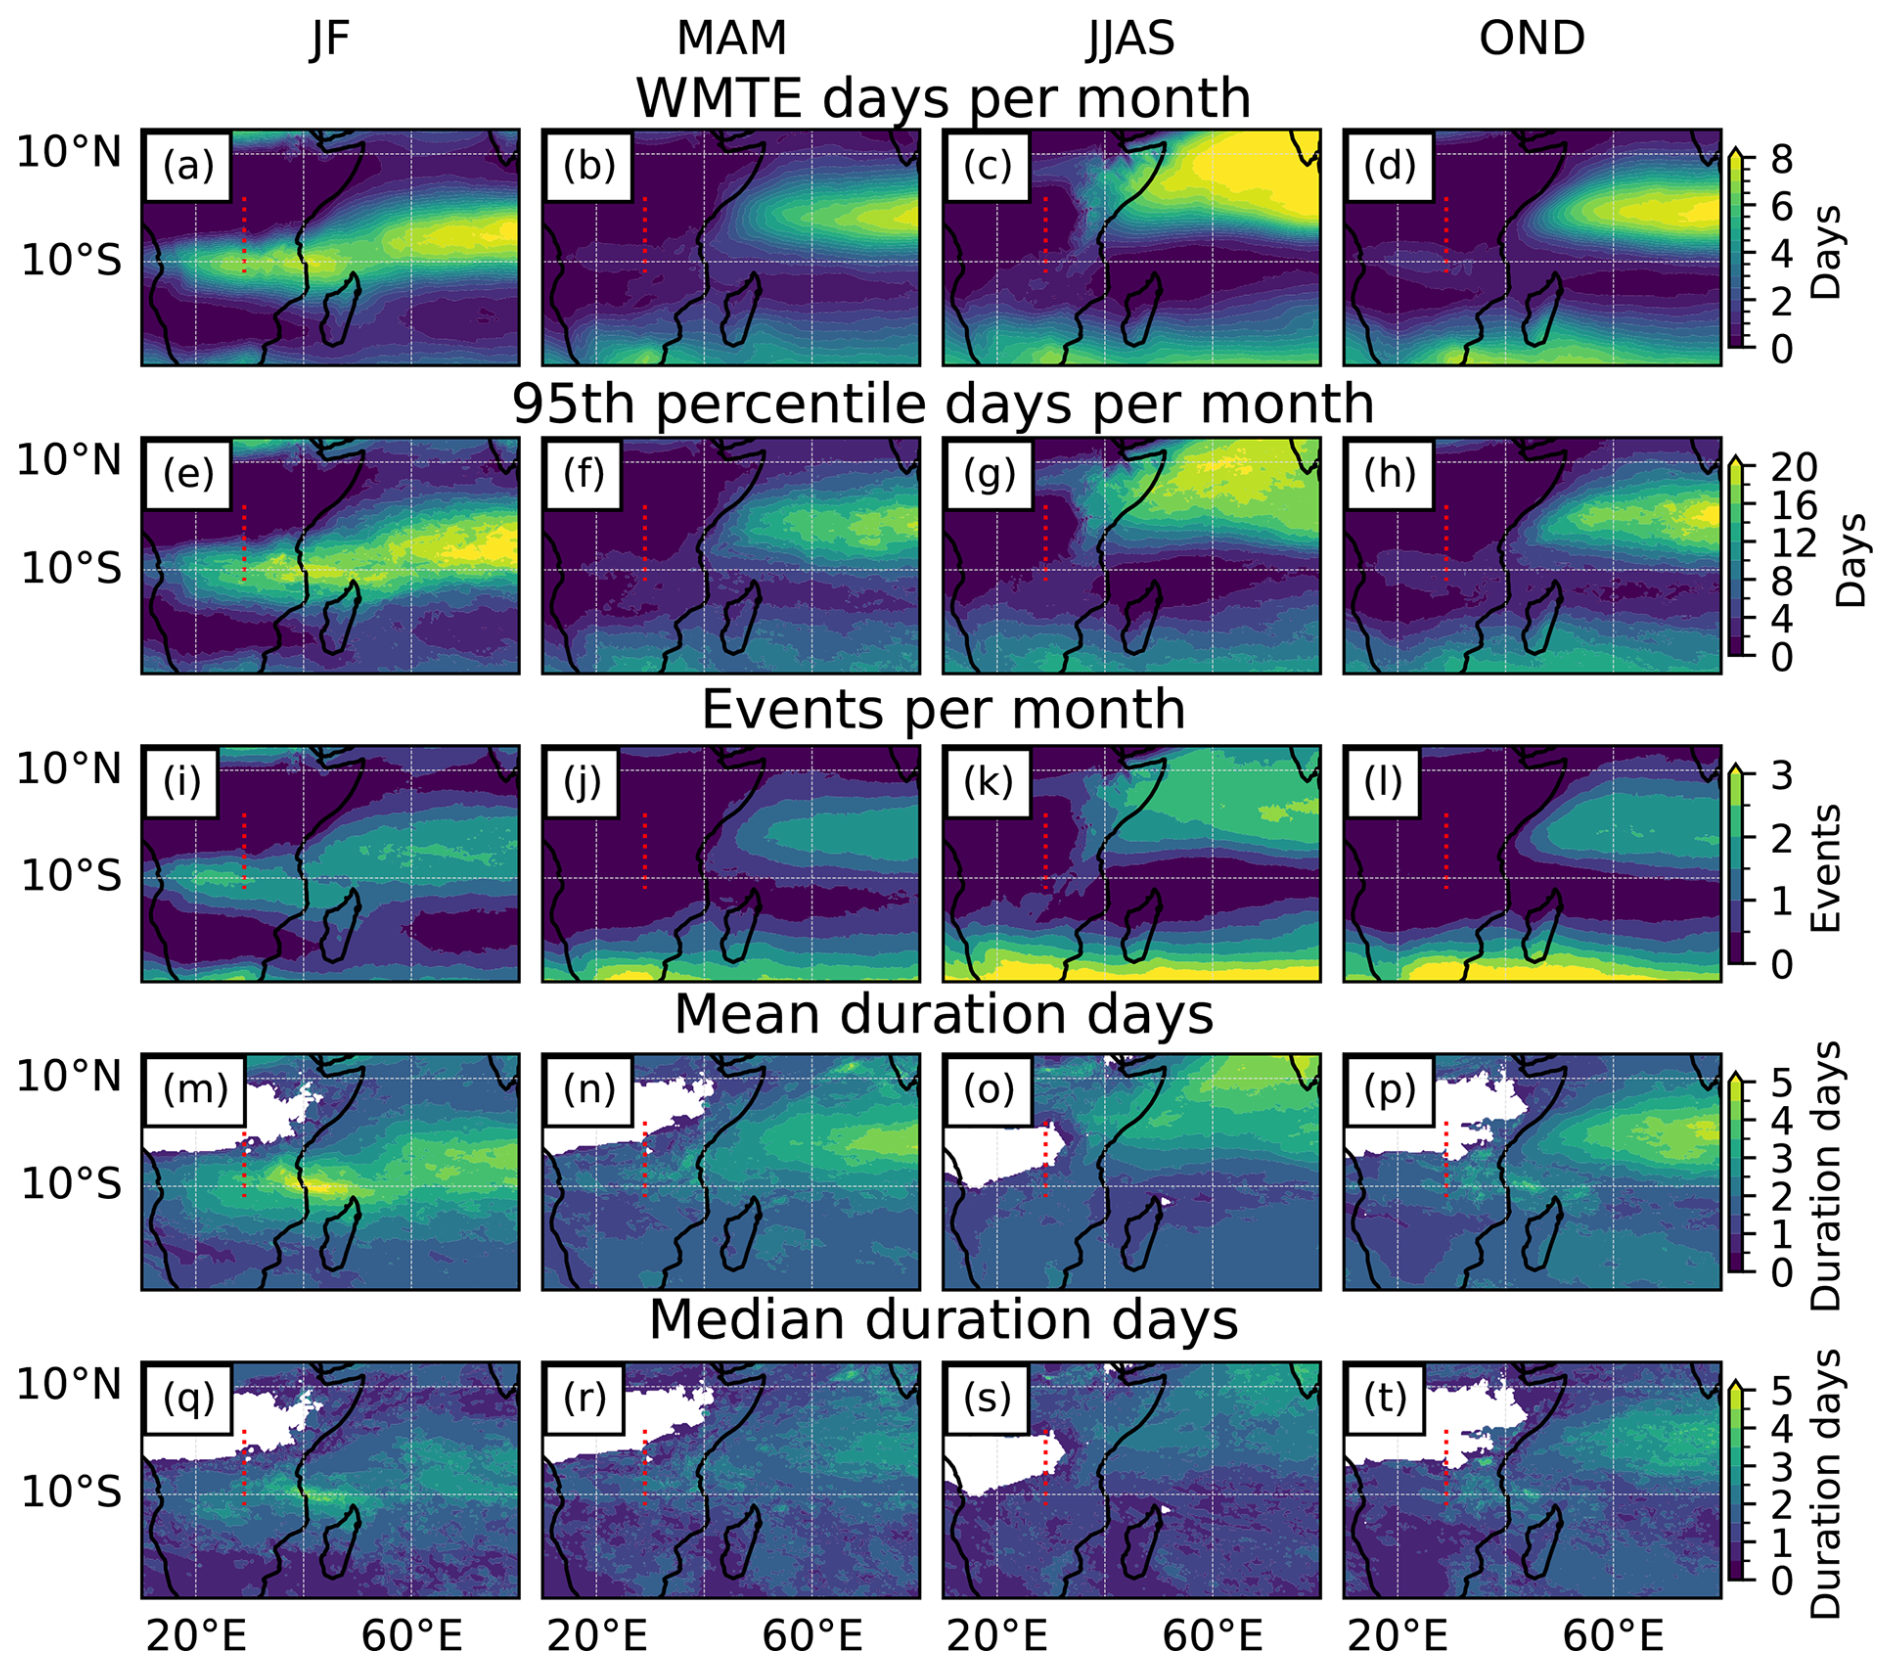
Figure 2Seasonal statistics of WMTEs detected in the whole domain: (a–d) average total number and (e–h) 95th percentile number of WMTE days per month, respectively. (i–l) average total number of WMTEs per month, defined as periods of consecutive days where there was a WMTE present at that location. (m–p) Mean and (q–t) median durations for which WMTEs persisted at each location, respectively. White shading indicates areas where no events were detected.
In the other months, detected WMTEs in the study region were much rarer. In MAM and OND, there was on average around 1 WMTE day per month in EEA (Fig. 2b, d). Events occurred less that once per month (Fig. 2j, l) and the mean and median lengths were just 1 to 2 d (Fig. 2n, p, r, t). However, the area covered by these events means that they would have the potential to advect moisture into EEA from the African interior. In JJAS, there were around two events per month at most grid points in the horn of Africa (Fig. 2k), lasting 1 to 2 d (Fig. 2o, s). However, these events rarely extended far enough westward to transport moisture into EEA from the Congo basin.
For the remainder of the paper, we focus our analysis on WMTEs that affected EEA (i.e. those overlapping with the line at 29° E from 2° N to 12° S, as discussed in Sect. 2.2; Fig. 3) and focus our analysis on the seasons of OND, JF and MAM, with at least 1 WMTE day per month with its westerly extent near the Congo Basin (Fig. 2a–d).
In Fig. 3, we compare regional 700 hPa moisture transport patterns on days with and without a WMTE polygon affecting EEA. To identify possible connections between WMTEs and cyclonic activity, we also show the curl of the moisture transport field (similar circulation patterns are observed if relative vorticity is considered; not shown).
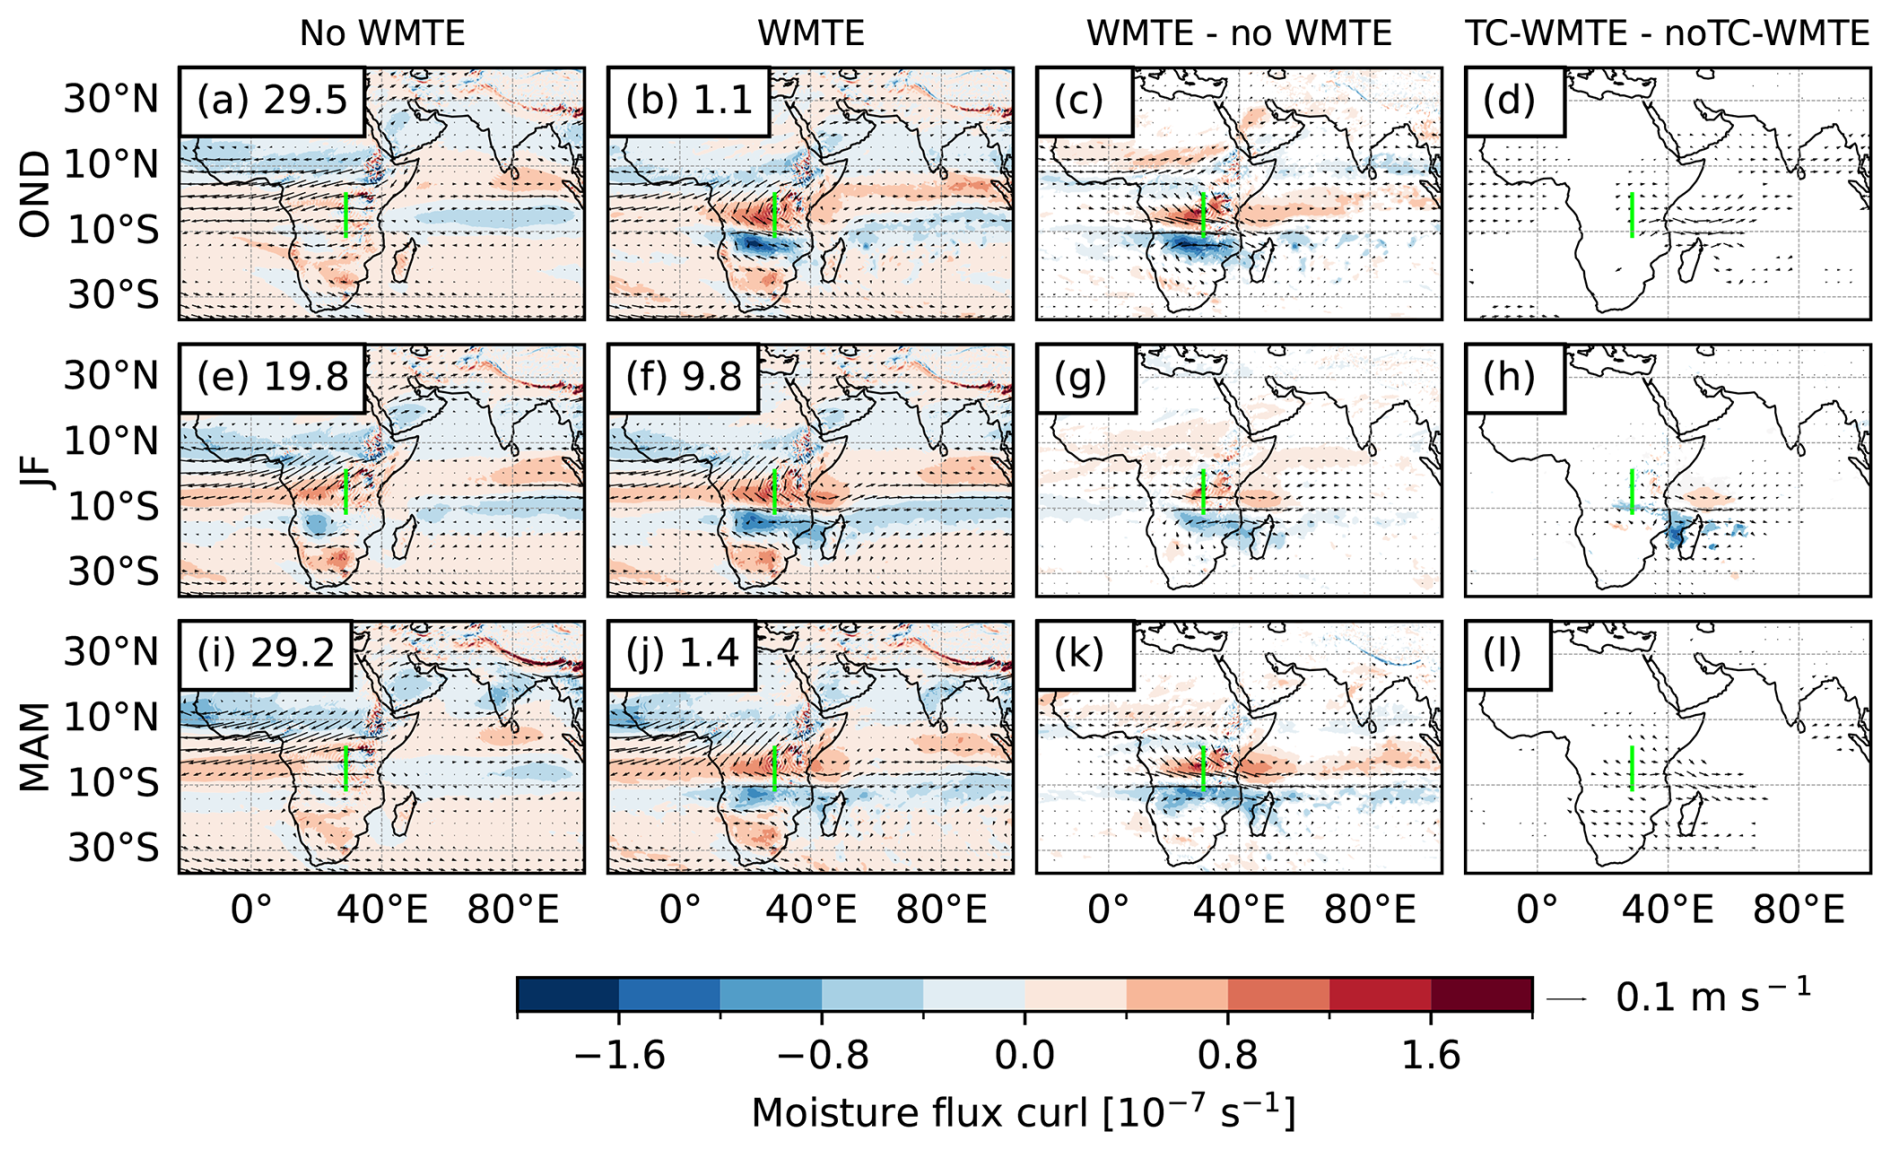
Figure 3Composites of 700 hPa moisture transport in (a–d) OND, (e–h) JF, and (i–l) MAM. (a, e, i) Days without a WMTE polygon crossing the EEA line, shown by the green line. (b, f, j) Days with a WMTE polygon crossing the EEA line. (c, g, k) Difference between the composite of days with, and without, a WMTE polygon crossing the EEA line. (d, h, l) Difference between the composite of days with a TC-WMTE, and days with a noTC-WMTE, polygon crossing the EEA line. The shading represents the curl of the moisture transport field. The numbers labelled in the first two columns show the average number of days per month in that composite. Differences are shown only where they were significant at the 95 % level using a permutation test with 1000 permutations.
On days without a WMTE (Fig. 3a, e, i), moisture transport across Eastern Africa was approximately easterly to north-easterly in all considered seasons, as expected. There was a region of anti-cyclonic rotation (positive curl in the southern hemisphere) over southern Africa north of about 20° S; and, in JF there was also a region of cyclonic rotation in the region south of 10° S. In the Indian Ocean, in both seasons there were weak westerlies east of Madagascar between the Equator and 10° S.
On days with a WMTE crossing the EEA line, the circulation patterns were similar in OND (Fig. 3b); JF (Fig. 3f) and MAM (Fig. 3j): north-easterly winds over equatorial Africa underwent sharp curvature at about 5° S, leading to strong westerlies crossing back through eastern Africa at about 10° S, and connecting to the westerlies in the Indian Ocean. All seasons, similar to Fig. 3e, show cyclonic rotation south of 10° S and anti-cyclonic rotation south of 20° S. In JF and MAM, there was also weak cyclonic rotation in the Mozambique channel.
In Fig. 3c, g, k and d, h, l, we show the difference between WMTE days and no-WMTE days, and between TC-WMTE days and noTC-WMTE days, respectively. Differences are only shown where they are significant at the 95 % confidence level using a permutation test with 1000 permutations. The generated P values were adjusted using the Benjamini/Hochberg correction (Benjamini and Hochberg, 2018) from the python function statsmodels.stats.multimodel.fdrcorrection. Compared to days without a WMTE crossing the EEA line, days with a WMTE showed significant westerly anomalies extending from the eastern Atlantic, over the Congo, and into the Indian Ocean, as well as cyclonic rotation anomalies north and south of the Equator (Fig. 3c, g, k). These anomalies were largest and had the greatest extent in OND and MAM (Fig. 3c, k).
Days with a TC-WMTE polygon crossing the EEA line showed similar patterns to those with a noTC-WMTE, but with stronger westerly moisture transport extending eastwards over the Indian Ocean (Fig. 3d, h, l). The only significant differences in curl were seen in JF, where TC-WMTE days were associated with enhanced cyclonic rotation over the Mozambique channel.
Similar patterns of anomalies occur at 850 hPa (Fig. S8), consistent with the findings of Finney et al. (2020) that low-level anomalies extended over the Congo during days with westerly moisture transport in EEA.
3.2 MJO and TCs as drivers of WMTEs
To investigate relationships between the MJO, TCs and WMTEs, we analysed the frequency of WMTEs in different MJO phases and on days with TCs present at different locations in the Indian Ocean. We begin with the MJO analysis in Fig. 4. To quantify the significance of phase dependence, we performed single-tailed Fisher's exact tests (Fisher, 1970) at the 95 % confidence level at every grid point using the function fisher_exact from the scipy.stats Python package (Virtanen et al., 2020). The null hypotheses were that WMTE occurrence during favourable/unfavourable MJO phases was the same as during inactive MJO. As in Sect. 3.1, the generated P-values were adjusted using the Benjamini/Hochberg correction (Benjamini and Hochberg, 2018) from the python function statsmodels.stats.multimodel.fdrcorrection. We tested both alternative hypotheses (an increase and a decrease in the rate), to clarify the direction of the change.
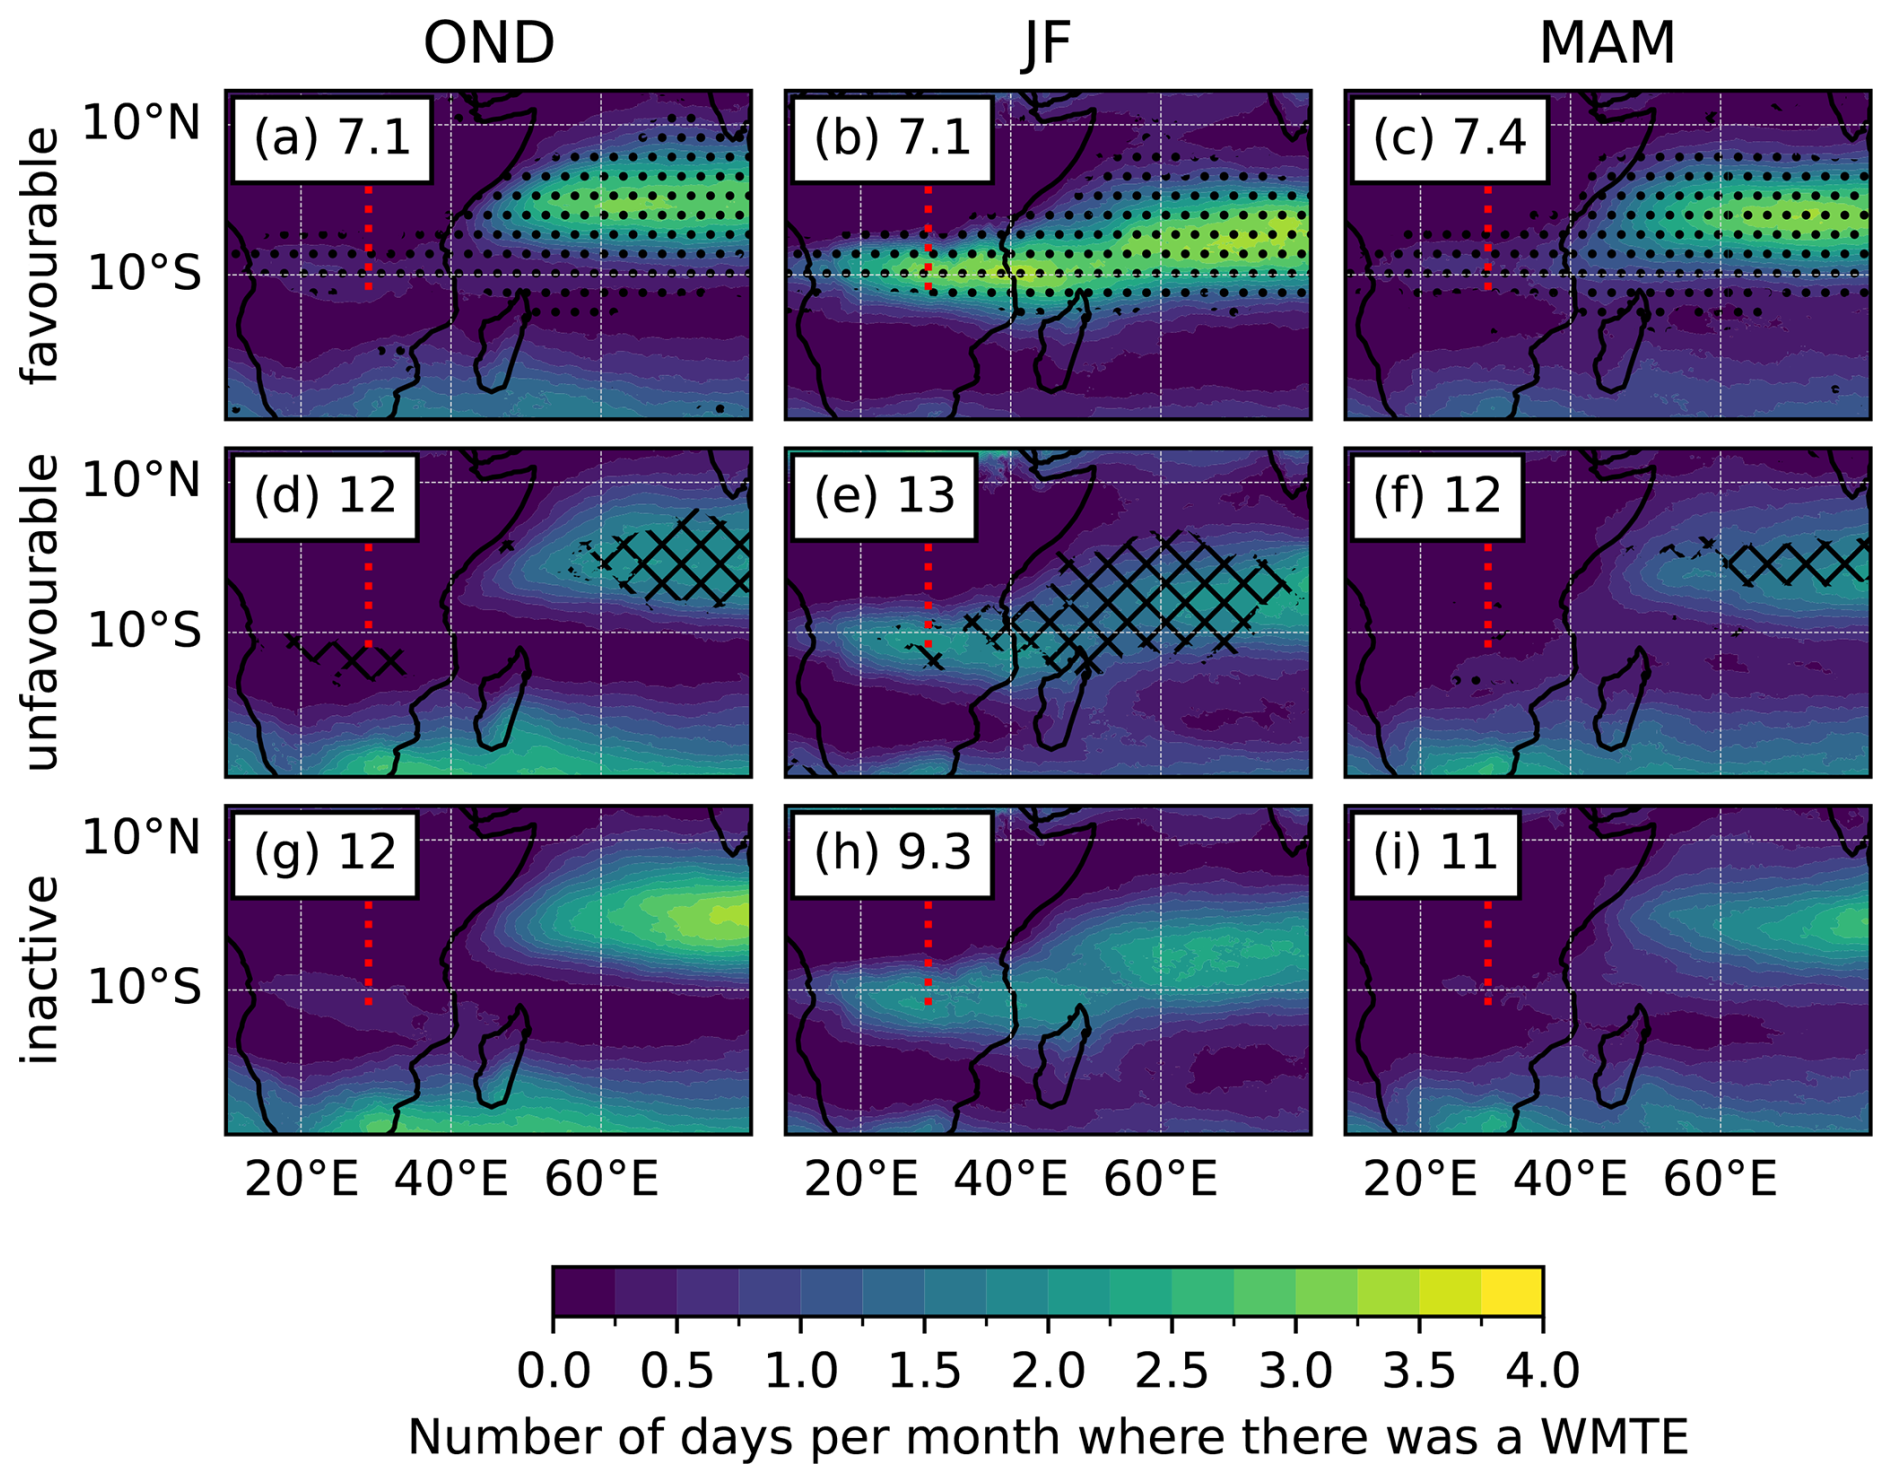
Figure 4The relationship between MJO phase and WMTE days. The number of days per month with a WMTE in each grid box during: (a, d, g) OND; (b, e, h) JF; (c, f, i) MAM; grouped by (a–c) favourable MJO phases (phases 2–4); (d–f) unfavourable MJO phases (phases 1 and 5–8); and, (g–i) inactive MJO. The number on each panel indicates the average number of days per month in the corresponding grouped MJO phase. Cross (dot) hatching shows areas where the rate of WMTE occurrence was significantly lower (higher) than the rate under inactive MJO using single-tailed Fisher exact tests at the 95 % level. The red dashed line shows the “EEA line”.
WMTE days occurred at the highest rate over eastern Africa during favourable MJO phases in JF: the region between 6 and 10° S from the Congo basin to the Indian Ocean had a WMTE present on around one third of days in these phases (Fig. 4b). This rate was significantly higher than for the days with inactive MJO, where there were around 1 to 2 WMTE days per month in that region (Fig. 4h). In the unfavourable phases, the same region also had around 1 to 2 WMTE days per month (Fig. 4e), suggesting that while WMTEs are more probable in the favourable phases, MJO phase cannot explain all the variation in WMTE frequency over eastern Africa in JF.
Similarly, in MAM and OND, WMTEs that could advect moisture from the Congo basin occurred at a significantly higher rate in favourable MJO phases (around once per month, Fig. 4a, c) compared to days with inactive MJO (less than once every 2 months, Fig. 4g, i). Such events were also extremely rare on days with unfavourable MJO phases (Fig. 4d, f); and, in OND, WMTE days actually occurred at a significantly lower rate in unfavourable phases compared to the inactive phase. These results confirm that the MJO is an important modulator of WMTE occurrence over EEA during MAM, by significantly increasing the rate in the favourable phases, and show a similar role for OND.
We also investigated whether WMTEs that affected EEA were more frequent on days with TCs present in the Indian Ocean, and whether certain TC locations enhanced or suppressed WMTEs. For this analysis, we divided our study region into 5° × 5° grid boxes and in each box calculated the fraction of the days where a TC was present while a WMTE crossed the EEA line. We controlled for the effect of MJO on TC genesis by subdividing our analysis using the same groupings as in previous sections. The presented probabilities can then be described as: P(WMTE day|TC in box & MJO phase).
Figure 5 shows the results of the analysis. Since TCs are relatively rare, there were typically only a few TC reports in each box, with the locations with the highest number of reports having around 15 to 25 TCs in each simplified MJO phase over the study period. We describe the general patterns emerging from this analysis while acknowledging that it is difficult to draw robust conclusions.
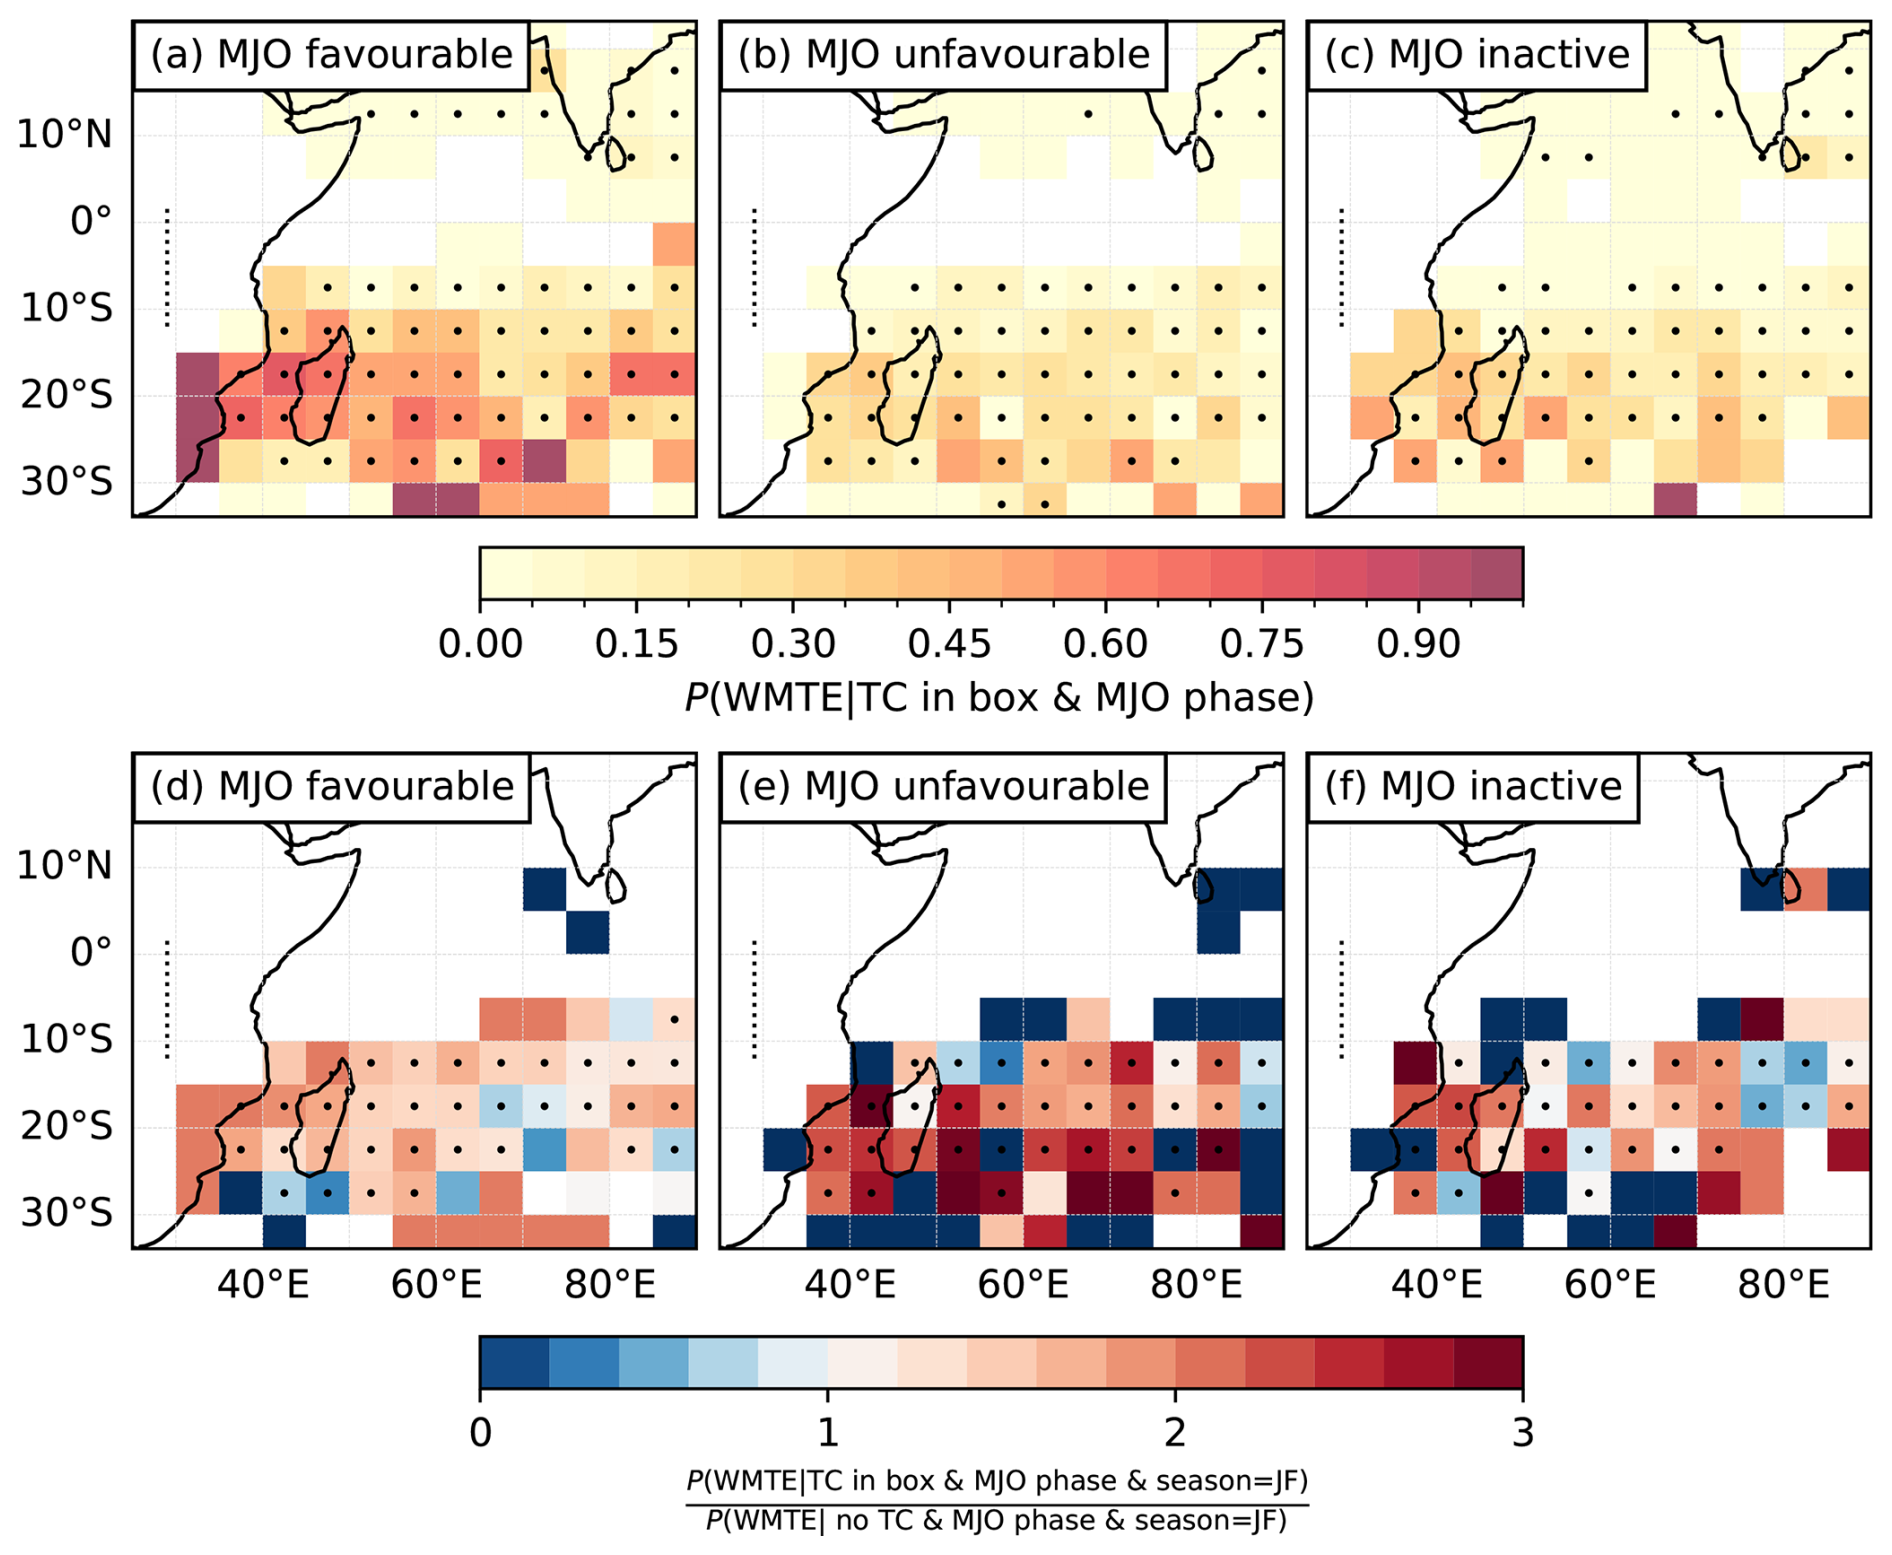
Figure 5How the presence of a TC at different locations changes the probability of a WMTE day in EEA. (a–c) The probability of a WMTE crossing the EEA line, shown by the black dashed line, given the presence of a TC in a 5° grid, for all seasons. (d–f) The relative risk in the JF season, showing for each box the ratio of the probability of a WMTE crossing the line given the presence of a TC, compared to the probability of a WMTE crossing the line when there is no TC anywhere in the Indian Ocean. Boxes with a dot have at least five TC reports in the period 1980–2022. (a, d) MJO phases 2–4, (b, e) MJO phases 5–1, (c, f) MJO inactive.
The probability of a WMTE crossing the EEA line given there was a TC present was highest for storms in the Mozambique channel during favourable MJO phases (Fig. 5a), with WMTEs occurring on roughly 80 % of days where there was a TC at that location. The probability decreased moving east in the southern Indian Ocean, but remained high at around 40 % as far as 65° E. The probabilities in the northern Indian Ocean, as well as for unfavourable phases (Fig. 5b) and inactive MJO conditions (Fig. 5c) were smaller, with a WMTE affecting EEA on ∼ 10 %–20 % of days where there was a TC present south of 15° S and west of 60° E. The locations with the highest probabilities were again the Mozambique channel with a rate of around 40 % for inactive MJO and 30 % for unfavourable phases.
In the favourable MJO phases (Fig. 5a), there was a region inland (32.5° E, 17.5–22.5° S) where (P(WMTE|box & MJO phase) was almost 1, since when TCs did penetrate this far inland, the northern section of the vortex crossed the EEA line and was always part of a TC-WMTE mask. However, this configuration occurred less than five times during the whole study period of 1980 to 2022.
To further disentangle TC impacts from MJO impacts during the peak WMTE season of JF, we also show the risk ratio, also known as relative risk (Simon, 2001), comparing the probability of a WMTE affecting EEA for a given MJO phase for two cases: when a TC was present in a given box and when no TCs were present anywhere in the Indian Ocean (Fig. 5d–f). A risk ratio greater (less) than one indicates that WMTEs affecting EEA occurred at a higher (lower) rate when there was a TC present in that box compared with when there was no TC present in the Indian Ocean, while a ratio of one indicates no effect. There were similar patterns in the rainy seasons (Figs. S9 and S10), but since there were many fewer TCs and WMTEs during these seasons, the signal was noisier and less robust. The displayed statistic is then:
For JF, the risk ratio was above 1 in the Mozambique channel in all phases: in the favourable and inactive phases, the rate at which WMTEs occurred over EEA was 1.5 to 2.5 times higher with a TC present in this location compared to without a TC in the Indian Ocean, and up to three times higher in unfavourable phases. The risk ratio was also above one at most locations in the south-west Indian Ocean east of Madagascar. The enhancement was strongest in the unfavourable phases, where the risk ratio often exceeded two, even as far east as 80° E.
Overall, the analysis suggests that during favourable MJO phases, TC presence in most of the south-west Indian Ocean is associated with an enhanced rate of WMTE occurrence over EEA, at least in JF and potentially from October to May.
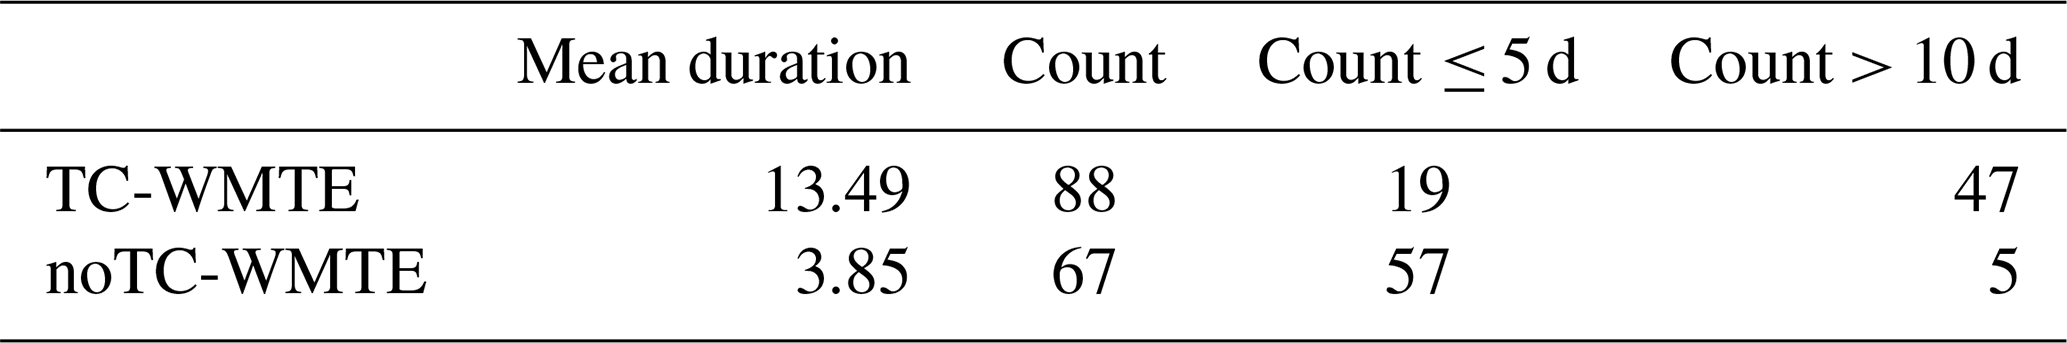
To address whether WMTEs can be triggered by TCs, we used the feature tracking to investigate how often TC-WMTEs that started in JF and intersected the EEA line at some point during their lifetime were located within 500 km of a TC, on each day of the event (Fig. S11). TC-WMTEs were affected by a TC on the first day of the event in about one third of cases, and on subsequent days in about half of cases (Fig. S11c). Thus, there is no indication that one phenomenon consistently precedes the other. However, TC-WMTEs tended to have longer lifetimes than noTC-WMTEs (Table 1), with TC-WMTEs representing 57 % of all events but 89 % of those lasting over 10 d and only 25 % of those lasting 5 d or less.
While the exact mechanisms linking TCs and WMTEs remains unclear, the enhanced likelihood and persistence of WMTEs during TC activity is consistent with case studies of anomalously wet MAM 2018 & 2020 (Kilavi et al., 2018; Gudoshava et al., 2024) and OND 2006 & 2019 (Collier et al., 2019; Wainwright et al., 2021) seasons. The finding that, over the 43-year study period, WMTEs over EEA were more common on days with a TC anywhere in the vicinity of Madagascar, is in contrast with previous work. A case study of the anomalously dry MAM 2019 (Gudoshava et al., 2024) and the long-term analysis of Finney et al. (2020) suggested that TCs to the west of Madagascar were associated with reduced precipitation in EEA. However, it is worth noting that the largest precipitation totals in EEA during MAM 2019 coincided with a TC-WMTE associated with cyclone Idai located off the northwest coast of Madagascar. Differences in the long-term patterns of WMTE, MJO and TC interactions likely arise because most WMTEs we detected were further south than the study regions of previous studies. However, they highlight the need for further work exploring spatial variations in the relationship between precipitation, westerlies, and TCs in the EEA region.
3.3 Precipitation attribution to WMTEs
Finally, we present the seasonal amounts of ERA5 precipitation and the fraction that was attributed to WMTEs from 1980 to 2022. We note that in the overlapping period where data are available in CHIRPS, IMERG, and ERA5, from 1998 to 2022, similar fractions and spatial patterns of precipitation were attributed in all three datasets (see Sect. S9).
Figure 6a–c shows the average amount of precipitation per month at each grid point during each season, contextualising the importance of precipitation attributed to WMTEs compared to other drivers within each season.
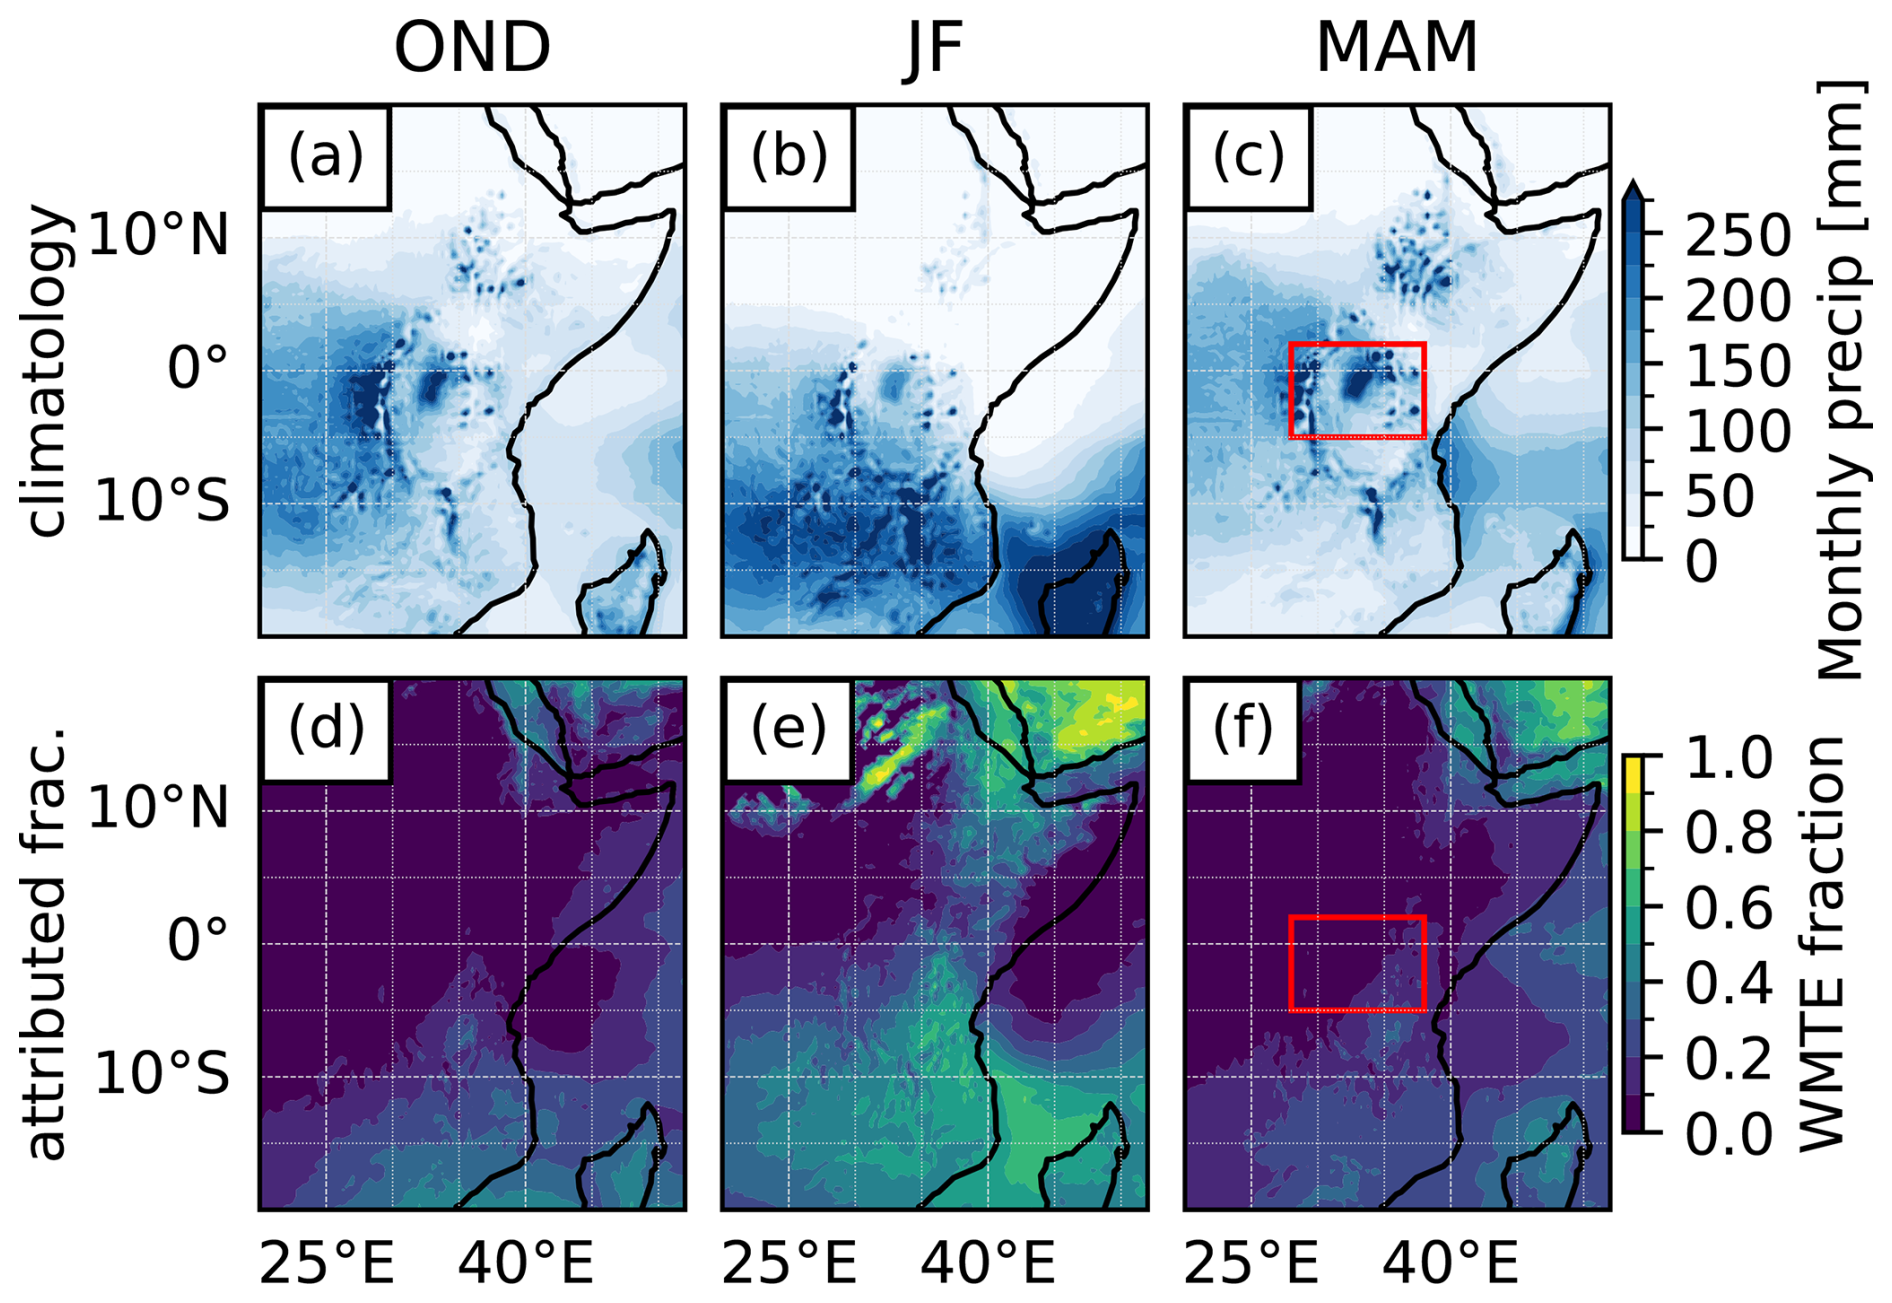
Figure 6(a–c) The ERA5 average monthly precipitation from 1980 to 2022 for the seasons of OND, JF and MAM; and, (d–f) the fraction that was attributed to WMTEs, for each season. The red box shows the extent of the region studied in Finney et al. (2020).
The main wet season south of 5° S, including most of Tanzania, occurs in JF (Fig. 6b), coinciding with the season where WMTEs were particularly prevalent over EEA (cf. Fig. 2a). During this season, up to 60 % of the precipitation was attributed to WMTEs (Fig. 6e), suggesting that moisture transport from the African interior is especially important. This result is consistent with Kebacho (2024), who showed that easterly flow during JF inhibited precipitation in Tanzania.
During MAM, ∼ 20 % of the precipitation around Lake Victoria was associated with WMTEs (Fig. 6f). Although this fraction is smaller than in JF, most locations in EEA experienced less than 1 WMTE day per month in this season (cf. Fig. 2b, f, j), highlighting that WMTEs in MAM are associated with large precipitation amounts. This finding is consistent with Finney et al. (2020), who found that days with westerly moisture transport anomalies in EEA during MAM had up to a 100 % increase in precipitation. Our methods show precipitation attributed to WMTEs is mainly concentrated in the eastern part of their study region, delineated by the red box in Fig. 6c, f. However, our results are not necessarily expected to be in agreement due to methodological differences. For example, Finney et al. (2020) detected events using area-averaged and vertically integrated vapour transport anomalies over their study region. Our approach is spatially flexible and indeed we detected most WMTEs further south than the regions considered in Finney et al. (2020) and other related work assessing the impact of westerlies on precipitation in the Lake Victoria and Rift Valley regions (e.g., Walker et al., 2020). These differences may explain why WMTEs appear less important in this region.
There are some regions where very large fractions of the precipitation were attributed during local dry seasons, such as around 15° N in JF (90 %; Fig. 6e), suggesting that precipitation at these locations outside the main wet seasons is often associated with WMTEs, but the total amounts of precipitation associated with such events are relatively small over the whole time period.
We note that in the study of Konstali et al. (2024), much of the precipitation in the tropics including eastern Africa, was unattributed. In that work, ARs were detected using moisture transport axes (Spensberger et al., 2025). This technique is well established for detecting ARs, but mostly at high latitudes, and did not detect features over EEA matching our WMTEs. It is possible that WMTEs differ from extratropical ARs in such a way that they were not detectable using the moisture transport axis method. One possibility is the typical circulation geometry around WMTEs, namely the easterly circulation reversing to westerly over central Africa (e.g. Fig. 3a–c), may mean that there is no clear axis of maximum moisture transport, even though there is strong westerly transport over EEA.
Properties of WMTEs associated with precipitation
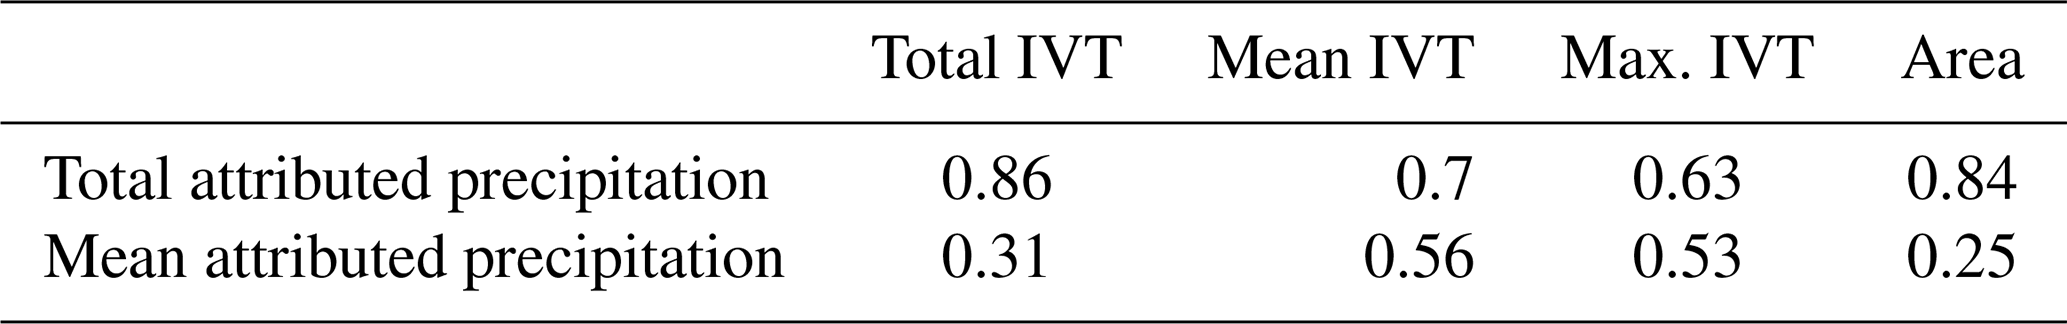
To investigate how the precipitation attributed to WMTEs related to their properties, we measured the total and the mean precipitation at every grid cell where it was attributed to a given WMTE using the Konstali et al. (2024) approach. We then calculated the Pearson correlation coefficient between attributed precipitation and WMTE properties (cf. Sect. 2.2; e.g. mean, maximum and total fluxes and IVT), to evaluate their relation. To focus our analysis on our region and feature of interest, we only considered WMTE polygons that intersected the EEA line between October and May.
This analysis only showed notable correlations between a few metrics, shown in Table 2 and as scatter plots in Fig. S15. The strongest correlations were between WMTE area and attributed precipitation (r = 0.84) and between total IVT and total attributed precipitation (r = 0.86). We note that the latter relationship is also related to the WMTE area, but reflects an additional role for the strength of moisture transport, since mean (r = 0.7) and maximum (r = 0.63) IVT were also well correlated with total attributed precipitation. The mean (r = 0.56) and maximum (r = 0.63) IVT were similarly correlated with the mean attributed precipitation. Overall, the results show that WMTEs with higher IVT were associated with more intense precipitation, and that WMTEs with larger areas and higher IVT were associated with increased total precipitation. Considering only the moisture flux at 700 hPa, the total was also well correlated with total attributed precipitation (r = 0.9), but the mean did not show strong correlations (not shown). We repeated the analysis using the total and mean precipitation only inside the WMTE mask (the most conservative precipitation attribution), and found similar results, although the correlations between both mean and maximum IVT and mean precipitation were weaker (Fig. S15).
Table 2Pearson correlation coefficients between properties of WMTE polygons affecting EEA and their precipitation impacts.
In this study, we developed the first spatially flexible and objective framework for detecting WMTEs and their impacts on EEA. We used the resulting timeseries of WMTEs to perform a multi-decadal study of their drivers and regional impacts, providing new insights including their importance. We showed that WMTEs affecting EEA exhibit a strong seasonal cycle, peaking during JF, where many locations in EEA experienced up to 6 WMTE days per month. There was also on average 1 WMTE day per month during the MAM long rains and the OND short rains. We also demonstrated the long horizontal extent of these features, with WMTEs over EEA often stretching right across the African continent and sometimes out into the western Indian Ocean. On days with a WMTE in EEA, there is a dramatic shift in the regional circulation, which remains easterly or north-easterly between the equator and about 10° N, but turns sharply to come from the west around 5° S north of the equator.
The seasonal characteristics of WMTEs were reflected in the amounts of attributed precipitation: up to 60 % of JF precipitation was attributed to WMTEs, highest over Tanzania where these months correspond to the wet season, while up to 20 % was attributed in MAM, highest around Lake Victoria and over Tanzania. We also showed that over EEA, WMTEs with larger areas and higher moisture transport inside the WMTE mask were associated with increased precipitation intensity.
Consistent with previous research, we showed that WMTEs advecting moisture from the Congo region into EEA are associated with the MJO. Between October and May, WMTEs were more common in EEA during MJO phases 2–4, but still occurred during other MJO phases and when the MJO was inactive. However, our analysis also supports a potential independent role of TCs in enhancing westerly moisture transport into EEA, which has previously only been identified on a case-study basis (e.g., Kilavi et al., 2018; Collier et al., 2019; Gudoshava et al., 2024), by potentially triggering WTMEs or by extending their lifetimes.
The exact physical nature of WMTEs remains an important open question. One possibility is that they are part of the western branch of circulation anomalies associated with the MJO (Pohl and Camberlin, 2006). This interpretation would be consistent with the fact that the seasonality of WMTEs aligns with that of the MJO, which tends to be stronger and have more organised patterns between December and March, particularly in JF (Zhang and Dong, 2004). WMTEs could also be linked to the Walker cell over the Indian Ocean, which is associated with equatorial surface westerly winds on average over the central part of the basin. However, a large body of literature has established that a strengthening of the Walker circulation (and therefore of the surface equatorial westerlies) is actually associated with a decrease in rainfall and drought conditions in EEA, due to enhanced subsidence over the region (e.g., Hastenrath et al., 2004; Hastenrath and Polzin, 2005; Hastenrath et al., 2010). Alternatively, WMTEs might result more generally from any factor(s) that induce a reversal of the zonal pressure gradient across sub-Equatorial Africa (Pohl and Camberlin, 2006; Collier et al., 2019). Potential mechanisms include cyclonic activity in the south-west Indian Ocean; the position of anomalous MJO convection; and, persistent continental lows over southern Africa during austral summer (Webster, 2019). While this discussion of physical explanations is speculative, it provides guidance for future studies on this topic.
The timeseries of WMTEs is publicly available, which we hope will facilitate further study of their long-term impacts and drivers as well as case studies of individual seasons or events. Areas for future work highlighted by this research include: (i) investigating the causality chain and exact processes linking WMTEs, TCs and MJO activity and their variability across the EEA region; (ii) assessing which TC properties, such as location and intensity, may affect their association with WMTEs; (iii) more spatially detailed analysis of how WMTE properties modulate their association with extreme precipitation in EEA; (iv) analysis of how WMTEs and their impacts on rainfall are modified by phenomena previously linked to EEA precipitation variability, such as the El Niño Southern Oscillation and the Indian Ocean Dipole (e.g., Palmer et al., 2023) and Atlantic sea surface temperatures (e.g., Ward et al., 2023); and, (v) further sensitivity analysis of how the choice of the parameters used to identify WMTEs affects the attributed EEA precipitation.
In addition to providing novel insights into WMTEs and their impacts on EEA, our work joins previous research in highlighting the importance of capturing both WMTEs and their interactions with MJO and TCs in weather models, for accurate simulations of intraseasonal precipitation variability and for improved forecasting of extremes in EEA.
The timeseries of WMTEs and attributed precipitation, as well as the code both for WMTE detection and precipitation attribution and for producing the figures in this paper, are available at https://doi.org/10.5281/zenodo.16875302 (Peal and Collier, 2025). The Dynlib software used to define the precipitation polygons is available at https://doi.org/10.5281/zenodo.4639624 (Spensberger, 2021). ERA5 data are freely available from the Copernicus Climate Change Service (C3S) Climate Data Store (https://doi.org/10.24381/cds.adbb2d47, Hersbach et al., 2023). IBTrACS tropical cyclone locations are available from https://doi.org/10.1175/2009BAMS2755.1 (Knapp et al., 2010). BOM MJO indices are available from the LDEO/IRI data library (https://iridl.ldeo.columbia.edu/SOURCES/.BoM/.MJO/.RMM/phase/index.html, last access: 6 February 2024).
The supplement related to this article is available online at https://doi.org/10.5194/wcd-6-1365-2025-supplement.
Research design: all authors; analysis and methodology: RP; funding acquisition: EC; writing: all authors
The contact author has declared that neither of the authors has any competing interests.
Publisher’s note: Copernicus Publications remains neutral with regard to jurisdictional claims made in the text, published maps, institutional affiliations, or any other geographical representation in this paper. While Copernicus Publications makes every effort to include appropriate place names, the final responsibility lies with the authors. Views expressed in the text are those of the authors and do not necessarily reflect the views of the publisher.
The authors gratefully acknowledge the scientific support and HPC resources provided by the Erlangen National High Performance Computing Center (NHR@FAU) of the Friedrich-Alexander-Universität Erlangen-Nürnberg (FAU) under the NHR project c104fa. NHR funding is provided by federal and Bavarian state authorities. NHR@FAU hardware is partially funded by the German Research Foundation (DFG) – 440719683. For open access purposes, the authors have applied a CC BY public copyright license to any author-accepted manuscript version arising from this submission. The authors thank Benjamin Pohl and one anonymous reviewer for their constructive feedback that lead to significant improvements to the paper, and the editor, Silvio Davolio.
This research was funded by the Austrian Science Fund (FWF) (grant no. P-36624, https://doi.org/10.55776/P36624). Additional support for this research project was provided by the Innsbruck Network for Weather and Climate Research (IWCR).
This paper was edited by Silvio Davolio and reviewed by Benjamin Pohl and one anonymous referee.
Benjamini, Y. and Hochberg, Y.: Controlling the False Discovery Rate: A Practical and Powerful Approach to Multiple Testing, J. Roy. Stat. Soc. B, 57, 289–300, https://doi.org/10.1111/j.2517-6161.1995.tb02031.x, 2018. a, b
Bessafi, M. and Wheeler, M. C.: Modulation of South Indian Ocean Tropical Cyclones by the Madden–Julian Oscillation and Convectively Coupled Equatorial Waves, Mon. Weather Rev., 134, 638–656, https://doi.org/10.1175/MWR3087.1, 2006. a
Beucher, S. and Lantuéjoul, C.: Use of Watersheds in Contour Detection, in: International Workshop on Image Processing: Real-time Edge and Motion Detection/Estimation, 2.1–2.12, http://cmm.ensmp.fr/~beucher/publi/watershed.pdf (last access: 3 November 2025), 1979. a
Bureau of Meteorology (BoM): Real-time Multivariate MJO (RMM) Phase Index, IRI/LDEO Climate Data Library,, https://iridl.ldeo.columbia.edu/SOURCES/.BoM/.MJO/.RMM/phase/index.html, last access: 6 February 2024. a
Camberlin, P. and Wairoto, J. G.: Intraseasonal wind anomalies related to wet and dry spells during the “long” and “short” rainy seasons in Kenya, Theor. Appl. Climatol., 58, 57–69, https://doi.org/10.1007/BF00867432, 1997. a, b
Collier, E., Sauter, T., Mölg, T., and Hardy, D.: The Influence of Tropical Cyclones on Circulation, Moisture Transport, and Snow Accumulation at Kilimanjaro During the 2006–2007 Season, J. Geophys. Res.- Atmos., 124, 6919–6928, https://doi.org/10.1029/2019JD030682, 2019. a, b, c, d, e, f
Finney, D. L., Marsham, J. H., Walker, D. P., Birch, C. E., Woodhams, B. J., Jackson, L. S., and Hardy, S.: The effect of westerlies on East African rainfall and the associated role of tropical cyclones and the Madden–Julian Oscillation, Q. J. Roy. Meteor. Soc., 146, 647–664, https://doi.org/10.1002/qj.3698, 2020. a, b, c, d, e, f, g, h, i, j, k
Fisher, R. A.: Statistical Methods for Research Workers, Oliver & Boyd, Edinburgh, 14th edn., ISBN 978-0-05-002170-5, 1970. a
Funk, C., Peterson, P., Landsfeld, M., Pedreros, D., Verdin, J., Shukla, S., Husak, G., Rowland, J., Harrison, L., Hoell, A., and Michaelsen, J.: The climate hazards infrared precipitation with stations – a new environmental record for monitoring extremes, Scientific Data, 2, 150066, https://doi.org/10.1038/sdata.2015.66, 2015. a
Guan, B. and Waliser, D. E.: Detection of atmospheric rivers: Evaluation and application of an algorithm for global studies, J. Geophys. Res.-Atmos., 120, 12514–12535, https://doi.org/10.1002/2015JD024257, 2015. a, b
Guan, B. and Waliser, D. E.: A regionally refined quarter-degree global atmospheric rivers database based on ERA5, Scientific Data, 11, 440, https://doi.org/10.1038/s41597-024-03258-4, 2024. a, b
Gudoshava, M., Nyinguro, P., Talib, J., Wainwright, C., Mwanthi, A., Hirons, L., de Andrade, F., Mutemi, J., Gitau, W., Thompson, E., Gacheru, J., Marsham, J., Endris, H. S., Woolnough, S., Segele, Z., Atheru, Z., and Artan, G.: Drivers of sub-seasonal extreme rainfall and their representation in ECMWF forecasts during the Eastern African March-to-May seasons of 2018–2020, Meteorol. Appl., 31, e70000, https://doi.org/10.1002/met.70000, 2024. a, b, c, d
Hastenrath, S. and Polzin, D.: Mechanisms of climate anomalies in the equatorial Indian Ocean, J. Geophys. Res.-Atmos., 110, https://doi.org/10.1029/2004JD004981, 2005. a
Hastenrath, S., Polzin, D., and Camberlin, P.: Exploring the predictability of the “Short Rains” at the coast of East Africa, Int. J. Climatol., 24, 1333–1343, https://doi.org/10.1002/joc.1070, 2004. a
Hastenrath, S., Polzin, D., and Mutai, C.: Diagnosing the Droughts and Floods in Equatorial East Africa during Boreal Autumn 2005–08, J. Climate, 23, 813–817, https://doi.org/10.1175/2009JCLI3094.1, 2010. a
Hersbach, H., Bell, B., Berrisford, P., Hirahara, S., Horányi, A., Muñoz-Sabater, J., Nicolas, J., Peubey, C., Radu, R., Schepers, D., Simmons, A., Soci, C., Abdalla, S., Abellan, X., Balsamo, G., Bechtold, P., Biavati, G., Bidlot, J., Bonavita, M., De Chiara, G., Dahlgren, P., Dee, D., Diamantakis, M., Dragani, R., Flemming, J., Forbes, R., Fuentes, M., Geer, A., Haimberger, L., Healy, S., Hogan, R. J., Hólm, E., Janisková, M., Keeley, S., Laloyaux, P., Lopez, P., Lupu, C., Radnoti, G., de Rosnay, P., Rozum, I., Vamborg, F., Villaume, S., and Thépaut, J.-N.: The ERA5 global reanalysis, Q. J. Roy. Meteor. Soc., 146, 1999–2049, https://doi.org/10.1002/qj.3803, 2020. a
Hersbach, H., Bell, B., Berrisford, P., Biavati, G., Horányi, A., Muñoz Sabater, J., Nicolas, J., Peubey, C., Radu, R., Rozum, I., Schepers, D., Simmons, A., Soci, C., Dee, D., and Thépaut, J.-N.: ERA5 hourly data on single levels from 1940 to present, Copernicus Climate Change Service (C3S) Climate Data Store (CDS) [data set], https://doi.org/10.24381/cds.adbb2d47, 2023. a
Ho, C.-H., Kim, J.-H., Jeong, J.-H., Kim, H.-S., and Chen, D.: Variation of tropical cyclone activity in the South Indian Ocean: El Niño–Southern Oscillation and Madden–Julian Oscillation effects, J. Geophys. Res.-Atmos., 111, https://doi.org/10.1029/2006JD007289, 2006. a
Hogan, E., Shelly, A., and Xavier, P.: The observed and modelled influence of the Madden–Julian Oscillation on East African rainfall, Meteorol. Appl., 22, 459–469, https://doi.org/10.1002/met.1475, 2015. a
Huffman, G. J., Stocker, E. F., Bolvin, D. T., Nelkin, E. J., and Tan, J.: GPM IMERG Final Precipitation L3 1 day 0.1 degree x 0.1 degree V07, Goddard Earth Sciences Data and Information Services Center (GES DISC) [data set], Greenbelt, MD, https://doi.org/10.5067/GPM/IMERGDF/DAY/07, 2023. a
Jones, B.: Kenya bears the brunt as floods devastate east Africa, https://www.theguardian.com/news/2020/may/13/kenya-bears-the-brunt-as-floods-devastate-central-africa (last access: 13 March 2025), 2020. a
Kebacho, L. L.: Climatological characteristics and interannual variability of the leading mode of eastern African precipitation in January and February, Int. J. Climatol., 44, 1371–1390, https://doi.org/10.1002/joc.8387, 2024. a, b
Kilavi, M., Macleod, D., Ambani, M., Robbins, J., Dankers, R., Graham, R., Helen, T., Salih, A., and Todd, M.: Extreme Rainfall and Flooding over Central Kenya Including Nairobi City during the Long-Rains Season 2018: Causes, Predictability, and Potential for Early Warning and Actions, Atmosphere, 9, 472, https://doi.org/10.3390/atmos9120472, 2018. a, b, c, d, e
Klein Tank, A. M. G., Zwiers, F. W., and Zhang, X.: Guidelines on Analysis of Extremes in a Changing Climate in Support of Informed Decisions for Adaptations, Technical Report WMO/TD-1500, World Meteorological Organization (WMO), https://www.ecad.eu/documents/WCDMP_72_TD_1500_en_1.pdf (last access: 3 November 2025), 2009. a
Klotzbach, P. J.: The Madden–Julian Oscillation’s Impacts on Worldwide Tropical Cyclone Activity, J. Climate, 27, 2317–2330, https://doi.org/10.1175/JCLI-D-13-00483.1, 2014. a
Knapp, K. R., Kruk, M. C., Levinson, D. H., Diamond, H. J., and Neumann, C. J.: The International Best Track Archive for Climate Stewardship (IBTrACS): Unifying Tropical Cyclone Data, B. Am. Meteorol. Soc., 91, 363–376, https://doi.org/10.1175/2009BAMS2755.1, 2010. a, b
Konstali, K., Spensberger, C., Spengler, T., and Sorteberg, A.: Global Attribution of Precipitation to Weather Features, J. Climate, 37, 1181–1196, https://doi.org/10.1175/JCLI-D-23-0293.1, 2024. a, b, c, d, e, f
Kossin, J. P., Olander, T. L., and Knapp, K. R.: Trend Analysis with a New Global Record of Tropical Cyclone Intensity, J. Climate, 26, 9960–9976, https://doi.org/10.1175/JCLI-D-13-00262.1, 2013. a
Lavers, D. A., Simmons, A., Vamborg, F., and Rodwell, M. J.: An evaluation of ERA5 precipitation for climate monitoring, Q. J. Roy. Meteor. Soc., 148, 3152–3165, https://doi.org/10.1002/qj.4351, 2022. a
Liebmann, B., Hendon, H. H., and Glick, J. D.: The Relationship Between Tropical Cyclones of the Western Pacific and Indian Oceans and the Madden-Julian Oscillation, J. Meteorol. Soc. Jpn., Ser. II, 72, 401–412, https://doi.org/10.2151/jmsj1965.72.3_401, 1994. a
Madden, R. A. and Julian, P. R.: Observations of the 40–50-Day Tropical Oscillation–A Review, Mon. Weather Rev., 122, 814–837, https://doi.org/10.1175/1520-0493(1994)122<0814:OOTDTO>2.0.CO;2, 1994. a
Mavume, A., Rydberg, L., Rouault, M., and Lutjeharms, J.: Climatology and Landfall of Tropical Cyclones in the South- West Indian Ocean, Western Indian Ocean Journal of Marine Science, 8, https://doi.org/10.4314/wiojms.v8i1.56672, 2010. a
Nakamura, K.: Equatorial westerlies over east Africa and their climatological significance, Geographical Review of Japan, 41, 359–373, https://doi.org/10.4157/grj.41.359, 1968. a
Palmer, P. I., Wainwright, C. M., Dong, B., Maidment, R. I., Wheeler, K. G., Gedney, N., Hickman, J. E., Madani, N., Folwell, S. S., Abdo, G., Allan, R. P., Black, E. C. L., Feng, L., Gudoshava, M., Haines, K., Huntingford, C., Kilavi, M., Lunt, M. F., Shaaban, A., and Turner, A. G.: Drivers and impacts of Eastern African rainfall variability, Nature Reviews Earth & Environment, 4, 254–270, https://doi.org/10.1038/s43017-023-00397-x, 2023. a
Parry, J.-E., Echeverría, D., Dekens, J., and Maitima, J.: Climate Risks, Vulnerability and Governance in Kenya: A review, United Nations Development Programme (UNDP) and International Institute for Sustainable Development (IISD), Winnipeg, Manitoba, Canada, 78 pp., https://www.iisd.org/system/files/publications/climate_risks_kenya.pdf (last access: 3 November 2025), 2012. a
Peal, R. and Collier, E.: Westerly Moisture Transport Events: A flexible framework for studying intraseasonal variability in East Africa, Version v3, Zenodo [data set], https://doi.org/10.5281/zenodo.16875302, 2025. a, b
Pohl, B. and Camberlin, P.: Influence of the Madden–Julian Oscillation on East African rainfall. I: Intraseasonal variability and regional dependency, Q. J. Roy. Meteor. Soc., 132, 2521–2539, https://doi.org/10.1256/qj.05.104, 2006. a, b, c, d, e, f
Simon, S. D.: Understanding the Odds Ratio and the Relative Risk, J. Androl., 22, 533–536, https://doi.org/10.1002/j.1939-4640.2001.tb02212.x, 2001. a
Spensberger, C.: Dynlib: A library of diagnostics, feature detection algorithms, plotting and convenience functions for dynamic meteorology, Version 1.1, Zenodo [code], https://doi.org/10.5281/zenodo.4639624, 2021. a, b
Spensberger, C., Konstali, K., and Spengler, T.: Moisture transport axes: a unifying definition for tropical moisture exports, atmospheric rivers, and warm moist intrusions, Weather Clim. Dynam., 6, 431–446, https://doi.org/10.5194/wcd-6-431-2025, 2025. a
Virtanen, P., Gommers, R., Oliphant, T. E., Haberland, M., Reddy, T., Cournapeau, D., Burovski, E., Peterson, P., Weckesser, W., Bright, J., van der Walt, S. J., Brett, M., Wilson, J., Millman, K. J., Mayorov, N., Nelson, A. R. J., Jones, E., Kern, R., Larson, E., Carey, C. J., Polat, İ., Feng, Y., Moore, E. W., VanderPlas, J., Laxalde, D., Perktold, J., Cimrman, R., Henriksen, I., Quintero, E. A., Harris, C. R., Archibald, A. M., Ribeiro, A. H., Pedregosa, F., van Mulbregt, P., and SciPy 1.0 Contributors: SciPy 1.0: Fundamental Algorithms for Scientific Computing in Python, Nature Methods, 17, 261–272, https://doi.org/10.1038/s41592-019-0686-2, 2020. a
Wainwright, C. M., Finney, D. L., Kilavi, M., Black, E., and Marsham, J. H.: Extreme rainfall in East Africa, October 2019–January 2020 and context under future climate change, Weather, 76, 26–31, https://doi.org/10.1002/wea.3824, 2021. a, b
Walker, D. P., Marsham, J. H., Birch, C. E., Scaife, A. A., and Finney, D. L.: Common Mechanism for Interannual and Decadal Variability in the East African Long Rains, Geophys. Res. Lett., 47, e2020GL089182, https://doi.org/10.1029/2020GL089182, 2020. a, b, c, d
Ward, N., Walker, D. P., Keane, R. J., Marsham, J. H., Scaife, A. A., Birch, C. E., and Maybee, B.: Predictability of the East Africa long rains through Congo zonal winds, Atmos. Sci. Lett., 24, https://doi.org/10.1002/asl.1185, 2023. a
Webster, E.: A Synoptic Climatology of Continental Tropical Low Pressure Systems over Southern Africa and Their Contribution to Rainfall over South Africa, MSc dissertation, University of Pretoria, Pretoria, South Africa, https://repository.up.ac.za/items/93d0d9c1-5e03-4d48-a034-395325b77d61 (last access: 3 November 2025), 2019. a
Wheeler, M. C. and Hendon, H. H.: An All-Season Real-Time Multivariate MJO Index: Development of an Index for Monitoring and Prediction, Mon. Weather Rev., 132, 1917–1932, https://doi.org/10.1175/1520-0493(2004)132<1917:AARMMI>2.0.CO;2, 2004. a
Wright, G.: Kenya: Floods cause widespread devastation in Nairobi, https://www.bbc.com/news/world-africa-68888110 (last access: 13 March 2025), 2024. a
Zaitchik, B. F.: Madden-Julian Oscillation impacts on tropical African precipitation, Atmos. Res., 184, 88–102, https://doi.org/10.1016/j.atmosres.2016.10.002, 2017. a
Zhang, C. and Dong, M.: Seasonality in the Madden–Julian Oscillation, J. Climate, 17, 3169–3180, https://doi.org/10.1175/1520-0442(2004)017<3169:SITMO>2.0.CO;2, 2004. a