the Creative Commons Attribution 4.0 License.
the Creative Commons Attribution 4.0 License.
 | 17 Nov 2025
QBOi El Niño–Southern Oscillation experiments: teleconnections of the QBO
Jorge L. García-Franco
Chang-Hyun Park
Mario Rodrigo
Froila M. Palmeiro
Federico Serva
Masakazu Taguchi
Kohei Yoshida
James A. Anstey
Javier García-Serrano
Seok-Woo Son
Yoshio Kawatani
Neal Butchart
Kevin Hamilton
Chih-Chieh Chen
Anne Glanville
Tobias Kerzenmacher
François Lott
Clara Orbe
Scott Osprey
Mijeong Park
Jadwiga H. Richter
Stefan Versick
Shingo Watanabe
This study investigates Quasi-Biennial Oscillation (QBO) teleconnections and their modulation by the El Niño–Southern Oscillation (ENSO) using a multi-model ensemble from the Atmospheric Processes And their Role in Climate (APARC) QBO initiative (QBOi). Analyzing observed QBO–ENSO teleconnections is challenging because it is difficult to separate the respective influences of QBO and ENSO outside the QBO region due to aliasing in the historical record. To isolate these signals, simulations were conducted with annually repeating prescribed sea-surface temperatures (SSTs) representing idealized El Niño and La Niña conditions (the QBOi EN and LN experiments, respectively), and results are compared with the QBOi control experiment (CTL) under ENSO-neutral conditions. The strength of the Holton-Tan relationship between the phase of the QBO and the strength of the polar vortex seen in observations is reproduced in fewer than three models in CTL and by one model in EN. In LN, three out of nine models reproduce the observed Holton–Tan relationship, but with less than half of the observed amplitude. In the Arctic winter climate, sudden stratospheric warmings (SSWs) occur more frequently in EN than in LN; however, unlike in observations, there is no discernible difference in SSW frequency between QBO westerly (QBO-W) and QBO easterly (QBO-E) phases. The Asia-Pacific subtropical jet (APJ) shifts significantly equatorward during QBO-W compared to QBO-E in observations, but this shift is not robust across models, regardless of ENSO phases. In the tropics, the sign and spatial pattern of the QBO precipitation response vary widely across models and experiments, indicating that any potential QBO signal is strongly modulated by the prevailing ENSO phases. Overall, the QBOi models exhibit unrealistically weak QBO wind amplitudes in the lower stratosphere, which may explain the weak polar vortex and APJ responses, as well as the weak precipitation signals in the tropics. In contrast, the QBO teleconnection with the Walker circulation during boreal summer and autumn shows consistent signals in both observations and most models. Specifically, the QBO-W phase is characterized by upper-level westerly and lower-level easterly anomalies over the Indian Ocean–Maritime Continent relative to QBO-E, although the amplitude and timing of these anomalies remain model-dependent. Notably, the influence of QBO phase on the Walker circulation appears insensitive to the ENSO phase.
- Article
(9652 KB) - Full-text XML
-
Supplement
(3009 KB) - BibTeX
- EndNote


The Quasi-Biennial Oscillation (QBO) and the El Niño–Southern Oscillation (ENSO) are the leading modes of climate variability in the tropical stratosphere and tropical troposphere, respectively. The QBO is a semi-periodic wind variation characterized by downward-propagating easterly and westerly wind regimes in the equatorial stratosphere, with an average period of approximately 28 months (Baldwin et al., 2001; Anstey et al., 2022b). It represents an important source of predictability due to its long timescale and teleconnections extending beyond the tropical stratosphere. The QBO is primarily driven by vertical momentum fluxes from upward-propagating equatorial wave activity generated by tropospheric convective systems (Lindzen and Holton, 1968; Holton and Lindzen, 1972; Plumb and McEwan, 1978).
Over the past two decades, atmospheric general circulation models (AGCMs) and Earth system models (ESMs) have increasingly included internally-generated QBOs (e.g. Butchart et al., 2018). To simulate a realistic QBO, most of these models require parameterization of unresolved gravity waves, specific treatments of parameterized and/or resolved convection, high horizontal and vertical resolution, and weak implicit and explicit grid-scale dissipation (Anstey et al., 2022b). Although the QBO is primarily an equatorial stratospheric phenomenon, it influences the climate system beyond this region through teleconnections. A deeper understanding of QBO teleconnections – including extratropical impacts, tropical and subtropical effects, and their interactions with other phenomena – can be achieved by intercomparing state-of-the-art, stratosphere-resolving, models that simulate QBO-like oscillations in the tropical stratosphere.
The QBO influences the Northern Hemisphere (NH) winter stratosphere by modulating planetary-scale waves that affect the stratospheric polar vortex. The observed statistical relationship between QBO phase and polar vortex strength is commonly referred to as the Holton–Tan effect (Holton and Tan, 1980, 1982). When the QBO in the lower stratosphere (∼ 50 hPa) is in its westerly phase (QBO-W), the polar vortex tends to be stronger and colder, and a reducing likelihood of sudden stratospheric warming (SSW) events. Conversely, during the easterly phase (QBO-E), the stratospheric polar vortex is weaker, warmer, and more disturbed. The mechanisms underlying this effect have been extensively investigated in both observational and modeling studies. Holton and Tan (1980) proposed that this effect results from a latitudinal shift of the zero-wind line, which acts as an effective waveguide for upward-propagating planetary waves in the NH winter stratosphere (Holton and Tan, 1980; Baldwin et al., 2001; Anstey and Shepherd, 2014; Watson and Gray, 2014; Gray et al., 2018; Lu et al., 2020; Anstey et al., 2022b). A related mechanism suggests that planetary waves interact with zonal wind anomalies associated with the QBO-induced secondary circulation, without requiring wave breaking induced by the zero-wind-line (Ruzmaikin et al., 2005; Naoe and Shibata, 2010; Garfinkel et al., 2012b; White et al., 2015; Naoe and Yoshida, 2019; Rao et al., 2020b; Anstey et al., 2022b).
A tropospheric pathway of the Holton–Tan relationship has also been proposed. In this mechanism, Rossby waves propagate from regions of tropical convection to higher latitudes, including the Aleutian low-pressure region, and disturb the stratospheric polar vortex through the subsequent upward wave activity flux into the stratosphere, which is modulated by tropospheric processes (Yamazaki et al., 2020). Although the relative importance of these mechanisms remains somewhat unclear, these teleconnections may enhance the predictability of the extratropical stratosphere on sub-seasonal time scales due to the QBO's long period (Boer and Hamilton, 2008; Scaife et al., 2014; Garfinkel et al., 2018).
It has also been suggested that the QBO affects the tropical troposphere by modifying deep convective activity and vertical wind shear near the tropopause (Gray et al., 1992; Collimore et al., 2003). The QBO-induced zonal-mean meridional circulation modulates the vertical temperature profile in the equatorial upper troposphere–lower stratosphere (UTLS), producing a QBO signature in tropical tropopause temperature and wind. Although the notion of a “direct effect” of the QBO on the tropical and subtropical UTLS had been discussed in the literature since the 1960s, it was not widely accepted until the early 2000s (Hitchman et al., 2021). A possible downward influence of the QBO on the tropical troposphere has also been found in the Madden–Julian Oscillation (MJO) (Yoo and Son, 2016; Marshall et al., 2017; Son et al., 2017; Martin et al., 2021; Elsbury et al., 2025). For more recent reviews of stratosphere–troposphere coupling in the tropics, see Haynes et al. (2021) and Hitchman et al. (2021).
Observational and modeling studies suggest that the interannual variability of tropical precipitation is, at least partially, modulated by the phase of the QBO (Collimore et al., 2003; Liess and Geller, 2012; Gray et al., 2018). In observations, the QBO signal in tropical precipitation shows zonally asymmetric patterns, for example, wetter conditions in the eastern Pacific Intertropical Convergence Zone (ITCZ) during QBO-W compared to QBO-E (Gray et al., 2018; Serva et al., 2022). The similarity between QBO and ENSO signals in observations may result from the higher number of El Niño events coinciding with QBO-W than with QBO-E (García-Franco et al., 2022). Serva et al. (2022) analyzed the simulated precipitation in Atmospheric Model Intercomparison Project (AMIP)-type simulations from the first phase of Quasi-Biennial Oscillation initiative (QBOi) experiments (Butchart et al., 2018). They found that those simulations have a limited ability to reproduce the observed modulation of the tropical tropopause-level processes, even after removing variability associated with the ENSO index. In these sea-surface temperature (SST)-forced, free-running simulations, the east Pacific ITCZ precipitation response to the QBO, which resembles the observed pattern, is reproduced by many, though not all, models (Fig. 11 of Serva et al., 2022). However, the simulated QBO signal in the tropopause is generally underestimated or unrealistic in these models.
In addition, Rao et al. (2020b) explored three dynamical pathways – through the stratosphere polar vortex, North Pacific via subtropical downward arching zonal winds, and tropical convection – for QBO impacts on the troposphere, using state-of-the-art CMIP5/6 models with a spontaneously generated QBO. They found that more than half of the models could reproduce at least one of the three pathways, but few models could reproduce all three pathways. Using similar SST-forced, as well as coupled ocean–atmosphere simulations with a single model, García-Franco et al. (2023) suggested that the simulated precipitation response to the QBO strongly depends on the state of ENSO and the Walker circulation, the strength of the QBO, and ocean–atmosphere coupling.
In the subtropics, the QBO has a direct influence on the subtropical jet through its secondary circulation. Observational studies have indicated that the QBO can affect the subtropical jet variability, particularly in the Pacific sector (e.g. Garfinkel and Hartmann, 2011a, b). During QBO-W, a horseshoe-shaped zonal wind anomaly forms in the UTLS associated with an equatorward shift of the Asian-Pacific jet (APJ) (Crooks and Gray, 2005; Simpson et al., 2009) This response is evident even near the surface over East Asian (Park et al., 2022; Park and Son, 2022). A study using a QBO-resolving multi-model ensemble found no clear evidence of a QBO teleconnection to the subtropical Pacific-sector jet (Anstey et al., 2022c), whereas another multi-model study found that seven out of 17 models captured this effect (Rao et al., 2020b).
ENSO teleconnections to the NH winter stratosphere have been widely reported in numerous observational studies (Van Loon and Labitzke, 1987; Camp and Tung, 2007; Garfinkel and Hartmann, 2007; Song and Son, 2018) and modeling studies (Taguchi and Hartmann, 2006; García-Serrano et al., 2017; Palmeiro et al., 2017, 2023; Trascasa-Castro et al., 2019; Weinberger et al., 2019). During El Niño winters, the polar vortex tends to be weaker, and the polar region becomes warmer compared to ENSO-neutral winters, whereas strong La Niña winters are associated with a weakening of the Aleutian low and destructive linear interference with the climatological wave pattern (Iza et al., 2016). Observations indicate that SSW events occur more frequently during both El Niño and La Niña winters than during ENSO-neutral winters (Butler and Polvani, 2011; Garfinkel et al., 2012a). However, sampling errors may arise due to the relatively short observational record (Domeisen et al., 2019), and the reported increase in SSWs during La Niña winters is sensitive to the definition of SSWs used (Song and Son, 2018). The observed relationships between ENSO and SSWs were often not reproduced in models. Models typically simulate ENSO events and teleconnections that appear considerably more linear than the observational evidence suggests (Domeisen et al., 2019). For example, simulations with a chemistry-climate model showed no indication of nonlinearities between El Niño and La Niña, and SSW frequencies for both phases were found to be similar (Weinberger et al., 2019). Trascasa-Castro et al. (2019) investigated the effect of ENSO amplitude variations on European winter climate using idealized SST anomalies and found no evidence of saturation in the stratospheric pathway under strong El Niño forcing. Systematic model biases in atmospheric winds and temperatures likely affect the representation of the ENSO–SSW teleconnection (Tyrrell et al., 2022).
ENSO exerts significant impacts on global atmospheric circulation, and QBO teleconnections may also be modulated by El Niño and La Niña. The QBO itself is affected by ENSO, with weaker QBO amplitude and faster QBO phase propagation under El Niño than under La Niña conditions (Taguchi, 2010a). Previous studies investigating the joint effects of QBO and ENSO on winter polar vortex variability have suggested that their interactions are nonlinear, with the Holton–Tan relationship being significant during La Niña but much weaker during El Niño (Wei et al., 2007; Garfinkel and Hartmann, 2008; Calvo et al., 2009; Richter et al., 2011; Hansen et al., 2016). A recent observational study (Kumar et al., 2022) examined the combined effects of the QBO and ENSO on the extratropical winter troposphere during 1979–2018. They found that during La Niña, QBO signals in the polar vortex were amplified, and the polar vortex and subtropical jet were enhanced under QBO-W. During El Niño, a stronger subtropical jet and a warmer polar vortex were present under QBO-W. Ma et al. (2023) assessed the synergistic effects of the QBO and ENSO on the North Atlantic winter atmospheric circulation using model output and reanalysis data, showing that their nonlinear combined effect on North Atlantic surface pressure anomalies arises from different pathways depending on the QBO and ENSO combinations. In contrast, Walsh et al. (2022) demonstrated that the polar vortex weakens more strongly when El Niño coincides with QBO-E than would be expected from the sum of their individual effects. However, there remains no clear consensus on the nature of nonlinearity in QBO–ENSO teleconnections within the extratropical circulation of the NH winter stratosphere.
In the tropical troposphere, QBO and ENSO teleconnections remain less understood than those in the extratropics. Only a limited number of studies have analyzed tropical tropospheric QBO teleconnections using models capable of simulating the QBO (Rao et al., 2020b; García-Franco et al., 2022, 2023; Serva et al., 2022). As noted by García-Franco et al. (2022, 2023), the observational record is likely too short to separate QBO teleconnections in the tropical troposphere from the strong influence of ENSO, since El Niño winters often coincide with the westerly phase of the QBO.
The present study aims to reexamine QBO teleconnections to both the extratropics and tropics and address combined QBO–ENSO influences using a new dataset of idealized ENSO experiments. Model experiments that can separate the influences of QBO and ENSO on the extratropical and tropical troposphere outside the QBO region are valuable tools for investigating the modulation of QBO teleconnections by ENSO. To isolate the QBO teleconnections from ENSO influences, we conduct model integrations with annually repeating prescribed SSTs representative of typical El Niño and La Niña conditions, thereby removing ENSO diversity from consideration.
The QBOi, an international project supported by the World Climate Research Programme (WCRP) core project Atmospheric Processes And their Role in Climate (APARC), has focused on assessing internally generated QBOs in climate models and improving model simulation of a realistic QBO (Butchart et al., 2018; Anstey et al., 2022a, c; Bushell et al., 2022; Richter et al., 2022). To investigate QBO and ENSO teleconnections and their mutual interactions, QBOi has coordinated additional experiments building on phase-1 experiments, referred to here as the “QBOiENSO” experiments. These experiments employ participating QBOi AGCMs and ESMs forced by prescribed “perpetual El Niño” and “perpetual La Niña” SSTs (Kawatani et al., 2025).
In this paper, we have examined QBO teleconnections modulated by ENSO and evaluate their robustness using a multi-model ensemble of QBO-resolving models that have run the QBOiENSO experiments We compare these results with those from the QBOi phase-1 “Experiment 2”, which represents the control case of ENSO-neutral conditions. Further details of the QBOiENSO experimental design are provided in Kawatani et al. (2025). The structure of this paper is as follows: Sect. 2 describes the datasets of the QBOiENSO experiments and observations, along with the analytical methods employed. Section 3 characterizes the combined effects of QBO–ENSO teleconnections on the polar winter stratosphere (Holton–Tan relationship). Sections 4 and 5 present the subtropical and tropical impacts of the QBO modified by ENSO, respectively. Finally, Sect. 6 provides more discussion and a summary of our findings.
We use nine AGCMs and ESMs participating in the QBOi project and conduct three experiments. The first one is the QBOi Experiment 2 using a climatological annual cycle of SST and sea ice conditions (Butchart et al., 2018). We hereafter refer to it as the control (CTL) experiment. The other two experiments are the QBOiENSO experiments, QBOiElNino and QBOiLaNina (Kawatani et al., 2025). They are time-slice experiments consistent with the QBOi Experiment 2 design but with prescribed “perpetual El Niño” and “perpetual La Niña” SST anomalies. They are referred to hereafter as the EN and LN experiments, respectively. The models that performed the CTL, EN, and LN experiments are EC-EARTH3.3 (hereafter EC-EARTH for short), ECHAM5sh, EMAC, GISS-E2-2G (GISS), LMDz6 (LMDz), MIROC-AGCM-LL (MIROC-AGCM), MIROC-ESM, MRI-ESM2.0, and CESM1(WACCM5-110L) (WACCM for short). Their characteristics have been described in Butchart et al. (2018) and Kawatani et al. (2025). MRI-ESM2.0 (Yukimoto et al., 2019) is an updated version of the model documented in Butchart et al. (2018), and it includes changes aimed at improving the modeled QBO (Naoe and Yoshida, 2019). The lengths of model integrations for each of the three experiments are presented in Table 1. Due to data availability issues, EMAC is not included in the results presented in Sects. 4 and 5.1 below.
Table 1Length of the model integrations.
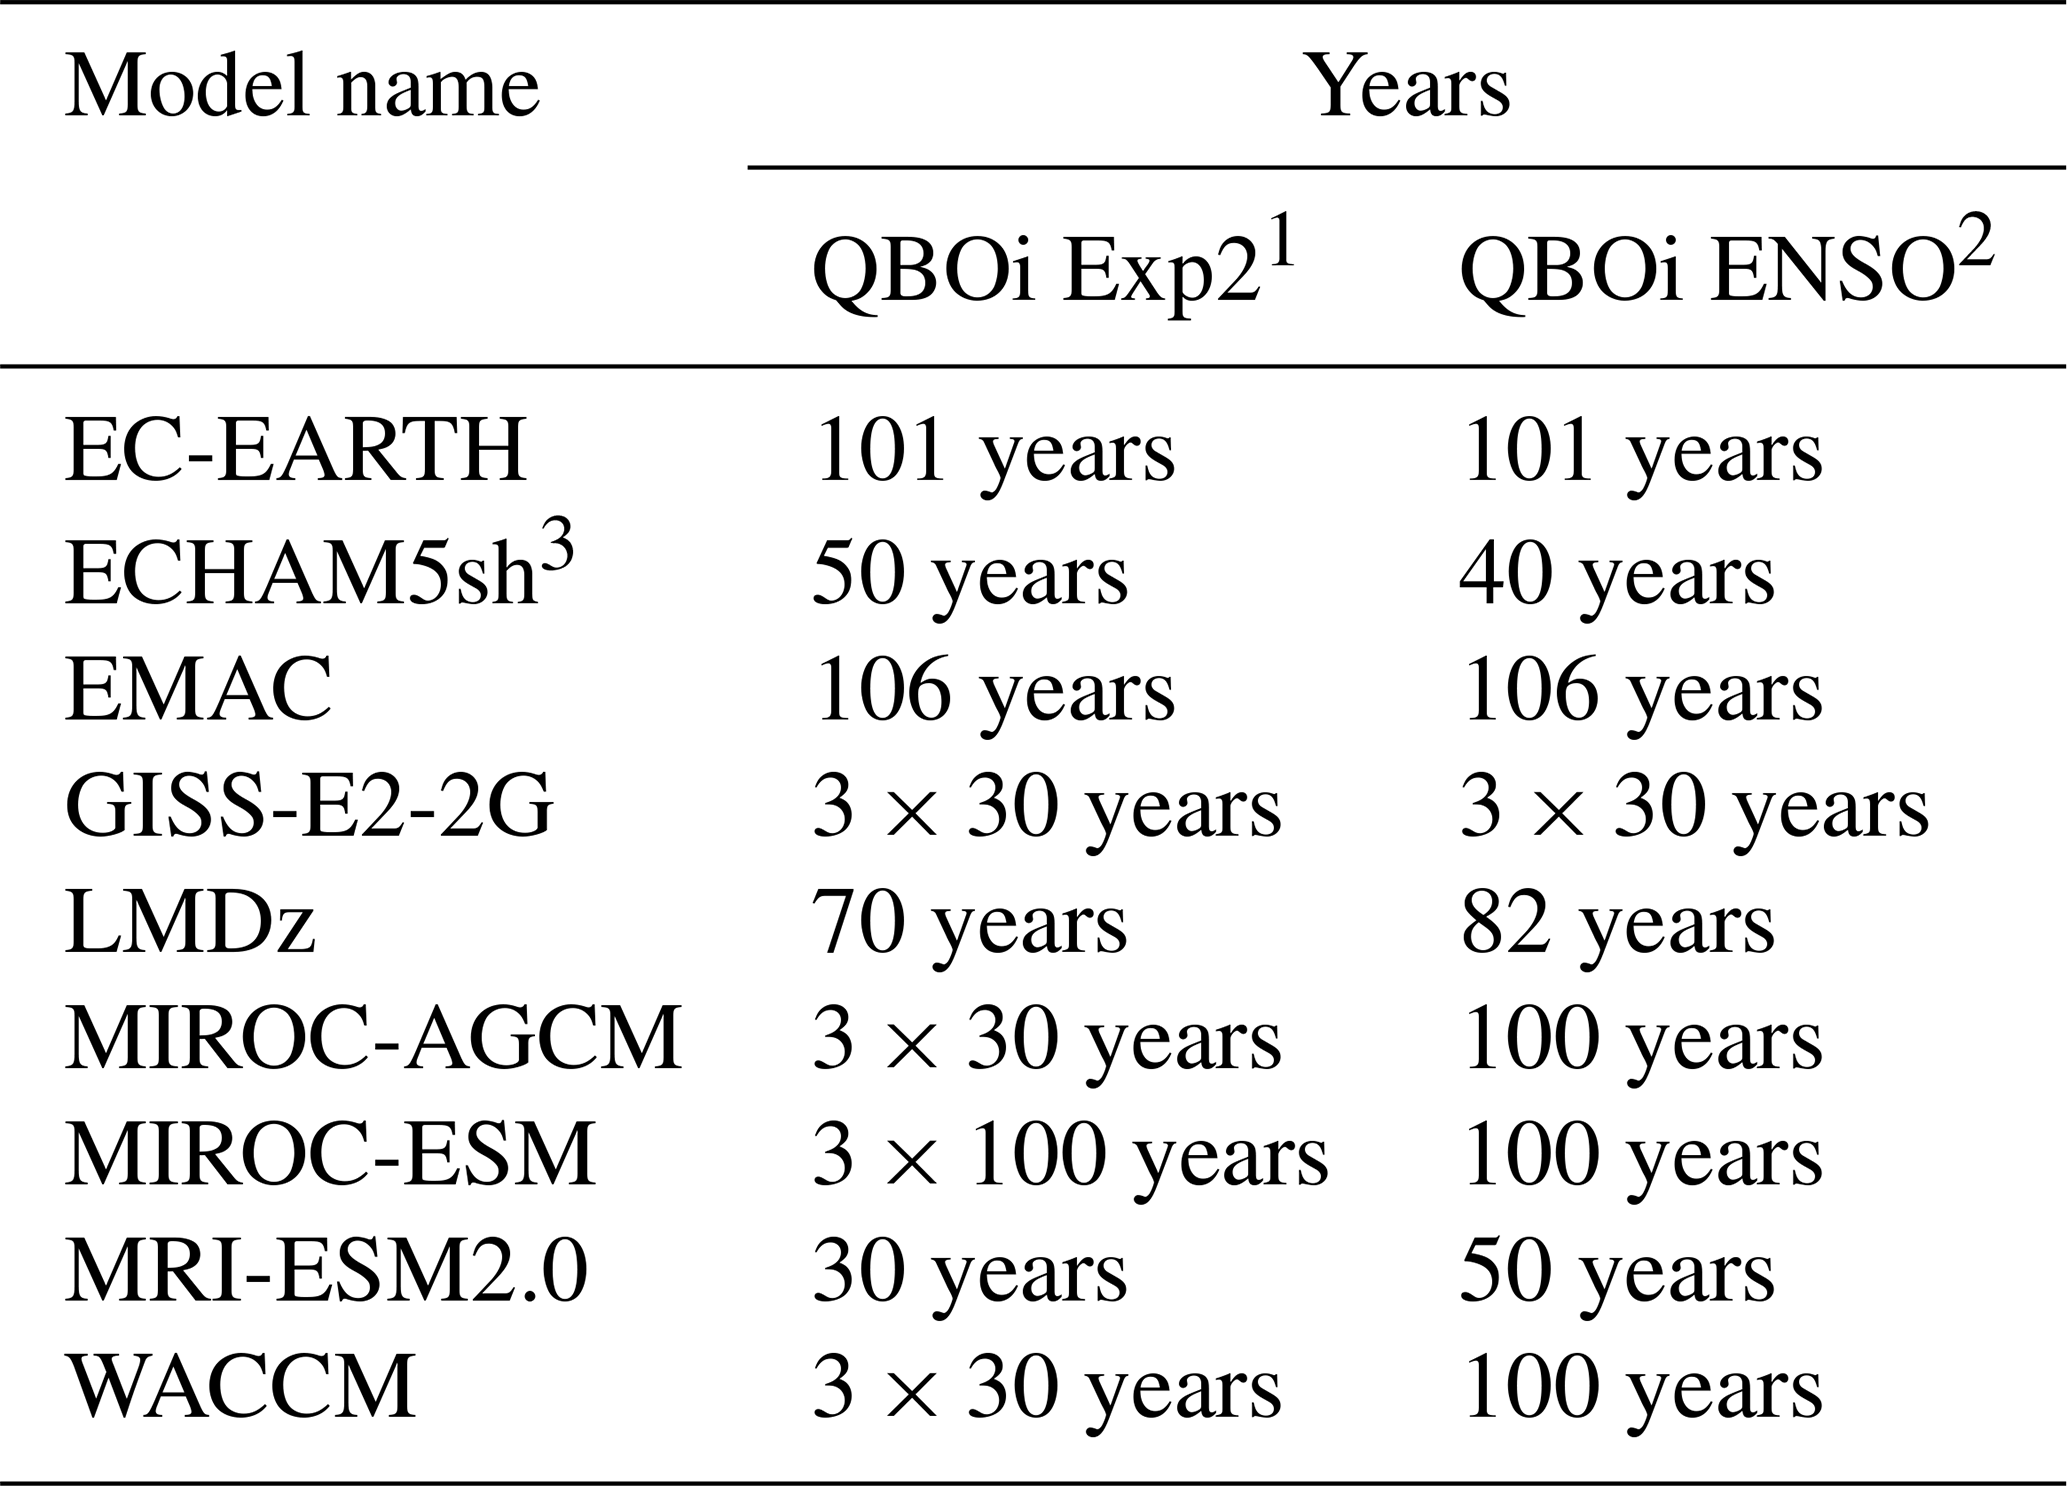
1 QBOi Experiment 2 (or CTL experiment). 2 QBOi ENSO experiments (QBOiElNino and QBOiLaNina experiments). 3 Only the realization labelled r2i1p1 is used in ECHAM5sh.
Observed teleconnections are quantified using a modern reanalysis dataset, the European Centre for Medium-Range Weather Forecasts (ECMWF) fifth generation atmospheric reanalysis (ERA5; Hersbach et al., 2020) over 1959–2021. The representation of the QBO in ERA5 as compared to other reanalyses is evaluated by Pahlavan et al. (2021) and Naoe et al. (2025). Observed precipitation is evaluated using the Global Precipitation Climatology Project (GPCP; Adler et al., 2003, 2016) dataset over 1979–2022. The design of QBOiENSO experiments used the Japan Meteorological Agency's (JMA) defined NINO.3 index (https://ds.data.jma.go.jp/tcc/tcc/products/elnino/index/index.html, last access: 25 February 2025), and so the classification of ENSO phases is based on this index. We note that the QBOiENSO experiments are idealized; therefore, we mostly rely on observation-based datasets to determine whether the model responses are at least qualitatively in agreement with the (short) observational record.
To determine if observed teleconnections are well represented in the model runs, the models and observations are compared by applying the same QBO phase definitions to the models that are optimal for the observed teleconnections. Here, we use “standard” indices (e.g., 50 hPa equatorial wind for the QBO), without adjusting them on a model-by-model basis, for all analyses presented in Sects. 3, 4 and 5.1. This facilitates comparison with other works. As noted by Anstey et al. (2022c), different QBO indices can maximize the response of different teleconnections (e.g. Gray et al., 2018). Thus, making these choices can account for the diversity of QBO signals (tropical convection, Walker circulation, subtropical jet response, extratropical basic-state zonal-mean flow for the Holton–Tan effect, etc.), which may lead to variations in the diagnosed QBO teleconnections. Zonal wind biases need to be carefully considered when defining the QBO phases in model outputs, as noted by Serva et al. (2022). Here, QBO phases are identified when the deseasonalized QBO-W and QBO-E averaged over 5° S–5° N (weighted by cosine of latitude) exceeds a given threshold value at selected pressure levels. Specifically, QBO-W and QBO-E are classified from the December-January-February (DJF) zonal wind at 50 hPa using > 0.5σ (standard deviation) and < −0.5σ in Sect. 3.1 (Figs. 2 and 3), using ≥ 0 and < 0 m s−1 in Sect. 3.2 (Fig. 5), using ≥ 2 and ≤ −2 m s−1 in Sect. 5.1 (Figs. 8, 9, and 10), and from the February-March zonal wind at 70 hPa using > 0.5σ and < −0.5σ in Sect. 4 (Figs. 6 and 7). In Sect. 5.2, the strongest signal in each model is identified, considering model diversity and biases in the simulated QBOs and tropical convection, from May to November with QBO definitions provided in the legend of Figs. 11 and 12; the analysis is summarized in Fig. 13. This approach is used to highlight the model dependency and seasonality of the QBO signal on the Walker circulation. Using a common definition for QBO phases in terms of the pressure level and season provides similar but weaker results (see Figs. S9, S10 and S11 in the Supplement using the summer zonal-mean zonal wind at 70 hPa).
The ENSO composites in observations are obtained for individual seasons in Sects. 3, 4, and 5.2, while for individual months in Sect. 5.1. In Sect. 5.2, the Bonferroni correction, as described by Holm (1979), is used for the two-sided t-test when the QBO phase is not defined using the preferred 70 hPa level during June-July-August (JJA). In this method, the significance level of the statistical test α is adjusted by dividing it by m, the number of tests performed, becoming more restrictive by increasing the confidence level. For instance, if the QBO definition is modified by season only, m=2; if it is modified by both season and vertical level, m = 3. Accordingly, , where α = 0.025 (the 5 % significance level for a two-sided test), and α′ denotes the adjusted threshold; implying that the corresponding p-value must be smaller to reject the null hypothesis.
This section investigates the extratropical pathway of the QBO teleconnection modulated by ENSO, with a focus on the Holton–Tan effect and SSW statistics. A previous study on QBO teleconnections using a multi-model ensemble of QBO-resolving models (Anstey et al., 2022c) found that QBOi models underestimated the polar vortex response to the equatorial zonal wind at 50 hPa compared with reanalyses. They suggested that these weak responses were likely due to model biases, such as systematically weak QBO amplitudes near 50 hPa, which affected the QBO teleconnection. Since most of the models used here for the EN and LN experiments are the same as those analyzed by Anstey et al. (2022c) in their CTL experiments, the EN and LN experiments may similarly underestimate the polar vortex response to the QBO.
3.1 Holton–Tan relationship
Figure 1 shows the DJF correlation coefficient between the 50 hPa equatorial zonal wind at 5° S–5° N and the polar vortex strength at different altitudes in the CTL, EN, and LN experiments, together with ENSO-neutral, El Niño, and La Niña winters from ERA5 reanalysis. In ERA5, correlations maximize over a deep layer of the polar vortex, reaching 0.63 at 15 hPa during La Niña and 0.40 during El Niño. The correlation during ENSO-neutral winters is slightly stronger than that during El Niño winters. The uncertainty range (horizontal bars) represents the 5 %–95 % confidence intervals of correlation coefficients derived from bootstrap resampling. For La Niña, the confidence intervals exclude zero in the stratosphere, whereas for El Niño they are close to zero at many altitudes, indicating substantial uncertainty in the strength of the correlation during El Niño and ENSO-neutral winters.
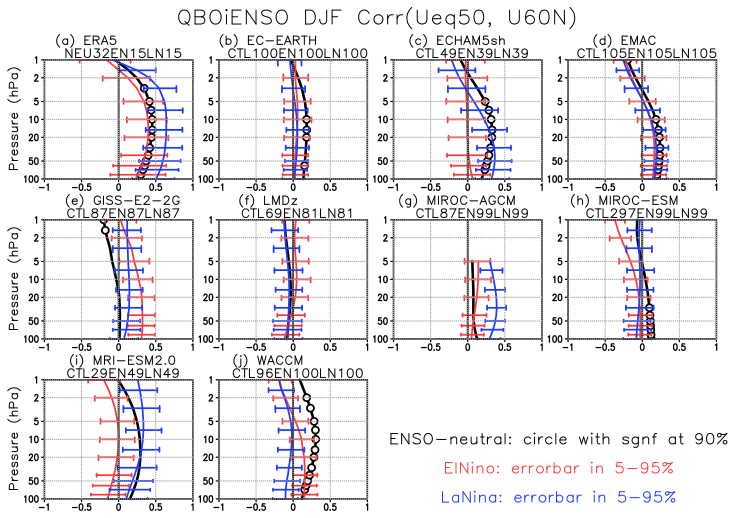
Figure 1Vertical profiles of the correlation coefficient between the QBO zonal wind at 50 hPa, averaged over 5° S–5° N, and the polar vortex zonal wind at 55–65° N during DJF in CTL (black), EN (red), and LN (blue) experiments, as well as for ENSO-neutral (black), El Niño (red), and La Niña (blue) winters in ERA5. Circles denote statistical significance at the 90 % level for the CTL/ENSO-neutral, and horizontal bars indicate the 5 %–95 % confidence interval, for EN/El Niño and LN/La Niña, calculated using a bootstrap method with 1000 times repetition. The number of winters available for each model run and experiment (ENSO phase) is shown in the upper panel. For example, “NEU32EN15LN15” in the ERA5 panel indicates 32 ENSO-neutral, 15 El Niño, and 15 La Niña winters, respectively.
Most model correlations exhibit smaller uncertainties than ERA5 due to larger sample sizes. Models such as ECHAM5sh, EMAC, EC-EARTH, MIROC-ESM, MRI-ESM2.0, and WACCM display positive correlation profiles in CTL, although these correlations are weaker than in ERA5. Most models do not show significant correlations in EN; only four models (MRI-ESM2.0, ECHAM5sh, EMAC, and MIROC-AGCM) out of nine reproduce observed positive correlations with confidence intervals excluding zero at certain altitudes. Kawatani et al. (2025, their Fig. 2) presented simple time–height cross-sections of monthly zonal-mean equatorial zonal winds in EN and LN, showing that the QBO in ECHAM5sh in EN was irregular, with stalling in the downward propagation of both easterlies and westerlies. They also showed that the QBOs in GISS and LMDz in LN were more irregular, with westerly phases sometimes failing to propagate into the lower stratosphere. These results indicate that most models exhibit weak positive correlations consistent in sign with ERA5, but in most cases these correlations are not statistically significant. This suggests that inter-model differences in the QBO–polar vortex relationship, or differences between experiments within the same model, may not be clearly distinguishable.
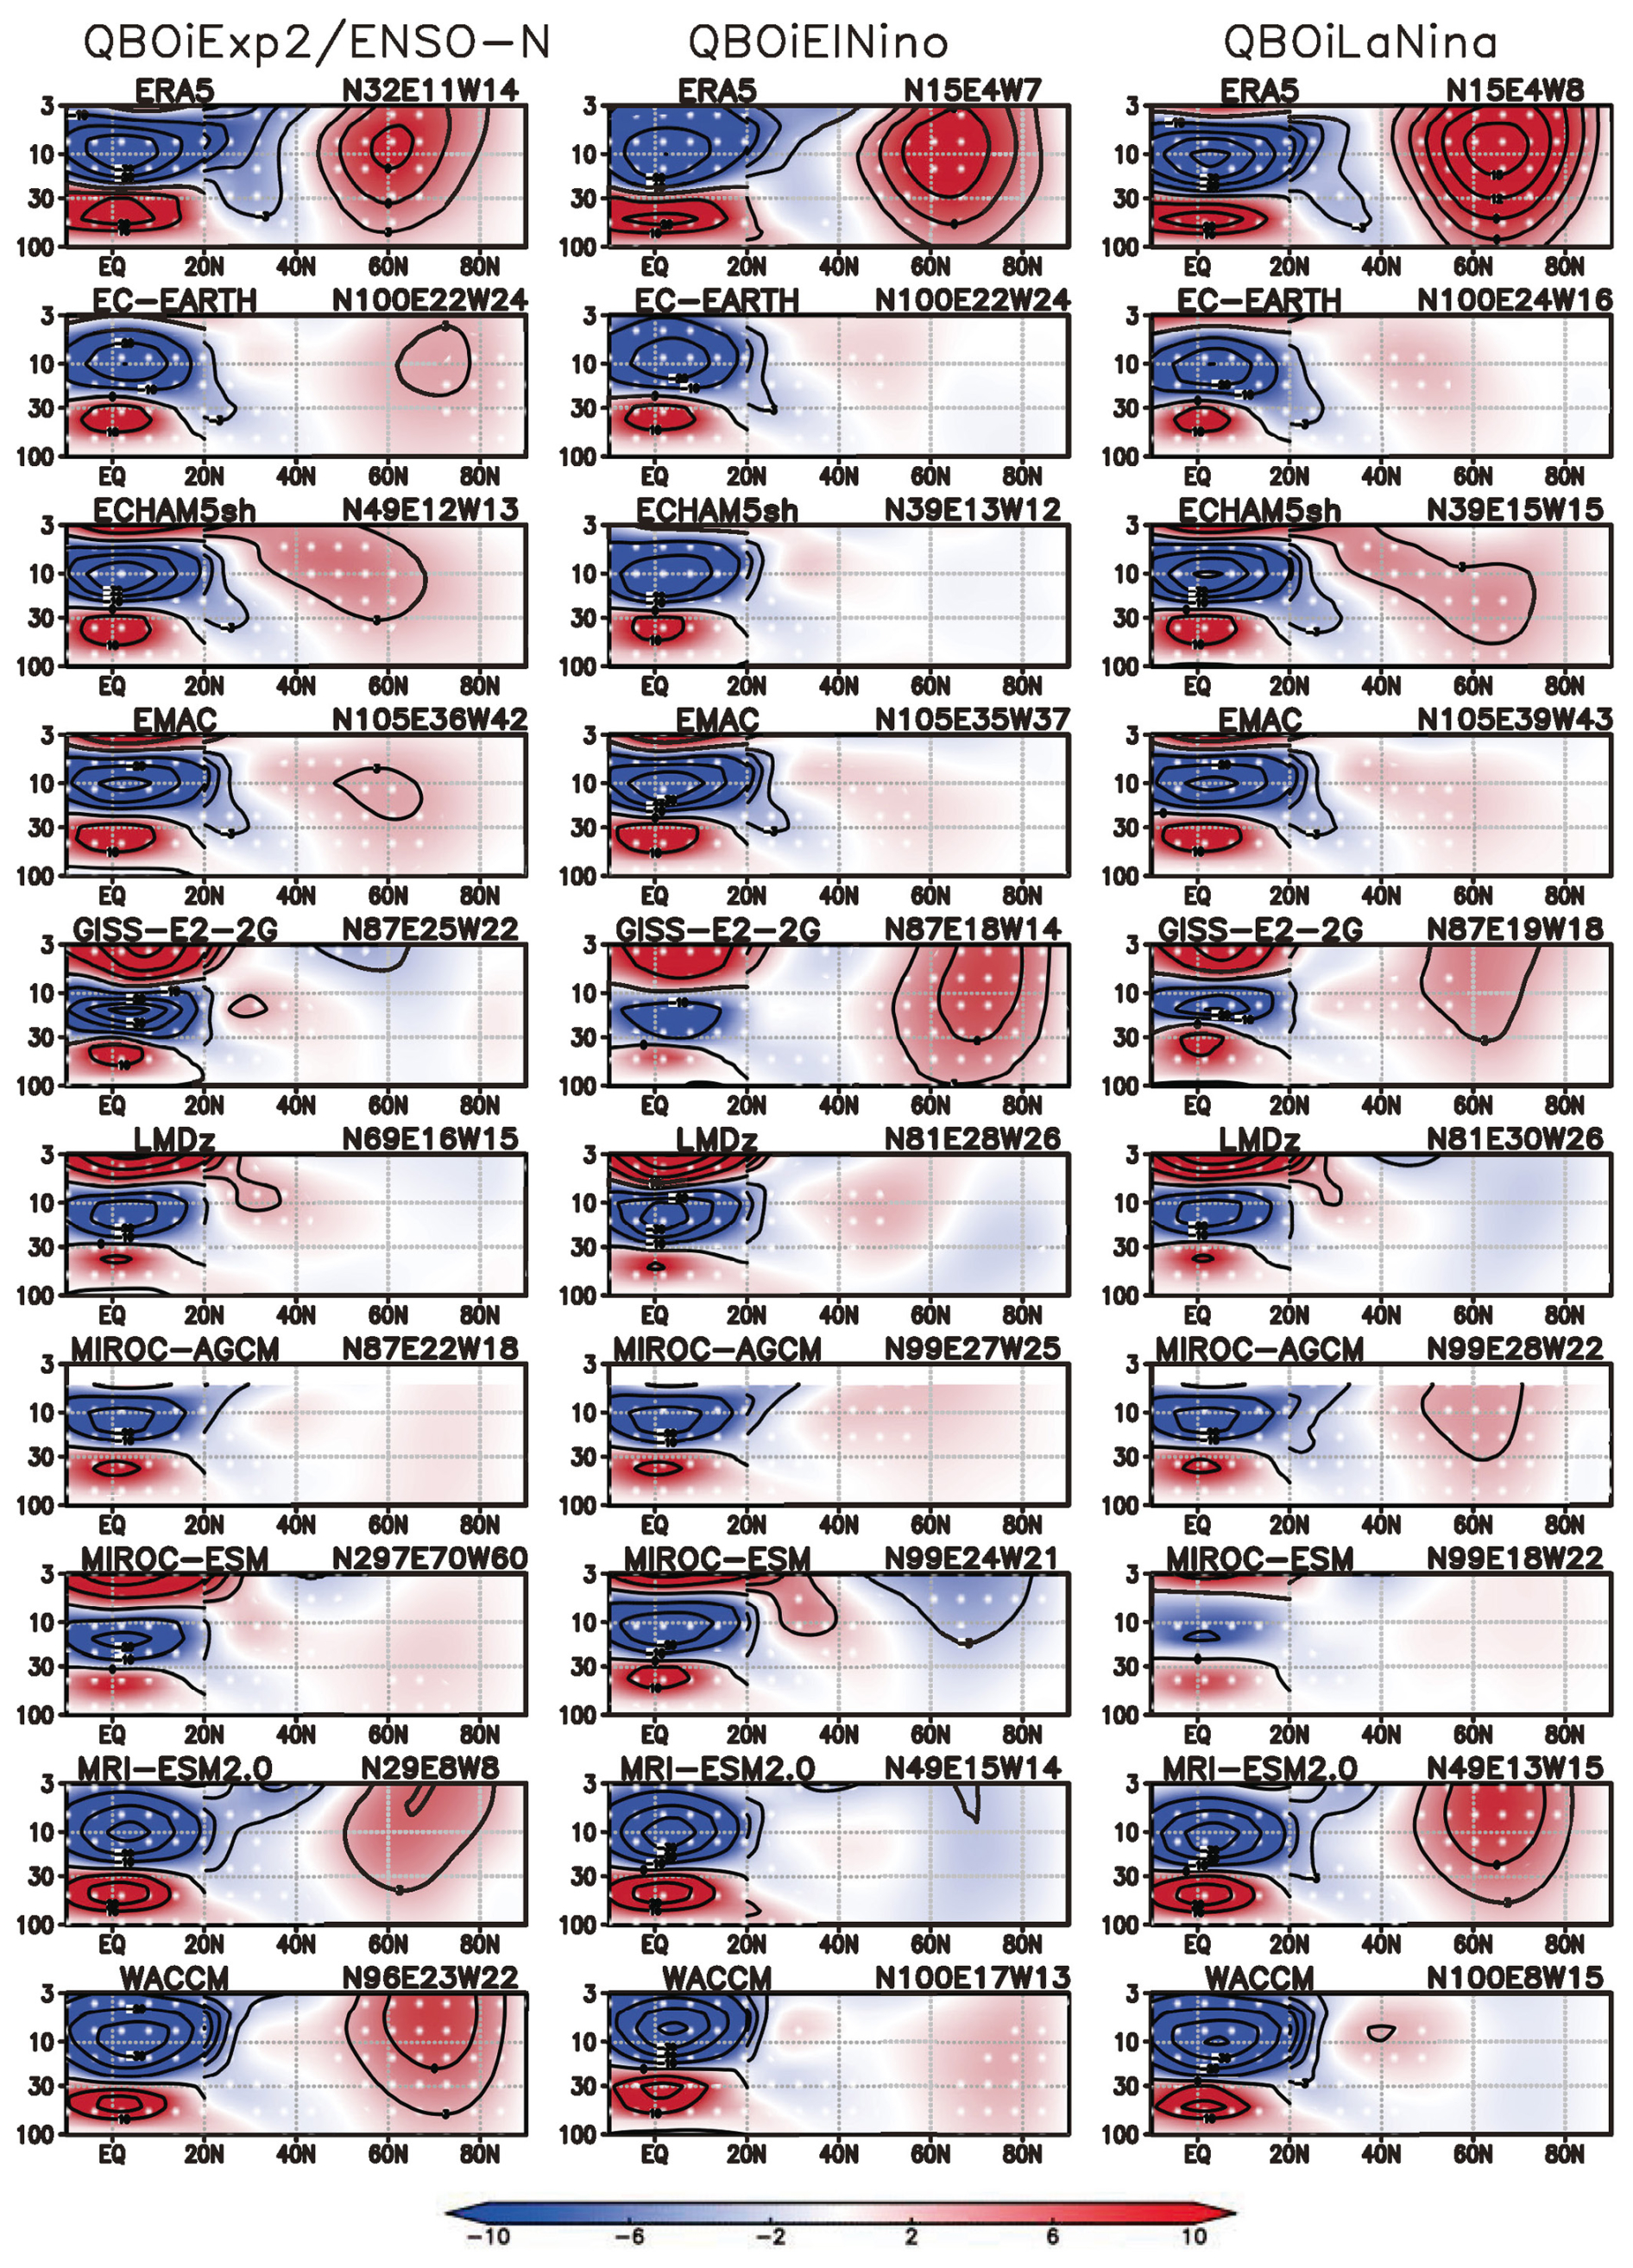
Figure 2Composite differences in the DJF mean zonal-mean zonal wind between the QBO-W and QBO-E phases, shown in the pressure (in hPa)–latitude domain, for the CTL, EN, and LN experiments, as well as for ENSO-neutral, El Niño, and La Niña winters based on ERA5. QBO phases are classified using deseasonalized DJF zonal-mean zonal wind at 50 hPa, averaged over 5° S–5° N, with values greater than 0.5σ indicating QBO-W and less than −0.5σ indicating QBO-E. Contour intervals are 3 m s−1 north of 20° N and 10 m s−1 south of 20° N. Dots indicate statistical significance at the 90 % confidence level. The number of winters for each model run, along with the counts of QBO-E and QBO-W winters, is shown in the upper-right corner of each panel. For example, “N100E30W41” for CTL in EC-EARTH indicates a total of 100 winters, with 30 winters classified as QBO-E and 41 as QBO-W.
Figure 2 presents composite differences in the zonal-mean zonal wind between QBO-W and QBO-E phases across the CTL, EN, and LN experiments. ERA5 clearly captures the Holton–Tan relationship under all three ENSO conditions (neutral, El Niño, and La Niña). The QBO teleconnection to the NH winter stratospheric polar vortex is most strongly correlated with the QBO amplitude at 50 hPa (Anstey et al., 2022c). The difference in vortex strength in DJF between QBO-W and QBO-E peaks at approximately 10 m s−1 in the mid-stratosphere (near 10 hPa) during ENSO-neutral and El Niño winters, with the strongest response occurring during La Niña winters, reaching a peak value of 15 m s−1. No model reproduces the observed strength of the Holton–Tan relationship across all three experiments (CTL, EN, and LN). From Fig. 2, only three models reproduce the observed relationship in CTL and EN, and only one model (MRI-ESM2.0) reproduces the observed relationship in LN. The two models in CTL (MRI-ESM2.0 and WACCM) exhibit responses within half the observed amplitude. The one model in LN (MRI-ESM2.0) exhibits a stronger QBO impact on the vortex compared with EN, although this model produces an incorrect sign response in EN. In LN, three models (ECHAM5sh, MIROC-AGCM, and MRI-ESM2.0) better reproduce the observed response, peaking at a modest amplitude of ∼ 3 m s−1 in the polar vortex region. GISS shows a significant difference in EN and a significant response in LN just equatorward of 60° N.
One may ask whether a model-specific equatorial wind level, such as 30 hPa (e.g., Rao et al., 2020a), is more effective for reproducing the QBO impact on the polar vortex (the Holton–Tan effect). We examine the relationship of composite differences of zonal-mean zonal wind in polar vortex at 60° N and 10 hPa against QBO definition at 50 hPa (QBO50) and at 30 hPa (QBO30) (Fig. S1). Most models underestimate equatorial QBO composite differences at 50 hPa compared with 30 hPa; for some models, the QBO is difficult to detect at 50 hPa. These results are similar to those reported by Rao et al. (2020a) for CMIP models. However, both panels (QBO50 and QBO30) show that most models underestimate equatorial QBO amplitude and struggle to reproduce the observed polar vortex responses. We also examine whether model performance in QBO amplitude and/or climatological polar night jet strength relates to a model's ability to capture the QBO-induced polar vortex responses (not shown), hypothesizing that the Holton–Tan relationship – the polar vortex pathway of the QBO teleconnection – may be influenced by these two factors. QBO amplitudes at 50 hPa are poorly represented in most models, consistent with previous studies (Bushell et al., 2022; Anstey et al., 2022c), while climatological polar vortices during NH winter are reproduced with the observed strength. These results are consistent with previous QBOi multi-model ensemble studies, which argued that unrealistically weak low-level QBO amplitudes can weaken QBO teleconnections to the polar vortex (Richter et al., 2022; Anstey et al., 2022c). In summary, across the CTL and LN experiments, models generally show a stronger polar vortex during NH winter when the 50 hPa QBO wind is westerly, and a weaker vortex when it is easterly, consistent with, but weaker than, the observed response.
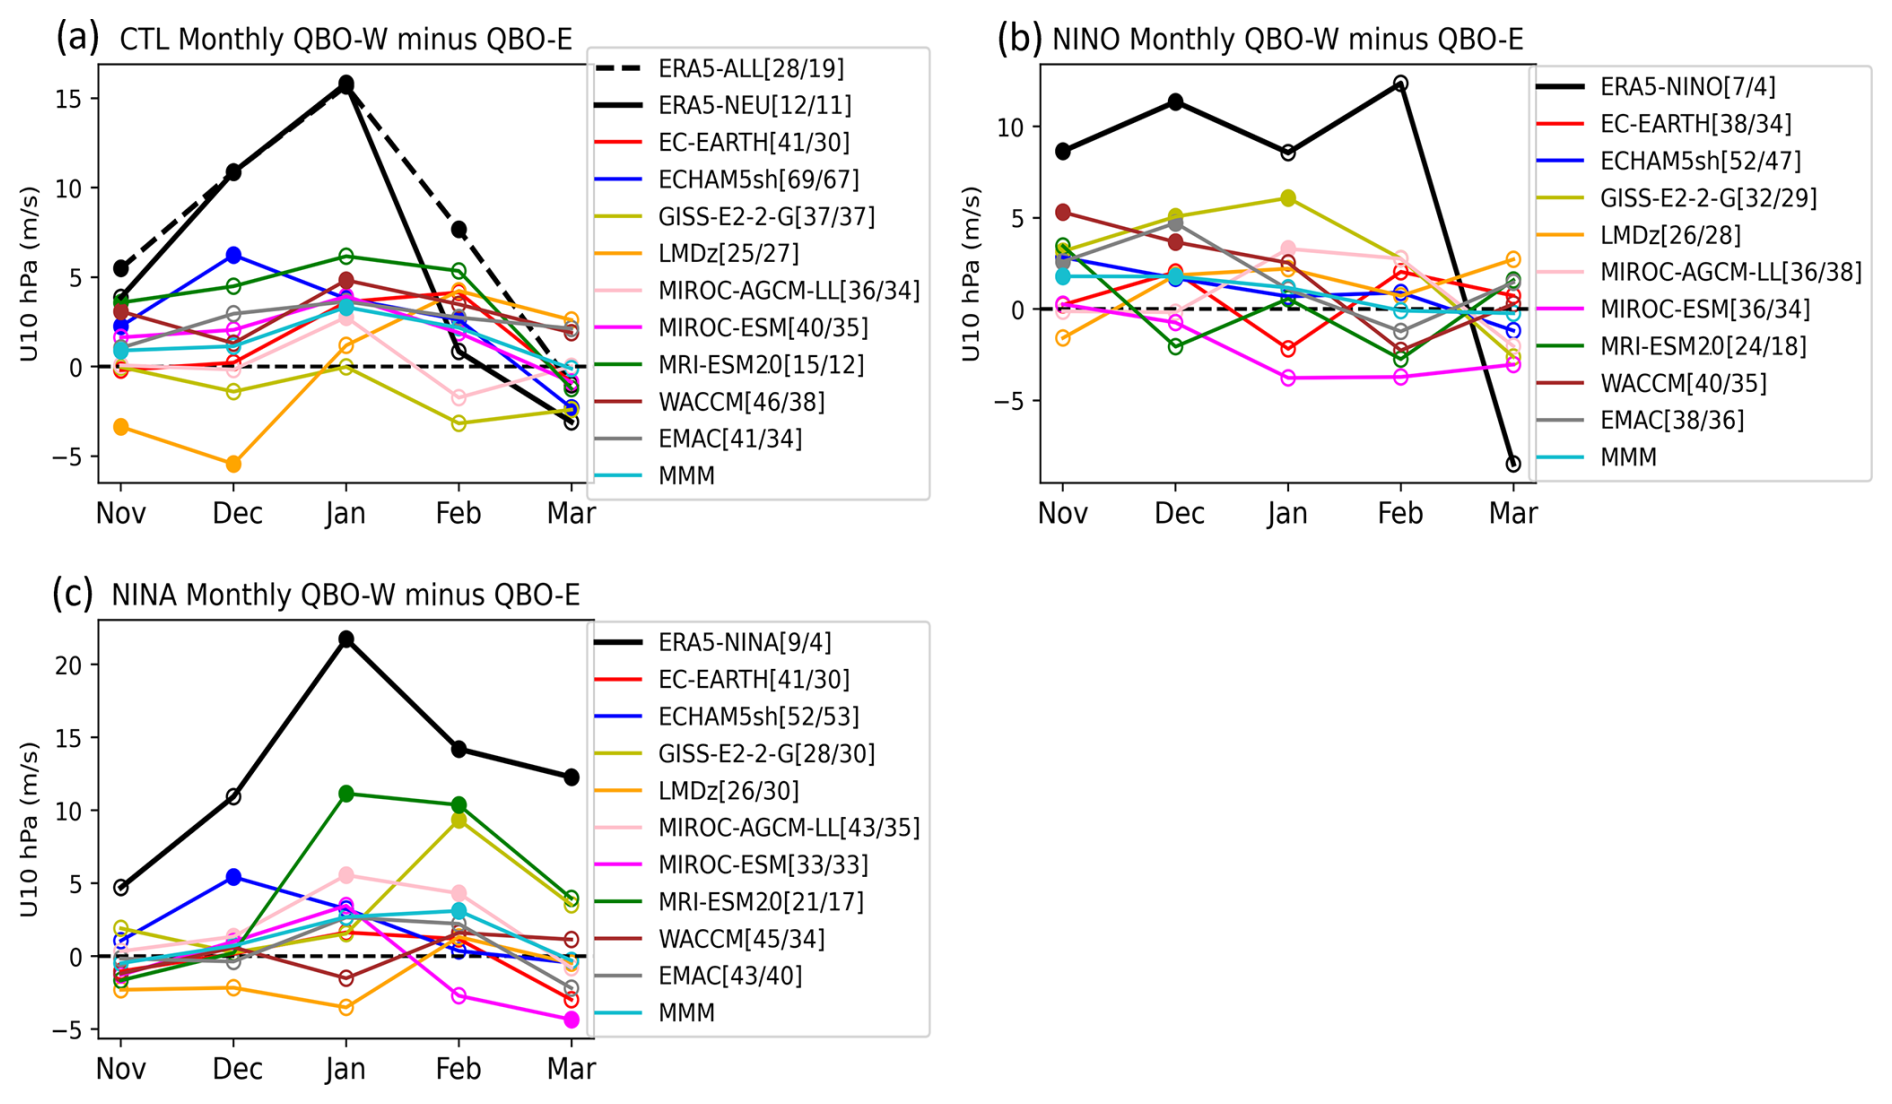
Figure 3(a) Monthly differences (QBO-W minus QBO-E) in the zonal-mean zonal wind at 10 hPa, averaged over 55–65° N, as a measure of the stratospheric polar vortex strength for the CTL experiment, along with ENSO-neutral winters in ERA5. QBO phases are classified as in Fig. 2. Solid dots indicate statistically significant differences between the QBO-W and QBO-E phases at the 90 % confidence level, based on a Monte Carlo test. The numbers in the legend represent the number of cases in each QBO phase. The dashed line in panel (a) shows the QBO composite difference in ERA5 when all years (1959–2022) are included in the analysis. MMM denotes the multi-model mean. (b) Same as panel (a), but for the EN experiment, along with El Niño winters in ERA5. (c) Same as panel (a) but for the LN experiment, along with La Niña winters in ERA5. The numbers of QBO phase categories (QBO-W, QBO-E) in ERA5 are (12, 11) during ENSO-Neutral, (7, 4) during El Niño, and (9, 4) during La Niña winters.
The intraseasonal Holton–Tan effects are shown in Fig. 3, represented by the composite difference (QBO-W minus QBO-E) of the monthly zonal-mean zonal wind at 10 hPa, 55–65° N in the CTL, EN, and LN experiments, together with ERA5. In ERA5, the maximum Holton–Tan effect occurs in January, with a peak of 13 m s−1 across all data (dashed black line in the top panel). This difference is reduced in February during ENSO-neutral winters (solid black line in Fig. 3a). The seasonal evolution of the Holton–Tan effect differs between El Niño and La Niña winters; it appears stronger in early and late winter during El Niño winters (Fig. 3b), and in mid-winter during La Niña winters (Fig. 3c). However, it should be noted that the sample sizes (number of W/E winters) are small for both El Niño and La Niña winters. Some models (MIROC-ESM and ECHAM5sh) in CTL show a seasonal cycle similar to that in ERA5. By contrast, GISS throughout all months, as well as LMDz and MIROC-AGCM in certain months, in CTL, exhibit a Holton–Tan relationship opposite to that observed. In EN, four models (GISS, WACCM, EMAC, and ECHAM5sh) capture the early winter response in December, although it is not statistically significant. The Holton–Tan relationship during El Niño winters may depend on SSW occurrence because of the nonlinear joint effects of QBO and ENSO on the polar vortex, as discussed in the Introduction. In LN, MRI-ESM2.0 and GISS reproduce the observed late-winter response relatively well, whereas other models show no response or even an opposite response.
3.2 SSW statistics
In this subsection, we examine the QBO impacts on SSW statistics modulated by ENSO in the NH polar region. Previous observational studies have shown that the ratio of SSW frequency between La Niña and ENSO-neutral winters depends on the specific definition of SSW (Butler and Polvani, 2011; Garfinkel et al., 2012a; Song and Son, 2018), and that SSW statistics are also influenced by model biases (Tyrrell et al., 2022). Figure 4 presents the frequencies of major SSWs, minor SSWs, and final warming dates in the NH for ERA5 and the QBOi models. The criteria for identifying major SSWs, minor SSWs, and final warming dates follows previous studies (Charlton and Polvani, 2007; Butler et al., 2015). Major SSWs are defined when the zonal-mean zonal wind at 10 hPa and 60° N (U60) reverse from westerlies to easterlies during winter. Minor SSWs are defined when the meridional gradient of the zonal-mean temperature changes the sign without a reversal of U60. A final warming date refers to the seasonal transition from westerlies to easterlies, with winds remaining easterlies thereafter.
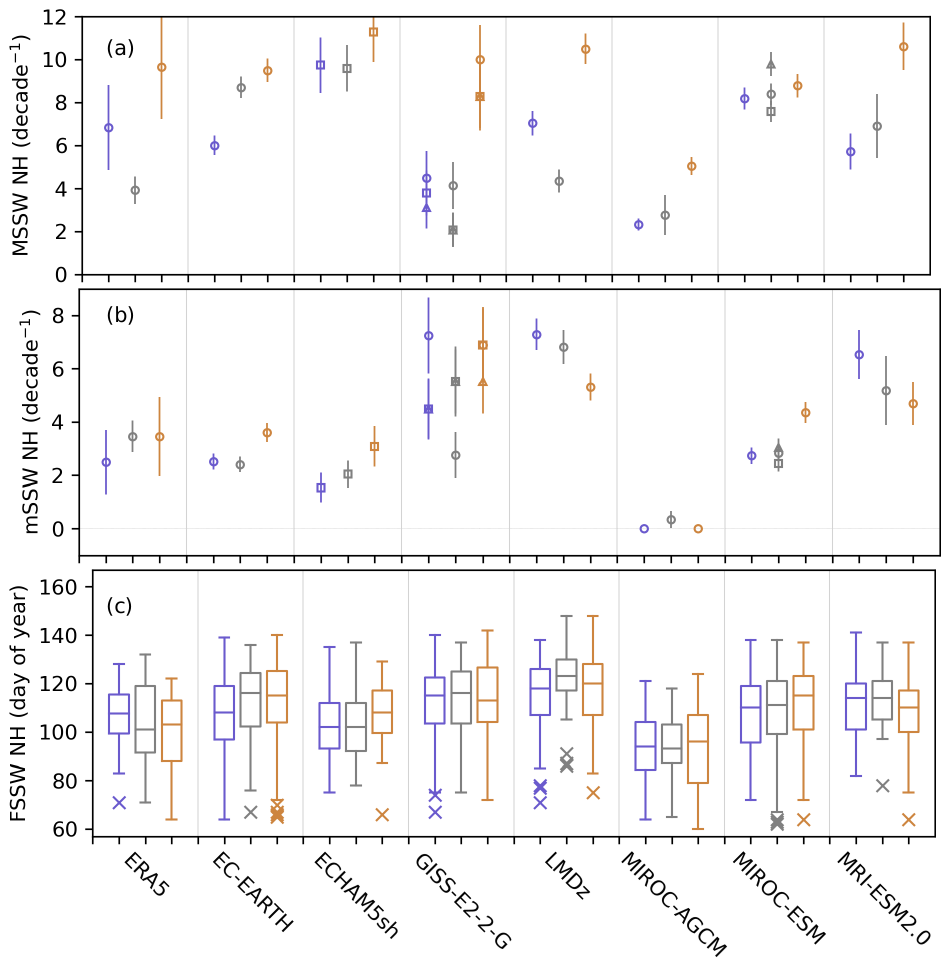
Figure 4SSW statistics – namely, the frequencies of (a) major SSWs, (b) minor SSWs, and (c) final SSW dates – in the Northern Hemisphere for the CTL, EN, and LN experiments in the QBOi models, along with ENSO-neutral, El Niño, and La Niña winters in ERA5, based on their daily data. The order of triplets from left to right is LN/La Niña (purple), CTL/ENSO-neutral (grey), and EN/El Niño (brown). The frequency (number of events per decade) of major SSWs is defined as the number of reversals of the zonal-mean zonal wind at 10 hPa and 60° N (U60), while the frequency of minor SSWs is defined as the number of reversals of 90–60° N temperature gradient at 10 hPa without a U60 reversal, occurring across full seasons. The final SSW date (day of year) is determined for full seasons, which is defined as a period from the onset of westerlies to the transition to easterlies. Uncertainties are estimated at the 5 %–95 % confidence level using bootstrapping of 10 years of winter months. Multiple markers within the same experiment of a model indicate ensemble members, depending on data availability.
First, we assess the influence of ENSO on SSW frequencies. In ERA5 (the leftmost triplet in Fig. 4a), the frequencies of major SSWs are high during both El Niño and La Niña winters compared to ENSO-neutral winters. Thus, we expect that major SSW frequencies in the QBOi models would resemble the observations, with fewer events in CTL and more in EN and LN. LMDz and GISS reproduce the observed nonlinear ENSO response to some extent (Fig. 4a). However, most models simulate more SSWs in EN but fail to capture the response in LN (e.g., EC-EARTH, MIROC-AGCM, and MRI-ESM2.0). Only one model (ECHAM5sh) reproduces the observed relationship between the frequency of minor SSWs and the ENSO phase, showing similar frequencies in CTL and LN, and more events in EN.
The final warming date is defined as the transition from winter westerlies to summer easterlies in the polar stratosphere (Butler et al., 2015). If the polar stratosphere is warmer, the zonal wind transition to easterlies occurs earlier, whereas if it is colder, the transition is delayed. Hence, we assume that during El Niño/La Niña winters, when the polar stratosphere tends to be warmer/colder as described in the Introduction, the final warming date may occur earlier/later. Consistent with this expectation, in ERA5 during La Niña winters (the leftmost triplet of Fig. 4c), the final warming date is delayed compared with ENSO-neutral and El Niño winters. GISS and MRI-ESM2.0 also show median final warming dates that are later in LN compared with EN, consistent with the observed response (Fig. 4c). In contrast, five models (EC-EARTH, ECHAM5sh, LMDZ, MIROC-AGCM, and MIROC-ESM) show later final warming dates in EN, opposite to the observed response. These results show that the QBOi models have significant biases in reproducing observed SSW statistics. Large inter-model variability is also evident in the Northern Annular Mode (NAM) index (Eyring et al., 2020) composited at 500 hPa, as shown in Fig. S2, where the geopotential heights during LN tend to be lower and the intensity of the extratropical signature differs between LN and EN. Inter-model variability in the large-scale response to ENSO may also explain the spread in SSW occurrence (e.g., in the GISS and MIROC-ESM models in Fig. 4) due to differences in simulated tropospheric forcing.
Next, we examine the influence of the QBO on major SSW frequencies modulated by ENSO during NH winter. Figure 5 shows scatter plots of the climatological zonal-mean zonal wind at 60° N and 10 hPa against the frequency of major SSWs during DJF under two QBO phases and three ENSO conditions. In ERA5, major SSW frequencies under QBO and ENSO conditions are clearly distinguishable. Averaged over all QBO conditions, the NH polar vortex is stronger during La Niña than during El Niño winters, while SSW frequencies are slightly higher during La Niña than during El Niño winters, and both are higher than during ENSO-neutral winters. Major SSW frequencies during La Niña winters are significantly higher under QBO-E and lower under QBO-W, whereas during El Niño winters, they are indistinguishable between QBO-W and QBO-E. Most QBOi models exhibit linear relationships between SSW frequencies and polar vortex strength. They generally simulate higher SSW frequencies in EN than in LN, with little distinction between QBO-W and QBO-E. This indicates that polar vortex responses to ENSO conditions in the QBOi models are stronger than their responses to QBO phases. Some models (EMAC, MIROC-AGCM, and MIROC-ESM) have very weak responses to both QBO and ENSO conditions.
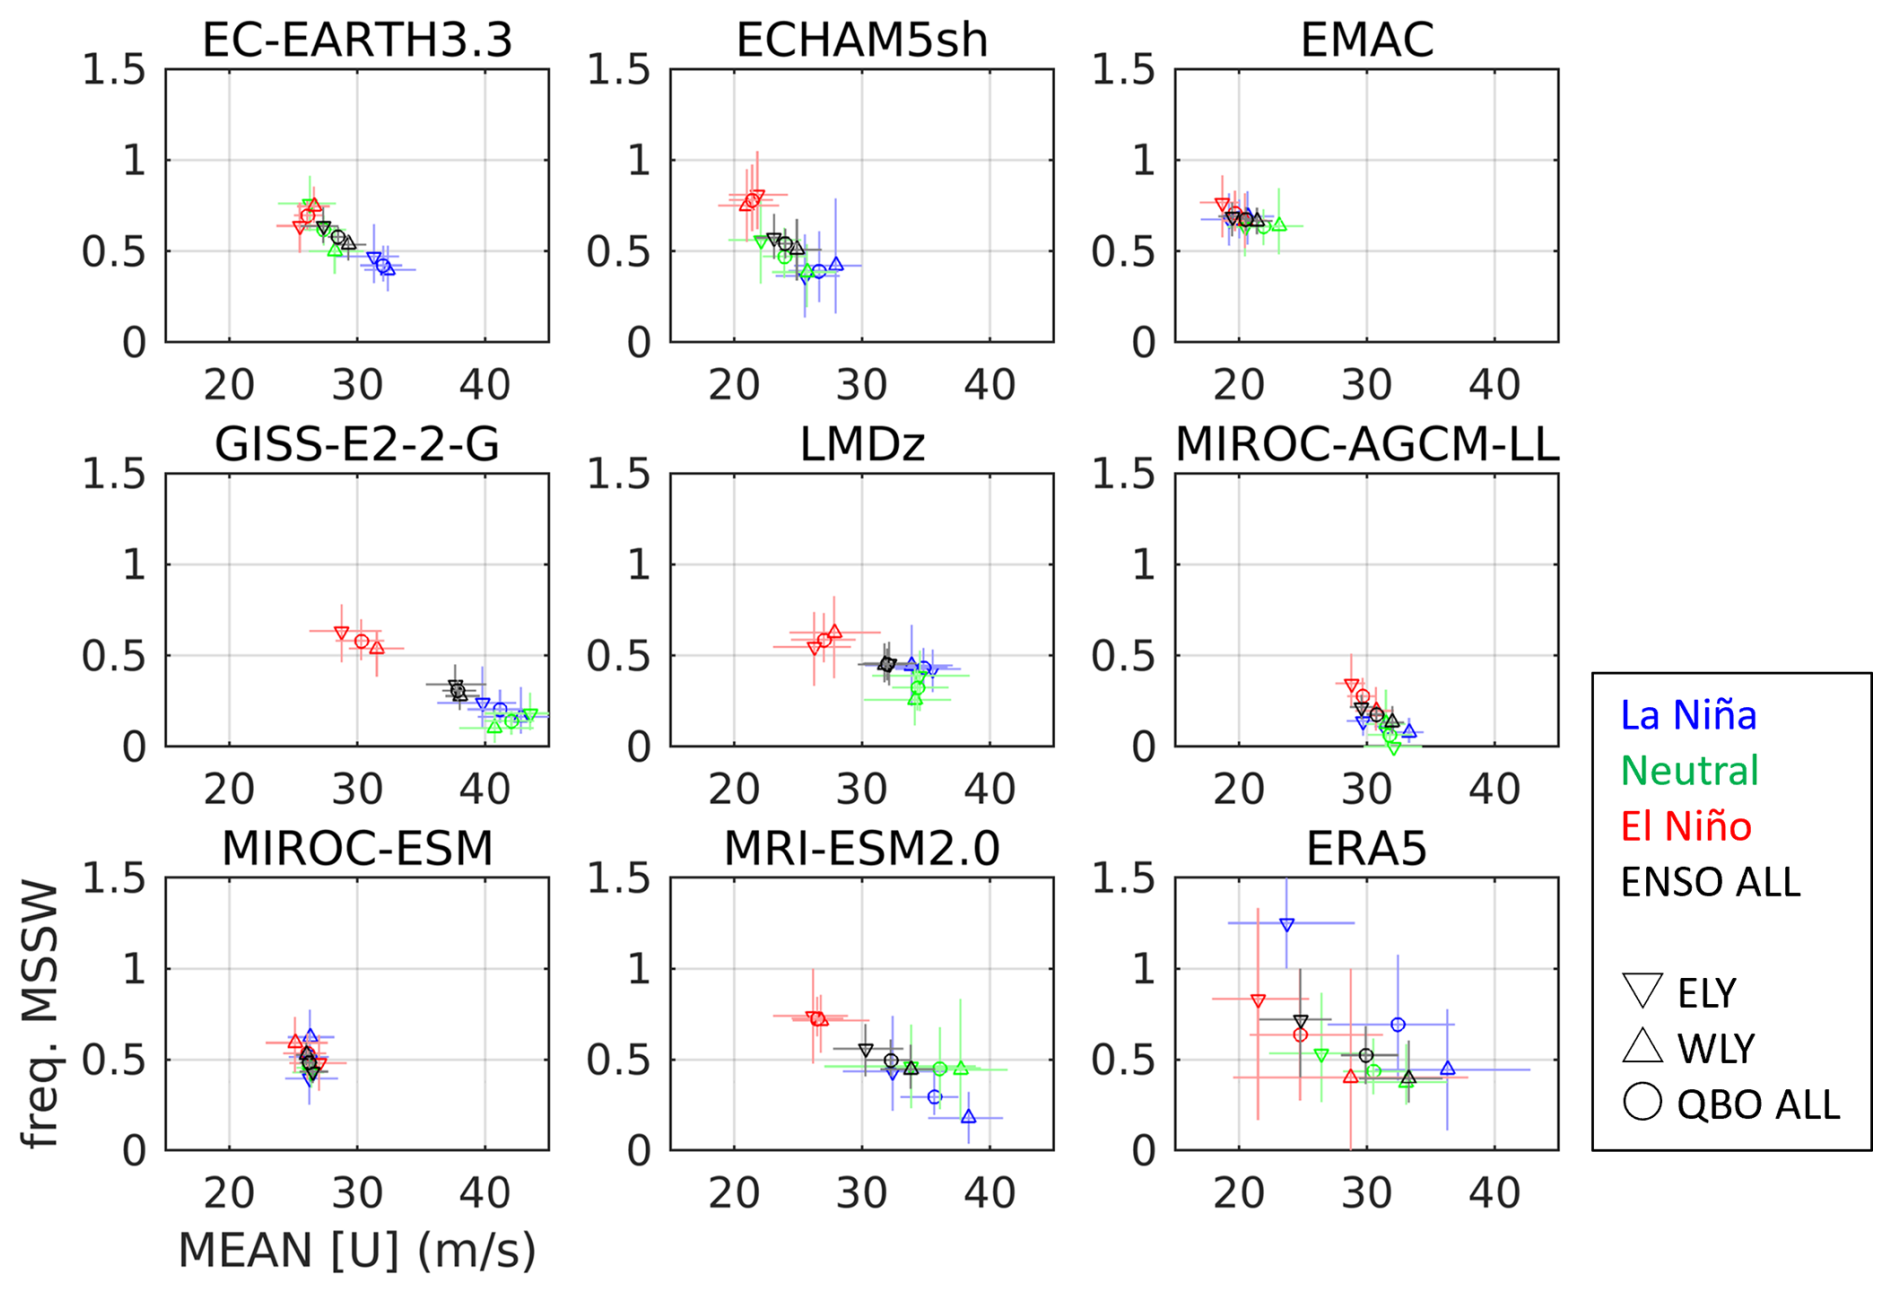
Figure 5Scatter plots of the winter-mean vortex strength at 60° N and 10 hPa versus the major SSW frequency during DJF under different QBO and ENSO conditions. Major SSWs are defined as reversals of the daily zonal-mean zonal wind at 60° N and 10 hPa. QBO phases are classified using DJF-mean zonal-mean zonal wind anomalies at 50 hPa, averaged over 5° S–5° N, with anomalies ≥ 0 m s−1 indicating QBO-W marked by up-pointing triangles (WLY in panel) and < 0 m s−1 indicating QBO-E marked by down-pointing triangles (ELY in panel). The sum of QBO-W and QBO-E is marked by circles (QBO ALL in panel). Anomalies are calculated for each ensemble member of each experiment in the simulation data; for ERA5, they are calculated using all winters from 1959 to 2021. El Niño and La Niña winters in observations are identified when all three DJF months have the El Niño and La Niña classification. The numbers of QBO phase categories (QBO-W, QBO-E) in ERA5 are (24, 15) during ENSO-neutral, (5, 6) during El Niño, and (9, 4) during La Niña winters. For each condition and model, the data are randomly resampled 100 times with replacement, and 95 % confidence intervals are calculated.
This section examines the subtropical jet pathway of the QBO teleconnection modulated by ENSO, focusing on the Asia-Pacific subtropical jet (APJ). Only the late winter period (February–March) is considered, when the subtropical pathway is strongest in observations (Garfinkel and Hartmann, 2011a; Park et al., 2022). The subtropical jet response to the QBO is most pronounced in the APJ, and so analyses are performed for the zonal wind averaged over the Pacific sector (150° E–150° W). The sensitivity of the QBO–APJ connection to the ENSO phase is also examined.
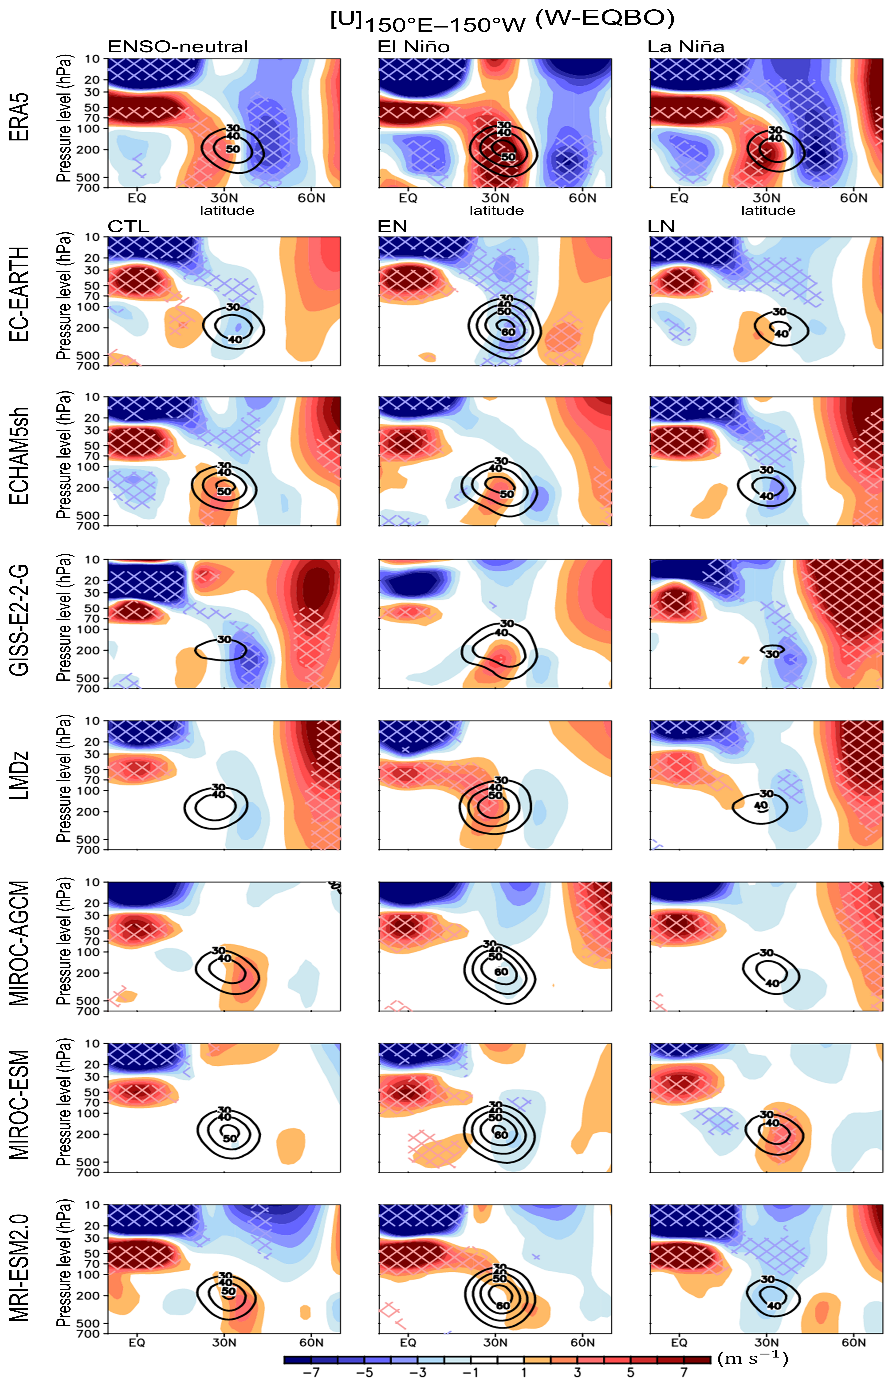
Figure 6QBO-W minus QBO-E composite differences in zonal wind averaged over the Pacific sector (150° E–150° W) during ENSO-neutral (top-left), El Niño (top-middle), and La Niña (top-right) winters, as well as in the CTL, EN, and LN experiments (left to right columns). Statistically significant values at the 95 % confidence level are indicated by cross-hatching. The contour denotes the climatological jet, defined as a zonal wind speed ≥ 30 m s−1. QBO phases are determined using deseasonalized February–March zonal-mean zonal wind at 70 hPa, averaged over 5° S–5° N, with > 0.5σ indicating QBO-W and < −0.5σ indicating QBO-E. The numbers of QBO phase samples (QBO-W, QBO-E) in ERA5 are (10, 9) during ENSO-neutral, (6, 3) during El Niño, and (12, 7) during La Niña winters.
The QBO-W minus QBO-E composite differences are shown in Fig. 6 for ENSO-neutral, El Niño, and La Niña winters, using both ERA5 and QBOiENSO experiments. In ERA5, a QBO-W minus QBO-E anomaly exhibits a distinct horseshoe-shaped pattern extending from the tropical lower stratosphere to the subtropical lower troposphere during ENSO-neutral winters (top-left panel in Fig. 6). This anomaly is accompanied by a quasi-barotropic, easterly anomaly in the extratropics. More importantly, the zonal wind anomalies switch sign across the climatological APJ (contour), indicating that the APJ shifts equatorward during QBO-W winters compared with QBO-E winters. Most models underestimate or fail to reproduce the observed QBO–APJ connection. The dipolar wind anomalies are much weaker in five models (EC-EARTH, ECHAM5sh, GISS, LMDz, and MIROC-ESM) than observations. Although one lobe of the dipolar wind anomalies is significant in ECHAM5sh and GISS, other models (i.e., EC-EARTH, LMDz, and MIROC-ESM) exhibit statistically insignificant wind anomalies. MIROC-AGCM and MRI-ESM2.0 even produce anomalies of opposite sign. Such a large inter-model spread is consistent with previous work (Anstey et al., 2022c). In ERA5, the QBO–APJ connection differs between El Niño and La Niña winters (top-middle and top-right panels in Fig. 6; Garfinkel and Hartmann, 2011b). As the APJ strengthens over the Pacific sector (150° E–150° W) in response to El Niño (compare climatological jet contours; Rasmusson and Wallace, 1983; Mo et al., 1998; Lu et al., 2008), the QBO-induced subtropical wind anomalies intensify near the APJ core during El Niño winters (top-middle panel; Ma et al., 2023). In contrast, the QBO-W minus QBO-E anomalies switch sign across the climatological APJ during La Niña winters (top-right panel), when the APJ becomes slightly weaker (compare climatological jet contours in the top-left and top-right panels). The APJ's response to ENSO is consistently reproduced across models, whereas the ENSO modulation of the QBO–APJ connection exhibits a large inter-model spread. While all models capture a stronger APJ in EN than in LN (compare climatological jet contours in the middle and right columns), they exhibit significant biases in reproducing the ENSO modulation of the QBO–APJ connection (filled contours).
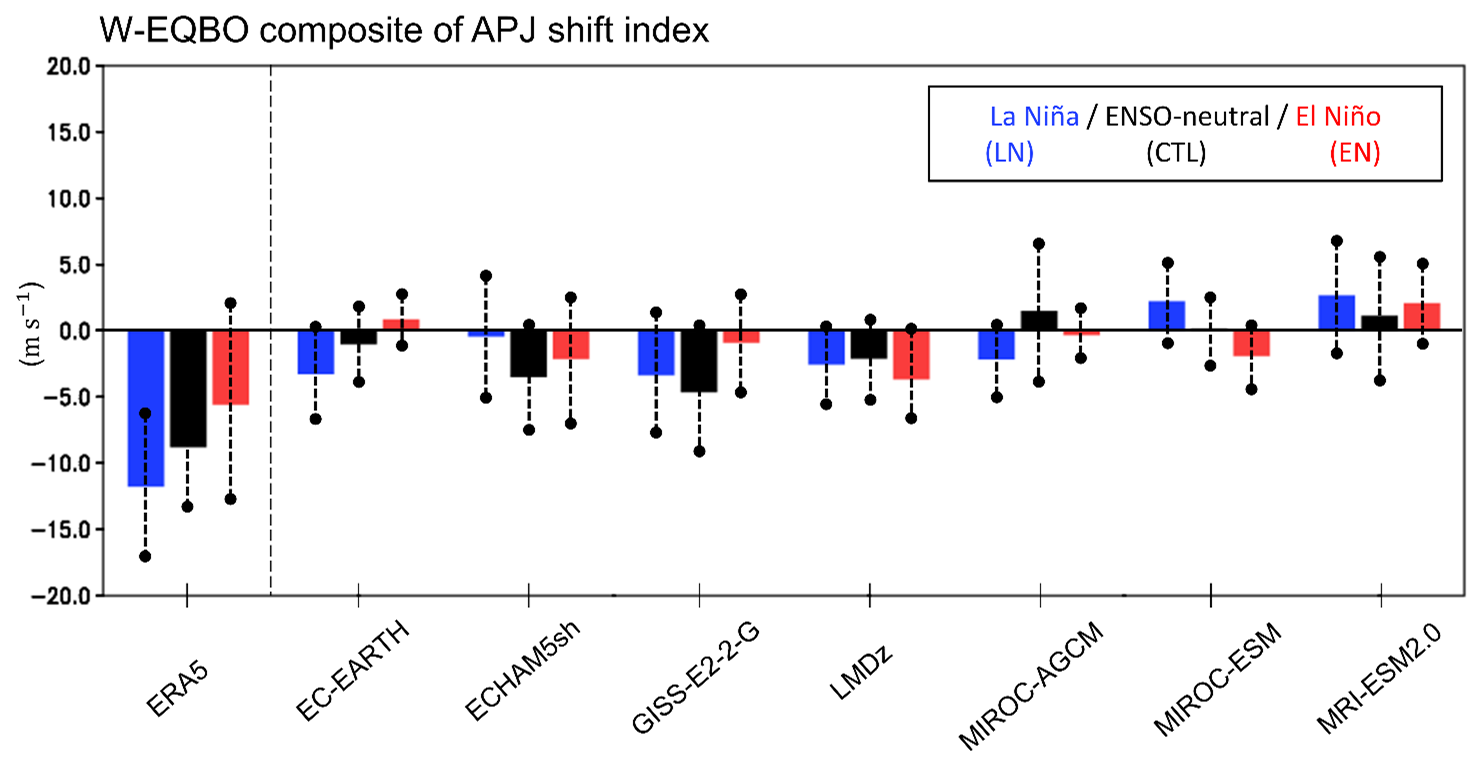
Figure 7QBO-W minus QBO-E composite differences in the Asia–Pacific Jet (APJ) shift index. The APJ shift index is defined as the difference in the 250 hPa zonal wind anomalies between the northern flank (40–50° N) and the southern flank (20–30° N) of the climatological APJ core, averaged over the Pacific sector (150° E–150° W). A negative value indicates that the APJ shifts equatorward during the QBO-W phase. Composite differences are shown for LN/La Niña (blue), CTL/ENSO-neutral (black), and EN/El Niño (red). The APJ shift index is considered significant if the 5 %–95 % range of the bootstrap distribution (vertical dashed lines) does not include zero.
The inter-model spread of the QBO subtropical pathway is summarized by the APJ-shift index in Fig. 7. This index is derived from the QBO-W minus QBO-E zonal wind differences shown in Fig. 6. Specifically, it is defined as the 250 hPa QBO zonal wind difference between the northern flank (40–50° N) and the southern flank (20–30° N) of the climatological APJ. Negative values indicate an equatorward shift of the APJ during QBO-W relative to QBO-E. The observed APJ-shift index is significantly negative during ENSO-neutral (black) and La Niña (blue) winters but insignificant during El Niño (red) winters. This is consistent with dipolar wind anomalies switching sign across the climatological APJ during ENSO-neutral and La Niña winters, whereas APJ strengthening is more pronounced during El Niño winters (Fig. 6). The APJ-shift index is not robust across models. None of the models show a statistically significant APJ shift in response to the QBO, regardless of the ENSO phase. This suggests that QBOi models substantially underestimate or fail to reproduce the subtropical pathway of the QBO teleconnection and its modulation by ENSO.
Given that the subtropical jet pathway of the QBO teleconnection can be influenced by the QBO amplitude and/or the climatological position of the subtropical jet (Garfinkel and Hartmann, 2011a), we examined whether model performance in simulating these two factors is related to the ability of a model to capture the QBO-induced shift of the APJ (Fig. S3). Here, the QBO amplitude is defined as the root-mean square of the deseasonalized zonal-wind time series at 70 hPa, multiplied by , following Dunkerton and Delisi (1985) and Bushell et al. (2022). The climatological position of the APJ is defined as the latitude of the maximum zonal-mean wind averaged over the APJ sector (150° E–150° W). Consistent with previous studies (Bushell et al., 2022; Anstey et al., 2022c), most QBOi models underestimate the QBO amplitude. Only two models show a QBO amplitude comparable to the reanalysis. However, model biases in the QBO amplitude do not affect those in the QBO–APJ connection (Fig. S3a). Models with larger QBO amplitudes do not necessarily exhibit stronger jet responses, nor do models with smaller amplitudes consistently show weaker responses. A similar result is found for the APJ position (Fig. S3b). These results suggest that neither the QBO amplitude nor the APJ position explains the inter-model spread in the QBO–APJ connection. Other factors, such as transient and stationary eddies, may determine the QBO–APJ connection in the models. This possibility should be explored in future studies.
This section investigates the tropical pathway of the QBO teleconnection modulated by ENSO, focusing on tropical precipitation and the Walker circulation.
5.1 Tropical precipitation
Several studies have suggested that the observed QBO signal in tropical precipitation depends on the underlying ENSO phase (e.g., Taguchi, 2010b; García-Franco et al., 2022, 2023). This section examines this hypothesis using QBOi models and experiments through analyses of tropical precipitation and OLR. Figure 8 shows DJF seasonal-mean precipitation differences between QBO-W and QBO-E in EN and LN, together with anomalies during El Niño and La Niña winters from GPCP. In the observations, the QBO signals are strongest and statistically significant in the tropical Pacific and Indian Oceans, consistent with previous analyses (Liess and Geller, 2012; García-Franco et al., 2022). The positive equatorial Pacific signal in the GPCP dataset, which resembles an El Niño anomaly (Dommenget et al., 2013; Capotondi and Sardeshmukh, 2015), is particularly strong and statistically significant during DJF. This signal is associated with the three strongest El Niño events (1982–1983, 1997–1998, 2015–2016), coinciding with the westerly QBO phase (Fig. S4; García-Franco et al., 2023).
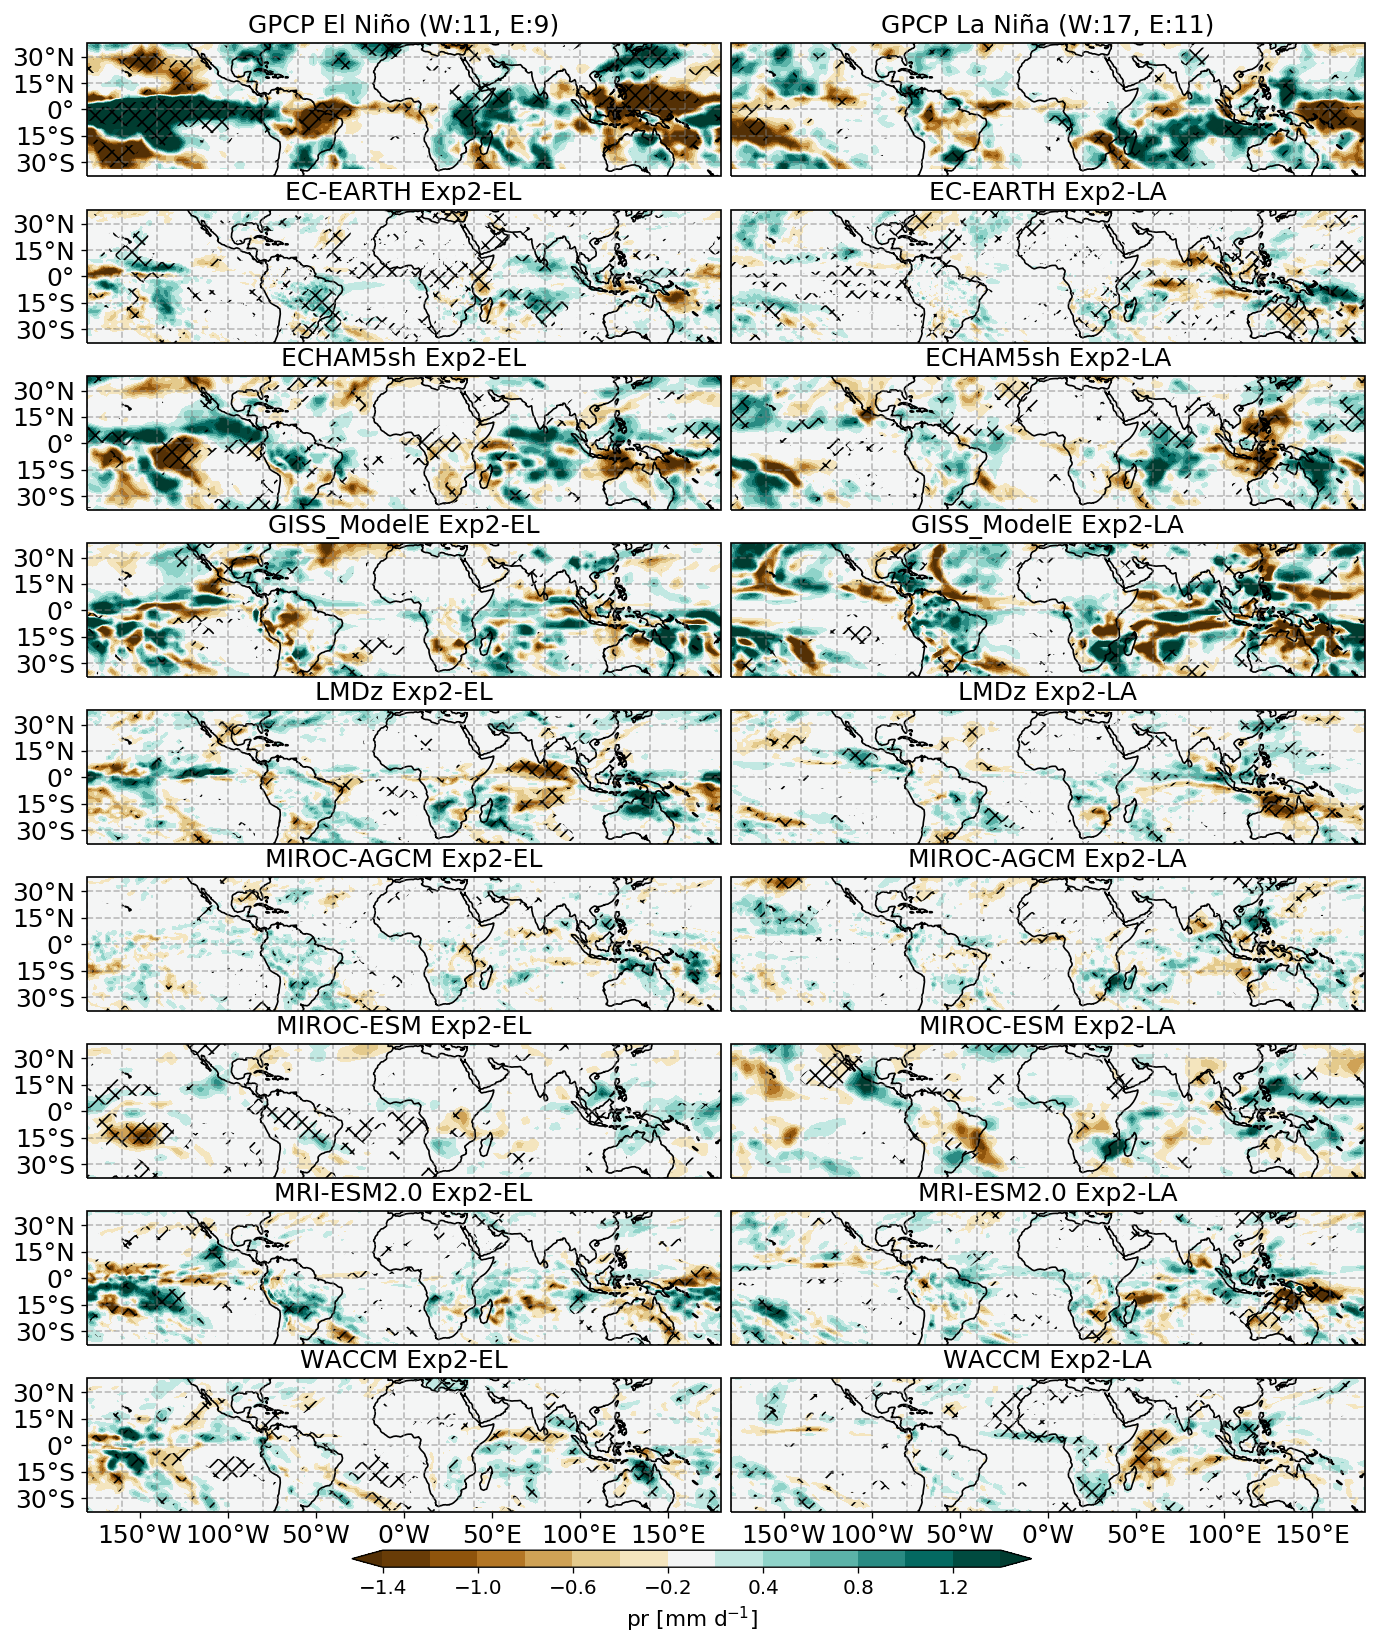
Figure 8DJF seasonal-mean precipitation differences (mm d−1) between QBO-W and QBO-E for (left) EN and (right) LN experiments in the QBOi models, including El Niño and La Niña winters from GPCP data. Hatching indicates statistical significance at the 95 % confidence level, determined by a bootstrap test for observations and a two-sided t-test for models. Observed composite sample sizes (in months) are shown in parentheses in the GPCP panels. QBO phases are classified based on deseasonalized DJF-mean zonal-mean zonal wind at 50 hPa, averaged over 5° S–5° N, with values ≥ 2 m s−1 indicating QBO-W and ≤ −2 m s−1 indicating QBO-E.
Although most models do not reproduce El Niño–like precipitation anomaly patterns in either experiment, several models exhibit significant QBO-related precipitation signals. For example, GISS, ECHAM5sh, and MRI-ESM2.0 show significant QBO responses in EN, comparable in magnitude to the signal diagnosed in GPCP when considering all months (Fig. S5a), though weaker than the observed signals under El Niño and La Niña conditions. In other models, the response is generally weaker, and the spatial distribution of anomalies is inconsistent across models. In LN, the models also fail to show a clear precipitation signal in the Pacific, although EC-EARTH, ECHAM5sh, WACCM, and MIROC-ESM exhibit a response over the Indian Ocean and Australia. A multi-model mean response (Fig. S5) illustrates the lack of model agreement, with the mean QBO signal effectively vanishing across the tropics. This suggests little consensus among models regarding both the spatial distribution and the sign of the tropical precipitation response to the QBO phase. Figure S6 further supports this, showing DJF seasonal OLR differences between QBO-W and QBO-E in EN and LN, alongside ERA5. None of the models reproduce the observed OLR signal, and some (EC-EARTH, ECHAM5sh, LMDz, and GISS) show OLR (and precipitation; Fig. 8) responses that differ distinctly between EN and LN, especially over the equatorial Pacific. In summary, there is no robust or consistent precipitation response to the phase of the QBO across models or experiments.
Previous studies have shown that the QBO signal during DJF is particularly strong in specific regions of the tropical Pacific: the western equatorial Pacific (WEP, 5° S–5° N, 120–170° E) and the Niño3.4 region (EN3.4, 5° S–5° N, 170–120° W) (Gray et al., 2018; Serva et al., 2022; García-Franco et al., 2022). To test the sensitivity of precipitation in these regions to the QBO phase, we analyze the area-averaged precipitation in both regions as a function of QBO and ENSO phases (Fig. S7). The QBOi models show considerable spread in the precipitation climatology. However, all simulations reproduce the observed ENSO signal: wetter conditions in the EN3.4 region and drier conditions in the WEP in EN, with the opposite pattern in LN, regardless of the QBO phase.
Figure 9 shows the area-averaged precipitation differences (QBO-W minus QBO-E) for the WEP and EN3.4 regions in the CTL, EN, and LN experiments, along with ENSO-neutral, El Niño, and La Niña winters from GPCP. In observations, the precipitation signal associated with the QBO during El Niño is opposite in sign to that during La Niña. However, these results should be interpreted with caution due to the small sample size (approximately 3–5 winters in each composite). Regardless of the observed sign and magnitude, the models generally disagree on the sign of the precipitation response in each experiment. For example, while the QBO signal during La Niña is positive over the WEP in observations and most models agree, only five out of seven models capture this positive response. GISS and MIROC-ESM show positive precipitation signals in the WEP across all three experiments. However, in the EN3.4 region, none of the models reproduce consistent QBO-related responses across all three experiments.
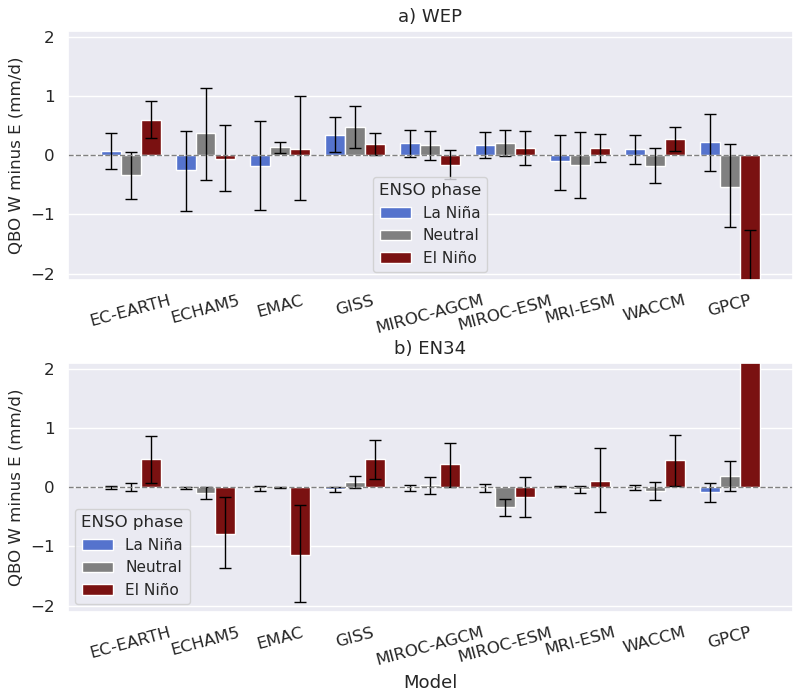
Figure 9Box plots of QBO-W minus QBO-E differences in DJF precipitation (mm d−1) for (a) the western equatorial Pacific (WEP) and (b) the EN3.4 region (5° S–5° N, 170–120° W). Error bars represent the 95 % confidence interval. The y-axis is fixed for clarity; however, an alternative version with y-axis limits set according to the GPCP scale is provided in Fig. S8.
One possible reason for the inter-model and inter-experiment spread in precipitation response is variability in QBO-related temperature anomalies at the equator, arising from the QBO-induced mean meridional circulation and thermal wind balance. The QBO's impact on the tropical tropopause layer (TTL) is important for its teleconnection via the tropical pathway (Haynes et al., 2021; Hitchman et al., 2021). A common hypothesis is that when a cold QBO anomaly occurs in the TTL, convection can penetrate to higher altitudes, locally amplifying the zonal-mean QBO cold anomaly (Tegtmeier et al., 2020). Figure 10 shows a scatter plot of the QBO-W minus QBO-E temperature differences at 100 hPa versus precipitation differences over the WEP. One might expect models that have larger TTL temperature signals or static stability to also show stronger precipitation signals. ERA5 shows larger QBO differences in TTL temperature than the models, with the strongest signals occurring during El Niño winters. Also, the GPCP precipitation signal is largest during El Niño, possibly due to the coincidence of the strongest El Niño events with the westerly QBO phase. Removing these strongest El Niño events (1982–1983, 1997–1998, 2015–2016) significantly alters GPCP precipitation signal (Fig. S4). For the all-winter composites, the Pacific signal dramatically weakens when excluding these cases (Fig. S4a, b). During the El Niño winters, only the eastern Pacific significantly changes. Some models, such as GISS and ECHAM5sh, exhibit strong temperature signals and strong negative precipitation signals in LN. However, most models show modest positive temperature differences without a clear precipitation signal. Overall, the QBOi models underestimate QBO TTL temperature anomalies (Serva et al., 2022), which may explain their weak precipitation signals.
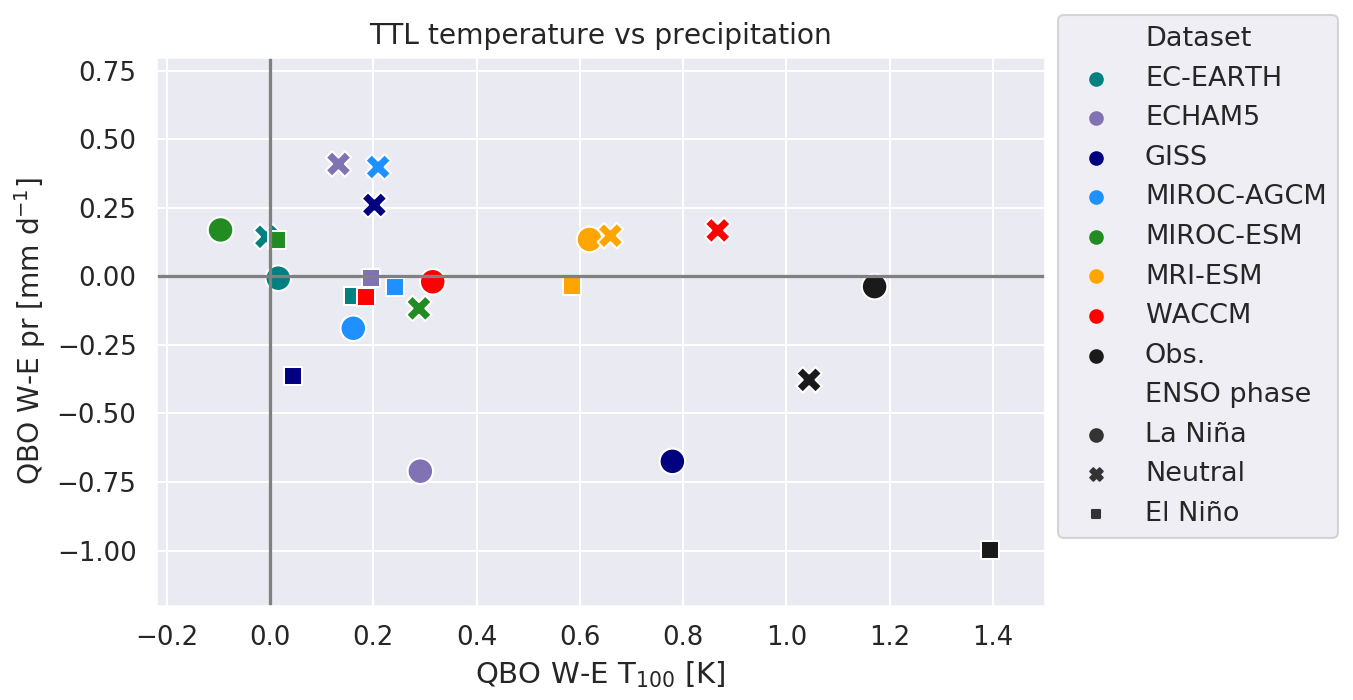
Figure 10Scatter plot of DJF temperature differences at 100 hPa (QBO-W minus QBO-E, in K) versus precipitation differences (QBO-W minus QBO-E, in mm d−1), both averaged over the western equatorial Pacific region. The correlation coefficient of the best-fit line for all data, including observations, is −0.48, which is significant at the 95 % confidence level according to a t-test. Without observations, the correlation is −0.25. Under El Niño conditions, the correlation is −0.82, while under La Niña conditions, it is −0.20.
5.2 Walker circulation
In this subsection, we examine whether the QBO's impact on the Walker circulation can be detected across different ENSO phases. A recent study (Rodrigo et al., 2025) showed that, in reanalyses, the QBO signal in the divergent circulation is strongest over the Maritime Continent during JJA, followed by autumn (SON), and weakest in DJF. However, under El Niño and La Niña conditions, this timing may shift slightly, potentially due to ENSO's influence on the QBO itself (Taguchi, 2010b; Kawatani et al., 2025). Additionally, model diversity and biases in the simulated QBO (Bushell et al., 2022) may contribute to inter-model variations in the simulated QBO teleconnection. We begin our analysis by applying a common QBO definition and target season across all models, using the zonal-mean zonal wind at 70 hPa during JJA to define the QBO phase. With this approach, we identify a coherent signal characterized by anomalous westerlies in the upper troposphere and anomalous easterlies in the lower troposphere over the Indian Ocean–Maritime Continent region, in both observations and some models across the CTL, LN, and EN experiments (Figs. S9, S10, and S11). To strengthen this signal and capture the strongest response in each model, we allow minor adjustments to the QBO definition and target season when necessary.
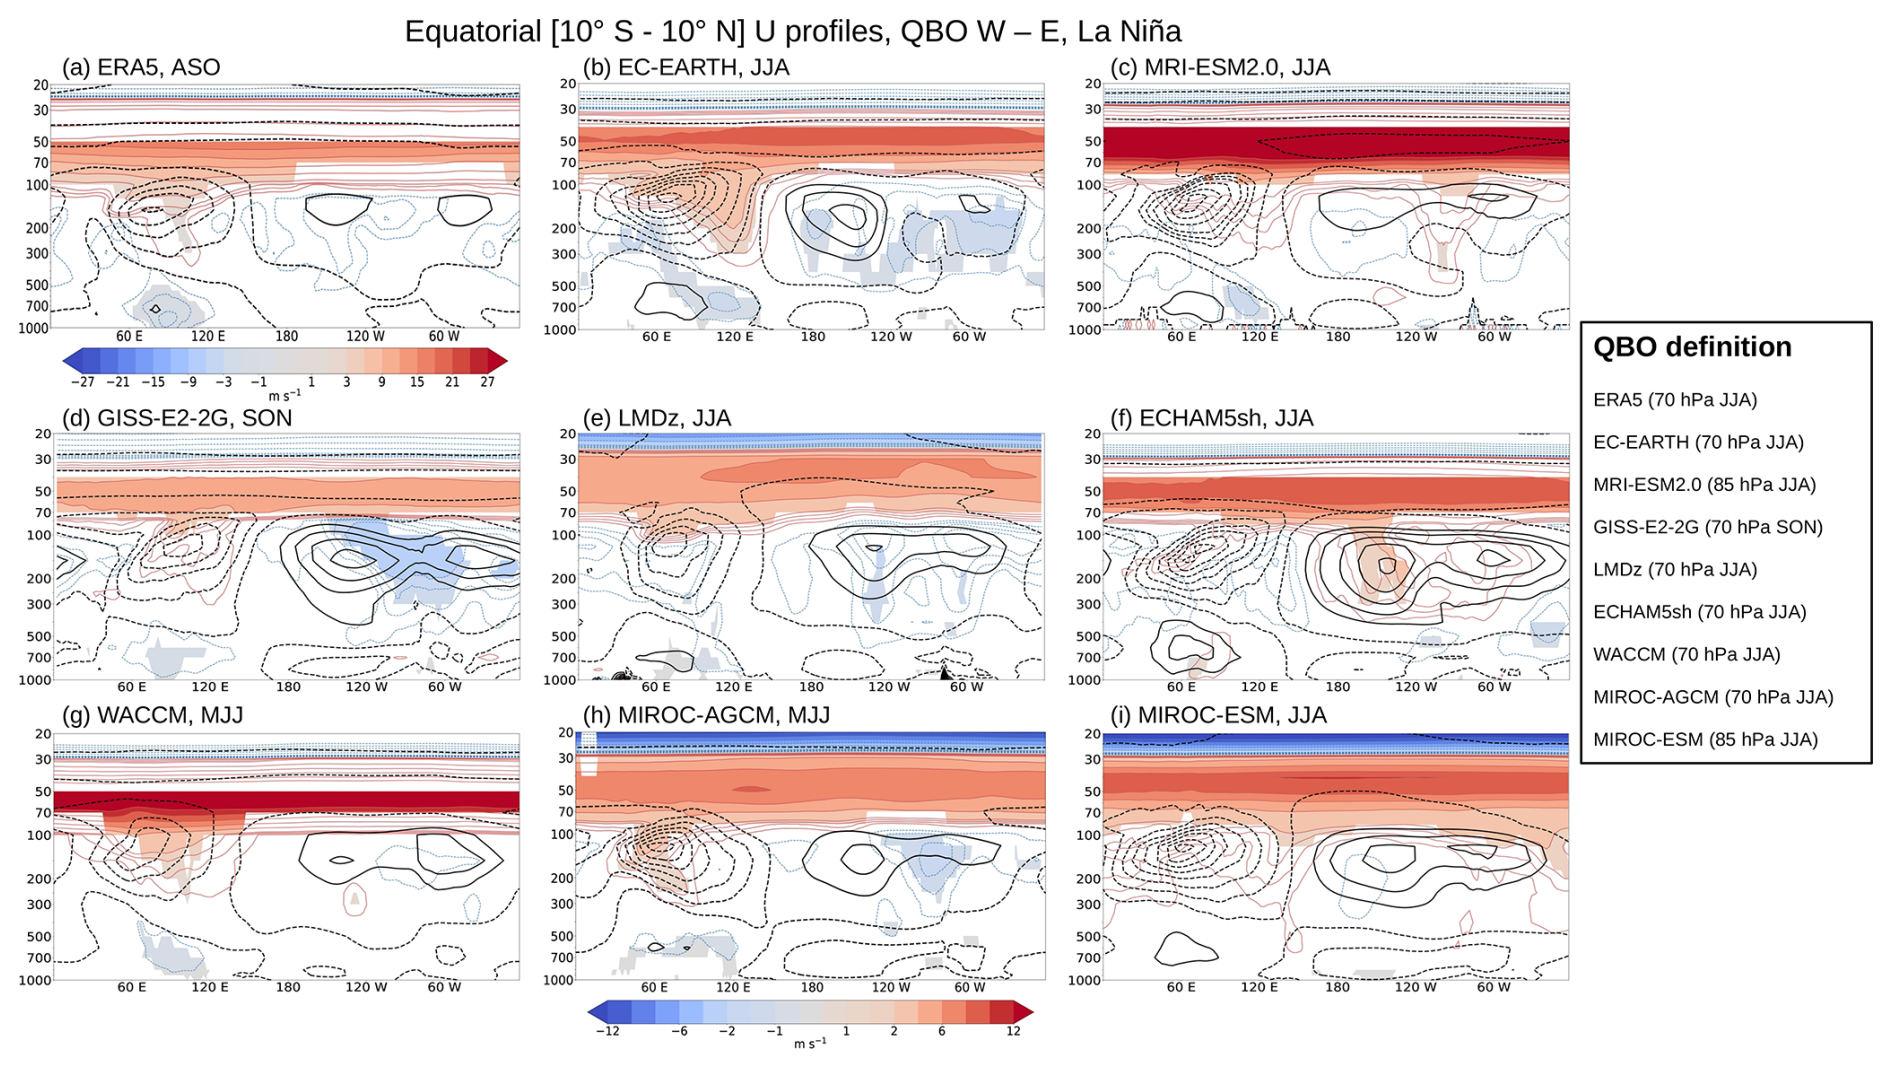
Figure 11Climatology (black contours) and QBO-W minus QBO-E differences (shading and colored contours) in equatorial zonal wind profiles, averaged over 10° S–10° N, from the LN experiment for the QBOi models, along with La Niña winters in ERA5. Black contours are drawn at 4 m s−1 intervals. Colored contours use the same intervals as the shading, with red contours indicating positive differences and blue contours indicating negative differences. The target season for each panel is indicated in the title, with the QBO definition provided in the legend. QBO phases are classified based on deseasonalized zonal-mean zonal wind at 70 or 85 hPa in summer and autumn (see the legend), with values ≥σ (standard deviation) indicating QBO-W and indicating QBO-E. In ERA5, 16 La Niña events are identified using the NINO3 index during DJF. The numbers of QBO phase categories (QBO-W, QBO-E) in ERA5 are (8, 8) for these events, with values ≥ 0 m s−1 indicating QBO-W and ≤ 0 m s−1 indicating QBO-E. Only statistically significant zonal wind differences at the 95 % confidence level are shaded. For models using a QBO definition other than 70 hPa during JJA, the Bonferroni correction is applied (see Sect. 2). Note that the color bar for ERA5 differs due to the larger QBO amplitude.
Figure 11 illustrates the QBO zonal wind signal averaged over 10° S–10° N in LN, represented by the QBO-W minus QBO-E composite (shading), with climatological winds superimposed (black contours). In ERA5 during La Niña (Fig. 11a), the August–September–October (ASO) climatology shows upper-level easterlies over the Eastern Hemisphere and westerlies over the Western Hemisphere, with a weaker, opposite pattern in the lower troposphere. A distinct QBO signal is observed in the equatorial troposphere over the Indian Ocean–Maritime Continent. This signal is characterized by anomalous westerlies in the upper troposphere (red contours and shading) and anomalous easterlies in the lower troposphere (blue contours and shading). Relative to the climatology, this signal represents a weakening of the zonal circulation over the Indian Ocean–Maritime Continent. Similar QBO-related anomalies to those observed in ERA5 for La Niña – featuring upper-level westerlies and lower-level easterlies – are also found in most models in LN experiments (Fig. 11b–i), although their precise locations vary and the lower-level anomalies are generally weaker. Specifically, the strongest signals are found in EC-EARTH, MRI-ESM2.0, LMDz, and MIROC-AGCM during JJA; GISS during SON; and WACCM during MJJ. In contrast, ECHAM5sh and MIROC-ESM show no significant signal. The QBO-W minus QBO-E composite in CTL shows a similar signal to that in LN in most models during JJA or SON (Fig. S12). This modulation of the tropical circulation by the QBO appears robust, despite variations in timing and longitudinal location.
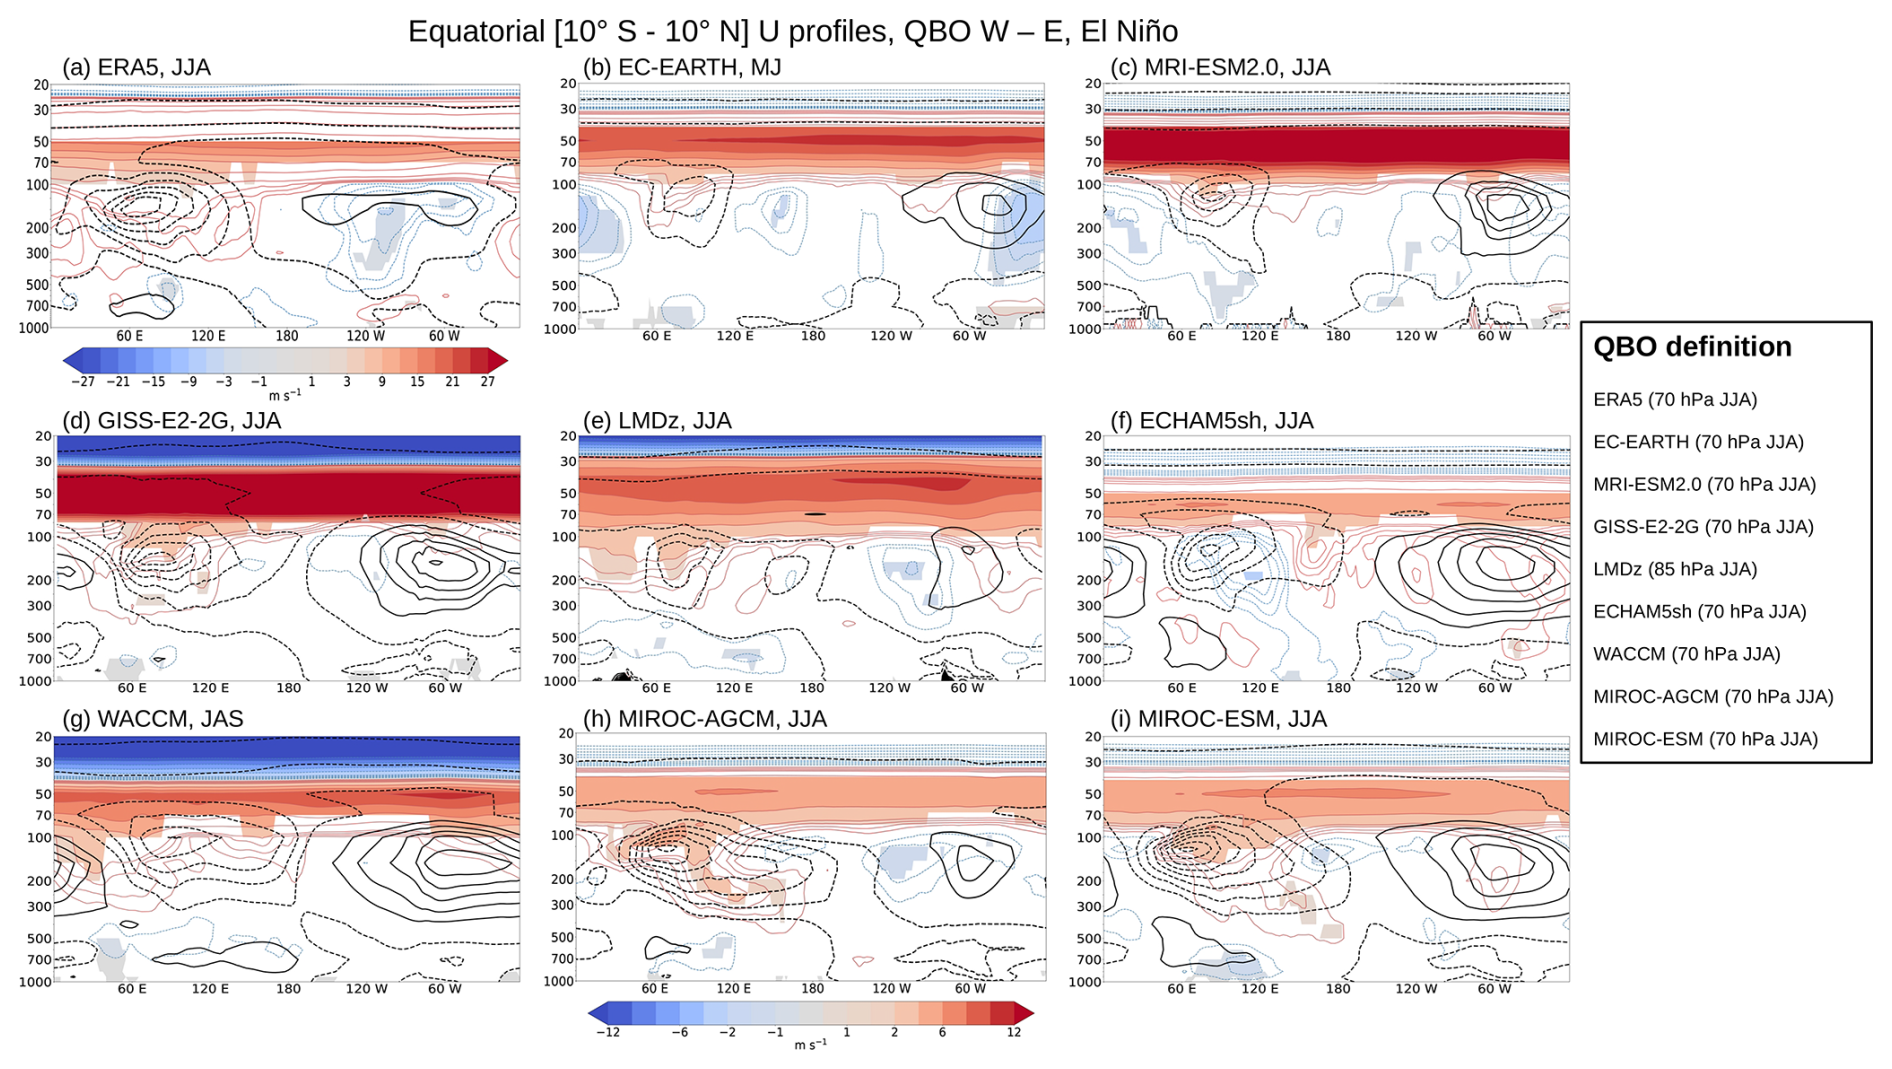
Figure 12Same as Fig. 11, but for EN experiments, along with El Niño events in ERA5. In ERA5, 14 El Niño events are identified, with QBO phase categories (QBO-W, QBO-E) of (7, 7).
During El Niño in ERA5 (Fig. 12a), the QBO signal in the equatorial troposphere resembles that observed during La Niña, although it occurs during JJA and is weaker. It also shows anomalous westerlies in the upper troposphere over the Indian Ocean–Maritime Continent and anomalous easterlies in the lower troposphere. As in LN, this anomalous zonal circulation indicates a weakening of the climatological pattern. Comparable anomalies, with upper-level westerlies and lower-level easterlies over the same region, are also present in most models. The strongest signals are found in EC-EARTH during MJ; in MRI-ESM2.0, GISS, LMDz, MIROC-AGCM, and MIROC-ESM during JJA; and in WACCM during JAS. By contrast, ECHAM5sh shows only a weak response that differs from the other models.
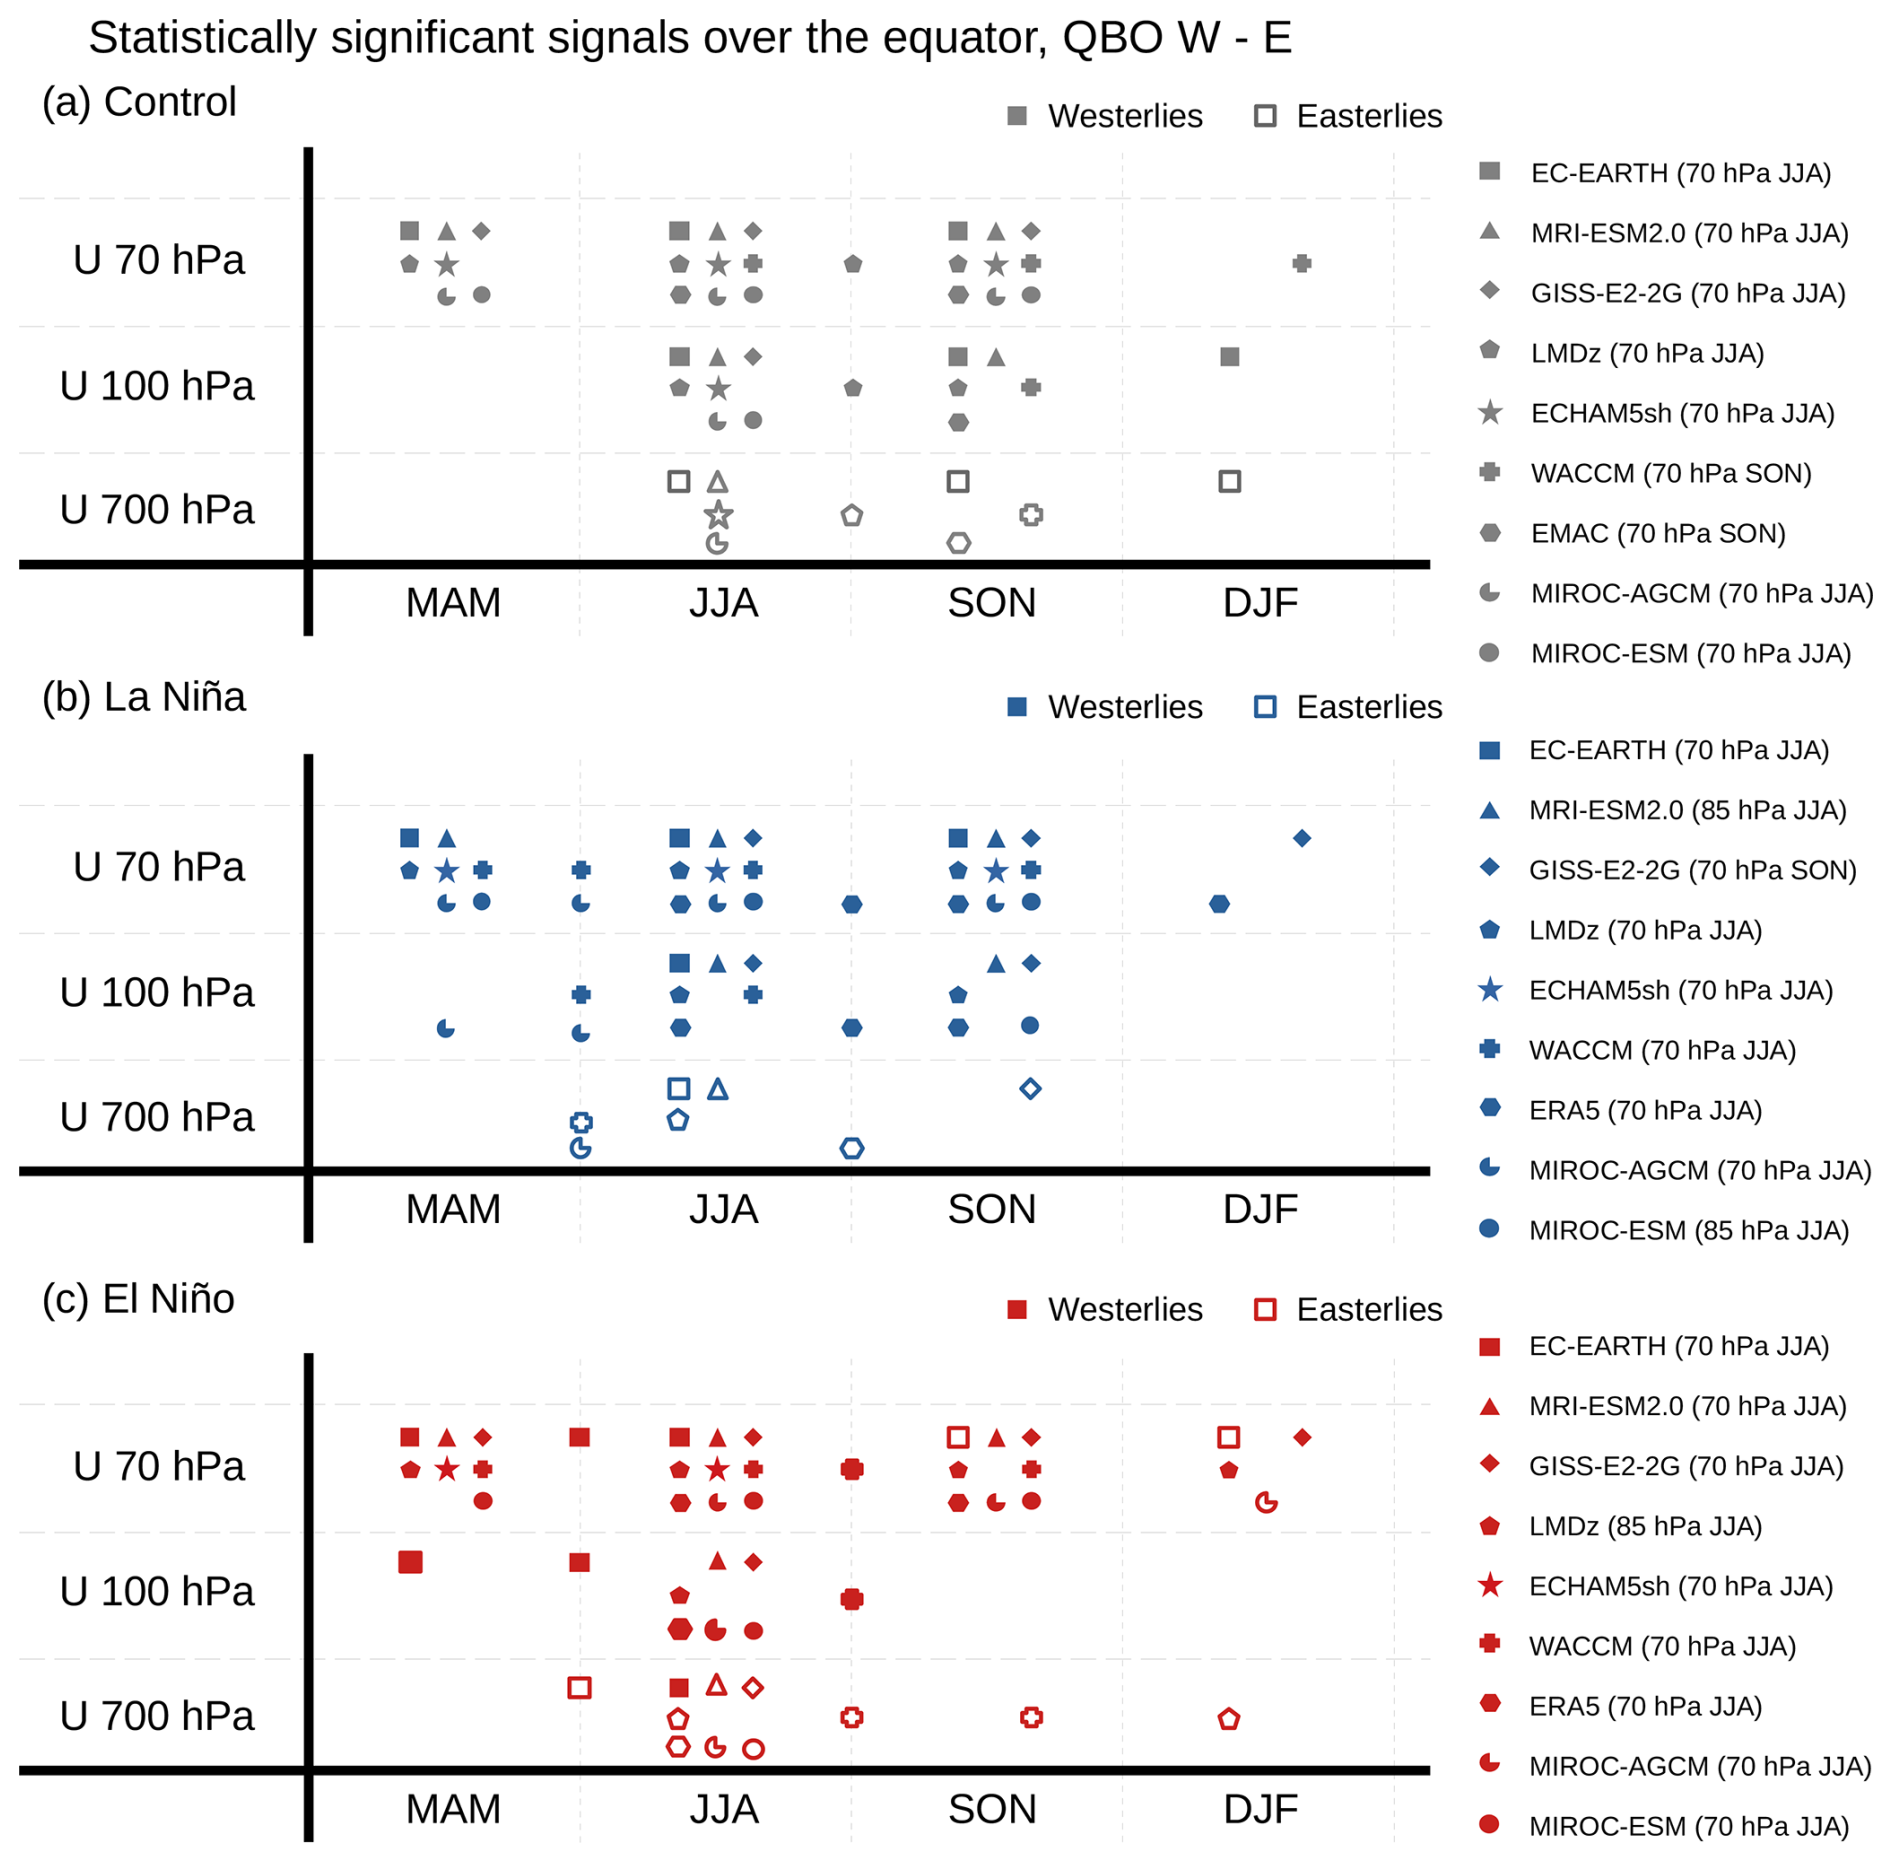
Figure 13(a) Occurrence of statistically significant zonal wind signals by model, season, and altitude over the equatorial band (10° S–10° N, 60–120° E) for the (a) CTL, (b) LN, and (c) EN experiments. QBO-W minus QBO-E zonal wind signals are evaluated at three vertical levels and across the four standard seasons. Symbols are placed between standard seasons when the strongest signal occurs during an intermediate period. Filled symbols represent westerly anomalies, while open symbols indicate easterly anomalies. The QBO definition for each model and experiment is provided in the legend and are the same as Figs. 11, 12, and S12.
Figure 13 presents a summary diagram showing the timing and location of statistically significant QBO-W minus QBO-E composite differences in equatorial zonal wind (10° S–10° N) across all three experiments, at three representative vertical levels (700, 100, and 70 hPa) and over the four standard seasons. These statistically significant signals are identified by analyzing the influence of the QBO on zonal winds within the longitudinal band from 60 to 120° E. An example from the EC-EARTH CTL experiment is shown in Fig. S13. The QBO phase is consistently defined for the specific season indicated in the legend (i.e., it does not vary seasonally). In some models, the strongest signals occur during transitional periods between standard seasons; in such cases, the corresponding symbols are placed accordingly. Across all three experiments, nearly all models, along with ERA5, exhibit a tropospheric signal characterized by upper-level (100 hPa) westerly anomalies during various seasons from May to November, while about half of the models and the observations show lower level (700 hPa) easterly anomalies. This pattern suggests a weakening of the climatological Walker circulation over the Indian Ocean–Maritime Continent. Exceptions include GISS in CTL, MIROC-ESM in CTL and LN, and ECHAM5sh in LN and EN (see Figs. 11, 12, and S12). Overall, this figure illustrates that the QBO, when defined around JJA and SON, modulates the zonal circulation in the equatorial troposphere over the Indo–Pacific region. ERA5 shows a consistent signal during both La Niña and El Niño years, which is reproduced by some models with variations in season, longitude, or the level used to define the QBO, but is absent in others. It is important to note that the QBOiENSO experiments are idealized, and ERA5 results are not directly comparable.
In this paper, we examine QBO teleconnections modulated by ENSO in the Arctic stratosphere, the subtropical Pacific jet, and the tropical troposphere. We use a multi-model ensemble of QBO-resolving models that performed the QBOiENSO experiments to evaluate the robustness of these teleconnections. Distinguishing the respective influences of the QBO and ENSO on the extratropics and tropical troposphere can be challenging because of the observed aliasing between these phenomena. To address this, we conduct model integrations with annually repeating prescribed SSTs representative of either strong El Niño or La Niña conditions, thereby simplifying ENSO forcing compared with the diversity of observed ENSO phases. We reexamine QBO teleconnections to the extratropics and tropics previously explored in QBOi studies (Anstey et al., 2022c; Serva et al., 2022), now focusing on combined QBO–ENSO influences using this new dataset of QBOi idealized ENSO experiments.
The Holton–Tan relationship in ERA5 indicates that the polar vortex is significantly stronger (weaker) under QBO-W (QBO-E) across all ENSO phases, with the strongest response occurring during La Niña. Nearly half of the models simulate a stronger polar vortex during NH winter under QBO-W for each experiment, consistent with but much weaker than the observed response, reaching at most half of the observed amplitude (Fig. 2). The seasonal evolution of the QBO in ERA5 reveals a stronger signal in early winter during El Niño and in late winter during La Niña. In the LN experiment, two of nine models capture the observed late-winter response relatively well, while the others show little or no response, or even an opposite response (Fig. 3).
Major SSWs occur more frequently during both El Niño and La Niña winters than during ENSO-neutral winters in ERA5. Most models show an increased number of events during EN but fail to capture the LN response, suggesting that the QBOi models struggle to reproduce observed SSW statistics (Fig. 4). Major SSW frequencies vary strongly with both QBO and ENSO phases in ERA5, whereas SSW frequencies between QBO-W and QBO-E phases are indistinguishable in the models. These results indicate that polar vortex responses to idealized ENSO forcing in the QBOi models are strong, whereas responses to equatorial QBO phases are relatively weak (Fig. 5), independently from the level used to define the QBO (50 or 30 hPa).
Changes in the APJ in response to the QBO are examined (Figs. 6 and 7), with a focus on late winter, when the subtropical jet pathway is strongest in observations. Observational data show that the APJ shifts equatorward during QBO-W winters compared with QBO-E winters associated with a horseshoe-shaped pattern extending from the tropical lower stratosphere to the subtropical lower troposphere; however, most models underestimate or fail to reproduce this observed QBO–APJ relationship. The observed APJ shifts equatorward under QBO-W during ENSO-neutral and La Niña winters, but it is insignificant during El Niño winters. This APJ-shift index is not robust across models. None of the models show a statistically significant shift of the APJ in response to the QBO, regardless of the ENSO phase. We also examine whether the subtropical-jet pathway of the QBO teleconnection is influenced by the QBO amplitude and/or the climatological position of the subtropical jet. Most QBOi models underestimate the QBO amplitude, whereas models with larger QBO amplitudes do not necessarily exhibit stronger jet responses nor do models with smaller amplitudes consistently show weaker responses. Hence, neither the QBO amplitude nor the APJ position explains the inter-model spread in the QBO–APJ connection. Other factors, such as transient and stationary eddies, likely play a role in determining the QBO–APJ connection.
The impact of the QBO on the troposphere is examined, focusing on tropical precipitation (Figs. 8–10) and the Walker circulation (Figs. 11–13). In the GPCP dataset, the positive equatorial Pacific signal with an El Niño–like anomaly in the QBO-W minus QBO-E differences is particularly strong and statistically significant during DJF. Although most models do not reproduce El Niño–like precipitation anomaly patterns in either the EN or LN experiments, some models show significant precipitation signals over the Indian Ocean and Australia. The precipitation response to the QBO phase in these experiments varies by model, region, and ENSO phase, with no consistent response across experiments for each model. To investigate the causes of discrepancies between models and observations, we analyze the strength of the QBO impact on the TTL region, which is considered important for the QBO teleconnection along the tropical pathway. Overall, the QBOi models produce too-weak wind amplitudes and too-weak temperature anomalies in the lower stratosphere.
The QBO teleconnection to the Walker circulation is strongest in observations over the Indian Ocean–Maritime Continent region during boreal summer, followed by autumn, and weakest in winter (Rodrigo et al., 2025). This timing may shift slightly potentially due to ENSO's influence on the QBO itself, and model diversity and biases may cause variability in simulating QBO teleconnections. Thus, we identified the strongest signal for each model by defining the QBO across different seasons (JJA or SON) and vertical levels (85 or 70 hPa). In ERA5, the equatorial troposphere has a QBO signal that is characterized by upper-level westerly and lower-level easterly anomalies over the Indian Ocean–Maritime Continent region, which does not have high sensitivity to the ENSO phase. Most models reproduce a similar pattern across all three experiments, although the lower-level anomalies are generally weaker. This modulation of the tropical circulation by the QBO appears spatially consistent, although its timing varies.
We now consider three issues related to modeling the complexity of QBO–ENSO interaction raised by these results: forced SSTs, the seasonality and variability of the Walker circulation, and biases in the QBO and other processes.
First, the climate system's response to ENSO forcing tends to be nonlinear with respect to ENSO intensity and asymmetric with respect to ENSO phases (Domeisen et al., 2019; Rao and Ren, 2016a, b). This nonlinearity complicates the identification of physically meaningful mechanisms and limits understanding of QBO–ENSO teleconnections. Therefore, conducting idealized experiments, such as our QBOiENSO experiments, could help clarify physically robust mechanisms within this complex system. The experimental design of QBOiENSO (Kawatani et al., 2025) is annually repeating, using inflated monthly mean ENSO anomalies. However, most QBOi models in the three experiments (CTL, EN, and LN) fail to reproduce QBO-related, El Niño–like precipitation anomalies as observed in the GPCP dataset, whereas such precipitation patterns are captured by some QBOi models in QBOi Experiment 1 of the AMIP-type with interannually varying SSTs (Serva et al., 2022) and by other models in AMIP-type experiments (García-Franco et al., 2022). This suggests that the QBO's downward influence on tropical precipitation may be overly sensitive to model physics or muted by the absence of SST feedbacks (García-Franco et al., 2023; Randall et al., 2023), or affected by biases in climatological winds and precipitation characteristics.
Next, we emphasize the importance of seasonality in shaping the combined effects of the QBO and ENSO on the tropical troposphere. Our results indicate that QBO teleconnections with the Walker circulation vary seasonally and display a distinct zonally asymmetric pattern. These findings underscore the need for further investigation to clarify the drivers of this seasonal dependence, the causes of the asymmetry, and the mechanisms governing these interactions. We also note that tropical convection is inherently coupled with the ocean. Long-term simulations with coupled general circulation models (CGCMs) would provide a useful framework for testing QBO–ENSO teleconnections arising from internal variability of the coupled ocean–atmosphere system (García-Franco et al., 2023; Randall et al., 2023).
Finally, common systematic model biases hinder QBO teleconnections to both the extratropics and the tropical troposphere. In the extratropical stratosphere, previous studies using QBOi models have suggested that the systematic weakness of the QBO–polar vortex coupling arises from consistently weak QBO amplitudes at lower levels in the equatorial stratosphere, biases in the wintertime polar vortex, and inadequate representation of stratosphere–troposphere coupling (Bushell et al., 2022; Richter et al., 2022; Anstey et al., 2022c). Our results confirm that these unrealistically weak low-level QBO amplitudes reduce the QBO teleconnections with both the polar vortex and the APJ.
In the tropics, models commonly exhibit weak QBO amplitudes in the lower stratosphere, which limit the effectiveness of stratosphere–troposphere coupling processes (Oueslati and Bellon, 2013; Richter et al., 2020; García-Franco et al., 2022, 2023). Unrealistic variability also emerges in QBOiENSO experiments, with occasional stalling of simulated QBOs (Kawatani et al., 2025). Additionally, persistent tropospheric biases related to tropical convection and precipitation are evident, including biases in the strength and position of the ITCZ, tropical wave activity, and unrealistic rainfall distributions. These shortcomings typically stem from model parameterizations, particularly those governing convection and cloud microphysics (Oueslati and Bellon, 2013; Hagos et al., 2021; Norris et al., 2021; Zhou et al., 2022). The combination of these stratospheric and tropospheric biases likely weakens the QBO signal in the tropical troposphere and contributes to inter-model differences in the magnitude, timing, and spatial manifestation of the teleconnection.
Phase 2 of the QBOi project is currently underway to assess the impact of QBO biases using zonal-mean nudging toward observations in the QBO region. Bias-corrected QBO amplitudes achieved through nudging may provide valuable insights for improving the representation of QBO teleconnections in both the extratropics and the tropical troposphere.
An archived website of the Grid Analysis and Display System (GrADS) is available at https://web.archive.org/web/20150407042441/ (last access: 4 November 2025; Doty and Kinter III, 1995). Python version 3 is available at http://www.python.org (last access: 9 October 2025). MATLAB is available in Japan at https://jp.mathworks.com/products/matlab.html (last access: 9 October 2025; The MathWorks, Inc., 2025).
The QBOi data archive was hosted by the Centre for Environmental Data Analysis (CEDA), UK, and data processing was performed on the JASMIN infrastructure. ERA5 reanalysis data (Hersbach et al., 2020) can be available from the ECMWF website (https://www.ecmwf.int/en/forecasts/datasets/browse-reanalysis-datasets, last access: 24 October 2024). The El Niño Monitoring Index (NINO.3) was obtained from the Japan Meteorological Agency's ENSO monitoring site: https://ds.data.jma.go.jp/tcc/tcc/products/elnino/index.html (last access: 31 January 2023; Japan Meteorological Agency, 2023). GPCP v2.3 data were downloaded from https://doi.org/10.7289/V56971M6 (Adler et al., 2016).
The supplement related to this article is available online at https://doi.org/10.5194/wcd-6-1419-2025-supplement.
YK, KH, JAA, and JHR designed the QBOiENSO–QBO experiments. JGS, FMP, FS, TK, SV, CO, FL, YK, SW, KY, HN, JHR, CCC, AG, and MP generated the model experiment data and uploaded them to CEDA. HN, JLGF, CHP, MR, FMP, FS, and MT conducted the analyses, prepared the figures, and contributed to the manuscript. JA, JGS, SWS, NB, and SO contributed to the interpretation of the results. The first draft of the manuscript was prepared by HN, with input from all authors on the final version.
The contact author has declared that none of the authors has any competing interests.
Publisher's note: Copernicus Publications remains neutral with regard to jurisdictional claims made in the text, published maps, institutional affiliations, or any other geographical representation in this paper. While Copernicus Publications makes every effort to include appropriate place names, the final responsibility lies with the authors. Views expressed in the text are those of the authors and do not necessarily reflect the views of the publisher.
The Editor, David Battisti, and two anonymous referees provided detailed and substantive reviews of the manuscript. Their efforts are greatly appreciated by the authors and contributed substantially to improving the final version. All authors acknowledge CEDA for kindly hosting the QBOi data archive. Numerical simulations with the MIROC models were performed on the Earth Simulator. The ECHAM5sh simulations were made possible thanks to an ECMWF Special Project awarded to FS. The AI program ChatGPT was used to refine the language in portions of the final draft. The manuscript does not contain any extended passages written by the AI program. GrADS, Python, and MATLAB were used to analyze data and draw figures. TK and SV acknowledge support by the state of Baden-Württemberg through bwHPC for the EMAC simulations.
HN was supported by MEXT, JSPS KAKENHI (grant numbers JP22H04493, JP24K07140); HN and KY were supported by JSPS KAKENHI JP24K00710. YK was supported by JSPS KAKENHI (JP22K18743) and by the Environment Research and Technology Development Fund (JPMEERF20242001) of the Environmental Restoration and Conservation Agency, provided by Ministry of the Environment of Japan, and MEXT program for the advanced studies of climate change projection (SENTAN) Grant Number JPMXD0722680395. YK and SW were supported by JSPS KAKENHI (JP22H01303 and JP23K22574). SW was also supported by the MEXT Program for Advanced Studies of Climate Change Projection (SENTAN) Grant Number JPMXD0722681344. CP and SS were funded by the Korea Meteorological Administration Research and Development Program (RS-2025-02307979). MR was supported by the 'Ayudas para la Formación de Profesorado Universitario' programme (FPU20/03517). FMP was supported by the EU/HORIZON-funded MSCA-IF-GF SD4SP project (GA 101065820). JGS acknowledges funding from the Spanish DYNCAST project (CNS2022-135312). JLGF was supported by Programa de Apoyo a Proyectos de Investigación e Innovación Tecnológica (PAPIIT-IA101024). NB was funded by the Met Office Climate Science for Service Partnership (CSSP) China project under the International Science Partnerships Fund (ISPF).
This paper was edited by David Battisti and reviewed by two anonymous referees.
Adler, R. F., Huffman, G. J., Chang, A., Ferraro, R., Xie, P.-P., Janowiak, J., Rudolf, B., Schneider, U., Curtis, S., Bolvin, D., Gruber, A., Susskind, J., Arkin, P., and Nelkin, E.: The Version-2 Global Precipitation Climatology Project (GPCP) monthly precipitation analysis (1979–present), J. Hydrometeorol., 4, 1147–1167, https://doi.org/10.1175/1525-7541(2003)004<1147:TVGPCP>2.0.CO;2, 2003.
Adler, R., Wang, J. J., Sapiano, M., Huffman, G., Chiu, L., Xie, P.-P., Ferraro, R., Schneider, U., Becker, A., Bolvin, D., Nelkin, E., Gu, G., and NOAA CDR Program: Global Precipitation Climatology Project (GPCP) Climate Data Record (CDR), Version 2.3 (Monthly), National Centers for Environmental Information [data set], https://doi.org/10.7289/V56971M6, 2016.
Anstey, J. A. and Shepherd, T. G.: High-latitude influence of the quasi-biennial oscillation, Q. J. R. Meteorol. Soc., 140, 1–21, https://doi.org/10.1002/qj.2132, 2014.
Anstey, J. A., Butchart, N., Hamilton, K., and Osprey, S. M.: The SPARC quasi-biennial oscillation initiative, Q. J. R. Meteorol. Soc., 148, 1455–1458, https://doi.org/10.1002/qj.3820, 2022a.
Anstey, J. A., Osprey, S. M., Alexander, J., Baldwin, M. P., Butchart, N., Gray, L., Kawatani, Y., and Richter, J. H.: Impacts, processes and projections of the quasi-biennial oscillation, Nat. Rev. Earth Environ., 3, 588–603, https://doi.org/10.1038/s43017-022-00323-7, 2022b.
Anstey, J. A., Simpson, I. R., Richter, J. H., Naoe, H., Taguchi, M., Serva, F., Gray, L. J., Butchart, N., Hamilton, K., Osprey, S., Bellprat, O., Braesicke, P., Bushell, A. C., Cagnazzo, C., Chen, C.-C., Chun, H.-Y., Garcia, R. R., Holt, L., Kawatani, Y., Kerzenmacher, T., Kim, Y.-H., Lott, F., McLandress, C., Scinocca, J., Stockdale, T. N., Versick, S., Watanabe, S., Yoshida, K., and Yukimoto, S.: Teleconnections of the quasi-biennial oscillation in a multi-model ensemble of QBO-resolving models, Q. J. R. Meteorol. Soc., 148, 1568–1592, https://doi.org/10.1002/qj.4048, 2022c.
Baldwin, M. P., Gray, L. J., Dunkerton, T. J., Hamilton, K., Haynes, P. H., Randel, W. J., Holton, J. R., Alexander, M. J., Hirota, I., Horinouchi, T., Jones, D. B. A., Kinnersley, J. S., Marquardt, C., Sato, K., and Takahashi, M.: The quasi-biennial oscillation, Rev. Geophys., 39, 179–229, https://doi.org/10.1029/1999RG000073, 2001.
Boer, G. J. and Hamilton, K.: QBO influence on extratropical predictive skill, Clim. Dyn., 31, 987–1000, https://doi.org/10.1007/s00382-008-0379-5, 2008.
Bushell, A. C., Anstey, J. A., Butchart, N., Kawatani, Y., Osprey, S. M., Richter, J. H., Serva, F., Braesicke, P., Cagnazzo, C., Chen, C.-C., Chun, H.-Y., Garcia, R. R., Gray, L. J., Hamilton, K., Kerzenmacher, T., Kim, Y.-H., Lott, F., McLandress, C., Naoe, H., Scinocca, J., Smith, A. K., Stockdale, T. N., Versick, S., Watanabe, S., Yoshida, K., and Yukimoto, S.: Evaluation of the quasi-biennial oscillation in global climate models for the SPARC QBO-initiative, Q. J. R. Meteorol. Soc., 148, 1459–1489, https://doi.org/10.1002/qj.3765, 2022.
Butchart, N., Anstey, J. A., Hamilton, K., Osprey, S., McLandress, C., Bushell, A. C., Kawatani, Y., Kim, Y.-H., Lott, F., Scinocca, J., Stockdale, T. N., Andrews, M., Bellprat, O., Braesicke, P., Cagnazzo, C., Chen, C.-C., Chun, H.-Y., Dobrynin, M., Garcia, R. R., Garcia-Serrano, J., Gray, L. J., Holt, L., Kerzenmacher, T., Naoe, H., Pohlmann, H., Richter, J. H., Scaife, A. A., Schenzinger, V., Serva, F., Versick, S., Watanabe, S., Yoshida, K., and Yukimoto, S.: Overview of experiment design and comparison of models participating in phase 1 of the SPARC Quasi-Biennial Oscillation initiative (QBOi), Geosci. Model Dev., 11, 1009–1032, https://doi.org/10.5194/gmd-11-1009-2018, 2018.
Butler, A. H. and Polvani, L. M.: El Niño, La Niña, and stratospheric sudden warmings: A reevaluation in light of the observational record, Geophys. Res. Lett., 38, L13807, https://doi.org/10.1029/2011GL048084, 2011.
Butler, A. H., Seidel, D. J., Hardiman, S. C., Butchart, N., Birner, T., and Match, A.: Defining sudden stratospheric warmings, Bull. Am. Meteor. Soc., 96, 1913–1928, https://doi.org/10.1175/BAMS-D-13-00173.1, 2015.
Calvo, N., Giorgetta, M. A., Garcia-Herrera, R., and Manzini, E.: Nonlinearity of the combined warm ENSO and QBO effects on the Northern Hemisphere polar vortex in MAECHAM5 simulations, J. Geophys. Res., 114, D13109, https://doi.org/10.1029/2008JD011445, 2009.
Camp, C. D. and Tung, K. K.: Stratospheric polar warming by ENSO in winter: A statistical study, Geophys. Res. Lett., 34, L04809, https://doi.org/10.1029/2006GL028521, 2007.
Capotondi, A. and Sardeshmukh, P. D.: Optimal precursors of different types of ENSO events, Geophys. Res. Lett., 42, 9952–9960, https://doi.org/10.1002/2015GL066171, 2015.
Charlton, A. J. and Polvani, L. M.: A new look at stratospheric sudden warmings. Part I: Climatology and modeling benchmarks, J. Clim., 20, 449–469, https://doi.org/10.1175/JCLI3996.1, 2007.
Collimore, C. C., Martin, D. W., Hitchman, M. H., Huesmann, A., and Waliser, D. E.: On the relationship between the QBO and tropical deep convection, J. Clim., 16, 2552–2568, https://doi.org/10.1175/1520-0442(2003)016<2552:OTRBTQ>2.0.CO;2, 2003.
Crooks, S. A. and Gray, L. J.: Characterization of the 11-year solar signal using a multiple regression analysis of the ERA-40 dataset, J. Clim., 18, 996–1015, https://doi.org/10.1175/JCLI-3308.1, 2005.
Domeisen, D. I., Garfinkel, C. I., and Butler, A. H.: The teleconnection of El Niño Southern Oscillation to the stratosphere, Rev. Geophys., 57, 5–47, https://doi.org/10.1029/2018rg000596, 2019.
Dommenget, D., Bayr, T., and Frauen, C.: Analysis of the nonlinearity in the pattern and time evolution of El Niño Southern Oscillation, Clim. Dyn., 40, 2825–2847, https://doi.org/10.1007/s00382-012-1475-0, 2013.
Doty, B., and Kinter III, J. L.: Geophysical data analysis and visualization using the Grid Analysis and Display System, Visualization Techniques in Space and Atmospheric Sciences, edited by: Szuszczewicz, E. P. and Bredekamp, J. H., National Aeronautics and Space Administration, 209–219, https://ntrs.nasa.gov/citations/19960022591 (last access: 4 November 2025), 1995.
Dunkerton, T. J. and Delisi, D. P.: Climatology of the equatorial lower stratosphere, J. Atmos. Sci., 42, 376–396, 1985.
Elsbury, D., Serva, F., Caron, J. M., Back, S.-Y., Orbe, C., Richter, J. H., Anstey, J. A., Butchart, N., Chen, C.-C., García-Serrano, J., Glanville, A., Kawatani, Y., Kerzenmacher, T., Lott, F., Naoe, H., Osprey, S., Palmeiro, F. M., Son, S.-W., Taguchi, M., Versick, S., Watanabe, S., and Yoshida, K.: QBOi El Niño Southern Oscillation experiments: Assessing relationships between ENSO, MJO, and QBO, EGUsphere [preprint], https://doi.org/10.5194/egusphere-2024-3950, 2025.
Eyring, V., Bock, L., Lauer, A., Righi, M., Schlund, M., Andela, B., Arnone, E., Bellprat, O., Brötz, B., Caron, L.-P., Carvalhais, N., Cionni, I., Cortesi, N., Crezee, B., Davin, E. L., Davini, P., Debeire, K., de Mora, L., Deser, C., Docquier, D., Earnshaw, P., Ehbrecht, C., Gier, B. K., Gonzalez-Reviriego, N., Goodman, P., Hagemann, S., Hardiman, S., Hassler, B., Hunter, A., Kadow, C., Kindermann, S., Koirala, S., Koldunov, N., Lejeune, Q., Lembo, V., Lovato, T., Lucarini, V., Massonnet, F., Müller, B., Pandde, A., Pérez-Zanón, N., Phillips, A., Predoi, V., Russell, J., Sellar, A., Serva, F., Stacke, T., Swaminathan, R., Torralba, V., Vegas-Regidor, J., von Hardenberg, J., Weigel, K., and Zimmermann, K.: Earth System Model Evaluation Tool (ESMValTool) v2.0 – an extended set of large-scale diagnostics for quasi-operational and comprehensive evaluation of Earth system models in CMIP, Geosci. Model Dev., 13, 3383–3438, https://doi.org/10.5194/gmd-13-3383-2020, 2020.
García-Franco, J. L., Gray, L. J., Osprey, S., Chadwick, R., and Martin, Z.: The tropical route of quasi-biennial oscillation (QBO) teleconnections in a climate model, Weather Clim. Dynam., 3, 825–844, https://doi.org/10.5194/wcd-3-825-2022, 2022.
García-Franco, J. L., Gray, L. J., Osprey, S., Jaison, A. M., Chadwick, R., and Lin, J.: Understanding the mechanisms for tropical surface impacts of the quasi-biennial oscillation (QBO), J. Geophys. Res., 128, e2023JD038474, https://doi.org/10.1029/2023JD038474, 2023.
García-Serrano, J., Cassou, C., Douville, H., Giannini, A., and Doblas-Reyes, F. J.: Revisiting the ENSO teleconnection to the tropical North Atlantic, J. Clim., 30, 6945–6957, https://doi.org/10.1175/JCLI-D-16-0641.1, 2017.
Garfinkel, C. I. and Hartmann, D. L.: Effects of the El Niño–Southern Oscillation and the Quasi-Biennial Oscillation on polar temperatures in the stratosphere, J. Geophys. Res., 112, D19112, https://doi.org/10.1029/2007JD008481, 2007.
Garfinkel, C. I. and Hartmann, D. L.: Different ENSO teleconnections and their effects on the stratospheric polar vortex, J. Geophys. Res., 113, D18114, https://doi.org/10.1029/2008JD009920, 2008.
Garfinkel, C. I. and Hartmann, D. L.: The influence of the quasi-biennial oscillation on the troposphere in winter in a hierarchy of models. Part I: Simplified dry GCMs, J. Atmos. Sci., 68, 1273–1289, https://doi.org/10.1175/2011JAS3665.1, 2011a.
Garfinkel, C. I. and Hartmann, D. L.: Influence of the quasi-biennial oscillation on the troposphere in winter in a hierarchy of models. Part II: perpetual winter WACCM runs, J. Atmos. Sci., 68, 2026–2041, https://doi.org/10.1175/2011JAS3702.1, 2011b.
Garfinkel, C. I., Butler, A. H., Waugh, D. W., Hurwitz, M. M., and Polvani, L. M.: Why might stratospheric sudden warmings occur with similar frequency in El Niño and La Niña winters?, J. Geophys. Res., 117, D19106, https://doi.org/10.1029/2012JD017777, 2012a.
Garfinkel, C. I., Shaw, T. A., Hartmann, D. L., and Waugh, D. W.: Does the Holton-Tan mechanism explain how the quasi-biennial oscillation modulates the Arctic polar vortex?, J. Atmos. Sci., 69, 1713–1733, https://doi.org/10.1175/JAS-D-11-0209.1, 2012b.
Garfinkel, C. I., Schwartz, C., Domeisen, D. I. V., Son, S.-W., Butler, A. H., and White, I. P.: Extratropical atmospheric predictability from the quasi-biennial oscillation in subseasonal forecast models, J. Geophys. Res., 123, 7855–7866, https://doi.org/10.1029/2018JD028724, 2018.
Gray, L. J., Anstey, J. A., Kawatani, Y., Lu, H., Osprey, S., and Schenzinger, V.: Surface impacts of the Quasi Biennial Oscillation, Atmos. Chem. Phys., 18, 8227–8247, https://doi.org/10.5194/acp-18-8227-2018, 2018.
Gray, W. M., Scheaffer, J. D., and Knaff, J. A.: Influence of the stratospheric QBO on ENSO variability, J. Meteor. Soc. Japan, 70, 975–995, https://doi.org/10.2151/jmsj1965.70.5_975, 1992.
Hagos, S. M., Leung, L. R., Garuba, O. A., Demott, C., Harrop, B., Lu, J., and Ahn, M. S.: The relationship between precipitation and precipitable water in CMIP6 simulations and implications for tropical climatology and change, J. Clim., 34, 1587–1600, https://doi.org/10.1175/JCLI-D-20-0243.1, 2021.
Hansen, F., Matthes, K., and Wahl, S.: Tropospheric QBO-ENSO interactions and differences between the Atlantic and Pacific, J. Clim., 29, 1353–1368, https://doi.org/10.1175/JCLI-D-15-0164.1, 2016.
Haynes, P., Hitchcock, P., Hitchman, M., Yoden, S., Hendon, H., Kiladis, G., Kodera, K., and Simpson, I.: The influence of the stratosphere on the tropical troposphere, J. Meteorol. Soc. Japan. Ser. II, 99, 803–845, https://doi.org/10.2151/jmsj.2021-040, 2021.
Hersbach, H., Bell, B., Berrisford, P., Hirahara, S., Horányi, A. Muñoz-Sabater, J., Nicolas, J., Peubey, C., Radu, R., Schepers, D., Simmons, A., Soci, C., Abdalla, S., Abellan, X., Balsamo, G., Bechtold, P., Biavati, G., Bidlot, J., Bonavita, M., De Chiara, G., Dahlgren, P., Dee, D., Diamantakis, M., Dragani, R., Flemming, J., Forbes, R., Fuentes, M., Geer, A., Haimberger, L., Healy, S., Hogan, R. J., Holm, E., Janiskova, M., Keeley, S., Laloyaux, P., Lopez, P., Lupu, C., Radnoti, G., de Rosnay, P., Rozum, I., Vamborg, F., Villaume, S., and Thepaut, J.-N.: The ERA5 global reanalysis, Q. J. R. Meteorol. Soc., 146, 1999–2049, https://doi.org/10.1002/qj.3803, 2020.
Hitchman, M. H., Yoden, S., Haynes, P. H., Kumar, V., and Tegtmeier, S.: An observational history of the direct influence of the stratospheric quasi-biennial oscillation on the tropical and subtropical upper troposphere and lower stratosphere, J. Meteorol. Soc. Japan. Ser. II, 99, 239–267, https://doi.org/10.2151/jmsj.2021-012, 2021.
Holm, S.: A simple sequentially rejective multiple test procedure, Scand. J. Statt., 6, 65–70, https://www.jstor.org/stable/4615733 (last access: 15 May 2025), 1979.
Holton, J. R. and Lindzen, R. S.: An updated theory for the quasi-biennial cycle of the tropical stratosphere, J. Atmos. Sci., 29, 1076–1080, https://doi.org/10.1175/1520-0469(1972)029<1076:AUTFTQ>2.0.CO;2, 1972.
Holton, J. R. and Tan, H.-C.: The influence of the equatorial quasi-biennial oscillation on the global circulation at 50 mb, J. Atmos. Sci., 37, 2200–2208, https://doi.org/10.1175/1520-0469(1980)037<2200:TIOTEQ>2.0.CO;2, 1980.
Holton, J. R. and Tan, H.-C.: The quasi-biennial oscillation in the Northern Hemisphere lower stratosphere, J. Meteorol. Soc. Japan, Ser. II, 60, 140–148, https://doi.org/10.2151/jmsj1965.60.1_140, 1982.
Iza, M., Calvo, N., and Manzini, E.: The stratospheric pathway of La Niña, J. Clim., 29, 8899–8914, https://doi.org/10.1175/JCLI-D-16-0230.1, 2016.
Japan Meteorological Agency: El Nino monitoring and outlook (including monitoring indices) [dataset], http://ds.data.jma.go.jp/tcc/tcc/products/elnino/index.html, last access: 31 January 2023.
Kawatani, Y., Hamilton, K., Watanabe, S., Taguchi, M., Serva, F., Anstey, J. A., Richter, J. H., Butchart, N., Orbe, C., Osprey, S. M., Naoe, H., Elsbury, D., Chen, C.-C., García-Serrano, J., Glanville, A., Kerzenmacher, T., Lott, F., Palmeiro, F. M., Park, M., Versick, S., and Yoshida, K.: QBOi El Niño–Southern Oscillation experiments: overview of the experimental design and ENSO modulation of the QBO, Weather Clim. Dynam., 6, 1045–1073, https://doi.org/10.5194/wcd-6-1045-2025, 2025.
Kumar, V., Yoden, S., and Hitchman, M. H.: QBO and ENSO effects on the mean meridional circulation, polar vortex, subtropical westerly jets, and wave patterns during boreal winter, J. Geophys. Res., 127, e2022JD036691, https://doi.org/10.1029/2022JD036691, 2022.
Liess, S. and Geller, M. A.: On the relationship between QBO and distribution of tropical deep convection, J. Geophys. Res., 117, https://doi.org/10.1029/2011JD016317, 2012.
Lindzen, R. S. and Holton, J. R.: A theory of the quasi-biennial oscillation, J. Atmos. Sci., 25, 1095–1107, https://doi.org/10.1175/1520-0469(1968)025<1095:ATOTQB>2.0.CO;2, 1968.
Lu, J., Chen, G. and Frierson, D. M.: Response of the zonal mean atmospheric circulation to El Niño versus global warming, J. Clim., 21, 5835–5851, https://doi.org/10.1175/2008JCLI2200.1, 2008.
Lu, H., Hitchman, M., Gray, L., Anstey, J., and Osprey, S.: On the role of Rossby wave breaking in the quasi-biennial modulation of the stratospheric polar vortex during boreal winter, Q. J. R. Meteorol. Soc., 146, 1939–1959, https://doi.org/10.1002/qj.3775, 2020.
Ma, T., Chen, W., An, X., Garfinkel, C. I., and Cai, Q.: Nonlinear effects of the stratospheric quasi-biennial oscillation and ENSO on the North Atlantic winter atmospheric circulation, J. Geophys. Res., 128, e2023JD039537, https://doi.org/10.1029/2023JD039537, 2023.
Marshall, A. G., Hendon, H. H., Son, S.-W., and Lim, Y.: Impact of the quasi-biennial oscillation on predictability of the Madden–Julian oscillation, Clim. Dyn., 49, 1365–1377, https://doi.org/10.1007/s00382-016-3392-0, 2017.
Martin, Z., Son, S.-W., Butler, A., Hendon, H., Kim, H., Sobel, A., Yoden, S., and Zhang, C.: The influence of the quasi-biennial oscillation on the Madden–Julian oscillation, Nat. Rev. Earth Environ., 2, 477–489, https://doi.org/10.1038/s43017-021-00173-9, 2021.
Mo, R., Fyfe, J., and Derome, J.: Phase-locked and asymmetric correlations of the wintertime atmospheric patterns with the ENSO, Atmosphere-Ocean, 36, 213–239, https://doi.org/10.1080/07055900.1998.9649612, 1998.
Naoe, H. and Shibata, K.: Equatorial quasi-biennial oscillation influence on northern winter extratropical circulation, J. Geophys. Res., 115, D19102, https://doi.org/10.1029/2009JD012952, 2010.
Naoe, H. and Yoshida, K.: Influence of quasi-biennial oscillation on the boreal winter extratropical stratosphere in QBOi experiments, Q. J. R. Meteorol. Soc., 145, 2755–2771, https://doi.org/10.1002/qj.3591, 2019.
Naoe, H., Kobayashi, C., Kobayashi, S., Kosaka, Y., and Shibata, K.: Representation of quasi-biennial oscillation in JRA-3Q, J. Meteorol. Soc. Japan, 103, 233–255, https://doi.org/10.2151/jmsj.2025-012, 2025.
Norris, J., Hall, A., Neelin, J. D., Thackeray, C. W., and Chen, D.: Evaluation of the tail of the probability distribution of daily and subdaily precipitation in CMIP6 models, J. Clim., 34, 2701–2721, https://doi.org/10.1175/JCLI-D-20-0182.1, 2021.
Oueslati, B. and Bellon, G.: Convective entrainment and large-scale organization of tropical precipitation: Sensitivity of the CNRM-CM5 hierarchy of models, J. Clim., 26, 2931–2946, https://doi.org/10.1175/JCLI-D-12-00314.1, 2013.
Pahlavan, H. A., Fu, Q., Wallace, J. M., and Kiladis, G. N.: Revisiting the quasi-biennial oscillation as seen in ERA5. Part I: Description and momentum budget, J. Atmos. Sci., 78, 673–691, https://doi.org/10.1175/JAS-D-20-0207.1, 2021.
Palmeiro, F., Iza, M., Barriopedro, D., Calvo, N., and Garcia-Herrera, R.: The complex behavior of El Niño winter 2015–2016. Geophys. Res. Lett., 44, 2902–2910, https://doi.org/10.1002/2017GL072920, 2017.
Palmeiro, F. M., García-Serrano, J., Ruggieri, P., Batté, L., and Gualdi, S.: On the influence of ENSO on sudden stratospheric warmings, J. Geophys. Res., 128, e2022JD037607, https://doi.org/10.1029/2022JD037607, 2023.
Park, C.-H. and Son, S.-W.: Relationship between the QBO and surface air temperature in the Korean Peninsula, Atmosphere (Korean Meteor. Soc.), 32, 39–49, https://doi.org/10.14191/Atmos.2022.32.1.039, 2022 (in Korean).
Park, C.-H., Son, S.-W., Lim, Y., and Choi, J.: Quasi-biennial oscillation-related surface air temperature change over the western North Pacific in late winter, Int. J. Climatol., 30, 4351–4359, https://doi.org/10.1002/joc.7470, 2022.
Plumb, R. A. and McEwan, A. D.: The instability of a forced standing wave in a viscous stratified fluid: A laboratory analogue of the quasi-biennial oscillation, J. Atmos. Sci., 35, 1827–1839, https://doi.org/10.1175/1520-0469(1978)035<1827:TIOAFS>2.0.CO;2, 1978.
Randall, D. A., Tziperman, E., Branson, M. D., Richter, J. H., and Kang, W.: The QBO-MJO connection: A possible role for the SST and ENSO, J. Clim., 36, 6515–6531, https://doi.org/10.1175/JCLI-D-23-0031.1, 2023.
Rao, J. and Ren, R.: Asymmetry and nonlinearity of the influence of ENSO on the northern winter stratosphere: 1. Observations, J. Geophys. Res., 121, 9000–9016, https://doi.org/10.1002/2015JD024520, 2016a.
Rao, J. and Ren, R.: Asymmetry and nonlinearity of the influence of ENSO on the northern winter stratosphere: 2. Model study with WACCM, J. Geophys. Res., 121, 9017–9032, https://doi.org/10.1002/2015JD024520, 2016b.
Rao, J., Garfinkel, C. I., and White, I. P.: Impact of the quasi-biennial oscillation on the northern winter stratospheric polar vortex in CMIP5/6 models, J. Clim., 33, 4787–4813, https://doi.org/10.1175/JCLI-D-19-0626.1, 2020a.
Rao, J., Garfinkel, C. I., and White, I. P.: How does the quasi-biennial oscillation affect the boreal winter tropospheric circulation in CMIP5/6 models?, J. Clim., 33, 8975–8996, https://doi.org/10.1175/JCLI-D-20-0024.1, 2020b.
Rasmusson, E. M. and Wallace, J. M.: Meteorological aspects of the El Nino/Southern Oscillation, Science, 222, 1195–1202, https://doi.org/10.1126/science.222.4629.1195, 1983.
Richter, J. H., Matthes, K., Calvo, N., and Gray, L. J.: Influence of the Quasi-Biennial Oscillation and El Niño–Southern Oscillation on the frequency of sudden stratospheric warmings, J. Geophys. Res., 116, D20111, https://doi.org/10.1029/2011JD015757, 2011.
Richter, J. H., Anstey, J. A., Butchart, N., Kawatani, Y., Meehl, G. A., Osprey, S., and Simpson, I. R.: Progress in simulating the quasi-biennial oscillation in CMIP models, J. Geophys. Res., 125, e2019JD032362, https://doi.org/10.1029/2019JD032362, 2020.
Richter, J. H., Butchart, N., Kawatani, Y., Bushell, A. C., Holt, L., Serva, F., Anstey, J., Simpson, I. R., Osprey, S., Hamilton, K., Braesicke, P., Cagnazzo, C., Chen, C.-C., Garcia, R. R., Gray, L. J., Kerzenmacher, T., Lott, F., McLandress, C., Naoe, H., Scinocca, J., Stockdale, T. N., Versick, S., Watanabe, S., Yoshida, K., and Yukimoto, S.: Response of the quasi-biennial oscillation to a warming climate in global climate models, Q. J. R. Meteorol. Soc., 148, 1490–1518, https://doi.org/10.1002/qj.3749, 2022.
Rodrigo, M., García-Serrano, J., and Bladé, I.: Quasi-Biennial Oscillation influence on tropical convection and El Niño variability, Geophys. Res. Lett., 52, e2024GL112854, https://doi.org/10.1029/2024GL112854, 2025.
Ruzmaikin, A., Feynman, J., Jiang, X., and Yung, Y. L.: Extratropical signature of the quasi-biennial oscillation, J. Geophys. Res., 110, D11111, https://doi.org/10.1029/2004JD005382, 2005.
Scaife, A. A., Athanassiadou, M., Andrews, M., Arribas, A., Baldwin, M., Dunstone, N., Knight, J., MacLachlan, C., Manzini, E., Muller, W. A., Pohlmann, H., Smith, D., Stockdale, T., and Williams, A.: Predictability of the quasi-biennial oscillation and its northern winter teleconnection on seasonal to decadal timescales, Geophys. Res. Lett. 41, 1752–1758, https://doi.org/10.1029/2004JD005382, 2014.
Serva, F., Anstey, J. A., Bushell, A. C., Butchart, N., Cagnazzo, C., Gray, L., Kawatani, Y., Osprey, S. M., Richter, J. H., and Simpson, I. R.: The impact of the QBO on the region of the tropical tropopause in QBOi models: present-day simulations, Q. J. R. Meteorol. Soc., 148, 1945–1964, https://doi.org/10.1002/qj.4287, 2022.
Simpson, I. R., Blackburn, M., and Haigh, J. D.: The role of eddies in driving the tropospheric response to stratospheric heating perturbations, J. Atmos. Sci., 66, 1347–1365, https://doi.org/10.1175/2008JAS2758.1, 2009.
Son, S.-W., Lim, Y., Yoo, C., Hendon, H. H., and Kim, J.: Stratospheric control of the Madden-Julian oscillation, J. Clim., 30, 1909–1922, https://doi.org/10.1175/JCLI-D-16-0620.1, 2017.
Song, K. and Son, S.-W.: Revisiting the ENSO–SSW relationship, J. Clim., 31, 2133–2143, https://doi.org/10.1175/JCLI-D-17-0078.1, 2018.
Taguchi, M.: Wave driving in the tropical lower stratosphere as simulated by WACCM. Part II: ENSO-induced changes for northern winter, J. Atmos. Sci., 67, 543–555, https://doi.org/10.1175/2009JAS3144.1, 2010a.
Taguchi, M.: Observed connection of the stratospheric Quasi-Biennial Oscillation with El Nino–Southern Oscillation in radiosonde data, J. Geophys. Res., 115, D18120, https://doi.org/10.1029/2010JD014325, 2010b.
Taguchi, M. and Hartmann, D. L.: Increased occurrence of stratospheric sudden warmings during El Niño simulated by WACCM, J. Clim., 19, 324–332, https://doi.org/10.1175/JCLI3655.1, 2006.
Tegtmeier, S., Anstey, J., Davis, S., Ivanciu, I., Jia, Y., McPhee, D., Kedzierski, R. P.: Zonal asymmetry of the QBO temperature signal in the tropical tropopause region. Geophy. Res. Lett., 47, e2020GL089533, https://doi.org/10.1029/2020GL089533, 2020.
The MathWorks, Inc.: MATLAB version R2025a, Natick, Massachusetts, USA, https://jp.mathworks.com/products/matlab.html, last access: 9 October 2025.
Trascasa-Castro, P., Maycock, A. C., Yiu, Y. Y. S., and Fletcher, J. K.: On the linearity of the stratospheric and Euro-Atlantic sector response to ENSO, J. Clim., 32, 6607–6626, https://doi.org/10.1175/JCLI-D-18-0780.1, 2019.
Tyrrell, N. L., Koskentausta, J. M., and Karpechko, A. Yu.: Sudden stratospheric warmings during El Niño and La Niña: sensitivity to atmospheric model biases, Weather Clim. Dynam., 3, 45–58, https://doi.org/10.5194/wcd-3-45-2022, 2022.
Van Loon, H. and Labitzke, K.: The Southern Oscillation. Part V: The anomalies in the lower stratosphere of the Northern Hemisphere in winter and a comparison with the Quasi-Biennial Oscillation, Mon. Weather Rev., 115, 357–369, https://doi.org/10.1175/1520-0493(1987)115<0357:TSOPVT>2.0.CO;2, 1987.
Walsh, A., Screen, J. A., Scaife, A. A., and Smith, D. M.: Non-linear response of the extratropics to tropical climate variability, Geophys. Res. Lett., 49, e2022GL100416, https://doi.org/10.1029/2022GL100416, 2022.
Watson, P. A. G. and Gray, L. J.: How does the quasi-biennial oscillation affect the stratospheric polar vortex?, J. Atmos. Sci., 71, 391–409, https://doi.org/10.1175/JAS-D-13-096.1, 2014.
Wei, K., Chen, W., and Huang, R.: Association of tropical Pacific sea surface temperatures with the stratospheric Holton–Tan oscillation in the Northern Hemisphere winter, Geophys. Res. Lett., 34, L16814, https://doi.org/10.1029/2007GL030478, 2007.
Weinberger, I., Garfinkel, C. I., White, I. P., Oman, L. D., Aquila, V., and Lim, Y.-K.: The salience of nonlinearities in the boreal winter response to ENSO: Arctic stratosphere and Europe, Clim. Dyn., 53, 4591–4610, https://doi.org/10.1007/s00382-019-04805-1, 2019.
White, I. P., Lu, H., Mitchell, N. J., and Phillips, T.: Dynamical response to the QBO in the Northern Winter stratosphere: signatures in wave forcing and eddy fluxes of potential vorticity, J. Atmos. Sci., 72, 4487–4507, https://doi.org/10.1175/JAS-D-14-0358.1, 2015.
Yamazaki, K., Nakamura, T., Ukita, J., and Hoshi, K.: A tropospheric pathway of the stratospheric quasi-biennial oscillation (QBO) impact on the boreal winter polar vortex, Atmos. Chem. Phys., 20, 5111–5127, https://doi.org/10.5194/acp-20-5111-2020, 2020.
Yoo, C. and Son, S.-W.: Modulation of the boreal wintertime Madden–Julian Oscillation by the stratospheric quasi-biennial oscillation, Geophys. Res. Lett., 43, 1392–1398, https://doi.org/10.1002/2016GL067762, 2016.
Yukimoto, S., Kawai, H., Koshiro, T., Oshima, N., Yoshida, K., Urakawa, S., Tsujino, H., Deushi, M., Tanaka, T. Y., Hosaka, M., Yabu, S., Yoshimura, H., Shindo, E., Mizuta, R., Obata, A., Adachi, Y., and Ishii, M.: The MRI Earth System Model version 2.0, MRI-ESM2.0: description and basic evaluation of the physical component, J. Meteorol. Soc. Japan, 97, 931–965, https://doi.org/10.2151/jmsj.2019-051, 2019.
Zhou, W., Leung, L. R., and Lu, J.: Linking large-scale double-ITCZ bias to local-scale drizzling bias in climate models, J. Clim., 35, 7965–7979, https://doi.org/10.1175/JCLI-D-22-0336.1, 2022.
- Abstract
- Introduction
- Data and Methods
- QBO teleconnections: the extratropical pathway
- The subtropical jet pathway of QBO teleconnections
- QBO teleconnections: the tropical pathway
- Summary and Discussion
- Code availability
- Data availability
- Author contributions
- Competing interests
- Disclaimer
- Acknowledgements
- Financial support
- Review statement
- References
- Supplement