the Creative Commons Attribution 4.0 License.
the Creative Commons Attribution 4.0 License.
 | 03 Dec 2025
Intensifying precipitation over the Southern Ocean challenges reanalysis-based climate estimates – Insights from Macquarie Island's 45-year record
Andrew T. Prata
Peter T. May
Ariaan Purich
Steven T. Siems
The Southern Ocean (SO) region plays a critical role in the global climate system but remains observationally limited. Macquarie Island (MAC), situated along the SO storm track, provides a unique, high-quality surface precipitation record since 1948. Based on daily synoptic regime classifications from 1979 to 2023, we find that a significant 28 % increase in annual precipitation at MAC is primarily driven by enhanced mean daily precipitation intensity associated with warm air advection, low pressure, and cold air advection regimes, rather than shifts in regime frequency, consistent with a poleward shift in the storm track. In contrast, ECMWF reanalysis (ERA5) shows only an 8 % overall increase in annual precipitation, as it insufficiently reflects the increase in mean daily precipitation intensity under these regimes, likely due to its limited representation of atmospheric moisture transport and increasing evaporation. This precipitation discrepancy suggests that reanalysis may underestimate aspects of the moisture and energy budgets over the SO, and may also have potential implications for the estimation of SO freshwater fluxes.
- Article
(4695 KB) - Full-text XML
- BibTeX
- EndNote


The broader Southern Ocean (SO) region, from the subtropical ridge to the Antarctic coast, is characterised by a nearly uninterrupted ocean expanse largely devoid of land masses and plays a vital role in the Earth's climate system (Rintoul and Church, 2022), taking up large portions of anthropogenic heat and carbon (Williams et al., 2024; Khatiwala et al., 2009; Gruber et al., 2023). The climate of this region is dominated by the SO storm track and its strong westerly winds, and is experiencing changes driven by global warming, and stratospheric ozone depletion and stabilisation (Cai et al., 2023). The westerly winds have strengthened and shifted poleward (Shaw et al., 2016; Yin, 2005) – reflecting a positive trend of the Southern Annular Mode (SAM) since the satellite era (post-1979) (Marshall, 2003; Dong et al., 2023) – and are associated with a redistribution of precipitation in reanalysis products and climate simulations, with the lower latitudes of the SO becoming drier and the higher latitudes experiencing greater precipitation (Manton et al., 2020).
Given that precipitation necessitates evaporation and a compensating latent heat flux (LHF), a primary means of cooling the SO mixed layer, precipitation serves as a constraint on the surface energy budget. In addition, precipitation, along with Antarctic glacial melt, is one of the primary sources of freshwater flux into the SO, modifying ocean buoyancy forcing, facilitating ocean mixing, impacting sea ice variability (Shaw et al., 2016; Li et al., 2000; Stammerjohn et al., 2011; Pauling et al., 2016), and having an impact on the biogeochemistry of the ocean mixed layer (Fisher et al., 2025). The estimation of precipitation over the SO is particularly challenging (Siems et al., 2022). The SO region has few continuous, in-situ observations due to its remoteness, lack of land masses, and harsh conditions along the storm tracks. The scarcity of in-situ observations not only restricts research on the weather and climate over the SO but also makes it challenging to evaluate numerical simulations and remote sensing products (McFarquhar et al., 2021; Gettelman et al., 2020; Hwang and Frierson, 2013; Bodas-Salcedo et al., 2019; Sallée et al., 2013; Lauer et al., 2023; Trenberth and Fasullo, 2010; Cesana et al., 2022). This ambiguity profoundly impacts the accuracy of atmospheric and oceanic circulation modelling and climate sensitivity studies, both across the SO and on a global scale (Zelinka et al., 2020; Kay et al., 2016).
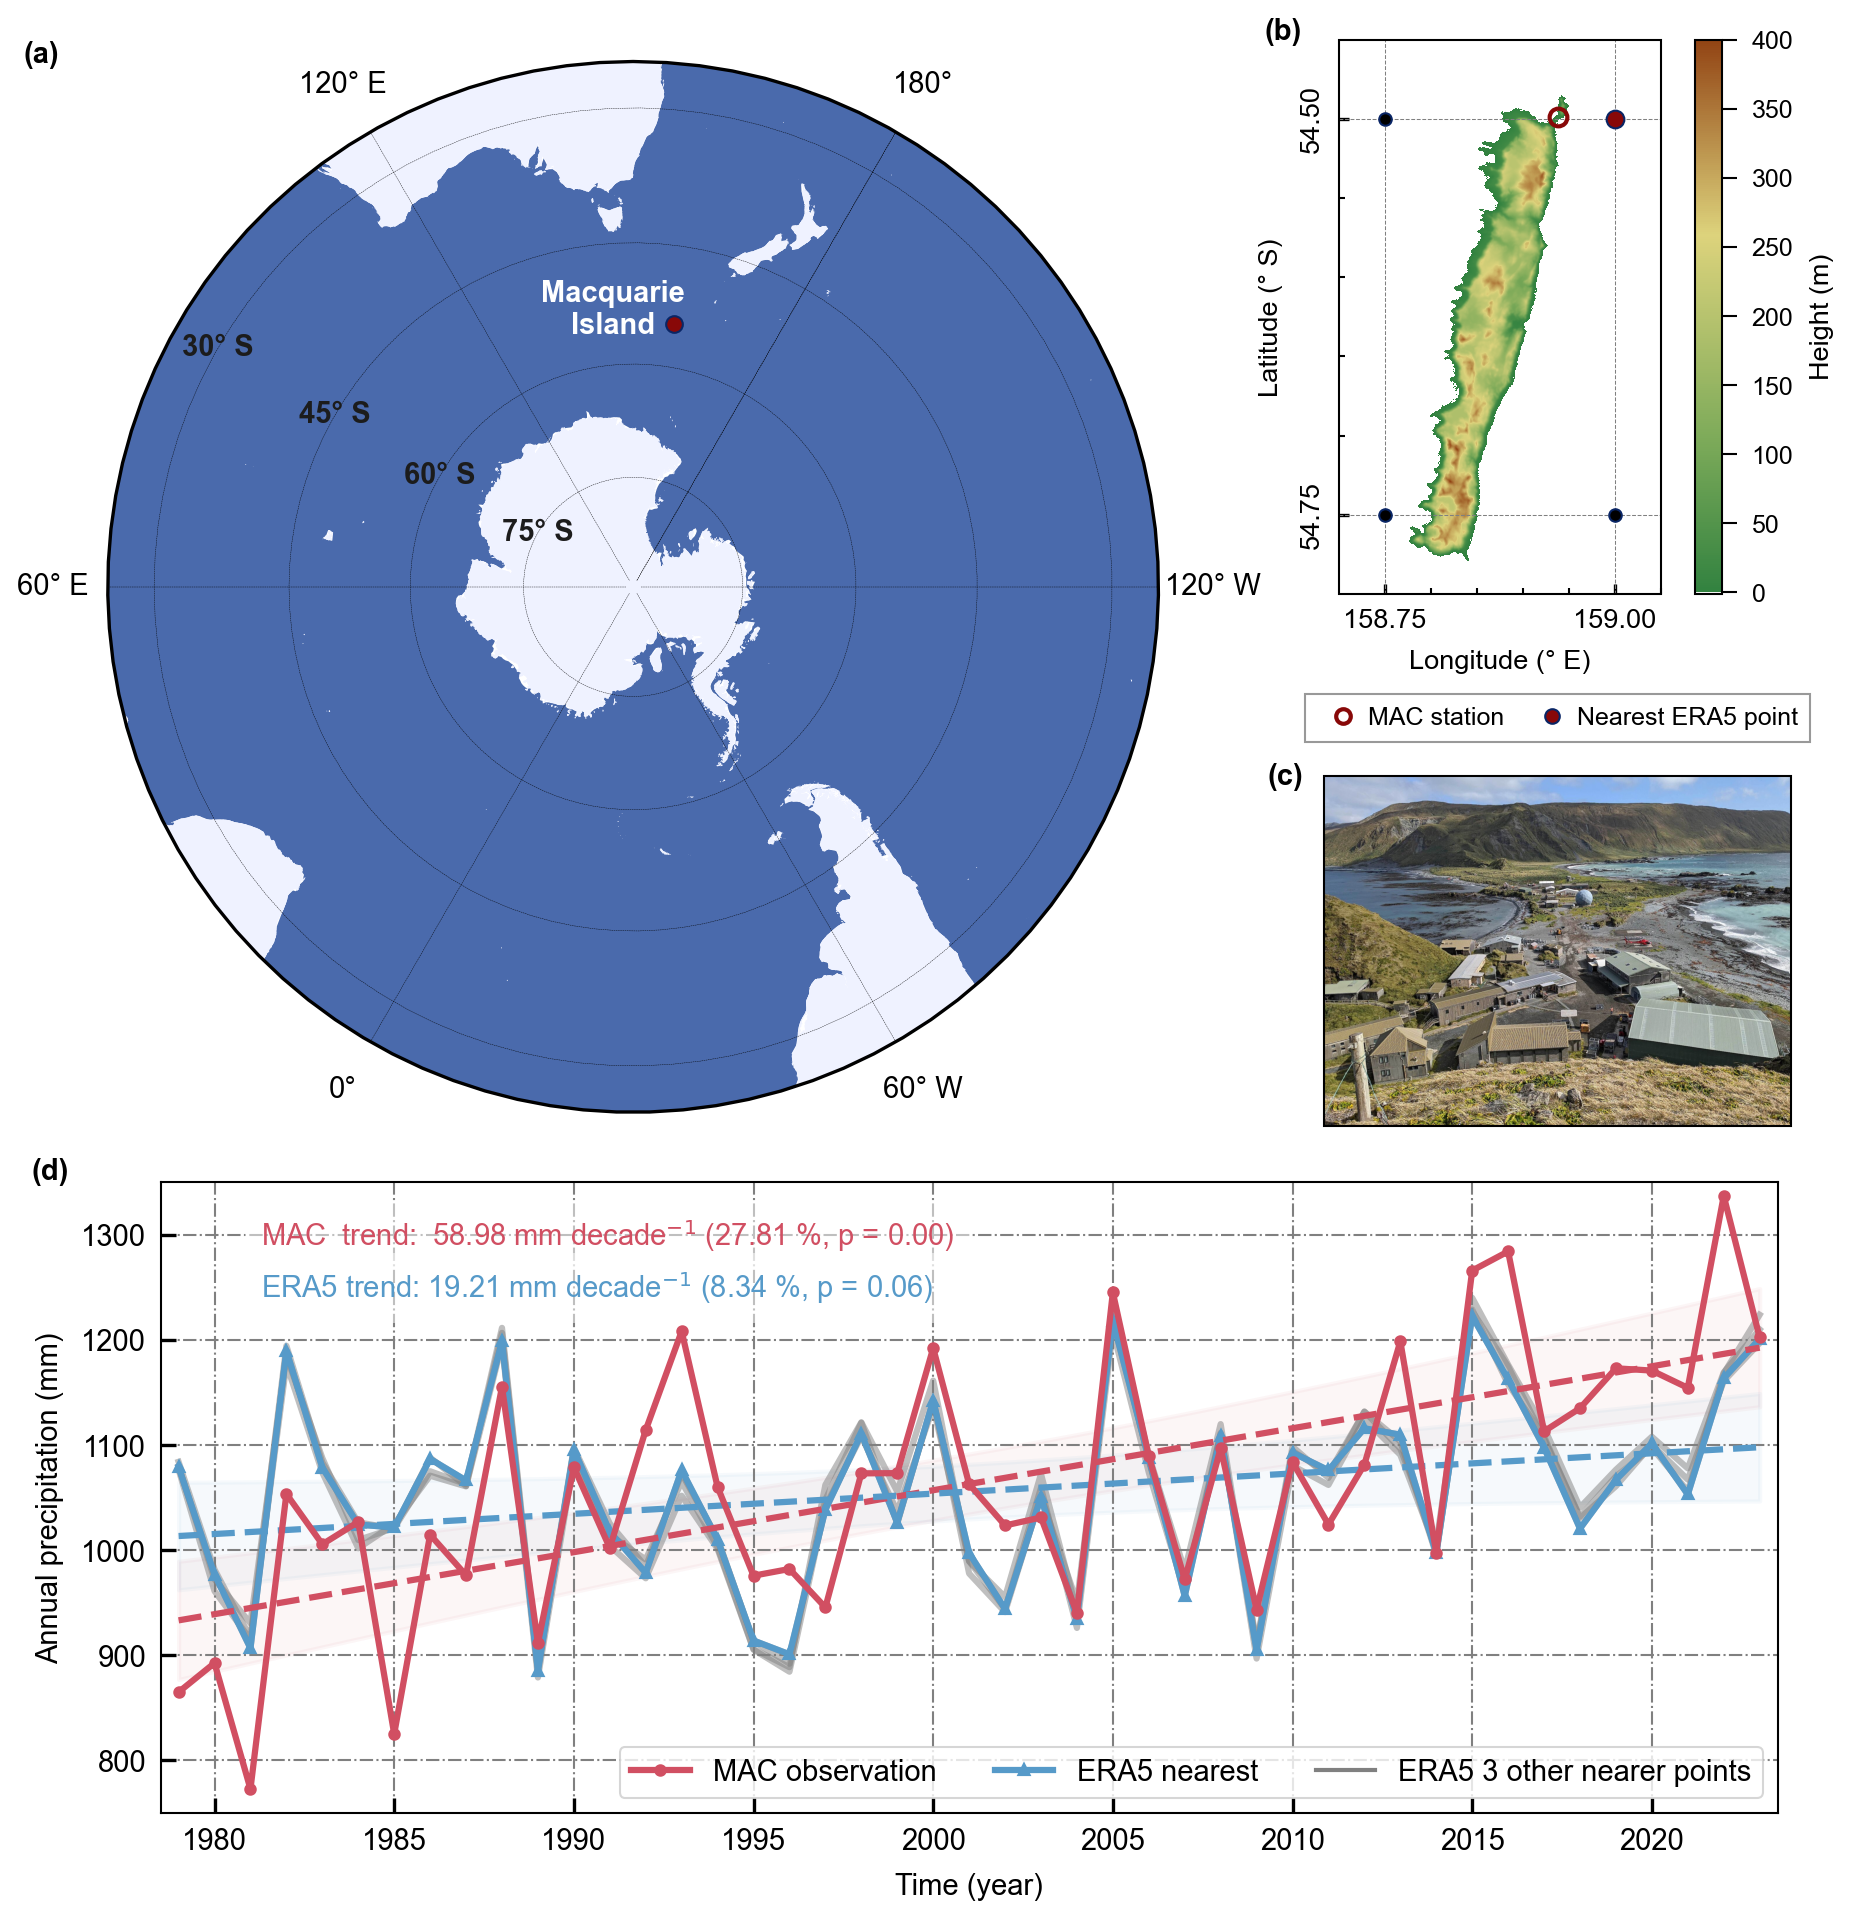
Figure 1(a) The location of Macquarie Island (MAC, red solid dot) in the Southern Ocean. (b) The topographic elevation map of MAC, which is approximately 34 km long and 5.5 km wide, with a highest point around 410 m. The MAC station is located at the isthmus at the northern end of the island (white dot with red border) at an elevation of 8 m. The nearest ERA5 grid point to the MAC station (red solid dot) is located approximately 4 km east over the ocean, along with three other ERA5 grid points at a 0.25° resolution near the island (dark blue dots). (c) Photograph of the MAC station site (view from the north). © Photo: Brendan Barnes/Australian Antarctic Division (AAD) (2020) (AAD, 2021). (d) Comparison of annual precipitation trends from 1979 to 2023 between MAC observations (red), nearest ERA5 grid point (blue), and three other nearby ERA5 grid points (grey) shown in panel (b), with shaded areas indicating the 95 % confidence intervals.
Macquarie Island (Fig. 1) is an isolated island situated along the SO storm track, with a research station (MAC; 54.50° S, 158.94° E; elevation 8 m) located on a narrow isthmus at the northern end that minimises any orographic distortion (Wang et al., 2016). Its long-term, high-quality observations constitute a unique record for the SO that has been extensively used to evaluate satellite products, reanalysis data, and climate simulations (Wang et al., 2015; Tansey et al., 2022, 2023). The surface record from MAC indicates that the island has been experiencing a statistically significant increase in annual precipitation over several decades (Adams, 2009), with an increase of 24 % (∼ 225 mm) from 1979 to 2021 (Siems et al., 2022). This increase is contributing to a degradation of the native flora of this United Nations Educational, Scientific and Cultural Organisation (UNESCO) World Heritage site (Bergstrom et al., 2015; Dickson et al., 2021). This additional precipitation is equivalent to a LHF of an additional 18 W m−2 (see Methods), although it is unknown over what spatial extent either the precipitation or evaporation occurs. Comparing these surface observations to precipitation from the European Centre for Medium-Range Weather Forecasts Reanalysis v5 (ERA5), Siems et al. (2022) identified a bias, with the ERA5 precipitation showing only a 6 % (∼ 62 mm) increase in annual precipitation at MAC. This discrepancy, though previously documented, remains unexplained and forms the core motivation for the present work.
This study aims to investigate the meteorology behind the observed increase in annual precipitation at MAC through the following objectives: (1) Classify daily synoptic meteorological patterns over the past 45 years (1979–2023). (2) Examine the frequency, intensity (mean daily precipitation), and contributions of different synoptic regimes to the observed cumulative precipitation at MAC. (3) Compare MAC observational data with ERA5 output at the nearest grid point to evaluate biases in precipitation trends across all classifications. (4) Investigate how changes in synoptic meteorology reflect intensifying climatic trends in precipitation at MAC, address discrepancies in ERA5, and discuss the broader implications.
2.1 Data
2.1.1 Macquarie Island Observation Data
The Macquarie Island station (MAC, BoM station ID. 300004) is operated by the Australian Antarctic Division (AAD) with support from the Australian Bureau of Meteorology (BoM). The daily precipitation accumulation records are measured over a 24 h period from 09:00 to 09:00 local time (LT). This daily update in Local Standard Time (LST, UTC + 10) corresponds to 23:00 UTC, while during Daylight Saving Time (DST, UTC + 11) it corresponds to 22:00 UTC. Only 7 d are missing from the MAC daily precipitation dataset from 1979 to 2023, ensuring data continuity for the analysis. The records are primarily collected using tipping bucket rain gauges that generally have a resolution of 0.2 mm, although measurements with a 0.1 mm resolution were recorded on 18 d during this period. The observed mean sea level pressure (MSLP) and 2 m temperature data from MAC are from the BoM Climate Data Services (CDS). Some data gaps are filled by data from the U.S. National Centres for Environmental Information (NCEI) Global Hourly Integrated Surface Database (ISD) at the MAC site (World Meteorological Organisation (WMO) station ID. 94998).
2.1.2 ERA5 Reanalysis Data
The European Centre for Medium-Range Weather Forecasts (ECMWF) Reanalysis v5 (ERA5) (Hersbach et al., 2020) is the fifth-generation global weather and climate reanalysis dataset. In this study, we used the ERA5 pressure level data with 37 vertical levels, a horizontal resolution of 0.25°×0.25°, and an hourly temporal resolution. The nearest ERA5 grid point to MAC is located at 54.50° S, 159.00° E, approximately 4 km east of the MAC observation station over the ocean. When converting ERA5 hourly data into daily values, we disregarded the effects of DST and processed the data based on MAC LST (UTC + 10), namely using 23:00 UTC as the start of the daily interval, to ensure alignment with the observed precipitation records.
2.1.3 Macquarie Island Topographic Data
The digital elevation model (DEM) data for Macquarie Island (Fig. 1b) is from the Shuttle Radar Topography Mission Global 1 arc second (SRTMGL1) dataset (Farr et al., 2007; NASA JPL, 2013), led by the U.S. National Geospatial-Intelligence Agency (NGA) and National Aeronautics and Space Administration (NASA). It provides surface elevation information with a resolution of 1 arcsec (approximately 3 m).
2.2 Methods
2.2.1 Daily Synoptic Systems Classification
We employed the K-means clustering method based on the Scikit-Learn library of Python (Pedregosa et al., 2011). For the synoptic typing using data from the nearest ERA5 grid point at 11:00 UTC (21:00 LST), 15 standardised variables, including air temperature, relative humidity, zonal wind, and meridional wind at three pressure levels (925, 850, and 700 hPa) in the lower troposphere, and three surface variables (surface pressure, 2 m air temperature, and relative humidity) were used following Lang et al. (2018) and Truong et al. (2020). The value of K (i.e. number of clusters) needs to be specified in advance. Once chosen, the K-means algorithm generates K cluster centroids (mean values in each cluster).
In order to decide upon an appropriate number of clusters, we tested K values ranging from 3 to 8 and finally determined that K=5 was optimal for classifying daily synoptic patterns at MAC from 1979 to 2023, categorised as zonal flow, warm air advection, low pressure, cold air advection, and high pressure. These cluster types are broadly consistent with those identified in earlier studies that were based on shorter timeframes (Lang et al., 2018; Truong et al., 2020).
2.2.2 48 h Atmospheric Back Trajectory
The Hybrid Single-Particle Lagrangian Integrated Trajectory (HYSPLIT) model (Stein et al., 2015), developed by the U.S. National Oceanic and Atmospheric Administration (NOAA), is widely used for forward and backward tracking of air mass trajectories. We used the HYSPLIT model driven by ERA5 single-level and pressure-level data to compute 48 h back trajectories starting at 11:00 UTC each day from 1 January 1979 to 31 December 2023. The trajectories were initialised at an altitude of 500 m, with the starting point set at the nearest ERA5 grid point to Macquarie Island (54.50° S, 159.00° E).
To convert ERA5 data from GRIB format to the ARL format required for HYSPLIT, we used the MeteoInfo software (Wang, 2014).
2.2.3 Relationship of Annual Precipitation, Frequency Proportion, and Daily Intensity
For each cluster, we have Eq. (1):
where Pi,j represents accumulated precipitation, fi,j represents frequency proportion in percentage, represents mean daily precipitation, Dj represents days per year, could be 365 or 366 d, i represents clusters, from 1 to 5, j represents year, from 1979 to 2023. Note: This formula can also be applied to the overall precipitation, where the yearly frequency proportions are always 100 %.
Since the number of days in a year is nearly constant (365 or 366 d), and the total sample has only 7 missing days, we can consider that the annual accumulated precipitation for each cluster is determined by the frequency proportion of cluster in that year and the average daily precipitation intensity, with these two variables having a product relationship.
2.2.4 Regression Analysis and Trend Significance Verification
In this study, we employed a linear regression model based on the Ordinary Least Squares (OLS) method to analyse the trends (Seabold and Perktold, 2010). To assess the significance of the regression line, we calculated the p-value of the slope coefficient. A p-value less than 0.05 was considered indicative of a statistically significant trend. Furthermore, we computed the 95 % confidence interval for the regression line to evaluate the reliability of the results. These analytical approaches were employed to ensure the robustness and accuracy of the trend analysis.
2.2.5 Relationship between Latent Heat Flux and Evaporation in ERA5
Assuming the water density is ρ=103 kg m−3. The latent heat of vaporization of water at 0 °C is J kg−1 (https://glossary.ametsoc.org/wiki/Latent_heat, last access: 27 November 2025). Therefore, on a daily scale, the factor between latent heat flux (LHF) and evaporation can be expressed as Eq. (2):
which can be confirmed in Fig. 4b-middle at the MAC site.
Assuming that in the ERA5 model, long-term precipitation equals evaporation, i.e., the precipitation variable is equal to the evaporation variable. From 1979 to 2021, MAC observed an increase of 225 mm in precipitation, the corresponding LHF is calculated as Eq. (3):
similarly, for the linear regression bias between ERA5 and MAC observation in 2023 (predicted) equals 95 mm (Fig. 1d), corresponding to an LHF of approximately 7.5 W m−2.
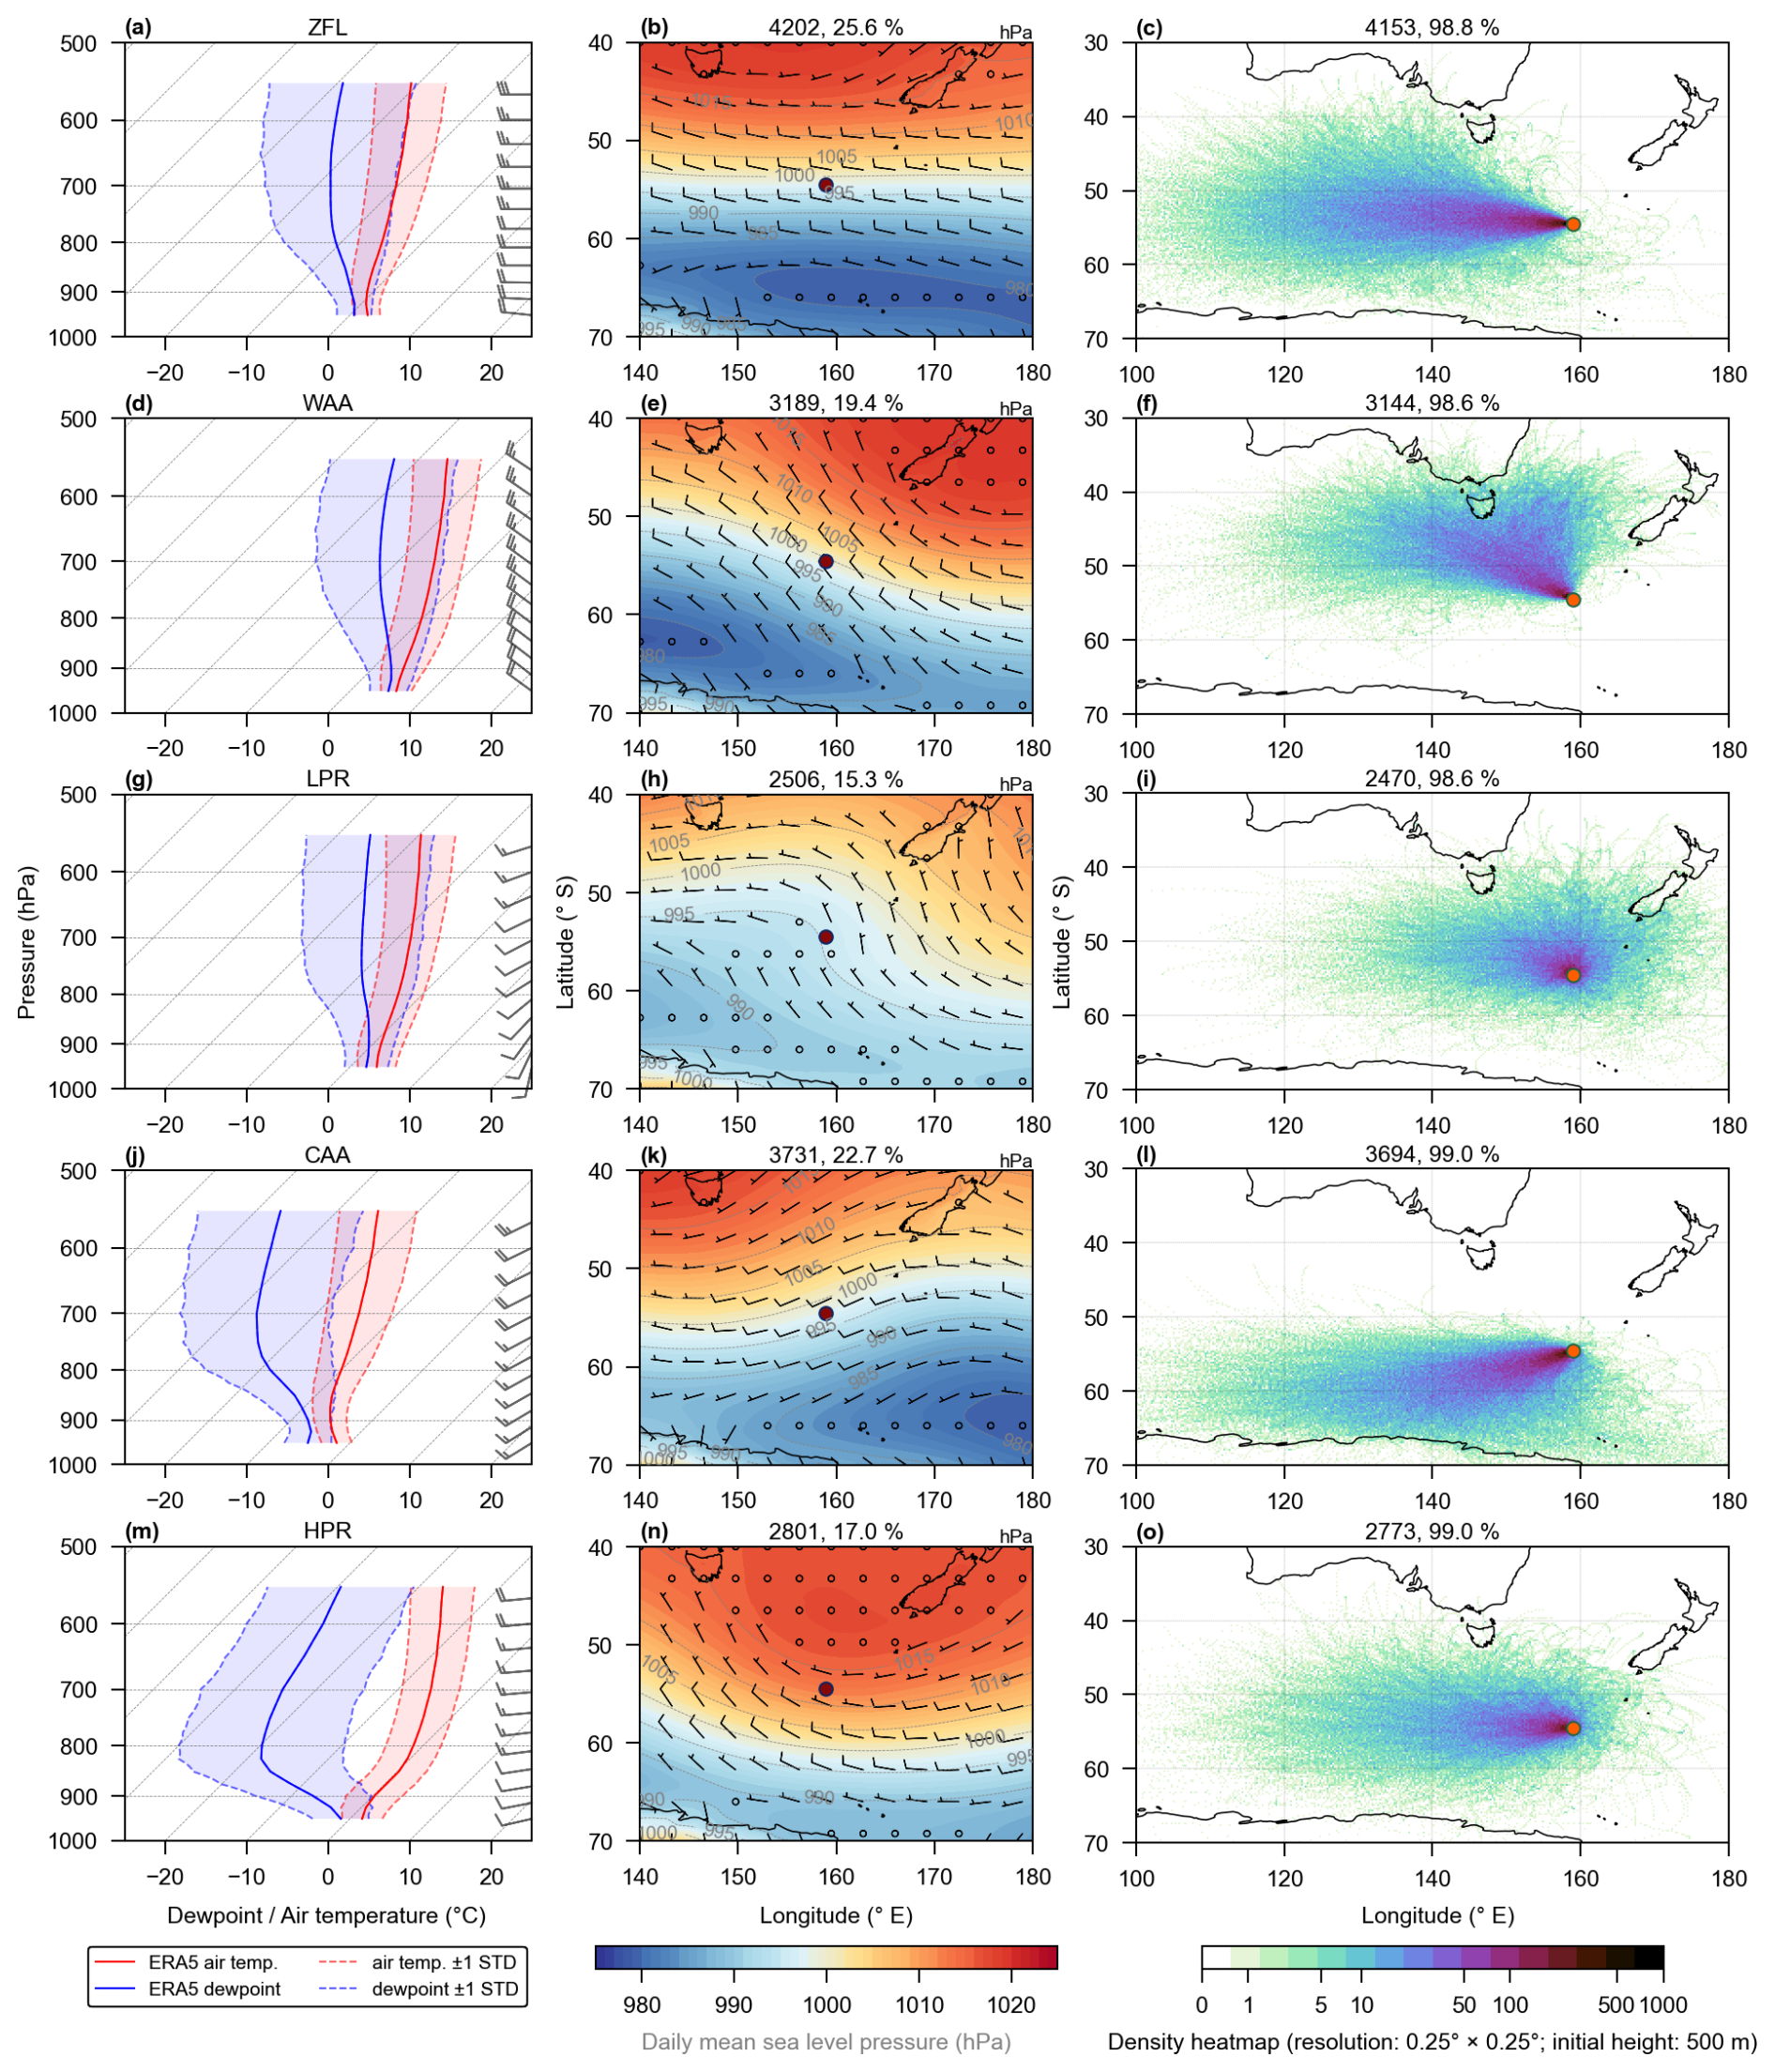
Figure 2For each synoptic type of k-means clustering from 1979 to 2023 based on ERA5 datasets. Zonal flow (ZFL), Warm air advection (WAA), Low pressure (LPR), Cold air advection (CAA), and High pressure (HPR). Column 1 (a, d, g, j, m) The average air temperature (°C, solid red) and dewpoint (°C, solid blue) profiles from 950–550 hPa at 11:00 UTC (around 21 Local Time) with ±1 standard deviations (dashed lines), and wind vector profiles (black). Column 2 (b, e, h, k, n) The mean daily mean sea-level pressure (MSLP, hPa, colour-filled and grey lines) and 10 m wind vector (m s−1, black wind barb) around Macquarie Island (MAC, red point). Column 3 (c, f, i, l, o) The 48 h back trajectories density heatmaps with the resolution of 0.25°×0.25°, initialized at 500 m from MAC (orange point).
3.1 Synoptic Typing at Macquarie Island
Five distinct regimes were found to be optimal for characterising the progression of mid-latitude cyclones and associated fronts along the SO storm track.
-
Zonal flow (ZFL, Fig. 2a–c) is characterised by strong westerly winds with little vertical shear, a relatively weak inversion at 900 hPa and moist air. A strong zonal gradient is evident in mean sea level pressure (MSLP), and the 48 h boundary layer HYSPLIT back trajectories are mainly limited to the 50–60° S zonal band.
-
Warm air advection (WAA, Fig. 2d–f) is characterised by the warm conveyor belt ahead of a mid-latitude cold front with strong winds (∼ 10.2 m s−1) from the northwest, a high pressure system northeast near New Zealand, no clear boundary layer inversion and warm, moist air aloft. 48 h back trajectories primarily originate from lower latitudes (40–55° S) with an anti-cyclonic rotation.
-
Low pressure (LPR, Fig. 2g–i) is characterised by weak surface winds with no boundary layer inversion, but strong vertical shear aloft. Above the boundary layer, the air is very moist with a dew point depression of just 6.0 °C at 700 hPa. A strong cyclonic rotation is evident in the MSLP and 48-hour back trajectories.
-
Cold air advection (CAA, Fig. 2j–l) is characterised by post-frontal air masses passing MAC. Winds are southwesterly with a relatively strong inversion evident at 850 hPa with cold and dry air aloft. There is a cyclonic rotation off the coast of Antarctica near 180° E, and the back-trajectories originate at higher latitudes with many reaching the coast of Antarctica.
-
High pressure (HPR, Fig. 2m–o) is characterised by ridging over MAC, with weak westerly winds. The boundary layer inversion is evident at 950 hPa with a nearly isothermal layer above extending to 850 hPa. Above the inversion, the air is warm and dry. The 48 h back trajectories are shorter in length and show a considerable spread across the SO.
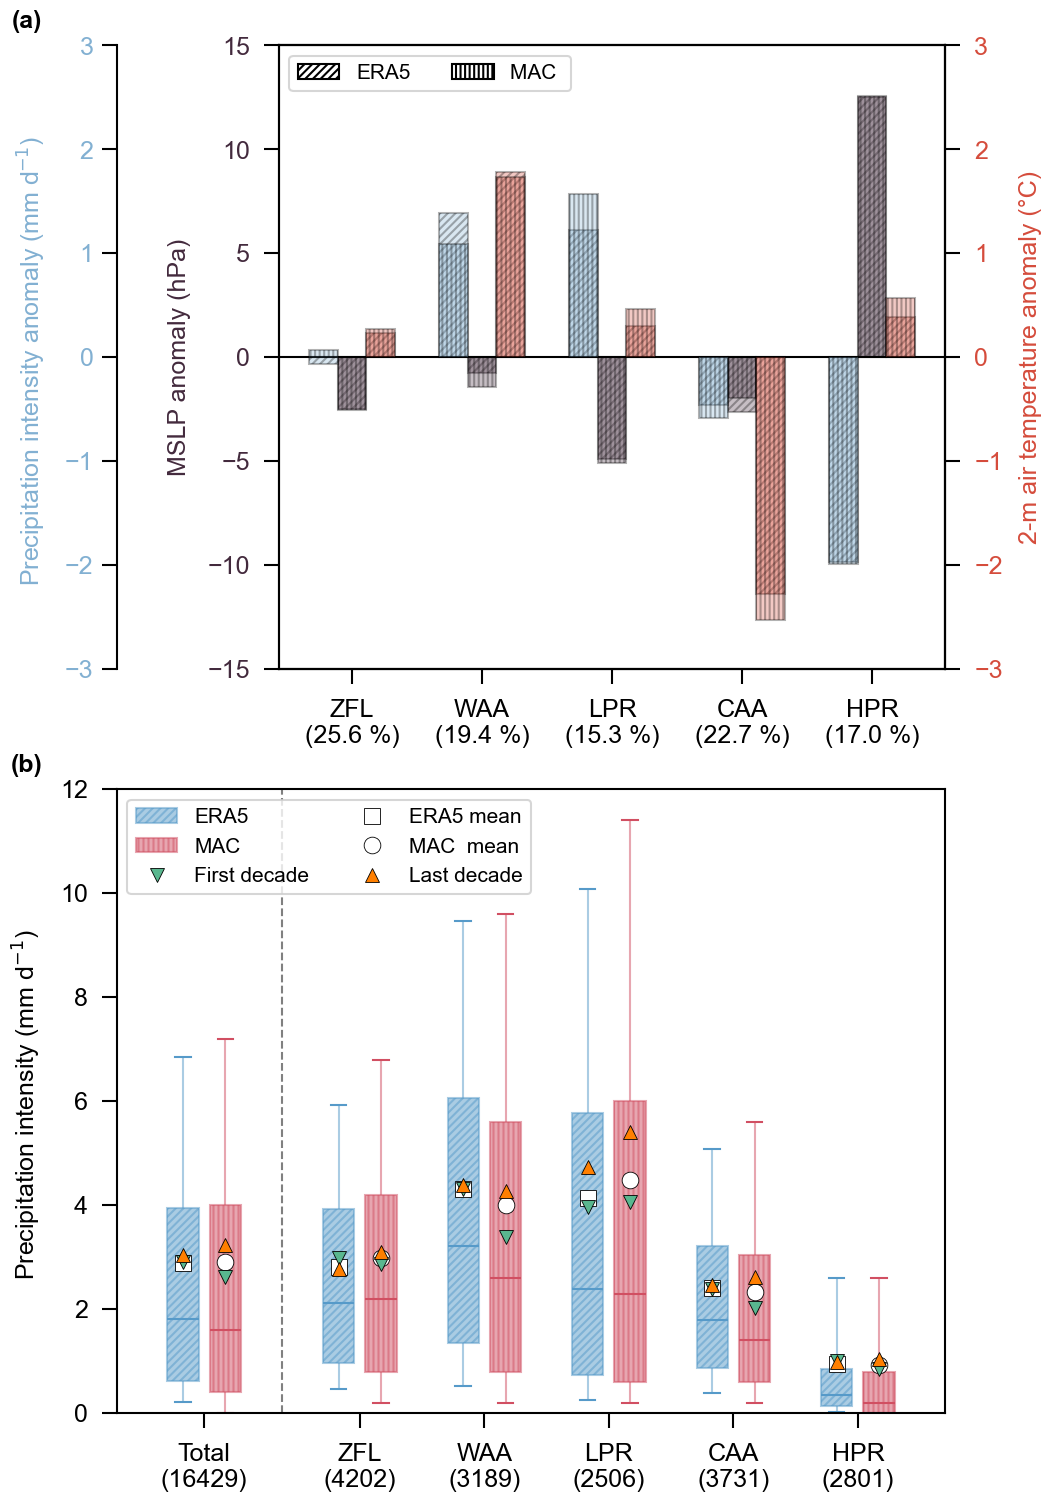
Figure 3Mean surface values for each regime based on both of the MAC observations (vertical lines) and the nearest ERA5 (diagonal lines) datasets. (a) Surface daily anomalies of precipitation intensity (mm d−1, blue), mean sea-level pressure (MSLP, hPa, grey) and 2 m air temperature (°C, red). (b) Box and whiskers plot for overall (total) and each regime of daily precipitation intensity in the percentile range of 10th and 90th with mean values (square for MAC, circle for ERA5), as well as the means of the first decade (1979–1988, green lower triangle) and the last decade (2014–2023, orange upper triangle).
Given that primary MAC observations are assimilated into ERA5, a good agreement in MSLP and 2 m air temperature is observed across the synoptic types (Fig. 3a). The daily mean precipitation values are also comparable (Fig. 3a), although ERA5 precipitation is derived solely from model output and does not directly assimilate MAC observations. The low pressure and warm air advection regimes exhibit the highest daily precipitation rates (4.3 and 4.2 mm d−1, respectively), whereas the high pressure regime has the lowest daily precipitation rate (0.9 mm d−1). From the first decade (1979–1988) to the last (2014–2023), the overall daily mean precipitation at MAC increases 0.6 mm d−1, primarily during warm air advection, cold air advection, and low pressure regimes (Fig. 3b). In contrast, ERA5 only records an increase of 0.2 mm d−1, primarily driven by the low pressure regime.
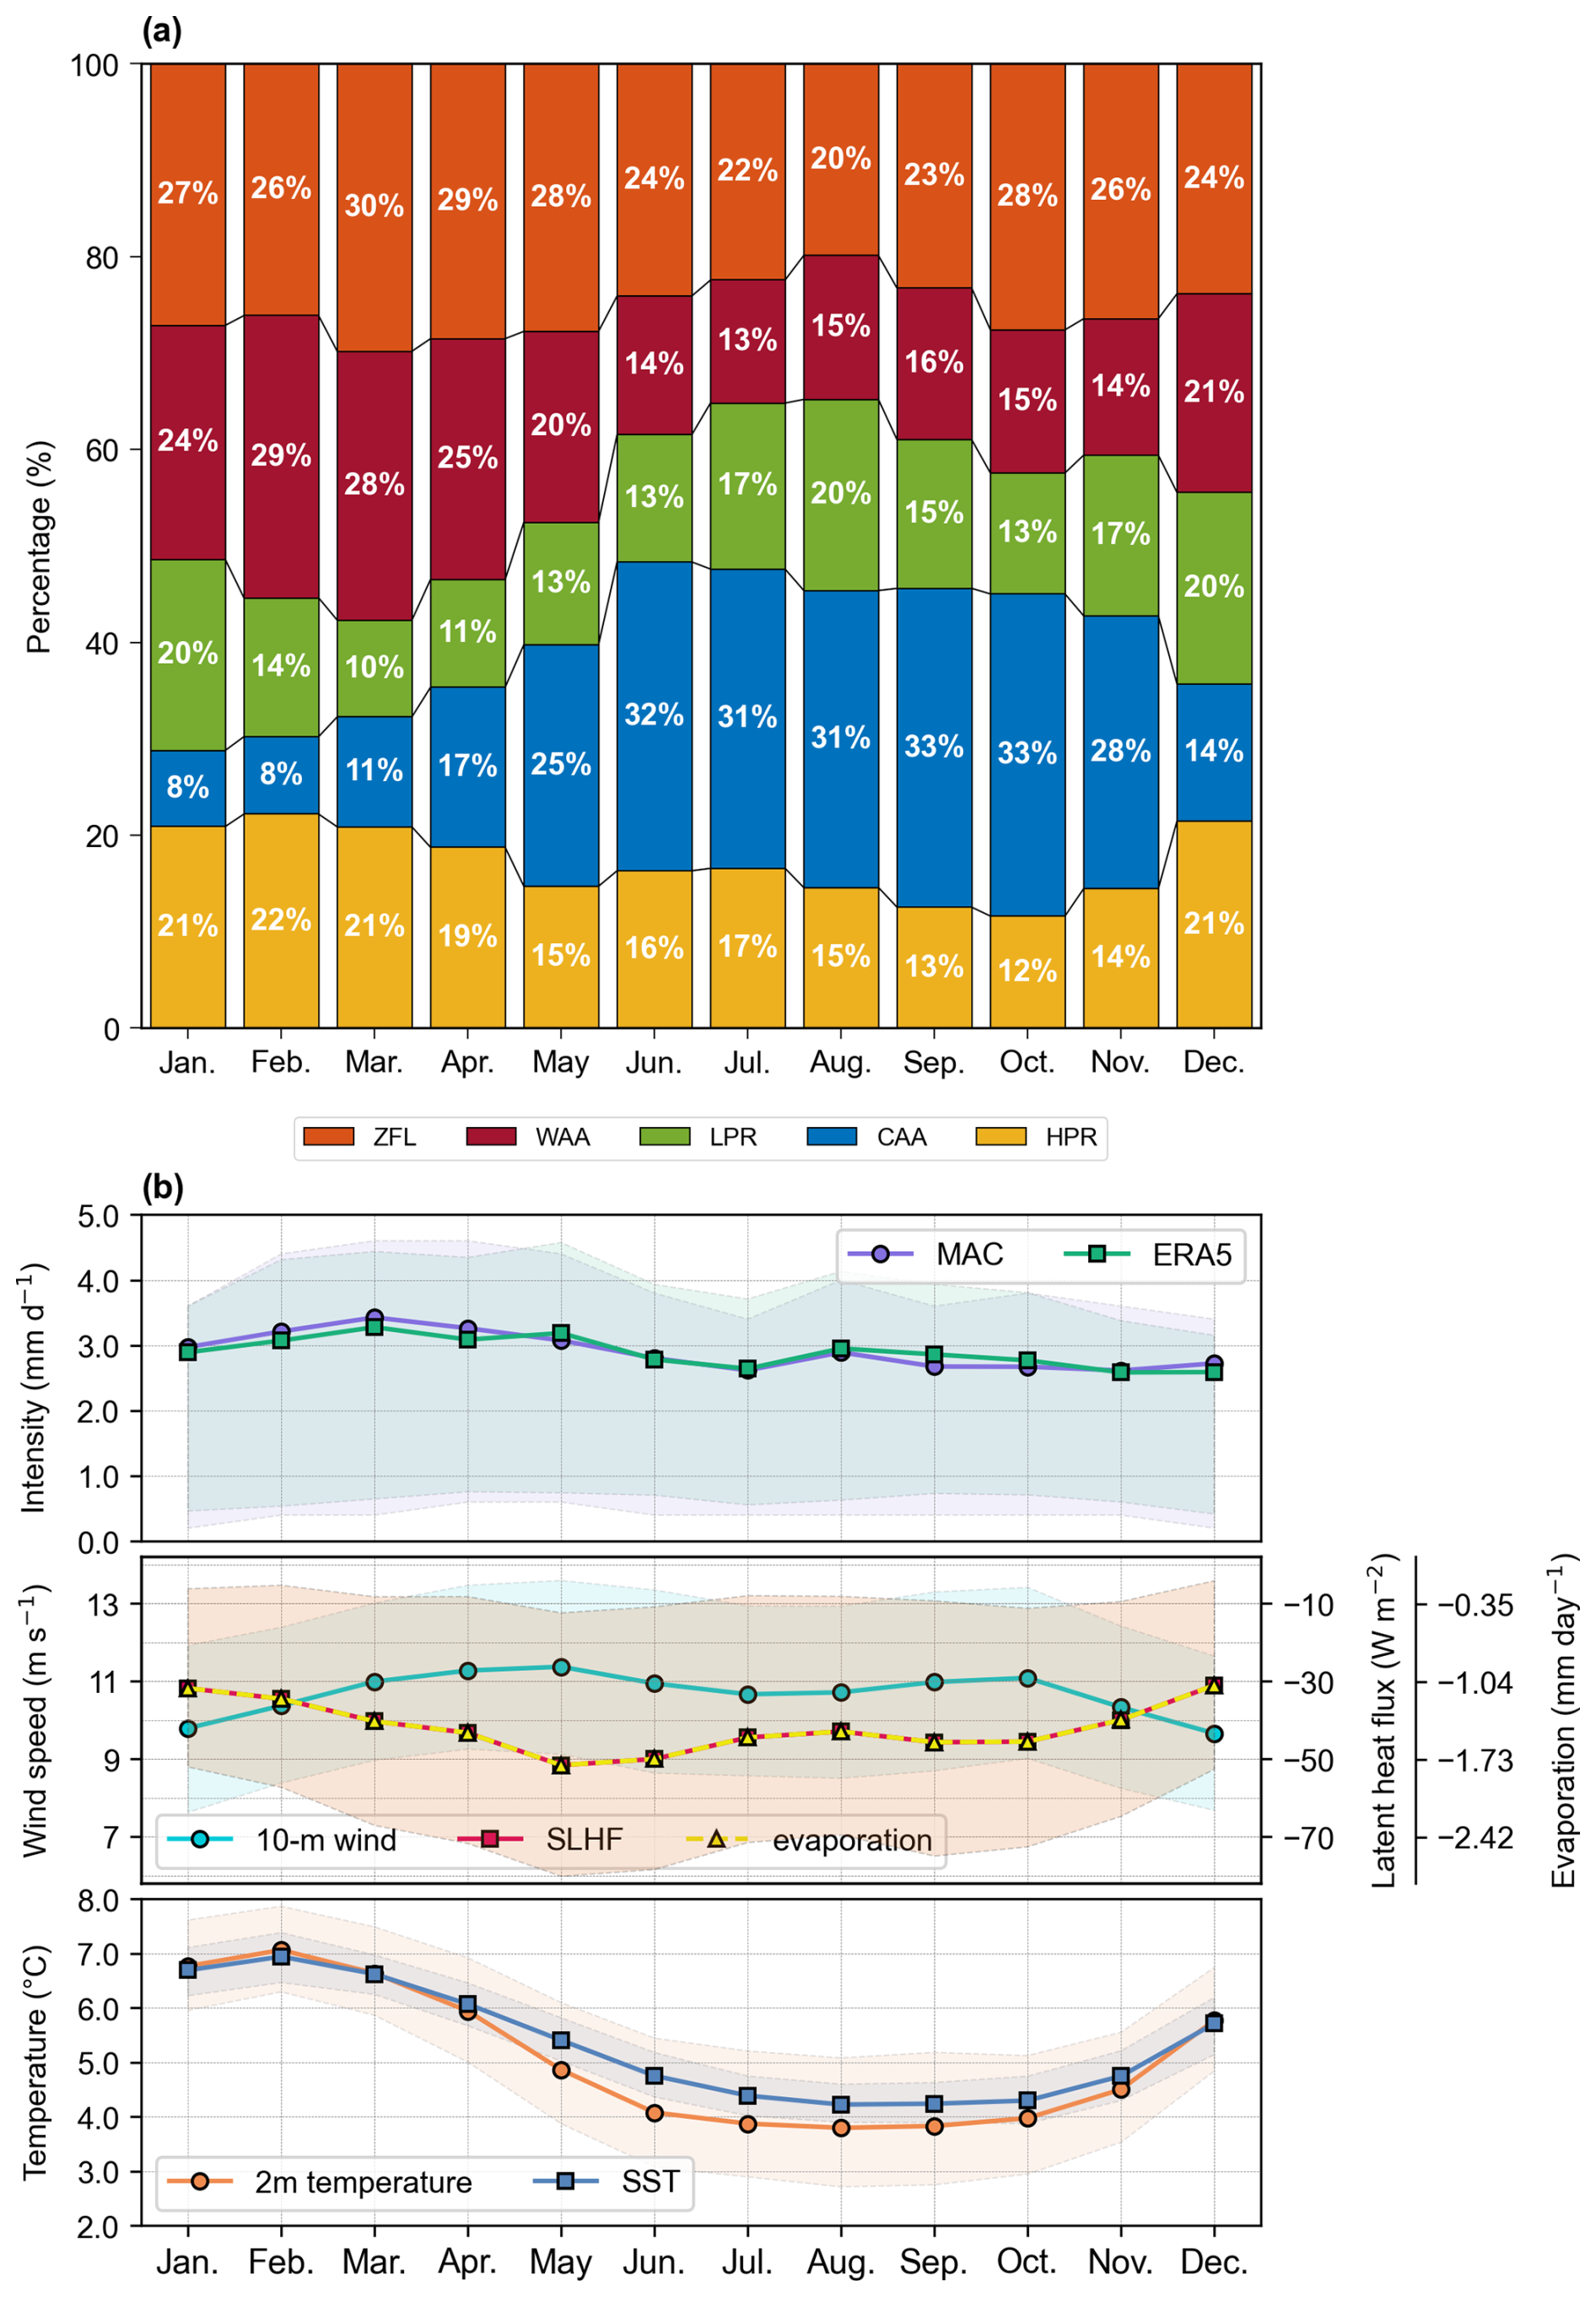
Figure 4(a) Mean monthly frequency of occurrence (%) of each cluster from 1979 to 2023. (b) Monthly means based on daily variables. Precipitation intensity (mm d−1) for MAC observations (purple) and ERA5 (green) (top). ERA5 10 m wind speed (m s−1, green), surface latent heat flux (SLHF, W m−2, red), and evaporation (mm d−1, yellow) (middle). ERA5 2 m air temperature (°C, orange) and SST (°C, blue) (bottom). The shaded areas for each variable represent the range from the 25th to the 75th percentile.
A strong seasonality is observed for these five synoptic regimes along with the key physical measurements of the environment (Fig. 4). The monthly averaged sea surface temperature (SST) reaches a peak in February (6.9 °C) and a minimum in August (4.2 °C) reflecting the thermal lag in the remote ocean SST (Fig. 4b-bottom). SST variations have a strong impact on the synoptic meteorology, being highly correlated with the occurrence of warm air advection (0.96), cold air advection (−0.97) and high pressure (0.88) regimes. The warm air advection and high pressure regimes are most common during a lagged austral summer (January–February–March) at 27 % and 21 %, respectively, while cold air advection is most common during a lagged austral winter (July–August–September) at 32 % (Fig. 4a). This seasonal cycle of the synoptic meteorology aligns with the seasonal cycle of the SO storm track: during the summer the storm track advances poleward with warm air advection and high pressure regimes more common over MAC, while during the winter the storm track retreats to lower latitudes and cold air advection is the dominant synoptic pattern over MAC (Hoskins and Hodges, 2005).
The seasonal cycle of the two remaining synoptic patterns, zonal flow and low pressure, is negatively correlated with each other (−0.68), with the zonal flow peaking in March and reaching a minimum in August. The low pressure regime is most strongly correlated with the ERA5 10 m wind speed (−0.78), which peaks twice through the year in May and October and is negatively correlated with the surface LHF/evaporation (Fig. 4b-middle, and see Methods), reflecting the dependence of heat fluxes on the surface wind speed. Following the ERA5 convention, upward fluxes are negative indicating a cooling of the ocean and warming of the atmosphere. MAC precipitation is relatively steady through the year with a weak peak in March (3.4 mm d−1) and a minimum in July and November (2.6 mm d−1; Fig. 4b-top). Annually averaged, both the MAC and ERA5 precipitation (2.9 mm d−1) far exceed the ERA5 evaporation (1.4 mm d−1) indicating that moisture is converging towards the storm track through some combination of warm air advection from the north and cold air advection from the south.
3.2 Trends in the Precipitation
We now employ these synoptic patterns to explore the bias in the ERA5 precipitation trend. Starting with the frequency of the different regimes, only the warm air advection regime has a statistically significant trend in frequency of occurrence over the 45 years (1979–2023), increasing from 63.2 d yr−1 in 1979 to 78.5 d in 2023 (Table 1). Over the same period, low pressure days decrease from 60.9 to 50.5 d, followed by cold air advection days, which decrease from 85.4 to 80.4 d. However, neither of these decreases is statistically significant (p=0.08 and 0.41, respectively), due to the large year-to-year variability in the frequency of regimes.
Table 1Trends of annual occurrence by number of days for each cluster with increase change and slope p-value (p<0.05 indicating a statistically significant trend, shown in bold). Note: The values for 1979 (predicted) and 2023 (predicted) represent the endpoints of the corresponding regression lines.
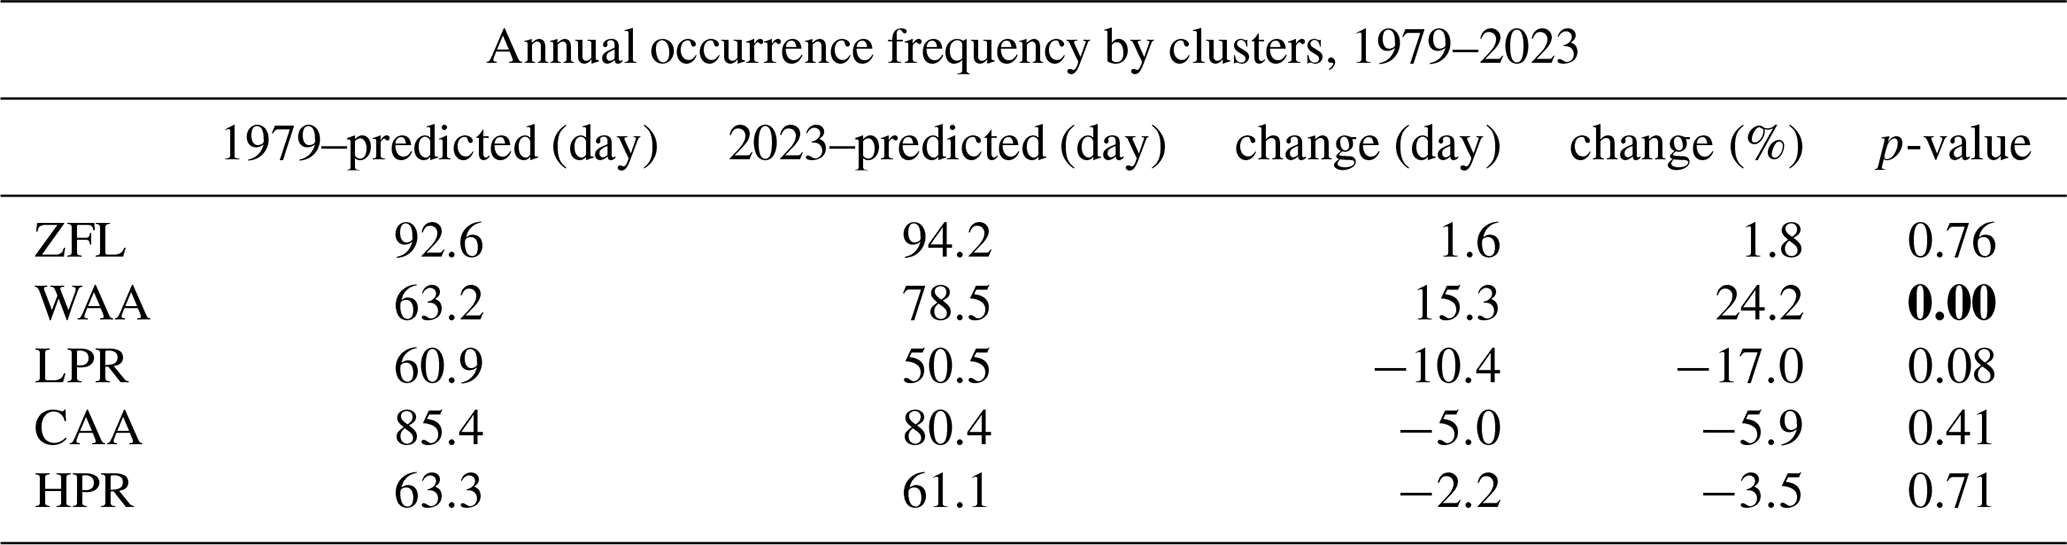
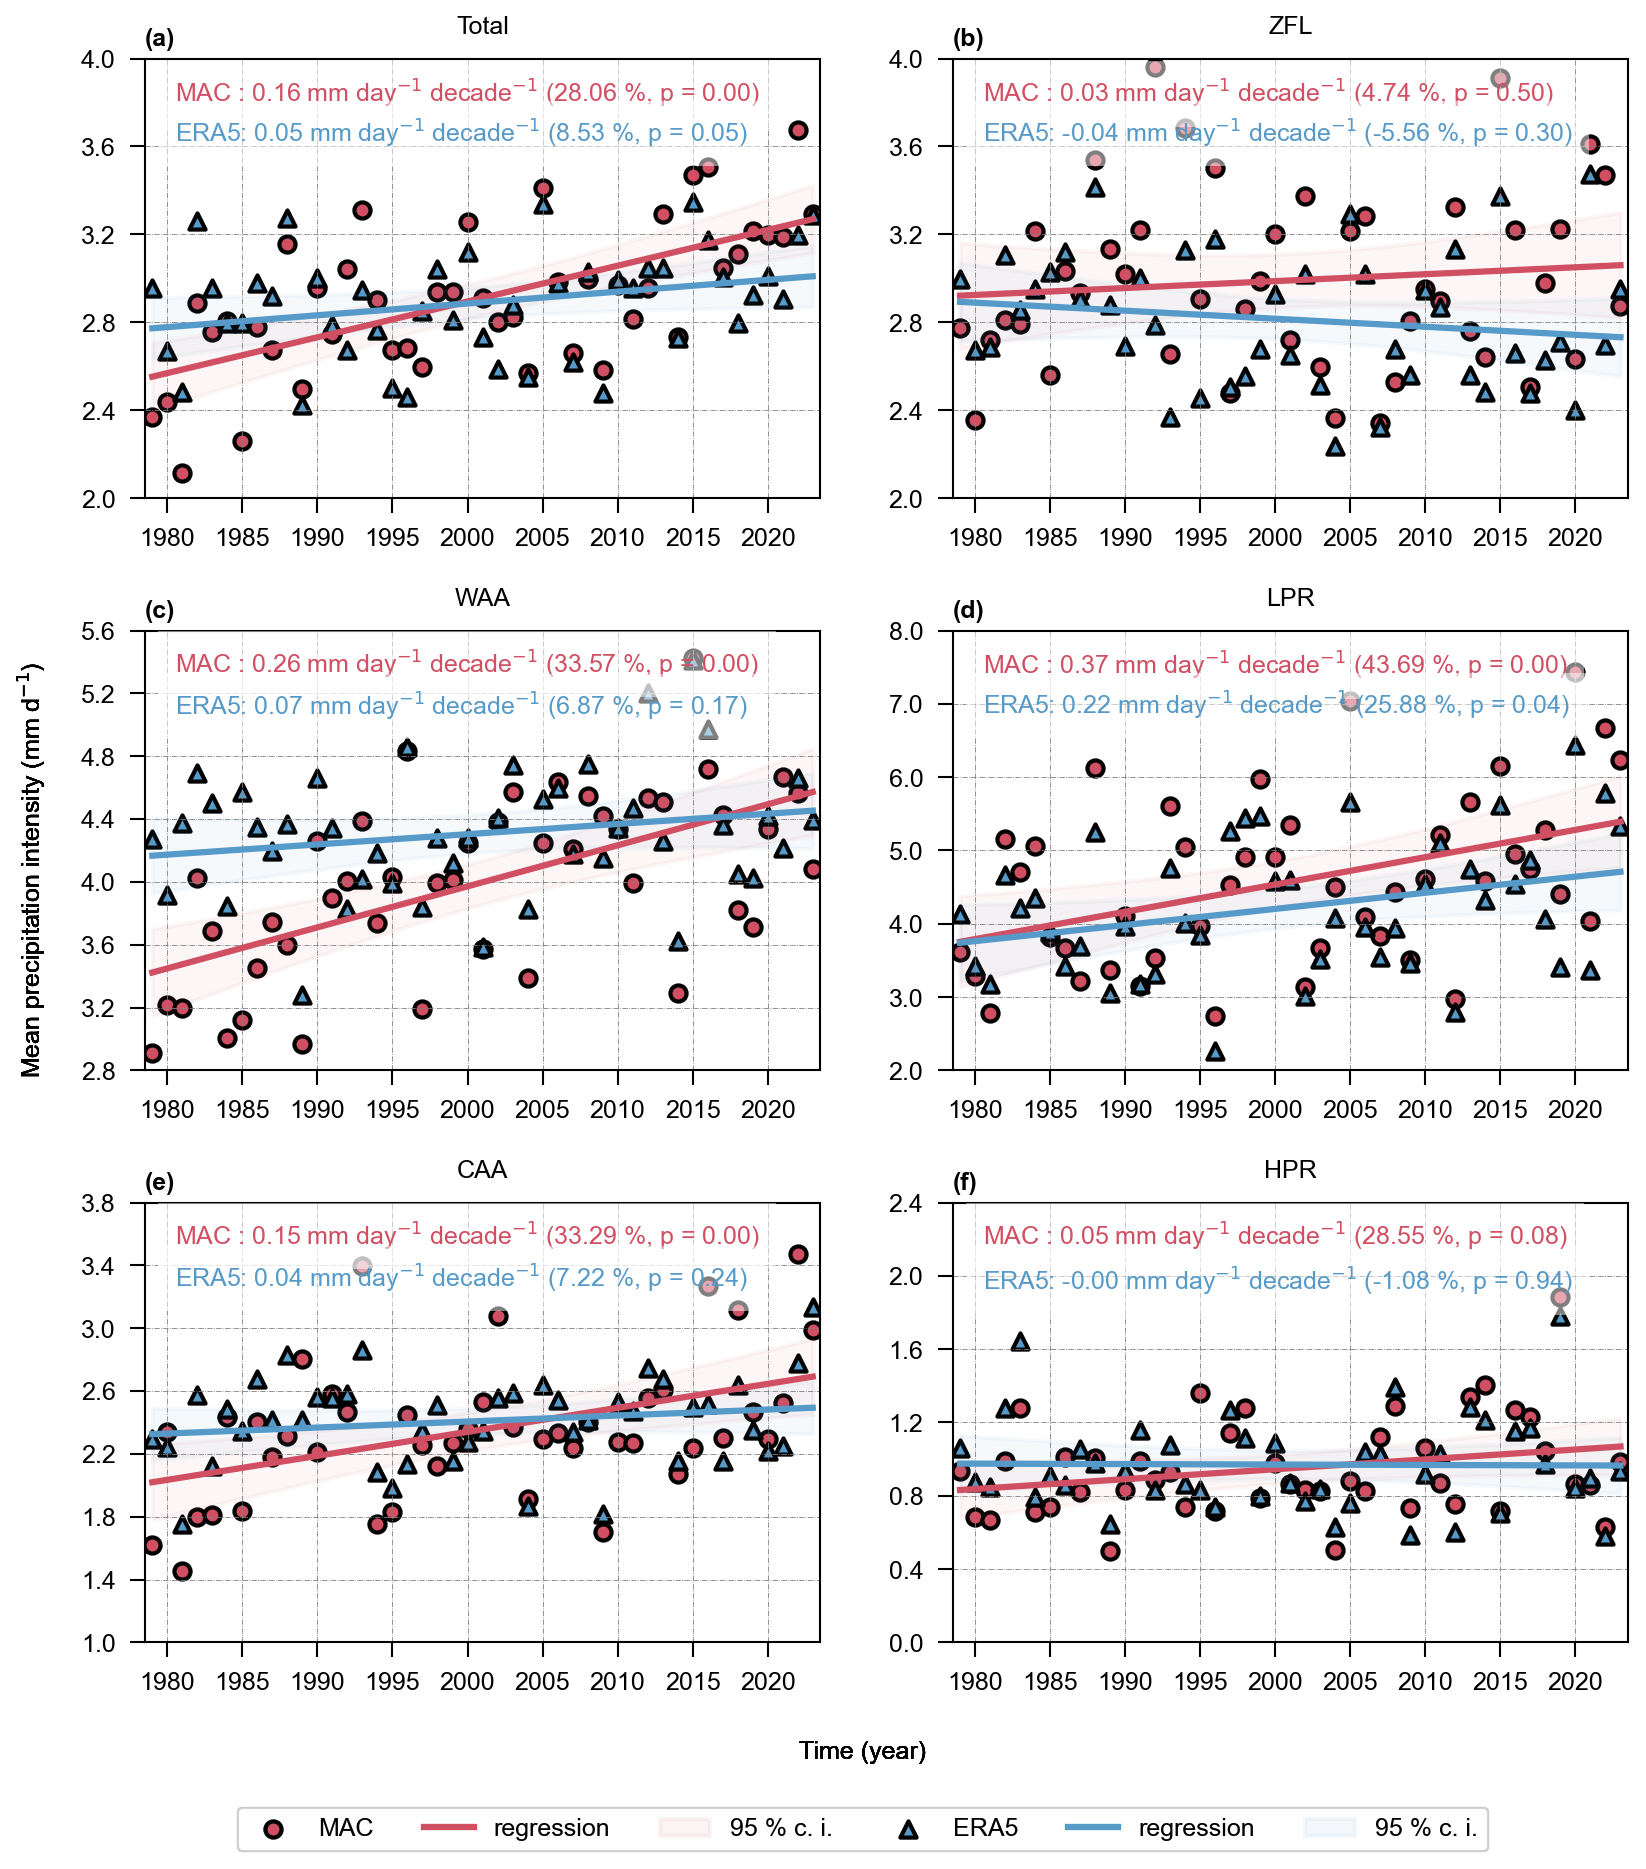
Figure 5Comparison of trends in annual mean daily precipitation intensity (mm d−1) from 1979 to 2023 between MAC observations (red circle) and the nearest ERA5 (blue triangle), shown both overall (a) and separated by individual clusters (b–f). The captions on each panel report the 10-year trend in daily precipitation intensity (mm d−1 10 yr−1), the percentage of increase (%), and the slope p-value (with p<0.05 indicating a statistically significant trend).
Turning to the 45-year trends in the annual mean daily precipitation (Fig. 5), the intensity of the daily MAC precipitation increases 28.1 % (2.6 to 3.3 mm d−1), while ERA5 only increases 8.5 % (2.8 to 3.0 mm d−1), both of which are statistically significant. Breaking this down into the five synoptic patterns, MAC has a positive trend for each one, gaining statistical significance for the warm air advection, low pressure and cold air advection regimes. For ERA5, only the increase in the daily intensity of the low pressure regime is statistically significant. In contrast, the trends for warm and cold air advection show slight increases, while the zonal flow and high pressure regimes exhibit minor negative trends; however, none of these are statistically significant.
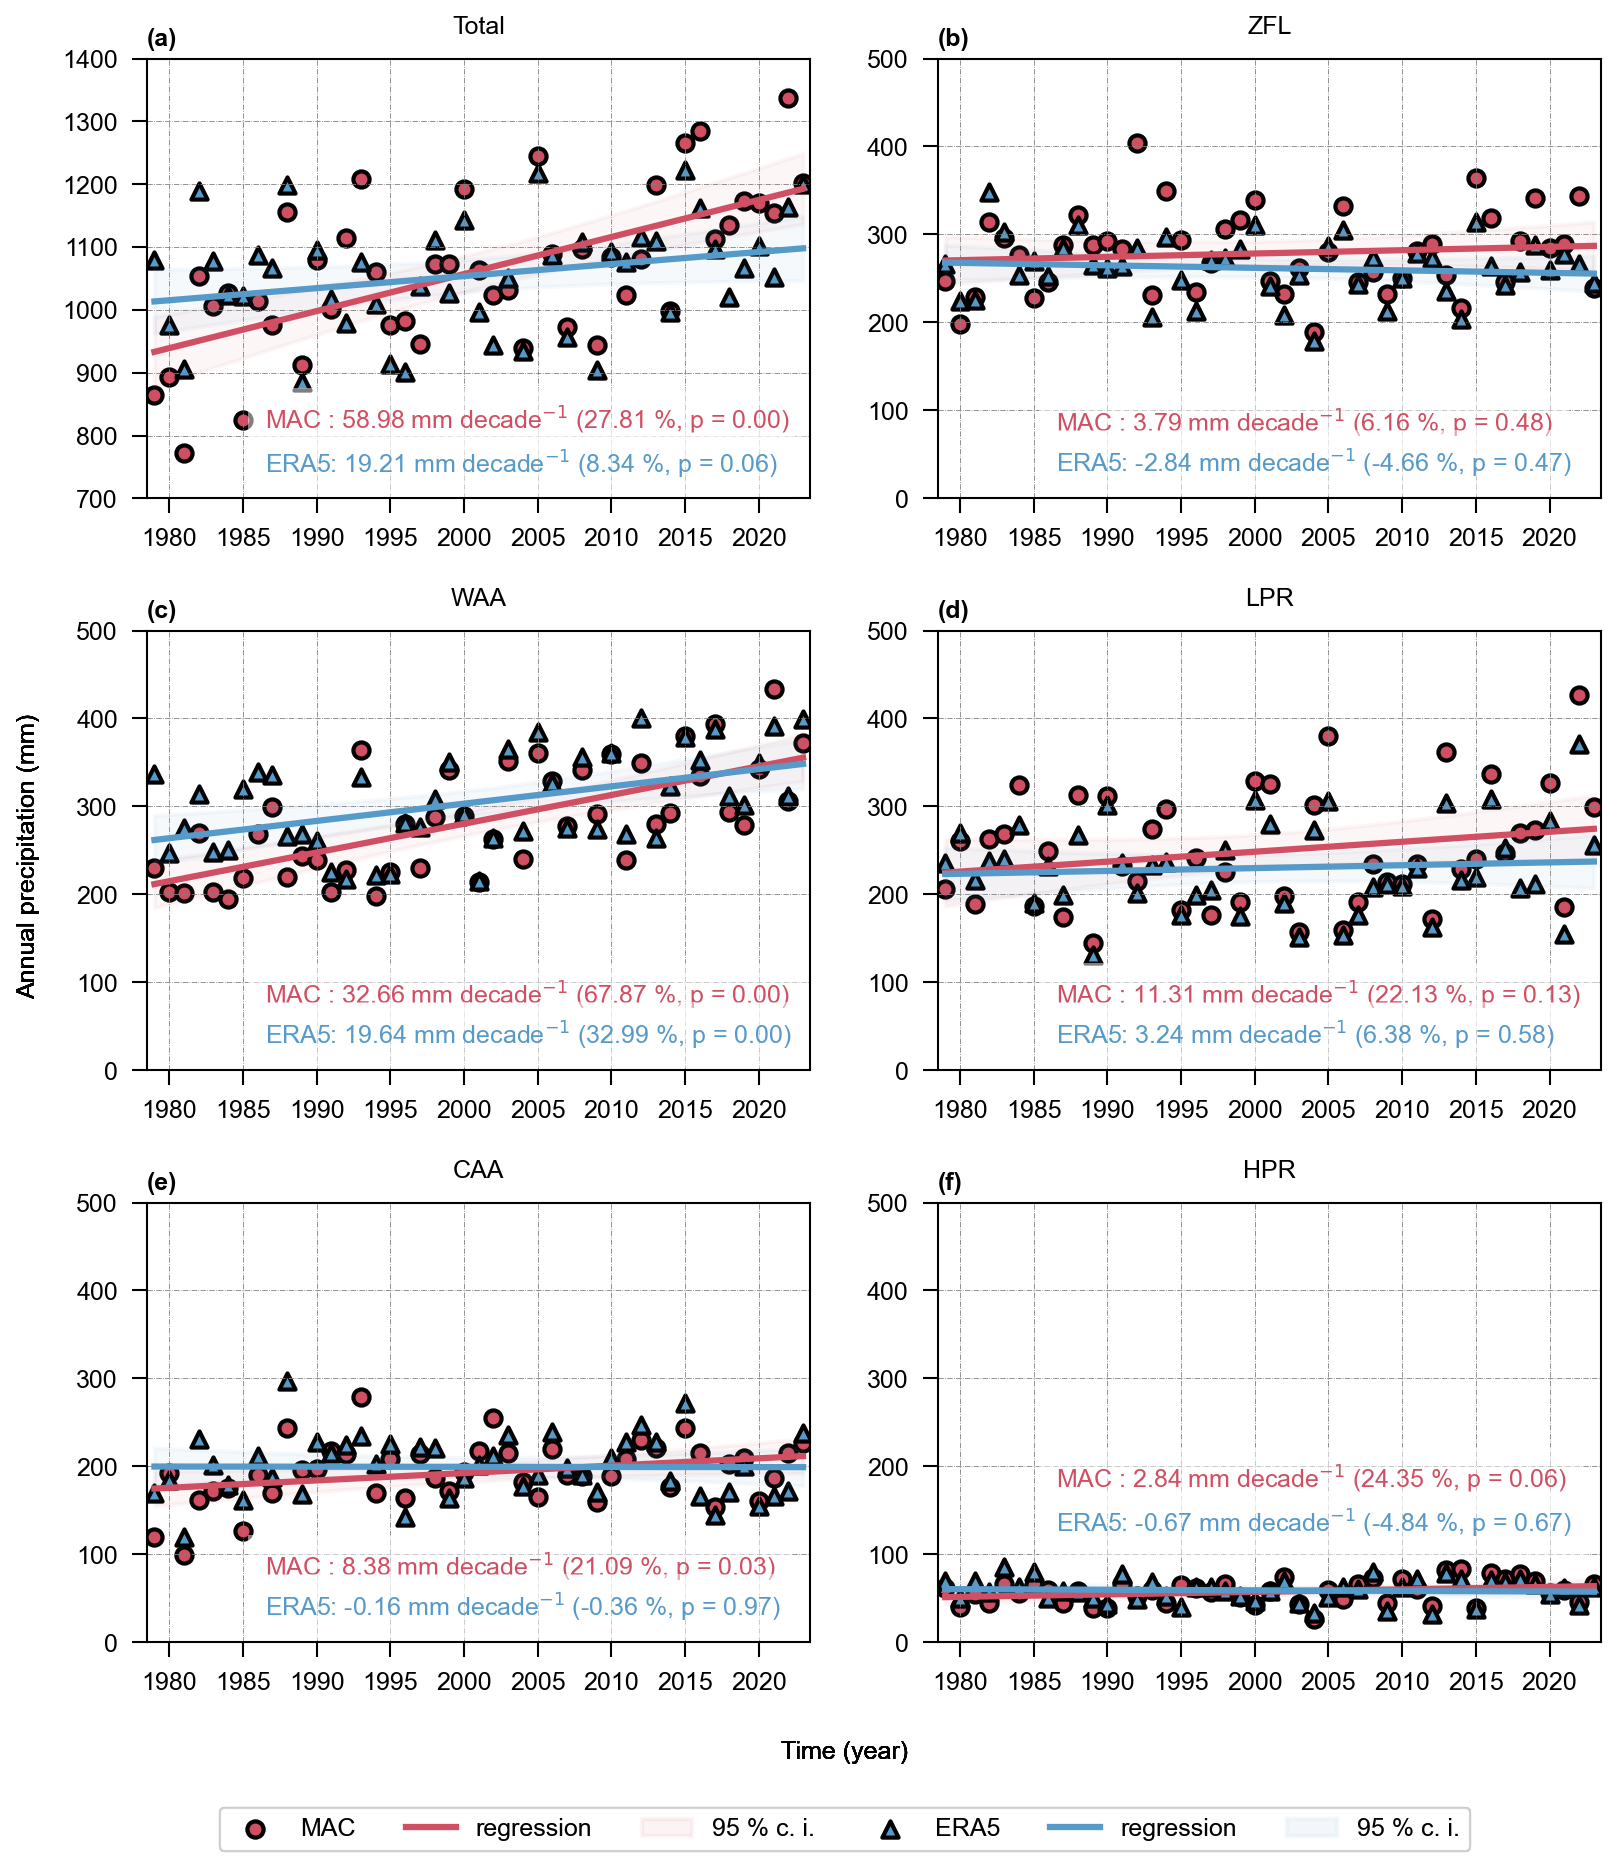
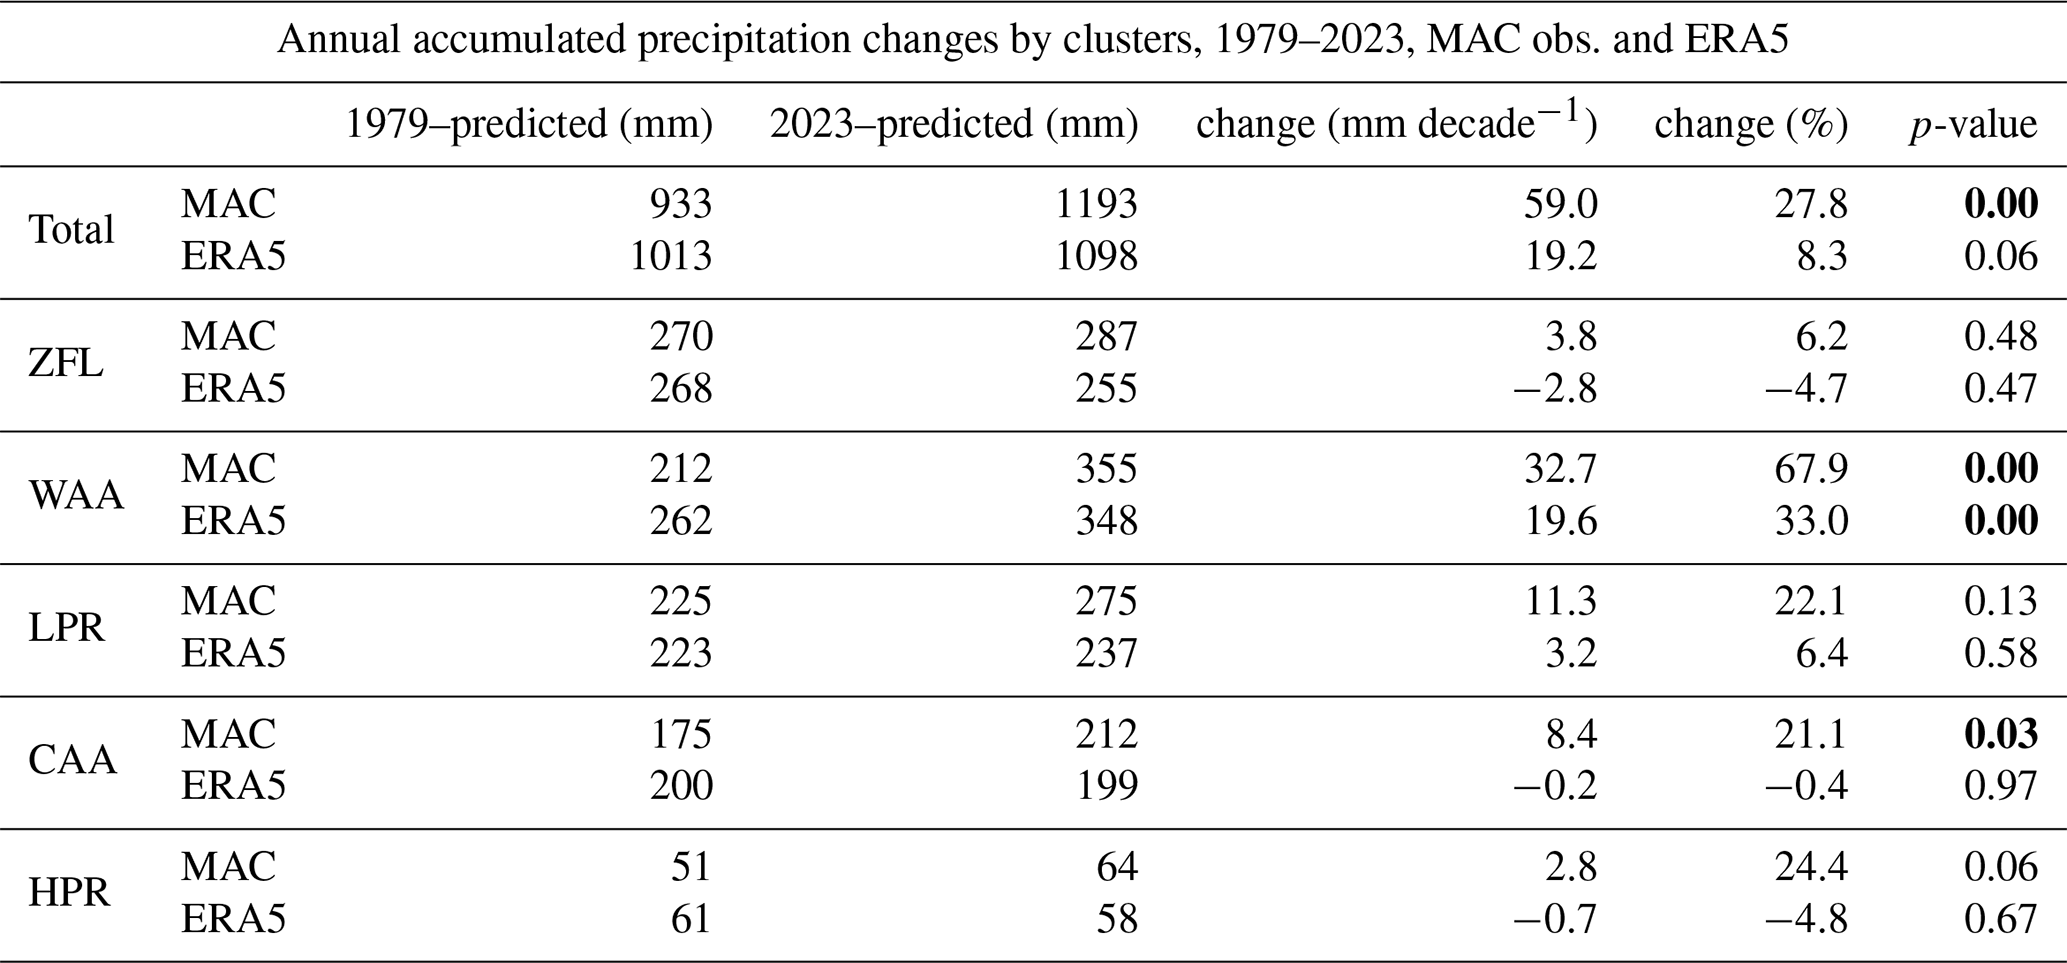
Finally, the trends in the annual accumulated precipitation (Fig. 6) are considered. Overall, the least squares fit in the annual accumulated MAC precipitation increases by 260 mm (from 933 to 1193 mm or 27.8 %) over the 45 years, while the accumulated ERA5 precipitation estimates only increase by 85 mm (from 1013 to 1098 mm or 8.3 %). The bias is evident throughout the year, being slightly stronger in autumn (April–May–June) and winter (July–August–September) (Table 2).
Table 2Seasonal accumulated precipitation changes (mm) for MAC and nearest ERA5 from 1979 to 2023, with the season definition including a 1-month lag.
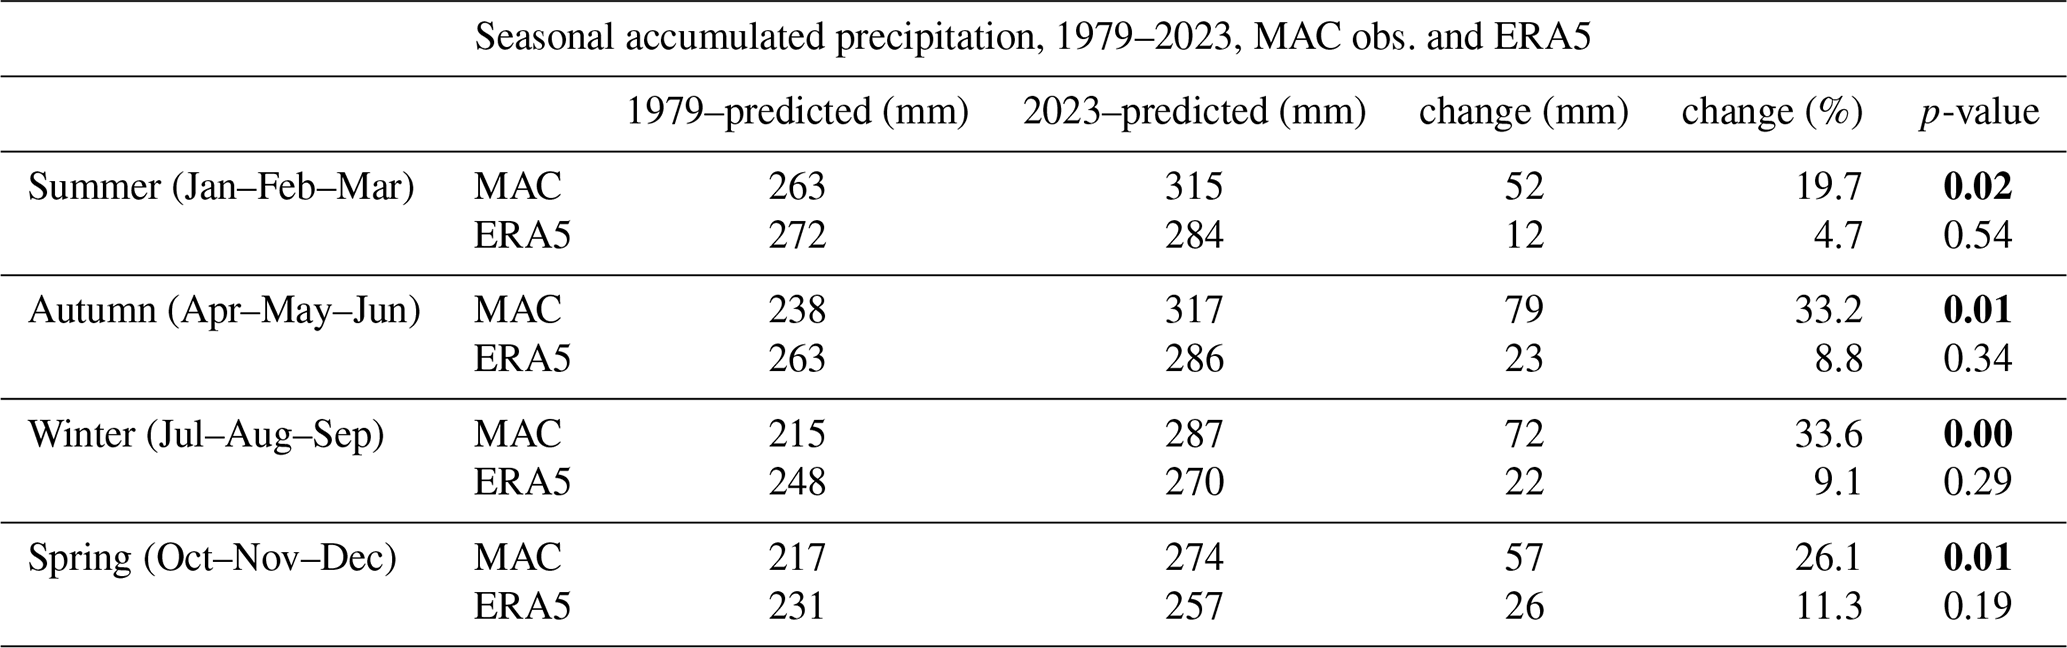
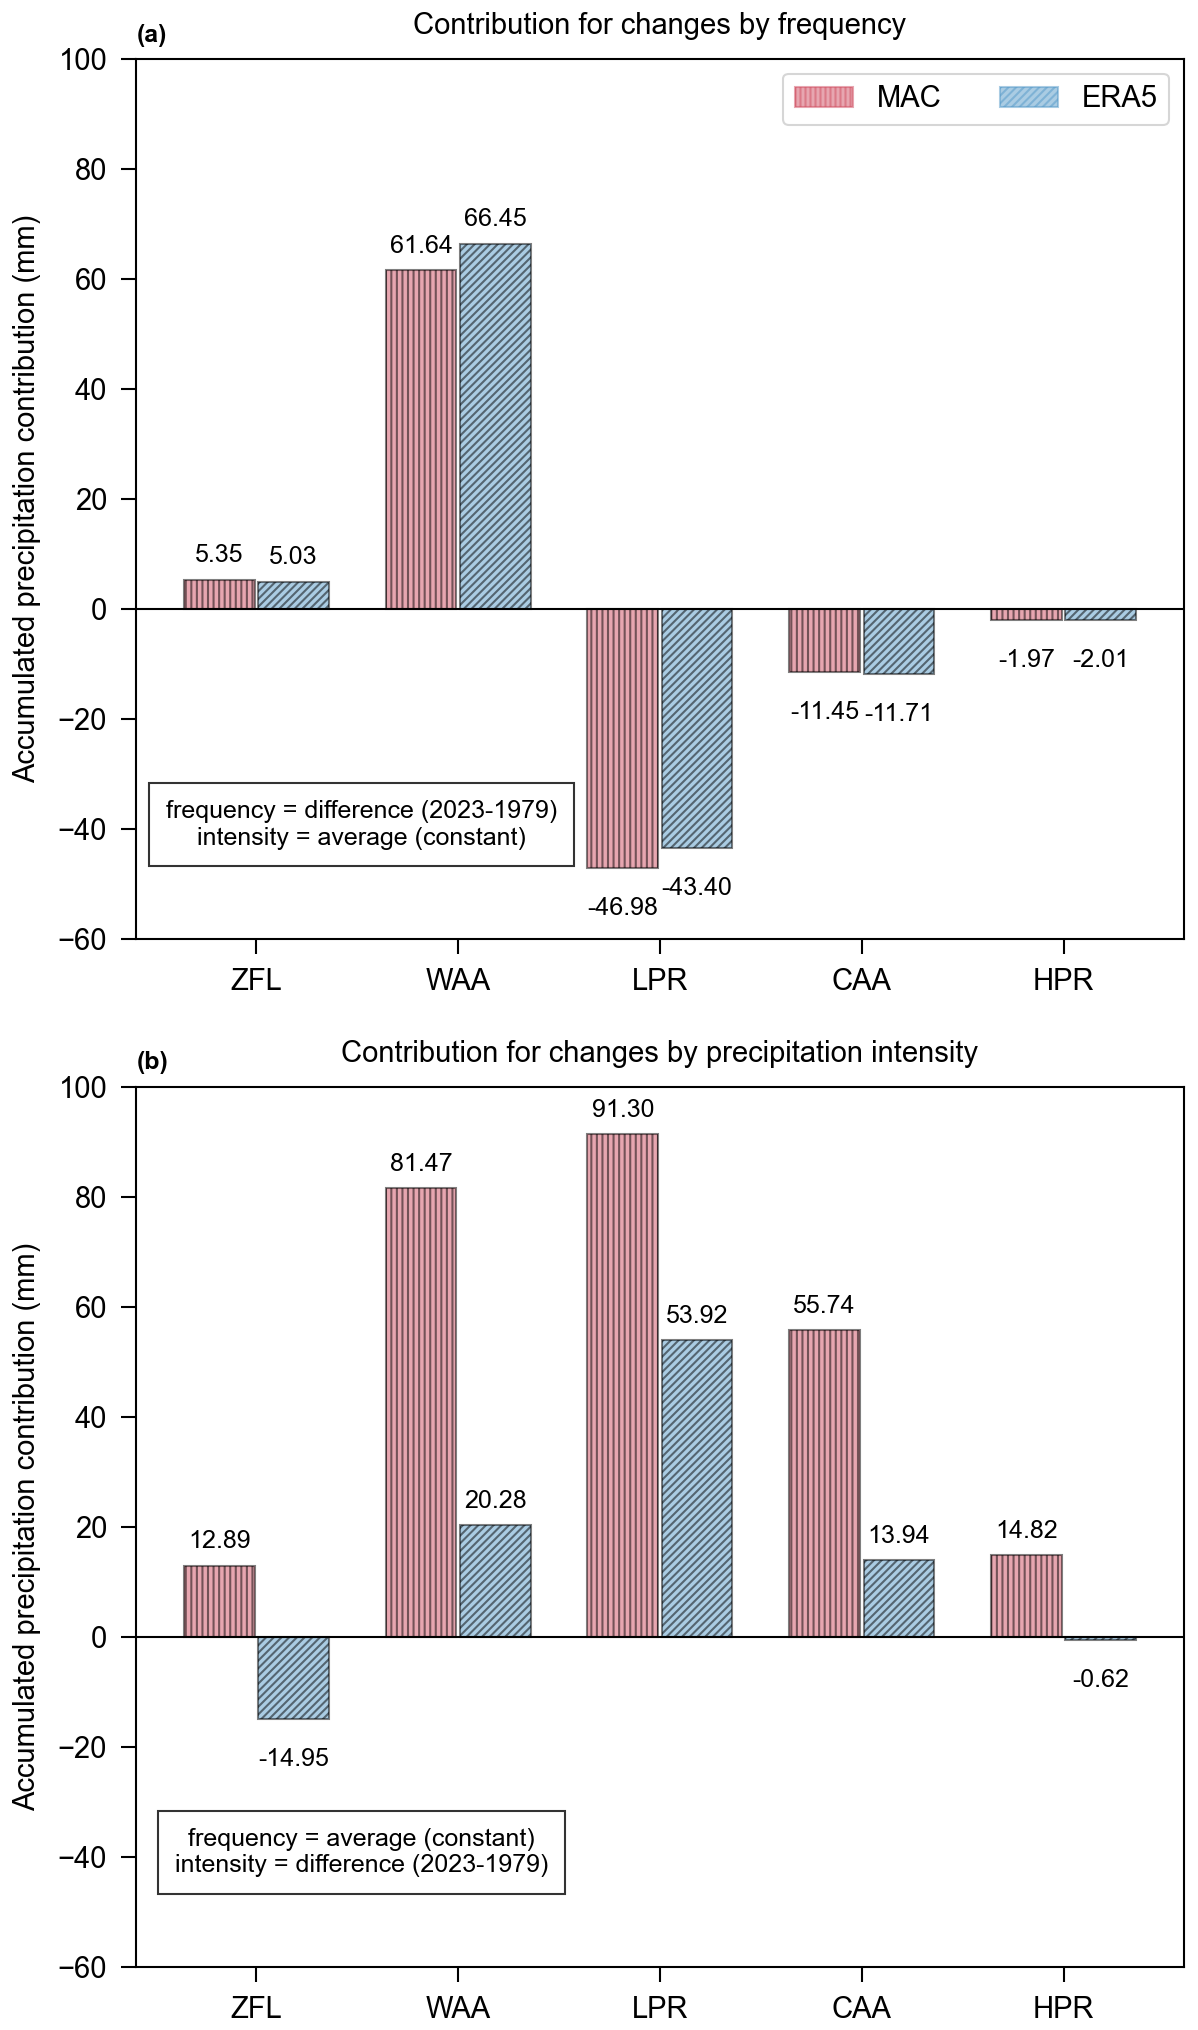
Figure 7Estimations of total contribution by each cluster to the increase in annual precipitation (mm) from 1979 to 2023 based on MAC observations (red vertical lines) and nearest ERA5 (blue diagonal lines) datasets, respectively. The contribution of changes by the occurrence frequency (a) and by the mean daily precipitation intensity (b) are derived from the Ordinary Least Squares (OLS) regression.
Assuming that changes in mean daily intensity are independent of the changes in the frequency of occurrence, we can linearly decompose the increase in accumulated precipitation by regime (Fig. 7). First, we use the observed changes in the frequency of occurrence (Fig. 7a) while fixing the mean daily intensity to find that the increase in the occurrence of the warm air advection regime (15.3 d) drives an increase of 62 mm in the annual accumulated precipitation. The corresponding decreases in the frequency of occurrence of the low pressure and cold air advection regimes, however, lead to decreases of 47 and 11 mm, respectively, over the 45 years. Aggregating the contributions across all five regimes, changes in the synoptic meteorology account for only 7 mm of 260 mm increase in annual MAC precipitation from 1979 to 2023. For ERA5, the changes in the synoptic meteorology account for only 14 mm of the 85 mm increase in accumulated precipitation.
We next examine the contribution from changes in the mean daily intensity when the average annual frequency of occurrence is held constant (Fig. 7b). Summed across all regimes, the increase in the daily intensity accounts for an increase of 256 mm in the MAC record, being led by increases in the low pressure (91 mm), warm air advection (82 mm) and cold air advection (56 mm) regimes. For ERA5, the changes in the daily intensities account for an overall increase of 73 mm, coming primarily from the low pressure regime (54 mm).
While MAC is only a single point along the SO storm track, the record is invaluable in our efforts to understand climate change across the Southern Ocean. The site has experienced a considerable and statistically significant 28 % increase (260 mm) in annual precipitation over the 45-year record spanning from 1979 to 2023, while ERA5 is found to have a substantial bias, recording only an 8 % increase (85 mm) (Fig. 1d). Our five synoptic regimes display a clear seasonality associated with seasonal variations in surface conditions and the storm track. Over these 45 years, the warm air advection regime has become more common over this period, increasing by ∼ 15 d, while the low pressure and cold air advection regimes have decreased by ∼ 10 and ∼ 5 d, respectively. These changes reflect both a potential intensification (Reboita et al., 2015; Chemke et al., 2022), especially at higher latitudes, and a poleward shift of the storm track (Yin, 2005) – features linked to complex atmospheric and oceanic changes across the broader SO region (Shaw and Stevens, 2025), under the background of combined greenhouse gas increases and stratospheric ozone depletion (Swart et al., 2018).
Decomposing this increase in accumulated precipitation into the components arising from changes in frequency of occurrence and changes in mean daily intensity, we find that the shift in the storm track has a small impact on the overall increase in accumulated precipitation for both MAC and ERA5 (Fig. 7a). This is understandable as one heavy precipitation system (low pressure) is largely being replaced by another (warm air advection). ERA5 captures these trends in the synoptic meteorology, as in addition to the extensive use of satellite data, MAC soundings are also assimilated into the reanalysis and are heavily weighted given the remoteness of the location. This result suggests that it is the increase in the mean daily intensity of the different synoptic patterns that drives the increase in accumulated MAC precipitation. Large positive trends in mean daily intensity are evident for warm air advection, low pressure and cold air advection regimes, suggesting that moisture is converging towards the storm track from both low and high latitudes. Combined, the increase in intensity for these three systems accounts for 229 mm of the 260 mm increase in annual precipitation over the 45 years (Fig. 7). The increases in mean daily intensity for these three systems are central to the bias in ERA5, accounting for an annual increase of only 88 mm.
Although more supporting evidence is needed, assuming this increase in annual precipitation at MAC is representative of changes across the full SO storm track, it could have implications for the water and energy budgets over the broader SO. As water in the atmosphere is conserved, the 95 mm underestimation of the ERA5 2023 annual precipitation alone (Fig. 1d) requires either a corresponding overestimation of precipitation elsewhere or an underestimation in evaporation. One potential source of water into the broader SO atmosphere is through a flux from the subtropics, for example from atmospheric rivers (Reid et al., 2020; Rauber et al., 2020), which have been found to increase precipitation widely across the mid-latitudes (Finlon et al., 2020).
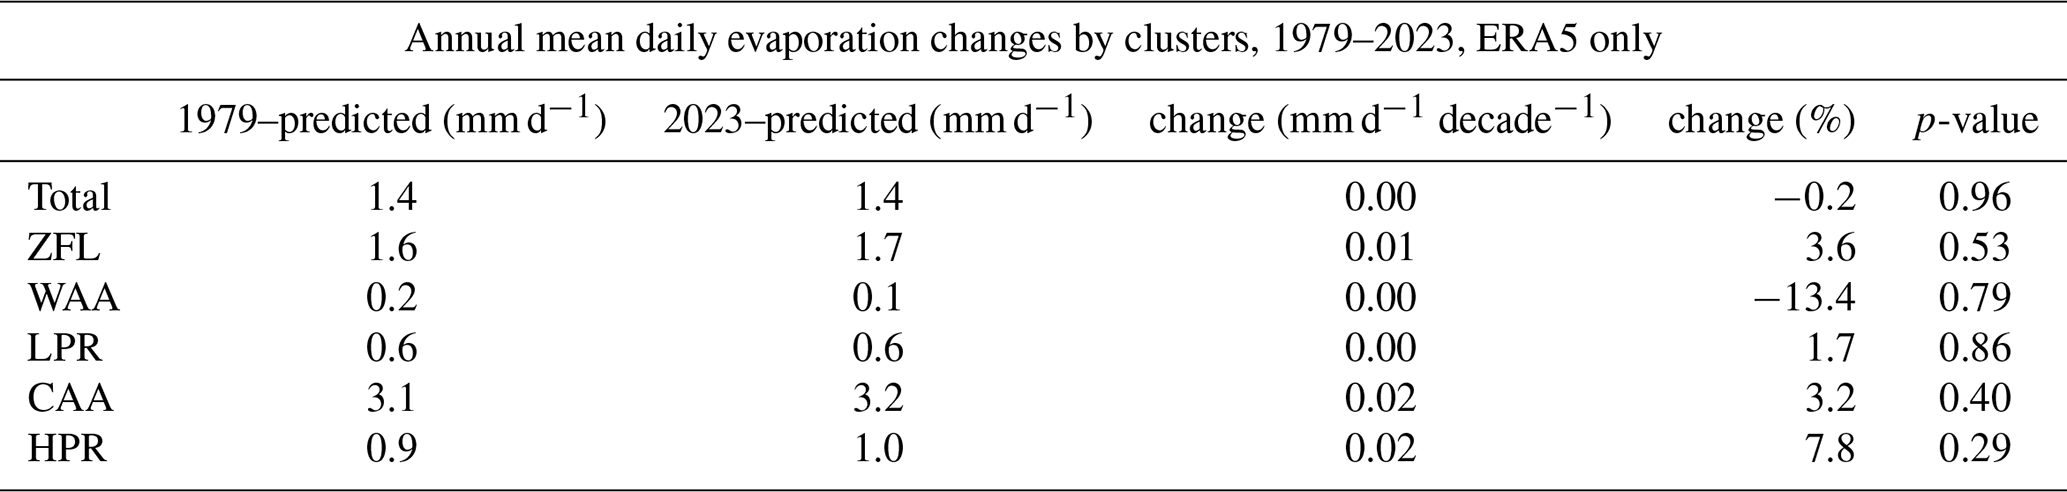
Alternatively, an underestimation of evaporation across the broader SO could produce biases in both the warm and cold air advection into the storm track, as observed, being driven by some combination of increasing westerly winds at higher latitudes and ocean surface warming north of ∼ 40° S (Swart et al., 2018). Such a bias in evaporation would also contribute to the bias in the energy budget over the SO (Trenberth and Fasullo, 2010; Schuddeboom and McDonald, 2021; Hyder et al., 2018), given that 95 mm yr−1 of precipitation corresponds to 7.5 W m−2 LHF (see Methods). Within ERA5, LHF/evaporation is governed by a bulk parameterisation, being sensitive to both surface winds and the saturation humidity at the sea surface and the specific humidity of the near-surface air. Within ERA5, the annually averaged 10 m wind speed at MAC has increased 4.3 % (10.5 to 10.9 m s−1, Table 3) from 1979 to 2023, yet the annually averaged evaporation has had no significant change (Table 4).
Table 3Same as Table 1 but for ERA5 annual mean daily 10 m wind magnitude (m s−1).
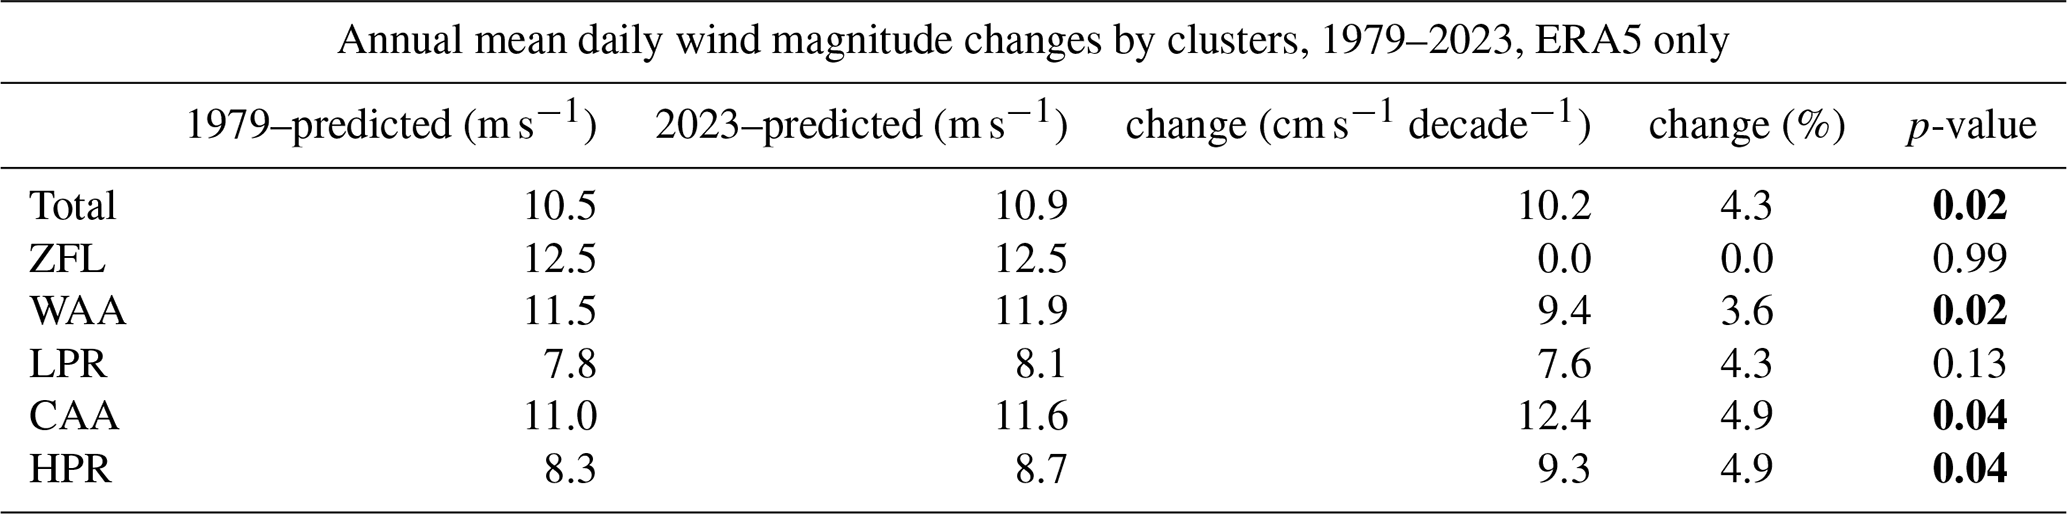
Table 4Same as Table 1 but for ERA5 annual mean daily evaporation (mm day−1).
A bias in the ERA5 evaporation could be a consequence of the bulk parameterisation not capturing the subgrid scale physics of the ocean-atmosphere interface across the broader SO, and that these physical processes have been enhanced over the past 45 years. For example, widespread shallow convection has been observed to produce precipitation, cold downdrafts, and gusty winds at the ocean surface on the scale of kilometres, beyond the horizontal grid spacing of ERA5 (Lang et al., 2021, 2022; Alinejadtabrizi et al., 2024). Further, the broader SO is renowned for intense winds and waves that produce abundant sea spray, which can lead to enhanced surface latent and heat fluxes compared with standard bulk calculations (Song et al., 2022; Richter and Veron, 2016; Hartery et al., 2020; Lin et al., 2024). Understanding the processes that are causing the ERA5 bias in precipitation will also inform the assessment of coupled climate models, which suffer from a similar bias (Purich et al., 2018) and are even underestimating storm track trends against ERA5 (Chemke et al., 2022).
This increase in precipitation has further implications for the freshwater flux over the high-latitude SO. The hypothesised increased evaporation, predominantly in the region north of the storm track, is consistent with the observed increase in surface salinity north of 45° S (Swart et al., 2018). Further poleward, consistent with the observed intensified precipitation at MAC, a surface freshening has been observed (Durack and Wijffels, 2010; Durack et al., 2012). Assuming the storm track region typically extends over more than half of the hemisphere longitudinally, and across the 50–60° S latitude band (Hoskins and Hodges, 2005), this implies that it covers an area of more than 1.3×10⁷ km2. Ignoring any changes in evaporation within the storm track region and extrapolating, the observed MAC precipitation increase of 260 mm over this area represents an additional ∼ 3400 Gt freshwater flux into the high-latitude SO in 2023 compared to 1979. The ERA5 precipitation intensification represents an additional ∼ 1100 Gt freshwater flux over this same time, an underestimation of ∼ 2300 Gt. These high-latitude freshwater fluxes are substantial: for context, current Antarctic mass loss estimates from the 1990s to the present are of order 200–500 Gt yr−1 (Swart et al., 2023). While intensified precipitation does not raise sea levels like Antarctic mass loss, increased freshwater fluxes modify SO stratification and circulation and have far-reaching climate impacts. Coincident with surface freshening, high-latitude SO surface cooling from ∼ 1980–2010 (Dong et al., 2023) is consistent with increased stratification and a weaker entrainment of warmer subsurface waters into the surface layer and is supported by modelling studies examining the impact of SO surface freshening (Pauling et al., 2016; Purich et al., 2018). Furthermore, emerging evidence suggests the high latitude SO cooling is linked to the cooling in the eastern equatorial Pacific (Kang et al., 2023a, b; Watanabe et al., 2024), highlighting the global consequences of increased precipitation across the SO storm track, as observed at MAC.
While MAC offers precious long-term observations over the SO, its single-point nature introduces potential scale mismatch with the nearest ERA5 grid-cell mean (0.25°×0.25°, ∼ 15–30 km), which may contribute to the observed biases in precipitation trends. Moreover, the extent to which MAC observations are representative of the broader SO area remains uncertain. Employing higher-resolution models or satellite products, as well as validating results against other stations within this region, would help mitigate these limitations in future studies.
Table A1Numerical details extracted from Fig. 5. (p<0.05 indicating a statistically significant trend, shown in bold).
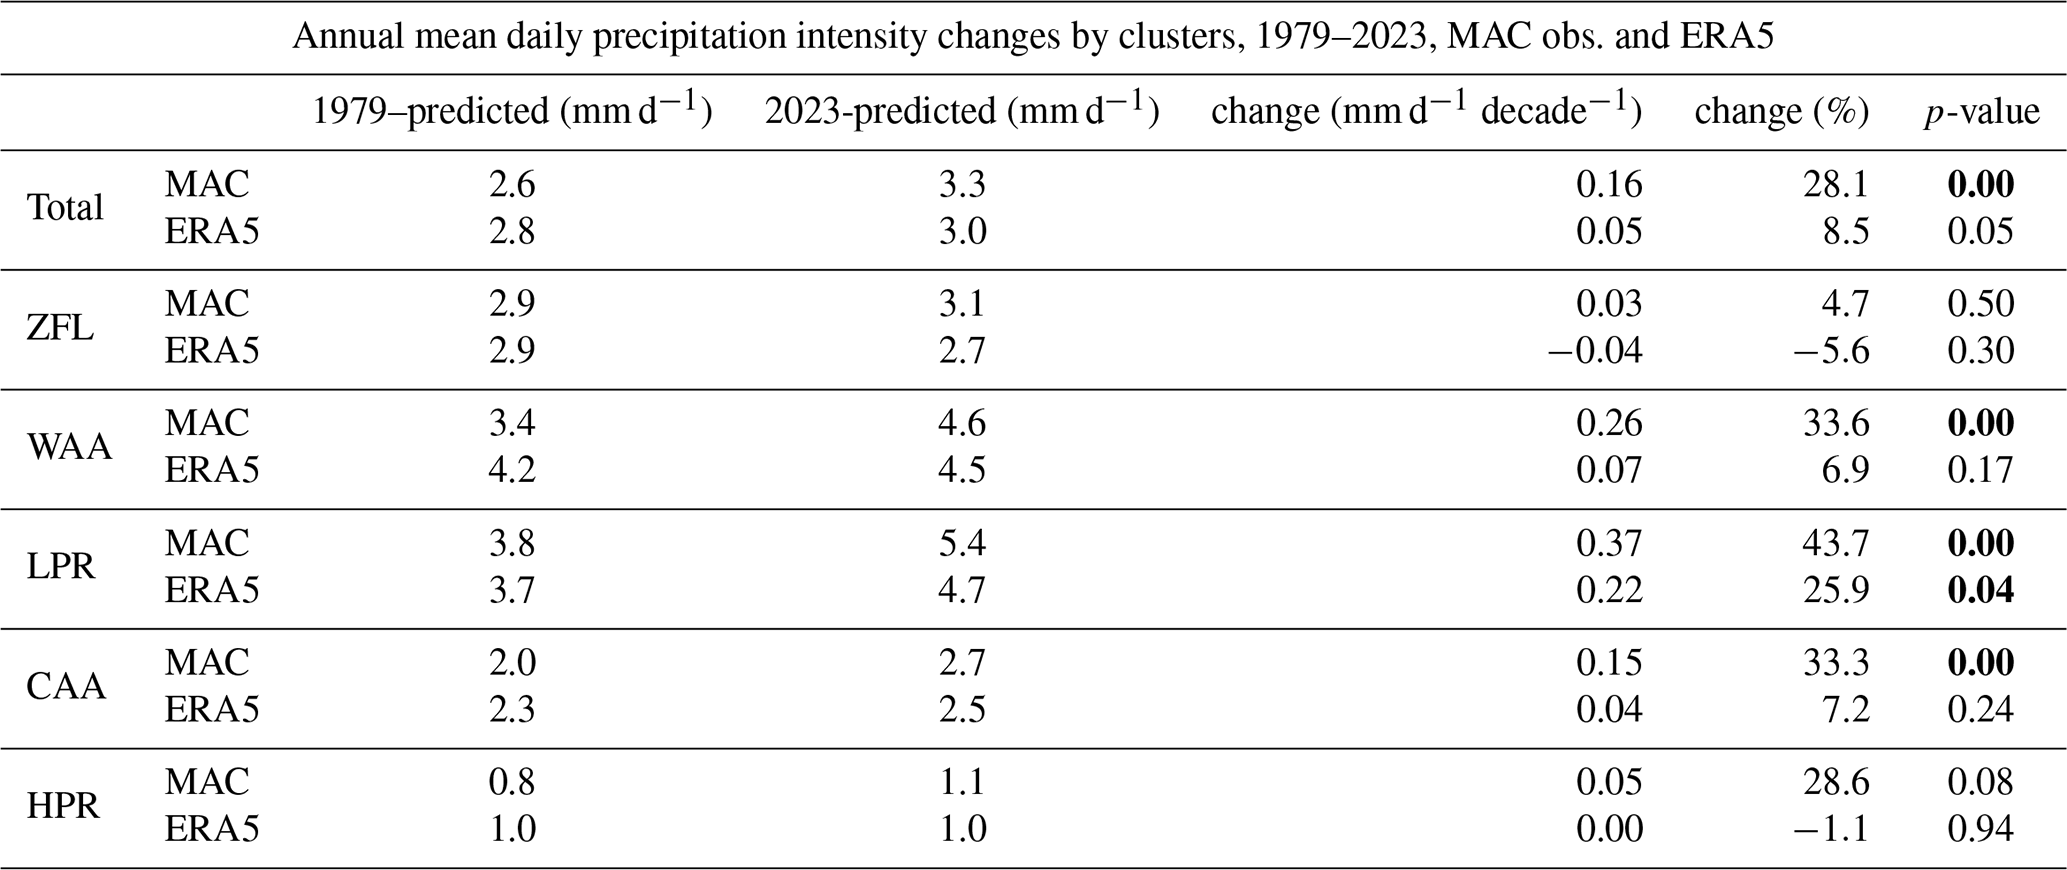
Table A2Numerical details extracted from Fig. 6. (p<0.05 indicating a statistically significant trend, shown in bold).
The Macquarie Island observational data are available from the Australian Bureau of Meteorology (A-BoM) at http://www.bom.gov.au/climate/data/ (last access: 27 November 2025) and from the NCEI-NOAA Global Hourly Integrated Surface Database (ISD) at https://www.ncei.noaa.gov/products/land-based-station/integrated-surface-database (last access: 27 November 2025). ECMWF reanalysis data (ERA5) can be accessed via the Copernicus Climate Data Store at https://doi.org/10.24381/cds.bd0915c6 (Copernicus Climate Change Service (C3S), 2023a) and https://doi.org/10.24381/cds.adbb2d47 (Copernicus Climate Change Service (C3S), 2023b). Topographic data (SRTMGL1) are available from the NASA Land Processes Distributed Active Archive Centre (LP DAAC) at https://doi.org/10.5067/MEASURES/SRTM/SRTMGL1.003 (NASA JPL, 2013). The HYSPLIT model is available from the NOAA Air Resources Laboratory at https://www.ready.noaa.gov/HYSPLIT.php (last access: 27 November 2025). The MeteoInfo software (used to convert ERA5 GRIB files into HYSPLIT ARL format) is available from http://www.meteothink.org/ (last access: 27 November 2025). The Scikit-Learn library of Python used for the k-means clustering analysis can be accessed at https://doi.org/10.5281/zenodo.8098905 (Grisel et al., 2023).
Zhaoyang Kong, Andrew Prata, and Ariaan Purich performed most of the data analysis and visualization. Steven Siems, Peter May, Yi Huang, and Ariaan Purich provided the foundational framework and contributed the main parts of the initial manuscript draft. All authors provided editorial feedback on the manuscript. All authors read and approved the final version.
The contact author has declared that none of the authors has any competing interests.
Publisher’s note: Copernicus Publications remains neutral with regard to jurisdictional claims made in the text, published maps, institutional affiliations, or any other geographical representation in this paper. While Copernicus Publications makes every effort to include appropriate place names, the final responsibility lies with the authors. Views expressed in the text are those of the authors and do not necessarily reflect the views of the publisher.
We acknowledge support from the National Computational Infrastructure (NCI), Australia. We are sincerely grateful to the Australian Antarctic Division (AAD) and the Australian Bureau of Meteorology (BoM) for kindly providing the observational data and the accompanying photograph. We further appreciate Prof. Tim Woollings, the two anonymous reviewers, and the editorial team for their constructive comments, insightful suggestions, and helpful support, all of which greatly improved this work.
This research has been supported by the ARC SRIEAS Securing Antarctica's Environmental Future (SAEF) (grant no. SR200100005) and the ARC Centre of Excellence for 21st Century Weather (grant no. CE230100012).
This paper was edited by Tim Woollings and reviewed by two anonymous referees.
Adams, N.: Climate trends at Macquarie Island and expectations of future climate change in the sub-Antarctic, PPRST, 143, 1–8, https://doi.org/10.26749/rstpp.143.1.1, 2009.
Alinejadtabrizi, T., Lang, F., Huang, Y., Ackermann, L., Keywood, M., Ayers, G., Krummel, P., Humphries, R., Williams, A. G., Siems, S. T., and Manton, M.: Wet deposition in shallow convection over the Southern Ocean, npj Clim. Atmos. Sci., 7, 76, https://doi.org/10.1038/s41612-024-00625-1, 2024.
Australian Antarctic Division (AAD): Macquarie Island station renovation, https://www.antarctica.gov.au/news/2021/macquarie-island-station-renovation/ (last access: 7 July 2025), 2021.
Bergstrom, D. M., Bricher, P. K., Raymond, B., Terauds, A., Doley, D., McGeoch, M. A., Whinam, J., Glen, M., Yuan, Z., Kiefer, K., Shaw, J. D., Bramely-Alves, J., Rudman, T., Mohammed, C., Lucieer, A., Visoiu, M., Jansen Van Vuuren, B., and Ball, M. C.: Rapid collapse of a sub-Antarctic alpine ecosystem: the role of climate and pathogens, Journal of Applied Ecology, 52, 774–783, https://doi.org/10.1111/1365-2664.12436, 2015.
Bodas-Salcedo, A., Mulcahy, J. P., Andrews, T., Williams, K. D., Ringer, M. A., Field, P. R., and Elsaesser, G. S.: Strong Dependence of Atmospheric Feedbacks on Mixed-Phase Microphysics and Aerosol-Cloud Interactions in HadGEM3, J. Adv. Model. Earth Syst., 11, 1735–1758, https://doi.org/10.1029/2019MS001688, 2019.
Cai, W., Gao, L., Luo, Y., Li, X., Zheng, X., Zhang, X., Cheng, X., Jia, F., Purich, A., Santoso, A., Du, Y., Holland, D. M., Shi, J.-R., Xiang, B., and Xie, S.-P.: Southern Ocean warming and its climatic impacts, Science Bulletin, 68, 946–960, https://doi.org/10.1016/j.scib.2023.03.049, 2023.
Cesana, G. V., Khadir, T., Chepfer, H., and Chiriaco, M.: Southern Ocean Solar Reflection Biases in CMIP6 Models Linked to Cloud Phase and Vertical Structure Representations, Geophysical Research Letters, 49, e2022GL099777, https://doi.org/10.1029/2022GL099777, 2022.
Chemke, R., Ming, Y., and Yuval, J.: The intensification of winter mid-latitude storm tracks in the Southern Hemisphere, Nat. Clim. Chang., 12, 553–557, https://doi.org/10.1038/s41558-022-01368-8, 2022.
Copernicus Climate Change Service (C3S): ERA5 hourly data on pressure levels from 1940 to present, Copernicus Climate Change Service (C3S) Climate Data Store (CDS) [data set], https://doi.org/10.24381/cds.bd0915c6, 2023a.
Copernicus Climate Change Service (C3S): ERA5 hourly data on single levels from 1940 to present, Copernicus Climate Change Service (C3S) Climate Data Store (CDS) [data set], https://doi.org/10.24381/cds.adbb2d47, 2023b.
Dickson, C. R., Baker, D. J., Bergstrom, D. M., Brookes, R. H., Whinam, J., and McGeoch, M. A.: Widespread dieback in a foundation species on a sub-Antarctic World Heritage Island: Fine-scale patterns and likely drivers, Austral Ecology, 46, 52–64, https://doi.org/10.1111/aec.12958, 2021.
Dong, Y., Polvani, L. M., and Bonan, D. B.: Recent Multi-Decadal Southern Ocean Surface Cooling Unlikely Caused by Southern Annular Mode Trends, Geophysical Research Letters, 50, e2023GL106142, https://doi.org/10.1029/2023GL106142, 2023.
Durack, P. J. and Wijffels, S. E.: Fifty-Year Trends in Global Ocean Salinities and Their Relationship to Broad-Scale Warming, Journal of Climate, 23, 4342–4362, https://doi.org/10.1175/2010JCLI3377.1, 2010.
Durack, P. J., Wijffels, S. E., and Matear, R. J.: Ocean Salinities Reveal Strong Global Water Cycle Intensification During 1950 to 2000, Science, 336, 455–458, https://doi.org/10.1126/science.1212222, 2012.
Farr, T. G., Rosen, P. A., Caro, E., Crippen, R., Duren, R., Hensley, S., Kobrick, M., Paller, M., Rodriguez, E., Roth, L., Seal, D., Shaffer, S., Shimada, J., Umland, J., Werner, M., Oskin, M., Burbank, D., and Alsdorf, D.: The Shuttle Radar Topography Mission, Reviews of Geophysics, 45, 2005RG000183, https://doi.org/10.1029/2005RG000183, 2007.
Finlon, J. A., Rauber, R. M., Wu, W., Zaremba, T. J., McFarquhar, G. M., Nesbitt, S. W., Schnaiter, M., Järvinen, E., Waitz, F., Hill, T. C. J., and DeMott, P. J.: Structure of an Atmospheric River Over Australia and the Southern Ocean: II. Microphysical Evolution, JGR Atmospheres, 125, e2020JD032514, https://doi.org/10.1029/2020JD032514, 2020.
Fisher, B. J., Poulton, A. J., Meredith, M. P., Baldry, K., Schofield, O., and Henley, S. F.: Climate-driven shifts in Southern Ocean primary producers and biogeochemistry in CMIP6 models, Biogeosciences, 22, 975–994, https://doi.org/10.5194/bg-22-975-2025, 2025.
Gettelman, A., Bardeen, C. G., McCluskey, C. S., Järvinen, E., Stith, J., Bretherton, C., McFarquhar, G., Twohy, C., D'Alessandro, J., and Wu, W.: Simulating Observations of Southern Ocean Clouds and Implications for Climate, JGR Atmospheres, 125, e2020JD032619, https://doi.org/10.1029/2020JD032619, 2020.
Grisel, O., Mueller, A., Fan, T. J., Estève, L., de Vazelhes, W., Abraham, A., Larsen, L., Gouk, H., Hedegaard, L., Kluyver, T., Nalenz, M., Ponti, M., Joly, A., Valko, M., Froehlich, J., Schmid, J., Soriano, C. J., Duportet, X., Trumpy, E., Guennebaud, G., 4 / 5 Brock, A., Thoma, M., Casari, C., Learmonth, G., May, A., Lanyon-Hogg, T., Mazur, P., Moreira, G., Melzi, S., Rehfeldt, M., Antonello, M., Shi, X., Hsu, P., Schramm, L., Michaud, B., Charette, J.-S., Long, J., Ye, D., Sachsenberg, N., Aharoni, E., Bastidas, H., McNicholas, B., Peric, V., Liao, P., Schmid, C., Nogueira, F., Pellerin, L., Lignée, O., Li, M., Da Fonseca, G., Liang, A. C., Vialaneix, N., Joyce, J., Cano, G., Vegesna, R., Arel-Bundock, V., Antonello, N. M., Brandl, S., Bompard, E., Chiapello, T. R., Buchin, M., Wolf, E., Bannour, N., Shah, D., Thiel, C., Meier, S., Hellwig, O., Horvath, S., Garbinato, B., Maffia, A. E., Lange, S., Flatow, J., Laurino, O., Tamburini, F., Jambor, H., and Woolam, C.: scikit-learn/scikit-learn: Scikit-learn 1.3.0, Zenodo [code], https://doi.org/10.5281/zenodo.8098905, 2023.
Gruber, N., Bakker, D. C. E., DeVries, T., Gregor, L., Hauck, J., Landschützer, P., McKinley, G. A., and Müller, J. D.: Trends and variability in the ocean carbon sink, Nat. Rev. Earth Environ., 4, 119–134, https://doi.org/10.1038/s43017-022-00381-x, 2023.
Hartery, S., Toohey, D., Revell, L., Sellegri, K., Kuma, P., Harvey, M., and McDonald, A. J.: Constraining the Surface Flux of Sea Spray Particles From the Southern Ocean, JGR Atmospheres, 125, e2019JD032026, https://doi.org/10.1029/2019JD032026, 2020.
Hersbach, H., Bell, B., Berrisford, P., Hirahara, S., Horányi, A., Muñoz-Sabater, J., Nicolas, J., Peubey, C., Radu, R., Schepers, D., Simmons, A., Soci, C., Abdalla, S., Abellan, X., Balsamo, G., Bechtold, P., Biavati, G., Bidlot, J., Bonavita, M., De Chiara, G., Dahlgren, P., Dee, D., Diamantakis, M., Dragani, R., Flemming, J., Forbes, R., Fuentes, M., Geer, A., Haimberger, L., Healy, S., Hogan, R. J., Hólm, E., Janisková, M., Keeley, S., Laloyaux, P., Lopez, P., Lupu, C., Radnoti, G., De Rosnay, P., Rozum, I., Vamborg, F., Villaume, S., and Thépaut, J.: The ERA5 global reanalysis, Quart. J. Royal Meteoro. Soc., 146, 1999–2049, https://doi.org/10.1002/qj.3803, 2020.
Hoskins, B. J. and Hodges, K. I.: A New Perspective on Southern Hemisphere Storm Tracks, Journal of Climate, 18, 4108–4129, https://doi.org/10.1175/JCLI3570.1, 2005.
Hwang, Y.-T. and Frierson, D. M. W.: Link between the double-Intertropical Convergence Zone problem and cloud biases over the Southern Ocean, Proc. Natl. Acad. Sci. U.S.A., 110, 4935–4940, https://doi.org/10.1073/pnas.1213302110, 2013.
Hyder, P., Edwards, J. M., Allan, R. P., Hewitt, H. T., Bracegirdle, T. J., Gregory, J. M., Wood, R. A., Meijers, A. J. S., Mulcahy, J., Field, P., Furtado, K., Bodas-Salcedo, A., Williams, K. D., Copsey, D., Josey, S. A., Liu, C., Roberts, C. D., Sanchez, C., Ridley, J., Thorpe, L., Hardiman, S. C., Mayer, M., Berry, D. I., and Belcher, S. E.: Critical Southern Ocean climate model biases traced to atmospheric model cloud errors, Nat. Commun., 9, 3625, https://doi.org/10.1038/s41467-018-05634-2, 2018.
Kang, S. M., Ceppi, P., Yu, Y., and Kang, I.-S.: Recent global climate feedback controlled by Southern Ocean cooling, Nat. Geosci., 16, 775–780, https://doi.org/10.1038/s41561-023-01256-6, 2023a.
Kang, S. M., Yu, Y., Deser, C., Zhang, X., Kang, I.-S., Lee, S.-S., Rodgers, K. B., and Ceppi, P.: Global impacts of recent Southern Ocean cooling, Proc. Natl. Acad. Sci. U.S.A., 120, e2300881120, https://doi.org/10.1073/pnas.2300881120, 2023b.
Kay, J. E., Wall, C., Yettella, V., Medeiros, B., Hannay, C., Caldwell, P., and Bitz, C.: Global Climate Impacts of Fixing the Southern Ocean Shortwave Radiation Bias in the Community Earth System Model (CESM), Journal of Climate, 29, 4617–4636, https://doi.org/10.1175/JCLI-D-15-0358.1, 2016.
Khatiwala, S., Primeau, F., and Hall, T.: Reconstruction of the history of anthropogenic CO2 concentrations in the ocean, Nature, 462, 346–349, https://doi.org/10.1038/nature08526, 2009.
Lang, F., Huang, Y., Siems, S. T., and Manton, M. J.: Characteristics of the Marine Atmospheric Boundary Layer Over the Southern Ocean in Response to the Synoptic Forcing, JGR Atmospheres, 123, 7799–7820, https://doi.org/10.1029/2018JD028700, 2018.
Lang, F., Huang, Y., Protat, A., Truong, S. C. H., Siems, S. T., and Manton, M. J.: Shallow Convection and Precipitation Over the Southern Ocean: A Case Study During the CAPRICORN 2016 Field Campaign, JGR Atmospheres, 126, e2020JD034088, https://doi.org/10.1029/2020JD034088, 2021.
Lang, F., Ackermann, L., Huang, Y., Truong, S. C. H., Siems, S. T., and Manton, M. J.: A climatology of open and closed mesoscale cellular convection over the Southern Ocean derived from Himawari-8 observations, Atmos. Chem. Phys., 22, 2135–2152, https://doi.org/10.5194/acp-22-2135-2022, 2022.
Lauer, A., Bock, L., Hassler, B., Schröder, M., and Stengel, M.: Cloud Climatologies from Global Climate Models–A Comparison of CMIP5 and CMIP6 Models with Satellite Data, Journal of Climate, 36, 281–311, https://doi.org/10.1175/JCLI-D-22-0181.1, 2023.
Li, X., Sui, C.-H., Lau, K.-M., and Adamec, D.: Effects of Precipitation on Ocean Mixed-Layer Temperature and Salinity as Simulated in a 2-D Coupled Ocean-Cloud Resolving Atmosphere Model, Journal of the Meteorological Society of Japan, 78, 647–659, https://doi.org/10.2151/jmsj1965.78.5_647, 2000.
Lin, T., Spengler, T., Rutgersson, A., and Wu, L.: Impact of sea spray-mediated heat fluxes on polar low development, Quart. J. Royal Meteoro. Soc., 150, 2976–2990, https://doi.org/10.1002/qj.4746, 2024.
Manton, M. J., Huang, Y., and Siems, S. T.: Variations in Precipitation across the Southern Ocean, Journal of Climate, 33, 10653–10670, https://doi.org/10.1175/JCLI-D-20-0120.1, 2020.
Marshall, G. J.: Trends in the Southern Annular Mode from Observations and Reanalyses, J. Climate, 16, 4134–4143, https://doi.org/10.1175/1520-0442(2003)016<4134:TITSAM>2.0.CO;2, 2003.
McFarquhar, G. M., Bretherton, C. S., Marchand, R., Protat, A., DeMott, P. J., Alexander, S. P., Roberts, G. C., Twohy, C. H., Toohey, D., Siems, S., Huang, Y., Wood, R., Rauber, R. M., Lasher-Trapp, S., Jensen, J., Stith, J. L., Mace, J., Um, J., Järvinen, E., Schnaiter, M., Gettelman, A., Sanchez, K. J., McCluskey, C. S., Russell, L. M., McCoy, I. L., Atlas, R. L., Bardeen, C. G., Moore, K. A., Hill, T. C. J., Humphries, R. S., Keywood, M. D., Ristovski, Z., Cravigan, L., Schofield, R., Fairall, C., Mallet, M. D., Kreidenweis, S. M., Rainwater, B., D'Alessandro, J., Wang, Y., Wu, W., Saliba, G., Levin, E. J. T., Ding, S., Lang, F., Truong, S. C. H., Wolff, C., Haggerty, J., Harvey, M. J., Klekociuk, A. R., and McDonald, A.: Observations of Clouds, Aerosols, Precipitation, and Surface Radiation over the Southern Ocean: An Overview of CAPRICORN, MARCUS, MICRE, and SOCRATES, Bulletin of the American Meteorological Society, 102, E894–E928, https://doi.org/10.1175/BAMS-D-20-0132.1, 2021.
NASA JPL: NASA Shuttle Radar Topography Mission Global 1 arc second, NASA Land Processes Distributed Active Archive Center [data set], https://doi.org/10.5067/MEASURES/SRTM/SRTMGL1.003, 2013.
Pauling, A. G., Bitz, C. M., Smith, I. J., and Langhorne, P. J.: The Response of the Southern Ocean and Antarctic Sea Ice to Freshwater from Ice Shelves in an Earth System Model, Journal of Climate, 29, 1655–1672, https://doi.org/10.1175/JCLI-D-15-0501.1, 2016.
Pedregosa, F., Varoquaux, G., Gramfort, A., Michel, V., Thirion, B., Grisel, O., Blondel, M., Prettenhofer, P., Weiss, R., Dubourg, V., Vanderplas, J., Passos, A., Cournapeau, D., Brucher, M., Perrot, M., and Duchesnay, É.: Scikit-learn: Machine Learning in Python, J. Mach. Learn. Res., 12, 2825–2830, 2011.
Purich, A., England, M. H., Cai, W., Sullivan, A., and Durack, P. J.: Impacts of Broad-Scale Surface Freshening of the Southern Ocean in a Coupled Climate Model, J. Climate, 31, 2613–2632, https://doi.org/10.1175/JCLI-D-17-0092.1, 2018.
Rauber, R. M., Hu, H., Dominguez, F., Nesbitt, S. W., McFarquhar, G. M., Zaremba, T. J., and Finlon, J. A.: Structure of an Atmospheric River Over Australia and the Southern Ocean. Part I: Tropical and Midlatitude Water Vapor Fluxes, JGR Atmospheres, 125, e2020JD032513, https://doi.org/10.1029/2020JD032513, 2020.
Reboita, M. S., Da Rocha, R. P., Ambrizzi, T., and Gouveia, C. D.: Trend and teleconnection patterns in the climatology of extratropical cyclones over the Southern Hemisphere, Clim. Dyn., 45, 1929–1944, https://doi.org/10.1007/s00382-014-2447-3, 2015.
Reid, K. J., King, A. D., Lane, T. P., and Short, E.: The Sensitivity of Atmospheric River Identification to Integrated Water Vapor Transport Threshold, Resolution, and Regridding Method, JGR Atmospheres, 125, e2020JD032897, https://doi.org/10.1029/2020JD032897, 2020.
Richter, D. H. and Veron, F.: Ocean spray: An outsized influence on weather and climate, Physics Today, 69, 34–39, https://doi.org/10.1063/PT.3.3363, 2016.
Rintoul, S. and Church, J.: The Southern Ocean's global reach: a crucial cog in Earth's heat engine, https://www.antarctica.gov.au/magazine/issue-4-spring-2002/feature2/the-southern-oceans-global-reach/ (last access: 7 July 2025), 2002.
Sallée, J. -B., Shuckburgh, E., Bruneau, N., Meijers, A. J. S., Bracegirdle, T. J., Wang, Z., and Roy, T.: Assessment of Southern Ocean water mass circulation and characteristics in CMIP5 models: Historical bias and forcing response, JGR Oceans, 118, 1830–1844, https://doi.org/10.1002/jgrc.20135, 2013.
Schuddeboom, A. J. and McDonald, A. J.: The Southern Ocean Radiative Bias, Cloud Compensating Errors, and Equilibrium Climate Sensitivity in CMIP6 Models, JGR Atmospheres, 126, e2021JD035310, https://doi.org/10.1029/2021JD035310, 2021.
Seabold, S. and Perktold, J.: Statsmodels: Econometric and Statistical Modeling with Python, Python in Science Conference, Austin, Texas, 92–96, https://doi.org/10.25080/Majora-92bf1922-011, 2010.
Shaw, T. A. and Stevens, B.: The other climate crisis, Nature, 639, 877–887, https://doi.org/10.1038/s41586-025-08680-1, 2025.
Shaw, T. A., Baldwin, M., Barnes, E. A., Caballero, R., Garfinkel, C. I., Hwang, Y.-T., Li, C., O'Gorman, P. A., Rivière, G., Simpson, I. R., and Voigt, A.: Storm track processes and the opposing influences of climate change, Nature Geosci., 9, 656–664, https://doi.org/10.1038/ngeo2783, 2016.
Siems, S. T., Huang, Y., and Manton, M. J.: Southern Ocean precipitation: Toward a process-level understanding, WIREs Climate Change, 13, e800, https://doi.org/10.1002/wcc.800, 2022.
Song, Y., Qiao, F., Liu, J., Shu, Q., Bao, Y., Wei, M., and Song, Z.: Effects of Sea Spray on Large-Scale Climatic Features over the Southern Ocean, Journal of Climate, 35, 4645–4663, https://doi.org/10.1175/JCLI-D-21-0608.1, 2022.
Stammerjohn, S., Maksym, T., Heil, P., Massom, R. A., Vancoppenolle, M., and Leonard, K. C.: The influence of winds, sea-surface temperature and precipitation anomalies on Antarctic regional sea-ice conditions during IPY 2007, Deep Sea Research Part II: Topical Studies in Oceanography, 58, 999–1018, https://doi.org/10.1016/j.dsr2.2010.10.026, 2011.
Stein, A. F., Draxler, R. R., Rolph, G. D., Stunder, B. J. B., Cohen, M. D., and Ngan, F.: NOAA's HYSPLIT Atmospheric Transport and Dispersion Modeling System, Bulletin of the American Meteorological Society, 96, 2059–2077, https://doi.org/10.1175/BAMS-D-14-00110.1, 2015.
Swart, N. C., Gille, S. T., Fyfe, J. C., and Gillett, N. P.: Recent Southern Ocean warming and freshening driven by greenhouse gas emissions and ozone depletion, Nature Geosci., 11, 836–841, https://doi.org/10.1038/s41561-018-0226-1, 2018.
Swart, N. C., Martin, T., Beadling, R., Chen, J.-J., Danek, C., England, M. H., Farneti, R., Griffies, S. M., Hattermann, T., Hauck, J., Haumann, F. A., Jüling, A., Li, Q., Marshall, J., Muilwijk, M., Pauling, A. G., Purich, A., Smith, I. J., and Thomas, M.: The Southern Ocean Freshwater Input from Antarctica (SOFIA) Initiative: scientific objectives and experimental design, Geosci. Model Dev., 16, 7289–7309, https://doi.org/10.5194/gmd-16-7289-2023, 2023.
Tansey, E., Marchand, R., Protat, A., Alexander, S. P., and Ding, S.: Southern Ocean Precipitation Characteristics Observed From CloudSat and Ground Instrumentation During the Macquarie Island Cloud & Radiation Experiment (MICRE): April 2016 to March 2017, JGR Atmospheres, 127, e2021JD035370, https://doi.org/10.1029/2021JD035370, 2022.
Tansey, E., Marchand, R., Alexander, S. P., Klekociuk, A. R., and Protat, A.: Southern Ocean Low Cloud and Precipitation Phase Observed During the Macquarie Island Cloud and Radiation Experiment (MICRE), JGR Atmospheres, 128, e2023JD039205, https://doi.org/10.1029/2023JD039205, 2023.
Trenberth, K. E. and Fasullo, J. T.: Simulation of Present-Day and Twenty-First-Century Energy Budgets of the Southern Oceans, Journal of Climate, 23, 440–454, https://doi.org/10.1175/2009JCLI3152.1, 2010.
Truong, S. C. H., Huang, Y., Lang, F., Messmer, M., Simmonds, I., Siems, S. T., and Manton, M. J.: A Climatology of the Marine Atmospheric Boundary Layer Over the Southern Ocean From Four Field Campaigns During 2016–2018, JGR Atmospheres, 125, e2020JD033214, https://doi.org/10.1029/2020JD033214, 2020.
Wang, Y. Q.: MeteoInfo: GIS software for meteorological data visualization and analysis: Meteorological GIS software, Met. Apps, 21, 360–368, https://doi.org/10.1002/met.1345, 2014.
Wang, Z., Siems, S. T., Belusic, D., Manton, M. J., and Huang, Y.: A Climatology of the Precipitation over the Southern Ocean as Observed at Macquarie Island, Journal of Applied Meteorology and Climatology, 54, 2321–2337, https://doi.org/10.1175/JAMC-D-14-0211.1, 2015.
Wang, Z., Belusic, D., Huang, Y., Siems, S. T., and Manton, M. J.: Understanding Orographic Effects on Surface Observations at Macquarie Island, Journal of Applied Meteorology and Climatology, 55, 2377–2395, https://doi.org/10.1175/JAMC-D-15-0305.1, 2016.
Watanabe, M., Kang, S. M., Collins, M., Hwang, Y.-T., McGregor, S., and Stuecker, M. F.: Possible shift in controls of the tropical Pacific surface warming pattern, Nature, 630, 315–324, https://doi.org/10.1038/s41586-024-07452-7, 2024.
Williams, R. G., Meijers, A. J. S., Roussenov, V. M., Katavouta, A., Ceppi, P., Rosser, J. P., and Salvi, P.: Asymmetries in the Southern Ocean contribution to global heat and carbon uptake, Nat. Clim. Chang., 14, 823–831, https://doi.org/10.1038/s41558-024-02066-3, 2024.
Yin, J. H.: A consistent poleward shift of the storm tracks in simulations of 21st century climate, Geophysical Research Letters, 32, 2005GL023684, https://doi.org/10.1029/2005GL023684, 2005.
Zelinka, M. D., Myers, T. A., McCoy, D. T., Po-Chedley, S., Caldwell, P. M., Ceppi, P., Klein, S. A., and Taylor, K. E.: Causes of Higher Climate Sensitivity in CMIP6 Models, Geophysical Research Letters, 47, e2019GL085782, https://doi.org/10.1029/2019GL085782, 2020.