the Creative Commons Attribution 4.0 License.
the Creative Commons Attribution 4.0 License.
 | 22 Apr 2025
On the role of moist and dry processes in atmospheric blocking biases in the Euro-Atlantic region in CMIP6
Edgar Dolores-Tesillos
Olivia Martius
Julian Quinting
Synoptic- and large-scale features of atmospheric flow such as extratropical cyclones, Rossby wave packets, and atmospheric blocking modulate mid-latitude weather and climate. However, several studies have shown strong biases in the frequency and location of these features in state-of-the-art global climate models. One notable and persistent bias is an underestimation of the atmospheric blocking frequency in the Euro-Atlantic region. In this study, we validate the representation of synoptic- and large-scale features of the North Atlantic flow in eight climate models of the Coupled Model Intercomparison Project Phase 6 (CMIP6), taking the ERA5 reanalysis as a reference. Validation includes atmospheric blocking, storm tracks, eddy heat and moisture fluxes, and warm conveyor belts (WCBs).
The selected CMIP6 models underestimate the atmospheric blocking frequency over the eastern North Atlantic and Europe in winter (December to February) by up to 80 %. The frequency biases result from combined biases at different spatial and temporal scales described in the following. First, we define the background flow as the most frequent value of the daily time series of the meridional gradient of geopotential height at 500 hPa. In the CMIP6 models, the strongest latitudinal geopotential gradients are shifted equatorward in the North Atlantic basin. This shift favours more zonal and stronger winds to the south of the climatological jet. The differences in the background flow affect Rossby wave breaking and blocking onset and persistence, as illustrated by analysing the eddies in the Euro-Atlantic region. We find an equatorward shift in the eddies in CMIP6 that accelerates the mean flow in the exit region of the Atlantic jet, as indicated by a reduction in the divergence of E vectors. The shift in the eddies leads to a less diffluent flow in the east Atlantic and, thus, a less favourable flow for blocking formation. Second, we find a negative bias in WCB outflow frequency in the CMIP6 models in the North Atlantic. Reduced WCB outflow indicates weaker transport of low potential vorticity (PV) from the lower to the upper troposphere by moist diabatic processes and consequently weaker downstream ridge amplification and, therefore, a less diffluent flow over the eastern North Atlantic and weaker diabatic contributions to blocking. The negative WCB outflow bias can be linked to an underestimation of the meridional moisture transport at low levels in the climatological WCB inflow area in the western North Atlantic. Thus, the misrepresentation of moist processes contributes to the negative blocking biases. Accordingly, an improved representation of the moist processes in the next generation of climate models could improve the blocking representation.
- Article
(9947 KB) - Full-text XML
-
Supplement
(602 KB) - BibTeX
- EndNote


Atmospheric blocks are quasi-stationary and persistent anticyclones often associated with up- and/or downstream Rossby wave breaking (Altenhoff et al., 2008; Trevisiol et al., 2022). Blocks may lead to high-impact surface weather (see Kautz et al., 2022, for a review). In summer, blocks can be associated with heatwaves (Jeong et al., 2022), wildfires (Antokhina et al., 2023), and thunderstorms (Mohr et al., 2019), and in winter, blocks can be associated with cold spells (Brunner et al., 2018).
Upstream eddies and wave breaking are essential for amplifying and maintaining blocks (Shutts, 1983; Woollings et al., 2018); however in recent years, research has shown that moist processes also play a major role in the initiation, amplification, and maintenance of blocking (Pfahl et al., 2015; Steinfeld and Pfahl, 2019; Steinfeld et al., 2020). For example, latent heat release upstream greatly contributed to the maintenance of the block and the associated heatwave in June 2021 in Canada (White et al., 2023). Pfahl et al. (2015) followed a Lagrangian perspective to analyse the development of blocking and showed that about 50 % of the air parcels ending in the upper-level anticyclone undergo diabatic processes, and the influence of these processes differs in different regions of the world. Moist diabatic processes which are linked to the formation or dissipation of clouds contribute to block development prominently in the western North Atlantic region in winter. At the same time, moist diabatic processes are an important contributor to blocking formation and intensification throughout the North Pacific and parts of eastern North America (Steinfeld and Pfahl, 2019). In contrast, contributions from latent heat release to blocks are small (< 30 %) over the Eurasian continent (Steinfeld and Pfahl, 2019).
The impact of moist diabatic processes on large-scale circulation might increase as the atmosphere warms. For instance, extratropical cyclones may respond to the increased latent heat release with faster-ascending warm conveyor belts (WCBs) (Binder et al., 2023; Dolores-Tesillos and Pfahl, 2024), which may impact the block properties. To capture the effects of climate change on atmospheric blocking, both dry and moist dynamical processes thus need to be accurately captured by climate models.
In general, Earth system models (ESMs) still struggle to represent blocks accurately (Schiemann et al., 2017, 2020). There are significant biases in the representation of blocking properties and frequency (Davini and D’Andrea, 2016; Schiemann et al., 2017, 2020; Eyring et al., 2020). A recent overview of blocking biases in various climate models (Woollings et al., 2018) summarises some known sources of the biases. They include the following:
-
Errors in the mean state or background flow affect the waviness and strength of the jet and thereby Rossby wave propagation (Berckmans et al., 2013; Kleiner et al., 2021b). Indeed, the representation of the mean state can be one of the leading causes of blocking bias (Branstator, 2002; Branstator and Teng, 2017; Wirth et al., 2018; Kleiner et al., 2021b). Luo et al. (2023) show how the meridional gradient of the background of potential vorticity (PV) modifies the lifetime of blocks.
-
Sea surface temperature biases have been linked to block frequency biases. Specifically in the North Atlantic, a negative sea surface temperature (SST) bias is found in several climate models (Scaife et al., 2011; Athanasiadis et al., 2022). The colder ocean increases the low-level temperature gradient, which results in stronger low-level baroclinicity and reduced surface evaporation (Scaife et al., 2011; Athanasiadis et al., 2022; Cheung et al., 2023; Wenta et al., 2024). Other studies show that blocking frequency is also sensitive to the tropical SST biases (e.g. Hinton et al., 2009).
-
Other studies suggest that blocking biases stem from systematic biases of the tropopause height. Too high a tropopause reduces blocking frequencies at higher latitudes, especially when blocks are being diagnosed with anomaly block indices (Attinger et al., 2019). There are two commonly used types of blocking indices: absolute and anomaly indices (e.g. Barriopedro et al., 2010). Absolute indices rely on absolute fields, such as flow gradients, to identify the circulation associated with blocking events. In contrast, anomaly indices detect deviations in variables like geopotential height (Z) or potential vorticity (PV) from a given climatological baseline.
According to Woollings et al. (2018), finer horizontal and/or vertical resolution can help reduce the blocking biases mentioned above. The finer horizontal resolution improves blocking representation by better resolving eddies and also by a better representation of the orography, resulting in more realistic planetary waves and a more realistic mean state (Berckmans et al., 2013; Davini et al., 2017). Woollings et al. (2018) also mentioned the relevance of increasing the vertical resolution, affecting the dynamics of the tropopause and the ascent of airstreams. Improving convection and drag parameterisations could also reduce blocking biases (Woollings et al., 2018; Martínez-Alvarado et al., 2018).
One aspect that has received limited attention is moist processes. Misrepresentation of moist processes generates large-scale circulation biases in current climate models. For example, the underestimation of latent heating has been mentioned as the primary source of bias in stationary waves in CMIP5 models (Park and Lee, 2021). Idealised experiments have shown that increasing latent heat release in cyclones helps reduce biases in large-scale flow representation by improving the storm tracks that are often too zonal and cyclones that are too weak (Schemm, 2023). A better representation of latent heating can be achieved by increasing horizontal resolution on a scale of kilometre resolution.
Latent heat (LH) release through moist diabatic processes is very intense in WCBs. The LH release in WCBs is associated with cloud formation processes, and its maximum is usually located downstream of the extratropical cyclone centre, where heavy precipitation occurs (Madonna et al., 2014). The moist diabatic processes in a WCB generate anticyclonic PV anomalies in the WCB outflow at the tropopause level. The anticyclonic PV anomaly influences the extratropical waveguide and downstream atmospheric flow (e.g. Grams et al., 2011; Binder et al., 2016; Wirth et al., 2018). Thus, the WCBs may contribute to blocking formation and maintenance (Steinfeld and Pfahl, 2019; Steinfeld et al., 2020). However, the evaluation of WCBs in climate model data is not straightforward. Identifying WCBs traditionally relies on calculating air parcel trajectories (Wernli and Davies, 1997; Madonna et al., 2014). For instance, in Joos et al. (2023), WCBs have been calculated in a climate model based on Lagrangian trajectories. For the trajectory calculation, 3D wind fields are necessary that are not always available from ESMs, and the calculations require substantial computational resources (Joos and Wernli, 2012; Madonna et al., 2014; Sprenger and Wernli, 2015; Binder et al., 2016; Schielicke and Pfahl, 2022). A novel and alternative approach is to apply deep learning to identify WCBs such as the EuLerian Identification of ascending AirStreams (ELIAS2.0) diagnostic (Quinting and Grams, 2022; Quinting et al., 2022). ELIAS2.0 is a deep-learning tool that predicts the probability of WCB inflow, ascent, and outflow on the basis of atmospheric state variables and derivations thereof. ELIAS2.0 has been successfully implemented in ERA5 and for numerical weather prediction data (Oertel et al., 2023b). Here, we apply ELIAS2.0 for the first time to climate model data. Validating the representation of WCBs in the Coupled Model Intercomparison Project Phase 6 (CMIP6) models contributes to the assessment of the role of moist diabatic processes in the blocking biases. The aim of this study is thus, for the first time, to estimate to which extent the representation of the background flow, storm tracks, eddy fluxes and WCBs contributes to the known Euro-Atlantic blocking biases in the CMIP6 models. To create a storyline, we translated that contribution into three questions:
-
Role of dry processes. How do biases in the representation of jet stream positioning, storm tracks, and eddy–mean flow interactions in CMIP6 models influence the development and maintenance of atmospheric blocking in the Euro-Atlantic region?
-
Role of moist processes. How well do CMIP6 models represent WCB activity, and what is the link to blocking biases in the Euro-Atlantic region?
-
Drivers of biases in moist processes. Which processes contribute to the biases of WCB inflow and outflow in CMIP6 models, and how might this affect the development of Euro-Atlantic blocking?
This paper is structured as follows. In Sect. 2, we describe the dataset used for the analysis. The method is presented in Sect. 3. We show the results and discuss them in Sects. 4 and 5. Finally, the conclusions are provided in Sect. 6.
We select a subset of CMIP6 models based (i) on the models' ability to represent the climatological atmospheric blocking occurrence frequency in the Euro-Atlantic region as quantified by Palmer et al. (2023) and (ii) on the data availability needed to identify the various synoptic-scale features. We ensure that, for each model, data spanning more than 30 years are available (on average, the historical simulations cover a period of 164 years) and that the data include the below-described variables. We aim for some model independence by considering models from different research institutes and model cores (Brunner et al., 2020). Palmer et al. (2023) used a combination of quantitative metrics – such as RMSE, bias, variance, and correlation – and qualitative assessments, including the examination of circulation wind patterns. Based on these evaluations, the models have been categorised into four classifications: inadequate, unsatisfactory, satisfactory, and not available. We analyse only models with adequate performance, excluding the inadequate models, as suggested by Palmer et al. (2023).
A model overview is shown in Table 1. We use daily data remapped to 1° × 1° of geopotential height (Z); the horizontal wind components (u and v); temperature (T); and specific humidity (q) at the pressure levels of 1000, 850, 700, 500, 300, 250, and 200 hPa. We focus on the boreal winter (December to February). The historical simulations cover the period from 1979 to 2014 and were retrieved from the DKRZ data pool (Eyring et al., 2016).
Table 1List of CMIP6 models and their characteristics. The ability of models to reproduce atmospheric blocking in the Euro-Atlantic region is shown in Palmer et al. (2023). The member notation indicates variations in realisation, initial conditions, physics, and forcing or a combination of these factors. For example, if the realisation index is 2, the initialisation index is 1, the physics index is 3, and the forcing index is 222, the corresponding member label is denoted “r2i1p3f222”.
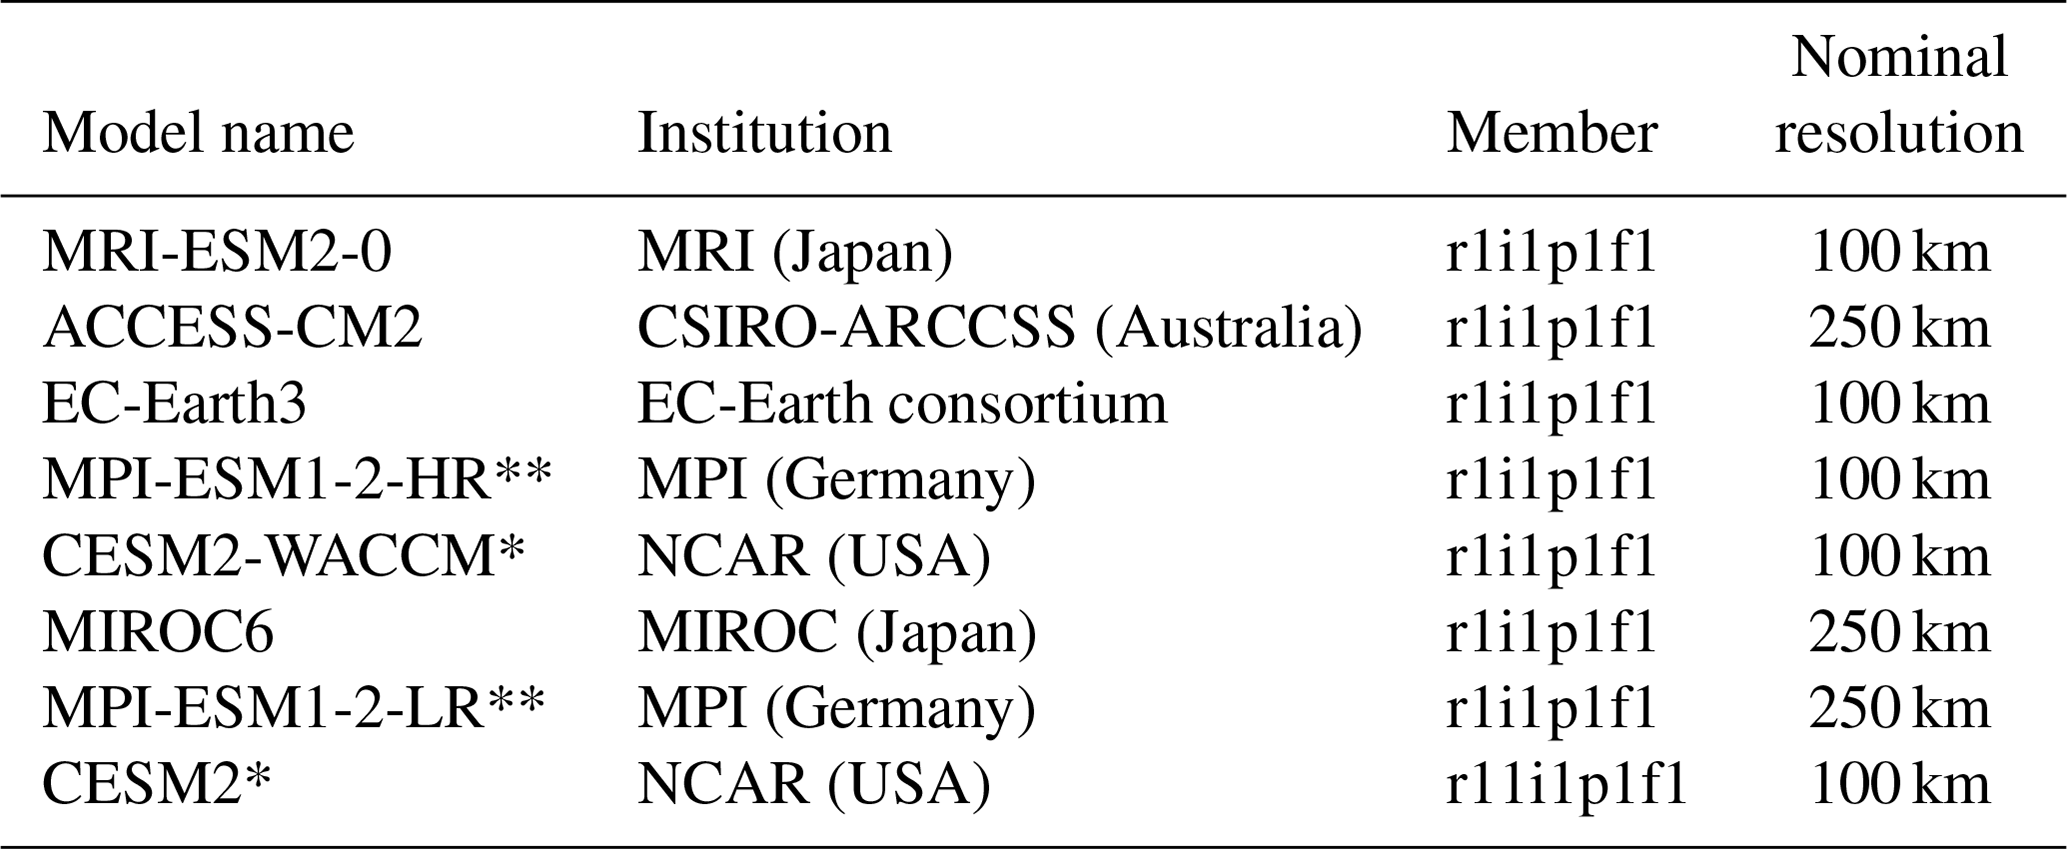
Models with * and ** indicate models with dependencies, for example, shared components (Brunner et al., 2020).
We evaluate the CMIP6 models against ERA5 reanalysis (Hersbach et al., 2020). The same variables as for CMIP6 were remapped to the exact spatial resolution (1° × 1°) from 1979 to 2014. Note that the grid spacing 1° × 1° is chosen to identify CMIP6 WCBs in ELIAS2.0 (similar to ERA5 WCBs).
3.1 Blocking index
Instantaneous blocks (IBs) are identified based on the reversal of the flow (Dole and Gordon, 1983; Tibaldi and Molteni, 1990; Scherrer et al., 2006; Davini et al., 2012; Davini and D’Andrea, 2016; Brunner and Steiner, 2017; Rohrer et al., 2019, 2018). We follow the methodology of Brunner and Steiner (2017), which consists of the calculation of geopotential height gradients to the north of a central latitude ϕ (ΔZN) and to the south of ϕ (ΔZS) and a third zonal gradient towards the Equator to remove low-latitude blocking (ΔZE):
Here, for the Northern Hemisphere, the IB follows the next three conditions: m (per degree latitude) 0 m (per degree latitude), and 5 m (per degree latitude). λ denotes the longitude from 180° W to 179° E and ϕ the latitude from 75° S to 75° N. Gradients are computed at each latitude point with Δϕ=15°.
We select only large-scale blocks by filtering out IBs smaller than 15° in longitude. To ensure quasi-stationarity and persistence, we consider only blocks lasting 5 d or more in a box of 6° × 4° longitude × latitude. This method captures blocks in their mature stage associated with Rossby wave breaking (RWB) (e.g. Pinheiro et al., 2019).
3.2 Background flow
Defining the background flow is not straightforward (e.g. Wirth et al., 2018). Often, a time mean is used to represent the background flow. However, Swanson (2001) shows that the frequency distributions of upper-tropospheric Z values are positively skewed poleward of the mid-latitude jets and negatively skewed equatorward. They, therefore, recommend using the mode (most frequent value) rather than the time mean to describe the background flow. We calculate the mode of Z and that of the absolute meridional gradient of Z () for each grid point to capture the background flow. Bins of 5 m km−1 for the time series (bins of 50 m for the Z time series) of each grid point are computed. After that, we calculate the mode for each model. We focus on the gradient of Z rather than the absolute values of Z because the gradient values are more closely associated with the position of the zonal jet, and blocks are identified using a gradient criterion.
3.3 Storm tracks and eddy fluxes
We apply a bandpass filter (2 and 6 d) to different fields (Z, u, v, T, q) to capture synoptic weather variability (Hoskins and Hodges, 2002; Greeves et al., 2007; Davini et al., 2017). The filtered variables are hereafter indicated by the prime symbol (′). Storm tracks are identified using the standard deviation of the bandpass-filtered daily Z at 500 hPa (Z′). We quantify the influence of the eddies on the mean flow by computing the divergence of the E vector (Hoskins et al., 1983; Trenberth, 1986; Raible et al., 2010). We calculate the E vector from the bandpass-filtered u and v at 250 hPa following Hoskins et al. (1983):
E vectors tend to have an eastward direction of the wave energy propagation, and ∇⋅E provides a measure of the eddies' forcing of the mean flow; divergent E vectors indicate an acceleration of the mean flow by the eddies. In contrast, the convergence of the E vectors indicates a deceleration of the mean flow by the eddies (Hoskins et al., 1983; Trenberth, 1986; Strong and Magnusdottir, 2008; Cheung and Zhou, 2015). E vectors are meridionally elongated upstream of blocks and converge around the blocked area (Berckmans et al., 2013; Drouard et al., 2021). During a European blocking event, a poleward-shifted jet stream is characterised by an anomalous divergence of E vectors to the north of the climatological jet. The displaced jet is forced into its position by the eddy forcing, which also helps to maintain the blocks by keeping the jet in its position (Berckmans et al., 2013).
Finally, we also calculate eddy moisture fluxes () from the bandpass-filtered daily specific humidity and the bandpass-filtered meridional wind at 850 hPa and eddy heat fluxes () from bandpass-filtered daily temperature and bandpass-filtered meridional wind at 850 hPa.
3.4 Warm conveyor belt identification
We use ELIAS2.0 to detect WCBs. ELIAS2.0 is a deep-learning tool that has been shown to work in reanalysis data and operational numerical weather prediction models (Quinting and Grams, 2022; Quinting et al., 2022). ELIAS2.0 has been employed to analyse extreme events (Oertel et al., 2023b), to investigate microphysical processes in WCBs (Oertel et al., 2023a), and to study the role of the Madden–Julian Oscillation in modulating the occurrence of North Pacific WCBs (Quinting et al., 2024).
ELIAS2.0 is trained on the basis of ERA-Interim data (Dee et al., 2011) remapped to regular latitude–longitude grid spacing of 1° × 1°. Accordingly, any input data to ELIAS2.0 need to be remapped to this same grid spacing. The predictor variables are derived from T, q, Z, u, and v on seven pressure levels comprising 1000, 925, 850, 700, 500, 300, and 200 hPa. ELIAS2.0 predicts conditional probabilities of WCB inflow, ascent, and outflow using a sigmoid activation function in the final layer of a U-Net convolutional neural network. WCB inflow is defined as WCB air masses being located below 800 hPa on the basis of trajectory data in the original training dataset. The ascent stage, which typically occurs with a time lag of 24 h after the inflow, represents WCB air masses between 800 and 400 hPa. WCB outflow comprises all WCB air masses above 400 hPa and typically occurs with a time lag after the ascent stage. WCB masks in ERA5 are derived every 6 h (at 00:00, 06:00, 12:00, and 18:00 UTC), with each grid cell assigned a binary value: 1 for the presence of a WCB and 0 for its absence. We compute WCB masks in the CMIP6 models from daily mean data. Therefore, we select only the 12:00 UTC timestamp of ERA5 to compute the WCB reference climatology.
We first compare the blocking frequencies in the CMIP6 models against ERA5 to identify the largest and most significant biases; we then link these biases to biases in the background flow, dry processes, and moist processes.
4.1 Atmospheric blocking and the background flow
The biases in atmospheric blocking frequency are shown in Fig. 1. The contours show the climatological blocking frequency for ERA5 and the shaded colours the difference between each CMIP6 model and ERA5 (Fig. 1a–h) and between the CMIP6 multi-model mean and ERA5 (Fig. 1i). Note that we applied the blocking identification method proposed by Brunner and Steiner (2017), which introduces a third gradient to exclude slow-moving, low-latitude ridges from being classified as blocking. As a result, our blocking frequency is comparably low. By analysing the biases in each CMIP6 model, one can see that the underestimation of the Euro-Atlantic blocking is present in all models (Fig. 1a–i). The strongest negative biases are found in MPI-ESM1-2-HR, MPI-ESM1-2-LR, and CESM2 (Fig. 1d, g, h). On the contrary, MRI-ESM2-0 shows the lowest negative biases (Fig. 1a). Note that in the analysis of the CMIP6 performance by Palmer et al. (2023), MRI-ESM2-0 (compared to the other models selected here) exhibits the lowest blocking bias in the Euro-Atlantic region. Ural blocks are also underestimated in most models except for MIROC6 and CESM2. However, there is a disagreement over the Greenland region. MPI-ESM1-2-LR, MPI-ESM1-2-HR, MIROC6, MRI-ESM2-0, and ACCESS-CM2 simulate more Greenland blocking than the ERA5 climatology does. In contrast, CESM2, CESM2-WACCM, and EC-Earth3 underestimate Greenland block frequency. In the North Pacific, most of the models simulate fewer blocks, but the location varies; for instance, CESM2-WACCM underestimates blocks to the south of the main North Pacific blocking region, while MRI-ESM2-0 underestimates blocks to the north of the main North Pacific blocking region. We find a robust underestimation of the Euro-Atlantic and Ural blocks in the CMIP6 multi-model mean bias (Fig. 1i). The selected CMIP6 models underestimate the Euro-Atlantic blocking frequency by more than 80 % relative to ERA5 over the United Kingdom and parts of Scandinavia (Fig. 1). Another region of underestimation of blocking frequency is over the East Siberian Sea (Fig. 1i). Smaller blocking biases of positive signs are found over Baffin Bay, Alaska, northern Kazakhstan, the Barents Sea, and the Kara Sea (Fig. 1i). Our results are in line with previous studies looking at both CMIP5 and CMIP6 models (Masato et al., 2013; Davini et al., 2014, 2017; Davini and D’Andrea, 2016, 2020; Woollings et al., 2018; Trevisiol et al., 2022) that find a negative blocking frequency bias over the Euro-Atlantic region. Contrary to previous studies using CMIP6 models, the negative frequency biases do not extend into central Europe and are smaller in the North Pacific region (e.g. Davini and D’Andrea, 2020). This improvement in the blocking frequency may be due to selecting models with the lowest bias (see discussion in Sect. 2, Data).
The Euro-Atlantic region shows the most considerable blocking bias. Thus, we focus only on this region when analysing the biases in background flow, eddy transient activity, and WCB outflow. Although the biases are calculated for each climate model, we present the multi-model CMIP6 mean bias for concision. Figure 2a and b show the mean and mode of Z for ERA5. Closer spacing of Z contours can be observed when considering the mode rather than the mean value (Fig. 2d).
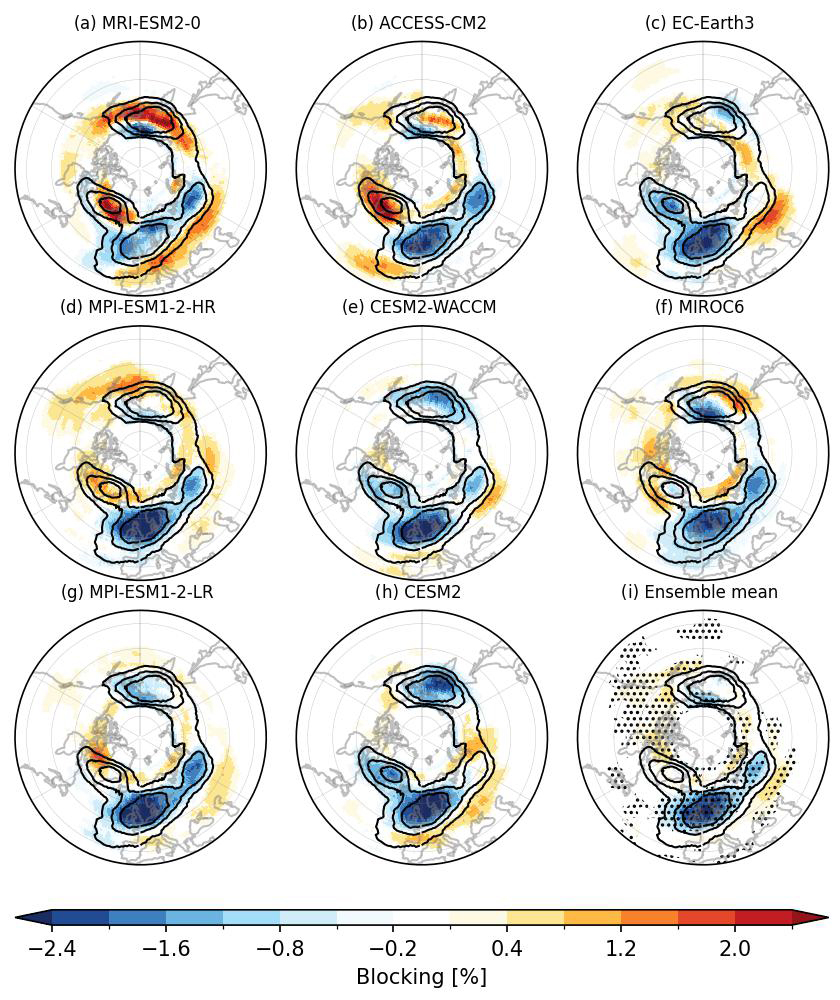
Figure 1(a–h) Blocking frequency biases of individual CMIP6 models and (i) the multi-model mean against ERA5 (1979–2014). The ERA5 blocking frequency is indicated by contours (1 % intervals starting at 1 %). Stippling denotes regions where more than 80 % (six models) of the ensemble members indicate a bias of the same sign.
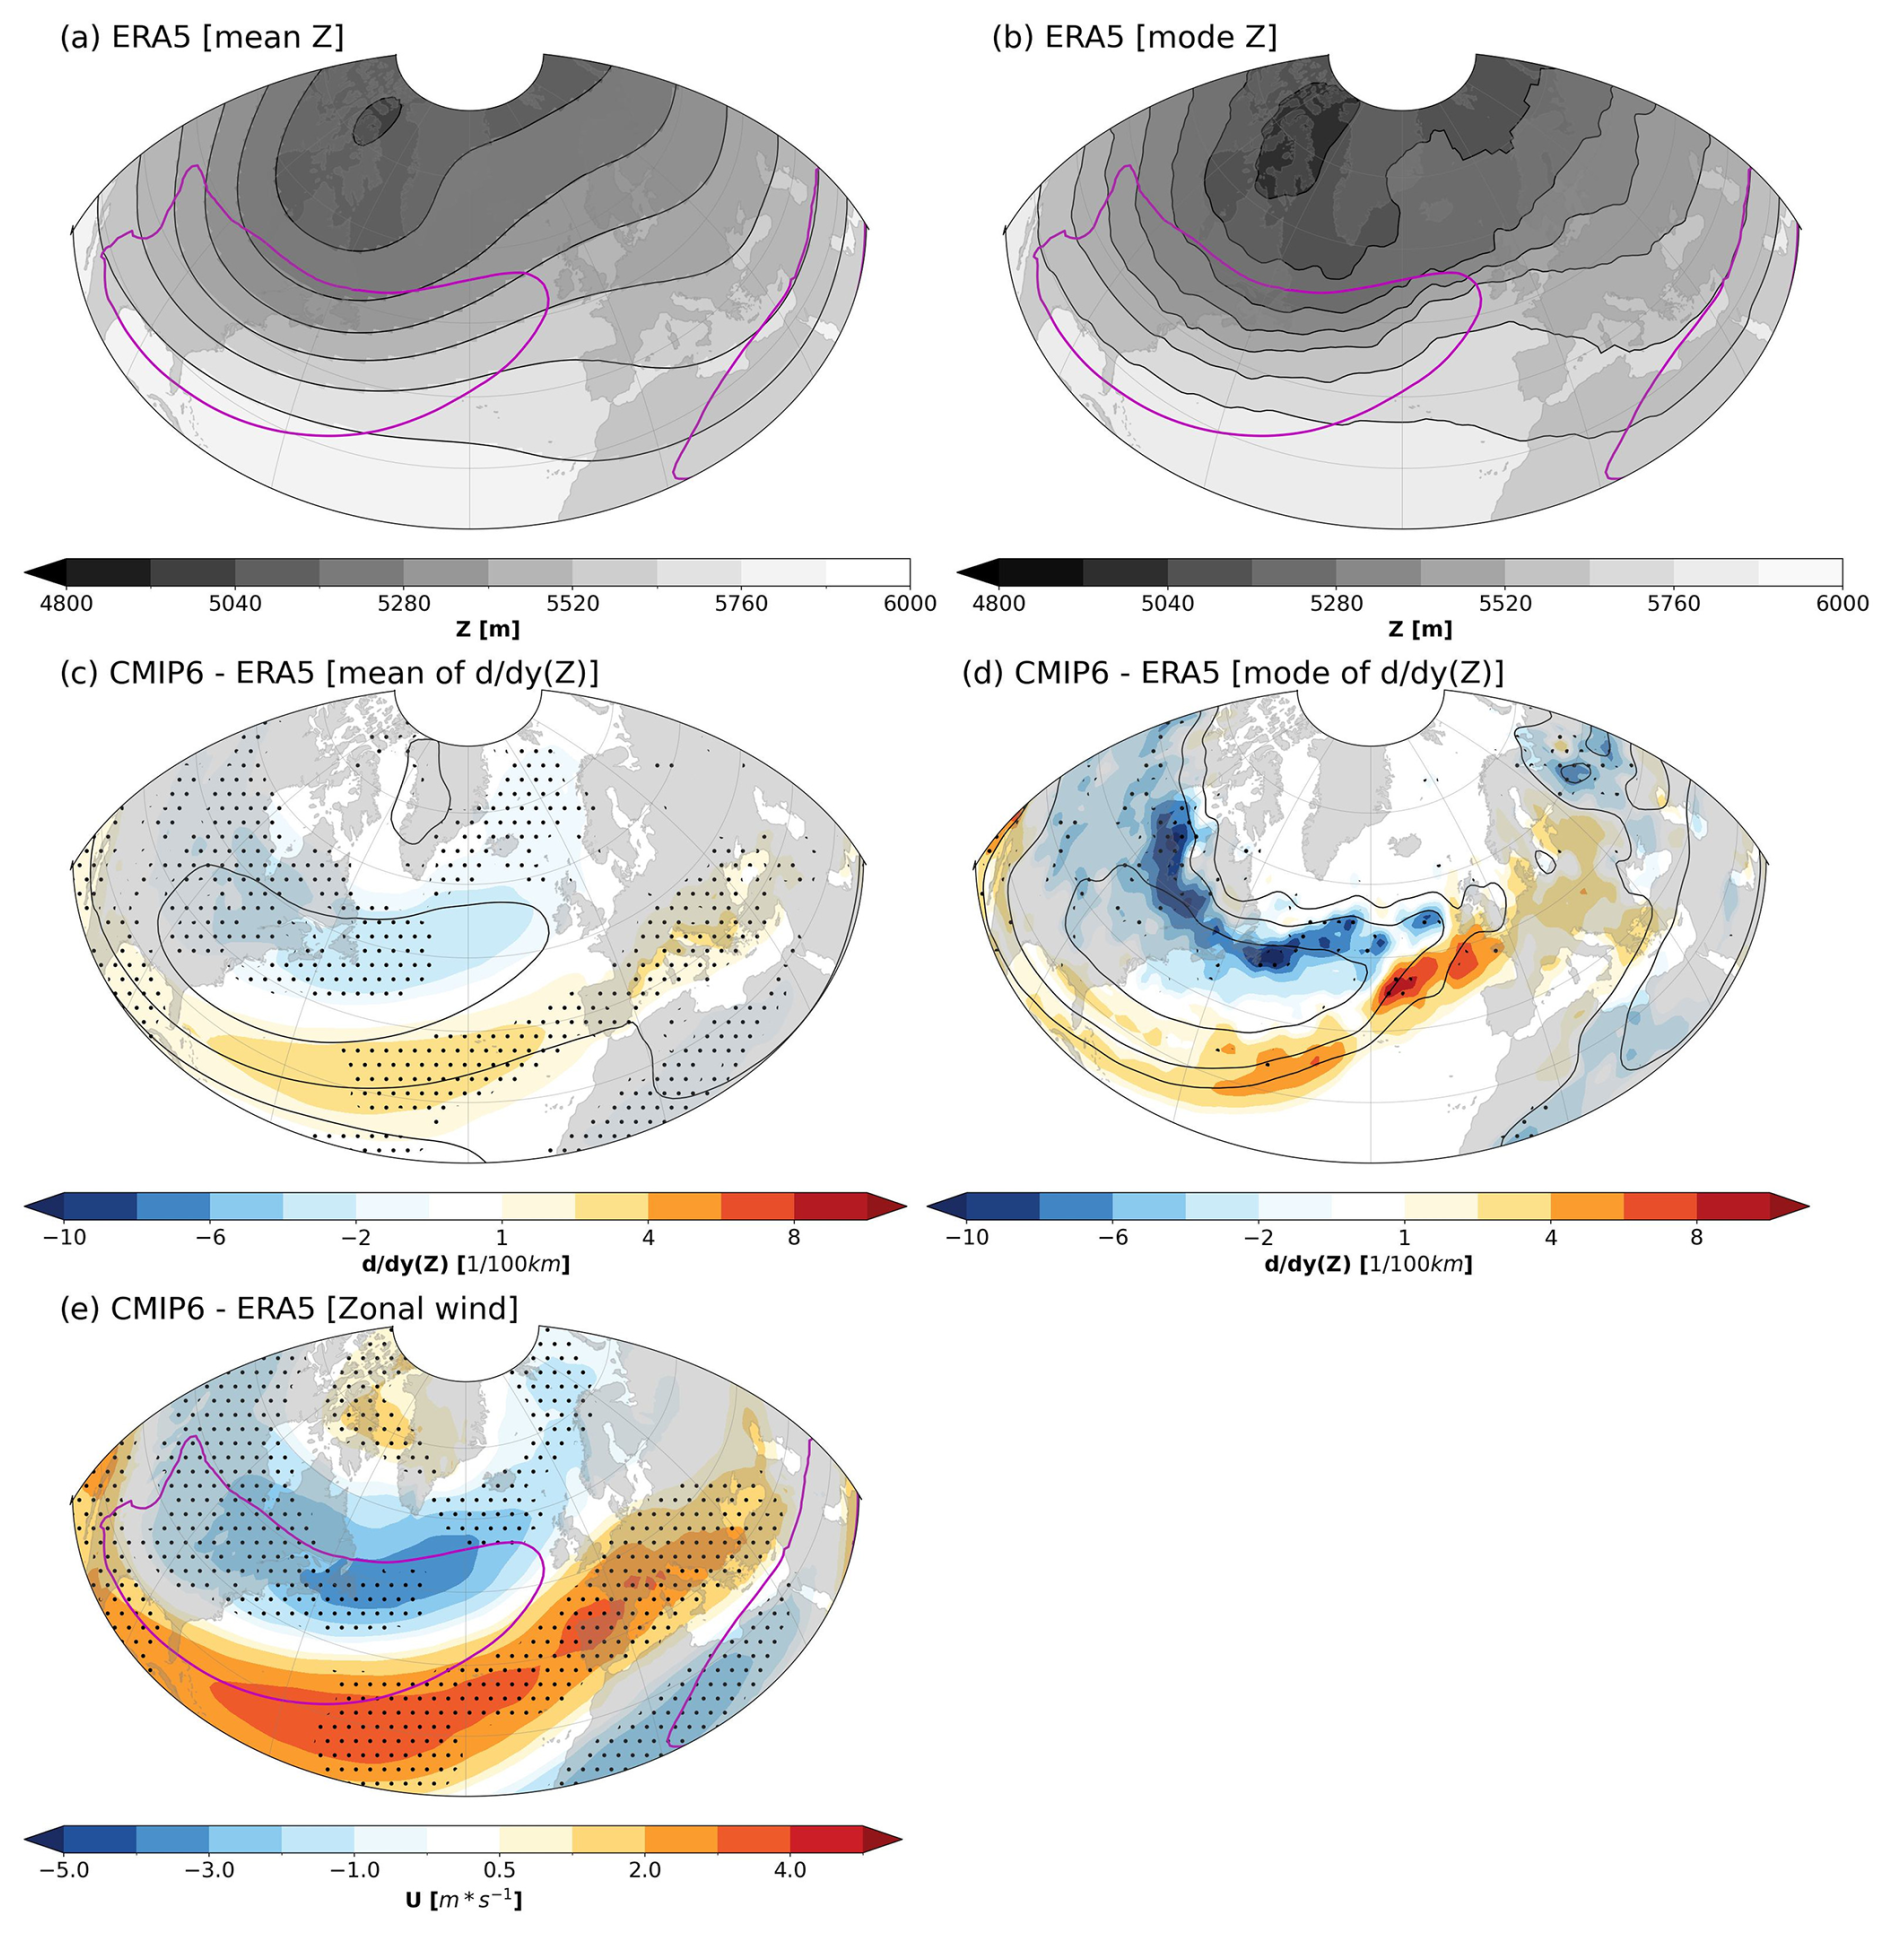
Figure 2(a, b) The climatological (a) mean and (b) mode of Z at 500 hPa for ERA5. The mean of zonal wind at 500 hPa is shown as a purple contour (15 m s−1). (c, d, e) CMIP6 multi-model mean biases of the (c) mean , (d) mode of , and (e) mean of zonal wind at 500 hPa against ERA5. Black contours depict the ERA5 climatology in (c) and (d) (5, 10, 20, 30, 40 m km−1 intervals). Stippling denotes regions where more than 80 % (six models) of the ensemble members indicate a bias of the same sign.
Using the mode results in sharper gradients in the mid-latitudes, which has also been described in Swanson (2001). Note that the strong gradient of Z follows the location of the midlevel jet (zonal wind at 500 hPa, purple contour in Fig. 2a, b). As discussed in Sect. 3, Methods, we chose to look at the CMIP6 biases for understanding biases in the background flow due to the gradient index used to identify blocks. Thus, we show the CMIP6 biases of the mode and mean in Fig. 2c and d. Again, note that there are sharper gradients in the mode of (contours in Fig. 2b, c). Both the mean and the mode of indicate an equatorward shift of the strongest in the North Atlantic (Fig. 2c, d). The equatorward shift of is more pronounced downstream of the ERA5 climatological maximum in the North Atlantic, indicating too zonal a background flow. The biases in the mode of also indicate an eastward shift of the strongest gradient of in the North Atlantic reaching the western European countries.
In general, the background flow in the CMIP6 models may favour a jet that is shifted equatorward and is too zonal, and this is confirmed by the biases in the zonal wind at 500 hPa (Fig. 2e). Over the eastern North Atlantic, the biases of the mode of hint at an eastward extension of the jet compared to the results of the climatological ERA5. The mode hints at a strong jet over western Europe (e.g. the UK), while the mean shows a jet extension to southern Europe (Fig. 2c). A stronger (stronger jet) in western Europe coincides with the low frequency of blocking simulated by the CMIP6 models (Fig. 1i). We can find the strongest jet (positive bias in mode/mean ) over the eastern North Atlantic for individual CMIP6 models that show the highest blocking underestimation in the European–Atlantic region (e.g. CESM2, not shown). Negative biases of mode and mean and, thus, weaker gradients of background flow are found to the northeast of the USA. The less intense jet may be associated with slightly overestimated blocking frequency in North America (Fig. 1i).
4.2 Transient wave activity and the role of dry processes
High-frequency eddies are crucial for the formation and maintenance of blocking; the associated PV fluxes contribute to the amplification and maintenance of the blocking anticyclones (e.g. Hoskins et al., 1983; Shutts, 1983; Zappa et al., 2014; Cheung and Zhou, 2015; Woollings et al., 2018). Therefore, we next analyse the CMIP6 biases in storm track positions, transient wave activity, and blocking occurrence.
The Eulerian storm track diagnostic captures the main storm track regions, with the maxima in the western North Atlantic (Fig. 3a). The main storm tracks are found on the poleward side of the climatological jet (purple contours in Fig. 3a). The storm track biases in the CMIP6 models are shown as shaded colours in Fig. 3c (biases of individual models are presented in Fig. S1 in the Supplement). CMIP6 models show an equatorward shift of the storm tracks in the North Atlantic region. We also observe an overestimation of the magnitude of storm tracks over the Mediterranean and eastern Europe. Similar storm track biases have been described for other CMIP6 and CMIP5 models based on Lagrangian metrics (Priestley et al., 2023; Zappa et al., 2013) and Eulerian metrics (Harvey et al., 2020). Priestley et al. (2023) identified an underestimation of cyclone frequency over the Mediterranean region that is not captured in our analysis. This discrepancy may be due to our model selection or the Lagrangian approach. Even when we cannot make quantitative statements due to the feedback between background flow and storm tracks, the biases in storm tracks are consistent with background flow biases (Fig. 2c, d). For example, the more equatorward and zonal passage of extratropical storms in the North Atlantic aligns with the equatorward displacement of the most substantial gradients in the background flow.

Figure 3(a) Climatological storm tracks (standard deviation of the bandpass-filtered Z at 500 hPa in units of m) for ERA5 (black shading) and the CMIP6 multi-model mean (green contours). The ERA5 zonal wind at 500 hPa is the purple contour (15 m s−1). (b) E vectors at 250 hPa for ERA5 (black arrows) and CMIP6 (green arrows). E vectors are drawn only where the wind speed is higher than 30 m s−1 (at 250 hPa). (c) CMIP6 multi-model mean biases in storm tracks (bandpass-filtered Z) against ERA5. Black contours depict the ERA5 storm tracks (every 10 m, starting from 40 m). (d) CMIP6 multi-model mean biases in E-vector divergence (colour shading). E-vector divergence of m−1 s−2 is shown for ERA5 (black contour) and CMIP6 (green contour). Stippling denotes regions where more than 80 % (six models) of the ensemble members indicate a bias of the same sign.
To further understand the interaction between the eddies and the mean flow, we show the E vectors in Fig. 3b and the difference in ∇⋅E between CMIP6 and ERA5 in Fig. 3d. The E vectors indicate the eastward propagation of Rossby waves in the North Atlantic as described in previous studies (e.g. Hoskins et al., 1983; Strong and Magnusdottir, 2008; Drouard et al., 2021). E vectors exhibit the greatest magnitude over the central North Atlantic, and they reduce their magnitude in the northeastern Atlantic. This reduction in magnitude coincides with diffluent flow, usually found upstream of blocks (Hoskins et al., 1983; Drouard et al., 2021). Eddy activity associated with the storm tracks decelerates the background flow and can be identified as the convergence of E vectors, and it is shown as dashed black (green) contours for ERA5 (CMIP6) in Fig. 3d. In ERA5, convergence regions are found in the storm tracks, for instance, over the east of the North Atlantic, central Europe, and Greenland. Convergence of E vectors is prominent in the Euro-Atlantic region, i.e. in the exit region of the jet, where we have found the most considerable underestimation in blocking frequency.
We investigate the interaction of the shifted eddies and the background flow in CMIP6 models by looking at the differences in the E-vector divergence (colours in Fig. 3d). Note that CMIP6 E vectors have a larger zonal component vector on the Equator side of the jet in the western North Atlantic (green arrows in Fig. 3b), which indicates larger positive momentum transport northward that accelerates the jet to the south of the climatological jet (Drouard et al., 2021). CMIP6 models overestimate the divergence at the jet's exit over regions where the ERA5 climatological mean shows convergence (i.e. upstream of the Iberian Peninsula). This bias may result in a positive contribution from the eddies to the mean flow, speeding up the mean flow and reducing the wave breaking and the blocking onset.
Underestimation of divergence is observed on the polar side of the jet, which could result in a negative contribution to the mean flow and suggest an equatorward shift of the eddy wave activity. Note that the equatorward shift of the eddy wave activity coincides with the shift of the storm tracks towards the Equator, showing the vital link between eddies and storm tracks (Fig. 3b). Thus, we see strong feedbacks between the transient eddy activity and the background flow in the Euro-Atlantic region. In tandem with the biases in the background flow, the transient eddy activity is shifted equatorward in the main storm track region and the associated differences in E-vector divergence speed up the westerly flow upstream of Europe. The advection by the background flow is too strong to balance the westward propagation of Rossby waves. As a consequence, the jet extends further eastward.
4.3 WCBs and the role of moist processes
Recent studies have demonstrated the impact of moist processes on the development and maintenance of blocking. A mid-latitude weather system unambiguously linked to moist processes comprises the WCBs (Madonna et al., 2014). Latent heat release due to cloud formation in these ascending air systems leads to the net transport of low-PV air into the upper troposphere, amplifying the downstream ridge (Grams et al., 2011). Further, the ascent and latent heat release are associated with divergent outflow in the upper troposphere, further amplifying the downstream ridge due to a poleward advection of low-PV air (Steinfeld and Pfahl, 2019). The air mass of the WCB that reaches the upper troposphere is called WCB outflow. The described process chain associated with WCBs indicates that an underestimation of WCB outflow may indicate a misrepresentation of moist diabatic processes and that it may cause a reduction in blocking frequency. In the following, we analyse the WCB inflow and outflow biases in the CMIP6 models. Subsequently, we associate WCB outflow biases with blocking biases.
Figure 4 shows the ERA5 mean WCB inflow and WCB outflow frequency obtained from ELIAS2.0 and the biases in the CMIP6 models. We show biases as an absolute difference (Fig. 4c, d) and relative to the ERA5 climatological mean (Fig. 4e, f). The WCB inflow area indicates the location of air parcels in a WCB prior to the main ascent (Madonna et al., 2014; Joos et al., 2023). The WCB inflow frequency in ERA5 reaches its maxima over the North Atlantic just off the east coast of North America (Fig. 4a). In the North Atlantic, the area with a WCB inflow frequency equal to or larger than 4 % extends from the Gulf of Mexico to the central North Atlantic. CMIP6 models systematically underestimate WCB inflow frequency in the western North Atlantic (Fig. 4c, e). The relative biases show an underestimation of around 30 % over the main WCB inflow region in the North Atlantic (Fig. 4e). Additionally, in the North Atlantic, there is a slight equatorward shift of the main WCB inflow region (see that the green contour is farther from the black contour on the polar side compared to the equatorial side).
The WCB outflow frequency distribution from ELIAS2.0 is comparable with the locations of WCB trajectories 48 h after they started their ascent in a Lagrangian analysis (Madonna et al., 2014; Joos et al., 2023). The regions with a high frequency of WCB outflow are from the North American east coast to the south of Greenland (Fig. 4b). The WCB outflow biases in the CMIP6 models are shown in Fig. 4d and f. In general, in the North Atlantic, the models tend to produce less frequent WCB outflows, which is consistent with an underestimation of WCB inflow frequencies. In the North Atlantic, the WCB outflow is more concentrated at mid-latitudes and extends less to high latitudes. The WCB outflow rarely reaches southern Greenland, where the underestimation is around 80 %. We may interpret this as a weaker WCB ascent that does not reach the upper atmosphere or a weaker poleward displacement of the WCB air parcels.
These results are similar to those results obtained using a Lagrangian analysis (i.e. the LAGRANTO tool) in the Community Earth System Model Large Ensemble (CESM-LE) (Joos et al., 2023). One difference is the location of maximum bias; CESM-LE has the most significant bias over western Europe and southern Greenland (see Fig. S1 in Joos et al., 2023), while the CMIP6 bias is most prominent over the central North Atlantic and south of Greenland.
The storm tracks that are too zonal in the CMIP6 models may explain the lack of WCB outflow at higher latitudes. Similarly, the underestimation of WCB inflow is ultimately linked to the underestimation of WCB outflow. However, the fact that the WCB inflow underestimation is about 40 % hints at other processes being involved in the WCB outflow underestimation. Such underestimation of WCB outflow can be associated with misrepresenting moist diabatic processes in the cloud formation and its associated circulation. Less heating leads to weaker cross-isentropic ascent and a weaker upper-tropospheric divergent outflow. As discussed, ascending WCB trajectories are crucial for blocking amplification and maintenance. CMIP6 models fail to reproduce the WCB inflow and outflow frequency. The lack of WCBs reaching upper levels south of Greenland may thus explain a large portion of blocking biases in the European–Atlantic region.
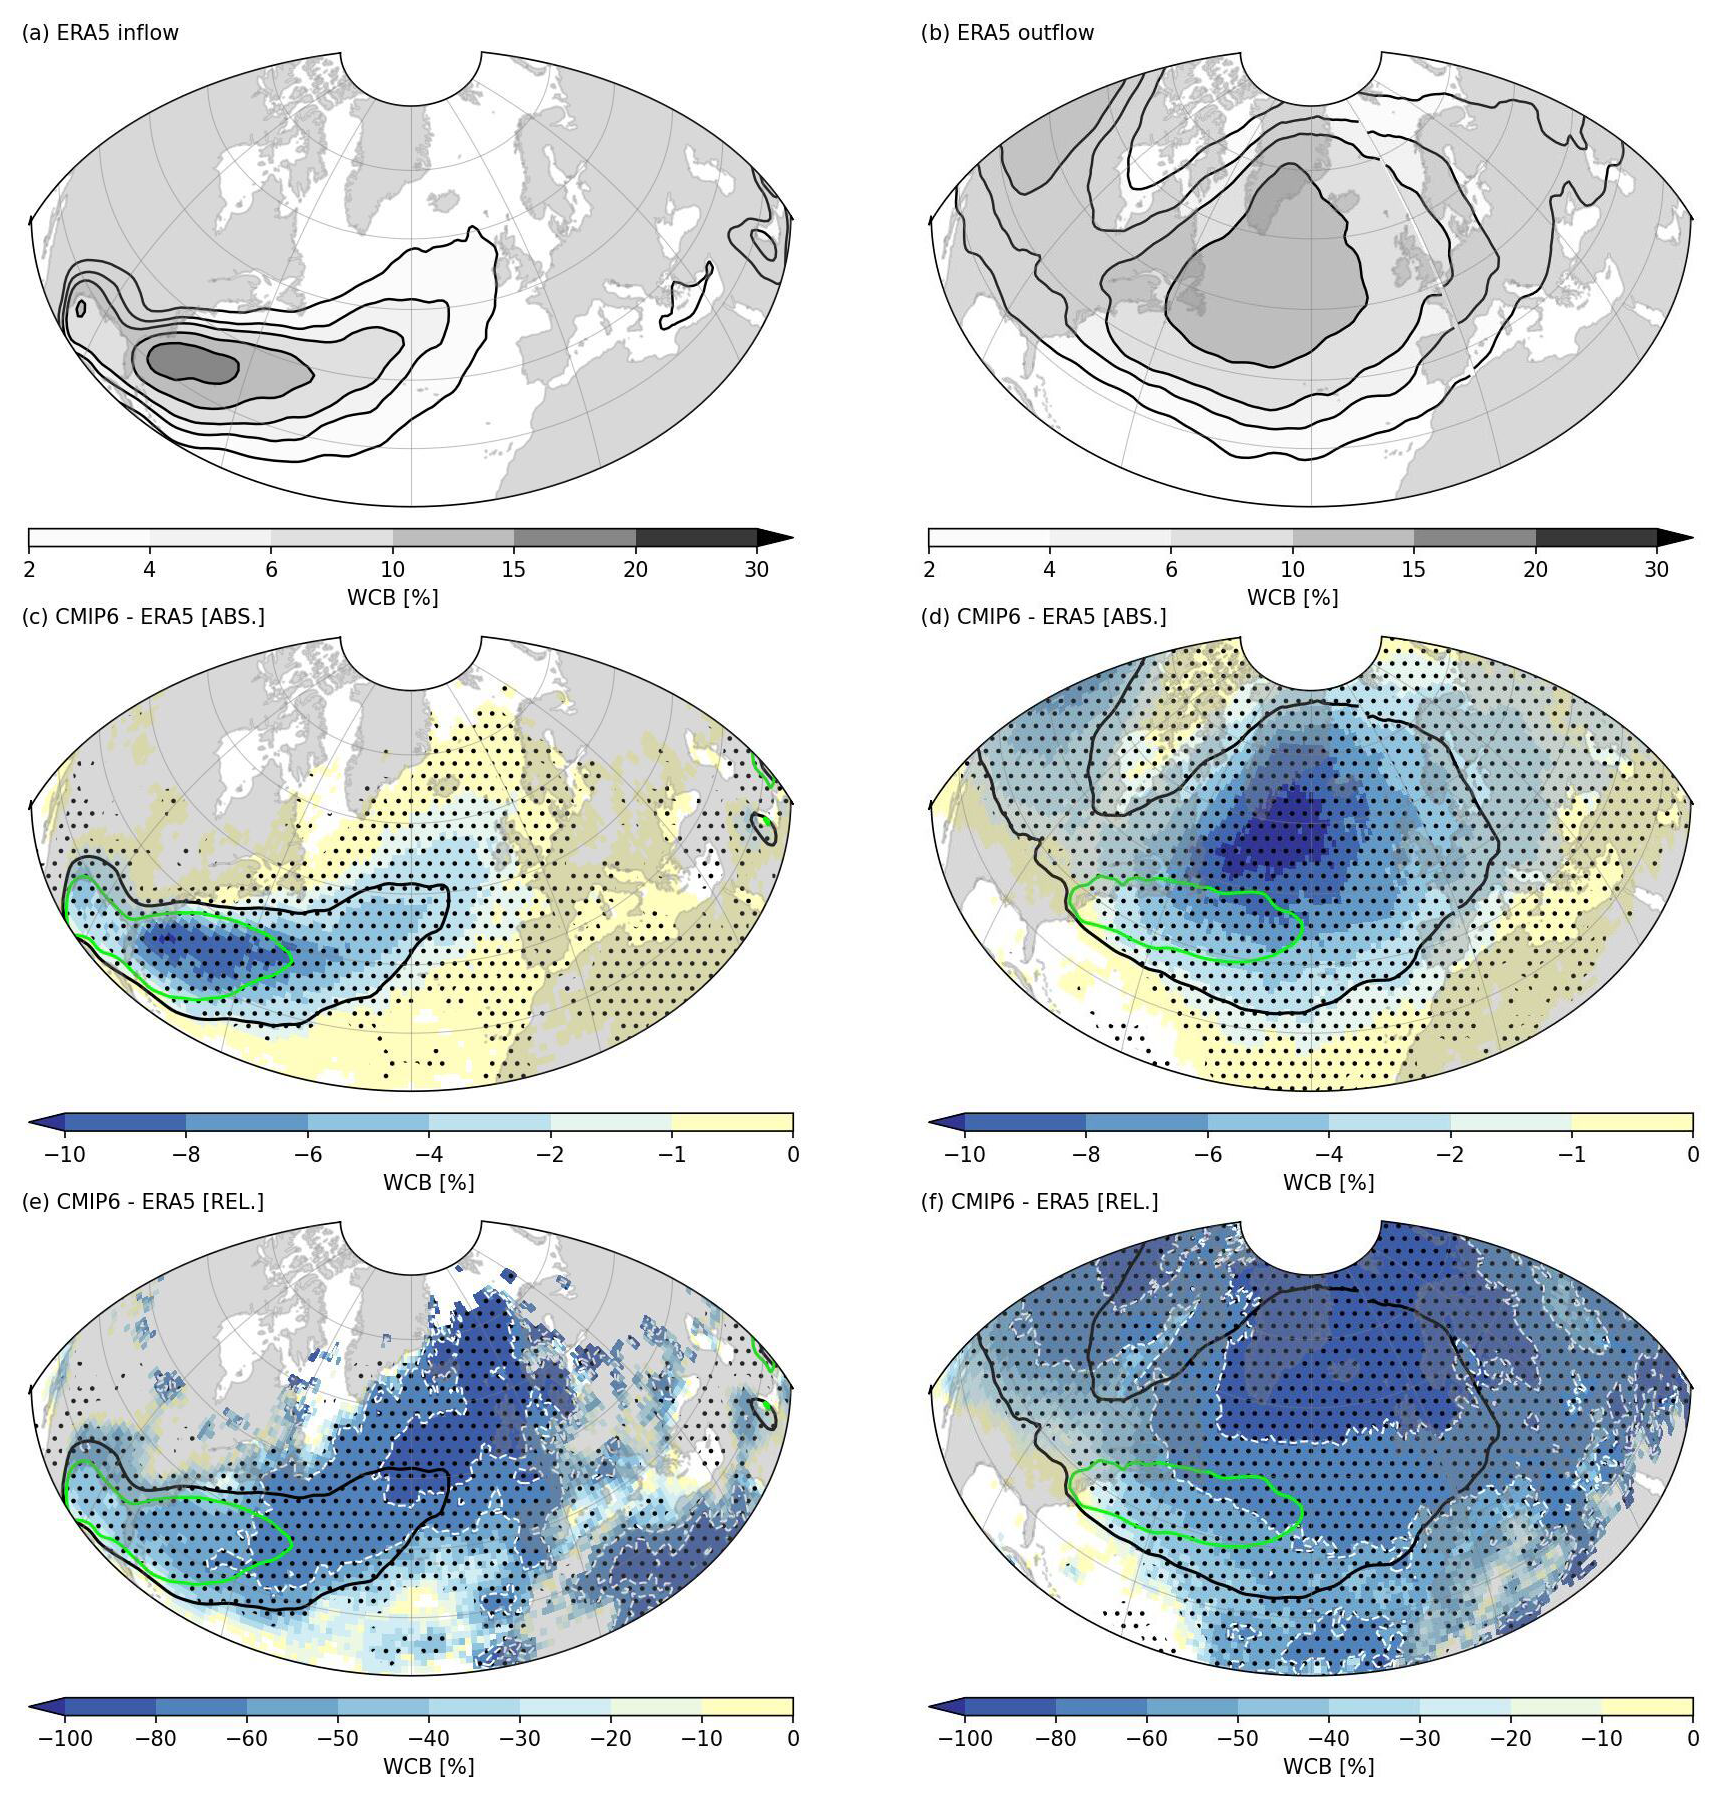
Figure 4(a, b) Climatological frequency of (a) WCB inflow and (b) WCB outflow for ERA5. (c–f) CMIP6 multi-model mean biases of (c, e) WCB inflow and (d, f) WCB outflow against ERA5. Panels (c) and (d) show the absolute biases in percent frequency, and panels (e) and (f) show the relative biases compared to ERA5. In panels (c)–(f), a contour of 4% frequency is depicted in black for ERA5 and green for CMIP6. The white contour in (e) and (f) depicts the biases of 60 % and 80 %. Stippling denotes regions where more than 80 % (six models) of the ensemble members indicate a bias of the same sign.
This study links Euro-Atlantic blocking biases in CMIP6 models to biases in the background flow and dry and moist diabatic processes. The CMIP6 models analysed here exhibit substantial biases in the blocking frequency over the North Pacific, Greenland, and the Euro-Atlantic region. Over the North Pacific and Greenland (i.e. in blocking regions north of the storm track), blocking biases vary across the models. In the Euro-Atlantic region, where blocking occurs downstream of the storm track, the underestimation is particularly pronounced, reaching 80 % relative to ERA5. Accordingly, we focus on that region in the following. The underestimation is limited to a smaller area than reported by previous studies looking at the CMIP6 models (e.g. Davini and D’Andrea, 2020; Schiemann et al., 2020). This improvement may come from selecting only models with reasonable performance according to Palmer et al. (2023). In the following, we further discuss the role of background flow and dry and moist processes.
Establishing the direction of causal relationships is challenging due to the complex feedbacks between the various synoptic features analysed in this study. However, we argue that a causal connection exists between the mean state and the blocking bias. Specifically, the mean state is influenced not only by atmospheric blocks but also by factors such as the representation of topography, land–sea distribution, and tropical convection. Several studies show that coarse-resolution models struggle to accurately capture these elements (e.g. Scaife et al., 2011; Pithan et al., 2016; Kleiner et al., 2021a). Carefully designed sensitivity studies would be needed to quantify the causal relationship between diabatic processes and Euro-Atlantic blocking biases. A first step could be numerical experiments testing the overall sensitivity of the large-scale flow to WCB activity and its associated latent heat release. A rather subtle approach would be experiments with and without stochastic perturbation schemes in the region of WCBs. For example, Dawson and Palmer (2015) and Christensen et al. (2015) show that stochastic perturbations in general improve the representation of blocking in the Atlantic–European region. However, we still lack an understanding of exactly how diabatic processes contribute to this improvement.
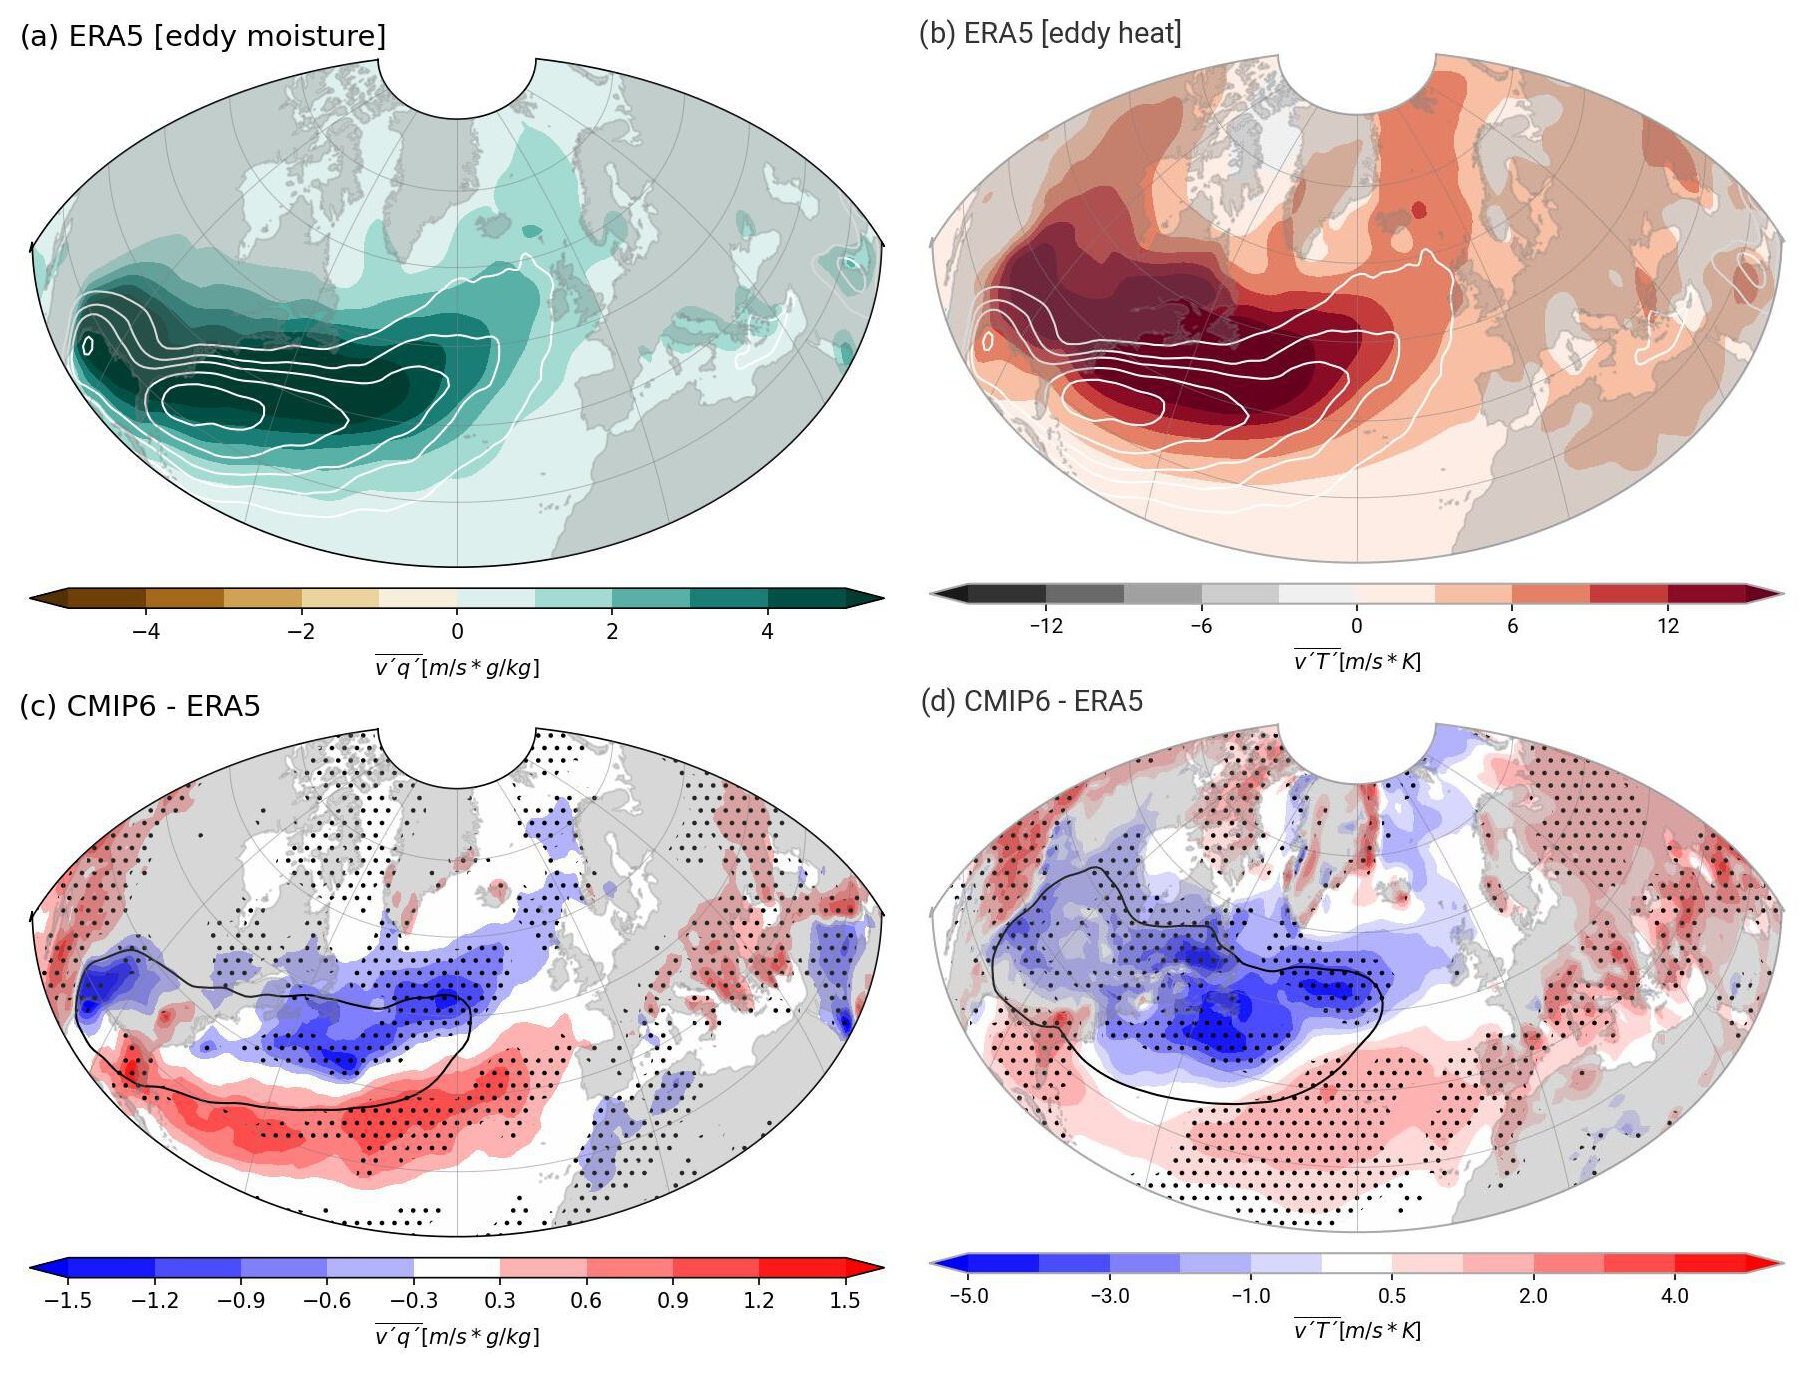
Figure 5(a) Climatological eddy moisture flux in ERA5 (colour shading). The white contours are the climatological WCB inflow frequency for ERA5 (2 %, 4 %, 6 %, 10 %, 15 %, 20 %, 30 %). (b) Climatological eddy heat flux in ERA5. (c, d) CMIP6 multi-model mean biases of eddy (c) moisture flux and (d) heat flux against ERA5. We show the contour of 3.5 m s−1 g kg−1 in panel (c) and 10 m s−1 K in panel (d) of the ERA5 fluxes. Stippling denotes regions where more than 80 % (six models) of the models indicate a bias of the same sign.
Regarding the background flow, CMIP6 models show an equatorward shift of the area of most substantial meridional geopotential height gradients in the North Atlantic (see Fig. 2). The stronger winds to the south of the climatological jet lead to a faster eastward translation of Rossby waves. Accordingly, Rossby waves in these areas need larger zonal wavelengths to become stationary. The storm tracks and the eddy wave activity (defined by the E vectors) are too zonal in the CMIP6 models (Fig. 3). Usually, diffluent flow, from a strong zonal flow to a more meridional flow, favours blocking development (Gabriel and Peters, 2008; Nakamura and Huang, 2018). However, the diffluent flow is unclear in the Euro-Atlantic region, where a stronger tends to dominate. The momentum forcing of eddies, quantified by the E vectors, strengthens the southward shift and zonal extension of the jet (Fig. 3). In the Euro-Atlantic region, the divergence of E vectors is stronger in the CMIP6 models and is associated with accelerating the background flow. The resulting flow is less diffluent over the east of the North Atlantic and thus less favourable to blocking formation in CMIP6.
Moist processes (e.g. cloud formation) interact with atmospheric blocking and can impact their onset and maintenance (e.g. Pfahl et al., 2015). Here, we consider moist processes by analysing WCB outflow frequencies. We find a substantial underestimation of the WCB outflow in the North Atlantic in the CMIP6 models. A qualitatively similar underestimation was found in subseasonal weather predictions (Wandel et al., 2021) as well as in CESM-LE data (Joos et al., 2023). We argue that two factors can explain these biases: (i) misrepresented diabatic heating and the associated cross-isentropic flow and (ii) biases in the WCB inflow. We find a relatively high underestimation of the WCB outflow frequency compared to the WCB inflow frequency (see Fig. 4). The weaker ascent of air parcels in WCBs in CMIP6 might explain part of the WCB outflow biases in the CMIP6 models (see also Woollings et al., 2018; Steinfeld et al., 2020; Joos et al., 2023). Moreover, the WCB outflow is constrained to lower latitudes (no poleward displacement), which can be linked to the storm tracks being too zonal and equatorward-shifted. To better understand WCB inflow biases, we analyse lower-tropospheric heat and moisture fluxes. Lower-tropospheric moisture fluxes are essential during the initial stage of WCB formation and may indicate the presence of the WCB inflow (Dacre et al., 2019; Quinting et al., 2024). We hypothesise that underestimating moisture and eddy heat flux reduces WCB frequency and ascent. Indeed, the meridional moisture flux is one predictor in ELIAS2.0 (Quinting and Grams, 2022). Figure 5 shows the meridional eddy moisture and heat fluxes at 850 hPa in ERA5 and the CMIP6 biases. In ERA5, the climatological eddy moisture flux maxima are in locations similar to the WCB inflow climatology with a slight poleward displacement in the North Atlantic (Fig. 5a). The maxima in eddy heat fluxes are at higher latitudes than the WCB inflow regions closer to the storm tracks (Fig. 5b).
In the North Atlantic, the maximum eddy moisture flux from the CMIP6 models is equatorward-shifted (Fig. 5c). This is consistent with the equatorward-shifted storm tracks but does not explain the underestimation of WCB inflow in the North Atlantic, although we observe an eddy moisture flux underestimation in the Gulf of Mexico, which can lead to WCB inflow biases. Nevertheless, we observe a clear underestimation (50 % relative to ERA5) of eddy heat fluxes at the US east coast (Fig. 5d). Thus, the biases in the WCB inflow over the North Atlantic are associated with biases in eddy moisture and heat fluxes.
In summary, the CMIP6 models exhibit two systematic biases: (1) a southward shift of the background flow and (2) an underestimation of eddy activity in the North Atlantic region, associated with WCB inflow and outflow biases and blocking underestimation. Despite the consistent signals with the different approaches in this study, caution is advised when interpreting the absolute values of WCB frequencies. Based on the fact that ELIAS2.0 was trained on ERA-Interim reanalysis data, identified biases may be not only biases in the CMIP6 models but also an effect of ELIAS2.0 itself.
-
One limitation is that ELIAS2.0 is trained on the basis of ERA-Interim data and here is applied to ERA5 and climate models. This is the first time ELIAS2.0 has been applied to climate models. Validation with explicit WCB trajectories in climate models (e.g. CESM-LE) as in Joos et al. (2023) could help us better understand potential biases arising from ELIAS2.0, although, overall, it is worth noting that the identified underestimation of WCB activity in this study qualitatively mirrors the underestimation identified by Joos et al. (2023) (see their Fig. S1).
-
Joos et al. (2023) found that WCBs identified on the basis of trajectories tend to ascend more slowly in CESM-LE than in ERA-Interim. Accordingly, the outflow heights as identified in our study may only be reached at a later time and thus appear to be an underestimation of WCB outflow frequency. Due to its training configuration, ELIAS2.0 is not able to identify such deficiencies. Full retraining on a different training dataset would be necessary, which goes beyond the scope of this study.
-
The CMIP6 models analysed here generally have coarser native horizontal grid spacing than that of ERA-Interim. Accordingly, all data were interpolated from different resolutions to a regular latitude–longitude grid of 1° × 1°. This interpolation may result in smoothened gradients that in turn affect parameters such as vorticity or divergence, which are both predictors in ELIAS2.0.
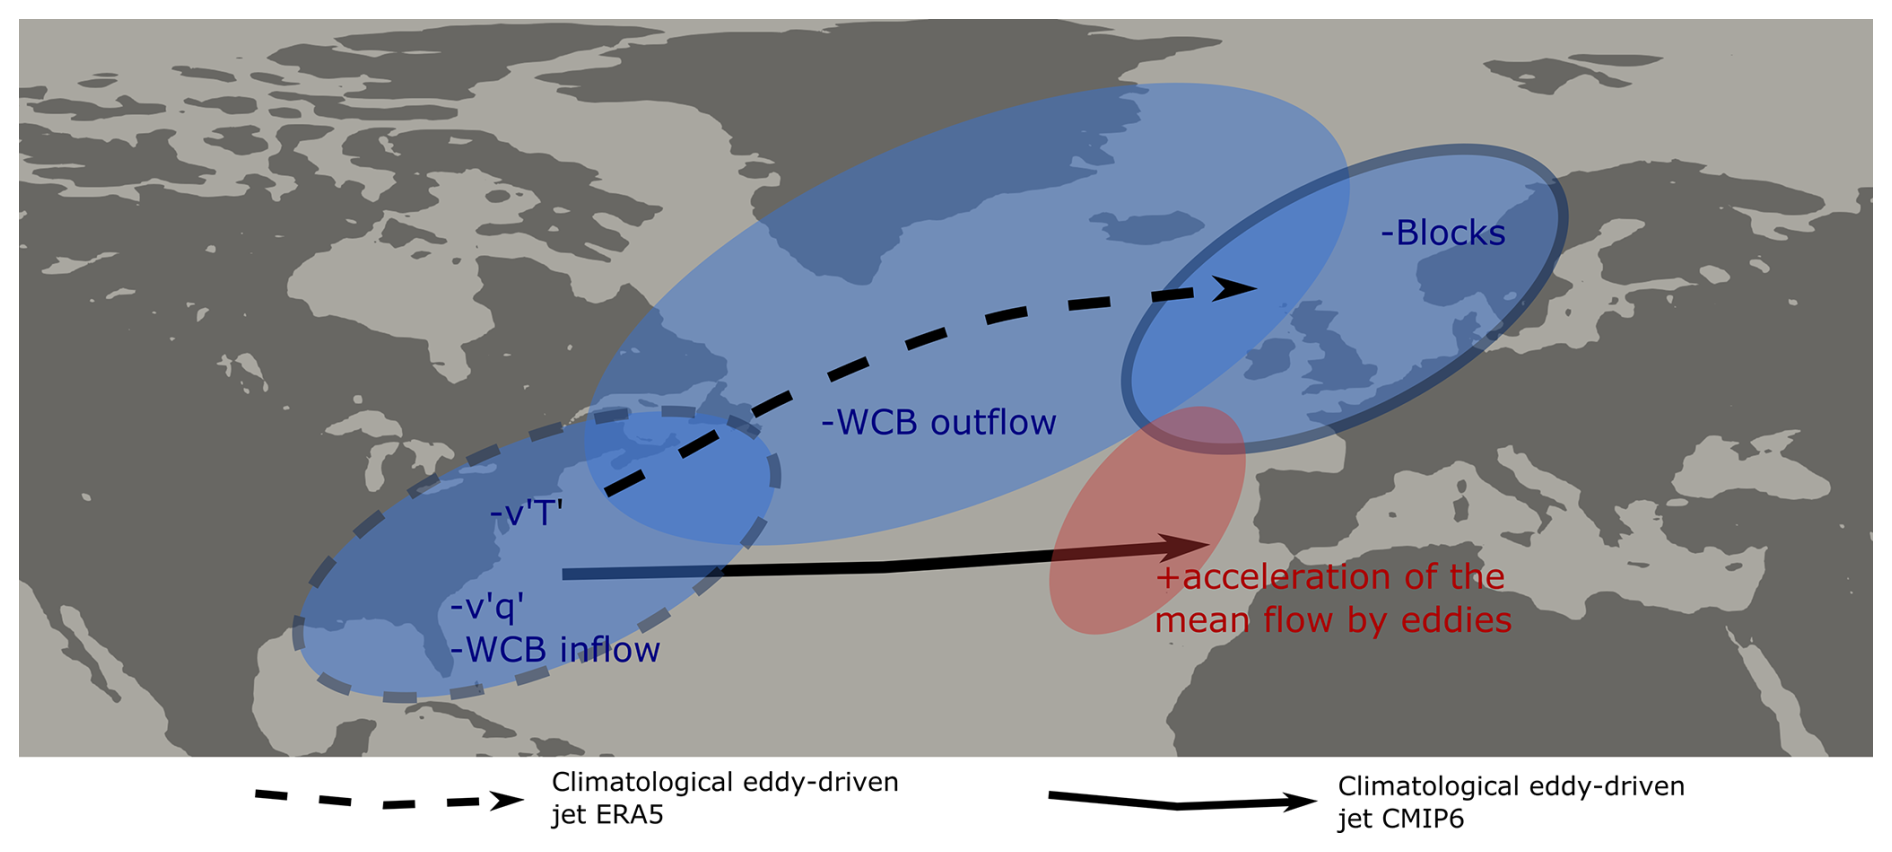
Figure 6Schematic summary of the identified sources of the Euro-Atlantic blocking biases in the CMIP6 models. The red-shaded colour indicates positive biases, and blue indicates negative biases. There is a negative blocking bias over the eastern North Atlantic and Europe in the CMIP6 simulations (blue area and solid grey contour). The eddy-driven jet over the North Atlantic is shifted equatorward and extends farther into the eastern North Atlantic in the CMIP6 simulations. The associated shift in the storm track results in a positive eddy–mean flow feedback, with the transient wave activity accelerating the jet over the eastern North Atlantic. Weaker moisture and heat fluxes in the western North Atlantic are associated with a negative WCB inflow frequency bias (blue area and dashed grey contour). A negative frequency bias in the WCB outflow over the central and eastern North Atlantic contributes to a weaker downstream ridge. Note that blocking may bias the background flow and dry processes, and the process chain should be interpreted cautiously.
Furthermore, we have discussed that WCBs can significantly influence the upper-level waveguide. Nevertheless, it is essential to highlight the key factors that govern the WCB's influence on the waveguide and the processes that may introduce biases in this interaction. These factors include the following:
- i.
Biases in the frequency and/or location of the WCB outflow. As discussed in this study, inaccuracies in the predicted frequency or positioning of the outflow can lead to incorrect assessments of the WCB's impact on the waveguide.
- ii.
Biases in the potential vorticity (PV) anomaly generated by the WCB. The representation of microphysical processes and the simulated outflow height are critical in determining the PV value at the upper levels. If this PV value is inaccurately represented, it can distort the WCB's impact on the waveguide, even if the frequency and location are correctly simulated.
- iii.
Climatological tropopause height biases in CMIP6 models. Even if the WCB outflow's location, height, and PV value are accurately simulated, an incorrect representation of the climatological tropopause height could still lead to errors. For instance, if the tropopause is modelled to be too high or too low, the impact of an otherwise well-represented WCB on the waveguide would be misestimated.
This study evaluates the representation of atmospheric blocking in eight CMIP6 models (see Table 1 for details). We base the model selection on information from the literature: (i) on the models' skill to simulate atmospheric blocking and (ii) on the independence of the models in terms of shared model components. The CMIP6 multi-model mean biases reveal that the frequency of Euro-Atlantic blocking is the most severely underestimated of the major blocking regions in the Northern Hemisphere. During winter, the underestimation reaches 80 %, confirming the results of previous studies.
We then focus on identifying different potential sources of the Euro-Atlantic blocking biases: the background flow, dry processes, and moist processes. We use the mean and mode of the latitudinal gradient of the geopotential height at 500 hPa to describe the background flow. In the multi-model CMIP6 mean, the jet (area with strong gradients and depicted as a purple contour in Fig. 2a, b, and e) is shifted equatorward, is more zonal, and extends further downstream. The storm tracks, as well as their associated eddy activity, are also shifted equatorward in the North Atlantic in the CMIP6 models. CMIP6 E vectors show that diffluent flow is reduced in the Euro-Atlantic region. Moreover, the contribution of the eddies to mean flow is examined by ∇⋅E, where the convergence indicates a deceleration of mean flow by the eddies. In CMIP6, we find a reduced convergence or divergence in the Euro-Atlantic region. Thus, the eddies accelerate the background flow and negatively contribute to the block development in the eastern North Atlantic.
We have applied deep-learning WCB detection (ELIAS2.0) to the CMIP6 models. Both WCB inflow and WCB outflow frequency are underestimated in the CMIP6 models. A similar underestimation of WCB frequency is found using a Lagrangian approach in climate models (Joos et al., 2023). The WCB outflow frequency is 80 % lower in the North Atlantic in CMIP6 compared to ERA5. The WCB outflow biases are partly linked to the underestimation of WCB inflow in the western North Atlantic. The underestimation of the WCB inflow is likely linked to the misrepresentation of eddy moisture and heat fluxes in the lower troposphere. In the North Atlantic, WCB outflow frequency is underestimated by 80 % in the region of maximum WCB outflow (south of Greenland), while inflow is underestimated by 40 %. Thus, WCB inflow may explain part of the WCB outflow underestimation but not the whole of it. CMIP6 models lack WCB outflow at higher latitudes and may be associated with air masses that do not reach as far poleward as in ERA5 or do not reach the upper troposphere. One can interpret this misrepresentation as a consequence of weaker latent heat release, reflecting an underestimation of moist processes in CMIP6 models. Thus, the misrepresentation of moist processes in CMIP6 is likely one factor contributing to reducing Euro-Atlantic blocking by depositing less-anticyclonic PV air in the upper troposphere.
We summarise the background flow and dry and moist processes biases and their link to the blocking biases in Fig. 6. Note that the blocking may produce some biases in the background flow and dry processes, as described in Sect. 5, Discussion. Thus, we refer to linkages rather than causalities, and the following chain of processes should be taken with caution. In the North Atlantic, too zonal a background flow is associated with southward migration of the eddy activity, and momentum transport from eddies accelerates the mean flow in the Euro-Atlantic region (red region in Fig. 6) and reduces diffluent flow and blocking formation. CMIP6 models also underestimate moisture fluxes in the lower troposphere, linked to a lower frequency of WCB inflow and WCB outflow and blocking.
The code of ELIAS2.0 is available from https://gitlab.kit.edu/julian.quinting/elias-2.0.git (Quinting and Grams, 2022).
CMIP6 data are available via https://easy.gems.dkrz.de (Eyring et al., 2016).
The supplement related to this article is available online at https://doi.org/10.5194/wcd-6-471-2025-supplement.
OM and EDT designed the study. EDT performed the analysis, with the support of JQ for ELIAS2.0; produced the figures; and drafted the manuscript. All authors discussed the results and edited the manuscript.
The contact author has declared that none of the authors has any competing interests.
Publisher’s note: Copernicus Publications remains neutral with regard to jurisdictional claims made in the text, published maps, institutional affiliations, or any other geographical representation in this paper. While Copernicus Publications makes every effort to include appropriate place names, the final responsibility lies with the authors.
Edgar Dolores-Tesillos was supported by the nextGEMS project (European Union's Horizon 2020, 101003470). The contribution of Julian Quinting was funded by the European Union (ERC, ASPIRE, 101077260).
This research has been supported by EU Horizon 2020 (grant no. 101003470).
This paper was edited by Juliane Schwendike and reviewed by Hanna Joos and three anonymous referees.
Altenhoff, A. M., Martius, O., Croci-Maspoli, M., Schwierz, C., and Davies, H. C.: Linkage of atmospheric blocks and synoptic-scale Rossby waves: a climatological analysis, Tellus A, 60, 1053, https://doi.org/10.1111/j.1600-0870.2008.00354.x, 2008. a
Antokhina, O. Y., Antokhin, P. N., Belan, B. D., Gochakov, A. V., Martynova, Y. V., Pustovalov, K. N., Tarabukina, L. D., and Devyatova, E. V.: Effects of Rossby Waves Breaking and Atmospheric Blocking Formation on the Extreme Forest Fire and Floods in Eastern Siberia 2019, Fire, 6, 122, https://doi.org/10.3390/fire6030122, 2023. a
Athanasiadis, P. J., Ogawa, F., Omrani, N.-E., Keenlyside, N., Schiemann, R., Baker, A. J., Vidale, P. L., Bellucci, A., Ruggieri, P., Haarsma, R., Roberts, M., Roberts, C., Novak, L., and Gualdi, S.: Mitigating climate biases in the midlatitude North Atlantic by increasing model resolution: SST gradients and their relation to blocking and the jet, J. Climate, 35, 6985–7006, https://doi.org/10.1175/JCLI-D-21-0515.1, 2022. a, b
Attinger, R., Keller, J., Köhler, M., Riboldi, J., and Grams, C.: Representation of atmospheric blocking in the new global non-hydrostatic weather prediction model ICON, Meteorologische Z., 28, 429–446, https://doi.org/10.1127/metz/2019/0967, 2019. a
Barriopedro, D., García-Herrera, R., and Trigo, R. M.: Application of blocking diagnosis methods to General Circulation Models. Part I: a novel detection scheme, Clim. Dynam., 35, 1373–1391, https://doi.org/10.1007/s00382-010-0767-5, 2010. a
Berckmans, J., Woollings, T., Demory, M.-E., Vidale, P.-L., and Roberts, M.: Atmospheric blocking in a high resolution climate model: influences of mean state, orography and eddy forcing, Atmos. Sci. Lett., 14, 34–40, https://doi.org/10.1002/asl2.412, 2013. a, b, c, d
Binder, H., Boettcher, M., Joos, H., and Wernli, H.: The role of warm conveyor belts for the intensification of extratropical cyclones in Northern Hemisphere winter, J. Atmos. Sci., 73, 3997–4020, https://doi.org/10.1175/JAS-D-15-0302.1, 2016. a, b
Binder, H., Joos, H., Sprenger, M., and Wernli, H.: Warm conveyor belts in present-day and future climate simulations – Part 2: Role of potential vorticity production for cyclone intensification, Weather Clim. Dynam., 4, 19–37, https://doi.org/10.5194/wcd-4-19-2023, 2023. a
Branstator, G.: Circumglobal teleconnections, the jet stream waveguide, and the North Atlantic Oscillation, J. Climate, 15, 1893–1910, https://doi.org/10.1175/1520-0442(2002)015<1893:CTTJSW>2.0.CO;2, 2002. a
Branstator, G. and Teng, H.: Tropospheric waveguide teleconnections and their seasonality, J. Atmos. Sci., 74, 1513–1532, https://doi.org/10.1175/JAS-D-16-0305.1, 2017. a
Brunner, L. and Steiner, A. K.: A global perspective on atmospheric blocking using GPS radio occultation – one decade of observations, Atmos. Meas. Tech., 10, 4727–4745, https://doi.org/10.5194/amt-10-4727-2017, 2017. a, b, c
Brunner, L., Schaller, N., Anstey, J., Sillmann, J., and Steiner, A. K.: Dependence of present and future European temperature extremes on the location of atmospheric blocking, Geophys. Res. Lett., 45, 6311–6320, https://doi.org/10.1029/2018GL077837, 2018. a
Brunner, L., Pendergrass, A. G., Lehner, F., Merrifield, A. L., Lorenz, R., and Knutti, R.: Reduced global warming from CMIP6 projections when weighting models by performance and independence, Earth Syst. Dynam., 11, 995–1012, https://doi.org/10.5194/esd-11-995-2020, 2020. a, b
Cheung, H. H. and Zhou, W.: Implications of Ural blocking for East Asian winter climate in CMIP5 GCMs. Part I: Biases in the historical scenario, J. Climate, 28, 2203–2216, https://doi.org/10.1175/JCLI-D-14-00308.1, 2015. a, b
Cheung, H.-N., Omrani, N.-E., Ogawa, F., Keenlyside, N., Nakamura, H., and Zhou, W.: Pacific oceanic front amplifies the impact of Atlantic oceanic front on North Atlantic blocking, npj Clim. Atmos. Sci., 6, 61, https://doi.org/10.1038/s41612-023-00370-x, 2023. a
Christensen, H. M., Moroz, I. M., and Palmer, T. N.: Simulating weather regimes: impact of stochastic and perturbed parameter schemes in a simple atmospheric model, Clim. Dynam., 44, 2195–2214, https://doi.org/10.1007/s00382-014-2239-9, 2015. a
Dacre, H. F., Martinez-Alvarado, O., and Mbengue, C. O.: Linking atmospheric rivers and warm conveyor belt airflows, J. Hydrometeorol., 20, 1183–1196, https://doi.org/10.1175/JHM-D-18-0175.1, 2019. a
Davini, P. and D’Andrea, F.: Northern Hemisphere atmospheric blocking representation in global climate models: twenty years of improvements?, J. Climate, 29, 8823–8840, https://doi.org/10.1175/JCLI-D-16-0242.1, 2016. a, b, c
Davini, P. and D’Andrea, F.: From CMIP3 to CMIP6: Northern Hemisphere Atmospheric Blocking Simulation in Present and Future Climate, J. Climate, 33, 10021–10038, https://doi.org/10.1175/JCLI-D-19-0862.1, 2020. a, b, c
Davini, P., Cagnazzo, C., Gualdi, S., and Navarra, A.: Bidimensional diagnostics, variability, and trends of Northern Hemisphere blocking, J. Climate, 25, 6496–6509, https://doi.org/10.1175/JCLI-D-12-00032.1, 2012. a
Davini, P., Cagnazzo, C., Fogli, P. G., Manzini, E., Gualdi, S., and Navarra, A.: European blocking and Atlantic jet stream variability in the NCEP/NCAR reanalysis and the CMCC-CMS climate model, Clim. Dynam., 43, 71–85, https://doi.org/10.1007/s00382-013-1873-y, 2014. a
Davini, P., Corti, S., D'Andrea, F., Rivière, G., and Von Hardenberg, J.: Improved Winter European Atmospheric Blocking Frequencies in High‐Resolution Global Climate Simulations, J. Adv. Model. Earth Syst., 9, 2615–2634, https://doi.org/10.1002/2017MS001082, 2017. a, b, c
Dawson, A. and Palmer, T. N.: Simulating weather regimes: impact of model resolution and stochastic parameterization, Clim. Dynam., 44, 2177–2193, https://doi.org/10.1007/s00382-014-2238-x, 2015. a
Dee, D. P., Uppala, S., Simmons, A., Berrisford, P., Poli, P., Kobayashi, S., Andrae, U., Balmaseda, M., Balsamo, G., Bauer, D. P., Bechtold, P., Beljaars, A. C. M., van de Berg, L., Bidlot, J., Bormann, N., Delsol, C., Dragani, R., Fuentes, M., Geer, A. J., Haimberger, L., Healy, S. B., Hersbach, H., Hólm, E. V., Isaksen, L., Kållberg, P., Köhler, M., Matricardi, M., McNally, A. P., Monge-Sanz, B. M., Morcrette, J.-J., Park, B.-K., Peubey, C., de Rosnay, P., Tavolato, C., Thépaut, J.-N., and Vitart, F.: The ERA-Interim reanalysis: Configuration and performance of the data assimilation system, Q. J. Roy. Meteorol. Soc., 137, 553–597, https://doi.org/10.1002/qj.828, 2011. a
Dole, R. M. and Gordon, N. D.: Persistent anomalies of the extratropical Northern Hemisphere wintertime circulation: Geographical distribution and regional persistence characteristics, Mon. Weather Rev., 111, 1567–1586, https://doi.org/10.1175/1520-0493(1983)111<1567:PAOTEN>2.0.CO;2, 1983. a
Dolores-Tesillos, E. and Pfahl, S.: Future changes in North Atlantic winter cyclones in CESM-LE – Part 2: A Lagrangian analysis, Weather Clim. Dynam., 5, 163–179, https://doi.org/10.5194/wcd-5-163-2024, 2024. a
Drouard, M., Woollings, T., Sexton, D. M., and McSweeney, C. F.: Dynamical differences between short and long blocks in the Northern Hemisphere, J. Geophys. Res.-Atmos., 126, e2020JD034082, https://doi.org/10.1029/2020JD034082, 2021. a, b, c, d
Eyring, V., Bony, S., Meehl, G. A., Senior, C. A., Stevens, B., Stouffer, R. J., and Taylor, K. E.: Overview of the Coupled Model Intercomparison Project Phase 6 (CMIP6) experimental design and organization, Geosci. Model Dev., 9, 1937–1958, https://doi.org/10.5194/gmd-9-1937-2016, 2016 (data available at: https://easy.gems.dkrz.de, last access: December 2024). a, b
Eyring, V., Bock, L., Lauer, A., Righi, M., Schlund, M., Andela, B., Arnone, E., Bellprat, O., Brötz, B., Caron, L.-P., Carvalhais, N., Cionni, I., Cortesi, N., Crezee, B., Davin, E. L., Davini, P., Debeire, K., de Mora, L., Deser, C., Docquier, D., Earnshaw, P., Ehbrecht, C., Gier, B. K., Gonzalez-Reviriego, N., Goodman, P., Hagemann, S., Hardiman, S., Hassler, B., Hunter, A., Kadow, C., Kindermann, S., Koirala, S., Koldunov, N., Lejeune, Q., Lembo, V., Lovato, T., Lucarini, V., Massonnet, F., Müller, B., Pandde, A., Pérez-Zanón, N., Phillips, A., Predoi, V., Russell, J., Sellar, A., Serva, F., Stacke, T., Swaminathan, R., Torralba, V., Vegas-Regidor, J., von Hardenberg, J., Weigel, K., and Zimmermann, K.: Earth System Model Evaluation Tool (ESMValTool) v2.0 – an extended set of large-scale diagnostics for quasi-operational and comprehensive evaluation of Earth system models in CMIP, Geosci. Model Dev., 13, 3383–3438, https://doi.org/10.5194/gmd-13-3383-2020, 2020. a
Gabriel, A. and Peters, D.: A diagnostic study of different types of Rossby wave breaking events in the northern extratropics, J. Meteorol. Soc. JPN II, 86, 613–631, https://doi.org/10.2151/jmsj.86.613, 2008. a
Grams, C. M., Wernli, H., Böttcher, M., Čampa, J., Corsmeier, U., Jones, S. C., Keller, J. H., Lenz, C.-J., and Wiegand, L.: The key role of diabatic processes in modifying the upper-tropospheric wave guide: a North Atlantic case-study, Q. J. Roy. Meteorol. Soc., 137, 2174–2193, https://doi.org/10.1002/qj.891, 2011. a, b
Greeves, C., Pope, V., Stratton, R., and Martin, G.: Representation of Northern Hemisphere winter storm tracks in climate models, Clim. Dynam., 28, 683–702, https://doi.org/10.1007/s00382-006-0205-x, 2007. a
Harvey, B., Cook, P., Shaffrey, L., and Schiemann, R.: The response of the northern hemisphere storm tracks and jet streams to climate change in the CMIP3, CMIP5, and CMIP6 climate models, J. Geophys. Res.-Atmos., 125, e2020JD032701, https://doi.org/10.1029/2020JD032701, 2020. a
Hersbach, H., Bell, B., Berrisford, P., Hirahara, S., Horányi, A., Muñoz-Sabater, J., Nicolas, J., Peubey, C., Radu, R., Schepers, D., Simmons, A., Soci, C., Abdalla, S., Abellan, X., Balsamo, G., Bechtold, P., Biavati, G., Bidlot, J., Bonavita, M., De Chiara, G., Dahlgren, P., Dee, D., Diamantakis, M., Dragani, R., Flemming, J., Forbes, R., Fuentes, M., Geer, A., Haimberger, L., Healy, S., Hogan, R. J., Hólm, E., Janisková, M., Keeley, S., Laloyaux, P., Lopez, P., Lupu, C., Radnoti, G., de Rosnay, P., Rozum, I., Vamborg, F., Villaume, S., and Thépaut, J.-N.: The ERA5 global reanalysis, Q. J. Roy. Meteorol. Soc., 146, 1999–2049, https://doi.org/10.1002/qj.3803, 2020. a
Hinton, T., Hoskins, B., and Martin, G.: The influence of tropical sea surface temperatures and precipitation on north Pacific atmospheric blocking, Clim. Dynam., 33, 549–563, https://doi.org/10.1007/s00382-009-0542-7, 2009. a
Hoskins, B. J. and Hodges, K. I.: New perspectives on the Northern Hemisphere winter storm tracks, J. Atmos. Sci., 59, 1041–1061, https://doi.org/10.1175/1520-0469(2002)059<1041:NPOTNH>2.0.CO;2, 2002. a
Hoskins, B. J., James, I. N., and White, G. H.: The shape, propagation and mean-flow interaction of large-scale weather systems, J. Atmos. Sci., 40, 1595–1612, https://doi.org/10.1175/1520-0469(1983)040<1595:TSPAMF>2.0.CO;2, 1983. a, b, c, d, e, f
Jeong, D. I., Cannon, A. J., and Yu, B.: Influences of atmospheric blocking on North American summer heatwaves in a changing climate: a comparison of two Canadian Earth system model large ensembles, Clim. Change, 172, 5, https://doi.org/10.1007/s10584-022-03358-3, 2022. a
Joos, H. and Wernli, H.: Influence of microphysical processes on the potential vorticity development in a warm conveyor belt: a case-study with the limited-area model COSMO, Q. J. Roy. Meteorol. Soc., 138, 407–418, https://doi.org/10.1002/qj.934, 2012. a
Joos, H., Sprenger, M., Binder, H., Beyerle, U., and Wernli, H.: Warm conveyor belts in present-day and future climate simulations – Part 1: Climatology and impacts, Weather Clim. Dynam., 4, 133–155, https://doi.org/10.5194/wcd-4-133-2023, 2023. a, b, c, d, e, f, g, h, i, j, k
Kautz, L.-A., Martius, O., Pfahl, S., Pinto, J. G., Ramos, A. M., Sousa, P. M., and Woollings, T.: Atmospheric blocking and weather extremes over the Euro-Atlantic sector – a review, Weather Clim. Dynam., 3, 305–336, https://doi.org/10.5194/wcd-3-305-2022, 2022. a
Kleiner, N., Chan, P. W., Wang, L., Ma, D., and Kuang, Z.: Effects of Climate Model Mean-State Bias on Blocking Underestimation, Geophys. Res. Lett., 48, e2021GL094129, https://doi.org/10.1029/2021GL094129, 2021a. a
Kleiner, N., Chan, P. W., Wang, L., Ma, D., and Kuang, Z.: Effects of Climate Model Mean-State Bias on Blocking Underestimation, Geophys. Res. Lett., 48, e2021GL094129, https://doi.org/10.1029/2021GL094129, 2021b. a, b
Luo, D., Luo, B., and Zhang, W.: A perspective on the evolution of atmospheric blocking theories: from eddy-mean flow interaction to nonlinear multiscale interaction, Adv. Atmos. Sci., 40, 553–569, https://doi.org/10.1007/s00376-022-2194-z, 2023. a
Madonna, E., Wernli, H., Joos, H., and Martius, O.: Warm conveyor belts in the ERA-Interim dataset (1979–2010). Part I: Climatology and potential vorticity evolution, J. Climate, 27, 3–26, https://doi.org/10.1175/JCLI-D-12-00720.1, 2014. a, b, c, d, e, f
Martínez-Alvarado, O., Maddison, J. W., Gray, S. L., and Williams, K. D.: Atmospheric blocking and upper-level Rossby-wave forecast skill dependence on model configuration, Q. J. Roy. Meteorol. Soc., 144, 2165–2181, https://doi.org/10.1002/qj.3326, 2018. a
Masato, G., Hoskins, B. J., and Woollings, T.: Winter and summer Northern Hemisphere blocking in CMIP5 models, J. Climate, 26, 7044–7059, https://doi.org/10.1175/JCLI-D-12-00466.1, 2013. a
Mohr, S., Wandel, J., Lenggenhager, S., and Martius, O.: Relationship between atmospheric blocking and warm-season thunderstorms over western and central Europe, Q. J. Roy. Meteorol. Soc., 145, 3040–3056, https://doi.org/10.1002/qj.3603, 2019. a
Nakamura, N. and Huang, C. S. Y.: Atmospheric blocking as a traffic jam in the jet stream, Science, 361, 42–47, https://doi.org/10.1126/science.aat0721, 2018. a
Oertel, A., Miltenberger, A. K., Grams, C. M., and Hoose, C.: Interaction of microphysics and dynamics in a warm conveyor belt simulated with the ICOsahedral Nonhydrostatic (ICON) model , Atmos. Chem. Phys., 23, 8553–8581, https://doi.org/10.5194/acp-23-8553-2023, 2023a. a
Oertel, A., Pickl, M., Quinting, J. F., Hauser, S., Wandel, J., Magnusson, L., Balmaseda, M., Vitart, F., and Grams, C. M.: Everything Hits at Once: How Remote Rainfall Matters for the Prediction of the 2021 North American Heat Wave, Geophys. Res. Lett., 50, e2022GL100958, https://doi.org/10.1029/2022GL100958, 2023b. a, b
Palmer, T. E., McSweeney, C. F., Booth, B. B. B., Priestley, M. D. K., Davini, P., Brunner, L., Borchert, L., and Menary, M. B.: Performance-based sub-selection of CMIP6 models for impact assessments in Europe, Earth Syst. Dynam., 14, 457–483, https://doi.org/10.5194/esd-14-457-2023, 2023. a, b, c, d, e, f
Park, M. and Lee, S.: Is the Stationary Wave Bias in CMIP5 Simulations Driven by Latent Heating Biases?, Geophys. Res. Lett., 48, e2020GL091678, https://doi.org/10.1029/2020GL091678, 2021. a
Pfahl, S., Schwierz, C., Croci-Maspoli, M., Grams, C. M., and Wernli, H.: Importance of latent heat release in ascending air streams for atmospheric blocking, Nat. Geosci., 8, 610–614, https://doi.org/10.1038/ngeo2487, 2015. a, b, c
Pinheiro, M. C., Ullrich, P. A., and Grotjahn, R.: Atmospheric blocking and intercomparison of objective detection methods: flow field characteristics, Clim. Dynam., 53, 4189–4216, 2019. a
Pithan, F., Shepherd, T. G., Zappa, G., and Sandu, I.: Climate model biases in jet streams, blocking and storm tracks resulting from missing orographic drag, Geophys. Res. Lett., 43, 7231–7240, 2016. a
Priestley, M. D., Ackerley, D., Catto, J. L., and Hodges, K. I.: Drivers of biases in the CMIP6 extratropical storm tracks. Part I: Northern Hemisphere, J. Climate, 36, 1451–1467, https://doi.org/10.1175/JCLI-D-20-0976.1, 2023. a, b
Quinting, J. F. and Grams, C. M.: EuLerian Identification of ascending AirStreams (ELIAS 2.0) in numerical weather prediction and climate models – Part 1: Development of deep learning model, Geosci. Model Dev., 15, 715–730, https://doi.org/10.5194/gmd-15-715-2022, 2022 (data available at: https://gitlab.kit.edu/julian.quinting/elias-2.0.git, last access: December 2024). a, b, c, d
Quinting, J. F., Grams, C. M., Oertel, A., and Pickl, M.: EuLerian Identification of ascending AirStreams (ELIAS 2.0) in numerical weather prediction and climate models – Part 2: Model application to different datasets, Geosci. Model Dev., 15, 731–744, https://doi.org/10.5194/gmd-15-731-2022, 2022. a, b
Quinting, J. F., Grams, C. M., Chang, E. K.-M., Pfahl, S., and Wernli, H.: Warm conveyor belt activity over the Pacific: modulation by the Madden–Julian Oscillation and impact on tropical–extratropical teleconnections, Weather Clim. Dynam., 5, 65–85, https://doi.org/10.5194/wcd-5-65-2024, 2024. a, b
Raible, C. C., Ziv, B., Saaroni, H., and Wild, M.: Winter synoptic-scale variability over the Mediterranean Basin under future climate conditions as simulated by the ECHAM5, Clim. Dynam., 35, 473–488, https://doi.org/10.1007/s00382-009-0678-5, 2010. a
Rohrer, M., Brönnimann, S., Martius, O., Raible, C. C., Wild, M., and Compo, G. P.: Representation of extratropical cyclones, blocking anticyclones, and Alpine circulation types in multiple reanalyses and model simulations, J. Climate, 31, 3009–3031, https://doi.org/10.1175/JCLI-D-17-0350.1, 2018. a
Rohrer, M., Brönnimann, S., Martius, O., Raible, C. C., and Wild, M.: Decadal variations of blocking and storm tracks in centennial reanalyses, Tellus A, 71, 1586236, https://doi.org/10.1080/16000870.2019.1586236, 2019. a
Scaife, A. A., Copsey, D., Gordon, C., Harris, C., Hinton, T., Keeley, S., O'Neill, A., Roberts, M., and Williams, K.: Improved Atlantic winter blocking in a climate model, Geophys. Res. Lett., 38, 23, https://doi.org/10.1029/2011GL049573, 2011. a, b, c
Schemm, S.: Toward Eliminating the Decades-Old “Too Zonal and Too Equatorward” Storm-Track Bias in Climate Models, J. Adv. Model. Earth Syst., 15, e2022MS003482, https://doi.org/10.1029/2022MS003482, 2023. a
Scherrer, S. C., Croci-Maspoli, M., Schwierz, C., and Appenzeller, C.: Two-dimensional indices of atmospheric blocking and their statistical relationship with winter climate patterns in the Euro-Atlantic region, Int. J. Climatol., 26, 233–249, https://doi.org/10.1002/joc.1250, 2006. a
Schielicke, L. and Pfahl, S.: European heatwaves in present and future climate simulations: a Lagrangian analysis, Weather Clim. Dynam., 3, 1439–1459, https://doi.org/10.5194/wcd-3-1439-2022, 2022. a
Schiemann, R., Demory, M.-E., Shaffrey, L. C., Strachan, J., Vidale, P. L., Mizielinski, M. S., Roberts, M. J., Matsueda, M., Wehner, M. F., and Jung, T.: The resolution sensitivity of Northern Hemisphere blocking in four 25-km atmospheric global circulation models, J. Climate, 30, 337–358, https://doi.org/10.1175/JCLI-D-16-0100.1, 2017. a, b
Schiemann, R., Athanasiadis, P., Barriopedro, D., Doblas-Reyes, F., Lohmann, K., Roberts, M. J., Sein, D. V., Roberts, C. D., Terray, L., and Vidale, P. L.: Northern Hemisphere blocking simulation in current climate models: evaluating progress from the Climate Model Intercomparison Project Phase 5 to 6 and sensitivity to resolution, Weather Clim. Dynam., 1, 277–292, https://doi.org/10.5194/wcd-1-277-2020, 2020. a, b, c
Shutts, G. J.: The propagation of eddies in diffluent jetstreams: Eddy vorticity forcing of “blocking” flow fields, Q. J. Roy. Meteorol. Soc., 109, 737–761, https://doi.org/10.1002/qj.49710946204, 1983. a, b
Sprenger, M. and Wernli, H.: The LAGRANTO Lagrangian analysis tool – version 2.0, Geosci. Model Dev., 8, 2569–2586, https://doi.org/10.5194/gmd-8-2569-2015, 2015. a
Steinfeld, D. and Pfahl, S.: The role of latent heating in atmospheric blocking dynamics: a global climatology, Clim. Dynam., 53, 6159–6180, https://doi.org/10.1007/s00382-019-04919-6, 2019. a, b, c, d, e
Steinfeld, D., Boettcher, M., Forbes, R., and Pfahl, S.: The sensitivity of atmospheric blocking to upstream latent heating – numerical experiments, Weather Clim. Dynam., 1, 405–426, https://doi.org/10.5194/wcd-1-405-2020, 2020. a, b, c
Strong, C. and Magnusdottir, G.: Tropospheric Rossby wave breaking and the NAO/NAM, J. Atmos. Sci., 65, 2861–2876, https://doi.org/10.1175/2008JAS2632.1, 2008. a, b
Swanson, K.: Upper-tropospheric potential vorticity fluctuations and the dynamical relevance of the time mean, J. Atmos. Sci., 58, 1815–1826, https://doi.org/10.1175/1520-0469(2001)058<1815:UTPVFA>2.0.CO;2, 2001. a, b
Tibaldi, S. and Molteni, F.: On the operational predictability of blocking, Tellus A, 42, 343–365, https://doi.org/10.3402/tellusa.v42i3.11882, 1990. a
Trenberth, K. E.: An assessment of the impact of transient eddies on the zonal flow during a blocking episode using localized Eliassen-Palm flux diagnostics, J. Atmos. Sci., 43, 2070–2087, https://doi.org/10.1175/1520-0469(1986)043<2070:AAOTIO>2.0.CO;2, 1986. a, b
Trevisiol, A., Gilli, L., and Faggian, P.: Short and long-term projections of Rossby wave packets and blocking events with particular attention to the northern hemisphere, Global Planet. Change, 209, 103750, https://doi.org/10.1016/j.gloplacha.2022.103750, 2022. a, b
Wandel, J., Quinting, J. F., and Grams, C. M.: Toward a Systematic Evaluation of Warm Conveyor Belts in Numerical Weather Prediction and Climate Models. Part II: Verification of Operational Reforecasts, J. Atmos. Sci., 78, 3965–3982, https://doi.org/10.1175/JAS-D-20-0385.1, 2021. a
Wenta, M., Grams, C. M., Papritz, L., and Federer, M.: Linking Gulf Stream air–sea interactions to the exceptional blocking episode in February 2019: a Lagrangian perspective, Weather Clim. Dynam., 5, 181–209, https://doi.org/10.5194/wcd-5-181-2024, 2024. a
Wernli, B. H. and Davies, H. C.: A Lagrangian-based analysis of extratropical cyclones. I: The method and some applications, Q. J. Roy. Meteorol. Soc., 123, 467–489, https://doi.org/10.1002/qj.49712353811, 1997. a
White, R. H., Anderson, S., Booth, J. F., Braich, G., Draeger, C., Fei, C., Harley, C. D., Henderson, S. B., Jakob, M., Lau, C.-A., Admasu L. M., Narinesingh, V., Rodell, C., Roocroft, E., Weinberger, K. R., and West, G.: The unprecedented Pacific Northwest heatwave of June 2021, Nat. Commun., 14, 727, https://doi.org/10.1038/s41467-023-36289-3, 2023. a
Wirth, V., Riemer, M., Chang, E. K., and Martius, O.: Rossby wave packets on the midlatitude waveguide – A review, Mon. Weather Rev., 146, 1965–2001, https://doi.org/10.1175/MWR-D-16-0483.1, 2018. a, b, c
Woollings, T., Barriopedro, D., Methven, J., Son, S.-W., Martius, O., Harvey, B., Sillmann, J., Lupo, A. R., and Seneviratne, S.: Blocking and its response to climate change, Curr. Clim. Change Rep., 4, 287–300, https://doi.org/10.1007/s40641-018-0108-z, 2018. a, b, c, d, e, f, g, h
Zappa, G., Shaffrey, L. C., Hodges, K. I., Sansom, P. G., and Stephenson, D. B.: A multimodel assessment of future projections of North Atlantic and European extratropical cyclones in the CMIP5 climate models, J. Climate, 26, 5846–5862, https://doi.org/10.1175/JCLI-D-12-00573.1, 2013. a
Zappa, G., Masato, G., Shaffrey, L., Woollings, T., and Hodges, K.: Linking Northern Hemisphere blocking and storm track biases in the CMIP5 climate models, Geophys. Res. Lett., 41, 135–139, https://doi.org/10.1002/2013GL058480, 2014. a