the Creative Commons Attribution 4.0 License.
the Creative Commons Attribution 4.0 License.
 | 04 Jun 2025
Saharan warm-air intrusions in the western Mediterranean: identification, impacts on temperature extremes, and large-scale mechanisms
Matias Olmo
Diego Campos
Raül Marcos-Matamoros
Lluís Palma
Ángel G. Muñoz
Francisco J. Doblas-Reyes
Saharan warm intrusions are air masses that develop over the Sahara and that can be advected into surrounding areas, creating anomalous atmospheric conditions in those regions. This paper focuses on the characteristics of these intrusions into the western Mediterranean (WMed) region and their relationship with extreme temperatures in the neighbouring areas during the recent past (1959–2022). We describe and evaluate a methodology to identify Saharan air masses throughout the year, and, consequently, a historical catalogue of intrusion events that reach the WMed is built. To identify which large-scale phenomena might be relevant for the formation of the intrusions, we first identify different intrusion types (ITs) through a clustering procedure. Different ITs are found for the four seasons, which discriminate between the intrusions according to their longitudinal position over the Mediterranean region and their intensity. Upper-tropospheric anomalies are linked to the onset of these events, in particular an anomalous geopotential high over the intrusion region that slows down the upper-tropospheric circulation over northern Africa. These events are very relevant as they impact extreme temperatures throughout the year and account for a high percentage of the extreme-temperature events recorded in the WMed and neighbouring regions in summer.
- Article
(11533 KB) - Full-text XML
-
Supplement
(5590 KB) - BibTeX
- EndNote


Numerous studies discussing the Mediterranean climate have underscored important historical and projected changes in temperature, precipitation, and their extremes (Lionello and Scarascia, 2018; Giorgi, 2006; Michaelides et al., 2018; Cos et al., 2022; Olmo et al., 2024), with significant impacts on ecosystems, economies, and humans (Seager et al., 2019; Cherif et al., 2020; Cramer et al., 2018). In the context of climate change, it is crucial to develop robust methods for estimating the future state of the Mediterranean climate. Confidence in model projections depends on, among other things, our understanding of the physical mechanisms driving the observed climate (Barriopedro et al., 2023). To interpret both observational data and climate model simulations effectively, researchers have worked to unravel the physical processes that shape climate patterns. In the case of the Mediterranean, some studies have focused on the drivers behind the mean state of temperature and precipitation (Tuel and Eltahir, 2020; Brogli et al., 2019; Bladé et al., 2012), while others have explored the mechanisms behind climatic impact drivers like heat waves and extremes, analysing both large-scale circulation and interaction of climate modes of variability (Alvarez-Castro et al., 2018; Faranda et al., 2023; Horton et al., 2015; Muñoz et al., 2015, 2016, 2017) and local processes (Materia et al., 2022; Vogel et al., 2017; Urdiales-Flores et al., 2023; Nabat et al., 2015). Yet, some climate processes and phenomena require further investigation to improve our ability to predict, communicate, and adapt to present and future changes in the Mediterranean climate. Among those phenomena, intrusions of warm air masses from the Sahara that are advected northward (Sousa et al., 2019) have received particularly little attention.
There is a large body of literature on Saharan dust intrusions in the Mediterranean, which is very relevant for air quality and human health. However, the climatological properties of the intrusions of warm air, which might be accompanied, or not, by Saharan dust, are not well known. This is in spite of indications by authors like Sousa et al. (2019), who suggested that warm-air intrusions from the Sahara can be a driver of heat waves in the Iberian Peninsula. In the broader Euro-Mediterranean region, several studies have used different approaches to better understand the provenance and evolution of air masses that end up producing extreme temperatures at certain locations, through case studies (Rousi et al., 2023; Hotz et al., 2024; Mayer and Wirth, 2025) and analysis of extreme-temperature-event catalogues (Santos et al., 2015; Zschenderlein et al., 2019). While some of the results indicate that air is advected from the Sahara in some of the events, there is no specific study that attempts to generalize the effects of Saharan warm-air intrusions. Some work exists for summer intrusions (Sousa et al., 2019; Galvin, 2016), although here we aim to generalize the definition for a whole year. Further work is required to obtain a wider picture of what a Saharan warm-air intrusion is and what its implications are for the broader western Mediterranean temperature extremes. We aim to widen the scope of Saharan intrusion studies by focusing primarily on temperature rather than on the far more studied dust storm and transport phenomenon (Cuevas-Agulló et al., 2023).
Several works have indicated that southerly flow from Africa might play a role in Euro-Mediterranean temperatures. Sousa et al. (2019) studied the impact that past intrusion events have on heat waves in the Iberian Peninsula, Pereira et al. (2005) demonstrated the effect that advection from northern Africa can have on forest fires in Portugal, Santos et al. (2015) suggested that an anticyclonic circulation over northwestern Africa generates extremely high temperatures in the Iberian Peninsula, and Zschenderlein et al. (2019) showed how air masses in Africa can be linked to extreme temperatures in the central Mediterranean, among others (Sousa et al., 2018; Rousi et al., 2023). These studies led us to question the impact of Saharan warm-air intrusions on the generation of extreme-temperature days, their contribution to such events, and the spatial extent of their area of impact. Moreover, from a large-scale perspective, the question of what synoptic configurations lead specifically to Saharan warm-air intrusions emerges. We argue that, apart from describing their climatological characteristics, it is important to link Saharan warm-air intrusions both to the impact they have on temperature and to the larger-scale circulation that is associated with their onset.
In order to better understand the phenomenon and its processes from a climatological point of view, an objective identification algorithm for these masses is required. The algorithm would allow us to build a historical catalogue of events that can be used to gain insight into the phenomenon, its impacts, and its characteristics. Moreover, this identification and assessment framework should be easily applicable to climate model simulations to evaluate the model's ability to reproduce intrusions. This could potentially contribute to the implementation of process-based constraints in climate models (Palmer et al., 2023; Regayre et al., 2023; Fasullo and Trenberth, 2012). To identify Saharan warm-air intrusions, we focus on the thermodynamic properties that define air masses formed in low-latitude subtropical desertic areas.
This study has four objectives with regard to Saharan warm-air intrusions into the western Mediterranean (WMed henceforth) during the recent historical period (1959–2022):
- a.
Generalize the definition of a Saharan warm-air intrusion.
- b.
Describe the characteristics of the intrusions, namely spatial distribution, seasonality, and trends.
- c.
Assess the impact and contribution of the intrusions regarding extreme temperatures in the Euro-Mediterranean region.
- d.
Study which large-scale phenomena may play a predominant role in the development of Saharan warm-air intrusions.
The paper, after presenting the data used for the analyses in Sect. 2, presents a series of sections that establish the criteria to identify and assess Saharan intrusions in the WMed in the historical period. The structure is as follows: Sect. 3 describes a methodology to identify Saharan air masses, Sect. 4 assesses the differences between intrusions and defines different intrusion types through a clustering algorithm, Sect. 5 illustrates different characteristics of the intrusions and their relationship with extreme temperatures in the Euro-Mediterranean region, Sect. 6 proposes links between the large-scale circulation and the Saharan warm-air intrusions, and Sect. 7 presents the discussion and conclusions of the study.
In this study, we use both surface and pressure-level observationally based data in the historical period at a daily resolution. We employ daily means from 1-hourly data of the ERA5 reanalysis from the years 1959 to 2022 at 0.25° × 0.25° resolution (Hersbach et al., 2020). The variables used to define and identify Saharan warm-air intrusions are air temperature at 925 and 700 hPa and geopotential height at 1000 and 500 hPa. Composites of the intrusion days are computed for geopotential height and wind speeds at different levels (850, 300, and 500 hPa, with 500 hPa not shown). Daily maximum surface temperature (TX) is used to identify the relationship between Saharan warm-air intrusion events in the WMed (35–44° N, 10° W, 20° E) and extreme temperatures in the Euro-Mediterranean region (30–70° N, 20° W, 50° E). In the assessment of TX and its links with Saharan warm-air intrusions, we also use daily mean station data from the European Climate Assessment & Dataset (ECA&D) project (Klein Tank et al., 2002). Table S1 in the Supplement shows the stations considered in the current work, following the criteria that they be representative of the Euro-Mediterranean domain and have data coverage from 1 January 1959 to 31 December 2022 (see Table S1).
First we define some indicators used to detect Saharan air masses. We adapt the definition of Sousa et al. (2019), which takes into account both the temperature and the vertical homogeneity of a column of warm air characteristic of the latitude and surface radiative balance in the Saharan region (Webster, 2020), defined as the 18 to 30° N and 9° W to 29° E box. Two indicators can inform us about these air mass characteristics: the geopotential thickness between levels 1000 and 500 hPa (ΔZ500–1000, henceforth) defined in Eq. (1) and the average potential temperature between levels 925 and 700 hPa () defined in Eq. (2). Note that the latter is conserved in adiabatic heat exchanges and is therefore a good complement to the former. From Sousa et al. (2019), Galvin (2016), and Webster (2020), the summer (June–August) thresholds are suggested to be around 5300 m and 40 °C, respectively, which are based on the climatological mean summer values of air masses of Saharan origin:
where
and
where θi is the potential temperature at the pressure level i (in hPa), T is the temperature, p is the pressure, Rd is the gas constant of dry air, cp is the specific heat at constant pressure, and Zi is the geopotential height at pressure level i.
To validate the pressure levels used in the two indicators, we visualize the vertical profiles of the climatological Sahara and WMed, θ and ΔZ (see Figs. S1 and S2 in the Supplement). A distinction can be made between the θ vertical profiles in the warm and cold months, as becomes closer to 0 between levels ∼ 925–700 hPa during the warmer season (April–October). During the cold months, although the θ magnitudes between the WMed and the Sahara are still distinct, the θ lapse rates are similar. Therefore we keep the levels between 925 and 700 hPa for throughout the cold months but argue that the choice of levels could be more flexible. In terms of the levels defining ΔZ, we part from the knowledge that the relevant tropospheric variations at daily scale happen from ∼ 500 hPa to the surface (Holton and Hakim, 2013). Then we analyse the ΔZ climograms for the Saharan and WMed regions (see Fig. S2) and find that ΔZ between 500 and 1000 hPa presents a good distinction between the regions and a defined seasonal variability. Sensitivity studies with respect to the suggested levels are presented in the following paragraphs, after the identification algorithm is explained.
By conducting a study of the monthly climatologies of the two indicators defined in Eqs. (1) and (2), we find that the air masses over the Sahara behave differently in the warm and cold months (see Fig. S3). The indicators in the Sahara region during the warm months have distinct (maximum) values compared to any surrounding region (the Atlantic, the Mediterranean, and the equatorial band show lower values). During the cold season, the climatological ΔZ500–1000 and are not as distinct in the Saharan region but rather have an almost-constant latitudinal gradient in the longitudinal band 15–35°N, 30° W–50° E (e.g. in winter, the eastern Atlantic at the same latitudes as the Sahara has comparable and ΔZ500–1000 values). We argue that the weaker radiative forcing in the cold months and the shorter days do not allow the desert areas to heat the troposphere above them as notably as in the warm months; however, the indicator magnitudes over the Sahara are still distinct from those in the WMed region.
The red box in Fig. 1 represents the Sahara, which leads to climatologies close to those defined by other studies (Galvin, 2016; Sousa et al., 2019; Webster, 2020). Figure S4 shows the pool of data from all points within the Sahara and WMed (defined as the blue box in Fig. 1; 35–44° N, 10° W, 20° E) for all days between 1959 and 2022, which indicates the monthly historical values of the indicators in each region and shows how far away they are from each other. In Fig. S4 we see that the monthly mean Saharan air mass, represented by the mean ΔZ500–1000 and (red lines), is an extreme in the WMed distribution.
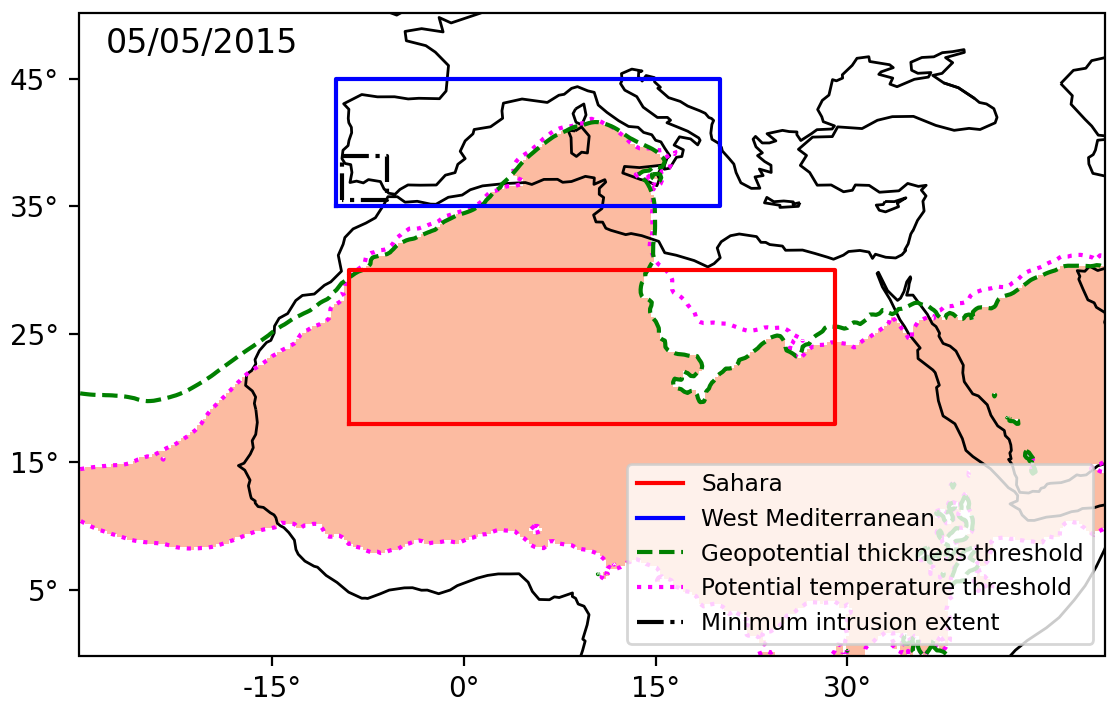
Figure 1The map shows the intrusion situation on 5 May 2015, when a Saharan air mass entered along the western boundary of the WMed. The WMed (blue; 35–44° N, 10° W, 20° E) and the Saharan regions (red; 18–30° N, 9° W, 29° E) used to compute the thresholds are enclosed by boxes. The green (dashed) and fuchsia (dotted) lines are the boundaries of the region where the geopotential thickness between 1000–500 hPa and average potential temperature between 925–700 hPa, respectively, satisfy the criteria for the air mass to be considered a Saharan air mass. The orange-shaded region is the area where the two thresholds are met simultaneously. The dot-dash black box illustrates the 5 % of the WMed area that is the minimum area inside the WMed that must be under Saharan air conditions for a day to be considered an intrusion day. This 5 % area can be located anywhere and in any shape within the WMed; the box is just to give an idea of its magnitude in the context of the relevant regions.
As we aim to identify Saharan air masses for other seasons beyond the summer and we want to take into account the seasonal cycle of the indicators, we find daily thresholds for ΔZ500–1000 and by computing their climatology over the Saharan region for each 31 d rolling window of the year. Different lengths of rolling windows (from 15 d to 3 months) were studied (not shown), and the results are sensitive to this length. The choice of 15 d was very restrictive, while 3 months was too permissive. After exploring the results, we chose a 31 d rolling mean, which, although arbitrary, is an educated guess from observing the captured events.
An example of a Saharan warm-air intrusion day in May of 2015, with thresholds indicated in dashed green and fuchsia lines, is shown in Fig. 1. When a grid cell exceeds both threshold values, the area is shaded in orange to represent a Saharan air mass. The rolling thresholds vary smoothly and allow for the identification of continuous events during the year. To classify any day as an intrusion day, the Saharan air mass (orange shading in Fig. 1) must cover a sufficiently large area within the WMed, which is taken to be 5 % of the region. The dashed black box in Fig. 1 is a representation of how much 5 % of the WMed is, but note that it can take any shape.
The sensitivity to the levels used to define the indicator thresholds is evaluated for the lower bounds of the geopotential thickness (ΔZ500–1000 and ΔZ500–850) and mean potential temperature ( and ). In general, using a higher lower-level potential temperature bound leads to more and long-lasting events, and a higher lower-level geopotential bound leads to a very slight decrease (increase in JJA) in the number and length of the events. The increase in events due to taking 850 hPa potential temperature might be related to the diminished diabatic cooling of the air mass as the lower bound of the indicator is further away from the surface. Changes due to the lower bound of the thickness layer are less obvious, and we cannot provide a robust hypothesis for their changes. Although some changes appear in the number of days recorded as intrusions (not shown), the captured intrusions remain similar, and long events are always captured with some slight changes in the duration. If we study the impacts on extreme temperatures and the atmospheric circulation associated with intrusion events, the results and conclusions remain the same as the ones conveyed in the subsequent sections of this work.
During the aforementioned sensitivity studies (of the levels used for the indicators and the rolling-window climatologies), we performed a visual inspection of all the event days to help define the algorithm parameters and make sure that the detected events are not spurious air masses formed away from the Sahara. All Saharan warm-air intrusion events recorded with the algorithm represent continuous air masses that are displaced northward. It is noteworthy that, in line with the results obtained for the differing Saharan characteristics in the climatologies of the warm and cold months, intrusions are qualitatively different in May–October compared to in November–March. In general, during the warm months, narrow bands of Saharan air are advected northward, while in the cold months, intrusions tend to span a broader longitudinal band that moves in a wavelike pattern, with the crest of Saharan warm air reaching the WMed. Note that, as mentioned in previous paragraphs, in the cold months, warm-air advection might have mixed origins between the eastern Atlantic (below ∼ 30° N) and the Sahara but always with Saharan-like warm-air properties.
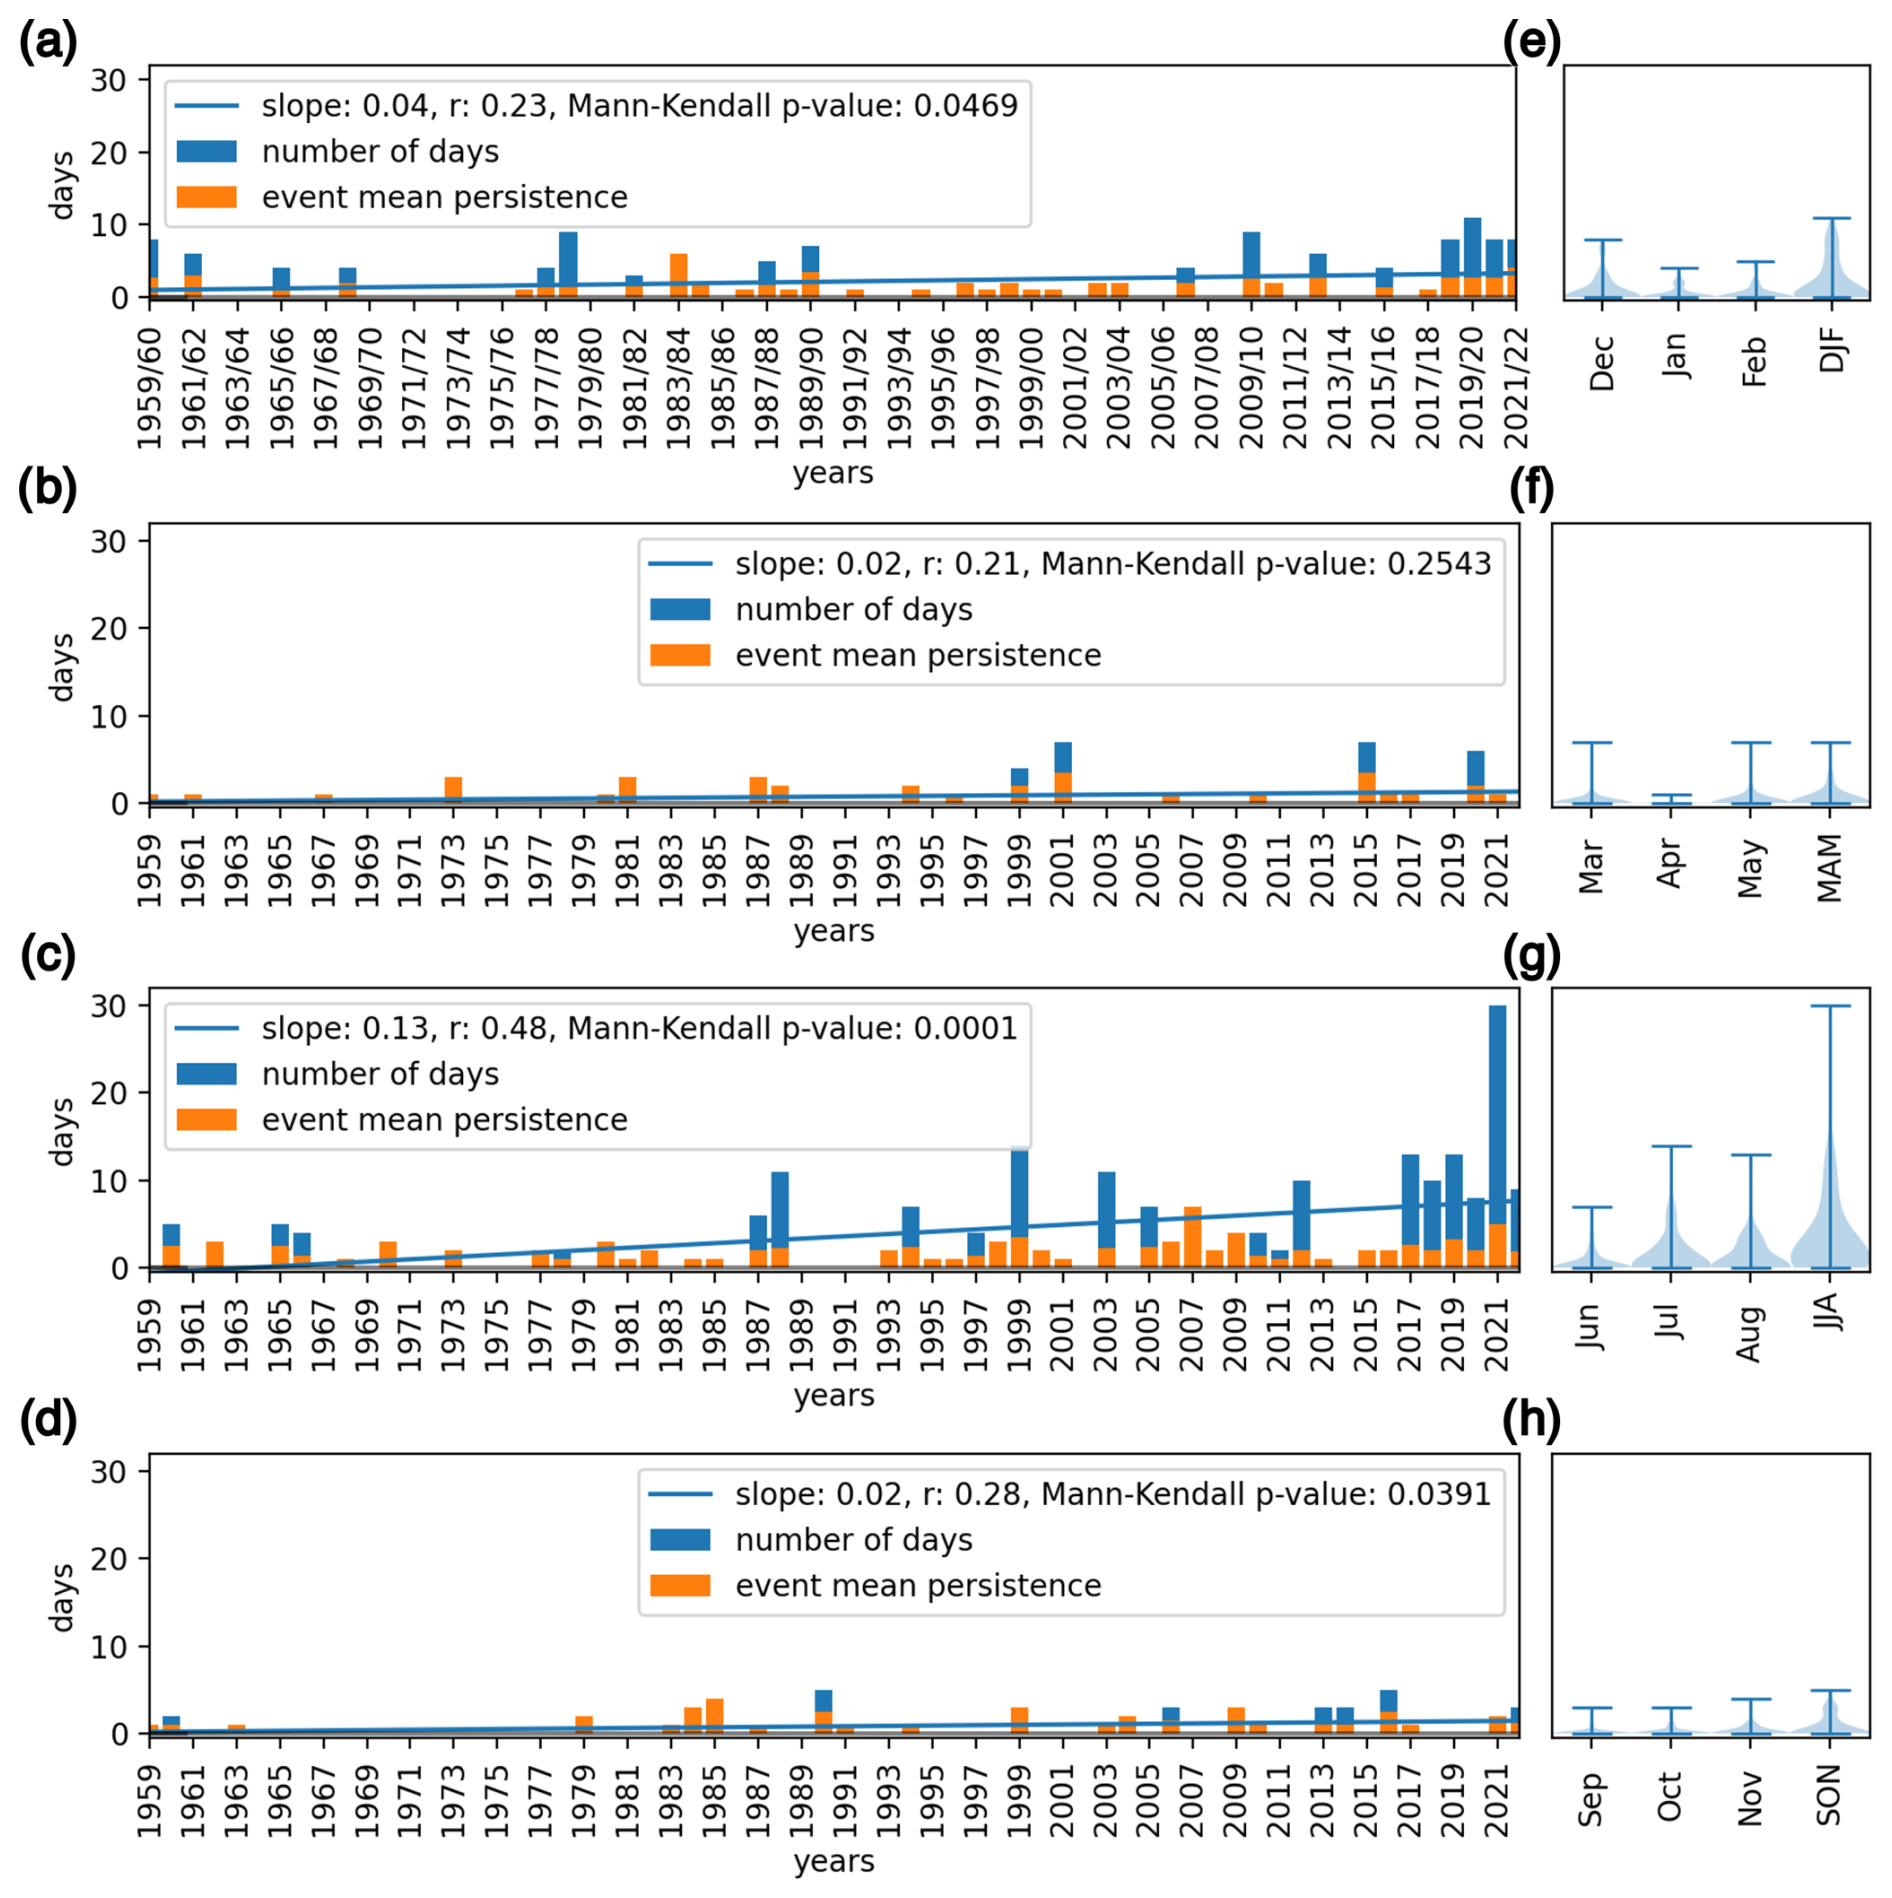
Figure 2Number of identified Saharan warm-air intrusions in (a) DJF, (b) MAM, (c) JJA, and (d) SON per year between 1959–2022 (blue bars). The mean duration of each intrusion event, from the first to the last continuous day, is shown with orange bars. Note that when a single event is recorded for a specific year, the blue and orange bars are the same size; therefore, only the orange bar is shown. A least squares linear regression fit to the seasonal number of intrusion days is shown in blue. Panels (e)–(h) show the violin plots containing the annual intrusion days for each month and season.
Through this identification algorithm, a catalogue (Fig. S5) is obtained for the 1959–2022 period. A synthesis of the catalogue is displayed in Fig. 2, where the yearly number of intrusion days per month and season can be seen (Fig. 2e–h), together with the full period's seasonally recorded intrusion days and mean event duration (Fig. 2a–d). Results show that the months with most of the intrusions are July, August, and December. There is also some activity during January–March and May–June. During early spring and autumn, the number of intrusions is reduced. In DJF, JJA, and SON, there is a statistically significantly positive trend in the number of intrusion days per year and season (blue bars in Fig. 2), with a 95 % confidence level, although it is only statistically significant for JJA when considering a 97.5 % confidence level. The orange bars in Fig. 2 show the mean persistence of the events, which is quite constant for all seasons.
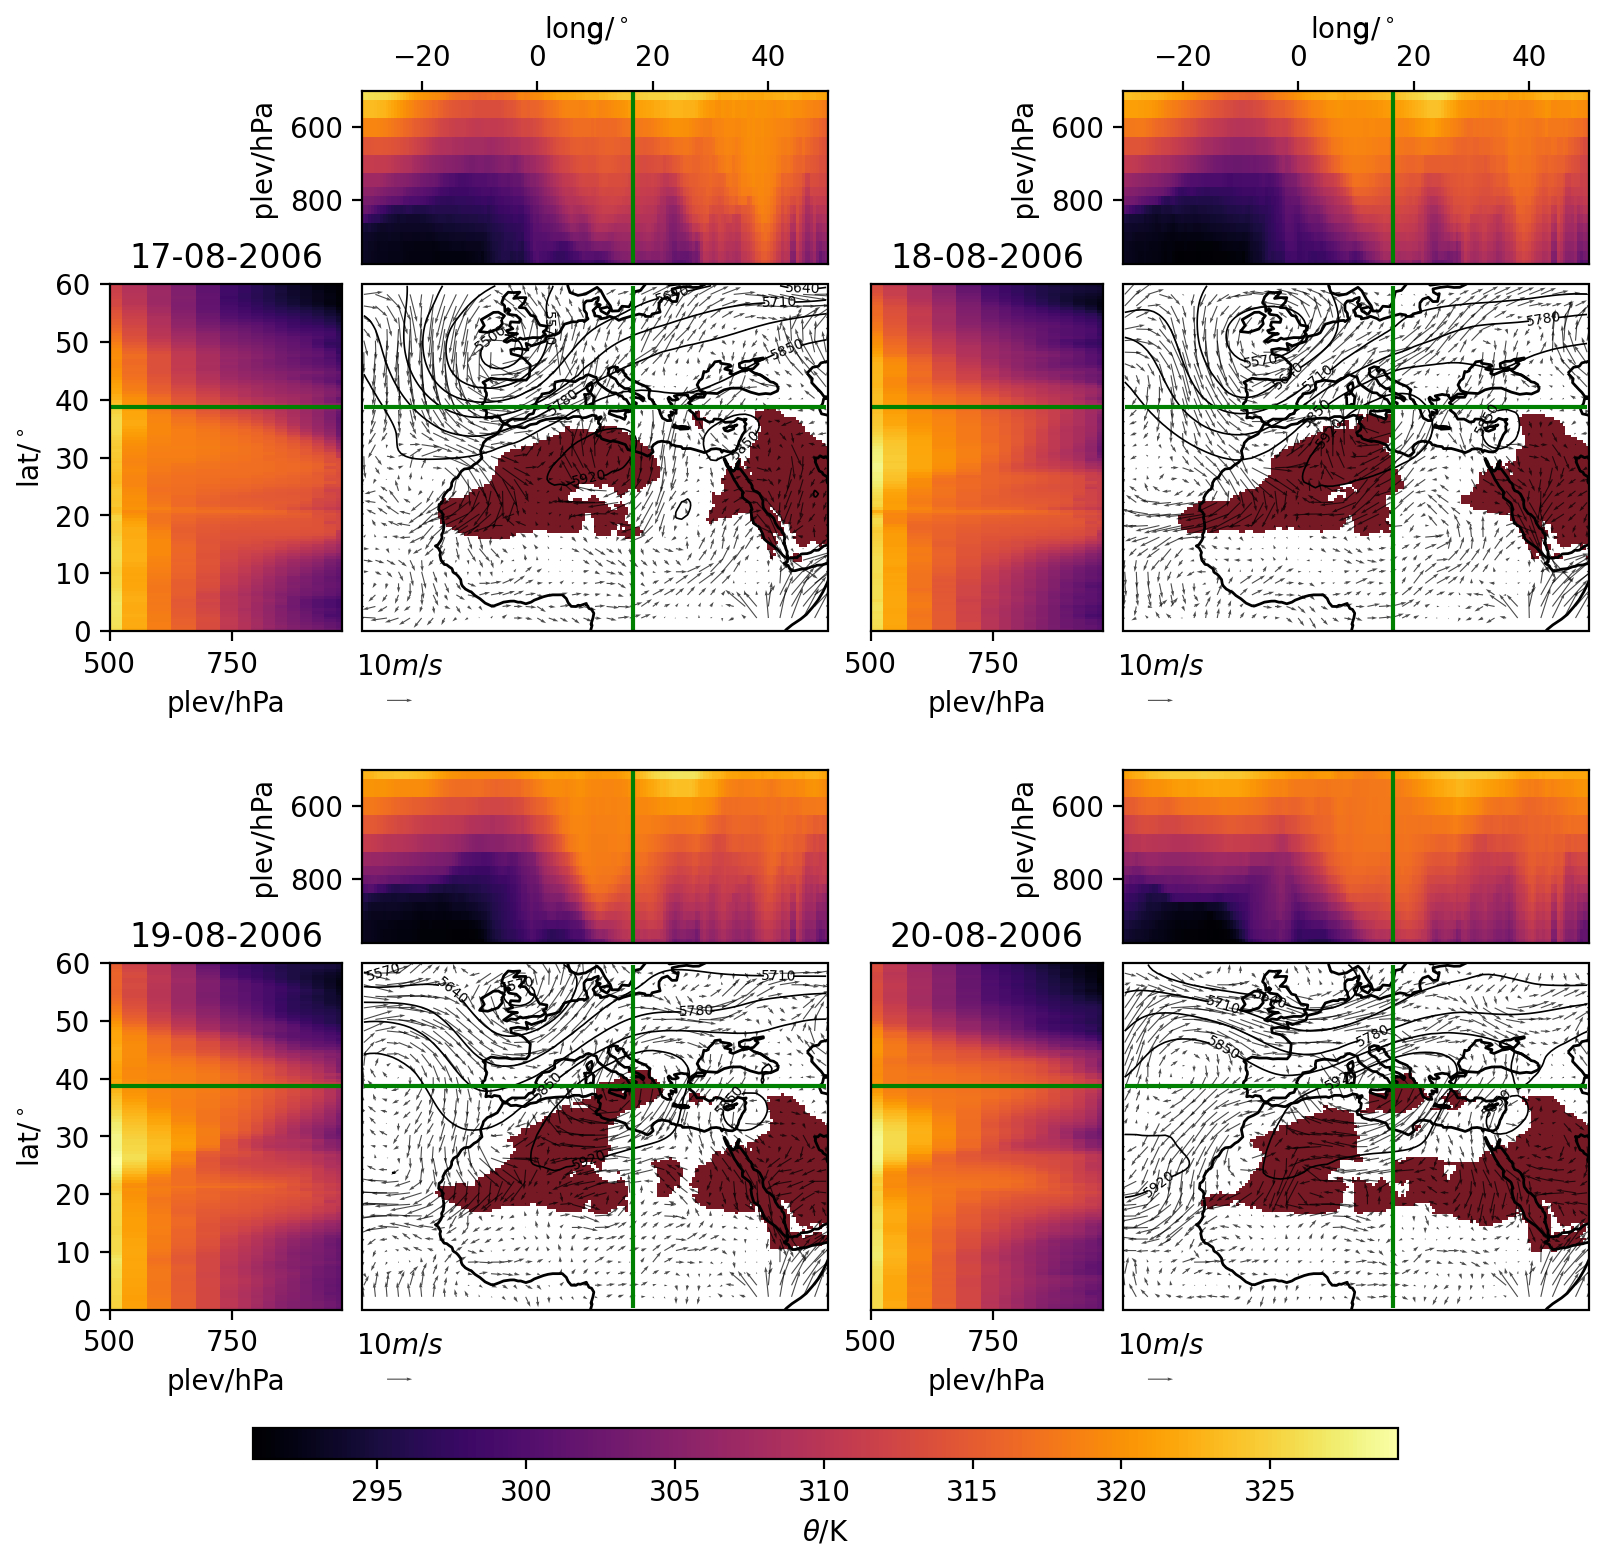
Figure 3Intrusion event observed during the days of 18–19 August 2006. The days before (17 August 2006) and after (20 August 2006) the event are also displayed to frame the intrusion in the synoptic configuration that occurred at the time. The air mass identified as Saharan is shaded in dark red, while the contours show the geopotential height at 500 hPa, and the arrows show the direction and magnitude of the wind at 850 hPa. The sub-panels to the left and top of the maps correspond to the vertical sections between pressure levels (plev) 975–500 hPa of potential temperature along the vertical and horizontal green lines.
We now focus on a particular event from this catalogue for a better understanding of the vertical properties of the Saharan air masses that move into the WMed. Figure 3 shows the daily mean fields and vertical sections during an event on 18–19 August 2006. From Fig. 3, we can see how a mass penetrates south of Sicily (37.5° N, 17° E), driven by an intense trough in the North Atlantic. The southern and southwestern winds on 17 August 2006 in the north of Tunisia result in a north-northeastward advection of the Saharan air mass. The vertical profiles of potential temperature show that the intruded mass has distinct features with respect to the surrounding areas. In the regions where Saharan air masses are identified, the vertical profiles show high potential temperatures, indicating that the mass comes from lower latitudes (or a region where it could warm up); the vertically homogeneous daily mean potential temperature in the latitudinal and longitudinal cross-section indicates the predominance of mixing by convection and diabatic heating. This agrees with the properties of air masses formed above desertic areas, where the surface longwave radiation can lead to convection, sensible heating, and a very warm and homogeneous air column (Webster, 2020). Note that the warm air mass seems to be tilted in the vertical but that it is not considered a Saharan air mass and does not have direct effects on the surface temperatures. We acknowledge that such a warm upper-troposphere air mass could have indirect effects on surface temperatures due to cloud formation and radiative effects, but analysing this falls out of the scope of the current work. The reader is referred to Figs. S6 and S7, which show two more events that also illustrate the properties of a Saharan air mass.
The visual inspection of individual events is informative but lacks some generalization to allow for a climatological study of the events. Therefore, we aim to classify the Saharan warm-air intrusions according to their different properties. The intrusions present local features that span smaller spatial scales than the whole WMed. This would suggest that different types of intrusions might exist depending on the area where they develop in the study region.
A clustering methodology is employed to make an initial classification of the different intrusions. To account for differences in the radiative forcing, atmospheric circulation, and thermodynamics in the Sahara during the year (as seen in Sect. 3), we apply a clustering analysis of the intrusion events in each meteorological season (DJF, MAM, JJA, and SON). Our approach inputs the ΔZ500–1000 and variables during intrusion days in the WMed region into a clustering procedure. The method is a combination of a reduction in the dimensionality via S-mode principal component analysis (99 % of the spatial variance is maintained) and the k-means clustering of the matrix of stacked indicators (Tencer et al., 2016; Muñoz et al., 2015, 2016, 2017; Olmo et al., 2024).
A sensitivity analysis is performed to determine the optimal number of clusters, using both the silhouette score (Rousseeuw, 1987) and the pseudo-F metric (Calinski and Harabasz, 1974). The silhouette score is calculated for each data sample based on the mean intra-cluster distance (the average distance within a cluster) and the mean nearest-cluster distance (the average distance to the nearest cluster). The pseudo-F score is computed by dividing the between-cluster sum of squares (which measures the dispersion between cluster centroids) by the within-cluster sum of squares (which measures the dispersion of data points within their assigned clusters). Together, these metrics provide insight into the clustering structure. However, neither metric indicates a clear optimal number of clusters, likely due to the high variability of the indicators during intrusion days. To address this issue, we prioritize relative maxima in the silhouette scores that coincide with an elbow in the pseudo-F curve, which allows us to synthesize the numbers of clusters (intrusion types, ITs) as much as possible. The resulting numbers of ITs are five for DJF, three for JJA, and four for MAM and SON (see Fig. S8). Each intrusion day is assigned to a centroid according to the Euclidean distance between the indicator fields of each day and the centroid.
Results obtained from clustering the intrusion days for and ΔZ500–1000 over the WMed show that the ITs can be distinguished by the location where the anomalously warm air mass is found and in its intensity (how big the anomaly magnitudes are). Figure 4 shows the ΔZ500–1000 and composites for the JJA ITs. They show a distribution between the western, central, and eastern WMed, and IT2 represents more intense intrusions (larger and ΔZ500–1000 positive anomalies). Figure S9 shows the rest of the seasons. MAM and SON display similar characteristics but divide the region into four longitudinal bands; the intensities and extent of the positive anomalies vary across ITs as well. DJF also has longitudinal separations, and, apart from displaying different intensities and extents, some latitudinal differences appear, suggesting that different ITs are also clustered in terms of how much they can move northward. We introduce the term “area of influence” of each IT as the green contours seen in Figs. 4 and S9, which are defined as the limit where intrusion events have been recorded for a specific season and IT.
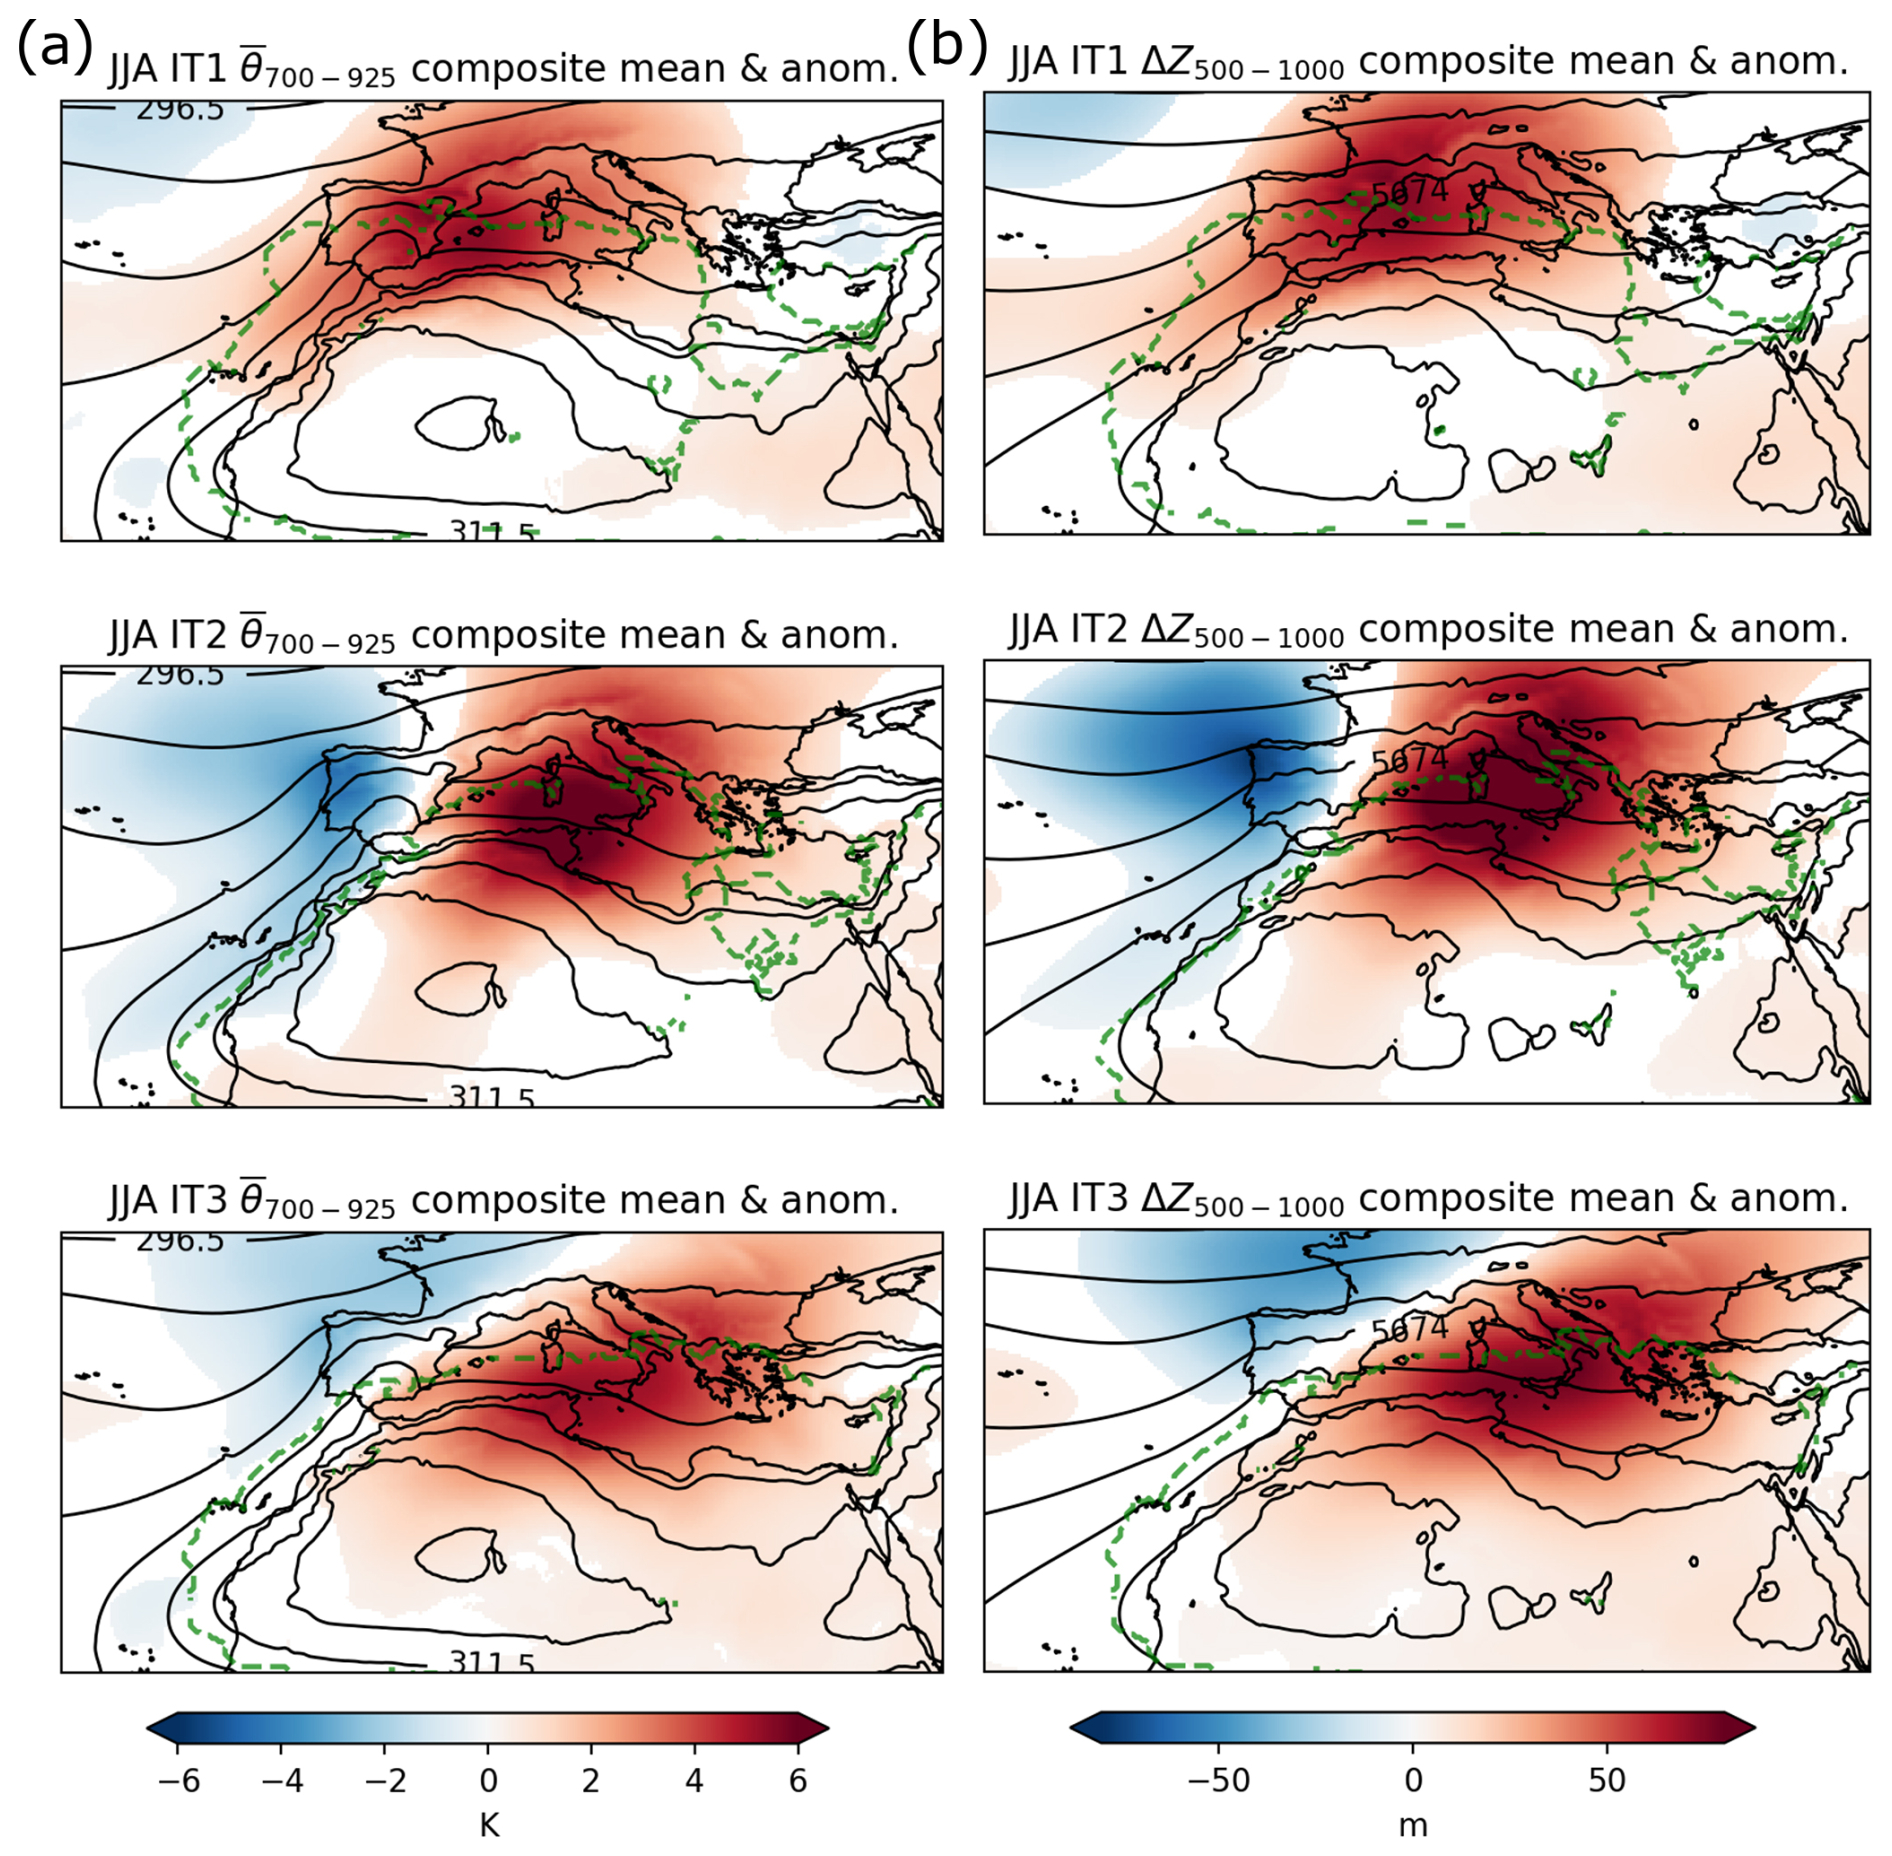
Figure 4Composites of the three June to August ITs of (a) and (b) ΔZ500–1000 anomalies with respect to the mean climatology of the days without intrusion. No values are shaded (white areas) where the anomaly is not significantly different from 0 according to Student's t test and a 95 % confidence level. The solid (black) contours display the climatological values of and ΔZ500–1000 from JJA days without intrusion. The area of influence is displayed with a green (dotted) contour and represents the limit where Saharan air masses have been recorded in the historical period for a specific IT.
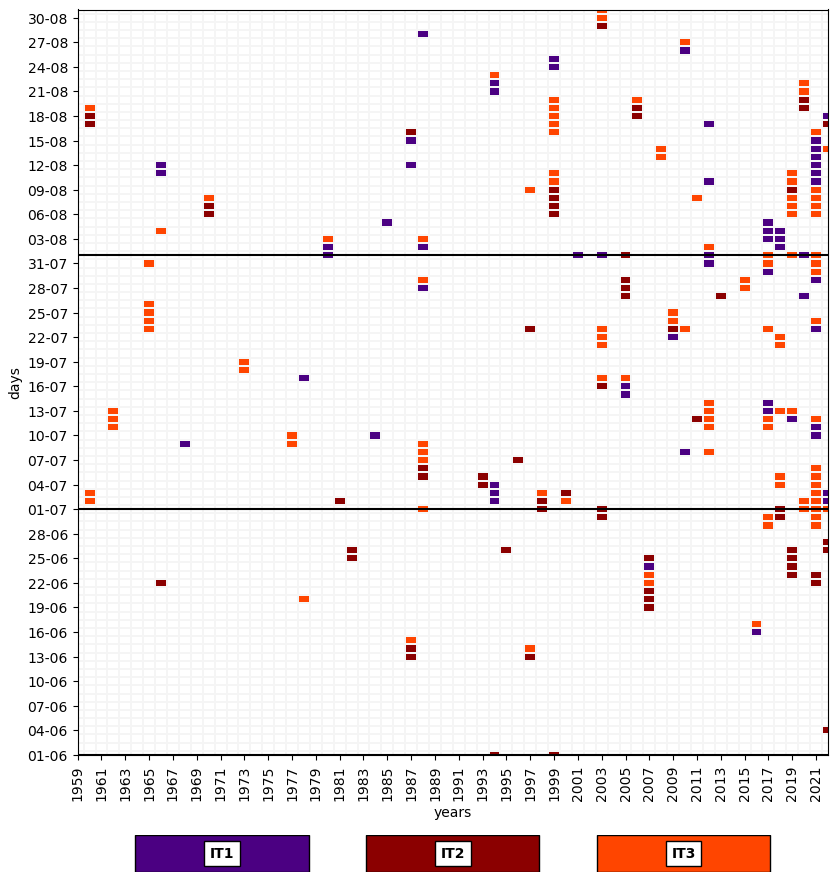
Figure 5Historical catalogue of intrusion days in the 1959–2022 period (x axis) and from 1 June to 30 August (JJA, y axis). The days identified as intrusions are coloured with their assigned IT. Black lines indicate the change in months.
Figure 5 shows the JJA intrusion days colour-coded according to the IT they belong to (see Fig. S10 for the other seasons). During persistent events, the IT can either remain constant or transition, meaning that the Saharan air mass can remain stationary in the IT area of influence or move towards other regions.
Transition probability heatmaps are computed given that intrusion days can shift from one IT to another (see Fig. S11). They provide information about the persistence or changes in the IT between one day and the next. ITs are generally persistent in JJA, although IT1 and IT2 can often transition to IT3. DJF shows very little persistence, and MAM and SON show mixed behaviours depending on the IT.
We want to take advantage of the separation of intrusion days into different ITs to see if there is any connection between Saharan warm-air intrusions and any of the relevant teleconnection indices in the Mediterranean region. There are many large-scale drivers that affect the climate of the WMed. Some drivers that may be of interest for assessing their link with the ITs are (i) the North Atlantic Oscillation (NAO) and its summer expression (SNAO), which are the leading modes of large-scale atmospheric variability in the North Atlantic and are defined by the pressure gradient between Iceland and Azores (Hurrell, 1995) and through principal component analysis of the summer mean sea-level pressure (Folland et al., 2009), respectively. The SNAO and especially the NAO have a direct effect on the position and strength of the subpolar jet and therefore affects the circulation, weather patterns, and different atmospheric variables in the Euro-Mediterranean (Hurrell, 1995; Folland et al., 2009; Bladé et al., 2012). (ii) The Western Mediterranean Oscillation (WeMO) is designed to consider the atmospheric dynamics of the WMed by taking the pressure gradient between the Gulf of Cádiz and the Po Plain (Martin-Vide and Lopez-Bustins, 2006). (iii) The Arctic Oscillation (AO) (Thompson and Wallace, 1998) is the hemispheric leading mode of variability from the surface to stratospheric levels (Dunkerton and Baldwin, 1999; Gerber et al., 2010), and it mainly drives the fluctuations in the subpolar jet. (iv) Atlantic Multi-decadal Variability (AMV; Deser et al., 2010) is the low-frequency fluctuation in the North Atlantic Sea observed in surface and subsurface variables. We use the definition of the Atlantic Multi-decadal Oscillation (AMO) to capture this low-frequency variability mode (Kerr, 2000; Klotzbach and Gray, 2008), which intends to distinguish itself from the NAO-influenced tripole pattern at interannual timescales (Enfield et al., 2001). It is defined as the detrended average anomalies of sea surface temperatures in the North Atlantic Basin (detrending is performed by subtracting the mean global SSTs). The AMO has been linked to Mediterranean temperature fluctuations (Mariotti and Dell'Aquila, 2012).
Kendall–tau (τ) correlations have been computed between the yearly intrusion days of every IT (labelled ID) and the aforementioned teleconnection indices. While the association values are low, statistically significant relationships at the 95 % level have been found for the Atlantic Multi-decadal Oscillation in summer, the Arctic Oscillation in winter, and the Western Mediterranean Oscillation in DJF as well. The results suggest that a warmer-than-usual North Atlantic could enhance the occurrence of Saharan warm-air intrusions in the central and western parts of the WMed during JJA. In DJF, having a negative AO (predominance of a low pressure in the northwestern WMed) is correlated with an enhanced number of intrusion events, and having a relatively high pressure in the southwestern part of the WMed with respect to the northeastern part of the WMed (positive WeMO) seems to also favour Saharan warm-air intrusions in DJF. The Kendall–tau correlation magnitudes are
-
,
-
,
-
,
-
.
In this section we focus on the broader Euro-Mediterranean (EM, henceforth) region and assess the influence of intrusions on extreme temperatures. We compute extreme-temperature days for the historical period at each grid cell, estimated as days that exceeded their daily maximum surface temperature 7 d rolling-window climatological 90th percentile (TX90p; Zhang et al., 2005; Wang et al., 2013). The same is done for station data from the ECA&D daily mean temperature dataset (see list of stations in Table S1). We aim to quantify the probability of encountering an extreme-temperature day in any region when a certain IT occurs. We define the impact on extreme temperatures for each IT and season in Eq. (3) as
where P(TX90p∣ITn intrusion day) is the probability of having an extreme-temperature day (TX90p) given that the day is also an intrusion day (i.e. the intrusion impact) from a specific IT (the n in ITn labels all possible ITs in each season).
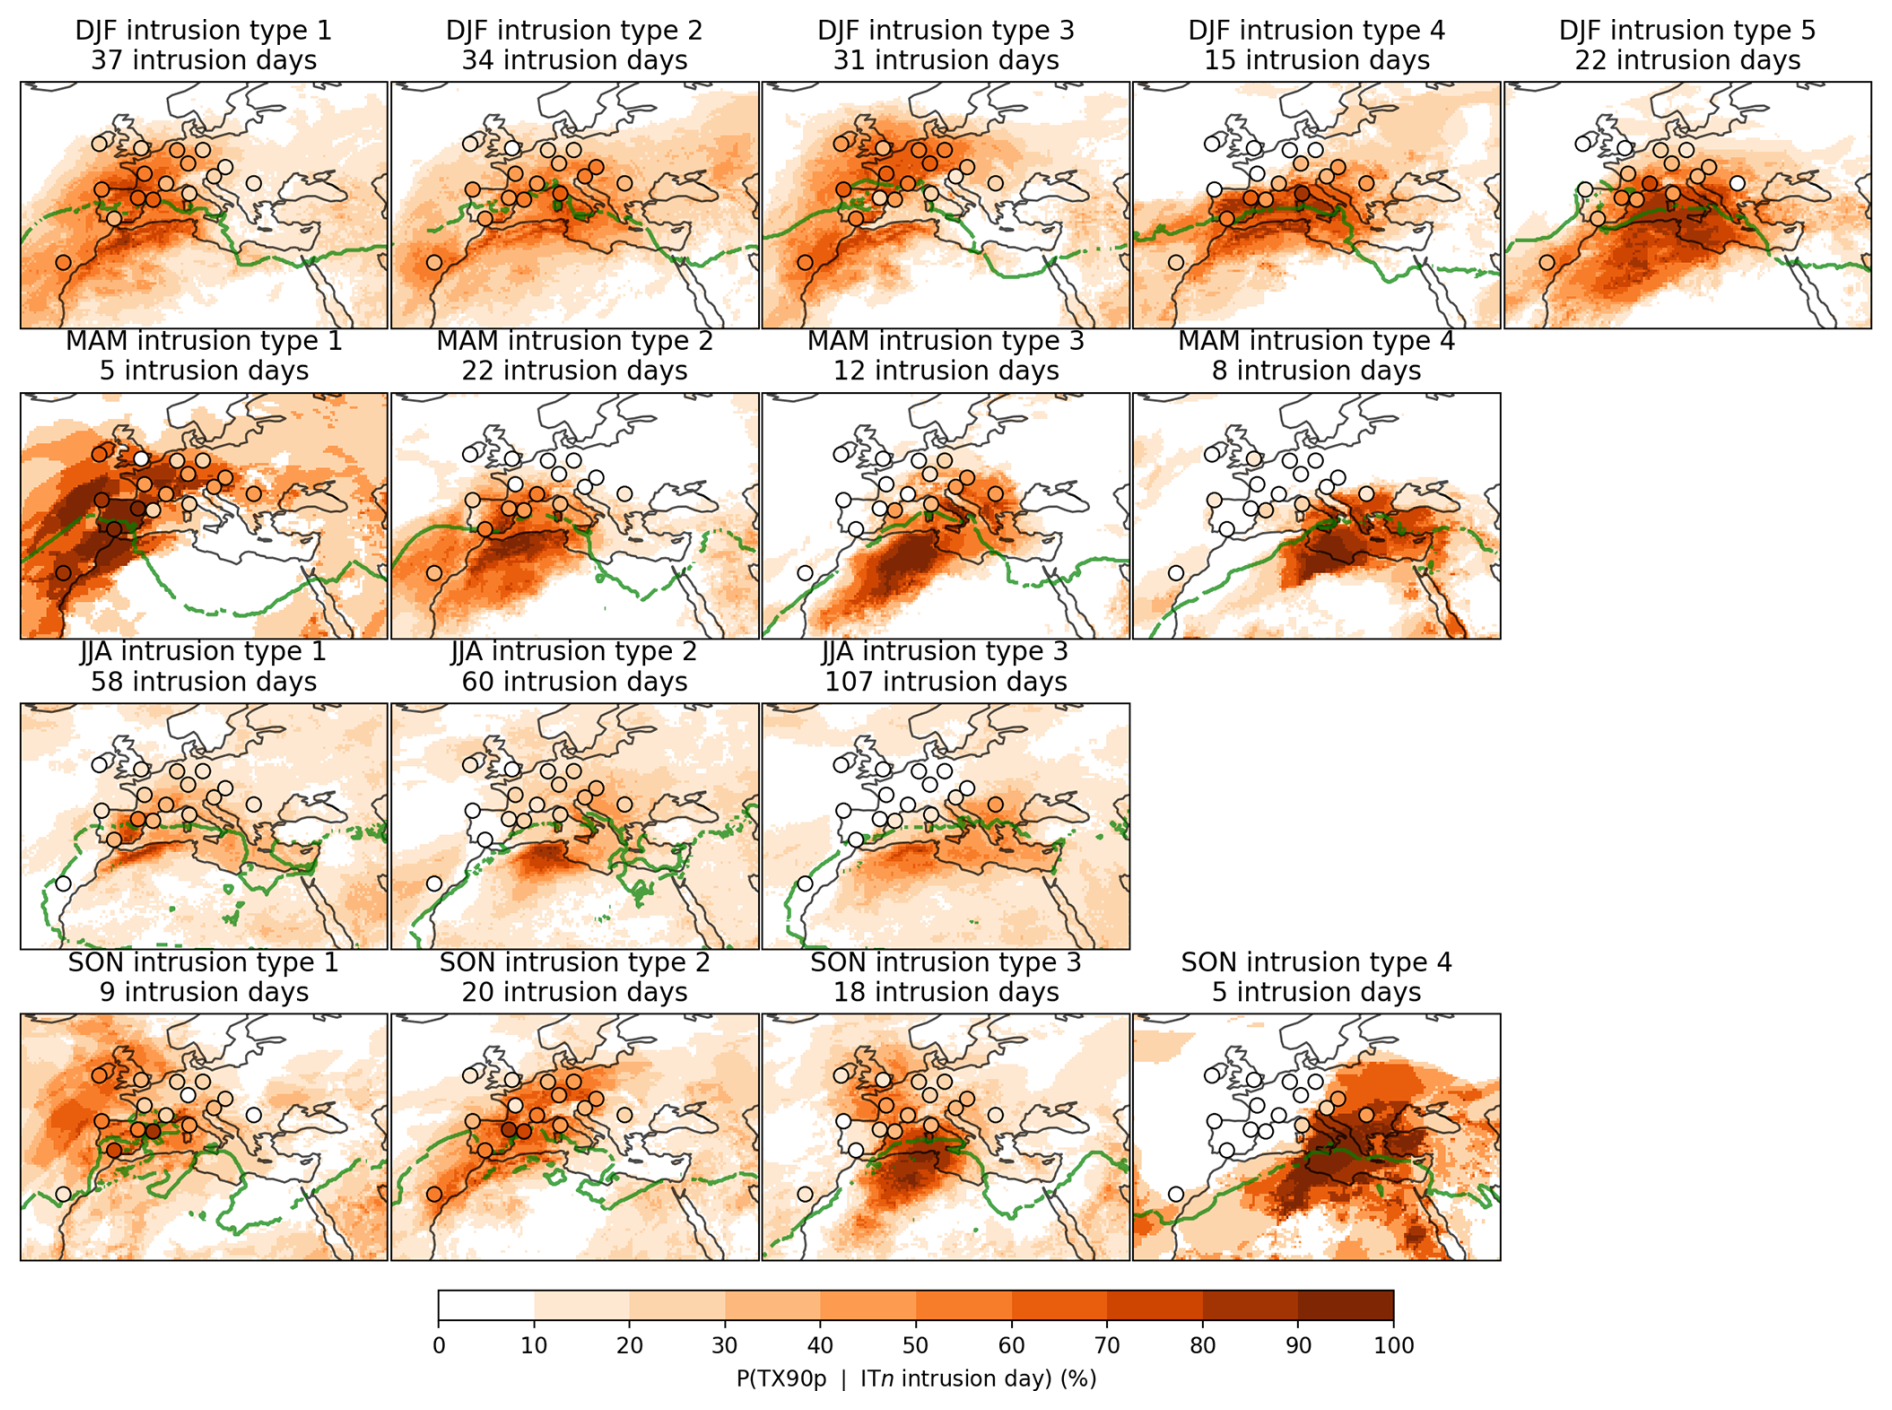
Figure 6Impact of the Saharan warm-air intrusions on extreme temperatures in the EM region for the different seasons (rows) and ITs (columns). The impact is measured as the percentage of intrusion days that coincide with an extreme-temperature day (TX90p). The number of intrusion days for each season and IT is specified in the title of each panel. Coloured dots are results from ECA&D station data (Table S1). The area of influence is displayed with a green contour and represents the limit where Saharan air masses have been recorded in the historical period for a specific IT.
The P(TX90p∣ITn intrusion day) of Saharan intrusions on extreme-temperature days in the EM has different spatial extents and probability magnitudes and depends on the season and IT (see Fig. 6). The results highlight the impact of the Saharan warm-air intrusions, which can reach probabilities from 60 % to 100 % in the area of influence. During DJF, MAM, and SON, Saharan intrusions can have a notable impact on regions beyond the WMed, meaning that intrusions have an effect outside the area of influence where intrusion days were recorded. Contrarily, during JJA, the impact is quite confined to the area of influence of each IT. To see if this can be due to the troposphere dynamics being slower in summer, we assess the results for the first and second days after the end of the intrusion events to check if the impact emerges after the events end (see Fig. S12 for the first day). There is some impact on extreme temperatures, although the impact is lower than during intrusion days. Moreover, the impacts after the events end are generally shifted eastward from the area of influence of each IT, in line with the climatological westerly circulation in the region. Therefore, Fig. S12 disproves that JJA intrusions might move slower and have an impact outside the area of influence in the days following an intrusion event. This result suggests that if JJA has no impact outside the area of influence, it is because Saharan warm-air intrusions and their impacts on extreme temperatures are simply more confined to the area of influence.
The station data are generally in agreement with ERA5 results, which gives us confidence in the reanalysis. Note that some of the results come from a small number of intrusions (each season and IT's number of intrusion days are provided in the top of each panel), and therefore probability results must be treated with care.
To quantify how the presence of an intrusion increases or decreases the risk of having TX90p days, we compute the risk ratio (Eq. 4) between the probability of having TX90p conditioned on having an ITn intrusion day versus the probability of having TX90p conditioned on being on any other day apart from the ITn intrusion day:
where the numerator is the impact, and the denominator is the probability of having an extreme event when the day is not an ITn day. The risk ratio is the ratio of how much more risk there is of having an extreme-temperature event if the day is an ITn intrusion day compared to if it is not. The risk ratio will be closer to 1 when the two probabilities are similar, and therefore the effect of the intrusion does not extend to the probability of having a TX90p day. When the risk ratio has values above 1, it means that having an extreme-temperature day is more probable when an intrusion is present. A risk ratio under 1 means that having an extreme-temperature day is more probable on non-intrusion days. Values above 10 suggest a strong difference in the occurrence of TX90p between having or not having an ITn intrusion day (Ellison, 1996).
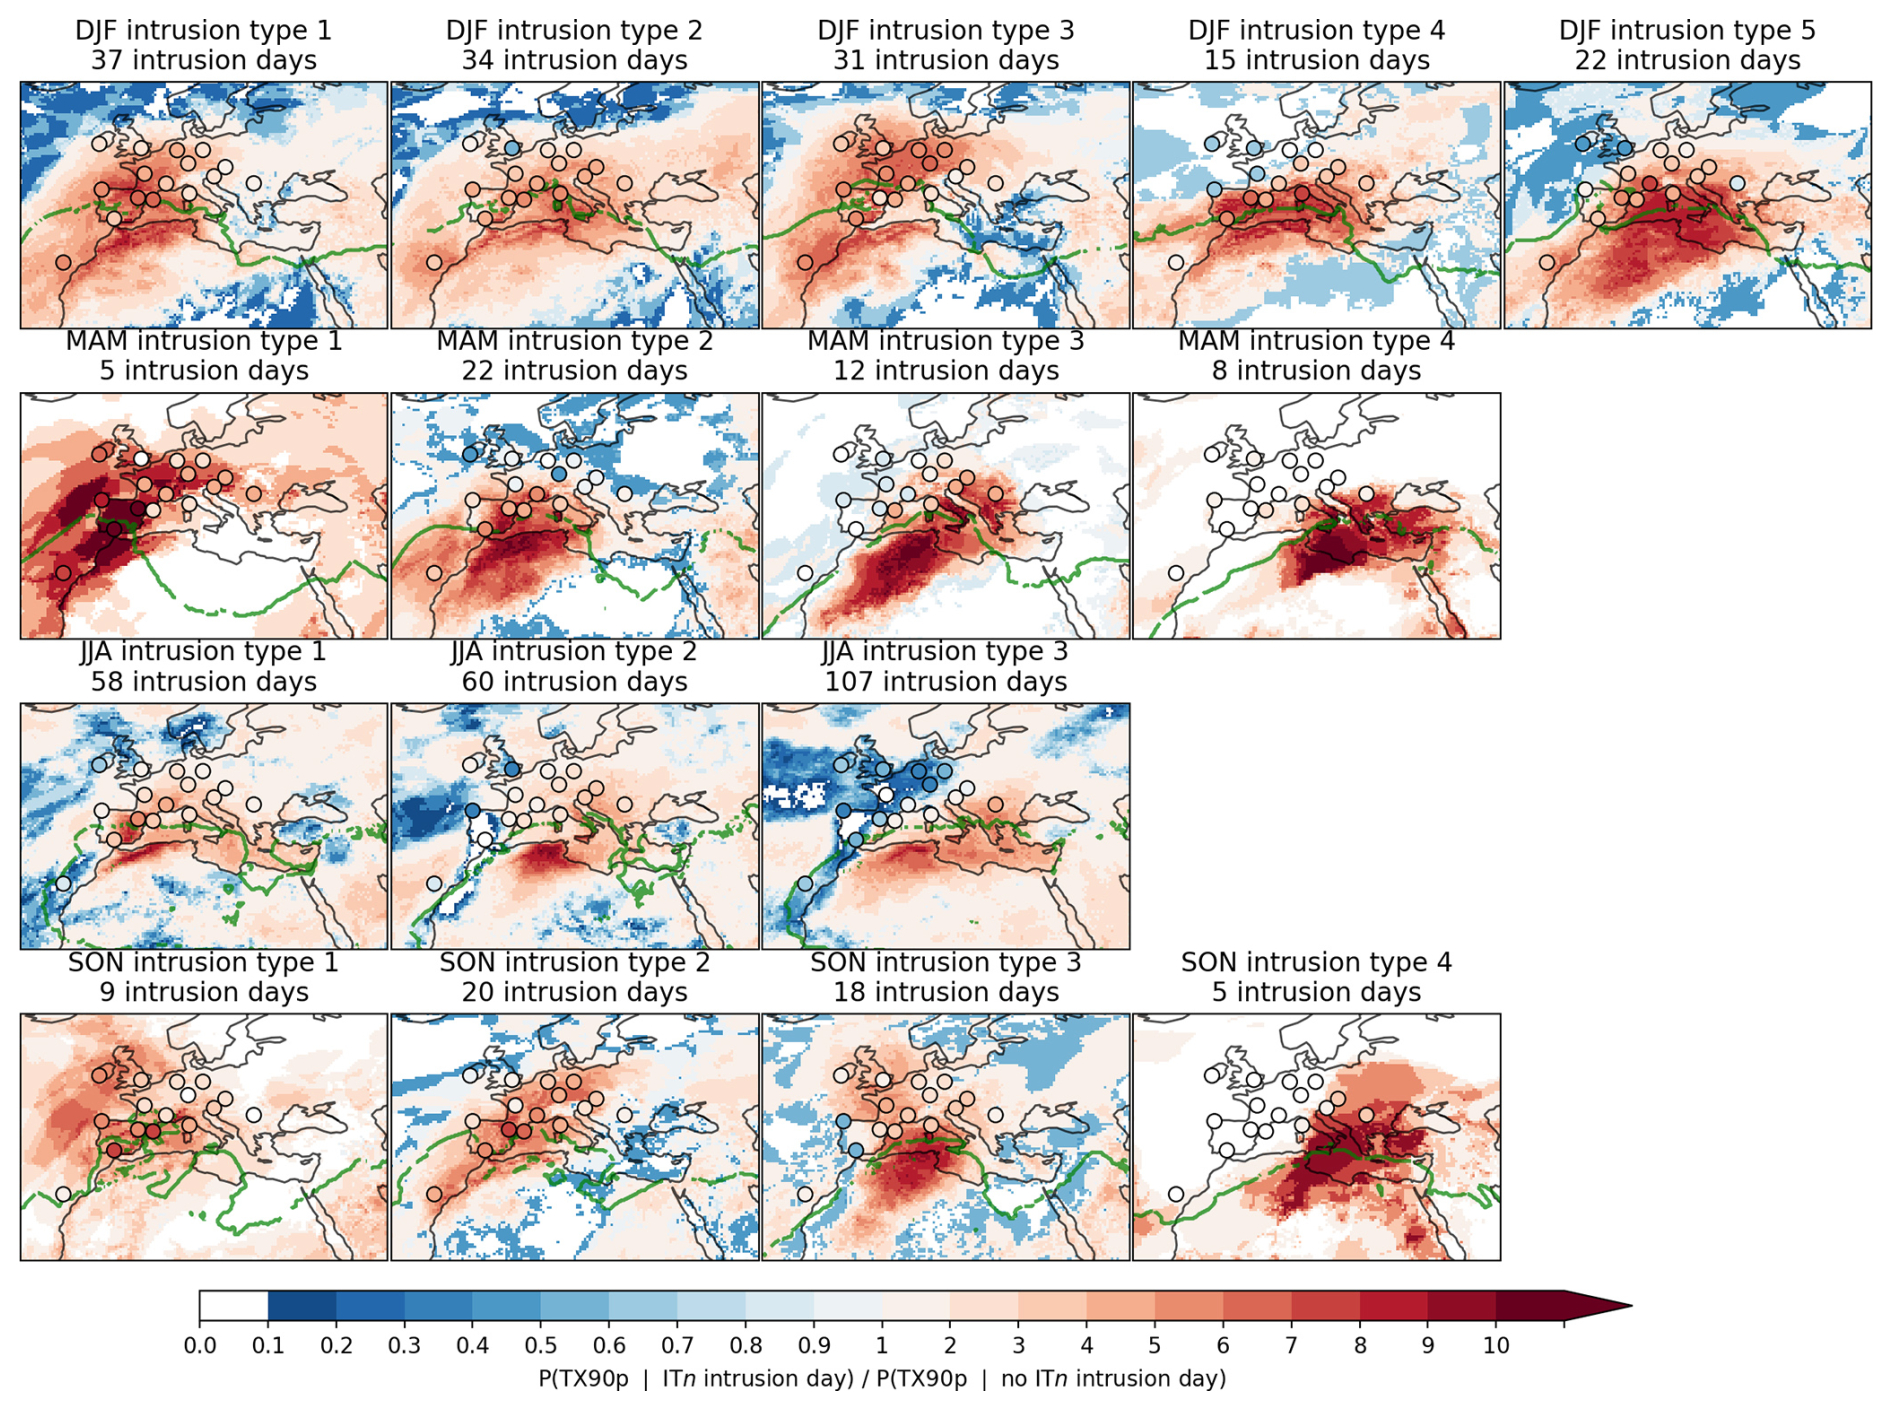
Figure 7Risk ratio of having an extreme-temperature day (TX90p) on days with and without Saharan warm-air intrusions for each season (rows) and IT (columns). It is computed as the fraction of the impact divided by the probability of having an extreme-temperature day when no ITn day is recorded. Coloured dots are the results from ECA&D station data (Table S1). The area of influence is displayed with a green (dotted) contour and represents the limit where Saharan air masses have been recorded in the historical period for a specific IT.
Figure 7 displays the risk ratio, and we see that results from Fig. 6 are validated and that many areas in MAM and SON display very large values, suggesting a strong influence of the intrusions on extreme-temperature values. Some substantial values in the other seasons can be seen, and in DJF, MAM, and SON, there are magnitudes above 1 that span beyond the area of influence.
Finally, if we compute, for every season, the percentage of TX90p days that are also an ITn intrusion day, i.e. , we get an idea of the contribution of intrusion days to the TX90p days. We see that in some regions, intrusions contribute up to ∼ 10 % of the seasonal TX90p days in JJA and up to 4 % in DJF (see Fig. S13).
Composites for each IT can be computed for any meteorological variable. This becomes helpful to understand the anomalies during intrusion days. First, we need the anomalies of any variable of interest, which are computed by subtracting the non-intrusion climatologies of 7 d rolling windows centred on each calendar day (Zhang et al., 2011; Tencer et al., 2016; Olmo et al., 2020). For example, we compute the upper-tropospheric geopotential height composites of any IT by first calculating the non-intrusion climatologies (using a 7 d rolling average), subtracting them from the intrusion days' composite, and then averaging these anomalies for the intrusion days. We are particularly interested in the relationship between the circulation and the onset of the intrusion events. Therefore, the composites are from the first day of the intrusion events. The results help us to identify the mechanisms behind the intrusions.
In previous analyses, we saw that the different ITs can be related, in part, to where the intrusion is located in the WMed (Fig. 4). This result is reinforced by Figs. 8–9a (for DJF and JJA, respectively) and Figs. S14–S15a (for MAM and SON, respectively), which show the anomalous winds at 850 hPa for each IT. The masked areas mean that the anomalies are not significantly different from 0 according to a two-tailed 95 % confidence t test (Ukkola et al., 2020). The northward wind anomalies coincide with the areas of influence of the ITs, meaning that there is an advection of southern air into the WMed. Figures 8–9a and S14–S15a also show the anomalies in sea-level pressure (SLP) in shading, and for most of the ITs there is an associated low pressure located to the west, northwest, or north of the area of influence. Some ITs do not have a clear statistically significant SLP anomaly signal (DJF IT3 and SON IT2). The low-tropospheric circulation and the SLP anomalies are coherent as the wind anomalies follow an (anti-)clockwise pattern around anomalous (highs) lows.
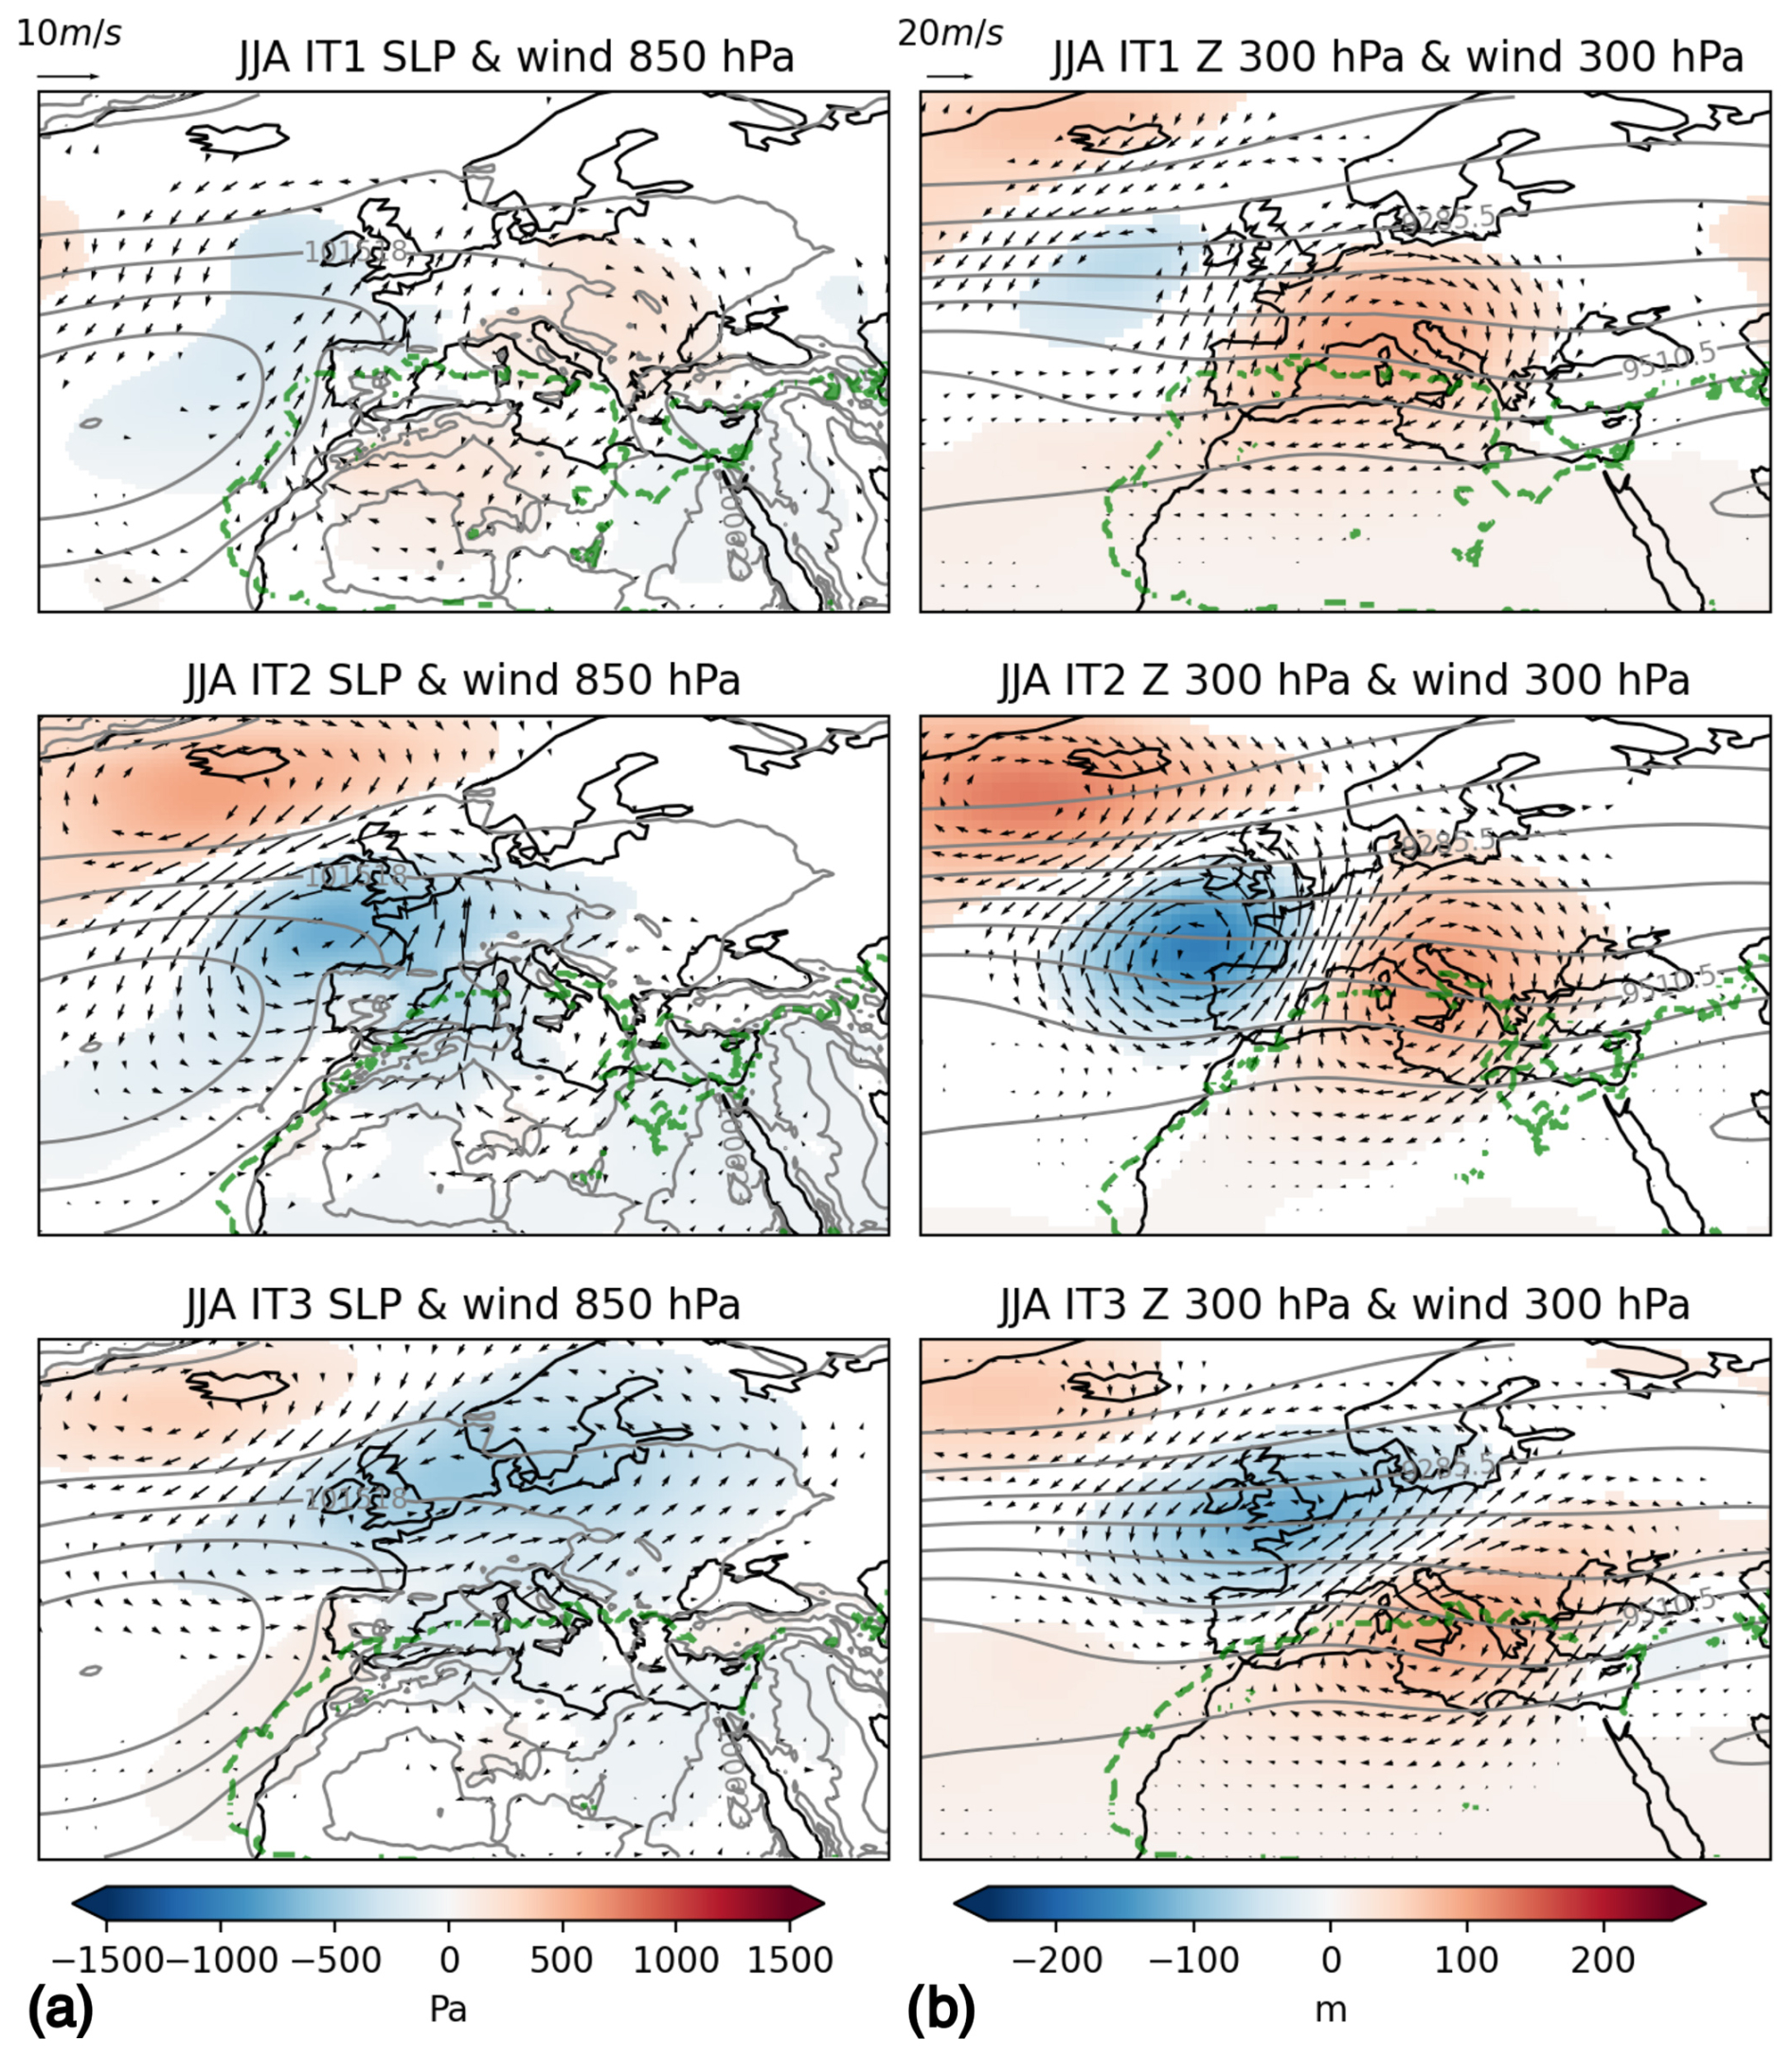
Figure 8Anomaly composites of the first days of the JJA intrusion events for (a) composites of SLP (shading) and wind speed at 850 hPa (arrows) and (b) geopotential height (shading) and wind speed (arrows) at 300 hPa for the three ITs (rows). Anomalies are computed with respect to the non-intrusion climatologies of 7 d rolling windows centred on each calendar day between 1959–2022. Contours show the climatological SLP (a) and 300 hPa geopotential height (b). No values are shown where the anomaly is not significantly different to 0 according to Student's t test and a 95 % confidence level.
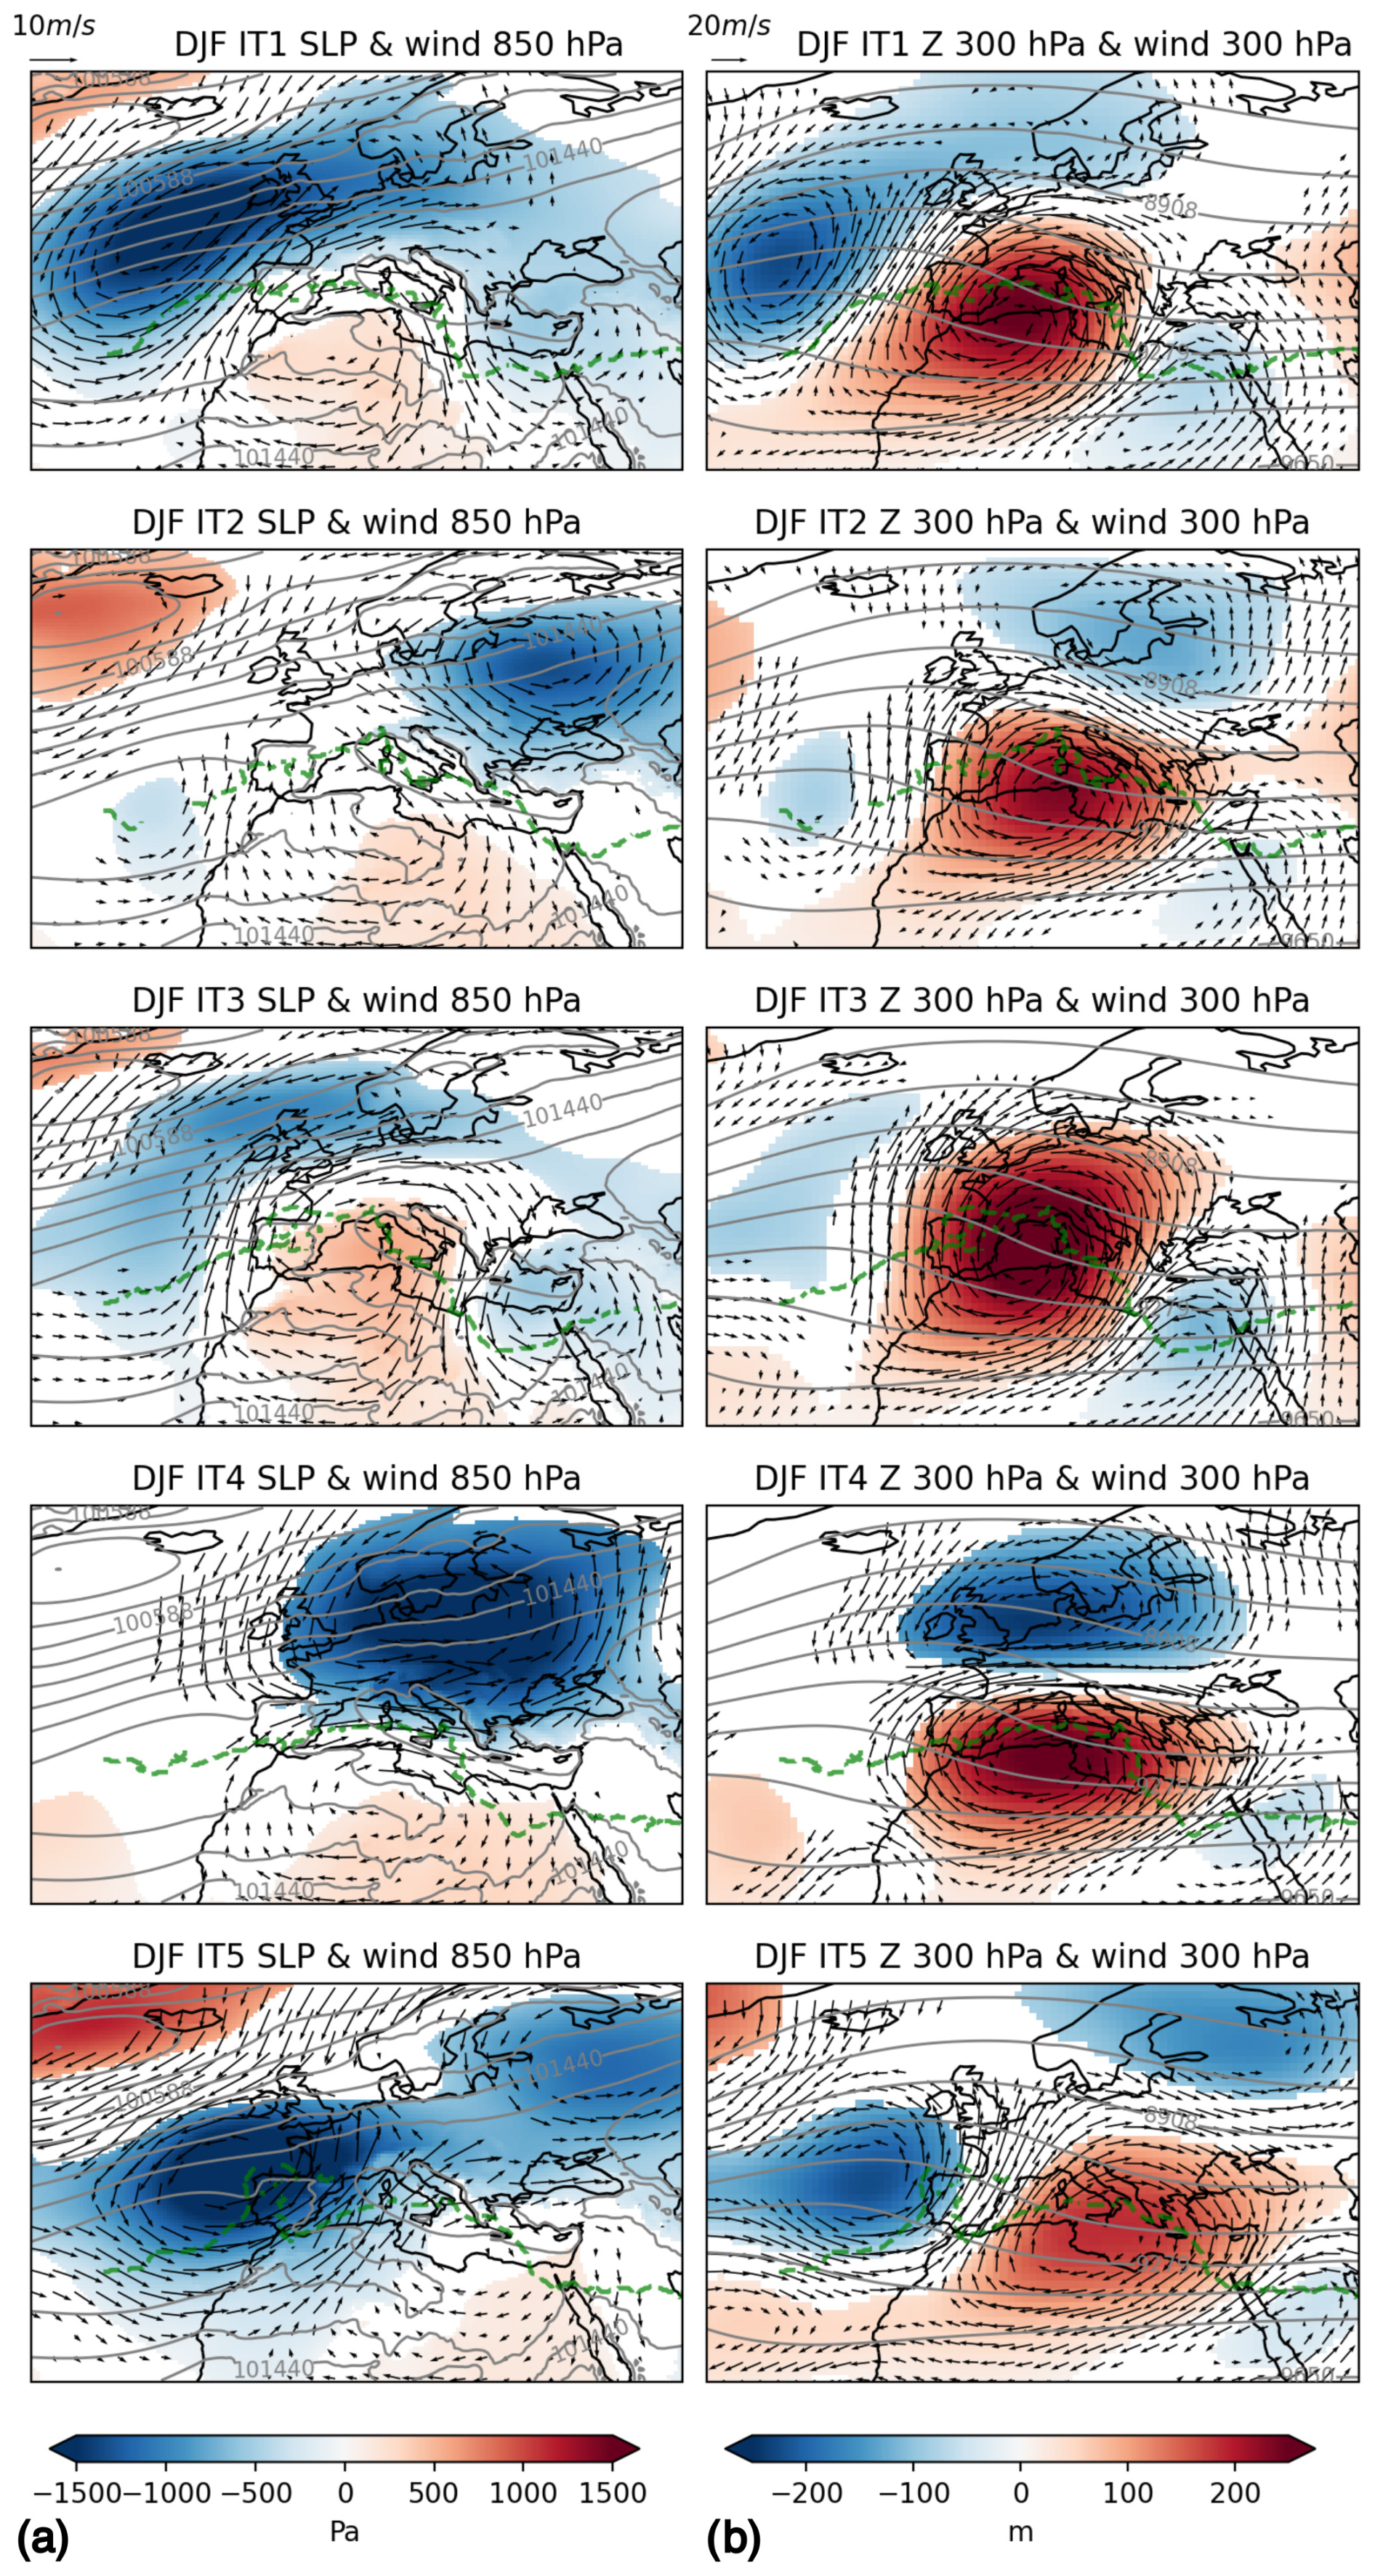
Figure 9Same as Fig. 8 but for the DJF ITs.
In terms of the IT strength, we have shown how JJA IT2 is associated with larger and ΔZ500–1000 anomaly composite magnitudes (Fig. 4), and this is in line with larger pressure and Z300 anomalies and a stronger northward component of the wind in the circulation composites in Fig. 8. Nonetheless, this is not found in DJF, MAM, and SON as there is not a relationship between strong indicator composites and the circulation anomaly composites. We must therefore remain cautious in claiming any link between the intensity of the IT and its circulation composites.
When looking into the upper troposphere (300 hPa, but similar results are found in 500 and 200 hPa), very well defined and significant anomalies are detected both in wind speeds and in geopotential height (see Figs. 8–9b and S14–S15b). Generally, there is always a statistically significant and well-defined geopotential high over the northern tip of the area of influence of the intrusion. Most times this high is accompanied by a low that is located to the west, northwest, or north. This anomalous negative geopotential centre is generally well aligned vertically with a negative sea-level pressure anomaly (although some ITs present some baroclinicity). The winds in the upper troposphere are consistent with the geopotential centres, suggesting that the general circulation (westerlies) is slowed down south of the geopotential positive blob, which can lead to onsets of intrusion events. The main differences between seasons are that the anomaly centres in DJF are generally broader and more intense than in JJA. MAM and SON composites have similar behaviours and also show broad and intense anomaly centres but to a lesser extent than in DJF. The composites have certain similarities to the composites of subtropical ridges proposed by Sousa et al. (2018). We argue that subtropical ridges might be a main driver of Saharan warm-air intrusions but not a necessary condition.
The composites of the days leading to the intrusion onset (Figs. S16–S17) show that the anomalies in the upper troposphere generally propagate over the North Atlantic (in DJF, with large spatial extents) and in the eastern North Atlantic (in JJA, with smaller spatial extents), first as a deepening trough (negative geopotential anomaly at 300 hPa) that leads to a high over the northern tip of the area of influence of the IT.
This study aims to characterize Saharan warm-air intrusions into the western Mediterranean, as the limited literature suggests that these events significantly influence extreme temperatures in the region (Sousa et al., 2019). Our goal has been to develop a workflow to (i) identify intrusion days throughout the year, (ii) classify them into different types, (iii) assess their impact on and contribution to temperature extremes, and (iv) evaluate the large-scale conditions at the onset of Saharan warm-air intrusions.
The method used identifies intrusions of warm air originating in the Sahara that propagate northward into the WMed. This is achieved through two indicators: the geopotential thickness between 1000 and 500 hPa and the mean potential temperature between 975 and 700 hPa, following the work by Sousa et al. (2019). These indicators provide insights into the temperature and vertical mixing within the air column – key characteristics of air masses formed in desert regions. The interaction between the land surface and the atmosphere heats the air column, making it highly convective but without cloud formation (Galvin, 2016; Webster, 2020).
During the initial stages of our study, we observed that the tropospheric air properties over the Sahara differ significantly from those of surrounding regions between May–October (warm months) but not from November–April (cold months). The climatology of the Saharan air masses provides a threshold for identifying warm, vertically homogeneous air masses that reach the WMed, as illustrated in Fig. S3. Typical Saharan air masses are found to lead to a higher probability of having extreme temperatures in the WMed (as seen in Fig. 7).
A visual inspection of the synoptic configurations during all the events helped to tune the algorithm parameters and revealed that our method successfully captures continuous air masses advected northward into the WMed, increasing our confidence in the method. We argue, nonetheless, that the visual inspection does not ensure that we miss less intense Saharan intrusions due to and ΔZ500–1000 thresholds that are too restrictive. The atmospheric circulation leading to these intrusions is diverse, often resulting in intrusions confined to spatial scales smaller than the entire WMed. During the cold months, the climatological values of the indicators and ΔZ500–1000 over the Sahara do not seem exclusive to the Sahara but rather have similar properties in regions outside the Sahara that are at the same latitude (∼ 15–35° N, 30° W–50° E). This is due to the reduced influence of the surface radiative balance over desert land that produces the distinctive air mass properties during the warm months. Therefore, we conclude that intrusions during the cold months could also be mixed with eastern Atlantic air masses at Saharan latitudes. This does not change the fact that Saharan-like air masses are penetrating the WMed, but it is important to note that their provenance can be non-exclusively from the Sahara. Moreover, from the qualitative assessment of some cold-month intrusions (see Fig. S6 for an example), we see that cold-month intrusions can behave like a broad subtropical ridge with a larger longitudinal extent than warm-month episodes. This result is backed by the circulation composites (which are discussed further in the following paragraphs) in DJF, where the upper-troposphere positive anomalies are generally broader than in JJA (see Figs. 8 and 9), in agreement with the results in Sousa et al. (2018).
This study provides, for the first time, a comprehensive catalogue of Saharan warm-air intrusions throughout the year, covering the period from 1959 to 2022. Our approach, while simple and based on just two variables, effectively identifies intrusion events in the WMed. Other studies, some not necessarily focused on the Sahara, have used tracking algorithms that may offer greater precision in detecting Saharan air intrusions, though at a significantly higher computational and data volume cost (Lemus-Canovas et al., 2021; Fix et al., 2024; Wernli and Davies, 1997; Santos et al., 2015; Bieli et al., 2015; Schielicke and Pfahl, 2022). We argue that our computationally cheap workflow can easily be ported to analyse climate model output, which is a key step in evaluating their performance in reproducing this mechanism.
Given that the spatial scale of the intrusions is smaller than the WMed and the visual inspection of the events indicated that intrusions have diverse behaviours, we applied a clustering method to identify distinct intrusion types (ITs). This approach yielded five types for DJF, three for JJA, and four for both MAM and SON, each representing the area of influence where the intrusions occur, effectively dividing the study region into subregions and also discriminating between the intensity and extent of the Saharan warm-air intrusions. These distinctions are relevant because different ITs have varying impacts on regional temperatures and are associated with different large-scale circulations, as discussed below.
While ITs can evolve during a single event, the most common behaviour is for an IT to either maintain its type or transition to a relatively eastern IT, consistent with the prevailing westerly circulation in the region (Olmo et al., 2024). We also observed a statistically significant increase in intrusion days over the historical period for JJA, DJF, and SON, consistent with long-term thermodynamic changes and the warming and expansion of the troposphere, which can allow our climatological definition of Saharan air masses to reach higher latitudes more easily or even to be generated more to the north. These thermodynamic changes have been extensively linked to global warming (Staten et al., 2018; Webster, 2020; IPCC, 2023), although it is important to consider how climate variability at different timescales can affect temperature increases in the Sahara and WMed regions (IPCC, 2023). Global warming and climate variability could also modify the circulation dynamics (Coumou and Rahmstorf, 2012; Rousi et al., 2022) and directly influence the frequency of mechanisms that lead to Saharan warm-air intrusions. This attribution falls out of the scope of the current work, but we believe such a study should be performed in the future to improve intrusions' predictability. The trend in intrusion days is also reflected in regional observations of extreme-heat events in Iberia (Del Río et al., 2011; Cardoso et al., 2019; Fonseca et al., 2016; Sandonis et al., 2021), the Italian peninsula and surrounding islands (Scorzini and Leopardi, 2019; Monforte and Ragusa, 2022; Bey et al., 2024; Caloiero and Guagliardi, 2020), and the broader Mediterranean region (Campos et al., 2024; Cos et al., 2022). Of particular relevance is the summer of the year 2021, when the number of intrusion days reached 30 d (more than 5 standard deviations higher than the mean in summer). The summer of 2021 has been studied for its extreme temperatures in the Euro-Mediterranean region (Demirtaş, 2023; Founda et al., 2022).
The contribution of Saharan warm-air intrusions in the WMed during the historical period is important. We highlight a key metric of the relationship between extreme temperatures and intrusions: the impact. We define impact as the probability of having an extreme-temperature day (TX90p) given that the day is also an intrusion day. The results show that intrusions are very impactful in terms of temperature extremes within their specific IT's area of influence and further north and northwest into the EM region (with the exception of JJA). The risk ratio of having extreme temperatures on ITn days versus non-ITn days has also been computed, and we see that there is a stronger risk of having extreme temperatures in broad areas of the EM region for all seasons when intrusion days are recorded. In terms of contribution, i.e. how many TX90p days coincide with an intrusion day, JJA stands out as the only season with a notable contribution of around 10 % of extreme-temperature days, primarily due to the higher frequency of intrusion events during this period. These findings confirm that Saharan warm-air intrusions have an important impact on extreme temperatures across all seasons. However, because the frequency of intrusions varies seasonally, only those in JJA make a relevant contribution to overall extreme temperatures. This initial study has not considered the radiative impact of Saharan aerosols on extreme temperatures, as in Sicard et al. (2022) and Cuevas-Agulló et al. (2023), nor has it assessed the evolution of Saharan air masses during intrusion events, as has been done in analyses of backward trajectories of extreme-temperature events by Sousa et al. (2018), Zschenderlein et al. (2019), and Mayer and Wirth (2025).
Through an analysis of anomaly composites for each intrusion type, we identified distinct upper-tropospheric circulation anomalies. The composites of upper-tropospheric geopotential show an anomalous high over the area of influence of the ITs, associated with an anomalous circulation around that high that slows down the main flow over northern Africa. Furthermore, we see that the anomalous high is normally preceded by a westerly shift of positive and/or negative geopotential height centres in the North Atlantic. This pattern holds for all seasons. In some cases, the days leading to the onset of the Saharan warm-air intrusion indicate the propagation of an anomaly wave train across the North Atlantic. This suggests that there might be an upstream source that forces the anomalous high over the WMed. Some work in this direction but related to other phenomena has recently been conducted by Sandler et al. (2024). They suggest that the connection between upper-level geopotential anomalies and surface processes in the Mediterranean can originate from Atlantic Ocean sea surface anomalies. Teng et al. (2022) identify a positive trend in the upper-tropospheric geopotential height in JJA over the EM, associated with a hemispheric wave-like structure forced by the North Atlantic. Therefore, trends in JJA Saharan intrusions could be influenced by the circulation trend described in Teng et al. (2022). This offers an explanation that links the upper-troposphere circulation and the Saharan intrusions. Other research has examined the role of polar jets in extreme temperatures (Rousi et al., 2022; Wang et al., 2013), though the mechanisms behind their fluctuations remain unsolved. It would be relevant to understand how the synoptic configurations specific to each intrusion event are related to fluctuations in the westerly eddy-driven jet stream over the North Atlantic, including anticyclonic and cyclonic wave-breaking processes, in line with the work of Sousa et al. (2021) and Woollings et al. (2010). Such an analysis of the large-scale dynamics falls beyond the scope of the present work. Further investigation is needed to identify the forcings driving the large-scale circulation anomalies and explore the potential role of teleconnections. Gaining a clearer understanding of these processes could improve the predictability of Saharan warm-air intrusions and enhance the evaluation of model simulations, ensuring confidence in their representation of this important phenomenon and its impacts.
The data used can be accessed through the Climate Data Store maintained by Copernicus at https://doi.org/10.24381/cds.adbb2d47 (Hersbach et al., 2023a) and https://doi.org/10.24381/cds.bd0915c6 (Hersbach et al., 2023b).
The code developed to identify the Saharan warm intrusions and to compute all other results of this study can be found at https://doi.org/10.5281/zenodo.14925526 (Cos, 2025).
The supplement related to this article is available online at https://doi.org/10.5194/wcd-6-609-2025-supplement.
PC, RMM, and FJDR designed the study. PC developed the diagnostics and wrote the initial manuscript. PC, MO, DC, LP, and AGM designed the clustering algorithm. All authors contributed to the interpretation and discussion of the results and the improvement of the paper.
The contact author has declared that none of the authors has any competing interests.
Publisher's note: Copernicus Publications remains neutral with regard to jurisdictional claims made in the text, published maps, institutional affiliations, or any other geographical representation in this paper. While Copernicus Publications makes every effort to include appropriate place names, the final responsibility lies with the authors.
We wish to thank all those who have provided the data used in this work and for the data support by Margarida Samso. We would also like to thank the two anonymous reviewers for their comments and suggestions, which greatly contributed to the improvement of this study. Pep Cos would like to thank Julia Mindlin in particular for her invaluable presence, random brilliant thoughts, and discussions throughout this study. We also thank the European Centre for Medium-Range Weather Forecasts (ECMWF) and the European Climate Assessment & Dataset for providing ERA5 reanalysis and station data, respectively.
This work was supported by the National Research Agency (AEI-Agencia Nacional de Investigación) through the project GLORIA (grant no. TED2021-129543B-I00). Matias Olmo is funded by the AI4Science PN070500 fellowship within the “Generación D” initiative, Red.es, Ministerio para la Transformación Digital y de la Función Pública, for talent attraction (grant no. C005/24-ED CV1). This study has been funded by the European Union NextGenerationEU funds, through PRTR.
This paper was edited by Heini Wernli and reviewed by two anonymous referees.
Alvarez-Castro, M. C., Faranda, D., and Yiou, P.: Atmospheric Dynamics Leading to West European Summer Hot Temperatures Since 1851, Complexity, 2018, 2494509, https://doi.org/10.1155/2018/2494509, 2018. a
Barriopedro, D., García-Herrera, R., Ordóñez, C., Miralles, D. G., and Salcedo-Sanz, S.: Heat Waves: Physical Understanding and Scientific Challenges, Rev. Geophys., 61, e2022RG000780, https://doi.org/10.1029/2022RG000780, 2023. a
Bey, E., Türkeş, M., and Hamed, M. M.: Long-term air temperature trends in North Cyprus, Theor. Appl. Climatol., 155, 1113–1122, https://doi.org/10.1007/s00704-023-04689-6, 2024. a
Bieli, M., Pfahl, S., and Wernli, H.: A Lagrangian investigation of hot and cold temperature extremes in Europe, Q. J. Roy. Meteor. Soc., 141, 98–108, https://doi.org/10.1002/qj.2339, 2015. a
Bladé, I., Liebmann, B., Fortuny, D., and van Oldenborgh, G. J.: Observed and simulated impacts of the summer NAO in Europe: Implications for projected drying in the Mediterranean region, Clim. Dynam., 39, 709–727, https://doi.org/10.1007/s00382-011-1195-x, 2012. a, b
Brogli, R., Kröner, N., Sørland, S. L., Lüthi, D., and Schär, C.: The Role of Hadley Circulation and Lapse-Rate Changes for the Future European Summer Climate, J. Climate, 32, 385–404, https://doi.org/10.1175/JCLI-D-18-0431.1, 2019. a
Calinski, T. and Harabasz, J.: A dendrite method for cluster analysis, Commun. Stat. A-Theor., 3, 1–27, https://doi.org/10.1080/03610927408827101, 1974. a
Caloiero, T. and Guagliardi, I.: Temporal Variability of Temperature Extremes in the Sardinia Region (Italy), Hydrology, 7, 55, https://doi.org/10.3390/hydrology7030055, 2020. a
Campos, D. A., Olmo, M. E., Cos, P., Muñoz, A. G., and Doblas-Reyes, F.: Regional aspects of the recent observed trends in the Western Mediterranean: Insights from a Timescale Decomposition Analysis, ESS Open Archive, https://doi.org/10.22541/essoar.172838619.92296453/v1, 2024. a
Cardoso, R. M., Soares, P. M. M., Lima, D. C. A., and Miranda, P. M. A.: Mean and extreme temperatures in a warming climate: EURO CORDEX and WRF regional climate high-resolution projections for Portugal, Clim. Dynam., 52, 129–157, https://doi.org/10.1007/s00382-018-4124-4, 2019. a
Cherif, S., Doblas-Miranda, E., Lionello, P., Borrego, C., Giorgi, F., Iglesias, A., Jebari, S., Mahmoudi, E., Moriondo, M., Pringault, O., Rilov, G., Somot, S., Tsikliras, A., Vilà, M., and Zittis, G.: First Mediterranean Assessment Report – Chapter 2: Drivers of Change, Tech. rep., MedECC Reports, MedECC Secretariat, Marseille, France, Zenodo, https://doi.org/10.5281/zenodo.7100601, 2020. a
Cos, P.: Sahara warm air intrusions identification, Zenodo [code], https://doi.org/10.5281/zenodo.14925526, 2025. a
Cos, J., Doblas-Reyes, F., Jury, M., Marcos, R., Bretonnière, P.-A., and Samsó, M.: The Mediterranean climate change hotspot in the CMIP5 and CMIP6 projections, Earth Syst. Dynam., 13, 321–340, https://doi.org/10.5194/esd-13-321-2022, 2022. a, b
Coumou, D. and Rahmstorf, S.: A decade of weather extremes, Nat. Clim. Change, 2, 491–496, https://doi.org/10.1038/nclimate1452, 2012. a
Cramer, W., Guiot, J., Fader, M., Garrabou, J., Gattuso, J.-P., Iglesias, A., Lange, M. A., Lionello, P., Llasat, M. C., Paz, S., Peñuelas, J., Snoussi, M., Toreti, A., Tsimplis, M. N., and Xoplaki, E.: Climate change and interconnected risks to sustainable development in the Mediterranean, Nat. Clim. Change, 8, 972–980, https://doi.org/10.1038/s41558-018-0299-2, 2018. a
Cuevas-Agulló, E., Barriopedro, D., García, R. D., Alonso-Pérez, S., González-Alemán, J. J., Werner, E., Suárez, D., Bustos, J. J., García-Castrillo, G., García, O., Barreto, Á., and Basart, S.: Sharp increase of Saharan dust intrusions over the Western Mediterranean and Euro-Atlantic region in winters 2020–2022 and associated atmospheric circulation, EGUsphere [preprint], https://doi.org/10.5194/egusphere-2023-1749, 2023. a, b
Del Río, S., Herrero, L., Pinto-Gomes, C., and Penas, A.: Spatial analysis of mean temperature trends in Spain over the period 1961–2006, Global Planet. Change, 78, 65–75, https://doi.org/10.1016/j.gloplacha.2011.05.012, 2011. a
Demirtaş, M.: The anomalously hot summer of 2021 over the Euro-Mediterranean region: underlying atmospheric drivers and heatwaves, Theor. Appl. Climatol., 152, 861–870, https://doi.org/10.1007/s00704-023-04437-w, 2023. a
Deser, C., Alexander, M. A., Xie, S.-P., and Phillips, A. S.: Sea Surface Temperature Variability: Patterns and Mechanisms, Annu. Rev. Mar. Sci., 2, 115–143, https://doi.org/10.1146/annurev-marine-120408-151453, 2010. a
Dunkerton, T. J. and Baldwin, M. P.: Propagation of the Arctic Oscillation from the stratosphere to the troposphere, J. Geophys. Res.-Atmos., 104, 30937–30946, https://doi.org/10.1029/1999JD900445, 1999. a
Ellison, A. M.: An Introduction to Bayesian Inference for Ecological Research and Environmental Decision-Making, Ecol. Appl., 6, 1036–1046, https://doi.org/10.2307/2269588, 1996. a
Enfield, D. B., Mestas-Nuñez, A. M., and Trimble, P. J.: The Atlantic Multidecadal Oscillation and its relation to rainfall and river flows in the continental U.S., Geophys. Res. Lett., 28, 2077–2080, https://doi.org/10.1029/2000GL012745, 2001. a
Faranda, D., Messori, G., Jezequel, A., Vrac, M., and Yiou, P.: Atmospheric circulation compounds anthropogenic warming and impacts of climate extremes in Europe, P. Natl. Acad. Sci. USA, 120, e2214525120, https://doi.org/10.1073/pnas.2214525120, 2023. a
Fasullo, J. T. and Trenberth, K. E.: A Less Cloudy Future: The Role of Subtropical Subsidence in Climate Sensitivity, Science, 338, 792–794, https://doi.org/10.1126/science.1227465, 2012. a
Fix, F., Mayr, G., Zeileis, A., Stucke, I., and Stauffer, R.: Detection and consequences of atmospheric deserts: insights from a case study, Weather Clim. Dynam., 5, 1545–1560, https://doi.org/10.5194/wcd-5-1545-2024, 2024. a
Folland, C. K., Knight, J., Linderholm, H. W., Fereday, D., Ineson, S., and Hurrell, J. W.: The Summer North Atlantic Oscillation: Past, Present, and Future, J. Climate, 22, 1082–1103, https://doi.org/10.1175/2008JCLI2459.1, 2009. a, b
Fonseca, D., Carvalho, M., Marta-Almeida, M., Melo-Gonçalves, P., and Rocha, A.: Recent trends of extreme temperature indices for the Iberian Peninsula, Phys. Chem. Earth Pt. A/B/C, 94, 66–76, https://doi.org/10.1016/j.pce.2015.12.005, 2016. a
Founda, D., Katavoutas, G., Pierros, F., and Mihalopoulos, N.: The Extreme Heat Wave of Summer 2021 in Athens (Greece): Cumulative Heat and Exposure to Heat Stress, Sustainability, 14, 7766, https://doi.org/10.3390/su14137766, 2022. a
Galvin, J. F. P.: An introduction to the meteorology and climate of the tropics, MyiLibrary, Wiley Blackwell, Chichester, West Sussex, ISBN 978-1-119-08624-6, 2016. a, b, c, d
Gerber, E. P., Baldwin, M. P., Akiyoshi, H., Austin, J., Bekki, S., Braesicke, P., Butchart, N., Chipperfield, M., Dameris, M., Dhomse, S., Frith, S. M., Garcia, R. R., Garny, H., Gettelman, A., Hardiman, S. C., Karpechko, A., Marchand, M., Morgenstern, O., Nielsen, J. E., Pawson, S., Peter, T., Plummer, D. A., Pyle, J. A., Rozanov, E., Scinocca, J. F., Shepherd, T. G., and Smale, D.: Stratosphere-troposphere coupling and annular mode variability in chemistry-climate models, J. Geophys. Res.-Atmos., 115, 2009JD013770, https://doi.org/10.1029/2009JD013770, 2010. a
Giorgi, F.: Climate change hot-spots, Geophys. Res. Lett., 33, 2006GL025734, https://doi.org/10.1029/2006GL025734, 2006. a
Hersbach, H., Bell, B., Berrisford, P., Hirahara, S., Horányi, A., Muñoz-Sabater, J., Nicolas, J., Peubey, C., Radu, R., Schepers, D., Simmons, A., Soci, C., Abdalla, S., Abellan, X., Balsamo, G., Bechtold, P., Biavati, G., Bidlot, J., Bonavita, M., De Chiara, G., Dahlgren, P., Dee, D., Diamantakis, M., Dragani, R., Flemming, J., Forbes, R., Fuentes, M., Geer, A., Haimberger, L., Healy, S., Hogan, R. J., Hólm, E., Janisková, M., Keeley, S., Laloyaux, P., Lopez, P., Lupu, C., Radnoti, G., De Rosnay, P., Rozum, I., Vamborg, F., Villaume, S., and Thépaut, J.: The ERA5 global reanalysis, Q. J. Roy. Meteor. Soc., 146, 1999–2049, https://doi.org/10.1002/qj.3803, 2020. a
Hersbach, H., Bell, B., Berrisford, P., Biavati, G., Horányi, A., Muñoz Sabater, J., Nicolas, J., Peubey, C., Radu, R., Rozum, I., Schepers, D., Simmons, A., Soci, C., Dee, D., and Thépaut, J.-N.: ERA5 hourly data on single levels from 1940 to present, Copernicus Climate Change Service (C3S) Climate Data Store (CDS) [data set], https://doi.org/10.24381/cds.adbb2d47, 2023a. a
Hersbach, H., Bell, B., Berrisford, P., Biavati, G., Horányi, A., Muñoz Sabater, J., Nicolas, J., Peubey, C., Radu, R., Rozum, I., Schepers, D., Simmons, A., Soci, C., Dee, D., and Thépaut, J.-N.: ERA5 hourly data on pressure levels from 1940 to present, Copernicus Climate Change Service (C3S) Climate Data Store (CDS) [data set], https://doi.org/10.24381/cds.bd0915c6, 2023b. a
Holton, J. R. and Hakim, G. J.: An introduction to dynamic meteorology, Academic Press, Amsterdam, 5th edn., ISBN 978-0-12-384866-6, 2013. a
Horton, D. E., Johnson, N. C., Singh, D., Swain, D. L., Rajaratnam, B., and Diffenbaugh, N. S.: Contribution of changes in atmospheric circulation patterns to extreme temperature trends, Nature, 522, 465–469, https://doi.org/10.1038/nature14550, 2015. a
Hotz, B., Papritz, L., and Röthlisberger, M.: Understanding the vertical temperature structure of recent record-shattering heatwaves, Weather Clim. Dynam., 5, 323–343, https://doi.org/10.5194/wcd-5-323-2024, 2024. a
Hurrell, J. W.: Decadal Trends in the North Atlantic Oscillation: Regional Temperatures and Precipitation, Science, 269, 676–679, https://doi.org/10.1126/science.269.5224.676, 1995. a, b
IPCC: Climate Change 2021 – The Physical Science Basis: Working Group I Contribution to the Sixth Assessment Report of the Intergovernmental Panel on Climate Change, edited by: Masson-Delmotte, V., Zhai, P., Pirani, A., Connors, S. L., Péan, C., Berger, S., Caud, N., Chen, Y., Goldfarb, L., Gomis, M. I., Huang, M., Leitzell, K., Lonnoy, E., Matthews, J. B. R., Maycock, T. K., Waterfield, T., Yelekçi, O., Yu, R., and Zhou, B., Cambridge University Press, 1st edn., ISBN 978-1-009-15789-6, https://doi.org/10.1017/9781009157896, 2023. a, b
Kerr, R. A.: A North Atlantic Climate Pacemaker for the Centuries, Science, 288, 1984–1985, https://doi.org/10.1126/science.288.5473.1984, 2000. a
Klein Tank, A. M. G., Wijngaard, J. B., Können, G. P., Böhm, R., Demarée, G., Gocheva, A., Mileta, M., Pashiardis, S., Hejkrlik, L., Kern-Hansen, C., Heino, R., Bessemoulin, P., Müller-Westermeier, G., Tzanakou, M., Szalai, S., Pálsdóttir, T., Fitzgerald, D., Rubin, S., Capaldo, M., Maugeri, M., Leitass, A., Bukantis, A., Aberfeld, R., Van Engelen, A. F. V., Forland, E., Mietus, M., Coelho, F., Mares, C., Razuvaev, V., Nieplova, E., Cegnar, T., Antonio López, J., Dahlström, B., Moberg, A., Kirchhofer, W., Ceylan, A., Pachaliuk, O., Alexander, L. V., and Petrovic, P.: Daily dataset of 20th-century surface air temperature and precipitation series for the European Climate Assessment, Int. J. Climatol., 22, 1441–1453, https://doi.org/10.1002/joc.773, 2002. a
Klotzbach, P. J. and Gray, W. M.: Multidecadal Variability in North Atlantic Tropical Cyclone Activity, J. Climate, 21, 3929–3935, https://doi.org/10.1175/2008JCLI2162.1, 2008. a
Lemus-Canovas, M., Lopez-Bustins, J. A., Martín-Vide, J., Halifa-Marin, A., Insua-Costa, D., Martinez-Artigas, J., Trapero, L., Serrano-Notivoli, R., and Cuadrat, J. M.: Characterisation of Extreme Precipitation Events in the Pyrenees: From the Local to the Synoptic Scale, Atmosphere, 12, 665, https://doi.org/10.3390/atmos12060665, 2021. a
Lionello, P. and Scarascia, L.: The relation between climate change in the Mediterranean region and global warming, Reg. Environ. Change, 18, 1481–1493, https://doi.org/10.1007/s10113-018-1290-1, 2018. a
Mariotti, A. and Dell'Aquila, A.: Decadal climate variability in the Mediterranean region: roles of large-scale forcings and regional processes, Clim. Dynam., 38, 1129–1145, https://doi.org/10.1007/s00382-011-1056-7, 2012. a
Martin-Vide, J. and Lopez-Bustins, J.: The Western Mediterranean Oscillation and rainfall in the Iberian Peninsula, Int. J. Climatol., 26, 1455–1475, https://doi.org/10.1002/joc.1388, 2006. a
Materia, S., Ardilouze, C., Prodhomme, C., Donat, M. G., Benassi, M., Doblas-Reyes, F. J., Peano, D., Caron, L.-P., Ruggieri, P., and Gualdi, S.: Summer temperature response to extreme soil water conditions in the Mediterranean transitional climate regime, Clim. Dynam., 58, 1943–1963, https://doi.org/10.1007/s00382-021-05815-8, 2022. a
Mayer, A. and Wirth, V.: Two different perspectives on heatwaves within the Lagrangian framework, Weather Clim. Dynam., 6, 131–150, https://doi.org/10.5194/wcd-6-131-2025, 2025. a, b
Michaelides, S., Karacostas, T., Sánchez, J. L., Retalis, A., Pytharoulis, I., Homar, V., Romero, R., Zanis, P., Giannakopoulos, C., Bühl, J., Ansmann, A., Merino, A., Melcón, P., Lagouvardos, K., Kotroni, V., Bruggeman, A., López-Moreno, J. I., Berthet, C., Katragkou, E., Tymvios, F., Hadjimitsis, D. G., Mamouri, R.-E., and Nisantzi, A.: Reviews and perspectives of high impact atmospheric processes in the Mediterranean, Atmos. Res., 208, 4–44, https://doi.org/10.1016/j.atmosres.2017.11.022, 2018. a
Monforte, P. and Ragusa, M. A.: Temperature Trend Analysis and Investigation on a Case of Variability Climate, Mathematics, 10, 2202, https://doi.org/10.3390/math10132202, 2022. a
Muñoz, A. G., Goddard, L., Robertson, A. W., Kushnir, Y., and Baethgen, W.: Cross–Time Scale Interactions and Rainfall Extreme Events in Southeastern South America for the Austral Summer. Part I: Potential Predictors, J. Climate, 28, 7894–7913, https://doi.org/10.1175/JCLI-D-14-00693.1, 2015. a, b
Muñoz, A. G., Goddard, L., Mason, S. J., and Robertson, A. W.: Cross–Time Scale Interactions and Rainfall Extreme Events in Southeastern South America for the Austral Summer. Part II: Predictive Skill, J. Climate, 29, 5915–5934, https://doi.org/10.1175/JCLI-D-15-0699.1, 2016. a, b
Muñoz, A. G., Yang, X., Vecchi, G. A., Robertson, A. W., and Cooke, W. F.: A Weather-Type-Based Cross-Time-Scale Diagnostic Framework for Coupled Circulation Models, J. Climate, 30, 8951–8972, https://doi.org/10.1175/JCLI-D-17-0115.1, 2017. a, b
Nabat, P., Somot, S., Mallet, M., Sevault, F., Chiacchio, M., and Wild, M.: Direct and semi-direct aerosol radiative effect on the Mediterranean climate variability using a coupled regional climate system model, Clim. Dynam., 44, 1127–1155, https://doi.org/10.1007/s00382-014-2205-6, 2015. a
Olmo, M., Bettolli, M. L., and Rusticucci, M.: Atmospheric circulation influence on temperature and precipitation individual and compound daily extreme events: Spatial variability and trends over southern South America, Weather and Climate Extremes, 29, 100267, https://doi.org/10.1016/j.wace.2020.100267, 2020. a
Olmo, M., Cos, P., Muñoz, A. G., Altava-Ortiz, V., Barrera-Escoda, A., Campos, D., Soret, A., and Doblas-Reyes, F.: Cross-Time-Scale Analysis of Year-Round Atmospheric Circulation Patterns and Their Impacts on Rainfall and Temperatures in the Iberian Peninsula, J. Climate, 37, 5525–5541, https://doi.org/10.1175/JCLI-D-23-0735.1, 2024. a, b, c
Palmer, T. E., McSweeney, C. F., Booth, B. B. B., Priestley, M. D. K., Davini, P., Brunner, L., Borchert, L., and Menary, M. B.: Performance-based sub-selection of CMIP6 models for impact assessments in Europe, Earth Syst. Dynam., 14, 457–483, https://doi.org/10.5194/esd-14-457-2023, 2023. a
Pereira, M. G., Trigo, R. M., Da Camara, C. C., Pereira, J. M., and Leite, S. M.: Synoptic patterns associated with large summer forest fires in Portugal, Agr. Forest Meteorol., 129, 11–25, https://doi.org/10.1016/j.agrformet.2004.12.007, 2005. a
Regayre, L. A., Deaconu, L., Grosvenor, D. P., Sexton, D. M. H., Symonds, C., Langton, T., Watson-Paris, D., Mulcahy, J. P., Pringle, K. J., Richardson, M., Johnson, J. S., Rostron, J. W., Gordon, H., Lister, G., Stier, P., and Carslaw, K. S.: Identifying climate model structural inconsistencies allows for tight constraint of aerosol radiative forcing, Atmos. Chem. Phys., 23, 8749–8768, https://doi.org/10.5194/acp-23-8749-2023, 2023. a
Rousi, E., Kornhuber, K., Beobide-Arsuaga, G., Luo, F., and Coumou, D.: Accelerated western European heatwave trends linked to more-persistent double jets over Eurasia, Nat. Commun., 13, 3851, https://doi.org/10.1038/s41467-022-31432-y, 2022. a, b
Rousi, E., Fink, A. H., Andersen, L. S., Becker, F. N., Beobide-Arsuaga, G., Breil, M., Cozzi, G., Heinke, J., Jach, L., Niermann, D., Petrovic, D., Richling, A., Riebold, J., Steidl, S., Suarez-Gutierrez, L., Tradowsky, J. S., Coumou, D., Düsterhus, A., Ellsäßer, F., Fragkoulidis, G., Gliksman, D., Handorf, D., Haustein, K., Kornhuber, K., Kunstmann, H., Pinto, J. G., Warrach-Sagi, K., and Xoplaki, E.: The extremely hot and dry 2018 summer in central and northern Europe from a multi-faceted weather and climate perspective, Nat. Hazards Earth Syst. Sci., 23, 1699–1718, https://doi.org/10.5194/nhess-23-1699-2023, 2023. a, b
Rousseeuw, P. J.: Silhouettes: A graphical aid to the interpretation and validation of cluster analysis, J. Comput. Appl. Math., 20, 53–65, https://doi.org/10.1016/0377-0427(87)90125-7, 1987. a
Sandler, D., Saaroni, H., Ziv, B., Tamarin-Brodsky, T., and Harnik, N.: The connection between North Atlantic storm track regimes and eastern Mediterranean cyclonic activity, Weather Clim. Dynam., 5, 1103–1116, https://doi.org/10.5194/wcd-5-1103-2024, 2024. a
Sandonis, L., González-Hidalgo, J., Peña-Angulo, D., and Beguería, S.: Mean temperature evolution on the Spanish mainland 1916–2015, Clim. Res., 82, 177–189, https://doi.org/10.3354/cr01627, 2021. a
Santos, J. A., Pfahl, S., Pinto, J. G., and Wernli, H.: Mechanisms underlying temperature extremes in Iberia: a Lagrangian perspective, Tellus A, 67, 26032, https://doi.org/10.3402/tellusa.v67.26032, 2015. a, b, c
Schielicke, L. and Pfahl, S.: European heatwaves in present and future climate simulations: a Lagrangian analysis, Weather Clim. Dynam., 3, 1439–1459, https://doi.org/10.5194/wcd-3-1439-2022, 2022. a
Scorzini, A. R. and Leopardi, M.: Precipitation and temperature trends over central Italy (Abruzzo Region): 1951–2012, Theor. Appl. Climatol., 135, 959–977, https://doi.org/10.1007/s00704-018-2427-3, 2019. a
Seager, R., Osborn, T. J., Kushnir, Y., Simpson, I. R., Nakamura, J., and Liu, H.: Climate Variability and Change of Mediterranean-Type Climates, J. Climate, 32, 2887–2915, https://doi.org/10.1175/JCLI-D-18-0472.1, 2019. a
Sicard, M., Córdoba-Jabonero, C., López-Cayuela, M.-Á., Ansmann, A., Comerón, A., Zorzano, M.-P., Rodríguez-Gómez, A., and Muñoz-Porcar, C.: Aerosol radiative impact during the summer 2019 heatwave produced partly by an inter-continental Saharan dust outbreak – Part 2: Long-wave and net dust direct radiative effect, Atmos. Chem. Phys., 22, 1921–1937, https://doi.org/10.5194/acp-22-1921-2022, 2022. a
Sousa, P. M., Trigo, R. M., Barriopedro, D., Soares, P. M. M., and Santos, J. A.: European temperature responses to blocking and ridge regional patterns, Clim. Dynam., 50, 457–477, https://doi.org/10.1007/s00382-017-3620-2, 2018. a, b, c, d
Sousa, P. M., Barriopedro, D., Ramos, A. M., García-Herrera, R., Espírito-Santo, F., and Trigo, R. M.: Saharan air intrusions as a relevant mechanism for Iberian heatwaves: The record breaking events of August 2018 and June 2019, Weather and Climate Extremes, 26, 100224, https://doi.org/10.1016/j.wace.2019.100224, 2019. a, b, c, d, e, f, g, h, i
Sousa, P. M., Barriopedro, D., García-Herrera, R., Woollings, T., and Trigo, R. M.: A new combined detection algorithm for blocking and subtropical ridges, J. Climate, 34, 1–64, https://doi.org/10.1175/JCLI-D-20-0658.1, 2021. a
Staten, P. W., Lu, J., Grise, K. M., Davis, S. M., and Birner, T.: Re-examining tropical expansion, Nat. Clim. Change, 8, 768–775, https://doi.org/10.1038/s41558-018-0246-2, 2018. a
Tencer, B., Bettolli, M., and Rusticucci, M.: Compound temperature and precipitation extreme events in southern South America: associated atmospheric circulation, and simulations by a multi-RCM ensemble, Clim. Res., 68, 183–199, https://doi.org/10.3354/cr01396, 2016. a, b
Teng, H., Leung, R., Branstator, G., Lu, J., and Ding, Q.: Warming Pattern over the Northern Hemisphere Midlatitudes in Boreal Summer 1979–2020, J. Climate, 35, 3479–3494, https://doi.org/10.1175/JCLI-D-21-0437.1, 2022. a, b
Thompson, D. W. J. and Wallace, J. M.: The Arctic oscillation signature in the wintertime geopotential height and temperature fields, Geophys. Res. Lett., 25, 1297–1300, https://doi.org/10.1029/98GL00950, 1998. a
Tuel, A. and Eltahir, E. A. B.: Why Is the Mediterranean a Climate Change Hot Spot?, J. Climate, 33, 5829–5843, https://doi.org/10.1175/JCLI-D-19-0910.1, 2020. a
Ukkola, A. M., De Kauwe, M. G., Roderick, M. L., Abramowitz, G., and Pitman, A. J.: Robust Future Changes in Meteorological Drought in CMIP6 Projections Despite Uncertainty in Precipitation, Geophys. Res. Lett., 47, e2020GL087820, https://doi.org/10.1029/2020GL087820, 2020. a
Urdiales-Flores, D., Zittis, G., Hadjinicolaou, P., Osipov, S., Klingmüller, K., Mihalopoulos, N., Kanakidou, M., Economou, T., and Lelieveld, J.: Drivers of accelerated warming in Mediterranean climate-type regions, npj Clim. Atmos. Sci., 6, 97, https://doi.org/10.1038/s41612-023-00423-1, 2023. a
Vogel, M. M., Orth, R., Cheruy, F., Hagemann, S., Lorenz, R., Van Den Hurk, B. J. J. M., and Seneviratne, S. I.: Regional amplification of projected changes in extreme temperatures strongly controlled by soil moisture-temperature feedbacks, Geophys. Res. Lett., 44, 1511–1519, https://doi.org/10.1002/2016GL071235, 2017. a
Wang, W., Zhou, W., Wang, X., Fong, S. K., and Leong, K. C.: Summer high temperature extremes in Southeast China associated with the East Asian jet stream and circumglobal teleconnection, J. Geophys. Res.-Atmos., 118, 8306–8319, https://doi.org/10.1002/jgrd.50633, 2013. a, b
Webster, P.: Dynamics of The Tropical Atmosphere and Oceans, Wiley, 1st edn., ISBN 978-0-470-66256-4, https://doi.org/10.1002/9781118648469, 2020. a, b, c, d, e, f
Wernli, H. and Davies, H. C.: A Lagrangian-based analysis of extratropical cyclones. I: The method and some applications, Q. J. Roy. Meteor. Soc., 123, 467–489, https://doi.org/10.1002/qj.49712353811, 1997. a
Woollings, T., Hannachi, A., and Hoskins, B.: Variability of the North Atlantic eddy-driven jet stream: Variability of the North Atlantic Jet Stream, Q. J. Roy. Meteor. Soc., 136, 856–868, https://doi.org/10.1002/qj.625, 2010. a
Zhang, X., Hegerl, G., Zwiers, F. W., and Kenyon, J.: Avoiding Inhomogeneity in Percentile-Based Indices of Temperature Extremes, J. Climate, 18, 1641–1651, https://doi.org/10.1175/JCLI3366.1, 2005. a
Zhang, X., Alexander, L., Hegerl, G. C., Jones, P., Tank, A. K., Peterson, T. C., Trewin, B., and Zwiers, F. W.: Indices for monitoring changes in extremes based on daily temperature and precipitation data, WIREs Climate Change, 2, 851–870, https://doi.org/10.1002/wcc.147, 2011. a
Zschenderlein, P., Fink, A. H., Pfahl, S., and Wernli, H.: Processes determining heat waves across different European climates, Q. J. Roy. Meteor. Soc., 145, 2973–2989, https://doi.org/10.1002/qj.3599, 2019. a, b, c
- Abstract
- Introduction
- Data
- Saharan air mass definition and intrusion catalogue
- Intrusion types
- Intrusions and extreme temperatures in the Euro-Mediterranean region
- Large-scale circulation associated with the intrusion onset
- Discussion and conclusions
- Code and data availability
- Author contributions
- Competing interests
- Disclaimer
- Acknowledgements
- Financial support
- Review statement
- References
- Supplement