the Creative Commons Attribution 4.0 License.
the Creative Commons Attribution 4.0 License.
 | 23 Jul 2025
Long vs. short: understanding the dynamics of persistent summer hot spells in Europe
Alexandre Tuel
Dim Coumou
Mathieu Vrac
Olivia Martius
The persistence of surface hot spells in Europe on subseasonal timescales can lead to significant socio-economic impacts. Here, we adopt a regional perspective to compare the dynamical features associated with long-lasting persistent (12–26 d) and short-lived (4–5 d) regional-scale hot spells in Europe during summer using the ERA5 reanalysis. We identify six coherent regions in Europe (Southwestern (SW) Europe, Western (W) Europe, Central-Southern Europe, Northern Europe, Eastern Europe, and Northwestern Russia) defined by the clustering of grid cells that experience hot spells at the same time. Temperatures are spatially averaged within each region to identify hot spells; the analysis specifically concentrates on events occurring in SW and W Europe.
In SW Europe, persistent hot spells are tightly linked to antecedent soil dryness. Significant soil moisture anomalies are present in the weeks prior to and during the persistent hot spells but not prior to short hot spells. Persistent hot spells are associated with larger and higher-magnitude positive blocking frequency anomalies compared to short spells, as well as a significant positive frequency anomaly of cutoff lows upstream and south-west of the region, while the jet stream is shifted northwards. Large-scale anticyclonic Rossby wave breaking over Europe and the Mediterranean is also often associated with persistent hot spells in SW Europe. During short hot spells the upstream jet is located further south and the upstream wave train is more zonally oriented, indicating a more transient nature of the Rossby wave pattern, potentially leading to more variable surface weather.
In W Europe, persistent hot spells are marked by strong land–atmosphere coupling, leading to intense soil desiccation during the events but no significant soil moisture anomalies prior to the events. A lower-wavenumber Rossby wave train compared to the short hot spells indicates a more stationary upper-level flow during persistent spells. High blocking frequency and recurrent Rossby wave packets feature in 87 % and 60 % of persistent events in this region, respectively. During short hot spells the upstream jet over the Atlantic extends further east and the upstream cyclone frequency is significantly higher than in the climatology, pointing to the important role of cyclones for the termination of short hot spells.
In both regions, several dynamical mechanisms (blocking, recurrent Rossby wave packets, cutoff lows) contribute to persistent hot spells; in 80 % or more of the cases more than one type of mechanism was involved. The sequence of drivers during the persistent spells varies across spells. In both regions, short spells are associated with a configuration of the upper-level circulation that suggests the presence of more transient waves upstream over the North Atlantic.
- Article
(13512 KB) - Full-text XML
-
Supplement
(66079 KB) - BibTeX
- EndNote


During summer, anomalously high temperature conditions can sometimes persist for weeks. Europe has faced a number of such events of prolonged extreme heat, with notable examples including the devastating heatwave of 2003 (Black et al., 2004; Trigo et al., 2005; García-Herrera et al., 2010), the severe 2010 heatwave in Western Russia (Barriopedro et al., 2011; Di Capua et al., 2021), and the Northern European heatwave of 2018 (Vogel et al., 2019; Drouard et al., 2019; Yiou et al., 2020). These unusually persistent extreme surface weather events resulted in enormous impacts due to the disruption of natural, economic, and social systems (De Bono et al., 2004; Zuo et al., 2015). It has also been recognised that the societal response to such events is influenced by their duration, either independently of their intensity or in addition to it (Polt et al., 2023). In other words, events may surpass the extreme threshold by little or a lot, but it is their continued exceedance over a longer-than-usual period that does not give systems respite and thus negatively impacts their ability to recover following an event (Flach et al., 2021). In some midlatitude regions, the difficulty in acclimatising to prolonged above-normal temperatures increases the risk of mortality (Anderson and Bell, 2011). If the potential for high cumulative impacts on adaptation and resilience is tied to hot spell duration, it is crucial to improve our understanding of and the predictability of such events.
There is substantial literature on extratropical summer heat extremes and their driving mechanisms, often focusing on their frequency and intensity (e.g. Perkins, 2015; Horton et al., 2016; Barriopedro et al., 2023). However, fewer studies have isolated and explored the “duration” dimension of these events. Heat extremes exhibit a wide range of possible durations. They may last only a few days, persist beyond synoptic timescales for up to several weeks, or sometimes even endure for months. They may occur as a single, continuous exceedance of an extreme threshold (quasi-stationarity) or be comprised of multiple repeated occurrences separated by brief intervals (recurrence) (Tuel and Martius, 2023). In this study, we use the term “hot spell” to encompass all these instances of sustained warm temperatures.
Knowledge regarding long-lasting hot spells and their associated drivers and predictors remains limited. This is particularly the case for those hot spells occurring within the subseasonal timescale, which shall henceforth be referred to as “persistent” (or “long”) hot spells. For the purposes of this study, “persistence” refers to episodic persistence (events occurring within specific time intervals) and weather system persistence (a local property tied to the longevity of specific atmospheric patterns).
Despite existing gaps in understanding, numerous studies have already proposed processes and mechanisms that can contribute to increasing the persistence of midlatitude hot spells. Land–atmosphere feedbacks are perhaps the most widely recognised of these drivers (e.g. Fischer et al., 2007; Felsche et al., 2023). As a slowly changing variable, soil moisture serves as a crucial water and energy storage that couples land and atmosphere. This characteristic enables soil moisture to modulate near-surface weather over timescales of weeks to months, much beyond the lifetime of individual synoptic systems (Koster and Suarez, 2001; Wu and Dickinson, 2004; van den Hurk et al., 2012). Precipitation deficits over land can lead to dry soil anomalies, and as a drought develops, the reduction in evapotranspiration leads to lower moisture availability, allowing more of the sun's energy to be used for sensible heating, inducing an increase in near-surface air temperatures (Seneviratne et al., 2010). The positive temperature anomalies obtained through the land surface feedback also exert a dynamical feedback by warming the boundary layer and increasing the geopotential height anomalies. Under favourable conditions, e.g. once an anticyclone establishes itself in the large-scale flow, this land–atmosphere interaction ensures that the atmospheric forcing requires less “effort” to reach extreme temperatures. The resulting above-average number of hot days could mean a higher chance of hot spells occurring, perhaps even persistent ones (Lorenz et al., 2010; Müller and Seneviratne, 2012).
Though soils can act as temperature amplifiers/dampeners, the occurrence of hot spells is primarily influenced by the more rapidly varying atmospheric flow. Indeed, persistent hot spells have often been linked to the occurrence of atmospheric blocking (Black et al., 2004; Drouard and Woollings, 2018) and associated double jet flow structures (Perkins, 2015; Rousi et al., 2022). By definition, long-lasting and quasi-stationary systems that disrupt the westerly zonal flow blocks have a well-established link to prolonged surface weather (Röthlisberger and Martius, 2019; Kautz et al., 2022), among them quasi-stationary amplified circumglobal waves (Kornhuber et al., 2017). Weather recurrence can also contribute to persistence (see Tuel and Martius, 2023, for a review), such as through synoptic-scale recurrent Rossby wave packet activity, whereby troughs and ridges amplify repeatedly at the same longitudes (Röthlisberger et al., 2019; Ali et al., 2021, 2022). Highly nonlinear processes such as Rossby wave breaking (RWB) tie into several of the above-mentioned structures and can also be relevant for prolonged surface weather, though they have more often been studied in connection with persistent precipitation and flooding (Grams et al., 2017; Steinfeld and Pfahl, 2019; Mohr et al., 2020; Tuel et al., 2022; Thompson et al., 2024). There is also evidence to suggest that weaker storm track activity is associated with persistent surface heat, particularly over western Eurasia (Pfleiderer and Coumou, 2018).
Extreme events falling within the subseasonal timescale are influenced by atmospheric flow configurations, which may extend beyond the usual lifetime of synoptic weather systems, and the slower-evolving climate variables such as soil moisture (Vitart and Robertson, 2018). Persistent hot spells, therefore, also hold significant interest for the subseasonal to seasonal prediction (S2S) scientific community due to their potential for providing windows of high predictability for extended-range forecasts (White et al., 2017; Mariotti et al., 2020). Nevertheless, that which gives persistent hot spells predictive potential is the same that renders them notoriously challenging to forecast skilfully – namely, the complex interaction of multiple physical links at different temporal scales.
While still valuable, the focus on either individual mechanisms or single case studies can lead to a fragmented understanding of the clearly multifaceted dynamics that create persistent hot spells. Moreover, we expect the relevance and relative contribution of this “ensemble of processes” to vary depending on the affected region (e.g. Pfleiderer and Coumou, 2018; Tuel and Martius, 2024) and there remain gaps in our knowledge in this regard. Understanding the spatiotemporal characteristics and the processes that contribute to the persistence of hot spells in Europe is vital for their accurate representation in models, thereby leading to better estimations of their impacts and enhancing forecasting capabilities (Jacques-Dumas et al., 2022; Domeisen et al., 2023).
To address the research gaps, we conduct a systematic analysis of the dynamics linked to persistent hot spells in selected regions of Europe based on a physically consistent regionalisation. We want to understand why some surface extreme temperature events last longer than others, as well as gauge the extent of what the modern observational record can tell us. For this we compare and contrast long-lasting spells to short-lived ones to better understand the dynamics determining differences in duration. Much in the same way that Drouard and Woollings (2018) did in their study on atmospheric blocks, our purpose is to characterise persistent hot spells through comparison with short ones and to identify significant common ingredients among both types, which might improve the prediction of the former. To our knowledge, long- and short-duration heat extremes have so far not been examined in such a framework in the literature.
Section 2 introduces the data and the methodological approach underpinning the study. Results from the regionalisation and hot spell identification are shown in Sect. 3.1. Section 3.2 and 3.3 provide a comprehensive analysis of a number of hot spell drivers for two selected regions and interpret the results. We begin by examining the link between dry soils and hot spells. In a second part, we use composite analysis to investigate atmospheric variables and processes associated with near-surface temperature persistence. Finally, in Sect. 3.4, we illustrate the complexity and variability of persistent hot spells through some examples. Findings and final perspectives are summarised in Sect. 4, along with avenues for further research.
This study uses data from the ERA5 reanalysis over the Northern Hemisphere for 1959–2022 (Hersbach et al., 2020) at 0.5° × 0.5° spatial resolution and a daily temporal resolution, with the period reflecting the years available at the time of data acquisition. Daily means are computed from 6-hourly data. The data encompass 2 m temperature (T2M), 500 hPa geopotential height (Z500), wind speed at 300 hPa (W300), total precipitation, and top-1m soil moisture (SM). SM is determined using a depth-weighted average of the reanalysis' volumetric soil water content layers 1–4, expressed in water percentage by volume. We use the contour tracking tool ConTrack developed by Steinfeld (2021) and based on the work by Schwierz et al. (2004) to detect blocking and cyclone activity. Blocks are identified as regions of 500–150 hPa vertically integrated potential vorticity (VIPV) anomalies below the climatological 10th percentile, with a 70 % contour overlap between 6-hourly time steps for a minimum of 5 d. Cyclones are tracked as closed contours of 6-hourly mean sea level pressure anomalies below the climatological 10th percentile; the mean sea level pressure field has been previously filtered for frequencies in the 2.5 to 6 d range using a Butterworth bandpass filter. PV cutoff vortices, as defined by Wernli and Sprenger (2007), are detected using the tracking tool developed by Kaderli (2023). A cutoff cyclone is identified following the 2 PVU contour line on five isentropic levels between 350 and 330 K and then vertically averaged, subsequently retaining only grid cells where the cutoff structure is found on at least two levels. Overturning RWB frequency composites were also computed for the study using the same feature tracking algorithm employed for the cutoffs, following the index by Barnes and Hartmann (2012); these are provided in the Supplementary Materials as further analysis. In the manuscript, the presence of overturning RWB is inferred visually from the Z500 anomaly fields. Finally, to assess the presence and strength of recurrent Rossby wave packets (RRWPs), we compute the R metric as introduced in Röthlisberger et al. (2019).
Standardised anomalies are calculated for a given day with respect to a mean and standard deviation estimated from a 30 d 8-year moving window, similarly to Pfleiderer et al. (2019) and Tuel and Martius (2024). This procedure removes seasonality and long-term trends in the data.
2.1 Extreme temperature regionalisation
To reduce the dimension of the problem, we cluster the grid cells of our European domain (32–72° N, 25° W–53° E) into distinct regions that experience long-lasting heat extremes simultaneously and thus would share a similar association with large-scale circulation. Before applying the clustering, we first apply a land–sea mask to the T2M fields to retain only grid cells over land, as we are interested in the impacts there. We pre-process the daily data by calculating for each grid cell 3-week non-overlapping T2M averages from the standardised deseasonalised and detrended anomalies. We use non-overlapping periods to avoid introducing temporal dependencies that could complicate event distinction and analysis due to autocorrelation in the temperature series. The time-aggregated series are then binarised, with periods above each grid cell's climatological JJA 95th percentile of the 3-week T2M averages set to 1 and those below set to 0. We then cluster grid cells using the pairwise Jaccard distance matrix, which measures the total number of dissimilar entities between sets divided by the total number of entities:
where J(x,y) is the so-called Jaccard coefficient (see Jaccard, 1912; Choi et al., 2010). This distance metric is ideal for our purposes, as we are interested in the few 1s – meaning the extreme events – and not the many 0s (non-events). Also, the Jaccard distance corresponds to the level of event synchronicity between two binary time series, meaning that the number of clusters can later be defined by requiring that the average synchronicity for each cluster should be above some minimum value. For the clustering procedure itself, we compute a simple agglomerative hierarchical clustering with the average linkage method, the implementation of which is provided by the SciPy Python package and uses the unweighted pair group method with arithmetic mean algorithm (Virtanen et al., 2020). In this approach, there is no need to pre-specify a number of clusters; instead, the resulting dendrogram can be truncated at a desired distance that corresponds to a degree of event co-occurrence. Accordingly, at the truncation distance t = 0.8, we identify clusters corresponding to regions that are completely off continental Europe (excluding the British Isles). We then remove the corresponding grid cells and re-run the clustering procedure. Truncating the dendrogram at t = 0.875, indicating a 12.5 % level of event synchronicity, we obtain six distinct European clusters (see Sect. 3.1 for their description).
For the present study, we select two regions intended to be illustrative of our methodology and the central messages we aim to communicate. Thus, the dynamical analysis in Sect. 3.2, 3.3, and 3.4 is centred on clusters 1 and 2, representing Southwestern Europe and Western Europe, respectively. Figures pertaining to the analysis of other regions can be found in Sect. S5 of the Supplementary Material.
2.2 Definition of long- and short-duration hot spells
Hot spells are defined as continuous exceedances of +1 standard deviation (σ) of the region-averaged T2M anomalies, which have previously been detrended, deseasonalised, and standardised. In a second step, spells that are separated by up to 2 d of each other are merged into one hot spell. This results in each region having its own set of hot spells with varying durations, ranging from the more common short-duration events to the comparatively fewer (rarer) long-duration events. We define long (persistent) spells as events lasting between 12 and 26 d and short spells as lasting between 4 and 5 d. We disregard very short hot spells (1–2 d) as we want our short events to align more closely with the average lifetime of synoptic weather systems. The choice to adopt a broad 14 d range for defining persistent (long) hot spells is somewhat subjective, as there is no agreed-upon definition. However, this decision is intentional, aimed at encompassing the subseasonal timescale as well as increasing the sample size of events. Similarly, the choice of a more moderate threshold of +1σ rather than a more extreme one is also driven by the intention to bolster the number of cases. This threshold corresponds roughly to the 85th percentile of region-averaged anomalies, a threshold also used by Röthlisberger et al. (2019) at the grid point scale, with the resulting events referred to as “moderate hot spells”. With our definition, hot days can thus range from uncommon to rare in terms of magnitude.
Our hot spell definition does not differentiate between quasi-stationary and recurrent behaviour in near-surface weather. As such, it does not distinguish between, for example, an intense heatwave that surpasses the extreme threshold continuously throughout its lifetime and an event comprised of multiple waves occurring in rapid succession. From an impacts perspective, it is reasonable to consider both flavours of persistence together, since both can cause prolonged and impactful surface weather conditions (e.g. Barton et al., 2016; Quandt et al., 2017; Drouard and Woollings, 2018; Tuel et al., 2022).
2.3 Composites and comparisons
Through composite analysis, we discern the characteristics shared by persistent hot spells and compare them with those of short spells. The meteorological fields are composited by initially computing the mean of the days corresponding to the individual spells and subsequently by computing the mean of the spell means in the sample set. Nevertheless, meaningful comparisons are made difficult by two factors: first, the scarcity of the (rarer) detected long spells, constituting only 28 % and 38 % of the number of short spells in regions 1 and 2; second, compositing events that last as long as 2–3 weeks captures more variability than events averaged over just 4–5 d. To address this issue, we randomly subsample 4–5 d periods in the long spells as many times as there are short spells. The subsampling is performed 100 times and the medoid of the resulting 100 composites – i.e. the most representative one in the set – is retained for the comparison with the short spell composite. This approach ensures a more balanced comparison between events of different duration and unequal sample size. Thus, the compositing operation for short hot spells can be formulated in the following way:
and for the long hot spells:
where d and N are the number of days in the spell and the number of events, respectively; D is the distance function in Euclidian space; and sij and represent a given day i in event j of the short and long (* = subsampled) hot spells, respectively. Figure 1 provides a schematic illustration of this methodology. It is important to note that the long-spell subsampling pertains mainly to the analysis of atmospheric variables during the extreme events themselves (Sect. 3.3). The procedure is not applicable when aligning events around their beginning date, as in the case for the SM analysis (Sect. 3.2). When examining the probability of hot spells associated with dry soils, we bootstrap the short spell sample to match the (scarcer) climatological frequency of the long spells. Once more, this approach allows for meaningful comparisons between the two sets of events for each region.
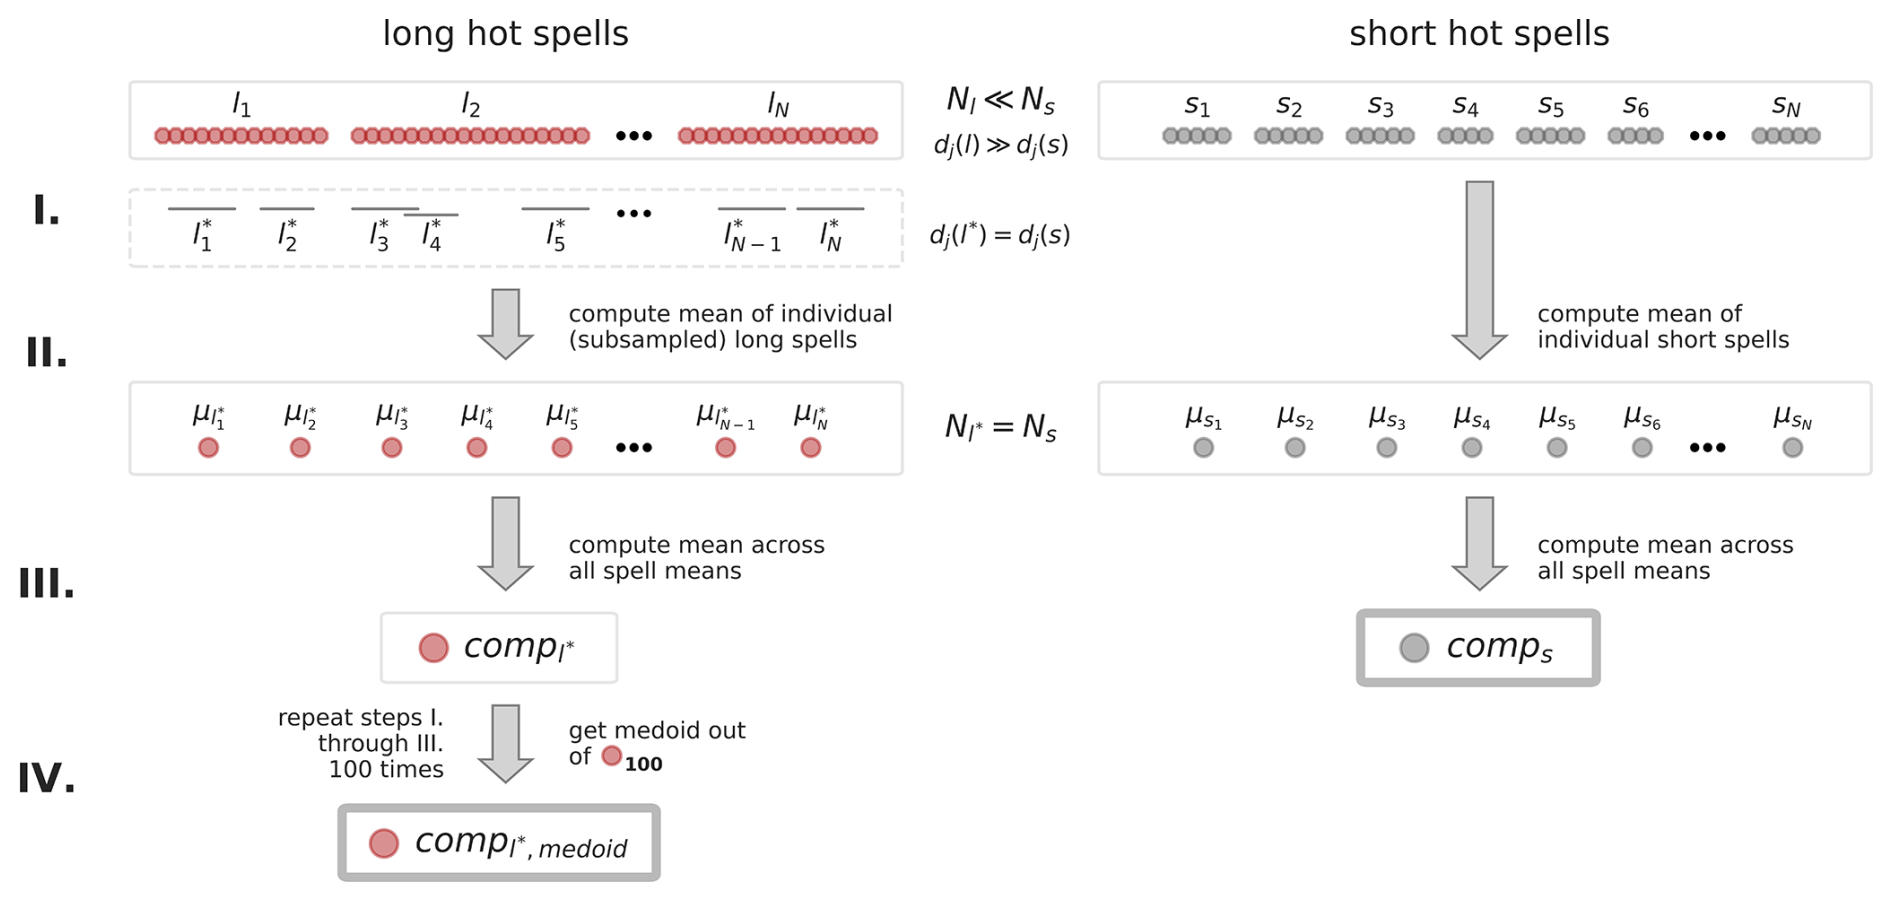
Figure 1Flowchart of methodology for the composite comparison of long and short hot spells used in Sect. 3.3. Step I is the random subsampling of long-duration events; step II is the computation of spell means; step III is the computation of the mean of means; step IV is the selection of the medoid out of the 100 composites from different subsampled sets and pertains only to the long spells. N represents the spell sample size and dj is the duration of individual events.
We test the statistical significance of the composite anomaly fields using a Monte Carlo approach, assessing the rank of each grid point's observed anomaly among 1000 anomalies obtained from randomly generated events. For the long spell fields, we consider grid cells significant if they are identified as such in at least two-thirds of the 100 subsampled composites. In addition, we use a different stippling to mark grid cells where at least one-third of the cases satisfy the given confidence level. Unlike for the short spells, this stippling in the long spell fields should not be interpreted statistically as corresponding to a specified confidence level. In both cases, the purpose is to highlight regions where a signal is present. Random dates for the Monte Carlo sampling are drawn from the summer distributions of occurrences for both the long and short spells in each region. The resulting p values are subsequently adjusted to account for the false discovery rate arising from multiple hypothesis testing (Wilks, 2016).
3.1 Regions and hot spells
The six clusters that result from the extreme temperature regionalisation (Fig. 2a) can be broadly defined as (1) Southwestern (SW) Europe, (2) Western (W) Europe (incl. the British Isles), (3) Central-Southern Europe, (4) Northern Europe/Scandinavia, (5) Eastern Europe/W Russia, and (6) Arctic/NW Russia. These clusters align closely with areas frequently studied in past and current heatwave research (Stefanon et al., 2012; Zschenderlein et al., 2019; Schielicke and Pfahl, 2022; Felsche et al., 2023; Pyrina and Domeisen, 2023). Our regionalisation also demonstrates some robustness, as regions exhibit minimal qualitative differences when the clustering to six final clusters is conducted using 2-week T2M averages and/or a less extreme threshold. We refer the reader to Sect. S1 for a more detailed exploration of the robustness of the regionalisation.
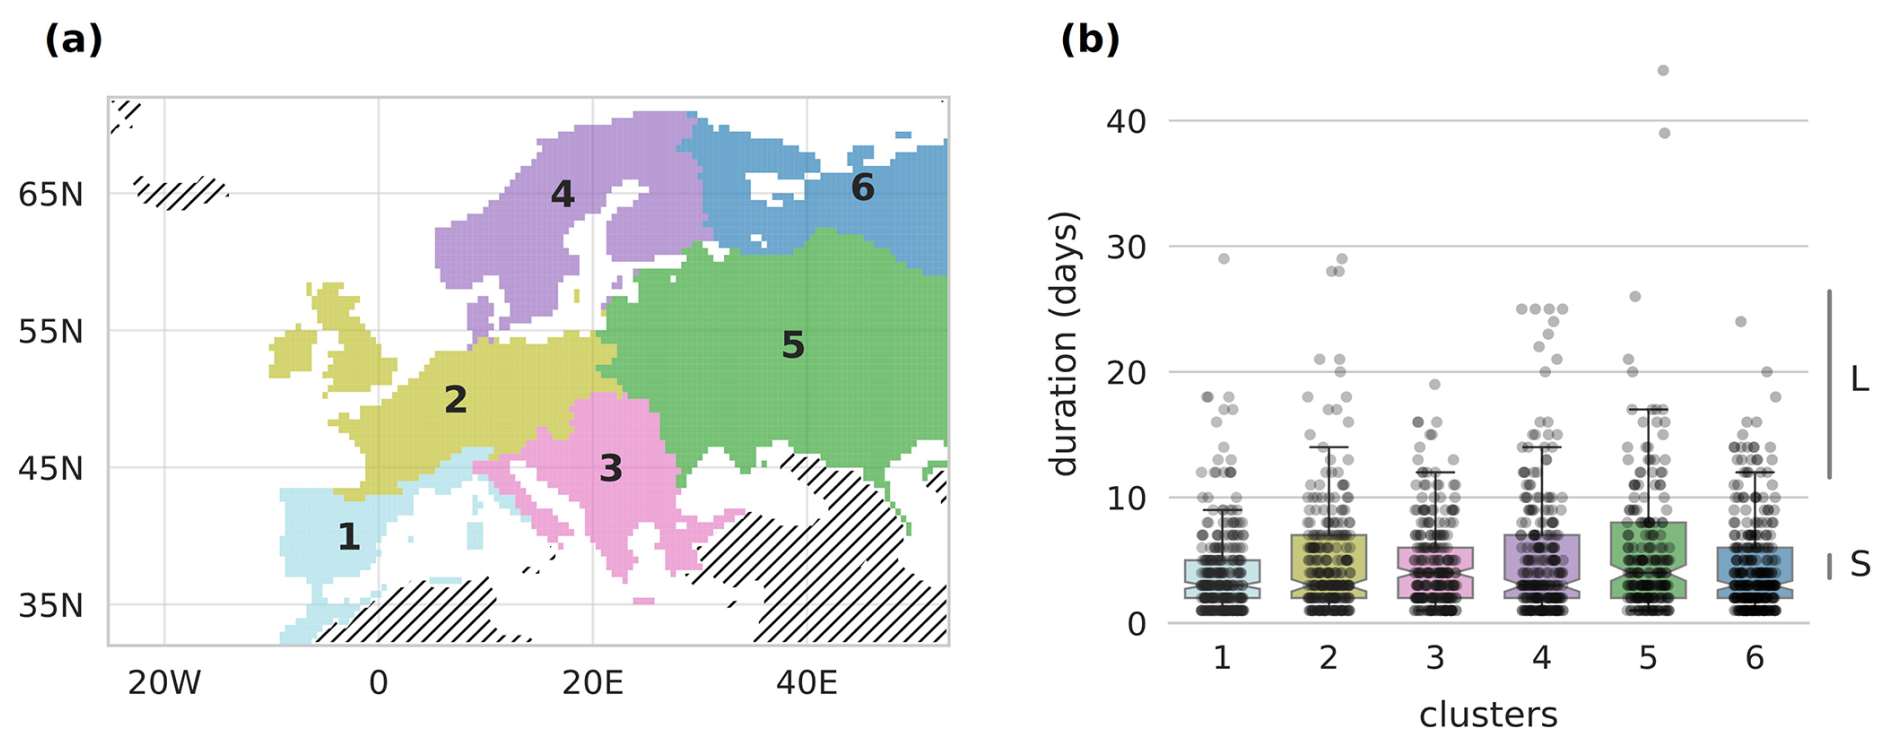
Figure 2(a) Map of the six European regions obtained with the cluster analysis. (b) Distribution of hot spell durations across clustered regions. Each dot represents a detected event, with “L” denoting the range that includes long spells (12 to 26 d) and “S” marking the short spells (4 to 5 d).
Figure 2b depicts the distribution of hot spell durations across each region; relevant statistics regarding the boxplots are provided in Table 1. Short spells are more numerous and therefore also visibly closer to the median, whereas long spells are in the tail of the hot spell distributions, indicating their relative scarcity. The mean spell duration is around 4–5 d, which would actually qualify such events as having an average duration. Nevertheless, we consider these to be short hot spells relative to the subseasonal event lifetime of interest.
Table 1Summary statistics of the identified hot spells for each cluster from the regionalisation.
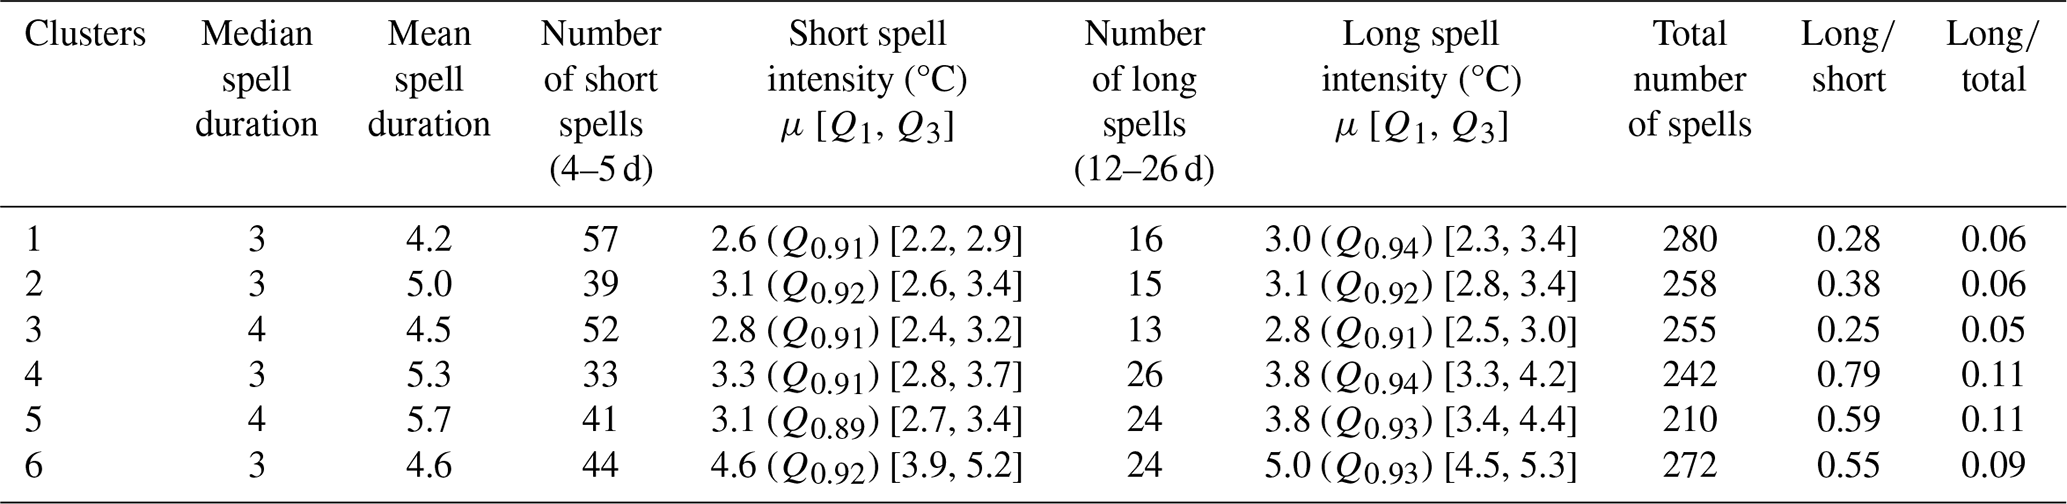
Both regions in Southern Europe (regions 1, 3) have the highest number of short spells, and the fewest long spells (this last point including W Europe). In contrast, northern/eastern Europe (regions 4, 5, 6) average nearly twice as many long spells as those in western/southern Europe (regions 1, 2, 3). Table 1 also shows that, on average, hot spells have a mean intensity at or above the 90th percentile. Long spells are generally more intense than short ones, except in regions 2 and 3, where the intensities of long and short spells are overall more similar. The same pattern is observed when comparing all hot days that make up long and short spells, as opposed to looking at the mean intensity of the entire spell (Fig. S5, Sect. 2).
The varying hot spell statistics of each cluster emphasise the importance of performing the extreme temperature regionalisation. Understandably, however, the actual number of detected hot spells is somewhat susceptible to the exact hot spell definition being used; nevertheless, the broad characteristics remain consistent. We refer the reader to Sect. S3, for an exploration of how different approaches to identify a region's hot spell affects the selected events. The analysis in the following sections focuses on SW Europe (region 1 in Fig. 2a) and W Europe (region 2 in Fig. 2a).
3.2 The link to soil moisture
Both within and across regions 1 and 2, clear differences can be observed between long and short hot spells with regard to the temporal evolution of SM anomalies in the run up to the events (Fig. 3).
In SW Europe (region 1), long spells are frequently preceded by dry soils, as evidenced by the fact that most values in the boxplots are negative (Fig. 3a, left panel). The average extent of dryness across long spells is statistically significant as far back as 6 to 8 weeks prior to the events. Furthermore, the overall spread of anomalies is smaller for long spells compared to short ones. While long spells are almost exclusively associated with very dry soil anomalies in the preceding weeks, short spells are preceded by a wide variety of soil conditions, from rather wet to very dry (Fig. 3a).
In W Europe (region 2), the spread of anomalies is large for both long-lasting and short-lived hot spells (Fig. 3a, right panel). Both types of events can occur after periods of anomalously high and low SM, with an overall tendency towards drier soils in the last 5 weeks for long spells. Indeed, the mean evolution of SM anomalies falls towards increasingly negative values up until the onset of long spells, though average values are not significantly different from zero.
Once the hot spells in both regions commence – i.e. the period represented in Fig. 3a by the thinner boxes on the right of each boxplot group – there is a marked jump to more negative values due to the positive soil-temperature feedback taking effect. The sudden strong desiccation is more pronounced in W Europe than in SW Europe. In both areas, this drop marks a shift to statistically significant average negative SM anomalies, except for short spells in W Europe. The onset of long spells in this region is highly unlikely to experience wetter-than-average SM.
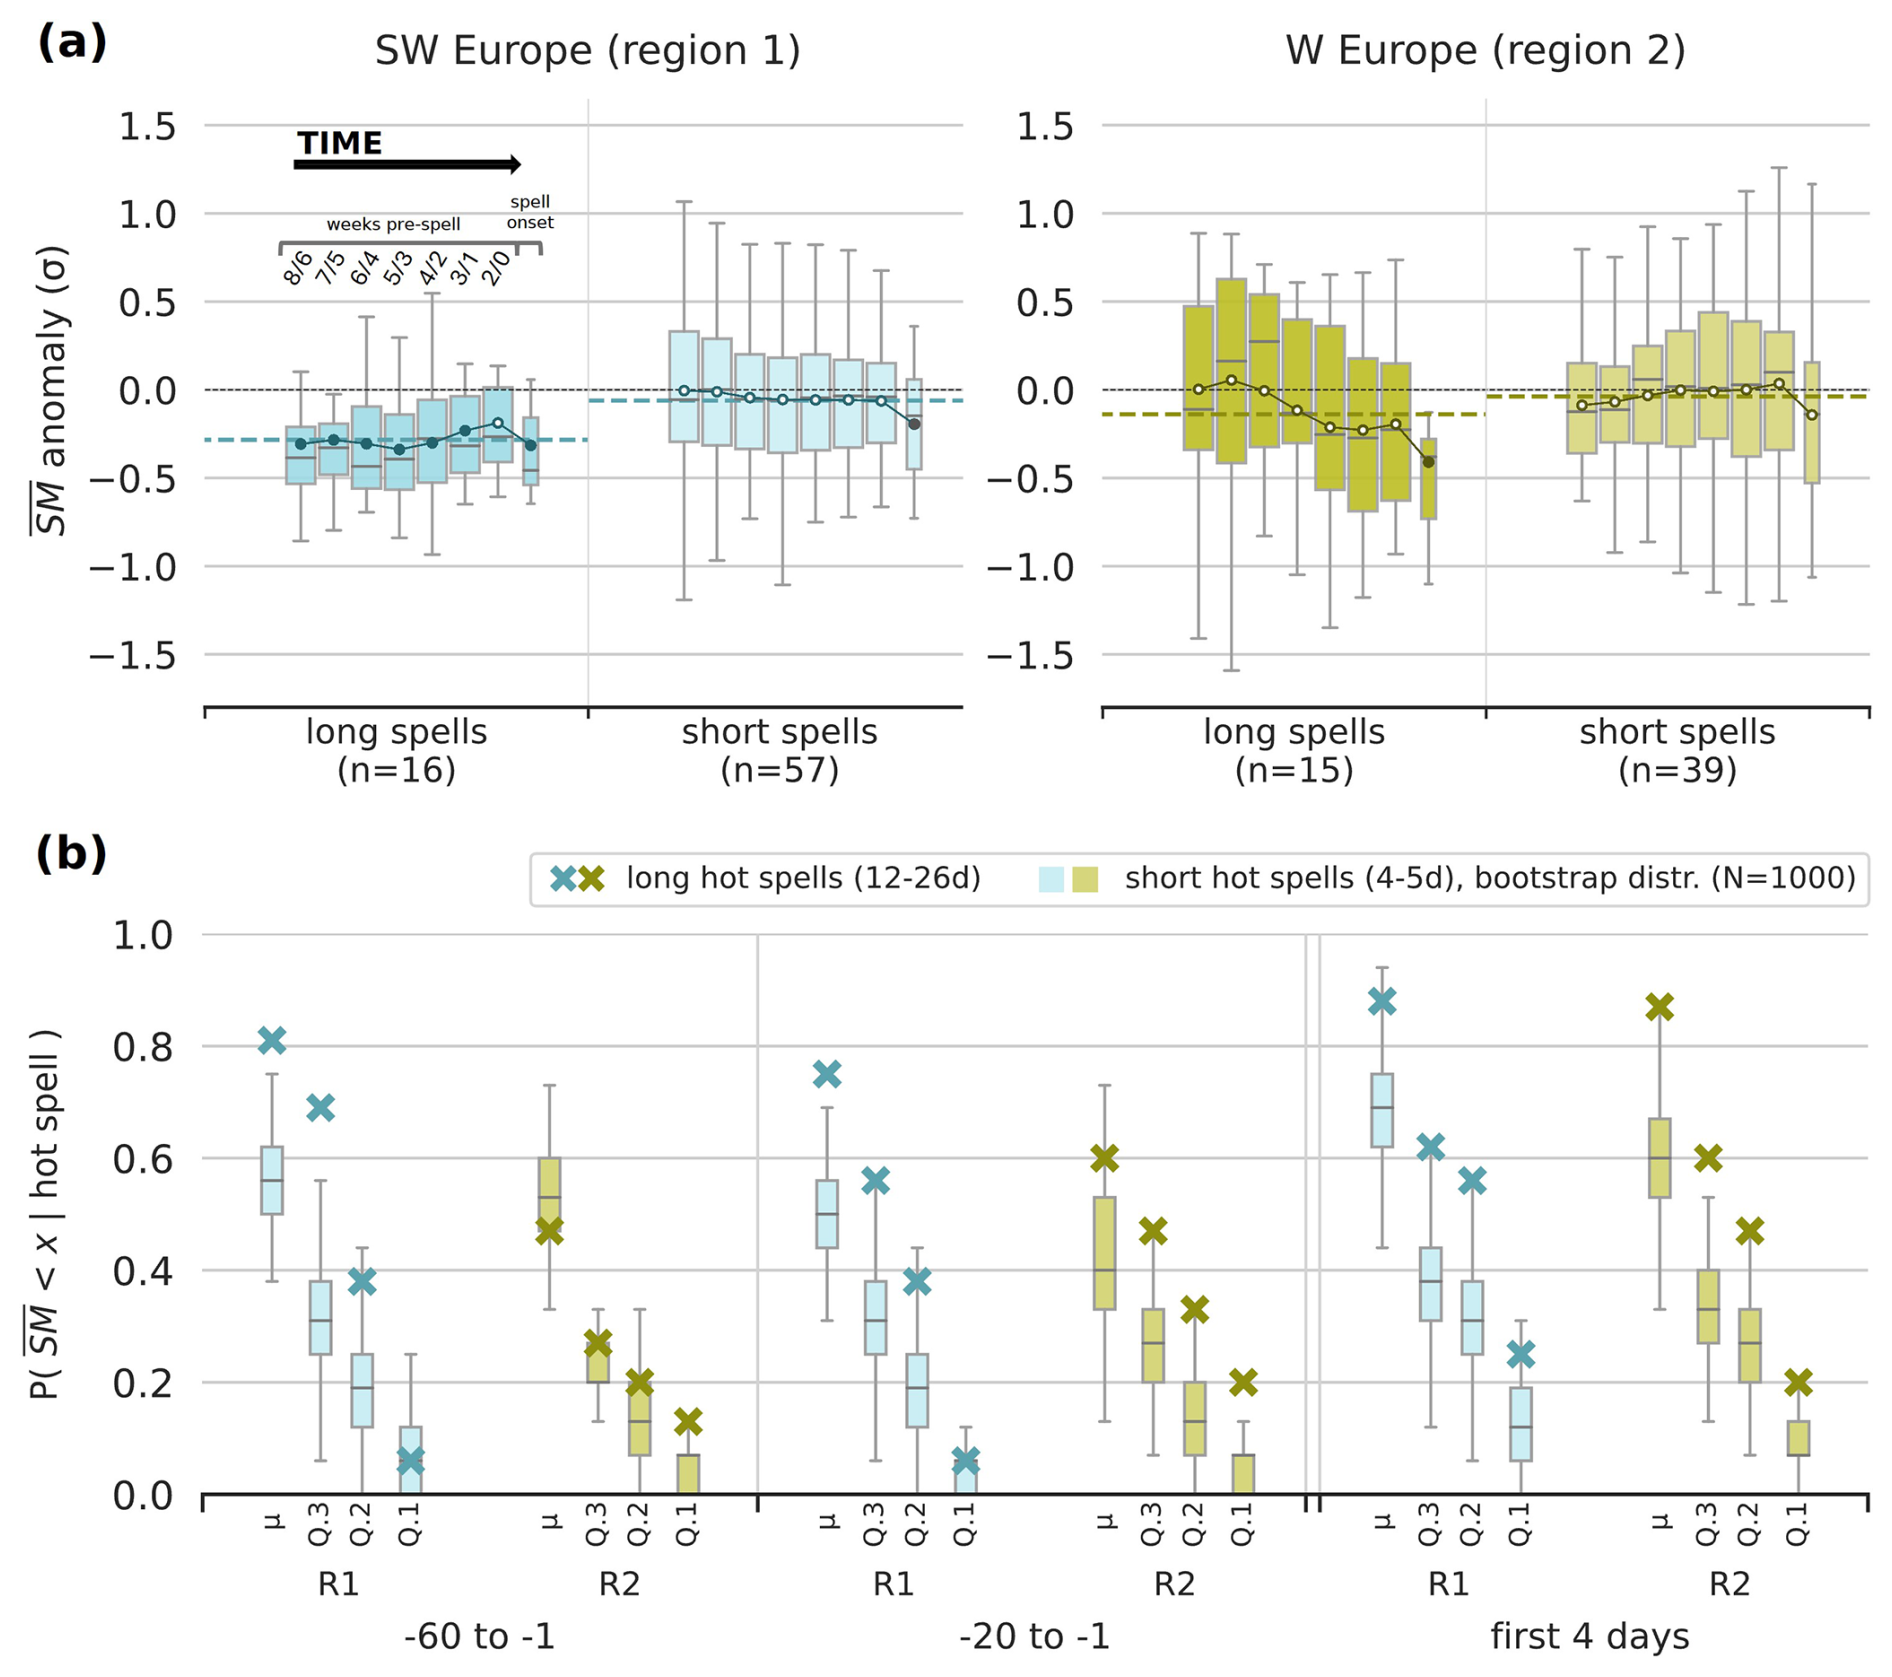
Figure 3(a) Region-averaged standardised soil moisture anomalies in the weeks leading up to the hot spells in regions 1 (left panel) and 2 (right panel) for long- (coloured) versus short-duration (faded colour) hot spells. The boxplots represent 2-week overlapping mean SM anomalies prior to the beginning of all spells (, , , , , , weeks prior), with the final thinner boxplot denoting the values during the first 4 d of the spell. The circles connected by the line are the means of the individual distributions and the filled circles indicate mean anomaly values that are statistically significant at a confidence level of 95 %. The dashed horizontal lines stand for the means across each boxplot grouping. (b) Probability of long and short hot spells in SW Europe (R1) and W Europe (R2) being preceded by 60 and 20 d periods of dry soils as well as during the first 4 d of the events themselves. The thresholds “x” for soil dryness, denoted along the x axis for each boxplot grouping, correspond to the mean (μ), 0.30, 0.20, and 0.10 quantiles of the deseasonalised and detrended AMJJA SM climatology 1959–2022.
Figure 3b illustrates the likelihood of region-averaged SM anomalies falling below specific quantile thresholds (SM < x) during different periods leading up to and at the onset of hot spells. In both regions and across all considered periods, the proportion of long spells associated with soil dryness (even extreme dryness) is almost always either above the upper quartile or completely exceeding the 1.5 interquartile range value of the probability distribution for short spells – under the assumption of equal climatological frequency with long spells (see boxplots in Fig. 3b, left panel). In other words, only in rare cases are short hot spells linked to dry soils to the same degree that persistent events are.
Generally, hot spells in SW Europe are more likely to have been preceded by dry soils than those in W Europe, except for when antecedent SM averages fall below the respective climatological 0.10 quantile relative to the climatology of each region. The desiccating effect of the positive soil-temperature feedback at the onset of hot spells (first 4 d) is evident in both regions, marked by a shift to higher probabilities. As also shown in Fig. 3a, the relative extent of this pre- to post-spell shift is greater for W Europe (Fig. 3b). Overall, persistent hot spells in both regions exhibit a clear – albeit differing in nature – link to SM deficits. For SW Europe the 2-month antecedent dryness in long spells marks the difference from short spells, while further north in W Europe, the notable factor is the differing spread of SM anomalies at spell onset, with those for long spells more unlikely to exceed climatology.
Complementing this picture are the results for the accumulated SM deficit shown in Fig. 4. Long spells in SW Europe show a significant constant depletion of SM from 60 d prior to beyond the events' decay, with the bulk of events showing this deficit as well as statistically significant mean values. Conversely, there is no significant deficit in the lead up to long spells in W Europe. However, during these events, a pronounced accumulated SM deficit develops as the hot spell progresses, though the values themselves are not significantly different from zero. In both regions, short spells show no preferred tendency in the antecedent SM, with progressive depletion and accumulation in the months prior being equally likely precursors.
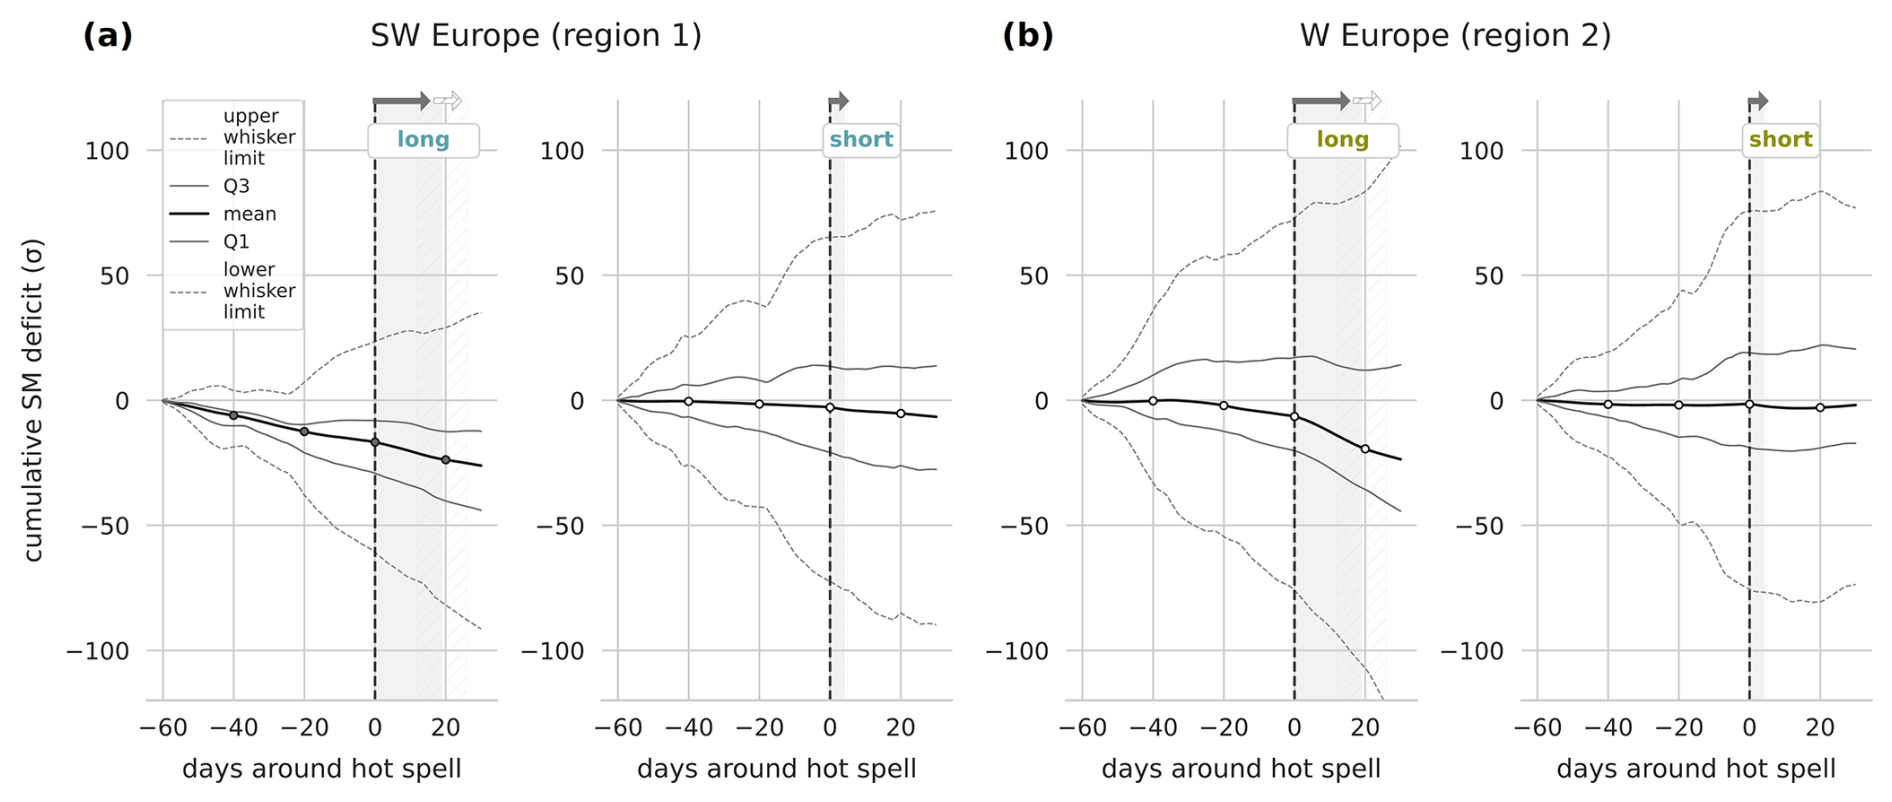
Figure 4Cumulative SM curves calculated with standardised anomalies of volumetric soil water content around long and short spells in (a) SW and (b) W Europe. The x axis ranges from 60 d before to 30 d after hot spell onset. The curves denote the mean (thick black), the 1st and 3rd quartiles (grey), and the lower and upper whisker limit values (thin grey dashed). Filled circles indicate time steps at which the mean value is significantly different from zero at the 95 % level.
As explained in the introduction, there is strong evidence for antecedent dry soils to extend the length of heat extremes in Europe (Brabson et al., 2005; Lorenz et al., 2010). For instance, through modelling experiments, Lorenz et al. (2010) found that antecedent dry conditions in the Iberian Peninsula increase both the length and amplitude of extreme threshold exceedances. A semi-arid region such as SW Europe has a relatively high SM memory (Seneviratne et al., 2010). An unusually long and intense drought in this region, therefore, would cause a cumulative depletion of water in the soils such that even more time is needed for the drought to recover and for the “bucket” to fill to levels where the energy flux partitioning is not favouring sensible heating (Fig. 4a). Until then, the positive warming feedback may continue unless the atmospheric circulation ends the spell by, for instance, causing above-normal precipitation or cold air advection into the region. This is one hypothesis that could explain why long spells in SW Europe are preceded by significant soil dryness up to 2 months prior. Some short hot spells are preceded by substantial SM deficits (Fig. 4a) and have the potential to last longer, but in these cases the atmospheric forcing did not allow the hot spell to persist.
Located further north in a wetter regime, W Europe's hot spells do not have a statistically significant link to antecedent SM deficits (Fig. 4b). Hot spells in W Europe are just as likely to follow wet soil conditions (Rouges et al., 2023), making low SM less of a common precondition for long spells as for SW Europe. There is a pronounced shift to significantly negative SM anomalies at long spell onset (Figs. 3–4), especially in W Europe. The difference in the association with dry soils between long and short spells is substantial.
While low SM favours extreme temperature persistence, our analysis shows that, although a common precondition, it is not a necessary prerequisite for long spells, and even less so for short ones. Figure 3 showed that half of the time in both regions, short hot spells were associated with negative SM anomalies yet the events remained short-lived. The additional Fig. S10 (Sect. S4) indicates that there is no monotonic relationship between SM anomalies and hot spell duration; in fact, SM anomalies around the event better explain its mean intensity rather than its duration. This suggests that something other than the land–atmosphere feedback must be determining the duration of hot spells. Indeed, researchers acknowledge that heatwaves are mainly atmospheric-driven events (Perkins, 2015; Horowitz et al., 2022), with their occurrence and duration strongly determined by the large-scale circulation patterns (Lorenz et al., 2010).
3.3 Atmospheric drivers
Figures 5 and 6 display spatial composites for several atmospheric variables and features during the long and short hot spells for SW Europe (region 1) and W Europe (region 2).
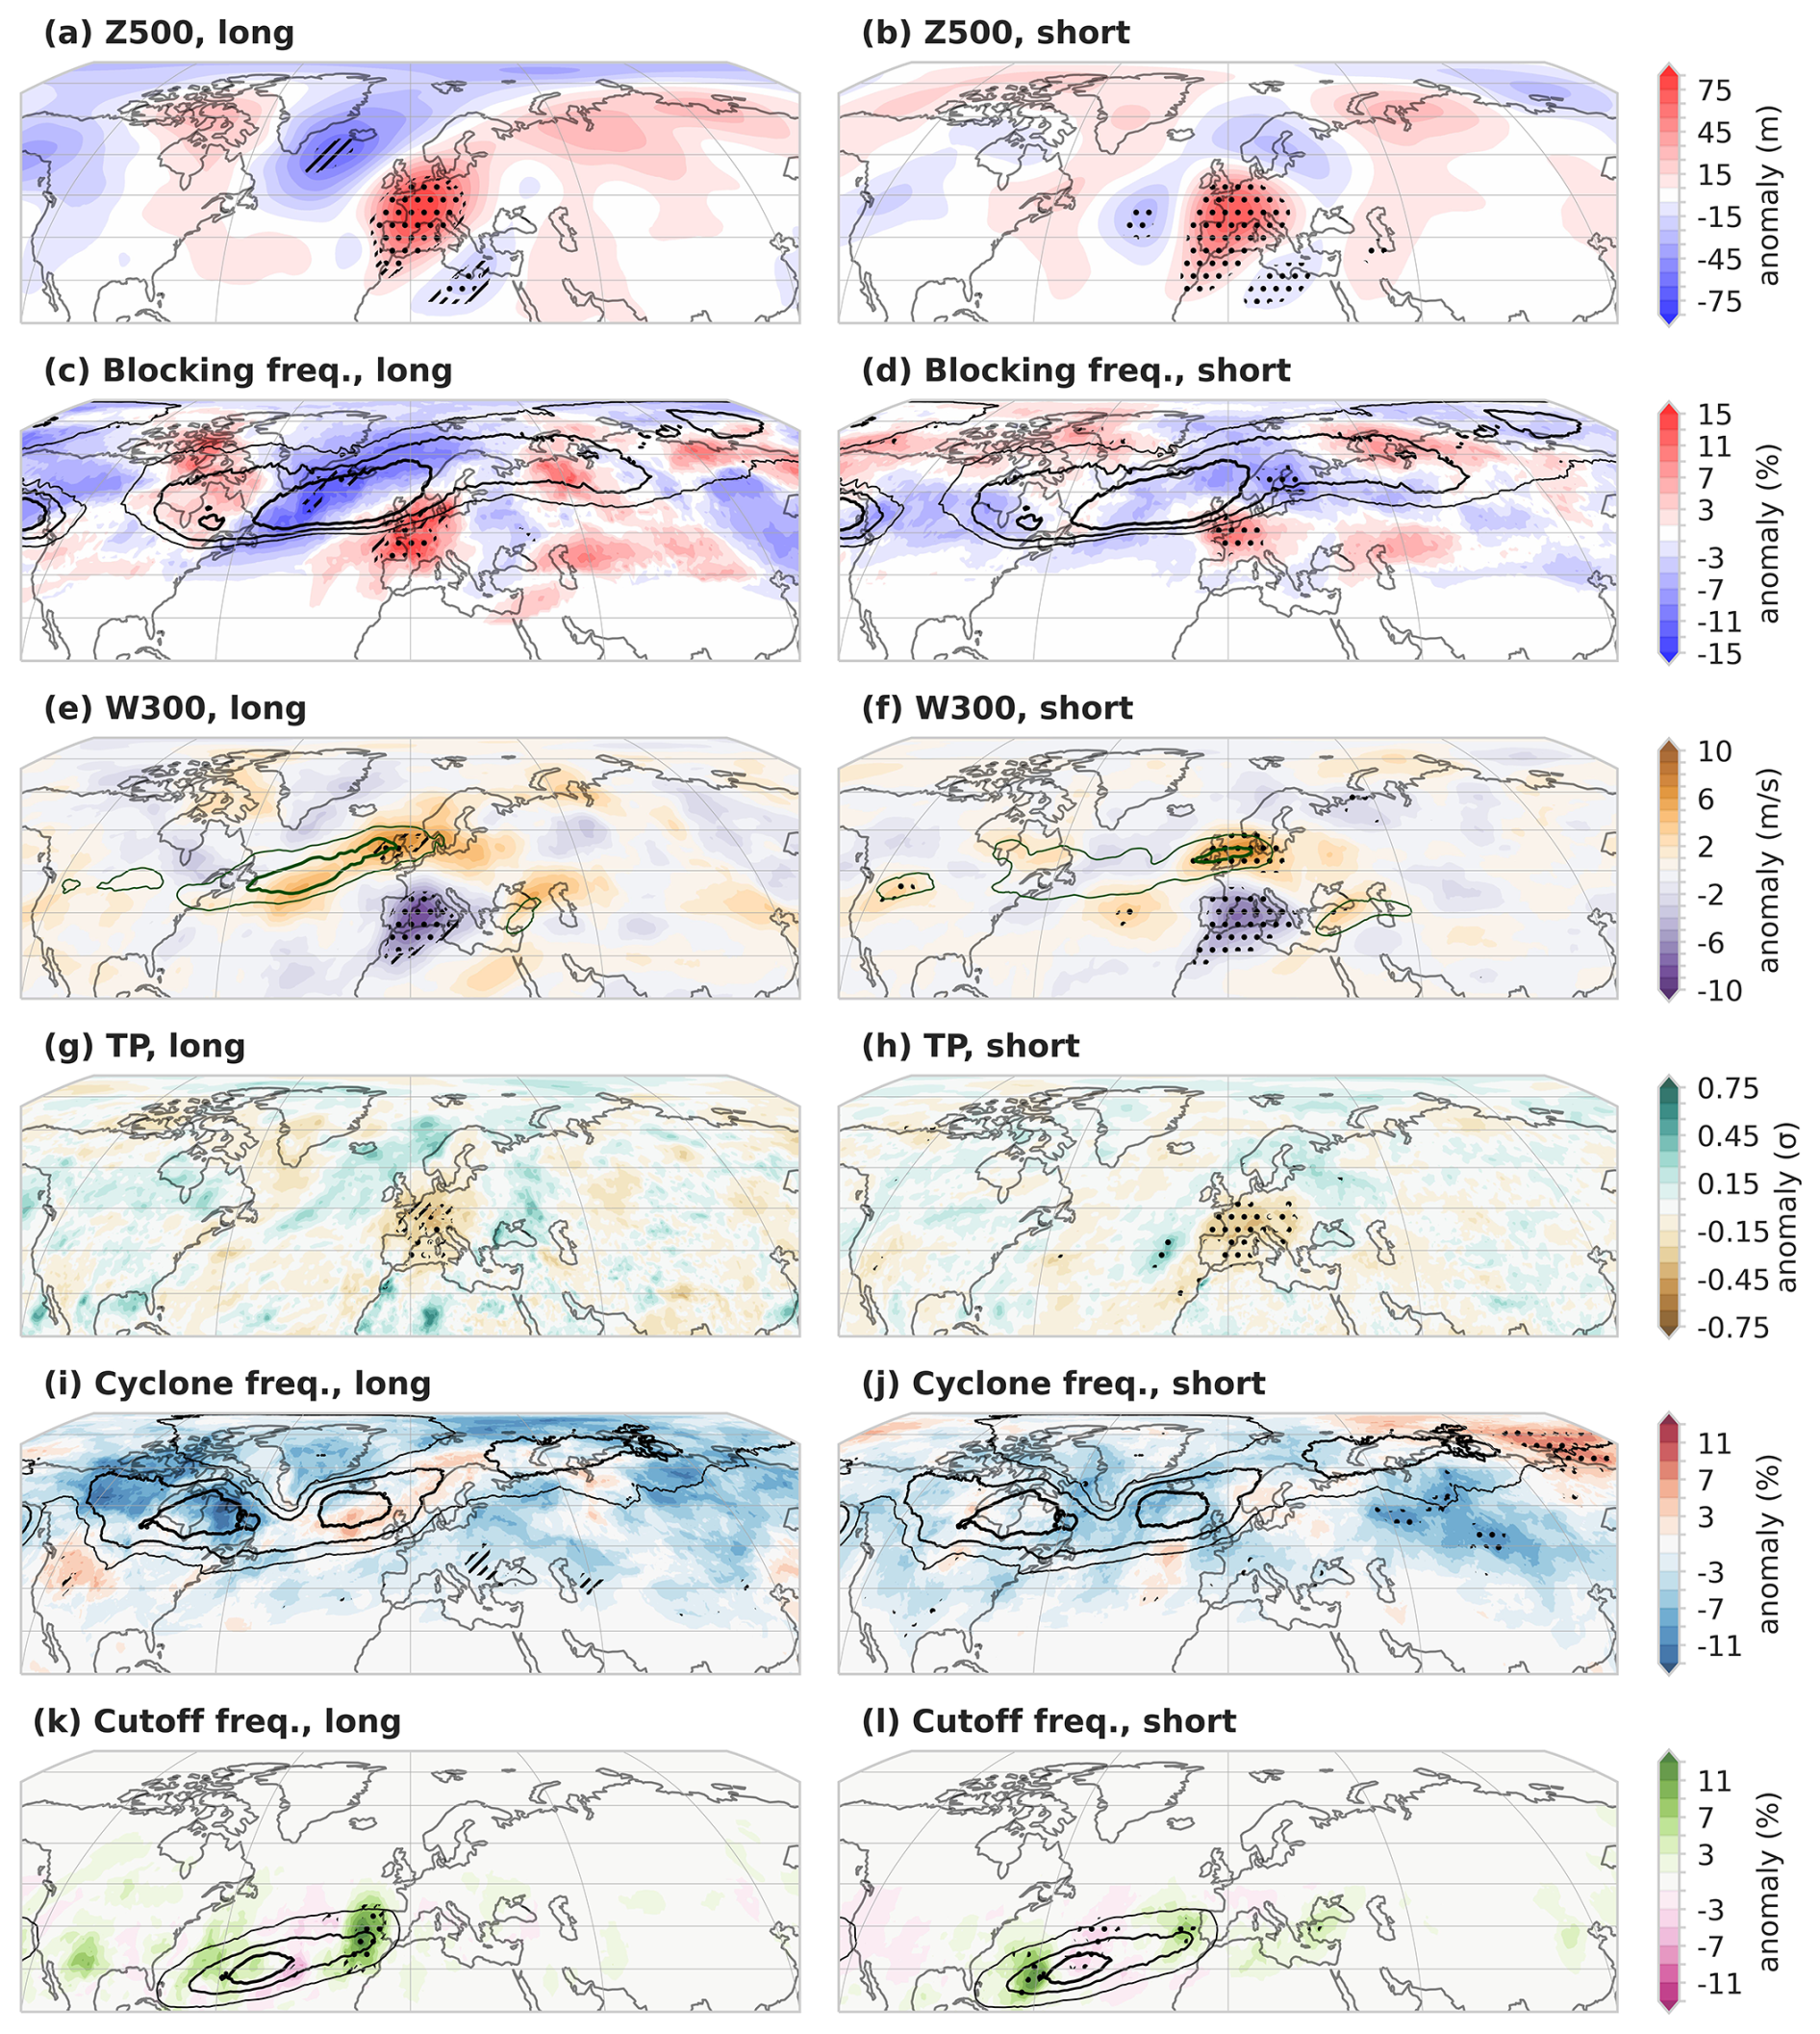
Figure 5Spatial composites for long (a, c, e, g, i, k) and short (b, d, f, h, j, l) hot spells in SW Europe (region 1). The variables Z500, W300, and TP represent geopotential height at 500 hPa, wind speed at 300 hPa, and total precipitation, respectively. Filled contours depict the anomaly field. The contours in panels (e) and (f) (green) show the corresponding absolute wind field to the anomalies (24 and 28 m s−1). The other contours (black) show the mean MJJAS frequency, specifically 10 %, 12 %, and 14 % (c, d); 4 %, 7.5 %, and 10 % (g, h); 14 %, 17 %, and 20 % (k, l). Dashed (dotted) hatching in the long spells denotes areas where the anomalies are significant at a 95 % confidence level in over one-third (two-thirds) of the 100 subsampled composites; dotted hatching in the short spell composites denotes significant anomalies at the 95 % level.
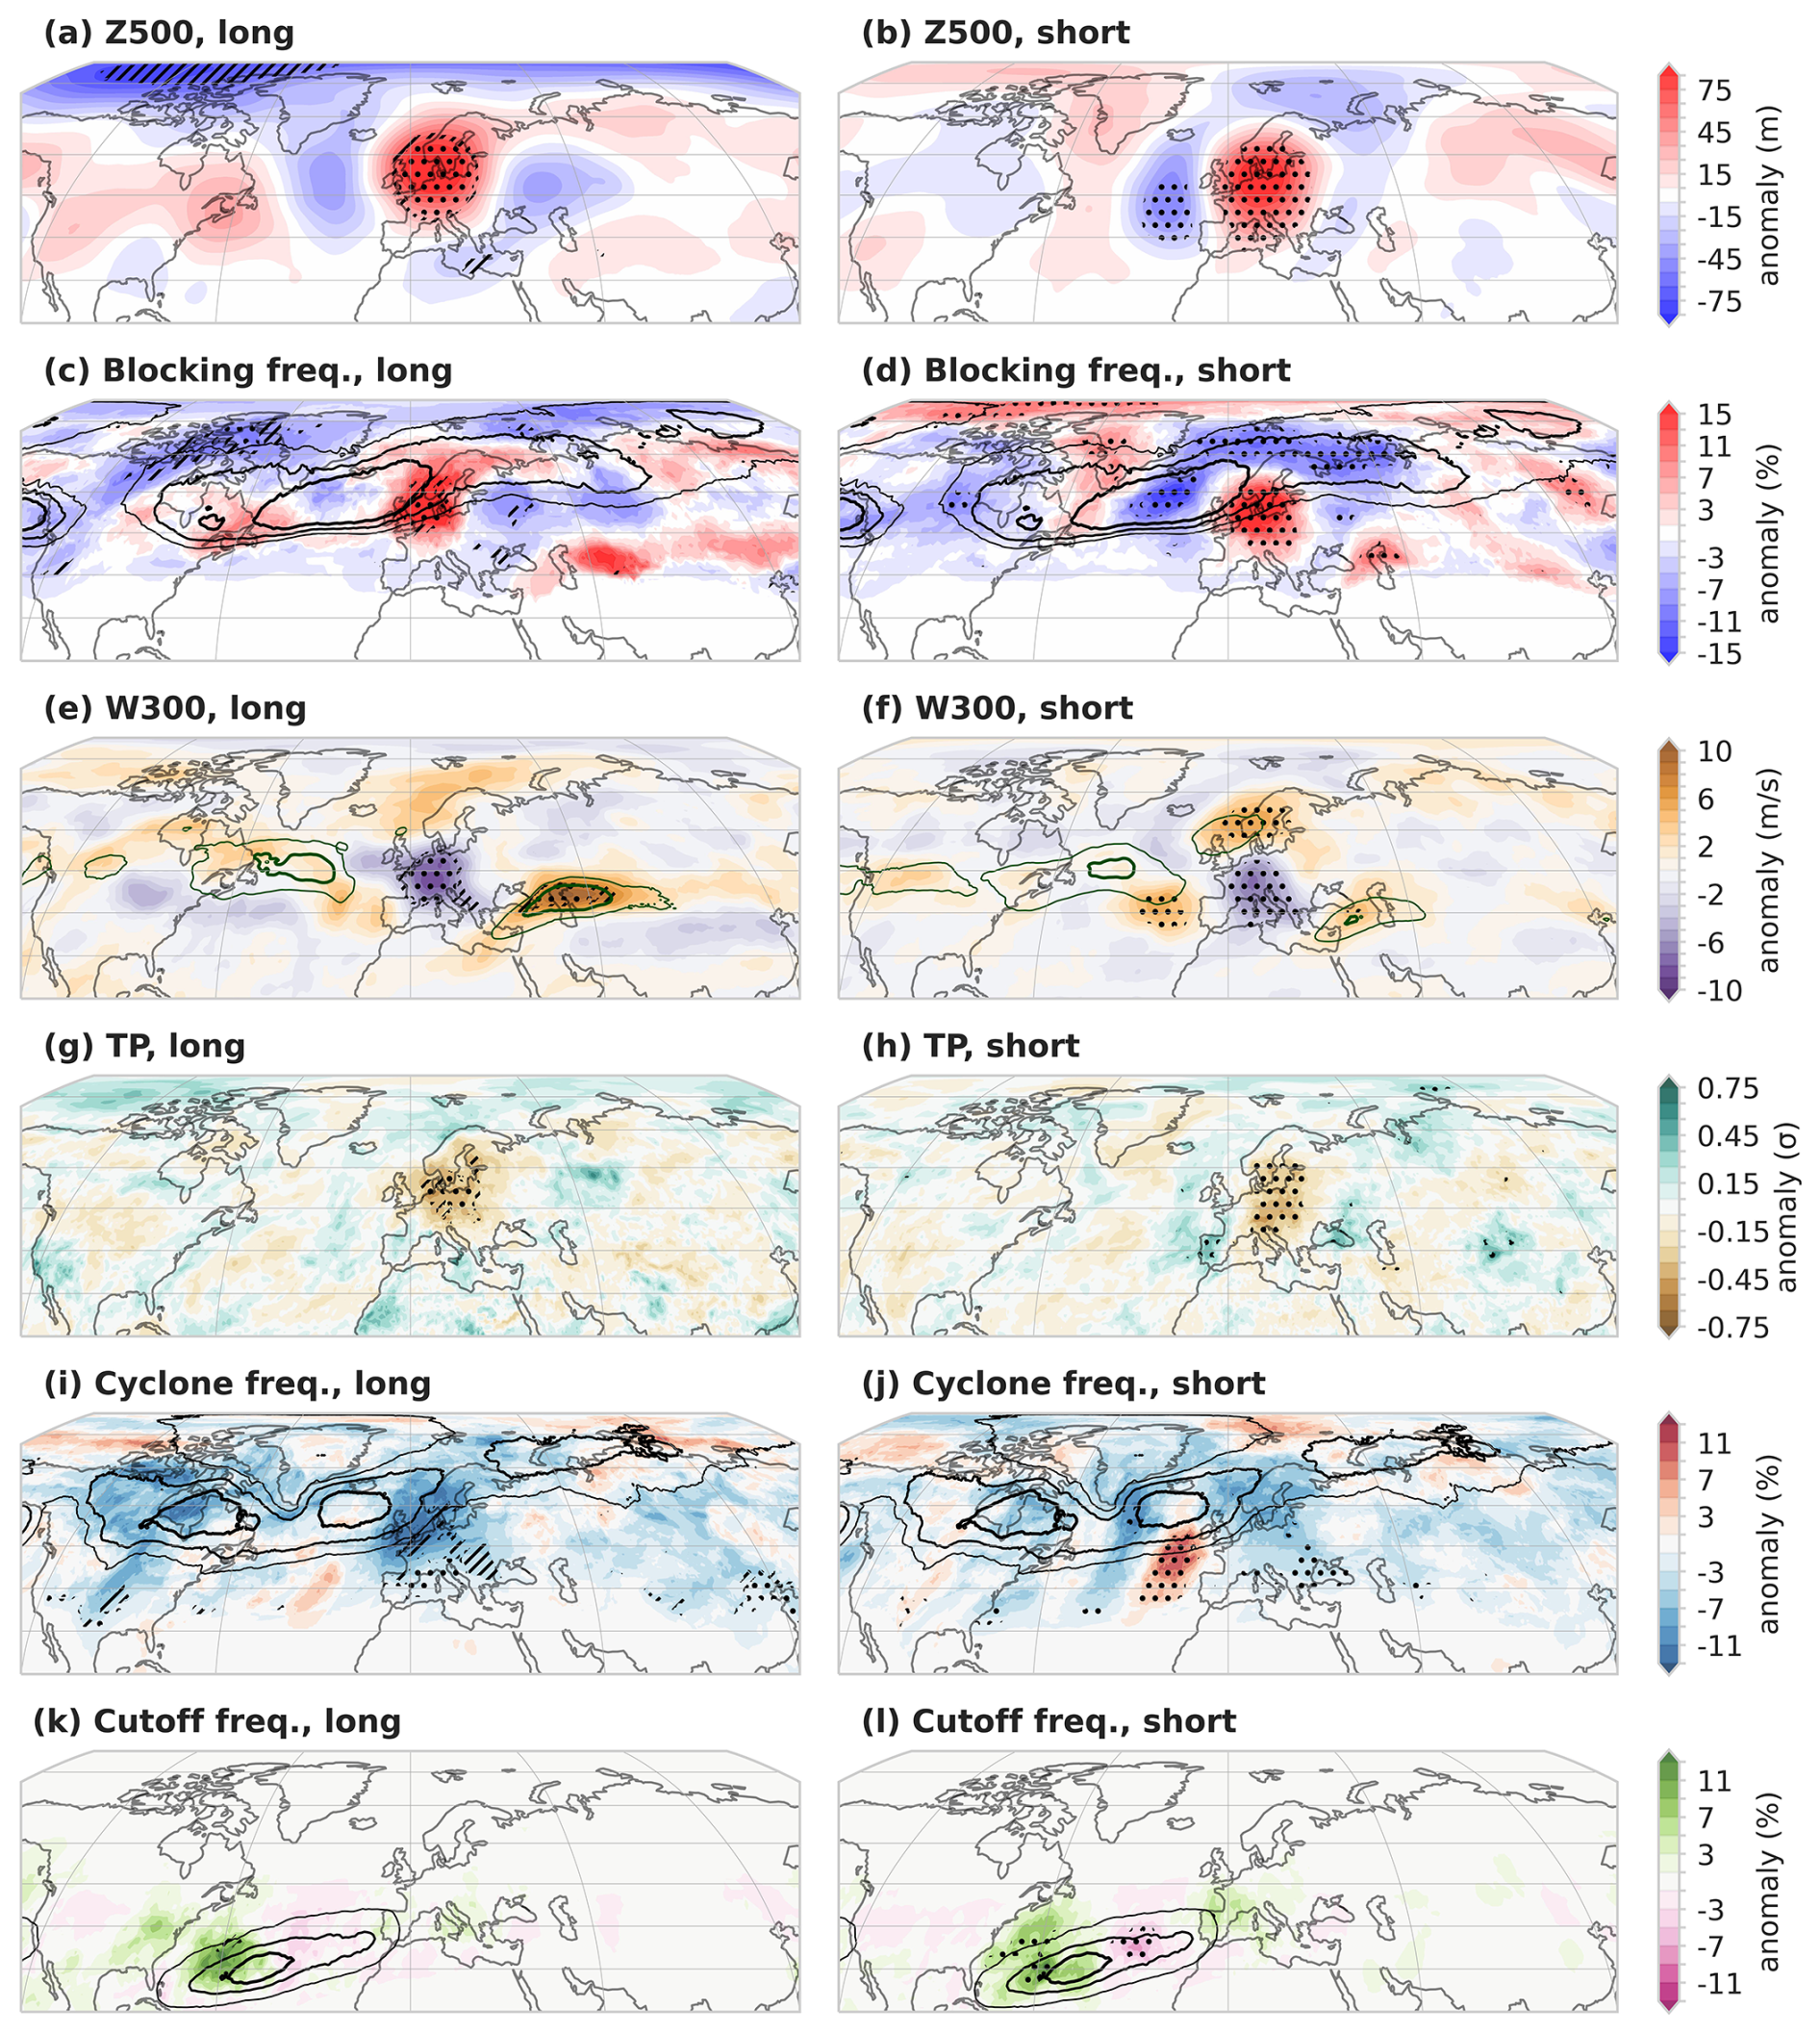
Figure 6Spatial composites for long (a, c, e, g, i, k) and short (b, d, f, h, j, l) hot spells in W Europe (region 2). The variables Z500, W300, and TP represent geopotential height at 500 hPa, wind speed at 300 hPa, and total precipitation, respectively. Filled contours depict the anomaly field. The contours in panels (e) and (f) (green) show the corresponding absolute wind field to the anomalies (24 and 28 m s−1). The other contours (black) show the mean MJJAS frequency, specifically 10 %, 12 %, and 14 % (c, d); 4 %, 7.5 %, and 10 % (g, h); 14 %, 17 %, and 20 % (k, l). Dashed (dotted) hatching in the long spells denotes areas where the anomalies are significant at a 95 % confidence level in over one-third (two-thirds) of the 100 subsampled composites; dotted hatching in the short spell composites denotes significant anomalies at the 95 % level.
3.3.1 Upper-level Rossby wave train orientation and wavenumber
More substantial than the difference in the magnitude of the upper-level circulation anomalies is the difference in their spatial extent and orientation. This is most apparent in the Z500 anomaly composites for W Europe (Fig. 6a, b), where the large-scale ridges and troughs that form the Rossby wave train pattern have a greater longitudinal extension during long spells than short ones. The anomalies are mostly not significant, suggesting that sample variability likely affects the location of the trough and ridge centres. Nonetheless, the footprint of the longer wavelengths is evident and indicative of a more stationary flow, leading to more persistent weather (Hoskins and Ambrizzi, 1993; Hoskins and Woollings, 2015). Note that the “whole-event” composites of the long spells show the statistical significance of the wave train anomalies (Fig. S21, Sect. S6).
The Z500 wave trains during hot spells in SW Europe also display this difference in wavelength (Fig. 5a, b). However, what is more relevant is the difference in orientation of the upper-level Rossby wave pattern. For long spells there is a marked NW-SE tilt typical of a weak waveguide and anticyclonic RWB (Branstator, 2002; Zhang and Wang, 2018; Zavadoff and Kirtman, 2019). While anticyclonic RWB is less persistent than cyclonic RWB (Thorncroft et al., 1993), the almost planetary scale of the anticyclonic wave breaking during long spells makes the structure more robust against cross-contour PV advection and barotropic instability and hence longer-lasting. Anticyclonic RWB results in a poleward displacement of the upper-tropospheric jet (Martius et al., 2007; Barnes and Hartmann, 2012) and hence a northward shift of the storm track and cyclonic activity would be deviated into N Europe, far away from the Iberian Peninsula. The upper-level wind field in the long spell composites shows a poleward shifted jet over the North Atlantic (Fig. 5e), although the positive anomalies themselves are not significantly different from zero. This picture contrasts with that of the short spells, which instead shows a small area of significantly strong winds located further southward, below the upstream trough ahead of SW Europe (Fig. 5f). Cyclone frequency during long spells, too, is slightly anomalously positive over the N Atlantic – close to where the storm track is climatologically most prevalent – though not significant (Fig. 5i).
3.3.2 Blocking
Atmospheric blocks are themselves synonymous with weather system persistence (Rex, 1950; Woollings et al., 2018; Kautz et al., 2022), as they typically involve large-scale anticyclonic conditions that persist beyond their usual duration. Some have likened these weather systems to “traffic jams” that temporarily stall the predominantly eastward flow of the midlatitudes (Nakamura and Huang, 2018). Their quasi-stationarity makes for a clear dynamical link to persistent surface temperature anomalies. Indeed, Röthlisberger and Martius (2019) found that the odds of a hot spell surviving into the next day are increased by as much as 200 % to 300 % in SW Europe when co-occurring with a block. Such a high odds ratio is owed to blocks being climatologically rarer at these lower latitudes (Zschenderlein et al., 2019), meaning that the few times they do occur, their impact on hot spell persistence is substantial. This aligns well with the difference in blocking frequency and spatial extent in our composites (Fig. 5c, d). Blocks in W Europe, conversely, are significantly more persistent during compound hot and dry spells (Röthlisberger and Martius, 2019); this aspect, too, is consistent with findings from our SM analysis (Fig. 4b, left panel).
The local positive blocking anomalies for long spells in W Europe are more meridionally extensive, contrasting with the short spells, for which the smaller positive anomaly is clearly bounded by negative frequency anomalies (Figs. 5–6c, d). Both in the blocking and wind composites, the subsampled long spells do not show statistical significance over the whole area, which could be indicative of the large variability in size, shape, and strength of the feature. That said, compositing over the whole duration of the persistent events leaves no doubt as to the relevance of large-scale blocking across their whole lifetime (Fig. S22, Sect. S6).
Note that results are sensitive to the blocking definition and tracking method. For instance, when using blocks defined with Z500 instead of VIPV, the blocking frequency anomalies associated with hot spells remain within the same range, but the difference between long and short becomes far more pronounced (see Fig. S11, Sect. S4), which would support our arguments even more. Part of the reason for the differing result could be that Z500 is a variable more tightly correlated with surface heat than VIPV (Chan et al., 2019), meaning the tracking algorithm potentially also captured subtropical anticyclones. The nature of the link to surface hot spells depends on the blocking index being used (Villiger, 2017).
The size of the individual blocking system can influence its quasi-stationarity: larger-scale blocks, often associated with longer-wavelength and lower-wavenumber Rossby waves, tend to have slower phase speeds and are more likely to appear stationary relative to a weak mean flow (Hoskins and Ambrizzi, 1993). Figure 7 provides information about average block size during long and short spells for the two above-mentioned indices. We observe for both SW and W Europe that a larger proportion of long hot spells are associated with bigger blocks compared to short hot spells. For both regions, the extent of the difference in the median area covered by blocks depends on the blocking index used. Long spells also tend to have fewer occurrences of either no blocks or small blocks. While it is less common for short spells to coincide with larger blocks, it is certainly still possible. These relationships suggest that in addition to frequency, the large size of the blocking system – and by extension its quasi-stationarity – often contributes to surface heat persistence. However, as in the case for the SM anomalies, the strong association between long spells and block size is not exclusive. Since short spells can sometimes exhibit similar characteristics, the difference in event duration must be subject to other conditions and dynamical configurations discussed in this chapter.
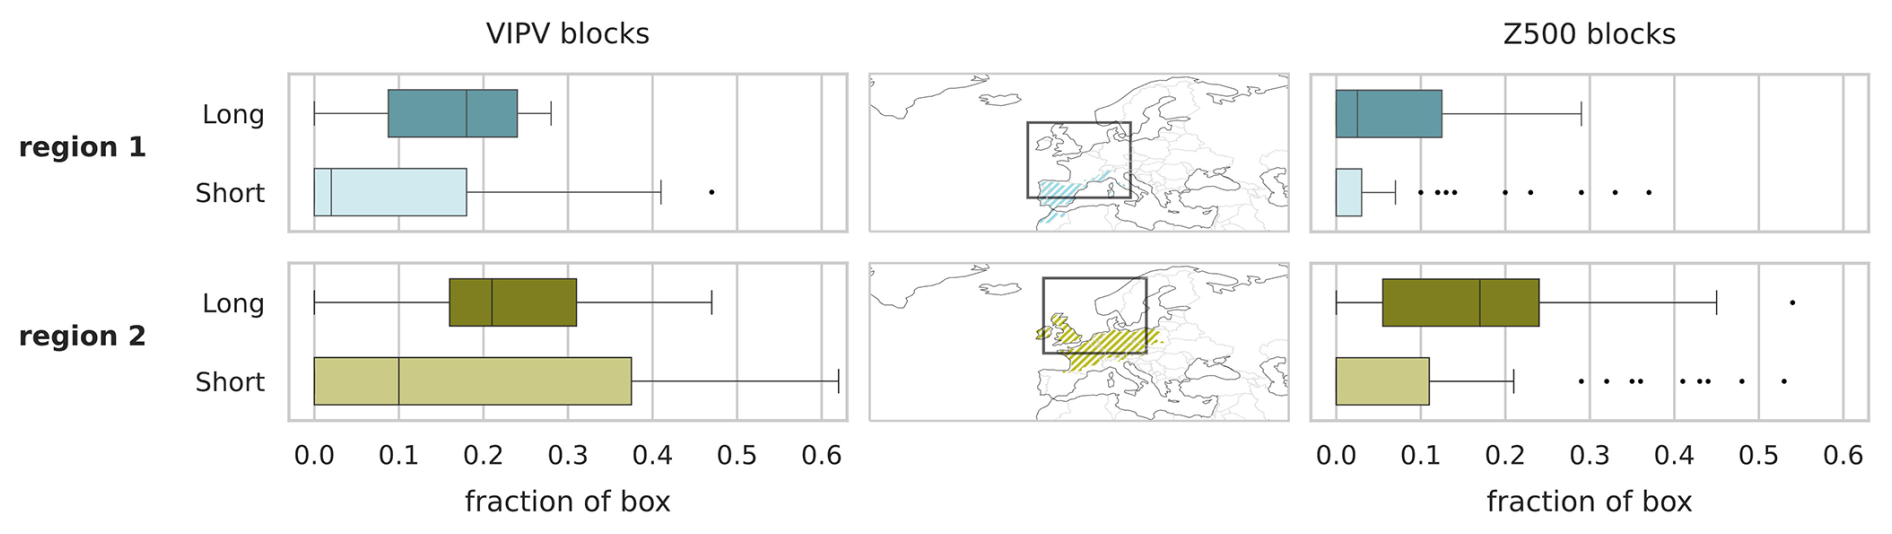
Figure 7Boxplots showing the average fraction of area covered by blocking during the lifetime of long and short spells for SW Europe (region 1, top row) and W Europe (region 2, bottom row). The leftmost panels display results for blocking detected using vertically averaged integrated potential vorticity (VIPV), while the rightmost panels show results from the blocking index based on geopotential height anomalies at 500 hPa (Z500).
3.3.3 Jet and storm track
Accompanying the blocks in W Europe is a splitting of the jet into two branches around the blocking anticyclone (Fig. 6e, f). The block size determines the extent of the northerly deflection of the jet streak.
The short spells in both SW and W Europe show a small area of significant positive W300 anomalies upstream of the hot spell regions and equatorward of the troughs over the western Atlantic (Figs. 5–6f). At the eastern edge of the positive wind anomalies we find statistically significant positive precipitation anomalies (Figs. 5–6h) and cyclone frequencies (Figs. 5–6j). The cyclones and precipitation are signs that the hot spell is soon to end; they can be interpreted as evidence of the transience of the circulation and that variable weather will shortly propagate eastward into the hot spell region and lead to the decay of the hot spell.
3.3.4 Cutoff lows
The bottom-most panels in the composite figures show frequency anomalies of cutoff lows (Figs. 5k, l and 6k, l). These high-PV vortices are detached from and equatorward of the main westerly current in the jet stream and thus potentially quite stationary. In the region over the Atlantic where cutoff lows are most likely to occur, both spell types in SW Europe display a positive-negative-positive tripole pattern. Interestingly, the statistical signal is contrasting: the more remote dipole is significant for short spells but not for long spells. Conversely, the long spell composite shows a strong positive signal upstream of the hot spell region (as much as 10 % more frequent than the MJJAS climatology). The cutoffs' position with respect to the hot spell area suggests that the cutoff would advect warm air from lower latitudes into the hot spell region. This warm air can be moist or dry, depending on the exact position of the cutoff with respect to the Atlantic or the Sahara, i.e. oceanic or continental (Wernli and Sprenger, 2007). The cutoff could either be short-lived and arrive at a fortuitous moment to extend the lifetime of an ongoing hot spell or establish itself for a longer time as the upstream part of a quasi-stationarity omega block. Thus, while upstream cyclones will eventually move in to terminate hot spells, the cyclonic activity of cutoff lows can prolong them. It could be the latitudinal difference of these systems that explains these opposite effects.
High-PV cutoffs have only recently been studied in relation to heatwaves, although mainly focusing on W Europe and not in connection with event persistence (Noyelle et al., 2024). According to our composites, cutoffs do not appear to be a relevant feature during long hot spells in W Europe.
3.3.5 Summary
The composite analysis shows that, on average, during the lifetime of long hot spells, certain large-scale upper-level atmospheric configurations are present that favour this prolonged surface weather. The existing literature and theory confirms that these configurations have a strong link to flow stationarity. Figure 8 summarises region-specific conditions that amount to a characterisation of persistent hot spells in a schematic for each region and spell type. Important features of long spells in SW Europe are the extremely dry antecedent soils in the weeks prior, planetary-scale anticyclonic RWB, frequent blocking, and the above-average presence of cutoff lows. Long spells in W Europe stand out for the strong soil drying during the event, the longer wavelength of the Z500 wave train, meridionally extended blocks, and the absence of anomalous cyclonic activity upstream. Short spells display an overall more transient situation upstream over the North Atlantic as seen in the wind speed, cyclones, shorter wavelengths, and fewer blocks. These individual strands of evidence hint that the atmospheric flow is set up such that the upstream disturbance is moving east into the hot spell region – a situation either prevented or delayed in the case of long spells. This also demonstrates that the upstream dynamics over the North Atlantic are very relevant for understanding hot spell persistence.
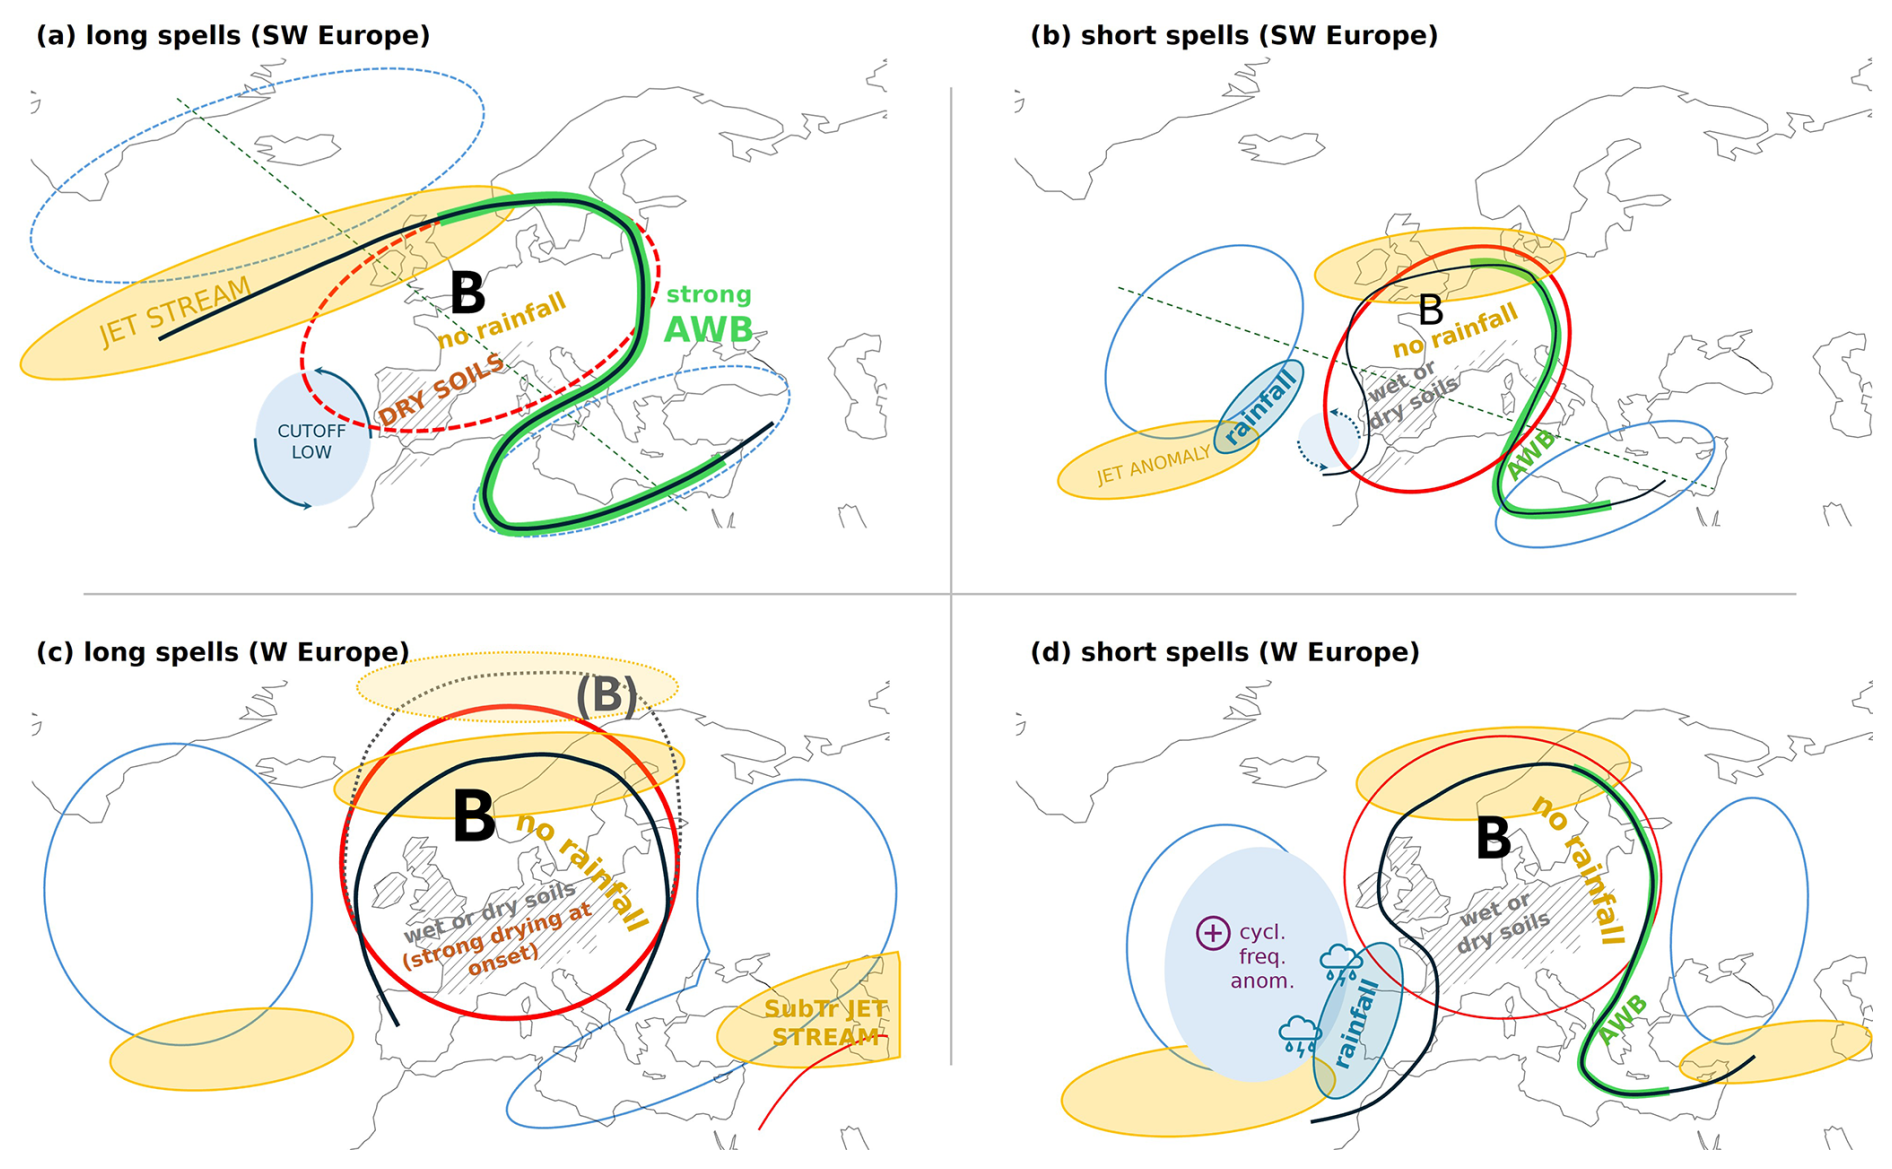
Figure 8Summary schematic depicting idealised structure of long and short spells in SW Europe (a, b) and W Europe (c, d). It illustrates some of the common mechanisms presented and discussed in this study. The grey hatching marks the area affected by the extreme temperature event. The red and blue contours represent the positive and negative Z500 anomalies; the black line sketches the atmospheric block B; the yellow shapes denote the jet streaks; the green line represents anticyclonic wave breaking (AWB). The dotted black line and fainter yellow jet streak in panel (c) represent the potential larger meridional extent of the block (B).
3.4 Variability and typicality of hot spells
The composite analyses reveal average characteristics of long and short hot spells. However, this method cannot capture the full diversity and complexity of flow structures and the varied configurations of driving mechanisms that lead to persistent hot spells. Although long spells generally exhibit more stationary behaviour of weather systems, this should not be taken to mean that the flow remains entirely unchanging throughout the event. A closer look at individual long spells in both studied regions confirms this point (see Fig. 9). Each event is marked by its own combination of SM conditions and atmospheric drivers. Each event has a distinct temperature evolution, with one or multiple local maxima. Some events resemble intense mega-heatwaves, while others consist of shorter waves in quick succession. Each spell is driven by its own set of drivers, which can occur at various stages throughout the event, with different lifespans. This is in agreement with Wehrli et al. (2019), who showed that the contributions of key physical drivers of heat extremes vary from one event to the next. It is further evident that a driver need not necessarily be present for the entire duration of an event for it to contribute to its persistence.
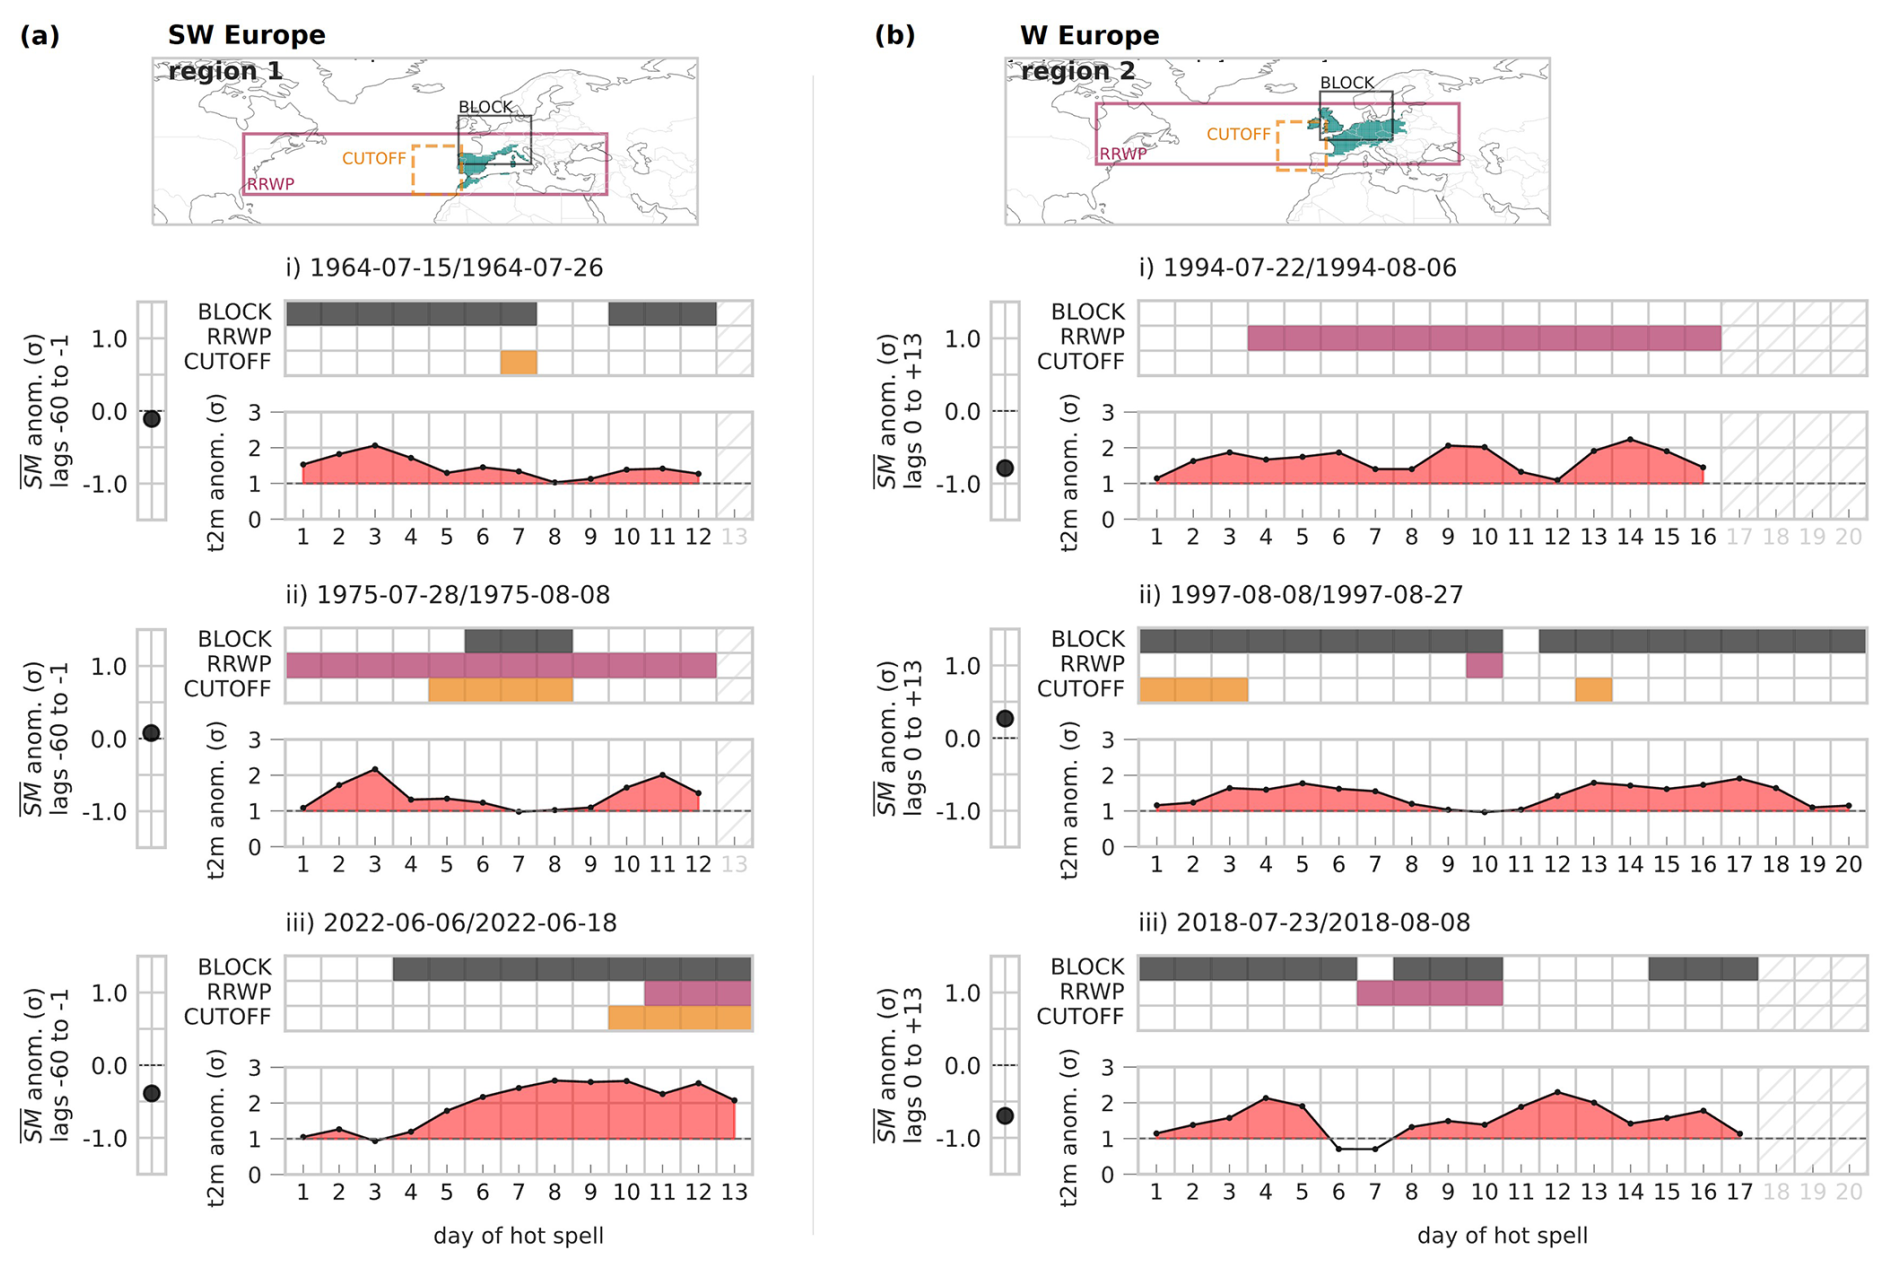
Figure 9Three select persistent events for both SW Europe (a) and W Europe (b). Each case is made up of three subplots: the left sub-panel shows the average SM conditions in the 60 d before the event (region 1) and during the first 2 weeks after onset (region 2); the bottom sub-panel depicts the T2M evolution during the event in red shading; the top sub-panel illustrates the presence of three atmospheric drivers for each case (colour filled boxes). The maps in the top row show the respective areas chosen to compute the proxies for the drivers. For a given day during the spell, a block (black)/cutoff (orange) is present when the feature covers at least 20 % of the boxed area. RRWPs (purple) are accounted for when the region-averaged R metric anomaly exceeds its seasonal 80th percentile.
In addition to the small sample size, our definition of hot spells using a relatively low threshold of +1σ can be a source of variability. Using large-deviation theory (Lucarini et al., 2023; Noyelle et al., 2024) shows that as heatwave intensity increases, the variance between the trajectories leading to the extreme decreases. In other words, typicality results from extreme magnitude: the higher the T2M anomaly, the greater the dynamical similarity.
Figures 10 and 11 provide a summary of each long and short event in SW Europe and W Europe, respectively, highlighting the relative presence of blocking, RRWPs, and cutoff lows in proportion to the event duration. Importantly, they show that the selected mechanisms tend to be present to some degree in the long spells. In SW Europe, blocking is detected during 81 % (37 %) of long (short) spells, while in W Europe, blocks are present in 87 % (59 %) of long (short) spells. For RRWPs, these values are 50 % (35 %) for long (short) spells in SW Europe, and 60 % (15 %) for long (short) spells in W Europe. Although the composites show that cutoffs are not so relevant for long spells in W Europe, these structures are present half of the time, and only in 23 % of short spells. For long spells in SW Europe, these structures are present in all but one case and in around 40 % of short spells. When interpreting and comparing these proportions, as well as the box sizes in the figures, it is important to consider the differing sample size and duration of the two hot spell categories.
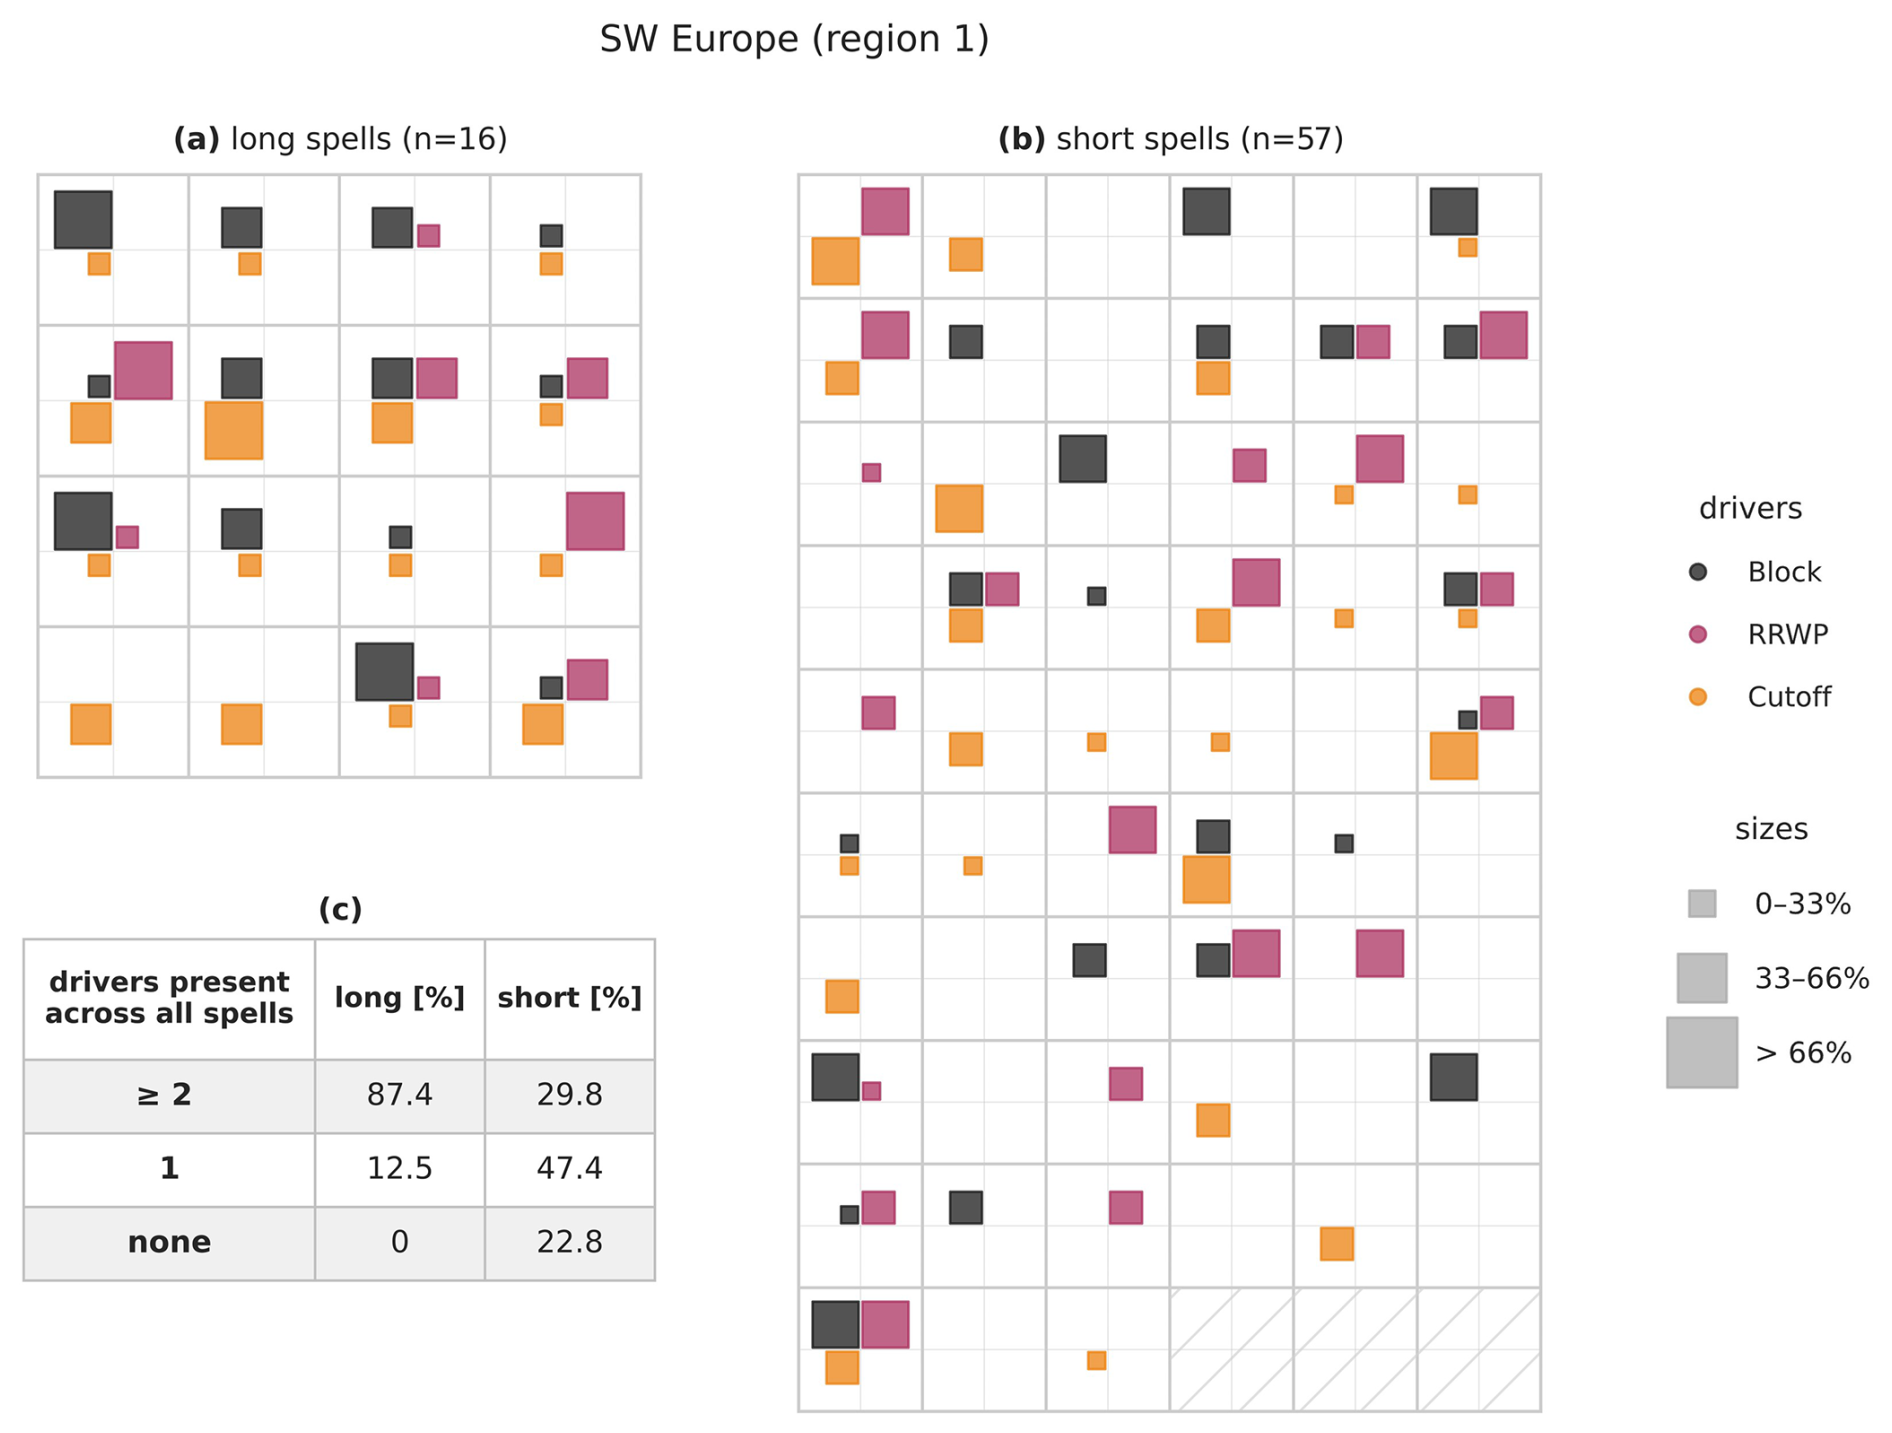
Figure 10Visual representation of the relative frequency of blocks, cutoffs, and RRWPs during (a) long and (b) short hot spells in SW Europe. The size of each square corresponds to the prevalence of each driver in proportion to the event's duration. Panel (c) illustrates the proportion of spells characterised by the presence of more than two, exactly one, or no drivers.
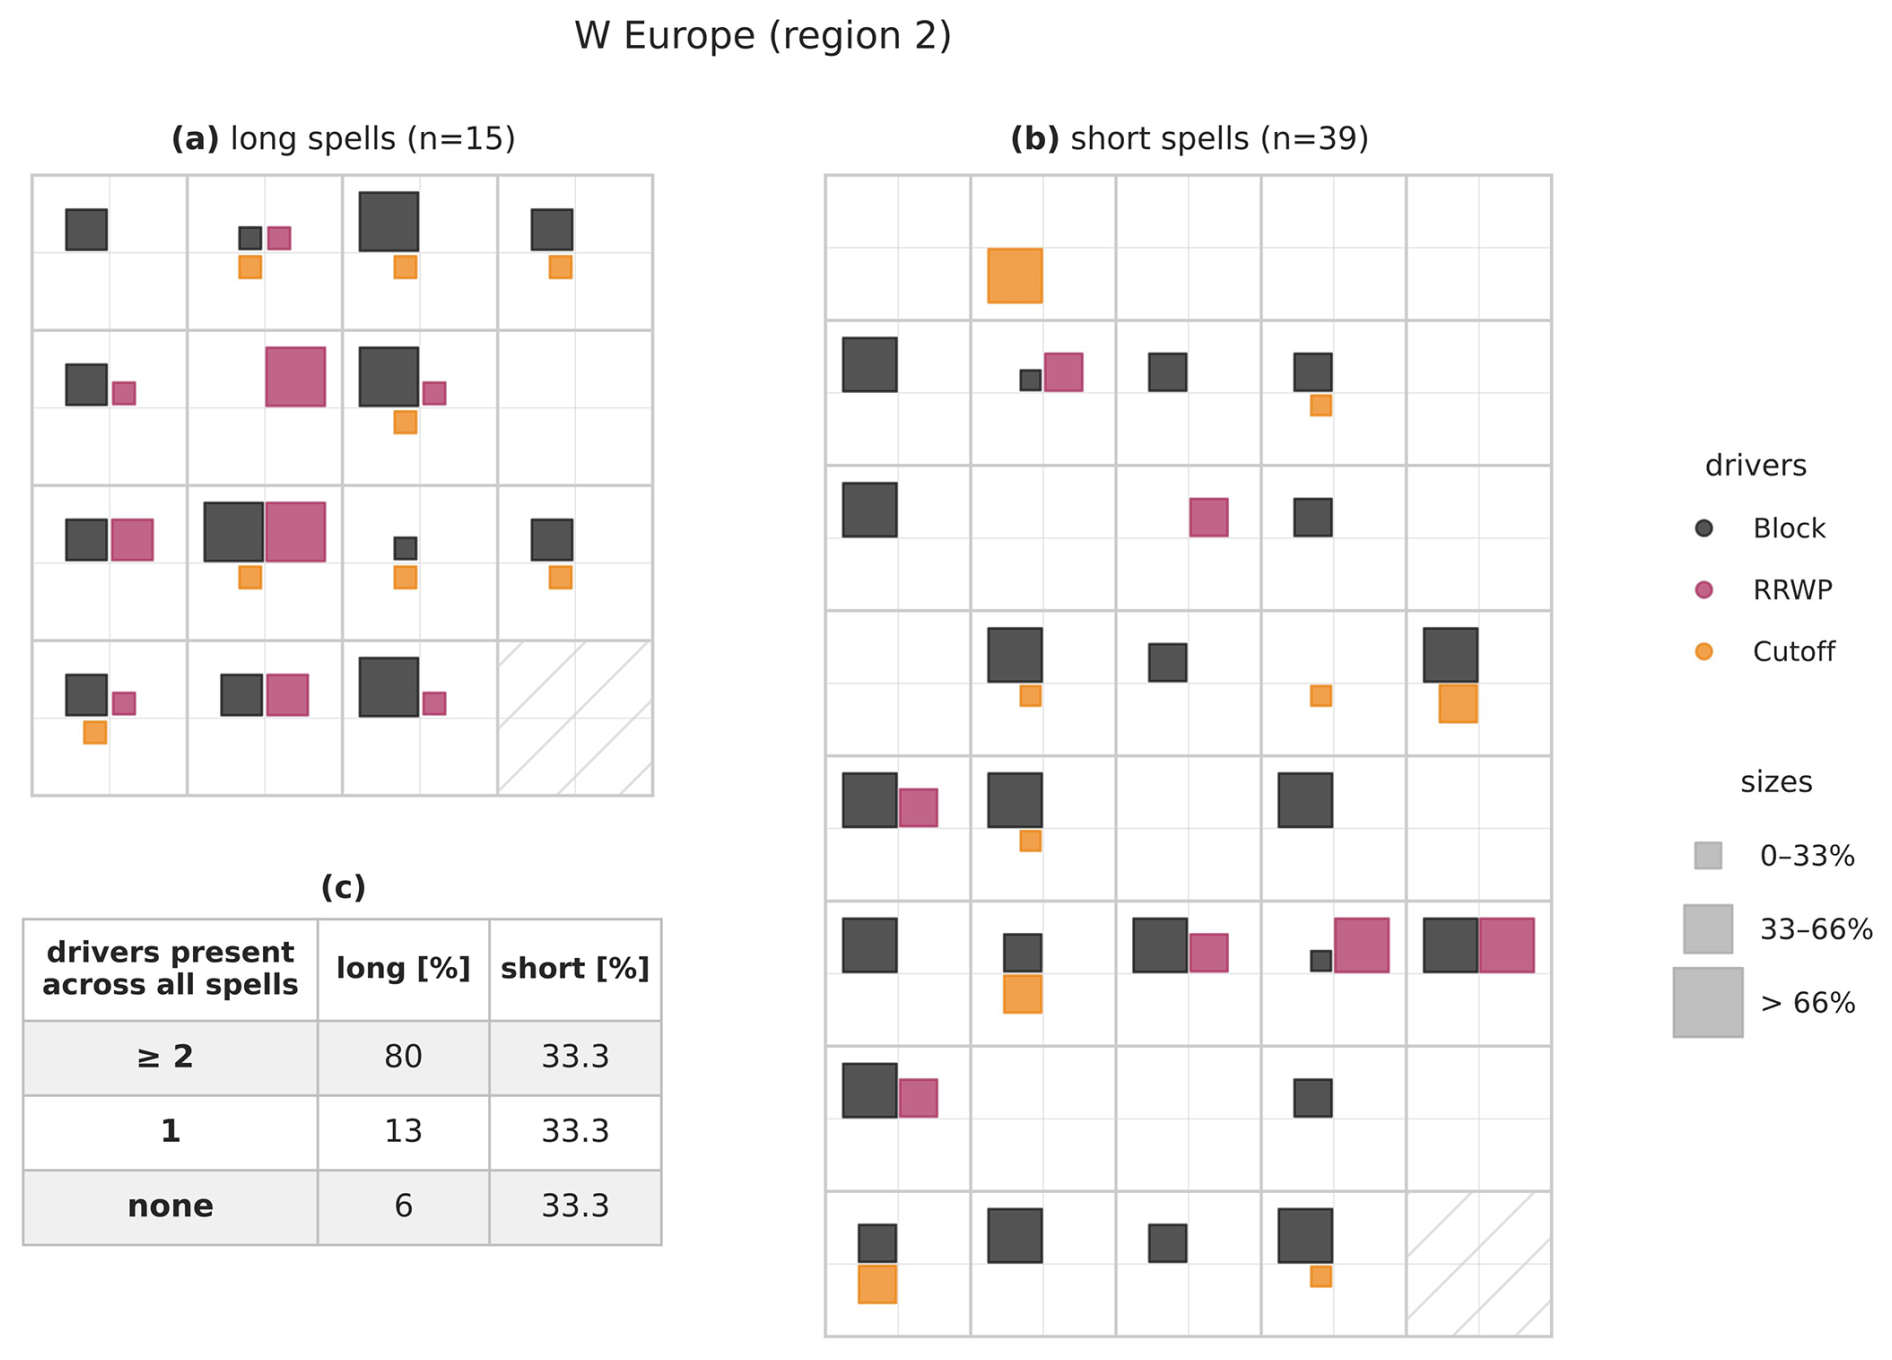
Figure 11Visual representation of the relative frequency of blocks, cutoffs, and RRWPs during (a) long and (b) short hot spells in W Europe. The size of each square corresponds to the prevalence of each driver in proportion to the event's duration. Panel (c) illustrates the proportion of spells characterised by the presence of more than two, exactly one, or no drivers.
Generally, long spells seem to mostly be characterised by the presence of more types of drivers, compared to short spells (Figs. 10c and11c). In both regions, at least 80 % of long spells show a combinations of two or more drivers, compared to around 30 % during short spells. Long spells in SW and W Europe, for instance, are often associated with simultaneous recurrence and quasi-stationarity in the large-scale flow. In other words, both transient wave activity in the form of RRWPs and near-stationary blocking co-occur to generate surface persistence.
In summary, duration represents an important dimension of temperature extremes that adds a level of complexity in understanding the associated weather and climate dynamics, with implications for their predictability (see e.g. Lembo et al., 2024). Accurately forecasting such extreme events on S2S timescales remains a major challenge (White et al., 2022). A comparative framework such as the one used in this study offers a valuable approach to begin addressing some of the questions and hurdles.
We investigate the differences between long (persistent, 12 to 26 d) and short (4 to 5 d) hot spells in SW and W Europe. We first introduce a regionalisation of summer extreme temperatures using data from the ERA5 reanalysis between 1959 and 2022. The regionalisation is based on the Jaccard distance as a measure of similarity for grouping locations over land into clusters that tend to experience 3-week T2M extremes simultaneously. We define long- and short-duration events for each cluster and compare composites of several relevant variables and drivers between these two sets of events in the selected regions. Additionally, our analysis draws out factors common to all persistent hot spells.
Long spells in both SW and W Europe are on average associated with stronger and lower-wavenumber upper-level Rossby wave trains, compared to short spells. Lower-wavenumber Rossby waves are more stationary than higher-wavenumber waves and can thereby increase the persistence of surface weather systems. Long spells in SW Europe, specifically, are characterised by significant soil dryness up to 2 months prior and a significant cumulative SM deficit at the start of the events, which delays drought recovery and prolongs positive land surface feedbacks. A pronounced meridional wave pattern, likely driven by strong anticyclonic RWB, deflects the jet stream northward, steering cyclonic activity further north. Frequent blocking and upstream cutoff lows are prominent features during long spells in SW Europe, both of which contribute to persistent hot surface weather conditions.
In contrast, long spells in W Europe have a different relation to SM, where strong land–atmosphere coupling and consequent soil desiccation during the event plays a critical role. The distinction between long and short spells in this region is further marked by the high frequency of large, long-lived blocks and frequent RRWPs during the long spells. The regional distinctions in the relative importance of dynamical features underscore the usefulness of our regionalisation. Short spells are characterised by a more zonal upstream flow structure, a stronger jet upstream of the hot spell region and a more active storm track upstream. All are indicators of a more transient flow over the eastern North Atlantic and the imminent arrival of disturbances that bring lower temperatures and potentially rain to the hot spell region and ultimately terminate the spells.
The composite fields can paint a picture of more (long spells) or less (short spells) quasi-stationary weather patterns. That said, a look into the individual events also reveals that long spells are more often characterised by the sequence and/or co-occurrence of multiple drivers (blocking, RRWP, cutoffs), involving their complex interaction over subseasonal timescales. These features are not required to be long-lived to contribute to the hot spell's persistence. Ultimately, to fully characterise these persistent events and the intricate dynamics that shape them, additional data is necessary. Despite this main limitation, our methodology provides a useful comparative framework with which to parse the dynamical components of persistent hot spells and understanding the factors driving their long duration. Extending our analysis to large-ensemble climate model simulations could offer a significantly larger sample size, leading to even more substantive conclusions. An alternative is making use of hindcasts, which may more accurately reproduce the synoptic and large-scale features discussed in this study.
Finally, other mechanisms not examined in this study may have mattered for affecting the duration of hot spells. Drought self-propagation and remote influences of SM should be further explored in connection with hot spell longevity. Other climate drivers modulating at longer timescales include anomalous sea surface temperatures (SSTs), tropical convection, and specific teleconnections that could force, and even phase-lock, wave activity over Europe. Studying the vertical profile during these events would also provide a more seamless view of the link between persistent surface weather, boundary layer dynamics, and upper-level circulation.
A repository of the Python code related to this study is available at http://www.github.com/dpappert/persistent-hotspells (last access: 9 May 2025; https://doi.org/10.5281/zenodo.15375034, Pappert, 2025). ERA5 reanalysis data can be downloaded from the Copernicus Climate Data Store at https://doi.org/10.24381/CDS.143582CF (Hersbach et al., 2023).
The supplement related to this article is available online at https://doi.org/10.5194/wcd-6-769-2025-supplement.
DP processed the data, performed the analysis, drafted the manuscript, and designed the figures. AT, DC, MV, and OM provided critical feedback and helped shape the research, analysis, and manuscript. OM supervised the project.
The contact author has declared that none of the authors has any competing interests.
Publisher's note: Copernicus Publications remains neutral with regard to jurisdictional claims made in the text, published maps, institutional affiliations, or any other geographical representation in this paper. While Copernicus Publications makes every effort to include appropriate place names, the final responsibility lies with the authors.
This research has been supported by the Schweizerischer Nationalfonds zur Förderung der Wissenschaftlichen Forschung (project PERSIST-EU, 207384). The work of Mathieu Vrac was supported by the “COESION” project funded by the French National programme LEFE (Les Enveloppes Fluides et l'Environnement). Mathieu Vrac also benefitted from state aid managed by the National Research Agency under France 2030 bearing the reference ANR-22-EXTR-0005 (TRACCS-PC4-EXTENDING project).
This research has been supported by the Schweizerischer Nationalfonds zur Förderung der Wissenschaftlichen Forschung (grant no. 207384), the French National programme LEFE (Les Enveloppes Fluides et l'Environnement, “COESION” project), and the National Research Agency (grant no. ANR-22-EXTR-0005, TRACCS-PC4-EXTENDING project).
This paper was edited by Gwendal Rivière and reviewed by two anonymous referees.
Ali, S. M., Martius, O., and Röthlisberger, M.: Recurrent Rossby Wave Packets Modulate the Persistence of Dry and Wet Spells Across the Globe, Geophys. Res. Lett., 48, e2020GL091452, https://doi.org/10.1029/2020GL091452, 2021. a
Ali, S. M., Röthlisberger, M., Parker, T., Kornhuber, K., and Martius, O.: Recurrent Rossby waves and south-eastern Australian heatwaves, Weather Clim. Dynam., 3, 1139–1156, https://doi.org/10.5194/wcd-3-1139-2022, 2022. a
Anderson, G. B. and Bell, M. L.: Heat Waves in the United States: Mortality Risk during Heat Waves and Effect Modification by Heat Wave Characteristics in 43 U.S. Communities, Environ. Health Persp., 119, 210–218, https://doi.org/10.1289/ehp.1002313, 2011. a
Barnes, E. A. and Hartmann, D. L.: Detection of Rossby wave breaking and its response to shifts of the midlatitude jet with climate change, J. Geophys. Res., 117, D09117, https://doi.org/10.1029/2012JD017469, 2012. a, b
Barriopedro, D., Fischer, E. M., Luterbacher, J., Trigo, R. M., and García-Herrera, R.: The Hot Summer of 2010: Redrawing the Temperature Record Map of Europe, Science, 332, 220–224, https://doi.org/10.1126/science.1201224, 2011. a
Barriopedro, D., García-Herrera, R., Ordóñez, C., Miralles, D. G., and Salcedo-Sanz, S.: Heat Waves: Physical Understanding and Scientific Challenges, Rev. Geophys., 61, e2022RG000780, https://doi.org/10.1029/2022RG000780, 2023. a
Barton, Y., Giannakaki, P., von Waldow, Harald, Chevalier, C., Pfahl, S., and Martius, O.: Clustering of Regional-Scale Extreme Precipitation Events in Southern Switzerland, Mon. Weather Rev., 144, 347–369, https://doi.org/10.1175/MWR-D-15-0205.1, 2016. a
Black, E., Blackburn, M., Harrison, G., Hoskins, B., and Methven, J.: Factors Contributing to the Summer 2003 European Heatwave, Weather, 59, 217–223, https://doi.org/10.1256/wea.74.04, 2004. a, b
Brabson, B. B., Lister, D. H., Jones, P. D., and Palutikof, J. P.: Soil Moisture and Predicted Spells of Extreme Temperatures in Britain, J. Geophys. Res.-Atmos., 110, D05104, https://doi.org/10.1029/2004JD005156, 2005. a
Branstator, G.: Circumglobal Teleconnections, the Jet Stream Waveguide, and the North Atlantic Oscillation, J. Climate, 15, 1893–1910, https://doi.org/10.1175/1520-0442(2002)015<1893:CTTJSW>2.0.CO;2, 2002. a
Chan, P.-W., Hassanzadeh, P., and Kuang, Z.: Evaluating Indices of Blocking Anticyclones in Terms of Their Linear Relations With Surface Hot Extremes, Geophys. Res. Lett., 46, 4904–4912, https://doi.org/10.1029/2019GL083307, 2019. a
Choi, S.-S., Cha, S.-H., and Tappert, C. C.: A Survey of Binary Similarity and Distance Measures, Journal of Systemics, Cybernetics and Informatics, 8, 43–48, 2010. a
De Bono, A., Peduzzi, P., Kluser, S., and Giuliani, G.: Impacts of Summer 2003 Heat Wave in Europe, Environment Alert Bulletin, 2, 4 pp., 2004. a
Di Capua, G., Sparrow, S., Kornhuber, K., Rousi, E., Osprey, S., Wallom, D., van den Hur, B., and Coumou, D.: Drivers behind the Summer 2010 Wave Train Leading to Russian Heatwave and Pakistan Flooding, npj Climate and Atmospheric Science, 4, 1–14, https://doi.org/10.1038/s41612-021-00211-9, 2021. a
Domeisen, D. I. V., Eltahir, E. A. B., Fischer, E. M., Knutti, R., Perkins-Kirkpatrick, S. E., Schär, C., Seneviratne, S. I., Weisheimer, A., and Wernli, H.: Prediction and Projection of Heatwaves, Nature Reviews Earth & Environment, 4, 36–50, https://doi.org/10.1038/s43017-022-00371-z, 2023. a
Drouard, M. and Woollings, T.: Contrasting Mechanisms of Summer Blocking Over Western Eurasia, Geophys. Res. Lett., 45, 12040–12048, https://doi.org/10.1029/2018GL079894, 2018. a, b, c
Drouard, M., Kornhuber, K., and Woollings, T.: Disentangling Dynamic Contributions to Summer 2018 Anomalous Weather Over Europe, Geophys. Res. Lett., 46, 12537–12546, https://doi.org/10.1029/2019GL084601, 2019. a
Felsche, E., Böhnisch, A., and Ludwig, R.: Inter-Seasonal Connection of Typical European Heatwave Patterns to Soil Moisture, npj Climate and Atmospheric Science, 6, 1–11, https://doi.org/10.1038/s41612-023-00330-5, 2023. a, b
Fischer, E. M., Seneviratne, S. I., Lüthi, D., and Schär, C.: Contribution of Land-Atmosphere Coupling to Recent European Summer Heat Waves, Geophys. Res. Lett., 34, L06707, https://doi.org/10.1029/2006GL029068, 2007. a
Flach, M., Brenning, A., Gans, F., Reichstein, M., Sippel, S., and Mahecha, M. D.: Vegetation modulates the impact of climate extremes on gross primary production, Biogeosciences, 18, 39–53, https://doi.org/10.5194/bg-18-39-2021, 2021. a
García-Herrera, R., Díaz, J., Trigo, R. M., Luterbacher, J., and Fischer, E. M.: A Review of the European Summer Heat Wave of 2003, Crit. Rev. Env. Sci. Tec., 40, 267–306, https://doi.org/10.1080/10643380802238137, 2010. a
Grams, C. M., Beerli, R., Pfenninger, S., Staffell, I., and Wernli, H.: Balancing Europe's Wind-Power Output through Spatial Deployment Informed by Weather Regimes, Nat. Clim. Change, 7, 557–562, https://doi.org/10.1038/nclimate3338, 2017. a
Hersbach, H., Bell, B., Berrisford, P., Hirahara, S., Horányi, A., Muñoz-Sabater, J., Nicolas, J., Peubey, C., Radu, R., Schepers, D., Simmons, A., Soci, C., Abdalla, S., Abellan, X., Balsamo, G., Bechtold, P., Biavati, G., Bidlot, J., Bonavita, M., De Chiara, G., Dahlgren, P., Dee, D., Diamantakis, M., Dragani, R., Flemming, J., Forbes, R., Fuentes, M., Geer, A., Haimberger, L., Healy, S., Hogan, R. J., Hólm, E., Janisková, M., Keeley, S., Laloyaux, P., Lopez, P., Lupu, C., Radnoti, G., de Rosnay, P., Rozum, I., Vamborg, F., Villaume, S., and Thépaut, J.-N.: The ERA5 global reanalysis, Q. J. Roy. Meteor. Soc., 146, 1999–2049, https://doi.org/10.1002/qj.3803, 2020. a
Hersbach, H., Bell, B., Berrisford, P., Hirahara, S., Horányi, A., Muñoz-Sabater, J., Nicolas, J., Peubey, C., Radu, R., Schepers, D., Simmons, A., Soci, C., Abdalla, S., Abellan, X., Balsamo, G., Bechtold, P., Biavati, G., Bidlot, J., Bonavita, M., De Chiara, G., Dahlgren, P., Dee, D., Diamantakis, M., Dragani, R., Flemming, J., Forbes, R., Fuentes, M., Geer, A., Haimberger, L., Healy, S., Hogan, R. J., Hólm, E., Janisková, M., Keeley, S., Laloyaux, P., Lopez, P., Lupu, C., Radnoti, G., de Rosnay, P., Rozum, I., Vamborg, F., Villaume, S., and Thépaut, J.-N.: Complete ERA5 global atmospheric reanalyis: Fifth generation of ECMWF atmospheric reanalyses of the global climate, Copernicus Climate Change Service (C3S) Climate Data Store (CDS) [data set], https://doi.org/10.24381/CDS.143582CF, 2023. a
Horowitz, R. L., McKinnon, K. A., and Simpson, I. R.: Circulation and Soil Moisture Contributions to Heatwaves in the United States, J. Climate, 35, 8031–8048, https://doi.org/10.1175/JCLI-D-21-0156.1, 2022. a
Horton, R. M., Mankin, J. S., Lesk, C., Coffel, E., and Raymond, C.: A Review of Recent Advances in Research on Extreme Heat Events, Current Climate Change Reports, 2, 242–259, https://doi.org/10.1007/s40641-016-0042-x, 2016. a
Hoskins, B. and Woollings, T.: Persistent Extratropical Regimes and Climate Extremes, Current Climate Change Reports, 1, 115–124, https://doi.org/10.1007/s40641-015-0020-8, 2015. a
Hoskins, B. J. and Ambrizzi, T.: Rossby Wave Propagation on a Realistic Longitudinally Varying Flow, J. Atmos. Sci., 50, 1661–1671, https://doi.org/10.1175/1520-0469(1993)050<1661:RWPOAR>2.0.CO;2, 1993. a, b
Jaccard, P.: The Distribution of the Flora in the Alpine Zone, New Pythol., 11, 37–50, https://doi.org/10.1111/j.1469-8137.1912.tb05611.x, 1912. a
Jacques-Dumas, V., Ragone, F., Borgnat, P., Abry, P., and Bouchet, F.: Deep Learning-Based Extreme Heatwave Forecast, Frontiers in Climate, 4, 789641, https://doi.org/10.3389/fclim.2022.789641, 2022. a
Kaderli, S.: WaveBreaking – Detection, Classification and Tracking of Rossby WaveBreaking v0.3.7, Version v.0.3.7, Zenodo [code], https://doi.org/10.5281/zenodo.8123188, 2023. a
Kautz, L.-A., Martius, O., Pfahl, S., Pinto, J. G., Ramos, A. M., Sousa, P. M., and Woollings, T.: Atmospheric blocking and weather extremes over the Euro-Atlantic sector – a review, Weather Clim. Dynam., 3, 305–336, https://doi.org/10.5194/wcd-3-305-2022, 2022. a, b
Kornhuber, K., Petoukhov, V., Karoly, D., Petri, S., Rahmstorf, S., and Coumou, D.: Summertime Planetary Wave Resonance in the Northern and Southern Hemispheres, J. Climate, 30, 6133–6150, https://doi.org/10.1175/JCLI-D-16-0703.1, 2017. a
Koster, R. D. and Suarez, M. J.: Soil Moisture Memory in Climate Models, J. Hydrometeorol., 2, 558–570, https://doi.org/10.1175/1525-7541(2001)002<0558:SMMICM>2.0.CO;2, 2001. a
Lembo, V., Bordoni, S., Bevacqua, E., Domeisen, D. I. V., Franzke, C. L. E., Galfi, V. M., Garfinkel, C., Grams, C. I., Hochman, A., Jha, R., Kornhuber, K., Kwasniok, F., Lucarini, V., Messori, G., Pappert, D., Perez-Fernandez, I., Riboldi, J., Russo, E., Shaw, T. A., Strigunova, I., Strnad, F., Yiou, P., and Zagar, N.: Dynamics, Statistics and Predictability of Rossby Waves, Heatwaves and Spatially Compounded Extreme Events, B. Am. Meteorol. Soc., 105, E2283–E2293, https://doi.org/10.1175/BAMS-D-24-0145.1, 2024. a
Lorenz, R., Jaeger, E. B., and Seneviratne, S. I.: Persistence of Heat Waves and Its Link to Soil Moisture Memory, Geophys. Res. Lett., 37, L09703, https://doi.org/10.1029/2010GL042764, 2010. a, b, c, d
Lucarini, V., Galfi, V. M., Riboldi, J., and Messori, G.: Typicality of the 2021 Western North America Summer Heatwave, Environ. Res. Lett., 18, 015004, https://doi.org/10.1088/1748-9326/acab77, 2023. a
Mariotti, A., Baggett, C., Barnes, E. A., Becker, E., Butler, A., Collins, D. C., Dirmeyer, P. A., Ferranti, L., Johnson, N. C., Jones, J., Kirtman, B. P., Lang, A. L., Molod, A., Newman, M., Robertson, A. W., Schubert, S., Waliser, D. E., and Albers, J.: Windows of Opportunity for Skillful Forecasts Subseasonal to Seasonal and Beyond, B. Am. Meteorol. Soc., 101, E608–E625, https://doi.org/10.1175/BAMS-D-18-0326.1, 2020. a
Martius, O., Schwierz, C., and Davies, H. C.: Breaking Waves at the Tropopause in the Wintertime Northern Hemisphere: Climatological Analyses of the Orientation and the Theoretical LC1/2 Classification, J. Atmos. Sci., 64, 2576–2592, https://doi.org/10.1175/JAS3977.1, 2007. a
Mohr, S., Wilhelm, J., Wandel, J., Kunz, M., Portmann, R., Punge, H. J., Schmidberger, M., Quinting, J. F., and Grams, C. M.: The role of large-scale dynamics in an exceptional sequence of severe thunderstorms in Europe May–June 2018, Weather Clim. Dynam., 1, 325–348, https://doi.org/10.5194/wcd-1-325-2020, 2020. a
Müller, B. and Seneviratne, S. I.: Hot Days Induced by Precipitation Deficits at the Global Scale, P. Natl. Acad. Sci. USA, 109, 12398–12403, https://doi.org/10.1073/pnas.1204330109, 2012. a
Nakamura, N. and Huang, C. S. Y.: Atmospheric Blocking as a Traffic Jam in the Jet Stream, Science, 361, 42–47, https://doi.org/10.1126/science.aat0721, 2018. a
Noyelle, R., Yiou, P., and Faranda, D.: Investigating the Typicality of the Dynamics Leading to Extreme Temperatures in the IPSL-CM6A-LR Model, Clim. Dynam., 62, 1329–1357, https://doi.org/10.1007/s00382-023-06967-5, 2024. a, b
Pappert, D.: persistent-hotspells (v1.0.0), Zenodo [code], https://doi.org/10.5281/zenodo.15375034, 2025. a
Perkins, S. E.: A Review on the Scientific Understanding of Heatwaves – Their Measurement, Driving Mechanisms, and Changes at the Global Scale, Atmos. Res., 164–165, 242–267, https://doi.org/10.1016/j.atmosres.2015.05.014, 2015. a, b, c
Pfleiderer, P. and Coumou, D.: Quantification of Temperature Persistence over the Northern Hemisphere Land-Area, Clim. Dynam., 51, 627–637, https://doi.org/10.1007/s00382-017-3945-x, 2018. a, b
Pfleiderer, P., Schleussner, C.-F., Kornhuber, K., and Coumou, D.: Summer Weather Becomes More Persistent in a 2 °C World, Nat. Clim. Change, 9, 666–671, https://doi.org/10.1038/s41558-019-0555-0, 2019. a
Polt, K. D., Ward, P. J., de Ruiter, M., Bogdanovich, E., Reichstein, M., Frank, D., and Orth, R.: Quantifying Impact-Relevant Heatwave Durations, Environ. Res. Lett., 18, 104005, https://doi.org/10.1088/1748-9326/acf05e, 2023. a
Pyrina, M. and Domeisen, D. I. V.: Subseasonal Predictability of Onset, Duration, and Intensity of European Heat Extremes, Q. J. Roy. Meteor. Soc., 149, 84–101, https://doi.org/10.1002/qj.4394, 2023. a
Quandt, L.-A., Keller, J. H., Martius, O., and Jones, S. C.: Forecast Variability of the Blocking System over Russia in Summer 2010 and Its Impact on Surface Conditions, Weather Forecast., 32, 61–82, https://doi.org/10.1175/WAF-D-16-0065.1, 2017. a
Rex, D. F.: Blocking Action in the Middle Troposphere and Its Effect upon Regional Climate, Tellus A, 2, 275–301, https://doi.org/10.3402/tellusa.v2i4.8603, 1950. a
Rouges, E., Ferranti, L., Kantz, H., and Pappenberger, F.: European Heatwaves: Link to Large-Scale Circulation Patterns and Intraseasonal Drivers, Int. J. Climatol., 43, 3189–3209, https://doi.org/10.1002/joc.8024, 2023. a
Rousi, E., Kornhuber, K., Beobide-Arsuaga, G., Luo, F., and Coumou, D.: Accelerated Western European Heatwave Trends Linked to More-Persistent Double Jets over Eurasia, Nat. Commun., 13, 3851, https://doi.org/10.1038/s41467-022-31432-y, 2022. a
Röthlisberger, M. and Martius, O.: Quantifying the Local Effect of Northern Hemisphere Atmospheric Blocks on the Persistence of Summer Hot and Dry Spells, Geophys. Res. Lett., 46, 10101–10111, https://doi.org/10.1029/2019GL083745, 2019. a, b, c
Röthlisberger, M., Frossard, L., Bosart, L. F., Keyser, D., and Martius, O.: Recurrent Synoptic-Scale Rossby Wave Patterns and Their Effect on the Persistence of Cold and Hot Spells, J. Climate, 32, 3207–3226, https://doi.org/10.1175/JCLI-D-18-0664.1, 2019. a, b, c
Schielicke, L. and Pfahl, S.: European heatwaves in present and future climate simulations: a Lagrangian analysis, Weather Clim. Dynam., 3, 1439–1459, https://doi.org/10.5194/wcd-3-1439-2022, 2022. a
Schwierz, C., Croci-Maspoli, M., and Davies, H. C.: Perspicacious Indicators of Atmospheric Blocking, Geophys. Res. Lett., 31, L06125, https://doi.org/10.1029/2003GL019341, 2004. a
Seneviratne, S. I., Corti, T., Davin, E. L., Hirschi, M., Jaeger, E. B., Lehner, I., Orlowsky, B., and Teuling, A. J.: Investigating Soil Moisture–Climate Interactions in a Changing Climate: A Review, Earth-Sci. Rev., 99, 125–161, https://doi.org/10.1016/j.earscirev.2010.02.004, 2010. a, b
Stefanon, M., D'Andrea, F., and Drobinski, P.: Heatwave Classification over Europe and the Mediterranean Region, Environ. Res. Lett., 7, 014023, https://doi.org/10.1088/1748-9326/7/1/014023, 2012. a
Steinfeld, D.: ConTrack v0.3.0 (2021), Zenodo [code], https://doi.org/10.5281/zenodo.4765560, 2021. a
Steinfeld, D. and Pfahl, S.: The Role of Latent Heating in Atmospheric Blocking Dynamics: A Global Climatology, Clim. Dynam., 53, 6159–6180, https://doi.org/10.1007/s00382-019-04919-6, 2019. a
Thompson, V., Coumou, D., Galfi, V. M., Happé, T., Kew, S., Pinto, I., Philip, S., de Vries, H., and van der Wiel, K.: Changing Dynamics of Western European Summertime Cut-off Lows: A Case Study of the July 2021 Flood Event, Atmos. Sci. Lett., 25, e1260, https://doi.org/10.1002/asl.1260, 2024. a
Thorncroft, C. D., Hoskins, B. J., and McIntyre, M. E.: Two Paradigms of Baroclinic-Wave Life-Cycle Behaviour, Q. J. Roy. Meteor. Soc., 119, 17–55, https://doi.org/10.1002/qj.49711950903, 1993. a
Trigo, R. M., García-Herrera, R., Díaz, J., Trigo, I. F., and Valente, M. A.: How Exceptional Was the Early August 2003 Heatwave in France?, Geophys. Res. Lett., 32, https://doi.org/10.1029/2005GL022410, 2005. a
Tuel, A. and Martius, O.: Weather persistence on sub-seasonal to seasonal timescales: a methodological review, Earth Syst. Dynam., 14, 955–987, https://doi.org/10.5194/esd-14-955-2023, 2023. a, b
Tuel, A. and Martius, O.: Persistent warm and cold spells in the Northern Hemisphere extratropics: regionalisation, synoptic-scale dynamics and temperature budget, Weather Clim. Dynam., 5, 263–292, https://doi.org/10.5194/wcd-5-263-2024, 2024. a, b
Tuel, A., Steinfeld, D., Ali, S. M., Sprenger, M., and Martius, O.: Large-Scale Drivers of Persistent Extreme Weather During Early Summer 2021 in Europe, Geophys. Res. Lett., 49, e2022GL099624, https://doi.org/10.1029/2022GL099624, 2022. a, b
van den Hurk, B., Doblas-Reyes, F., Balsamo, G., Koster, R. D., Seneviratne, S. I., and Camargo, H.: Soil Moisture Effects on Seasonal Temperature and Precipitation Forecast Scores in Europe, Clim. Dynam., 38, 349–362, https://doi.org/10.1007/s00382-010-0956-2, 2012. a
Villiger, L.: Block Detection and European Heat Waves, Master's thesis, Institute of Geography and Oeschger Centre for Climate Change Research, University of Bern, Bern, Switzerland, https://occrdata.unibe.ch/students/theses/msc/229.pdf (last access: 29 July 2024), 2017. a
Virtanen, P., Gommers, R., Oliphant, T. E., Haberland, M., Reddy, T., Cournapeau, D., Burovski, E., Peterson, P., Weckesser, W., Bright, J., van der Walt, S. J., Brett, M., Wilson, J., Millman, K. J., Mayorov, N., Nelson, A. R. J., Jones, E., Kern, R., Larson, E., Carey, C. J., Polat, İ., Feng, Y., Moore, E. W., VanderPlas, J., Laxalde, D., Perktold, J., Cimrman, R., Henriksen, I., Quintero, E. A., Harris, C. R., Archibald, A. M., Ribeiro, A. H., Pedregosa, F., van Mulbregt, P., and SciPy 1.0 Contributors: SciPy 1.0: Fundamental Algorithms for Scientific Computing in Python, Nat. Methods, 17, 261–272, https://doi.org/10.1038/s41592-019-0686-2, 2020. a
Vitart, F. and Robertson, A. W.: The Sub-Seasonal to Seasonal Prediction Project (S2S) and the Prediction of Extreme Events, npj Climate and Atmospheric Science, 1, 1–7, https://doi.org/10.1038/s41612-018-0013-0, 2018. a
Vogel, M. M., Zscheischler, J., Wartenburger, R., Dee, D., and Seneviratne, S. I.: Concurrent 2018 Hot Extremes Across Northern Hemisphere Due to Human-Induced Climate Change, Earth's Future, 7, 692–703, https://doi.org/10.1029/2019EF001189, 2019. a
Wehrli, K., Guillod, B. P., Hauser, M., Leclair, M., and Seneviratne, S. I.: Identifying Key Driving Processes of Major Recent Heat Waves, J. Geophys. Res.-Atmos., 124, 11746–11765, https://doi.org/10.1029/2019JD030635, 2019. a
Wernli, H. and Sprenger, M.: Identification and ERA-15 Climatology of Potential Vorticity Streamers and Cutoffs near the Extratropical Tropopause, J. Atmos. Sci., 64, 1569–1586, https://doi.org/10.1175/JAS3912.1, 2007. a, b
White, C. J., Carlsen, H., Robertson, A. W., Klein, R. J., Lazo, J. K., Kumar, A., Vitart, F., Coughlan de Perez, E., Ray, A. J., Murray, V., Bharwani, S., MacLeod, D., James, R., Fleming, L., Morse, A. P., Eggen, B., Graham, R., Kjellström, E., Becker, E., Pegion, K. V., Holbrook, N. J., McEvoy, D., Depledge, M., Perkins-Kirkpatrick, S., Brown, T. J., Street, R., Jones, L., Remenyi, T. A., Hodgson-Johnston, I., Buontempo, C., Lamb, R., Meinke, H., Arheimer, B., and Zebiak, S. E.: Potential Applications of Subseasonal-to-Seasonal (S2S) Predictions, Meteorol. Appl., 24, 315–325, https://doi.org/10.1002/met.1654, 2017. a
White, R. H., Kornhuber, K., Martius, O., and Wirth, V.: From Atmospheric Waves to Heatwaves: A Waveguide Perspective for Understanding and Predicting Concurrent, Persistent, and Extreme Extratropical Weather, B. Am. Meteorol. Soc., 103, E923–E935, https://doi.org/10.1175/BAMS-D-21-0170.1, 2022. a
Wilks, D. S.: “The Stippling Shows Statistically Significant Grid Points”: How Research Results Are Routinely Overstated and Overinterpreted, and What to Do about It, B. Am. Meteorol. Soc., 97, 2263–2273, https://doi.org/10.1175/BAMS-D-15-00267.1, 2016. a
Woollings, T., Barriopedro, D., Methven, J., Son, S.-W., Martius, O., Harvey, B., Sillmann, J., Lupo, A. R., and Seneviratne, S.: Blocking and Its Response to Climate Change, Current Climate Change Reports, 4, 287–300, https://doi.org/10.1007/s40641-018-0108-z, 2018. a
Wu, W. and Dickinson, R. E.: Time Scales of Layered Soil Moisture Memory in the Context of Land–Atmosphere Interaction, J. Climate, 17, 2752–2764, https://doi.org/10.1175/1520-0442(2004)017<2752:TSOLSM>2.0.CO;2, 2004. a
Yiou, P., Cattiaux, J., Faranda, D., Kadygrov, N., Jézéquel, A., Naveau, P., Ribes, A., Robin, Y., Thao, S., van Oldenborgh, G. J., and Vrac, M.: Analyses of the Northern European Summer Heatwave of 2018, B. Am. Meteorol. Society, 101, S35–S40, https://doi.org/10.1175/BAMS-D-19-0170.1, 2020. a
Zavadoff, B. L. and Kirtman, B. P.: North Atlantic Summertime Anticyclonic Rossby Wave Breaking: Climatology, Impacts, and Connections to the Pacific Decadal Oscillation, J. Climate, 32, 485–500, https://doi.org/10.1175/JCLI-D-18-0304.1, 2019. a
Zhang, G. and Wang, Z.: North Atlantic Extratropical Rossby Wave Breaking during the Warm Season: Wave Life Cycle and Role of Diabatic Heating, Mon. Weather Rev., 146, 695–712, https://doi.org/10.1175/MWR-D-17-0204.1, 2018. a
Zschenderlein, P., Fink, A. H., Pfahl, S., and Wernli, H.: Processes Determining Heat Waves across Different European Climates, Q. J. Roy. Meteor. Soc., 145, 2973–2989, https://doi.org/10.1002/qj.3599, 2019. a, b
Zuo, J., Pullen, S., Palmer, J., Bennetts, H., Chileshe, N., and Ma, T.: Impacts of Heat Waves and Corresponding Measures: A Review, J. Clean. Prod., 92, 1–12, https://doi.org/10.1016/j.jclepro.2014.12.078, 2015. a