the Creative Commons Attribution 4.0 License.
the Creative Commons Attribution 4.0 License.
 | 25 Sep 2025
Probabilistic seasonal outlook for the rainy season over India by monitoring the onset dates using GPM IMERG satellite-based precipitation
Chempampadam Balasubramannian Jayasankar
Vasubandhu Misra
We utilized the Integrated Multi-Satellite Retrievals for Global Precipitation Mission version 6 (IMERG) rainfall observation (available in real time) over India to determine the onset and withdrawal of the rainy season. The annual mean climatology derived from IMERG observations over India aligned closely with the rain gauge-based India Meteorological Department observation. The IMERG rainfall time series was randomly perturbed to generate 101 ensemble members at every grid point of the rainfall analysis to obtain a corresponding ensemble of the onset and withdrawal dates of the rainy season. The perturbations were designed to sample the uncertainty due to random synoptic or mesoscale rain events influencing the diagnosis of the onset/withdrawal dates at the granularity of the IMERG observations (available at 10 km grid). Following earlier studies, we find from the IMERG dataset that seasons with an earlier onset date are strongly related to a lengthier and wetter season, whereas seasons with a later onset date correspond to a shorter and a drier season. In contrast, the connections between El Niño–Southern Oscillation (ENSO) and Indian Ocean dipole (IOD) with the onset, withdrawal, seasonal length, and rainfall of the rainy season were comparatively weaker over most of India. The generation of ensembles in this study underscores the potential for real-time application of generating reliable, probabilistic seasonal outlooks of the rainy season over India by leveraging the local links amongst onset date, seasonal length, and seasonal rainfall anomalies. This potential is further confirmed by the high probabilistic skill scores of the seasonal outlooks using the area under the relative operating characteristic curve method.
- Article
(5773 KB) - Full-text XML
-
Supplement
(7439 KB) - BibTeX
- EndNote


India's water and agriculture sectors rely heavily on copious summer monsoon rainfall, emphasizing its critical role in defining the country's agrarian economy and water resource management (Gadgil and Gadgil, 2006). The seasonal progression of the Indian Summer Monsoon (ISM) season has an impact not only on agricultural yields but also on other sectors such as economy and ecology (Lal, 2000). Based on rainfall patterns, wind conditions, and outgoing longwave radiation, the India Meteorological Department (IMD) officially declare the date of monsoon onset over Kerala (MoK) each year. In a normal year, the ISM season begins in southern peninsular India on 1 June (with MoK), spreads throughout the country by mid-July, and then begins to retreat on 1 September (Pai et al., 2020).
There are many different definitions for the monsoon onset; however, it is typically considered as a quick, substantial, and prolonged increase in rainfall after 10 May, accompanied by a persistent change in wind direction to southwesterlies associated with the summer monsoon flow (Pai and Rajeevan, 2009). In addition to the rainfall-based definitions (e.g., Ananthakrishnan and Soman, 1988; Noska and Misra, 2016; Misra et al., 2017), several other atmospheric dynamical and thermodynamical variables (winds, outgoing longwave radiation, temperature, moisture flux convergence, and precipitable water) were utilized to identify the onset of summer monsoon rainfall (e.g., Fasullo and Webster, 2003; Zeng and Lu, 2004; Prasad and Hayashi, 2005; Joseph et al., 2006; Wang et al., 2009; Walker and Bordoni, 2016; Stolbova et al., 2016). These variables provide a comprehensive understanding of the atmospheric conditions and dynamics that influence the onset and total summer monsoon rainfall over India. According to Bombardi et al. (2020), monsoon onset detection methods can be grouped into local-scale and regional-to-large-scale approaches, though the latter often show weak correlation with local observations. All these approaches produce somewhat similar onset dates, but their connections with the local-scale onset of the rainfall during the ISM differ (Moron and Robertson, 2014; Noska and Misra, 2016; Fitzpatrick et al., 2016).
Owing to variations in the onset and withdrawal date of the monsoon season there are considerable spatial and temporal variations in the availability of the rainwater and length of the rainy season (determined solely based on rain rates) over India (Joseph et al., 1994; Lal, 2000; Wang and LinHo, 2002; Misra et al., 2017, 2018). Preenu et al. (2017) indicate from IMD archive that the earliest onset of the ISM was 11 May 1918, and the most delayed onset of ISM was 18 June 1972. Several studies discuss the interannual variability of monsoon onset dates in India and its teleconnection with El Niño and the Southern Oscillation (ENSO) and the Indian Ocean Dipole (IOD, Xavier et al., 2007; Sankar et al., 2011; Misra et al., 2017; Pradhan et al., 2017; Choudhury et al., 2021). In ENSO and IOD years, the monsoon onset is altered by the modulation of the teleconnections with SST anomalies in the tropical oceans, which affect the Walker and Hadley circulations, respectively (Pradhan et al., 2017). Significant changes in the large-scale atmospheric patterns over the monsoon areas are identified during the onset of the monsoon over India (Joseph et al., 1994). According to Wang et al. (2013), the interannual variations in ocean–atmosphere interaction processes significantly influence the association between the monsoon onset and ENSO, which is driven by the meridional SST gradient across the Indian Ocean. Noska and Misra (2016) show that the variations in the onset and withdrawal date of the rainy season over India that largely overlaps with ISM are linked to the variability of the cross-equatorial upper-ocean heat transport in the Indian Ocean, variations in large-scale atmospheric and oceanic circulations, and regional ocean-atmosphere thermal gradients. In addition, internal variability of ISM arising from intraseasonal oscillations (ISOs), can significantly influence the monsoon rainfall and as well as the onset and withdrawal characteristics of the ISM (Goswami and Mohan, 2001; Goswami and Xavier, 2005; Karmakar and Misra, 2019). Monsoon ISOs are typically classified into active (above normal) and break (below normal) phases, and the frequency of these phases plays a crucial role in determining the seasonal mean monsoon rainfall (Goswami and Mohan, 2001). Karmakar and Misra (2019) found that a majority of local onset dates (59 %) occur during the positive developing phases of high-frequency ISOs, while a majority of withdrawal dates (62 %) occur during the positive decaying phases of low-frequency ISOs.
It may be noted that we make a subtle distinction between the ISM and rainy seasons, with the latter solely determined by rain rates which includes pre- and post-monsoon seasonal rainfall (e. g., Noska and Misra, 2016) while the former is usually a fixed calendar season (June to September) and coincides additionally with the seasonal cycle of circulation features and other thermodynamic factors. Figure S1 in the Supplement highlights the difference between the rainy season and climatological ISM (June to September), which makes it evident that the rainy season accumulates more rainfall in southern peninsular India and in regions east of the central monsoon region. Similarly, when compared to the ISM season, the rainy season has slightly less total rainfall over both western, northern India, and parts of northeastern India. It may be noted that the definition of the rainy season allows for a variable length compared to the fixed calendar season of, which stems from the former including rainfall from both the pre-monsoon and post-monsoon seasons. For instance, tropical cyclones are also included in the rainy season defined here, and they significantly contribute to the annual rainfall in some parts of eastern India. Pre- and post-monsoon tropical cyclones can contribute up to 25 % of the yearly rainfall in some parts of India, even though the southwest monsoon is the main component of our defined rainy season (Khouakhi et al., 2017).
The information about the arrival of the monsoon rainfall is imperative for farmers to plan their strategy for the upcoming season. There are many attempts to predict the MoK; however, it remains a challenge due to the intricate interplay between large-scale atmospheric circulation and localized convective processes, resulting in substantial spatial variability in onset dates (Kung and Sharif, 1980; Rajeevan and Dubey, 1995; Pai and Rajeevan, 2007; Pradhan et al., 2017). Many studies have shown that variations of the MoK have very little influence on the mean rainfall anomalies of the ISM (Dhar et al., 1980; Mooley and Parthasarthy, 1984; Mooley and Shukla, 1987; Misra and DiNapoli, 2014). Furthermore, MoK is known to have insignificant relationship with subsequent progression of the onset isochrones of the ISM (Bansod et al., 1991; Fasullo and Webster, 2003; Pai and Rajeevan, 2007). Noska and Misra (2016) proposed an objective method to define the onset and withdrawal of the rainy season based on area averaged all India daily rainfall, and they found that mean anomalies of the rainy season are closely linked with variations in the onset and withdrawal dates of the rainy season. In addition, they validated the defined onset and withdrawal of the rainy season for consistency by comparing them with the seasonal evolution of key dynamic and thermodynamic variables associated with the ISM. In a following study, Misra et al. (2018) obtained local onset (withdrawal) dates of the Indian rainy season at the granularity of the rainfall analysis and showed that they are negatively (positively) correlated with rainfall anomalies of the rainy season across the Indian region. These studies suggest that monitoring the local onset date of the rainy season provides a good indication of the evolution of the seasonal length and rainfall of the forthcoming rainy season (i.e., the entire duration of the rainy season at each grid points) and supporting its use in predictability studies. Bhardwaj and Misra (2019) found that Remotely Sensed Rainfall Products such as Tropical Rainfall Measuring Mission (TRMM) Multi-satellite Precipitation Analysis (TMPA) produce local onset and withdrawal dates similar to IMD observations. In comparison to traditionally identified onset of ISM, which are often limited to defining the onset over Kerala (e.g., MoK), the proposed method enables the generation of spatially continuous maps of onset date evolution. By capturing regional heterogeneity, it provides a more nuanced understanding of the spatiotemporal progression of onset of the rainy season across India. This simple rainfall-based definition was found useful for monitoring the onset of the rainy season in real-time and issuing the outlook of the rainy season over various regions such as Florida (Misra et al., 2022), and Central America (Rodgers et al., 2024).
Many studies have used the IMERG data set as one of their primary dataset for the analysis of the ISM (Bushair et al., 2019; Thakur et al., 2020; Saikrishna et al., 2021; Phadtare et al., 2023). In this study, we employ a rainfall-based objective method to define the local onset and withdrawal of the rainy season, leveraging the high-resolution IMERG dataset available since January 2001. Our approach captures the actual arrival and retreat of persistent rainfall at each grid point by identifying the onset and withdrawal of the rainy season. This approach also accounts for pre- and post-monsoon rainfall, providing a more complete representation of the rainy season – particularly in regions where events such as tropical cyclones contribute significantly to seasonal rainfall totals. In this study, utilizing IMERG's 12 h latency product, we demonstrate the potential for real-time monitoring of the onset of the rainy season, which aids in anticipating the anomalies of the seasonal length and seasonal accumulated rainfall (hereafter referred to as seasonal rainfall) across India. Motivated from the grid-point level definition of onset and withdrawal dates established by Misra et al. (2018) and Bhardwaj and Misra (2019), this study advances this framework by how the IMERG 12 h latency product can be effectively used to monitor these parameters at fine spatial scales, enabling better anticipation of anomalies of the seasonal length and seasonal rainfall. In addition, the novelty of this work lies in the use of a perturbation technique applied in the diagnosis of onset/withdrawal dates of the rainy season over India following Misra et al. (2023) and Rodgers et al. (2024) to generate 101 ensembles of daily rainfall data. This approach is the first of its kind over the Indian region and allows us to define an ensemble of local onset and withdrawal dates, aiding in the probabilistic estimate of the evolution of the rainy season that accounts for observational and analysis uncertainties. Hereafter, the term “onset” refers to local or grid point-specific onset dates of the rainy season.
Additionally, this study explores the interannual variation of the evolution of the rainy season and its link to large-scale forcing such as ENSO and IOD and compares their viability as predictors of the rainy seasons to the local links we establish with the variations of the onset dates. We believe that the insights from this study will have significant potential applications in agricultural planning and water resource management.
2.1 Data
The analysis performed in this study utilized daily precipitation data from the IMERG version 6 (Huffman et al., 2020). This dataset is part of the Global Precipitation Measurement (GPM) mission, which was launched in 2014 and is co-operated by NASA and the Japan Aerospace Exploration Agency (JAXA). The 0.1° grid resolution (∼ 10 km) IMERG data are available at half-hourly intervals from June 2000 to the present. The dataset comprises early, late, and final run products, which have latencies of approximately 4 h (Early), 12 h (Late), and 3.5 months (Final). The IMERG late run incorporates data from multiple sources, such as satellite microwave and infrared estimations, precipitation gauge analysis, and other potential precipitation estimators. This dataset provides detailed temporal and spatial coverage for both the TRMM and GPM eras worldwide. However, in this study, we used the daily 12 h latency product (daily averages were estimated from half-hourly products), which has great potential for monitoring the rainy season in real-time. To assess the fidelity of the 12 h latency product of IMERG over India, we have compared it with the corresponding Final product of IMERG and also used rain gauge-based IMD gridded rainfall data for the period 2001–2023 at 0.25° × 0.25° resolution (Pai et al., 2014) as a validation dataset. Additionally, we defined the onset and withdrawal dates of the rainy season using the daily NOAA Climate Prediction Center (CPC) precipitation data set (Xie et al., 2007) and compared them with IMERG.
2.2 Methodology
2.2.1 Onset and retreat
This study uses a simple objective definition to identify the onset and cessation dates of the wet season over India which are determined by finding the minima and maxima of the cumulative rainfall anomaly curve (Liebmann and Marengo, 2001). The cumulative anomaly of the daily rainfall at a day J (i.e., Ci(J)) for a year i at each grid point is estimated as:
where Ri(j) is the rainfall for day j of year i, is the climatology of the annual mean rainfall for a given grid point. The Ci(J) for 365/366 calendar days in a year represents the cumulative rainfall anomaly curve. After the onset and withdrawal dates of the season are determined, we count the number of days between them to define the seasonal length. Seasonal rainfall of the rainy season refers to the daily rainfall that accumulates from the day of onset date to the withdrawal date.
2.2.2 Perturbation
The motivation to perturb the timeseries is to account for the uncertainty of random synoptic or mesoscale events that is potentially unrelated to the seasonal cycle, which could affect the diagnosis of the onset/withdrawal date of the rainy season. The threat of false diagnosis of onset/withdrawal dates of the rainy season is acute from the proposed methodology since this diagnosis is computed at the granularity of the rainfall analysis. Therefore, generating an ensemble of onset/withdrawal dates of the rainy season that accounts for this uncertainty is essential. The perturbations are generated randomly by replacing the rainfall of each day in the original timeseries for a given grid point by rainfall in the range of ±3 calendar days. The range of ±3 calendar days used in the generation of the perturbed timeseries covers the uncertainty in the occurrence of the synoptic (1 to 7 calendar days) to meso-scale (1 to 3 calendar days) rain features of the rainy season. In this manner, an ensemble of 101 (100 perturbations + 1 original) timeseries are generated. The diagnosis of the onset/withdrawal date of the rainy season will converge or diverge amongst the ensemble members if it is found to be insensitive or sensitive to these random rain events, respectively.
2.2.3 Signal-to-noise ratio
We estimated the signal-to-noise ratio of the four quantities by utilizing the 101 ensemble members.
where, X belongs to any of the four quantities such as onset date, withdrawal date, seasonal length, and seasonal rainfall anomalies of the varying rainy season, a and b are indices for A years and B ensemble members, respectively. represents the measured total signal variance in the data over A years and which is defined as;
And = , = ,
The signal-to-noise ratio is then given by:
when ratio < 1 then it indicates that noise (or chaotic variations) is dominant, and the signal dominates when ratio > 1. A strong signal indicates that perturbing the rainfall time series will not substantially influence the diagnostics of the onset date, withdrawal date, seasonal length, and seasonal rainfall anomalies.
2.2.4 Significance test
In this study, we first estimate the two-tailed p values of the correlation coefficients using the t statistic. Further, following Benjamini and Hochberg (1995), we conduct a test for false rejection on all temporal correlations to assess its robustness, which is necessary because of the large number of simultaneous statistical significance tests conducted across all grid points of the domain. This process involves adjusting the p value (Benjamini and Hochberg, 1995) to control the false rejection of the null hypothesis, also known as the false discovery rate. By controlling the false discovery rate, we enhance the confidence in the significance of the findings.
The seasonal mean rainfall over India observed from IMERG is found to be comparable with IMD observation and superior to other satellite products over the region (Saikrishna et al., 2021). This is further confirmed in Fig. 1a–c which compares the 23-year annual mean rainfall climatology between IMERG observations and the corresponding IMD rainfall dataset. It may be noted that in Eq. (1), the annual mean rainfall climatology () at each grid point is used to determine onset dates and withdrawal dates of the rainy season over India (e.g., Misra et al., 2018). Overall, the annual mean rainfall climatology from IMERG compares well with the IMD rain gauge dataset. However, the overestimation of rainfall in the Indo–Gangetic plains and parts of northeast India and underestimation of rainfall over the northern Western Ghats, northern sections of northeast India, and the bulk of Jammu and Kashmir by IMERG relative to IMD dataset is apparent (Fig. 1). Bushair et al. (2019) noted that IMERG underestimates the rainfall over high-altitude regions compared to IMD observations, which are rain gauge based. Further, Fig. 1d shows the cumulative rainfall anomaly curve generated from the 23-year (2001–2023) daily rainfall climatology area averaged over all of India for IMERG (blue) and IMD (red) observations. The onset (inflection at the nadir of the cumulative anomaly curve) and withdrawal (inflection at the zenith of the cumulative anomaly curve) dates estimated from IMERG and IMD closely match each other, with the onset dates being 31 May and 3 June, and the withdrawal dates being 7 and 8 October, respectively.
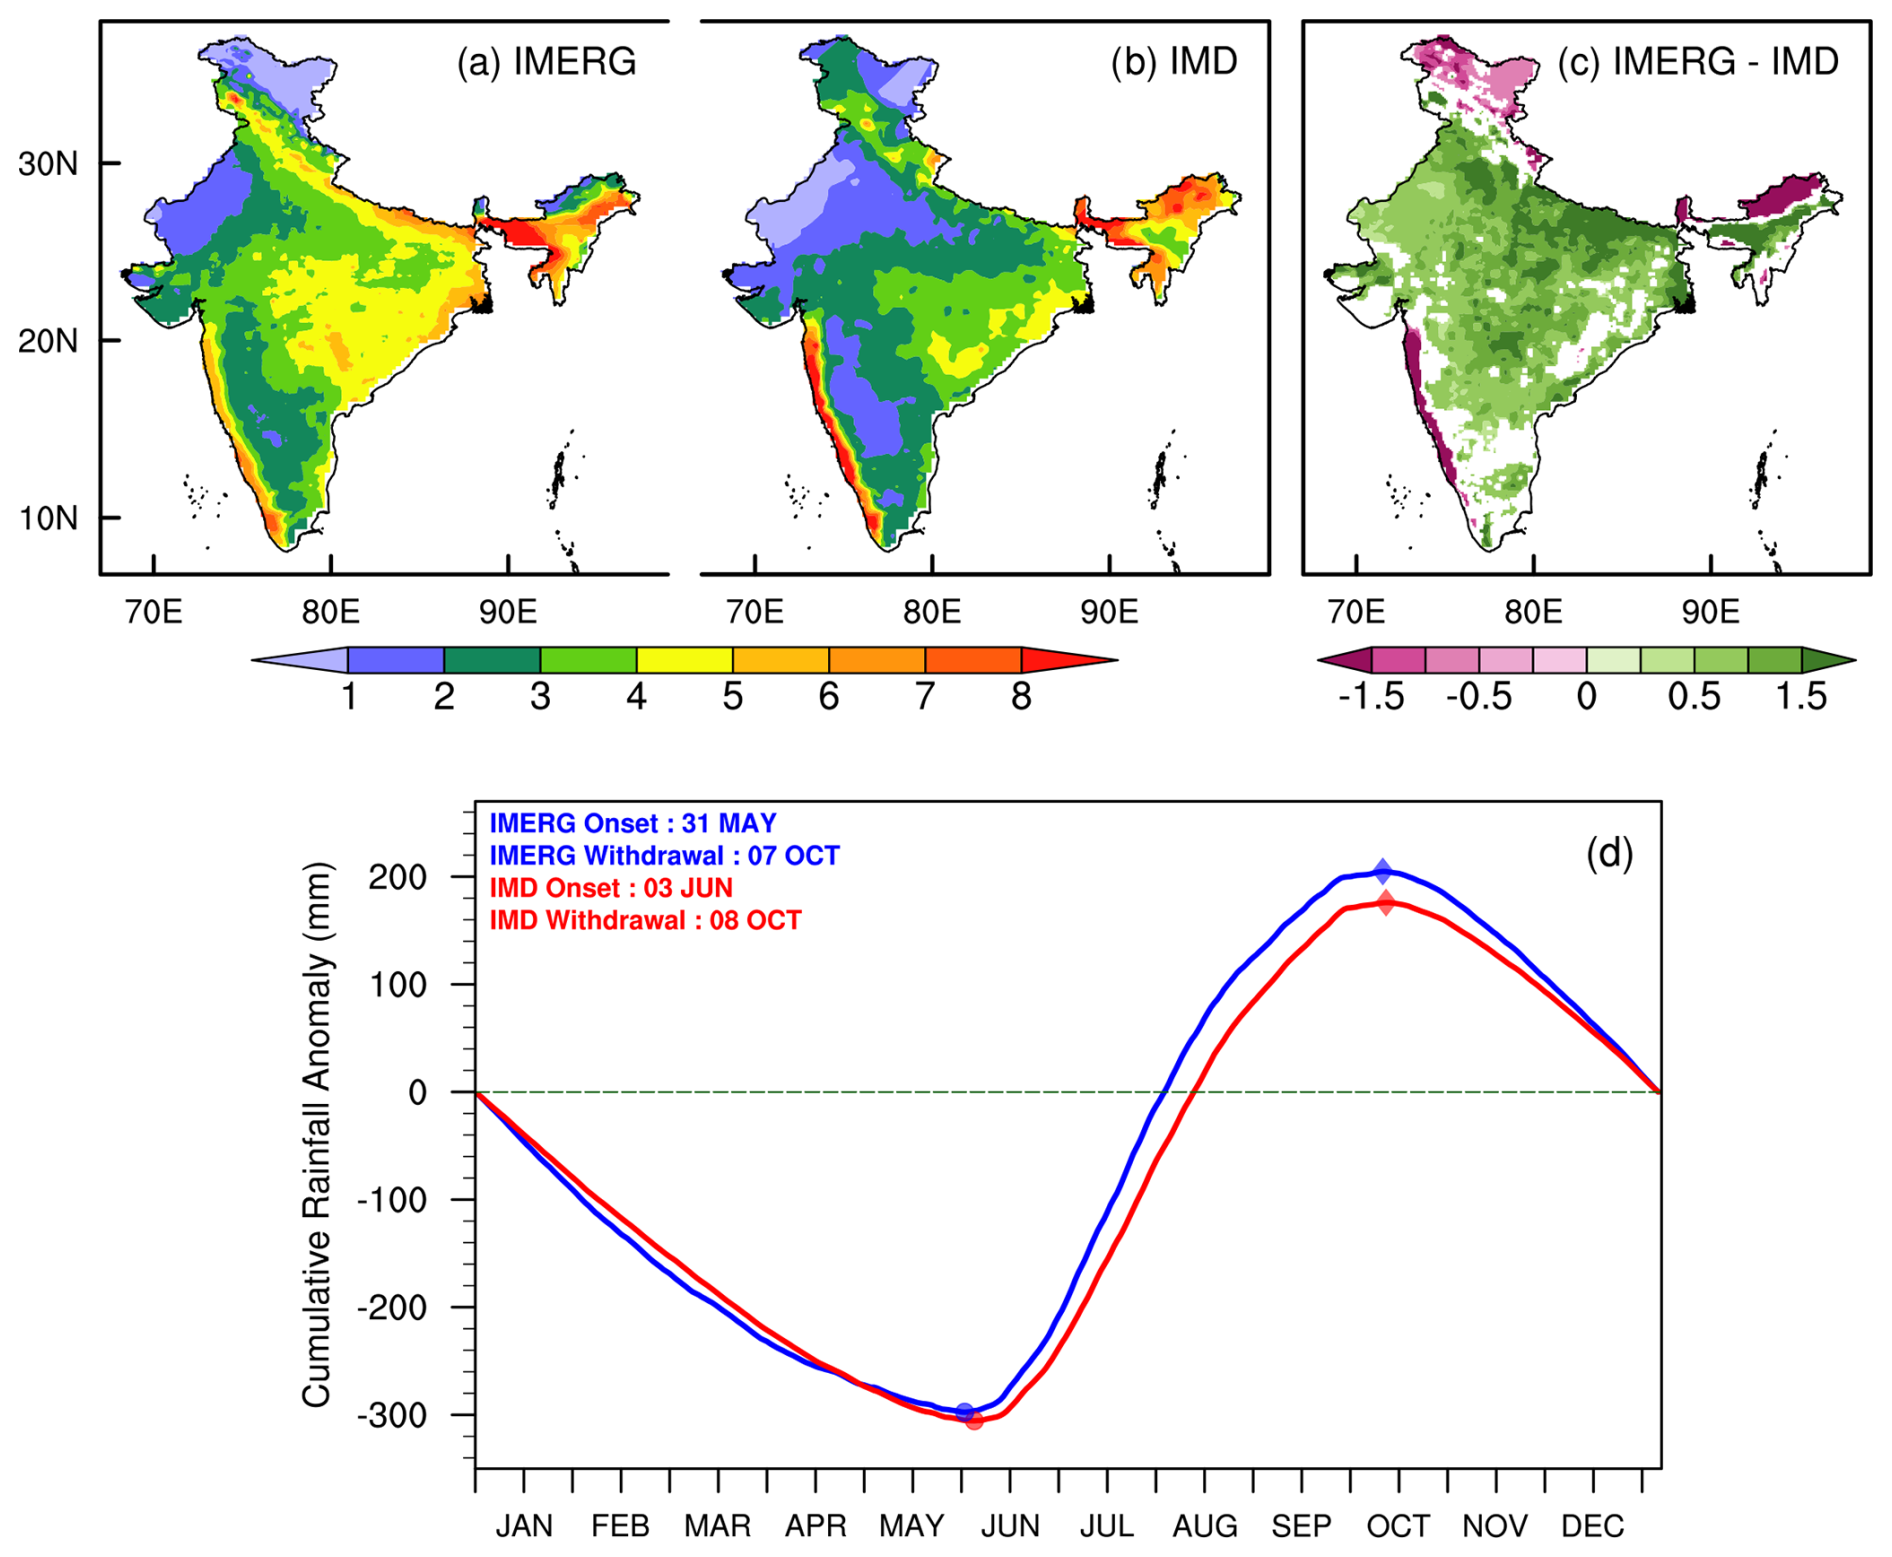
Figure 1Spatial pattern of the 23-year climatology of the mean annual rainfall (mm per day) during the period 2001–2023 from (a) IMERG observation, (b) IMD observation, and (c) the difference between the IMERG and IMD (only differences significant at 5th percentile level on t test is shaded). (d) The cumulative rainfall anomaly curve generated from the 23-year daily rainfall climatology of IMERG (blue) and IMD (red) observations. The onset dates (filled circles) and withdrawal dates (filled diamonds) obtained from both datasets are marked.
Figure 2a–d depict the 23-year local climatological onset date, withdrawal date, seasonal length, and seasonal accumulated rainfall from IMERG, with the associated standard deviation displayed in Fig. 2e–h. The spatial distribution of the climatology of the onset dates (Fig. 2a) shows the earliest onset occurs over northeast regions of India followed by southern Kerala, and then it gradually advances to the other parts of the country and looks like the typical isochrone evolution of the ISM (Ramage, 1971; Rao, 1976; Janowiak and Xie, 2003). The delayed onset occurs over the east coast of Tamil Nadu followed by Jammu and Kashmir. The onset dates over Kerala and adjacent regions mostly start from early May and do not coincide with the MoK, and this is because this methodology detects the onset dates relatively early due to strong and continuous spells of pre-monsoon rainfall. Similarly, the earliest withdrawal (Fig. 2b) of the ISM occurs over northwestern India such as Rajasthan, Punjab, Haryana, and Himachal Pradesh. The withdrawal date is delayed over southern peninsular India, with the most delayed withdrawal occurring over the southeast coast of Tamil Nadu. The seasonal length (Fig. 2c) is shorter in the west and northwest regions of India, with the shortest season in Jammu and Kashmir. The longer season over the peninsular India, as well as the coastal regions of Odisha and West Bengal, is linked to the season's earlier start date. The spatial distribution of the seasonal accumulated rainfall (Fig. 2d) closely follows the typical seasonal mean ISM distribution. The standard deviation patterns of the onset dates show central parts of India have less variability than other regions, such as southern peninsular India, northeast, and northwest regions. Similar patterns of variability are observed in the withdrawal dates and seasonal length with the largest variations found over southern peninsular India and northwest India and least over central India. On the other hand, the seasonal rainfall exhibits a significant range of variability across most of India, whereas comparatively less variability is observed over Rajasthan and Jammu and Kashmir.
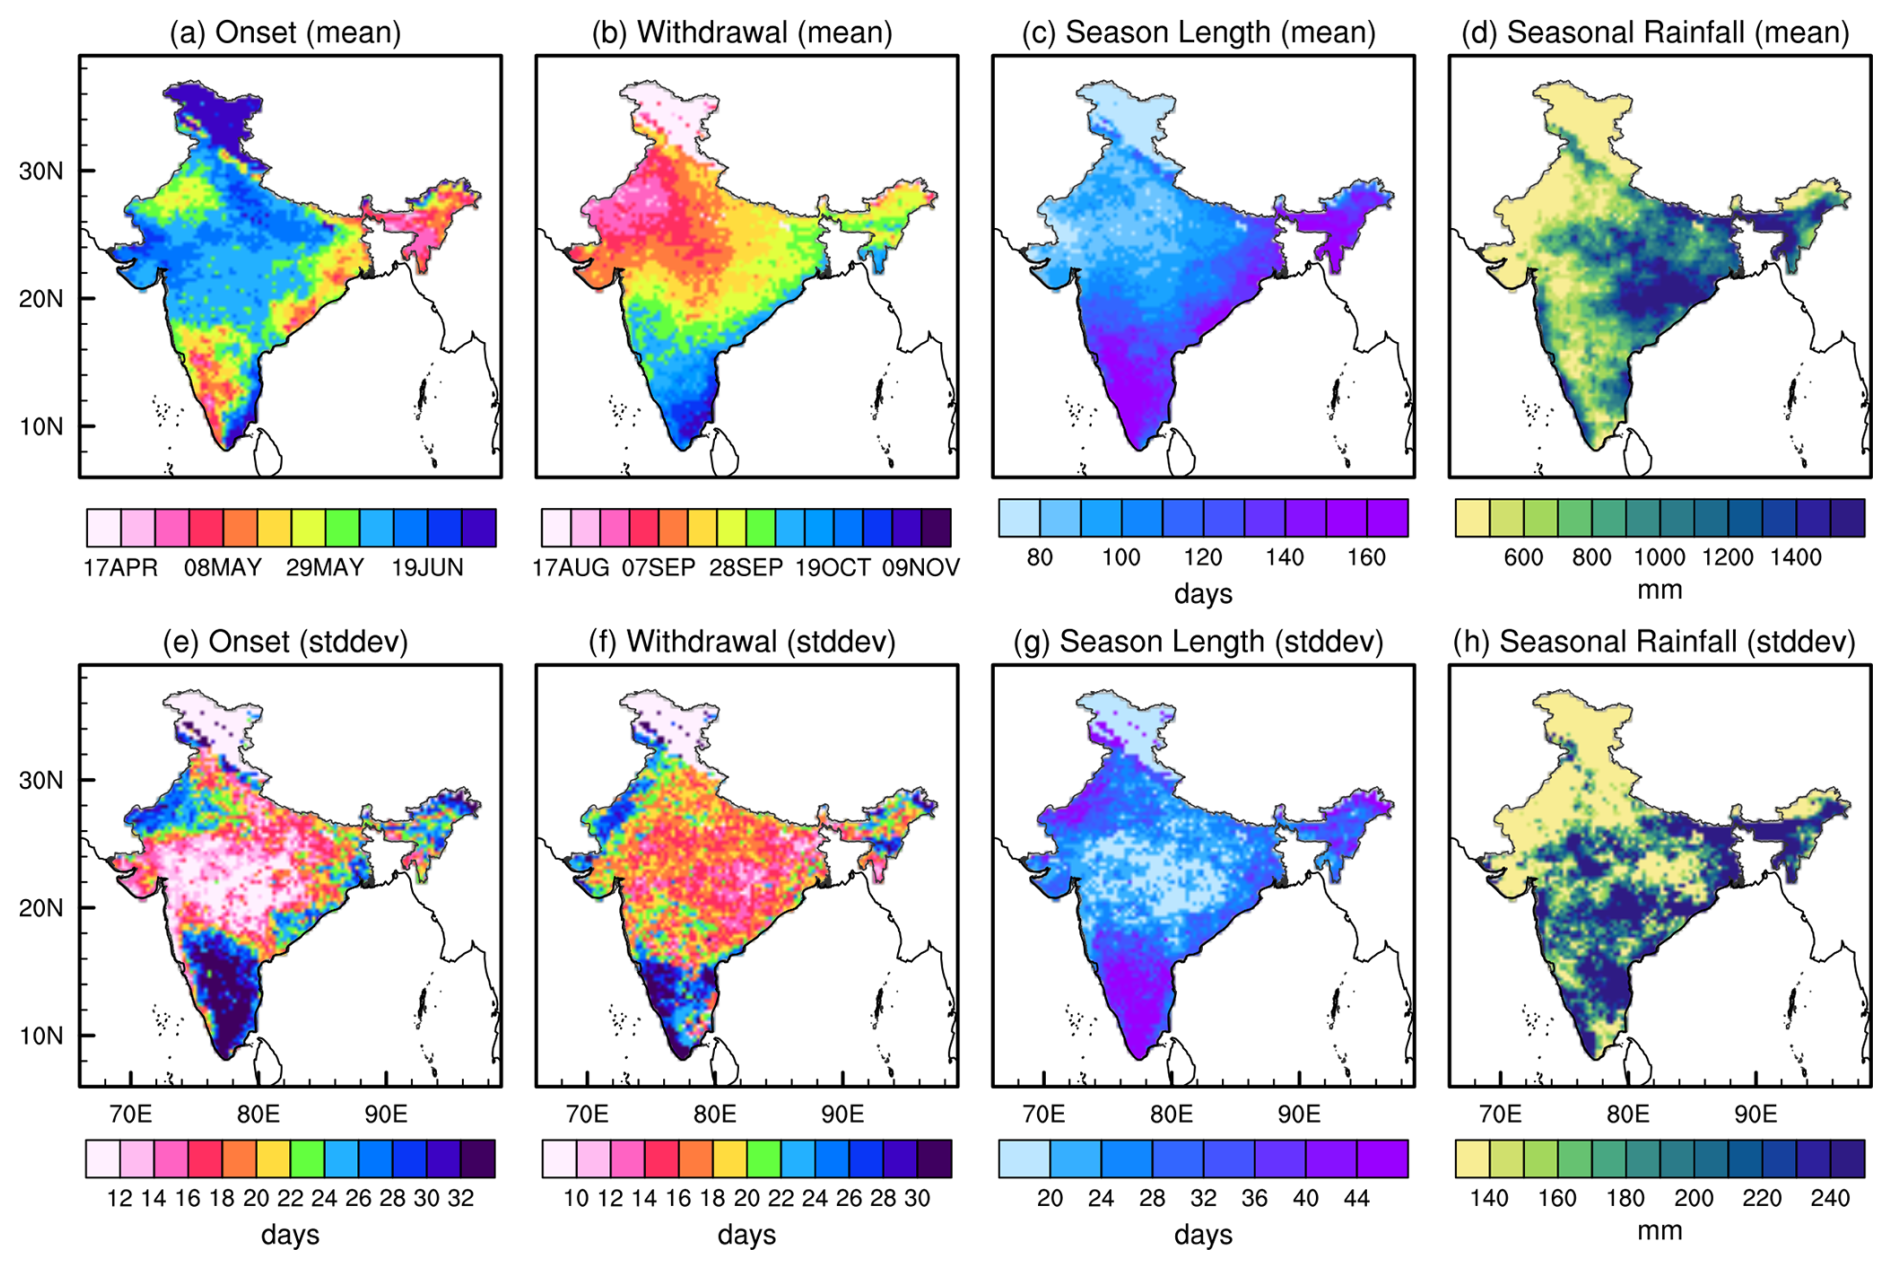
Figure 2The climatological (a) onset date (Julian day), (b) withdrawal date (Julian day), (c) seasonal length (days), and (d) seasonal accumulated rainfall (mm) of the rainy season from IMERG. The corresponding standard deviation of (e) onset date (days),(f) withdrawal date (days), (g) seasonal length (days), and (h) seasonal accumulated rainfall (mm). The contour intervals in panels (a) and (b) are at a 7 calendar day interval.
The IMERG dataset, with its 23-year record, was compared to the IMD and CPC datasets spanning 1979–2023 (limited to this period in order for CPC and IMD to have a common period) to evaluate onset and withdrawal dates, seasonal length, and seasonal accumulated rainfall of the rainy season over India (Fig. S2). The motivation to carry out this comparison is to establish that a 23-year record of IMERG is comparable to a longer record of dataset available from the other two sources besides examining its fidelity.
It is apparent from Fig. S2 that the spatial patterns of the climatological onset and withdrawal dates, seasonal length, and rainfall in IMERG is comparable to corresponding climatologies from IMD and CPC datasets. There is however a tendency for IMERG to have a bias of a slightly earlier onset of the rainy season compared to IMD and CPC, particularly over southern peninsular India, including Kerala and Tamil Nadu (Fig. S2a–c). Similar inference can be drawn in Rajasthan, coastal Odisha and West Bengal, and few isolated grid points over other regions. In contrast, over Jammu and Kashmir, IMERG exhibits a noticeably delayed onset, which makes us unsure about the results over this area. Similarly, IMERG display a systematic bias of slightly later withdrawal dates along the Western Ghats, but overall, the rainy season withdrawal dates are consistent across datasets (Fig. S2e–g). As a result, IMERG's rainy season seems to last longer than the other two datasets in some of these locations (Fig. S2i–k). Again, in terms of seasonal accumulated rainfall (Fig. S2m–o), IMERG overestimates precipitation compared to IMD and CPC in some of these locations. However, rainfall over the Western Ghats exhibits stronger gradients and is underestimated in IMERG while it exhibits more rainfall over western central India and Tamil Nadu than the other two datasets.
The interannual variability of these variables in IMERG also appear to be comparable to the other two datasets, especially in their spatial gradients (Fig. S3). There are however instances of some differences in the datasets. For example, over central India, the standard deviation of seasonal rainfall is significantly overestimated in IMERG compared to IMD (Fig. S3m–o), even though the withdrawal dates (Fig. S3e–g) and seasonal length (Fig. S3i–k) exhibit less variability in IMERG.
As mentioned earlier, IMERG has few different rainfall products based on the latency of their availability in real-time. We have made comparisons of 12 h latency product with the Final product of IMERG in Figs. S1, S2, and S3. The comparison in Fig. S1 indicates that some of the largest differences in the seasonal rain of the variable rainy season between Final and 12 h latency of IMERG is over northern India. However, the spatial patterns of the climatological onset appear comparable (Fig. S2c and d). But the climatological withdrawal dates appear to be slightly earlier in northern India in the Final run (Fig. S2h) compared to 12 h latency (Fig. S2g) of IMERG, which likely leads to slightly shorter length (Fig. S2l) and reduced seasonal rainfall (Fig. S2p) in the former (Fig. S2l) than in the latter (Fig. S2k and o). Some of the discrepancies observed in the 12 h latency product of IMERG relative to IMD and CPC in Figs. S2 and S3 can likely be attributed to the uncertainty associated with the choice of the 12 h latency product, which is an early version of IMERG with limited calibration against ground-based observations, its shorter temporal coverage of 23 years compared to the 45 years of data used for IMD and CPC. Despite these limitations, which seem to be tolerable for the applications of this study (compare Fig. 1) we are inclined to use IMERG due to its higher spatial resolution and near real-time availability making it particularly suitable for real-time applications.
The primary motivation to monitor the local onset and withdrawal of the ISM is its significant interannual variations and spatial variability (Fig. S3). Both the variation in seasonal length and seasonal rainfall are crucial in determining the nature of the rainy season (Xavier et al., 2007; Sperber and Annamalai, 2014). The spatial distribution of the correlation of the local onset date with the seasonal length shows a significant negative correlation across India except in some parts of central India and Jammu and Kashmir (Fig. 3a). This negative correlation suggests that an early or later onset date is likely to be associated with a longer or a shorter rainy season, respectively. Only the correlations significant at a 5 % level are shaded (non-significant values are shown in white) in Fig. 3. Similarly, early onset is associated with a wetter season, while a delayed onset is linked with a drier season (Fig. 3b). However, the grid points showing significant correlation are fewer in Fig. 3b compared to Fig. 3a. The correlations of the withdrawal date with seasonal length (Fig. 3c) and seasonal rainfall anomalies (Fig. 3d) show that later or early withdrawal of the wet season corresponds to a longer and wetter season, whereas an earlier withdrawal corresponds to shorter and drier seasons. While the correlation between seasonal rainfall and onset/withdrawal dates appears weaker than that with seasonal length, over 50 % of grid points across India still show statistically significant relationships. This is expected, as total rainfall during the rainy season is influenced by variations in the seasonal length but also daily rain rate, which can be influenced by various factors like tropical cyclones and intraseasonal weather patterns that may lead to a weak correlation with onset/withdrawal dates. However, the withdrawal date may not be a useful predictor for the rainy season because it occurs when the rainy season ends. The onset and withdrawal dates are largely uncorrelated (not shown), implying that their variations are independent of each other. These outcomes imply that the onset date alone can be a useful predictor for the outlook of the seasonal length and the seasonal rainfall anomaly of the forthcoming rainy season.
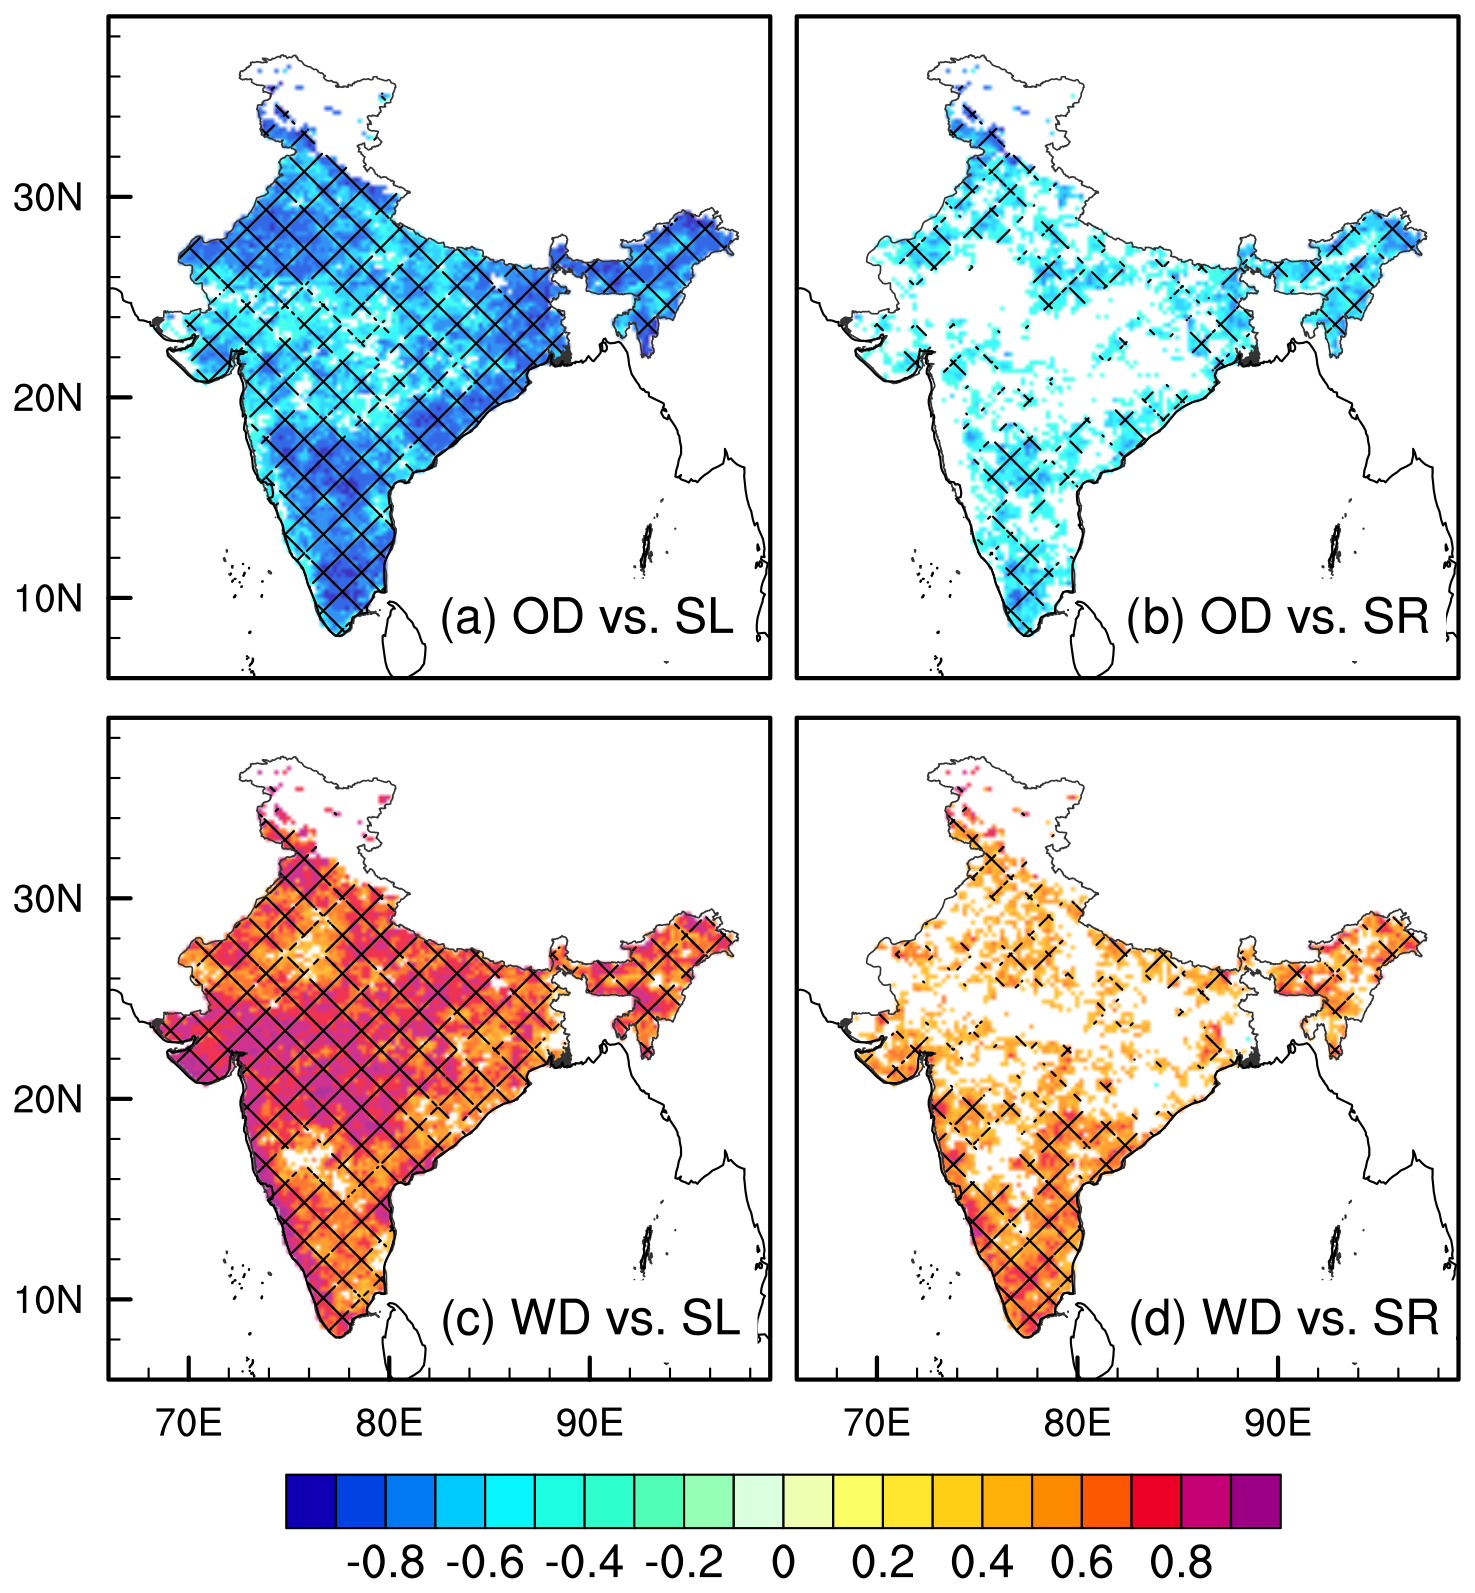
Figure 3The correlation coefficients of the onset date (OD) with (a) seasonal length (SL), and (b) seasonal rain (SR). Similarly, the correlations of withdrawal date (WD) with (c) SL and (d) SR. The shading indicates statistical significance at a 5% significance level according to the t statistic (non-significant values are shown in white), following false discovery rate testing as described by Benjamini and Hochberg (1995). Cross hatchings denote correlations greater than or equal to ±0.6.
We estimated the signal-to-noise ratio (Eq. 4) on the four variables of onset and withdrawal dates, seasonal length, and rainfall by utilizing the 101-member ensemble of time-series data. This analysis examines the spread across ensemble members and informs on the uncertainty of the diagnosis to random rain events. The signal-to-noise ratio for onset dates (Fig. 4a) shows that noise dominates in many places, particularly in peninsular India and the eastern half of central India. These low signal-to-noise ratio regions suggests that onset dates of the rainy season are not very strongly tied to the seasonal cycle and predicting the onset dates in these places becomes challenging and less reliable. In contrast, the signal-to-noise ratios for withdrawal dates (Fig. 4b) are typically more than one over most grid points. This indicates greater certainty for withdrawal dates, particularly in areas like Kerala, coastal Karnataka, and Gujarat, where the ratios are comparatively higher than one. In the case of the seasonal length, signal dominates over noise with a signal-to-noise ratio above 1 over most areas (Fig. 4c). Compared to the other variables, seasonal rainfall generally shows much higher signal-to-noise ratios (> 1) across most of the grid points. This result is obvious given the fact that seasonal rainfall is an aggregate of the daily rainfall over the entire rainy season, while the onset and withdrawal dates are single days of the season when they are diagnosed. Therefore, there is a tendency for the cancellation of the noise in the aggregation of the daily rainfall to seasonal rainfall, which yields a higher signal-to-noise ratio.
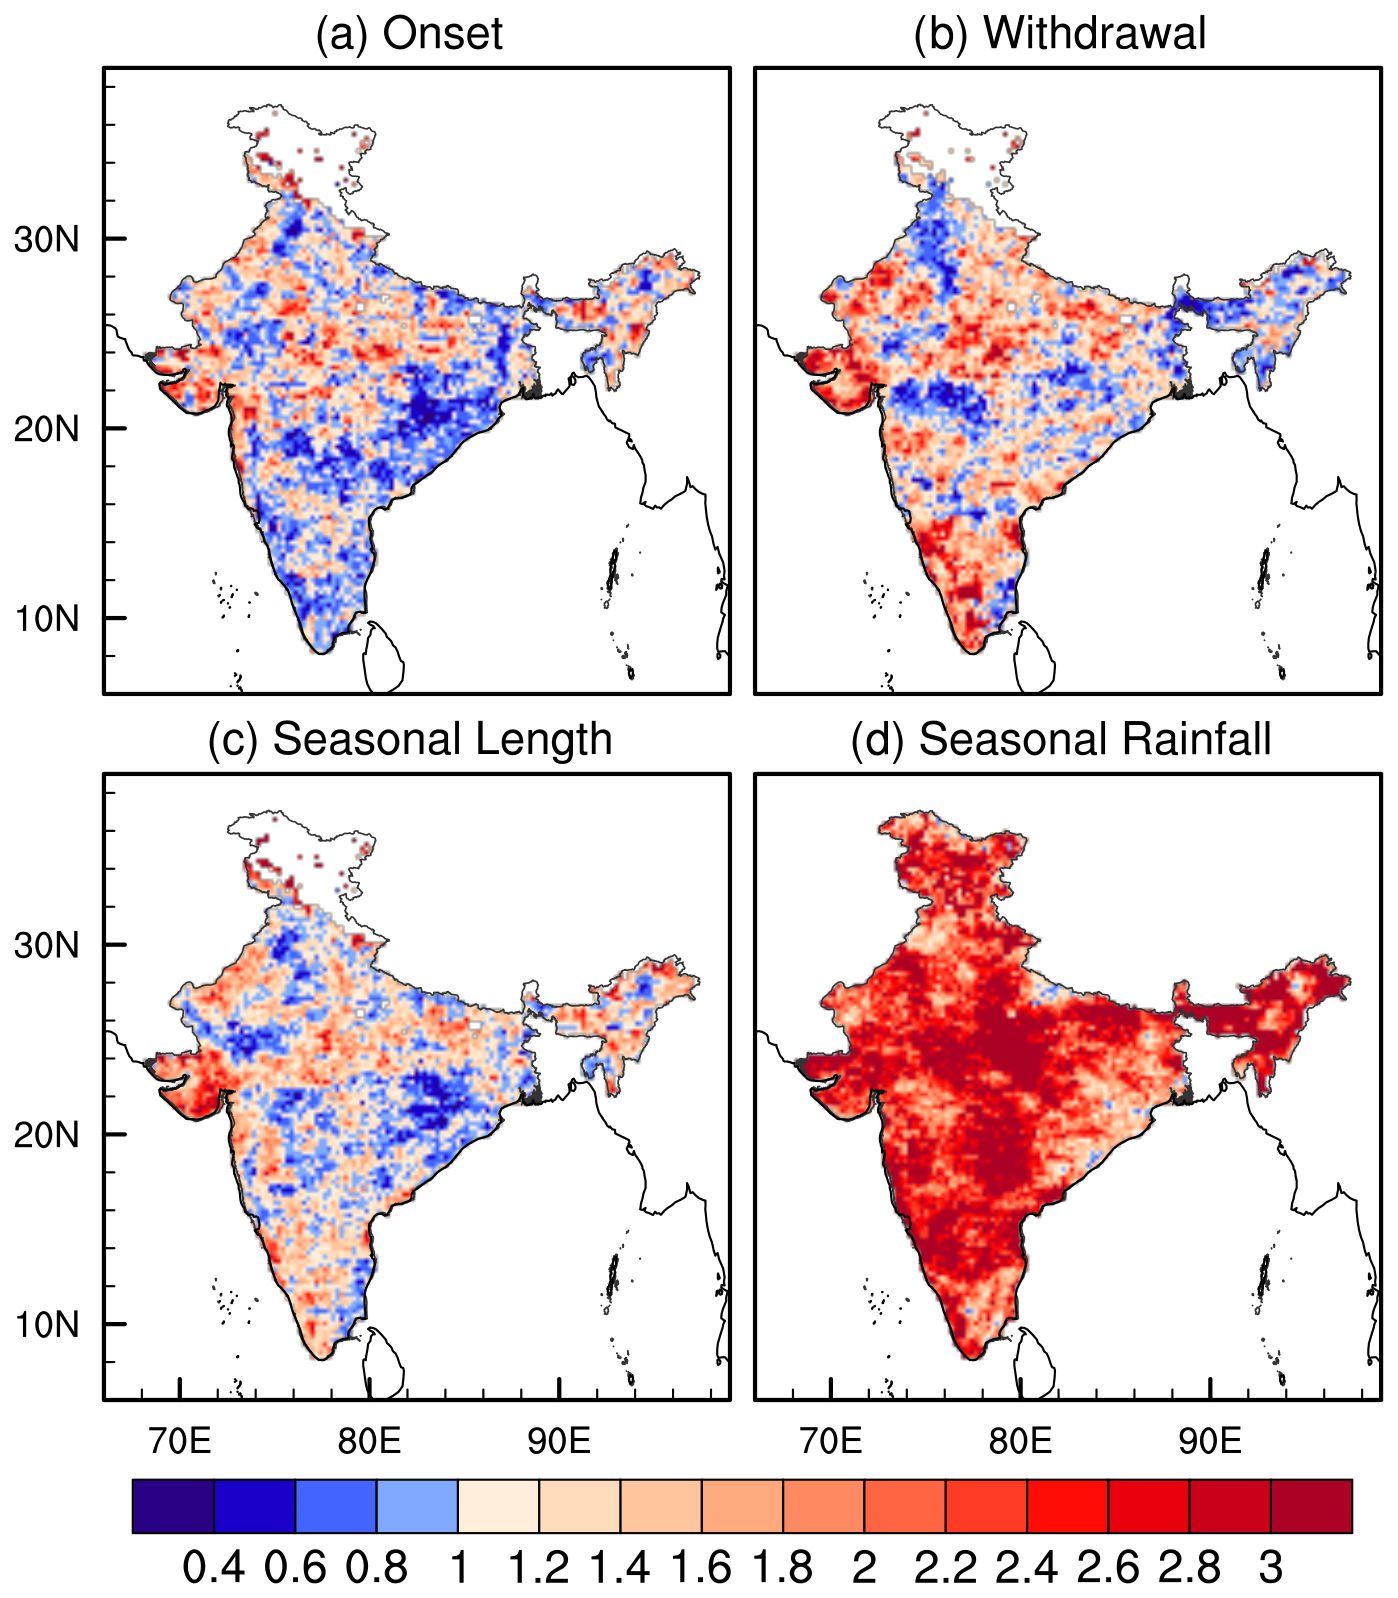
Figure 4The 23-year climatology of the signal-to-noise ratio of (a) onset date, (b) withdrawal date, (c) seasonal length, and (d) seasonal rainfall estimated based on the 101 ensemble members.
Further, we examined the probabilistic skill of the seasonal outlook by using the Area Under the relative operating characteristic (ROC) Curve (AUC) method. The AUC method is widely used to assess the skill of seasonal climate predictions (Mason and Graham, 2002; Misra, 2004; Narotsky and Misra, 2022). Previous studies have shown that this method is useful for evaluating the probabilistic skill of predicting anomalous seasons based on anomalous onset dates of the rainy season (e.g. Rodgers et al., 2024). We categorized the onset date, seasonal length, and seasonal rainfall into terciles (23-years divided into three groups): the lower tercile represents an early onset, shorter season, and drier conditions; the upper tercile signifies a delayed onset, longer season, and wetter conditions; and the middle tercile indicates normal onset, length, and seasonal rainfall. We then created a contingency table (Table S1 in the Supplement) to assess the probability of categorical forecasts. This table evaluates how often an early or late onset is linked with a shorter or longer season and with drier or wetter conditions, respectively. In addition, we also consider the effects of normal onset on normal length and seasonal rainfall.
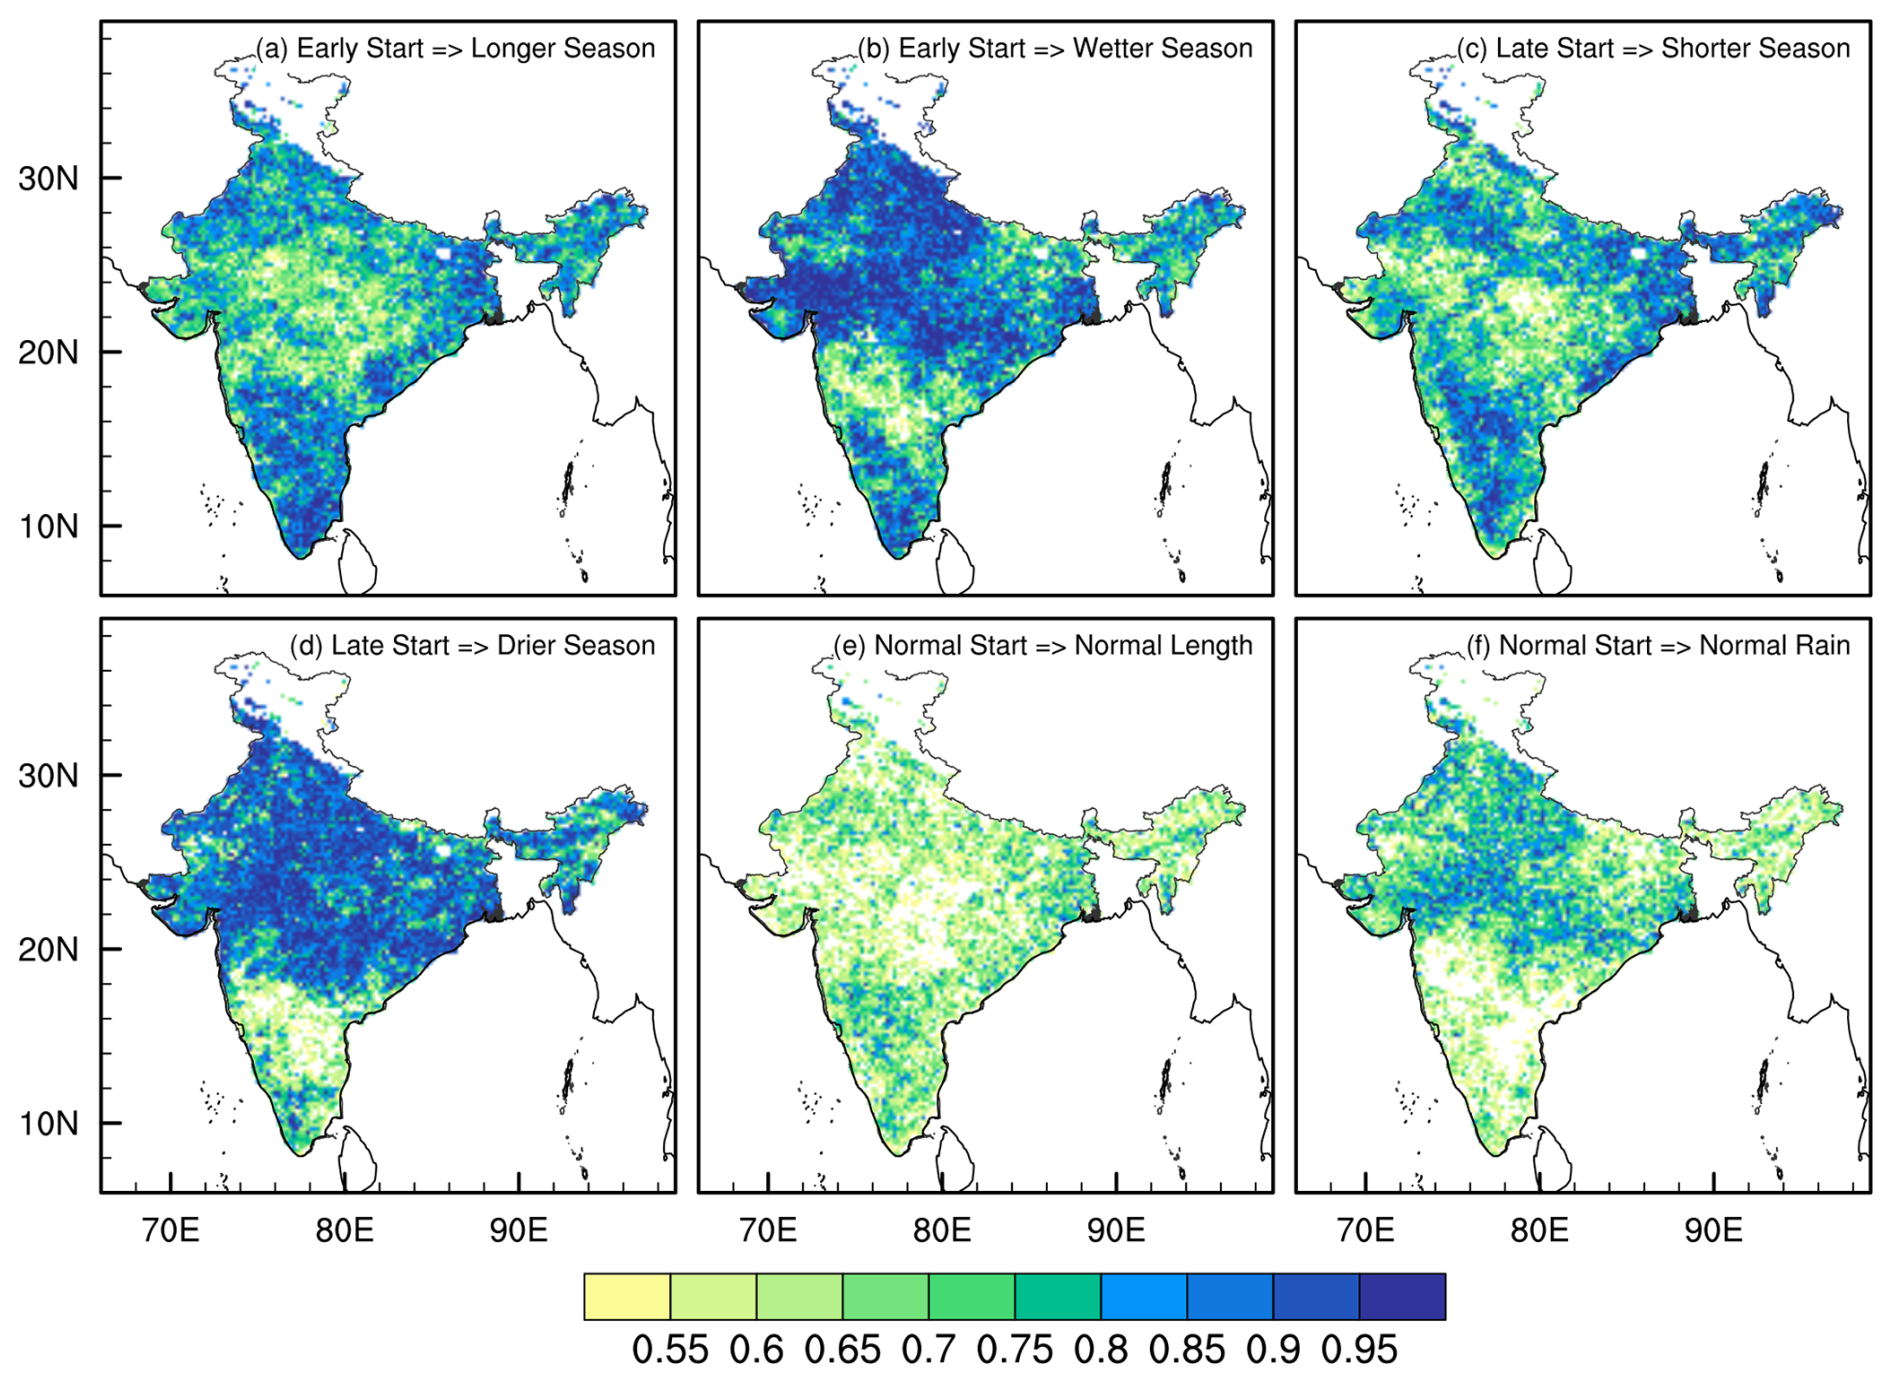
Figure 5The probabilistic skill score as measured by the Area Under the relative operating characteristic Curve (AUC) for early start (lowest tercile) season associated with (a) longer (highest tercile) and (b) wetter (highest tercile) season, late start (highest tercile) season associated with (c) shorter (lowest tercile) and (d) drier (lowest tercile) season, and normal (middle tercile) start season associated with (e) normal (middle tercile) seasonal length and (f) normal (middle tercile) seasonal rain. The AUC above 0.5 is shaded.
The probabilistic skill scores derived from the AUC method are shown in Fig. 5. Here, only grid points with AUC values ≥ 0.5 are shaded, as these points indicate skillful seasonal outlooks that outperform random predictions (Mason and Graham, 2002). The seasons with an early start and longer season (Fig. 5a) show the most skill (> 0.9) over peninsular India, northwest India, and some parts of northeast India. Similarly, the early start of the season, along with the wetter season (Fig. 5b), results in high skill levels across most parts of India except the majority of Maharashtra and north interior Karnataka. The late start and associated shorter seasons shown in Fig. 5c exhibit the highest skill score over some parts of peninsular India. The late start with the drier season also resulted in high skill scores across most of the areas except Kerala, Tamil Nadu, Karnataka and Andhra Pradesh. The anomalous seasons (Fig. 5a–d) demonstrate higher skill levels across India compared to the normal seasons (Fig. 5e–f). This is due to the leveraging of the linear relationships of the onset date variations with the rainy season variations (Fig. 3a and b). In contrast, seasons with a normal start of the rainy season exhibit lower AUC skill scores (Fig. 5e and f) across most grid points relative to the anomalous start of the rainy seasons (Fig. 5a–d). However, the skill scores for a normal start with normal rainfall (Fig. 5f) are slightly better than those for a normal start with normal length (Fig. 5e). In summary, the behavior of the forthcoming season is more predictable if the onset date is early or delayed than the normal. It is easy to adopt this methodology for real-time applications. The evolution of the daily cumulative anomaly curve of rainfall could be monitored in real-time to find the minima in the curve as the onset date. However, to avoid misdiagnosing the onset date of the rainy season, one could wait for a period of time after this diagnosis (typically a week) to confirm that the minima were indeed reached to declare the onset date. Once the onset date is diagnosed then one could use the linear relationships shown in Fig. 3 to develop a seasonal outlook for the rainy season. This is done routinely in Florida (Misra et al., 2022). With the availability of the merged IMERG estimates with the rain-gauge based IMD rainfall following Mitra et al. (2009) our proposed methodology could be adopted for real-time applications over India.
Further, we investigated the interannual variability of the onset dates over India and its association with ENSO (Fig. S4) and the Indian Ocean Dipole (IOD) variations (Fig. S5). In comparison to Figs. 3, S4 and S5 failed the BH test suggesting the lack of robustness in the teleconnections of the rainy season variations with either ENSO or IOD. It should be noted that the results in Figs. S4 and S5 appear to be contrary to many other studies that suggest a robust teleconnection of ENSO with ISM (e.g., Webster et al., 1998; Delsole and Shukla, 2002). However, our variable definition of the rainy season, which includes pre- and post-monsoon rainfall, would make the comparison with other studies dealing with fixed calendar ISM season and or all India averaged rainfall of the ISM incompatible. But in light of these results, which indicate a lack of strong external forcing, the significance of the reliability of the seasonal outlook of the rainy season shown in Fig. 5 assumes greater significance. Furthermore, the monitoring of the observations of the evolution of the rainy season, to diagnose the onset dates seems an attractive approach with the relatively low signal-to-noise ratio of the onset date of the rainy season shown in Fig. 4a, relative to the seasonal length in Fig. 4c or seasonal rainfall in Fig. 4d. We are then able to leverage a low signal-to-noise ratio quantity like the onset date of the rainy season to provide a seasonal outlook of relatively higher signal-to-noise ratio quantities of seasonal length and rainfall.
The seasonal prediction of the Indian rainy season is a considerable challenge given its complex spatio-temporal variations. In this study, we offer a simple and reliable technique for seasonal outlook of the rainy season, which is viable for real-time applications as well. Using precipitation estimates of IMERG version 6 over India at 10 km grid, we generate an ensemble of 101 members from randomly perturbing the series to assess the uncertainty of the diagnosed onset/withdrawal dates of the rainy season to random synoptic-meso scale rain events unconnected to the seasonal cycle. The proposed method generates a spatial distribution of local-scale onset and withdrawal dates, capturing regional variations and offering a nuanced view of progression rainy season across India. Such location-specific information is useful for practical applications such as agriculture, disaster planning, and water management.
We verified the IMERG rainfall observations against gauge-based IMD observations. The mean annual rainfall climatology of IMERG closely matches that of the IMD. However, IMERG tends to underestimate mean annual rainfall in high-altitude regions and overestimate it in the Indo–Gangetic plains. Further, we examined the relationships between the onset and withdrawal dates with seasonal length and rainfall and discovered that variations in onset and withdrawal dates of the rainy season across India have a significant impact on the seasonal length and the seasonal rainfall variations of the rainy season. It is found that an earlier onset date of the rainy season is strongly related to a longer and wetter season, whereas a later onset date corresponds to a shorter and drier season. However, the relationship between the onset, withdrawal, seasonal length, and rainfall with large-scale climate drivers such as ENSO and IOD is comparatively weaker in major parts of India. Although the influence of ENSO and IOD were investigated in this study, future research could investigate the influence of additional teleconnection patterns such as the Madden–Julian Oscillation (MJO), Pacific Decadal Oscillation (PDO), and North Atlantic Oscillation (NAO), which may also modulate the timing and characteristics of the rainy season.
This study shows that by estimating the onset date of the rainy season alone we can effectively provide a reliable seasonal outlook for both the seasonal length and total rainfall of the upcoming season by exploiting the existing local relationships. The low signal to noise ratio of the onset date of the rainy season suggests the dominance of internal variations, which will be a challenge for its seasonal predictability. However, by way of monitoring the evolution of the onset date we can leverage its local relationship with the seasonal length and seasonal rainfall anomaly to provide reliable seasonal outlook of the rainy season. The probabilistic skill scores of these seasonal outlooks generated from the monitoring of the onset date variations present an objective measure of its high confidence of reliability. Compared to traditional ISM onset definitions, which often focus on Kerala (e.g., MoK), the proposed method can generate spatial maps of local-scale onset dates of the rainy season. It captures regional heterogeneity and the progression of the rainy season across India. Since the method is based on the rainy season and includes pre- and post-monsoon rainfall, it provides a comprehensive viewpoint of the rainy season. These seasonal outlooks have numerous potential applications, and many local communities could greatly benefit from them. The proposed methodology for the seasonal outlook of the rainy season over India demonstrates its adaptation for real-time applications from the current availability of IMERG rainfall products in real-time.
The IMERG rainfall dataset is available from the NASA GES DISC (https://gpm1.gesdisc.eosdis.nasa.gov/data/GPM_L3/, last access: 23 September 2024). The India Meteorological Department rainfall data set used for the analysis in this study is available at https://www.imdpune.gov.in/cmpg/Griddata/Rainfall_25_NetCDF.html (last access: 21 March 2024). The daily CPC data is obtained from https://psl.noaa.gov/data/gridded/data.cpc.globalprecip.html (last access: 12 January 2024). The Python and NCL codes used for the analysis can be provided by the corresponding authors upon request.
The supplement related to this article is available online at https://doi.org/10.5194/wcd-6-981-2025-supplement.
The study was conceptualized by CBJ and VM. CBJ carried out the analysis and validation and prepared the original manuscript. VM supervised the work, acquired funding, and reviewed and edited the manuscript.
The contact author has declared that neither of the authors has any competing interests.
Publisher’s note: Copernicus Publications remains neutral with regard to jurisdictional claims made in the text, published maps, institutional affiliations, or any other geographical representation in this paper. While Copernicus Publications makes every effort to include appropriate place names, the final responsibility lies with the authors. Also, please note that this paper has not received English language copy-editing. Views expressed in the text are those of the authors and do not necessarily reflect the views of the publisher.
We acknowledge the support from NASA.
This research has been supported by the National Aeronautics and Space Administration (NASA; grant no. 80NSSC22K0595).
This paper was edited by Peter Knippertz and reviewed by two anonymous referees.
Ananthakrishnan, R. and Soman, M. K.: The onset of the southwest monsoon over Kerala: 1901–1980, J. Climatol., 8, 283–296, https://doi.org/10.1002/joc.3370080305, 1988.
Bansod, S. D., Singh, S. V., and Kripalani, R. H.: The relationship of monsoon onset with subsequent rainfall over India, Int. J. Climatol., 11, 809–817, https://doi.org/10.1002/joc.3370110707, 1991.
Benjamini, Y. and Hochberg, Y.: Controlling the false discovery rate: A practical and powerful approach to multiple testing, J. R. Stat. Soc. B, 57, 289–300, https://doi.org/10.1111/j.2517-6161.1995.tb02031.x, 1995.
Bhardwaj, A. and Misra, V.: Monitoring the Indian summer monsoon evolution at the granularity of the Indian meteorological sub-divisions using remotely sensed rainfall products, Remote Sens., 11, 1080, https://doi.org/10.3390/rs11091080, 2019.
Bombardi, R. J., Moron, V., and Goodnight, J. S.: Detection, variability, and predictability of monsoon onset and withdrawal dates: A review, Int. J. Climatol., 40, 641–667, https://doi.org/10.1002/joc.6264, 2020.
Bushair, M. T., Kumar, P., and Gairola, R. M.: Evaluation and assimilation of various satellite-derived rainfall products over India, Int. J. Remote Sens., 40, 1–24, https://doi.org/10.1080/01431161.2019.1579389, 2019.
Choudhury, D., Nath, D., and Chen, W.: The modulation of Indian summer monsoon onset processes during ENSO through equatorward migration of the subtropical jet stream, Clim. Dynam., 57, 141–152, https://doi.org/10.1007/s00382-021-05700-4, 2021.
Delsole, T. and Shukla, J.: Linear prediction of Indian monsoon rainfall, J. Climate, 15, 3645–3658, https://doi.org/10.1175/1520-0442(2002)015<3645:LPOIMR>2.0.CO;2, 2002.
Dhar, O. N., Rakhecha, P. R., and Mandal, B. N.: Does the early or late onset of monsoon provide any clue to subsequent rainfall during the monsoon season, Mon. Weather Rev., 108, 1069–1072, https://doi.org/10.1175/1520-0493(1980)108<1069:DTEOLO>2.0.CO;2, 1980.
Fasullo, J. and Webster, P. J.: A hydrological definition of Indian monsoon onset and withdrawal, J. Climate, 16, 3200–3210, https://doi.org/10.1175/1520-0442(2003)016<3200a:AHDOIM>2.0.CO;2, 2003.
Fitzpatrick, R. G., Parker, D. J., and Willetts, P. D.: Assessing the level of spatial homogeneity of the agronomic Indian monsoon onset, Geophys. Res. Lett., 43, 11–867, https://doi.org/10.1002/2016GL070711, 2016.
Gadgil, S. and Gadgil, S.: The Indian monsoon, GDP and agriculture, Econ. Polit. Weekly, 41, 4887–4895, https://www.jstor.org/stable/4418949 (last access: 15 August 2023), 2006.
Goswami, B. N. and Mohan, R. A.: Intraseasonal oscillations and interannual variability of the Indian summer monsoon, J. Climate, 14, 1180–1198, https://doi.org/10.1175/1520-0442(2001)014<1180:IOAIVO>2.0.CO;2, 2001.
Goswami, B. N. and Xavier, P. K.: ENSO control on the south Asian monsoon through the length of the rainy season, Geophys. Res. Lett., 32, L18715, https://doi.org/10.1029/2005GL023216, 2005.
Huffman, G. J., Bolvin, D. T., Braithwaite, D., Hsu, K. L., Joyce, R. J., Kidd, C., Chen, M., Nelkin, E. J., Tan, J., Hong, Y., Bowman, K. P., Stocker, E. F., and Xie, P.: Integrated multi-satellite retrievals for the global precipitation measurement (GPM) mission (IMERG), in: Satellite precipitation measurement, Springer, Cham, 1, 343–353, https://doi.org/10.1007/978-3-030-24568-9_19, 2020.
Janowiak, J. E. and Xie, P.: A global-scale examination of monsoon-related precipitation, J. Climate, 16, 4121–4133, https://doi.org/10.1175/1520-0442(2003)016<4121:AGEOMP>2.0.CO;2, 2003.
Joseph, P. V., Eischeid, J. K., and Pyle, R. J.: Interannual variability of the onset of the Indian summer monsoon and its association with atmospheric features, El Niño, and sea surface temperature anomalies, J. Climate, 7, 81–105, https://doi.org/10.1175/1520-0442(1994)007<0081:IVOTOO>2.0.CO;2, 1994.
Joseph, P. V., Sooraj, K. P., and Rajan, C. K.: The summer monsoon onset process over South Asia and an objective method for the date of monsoon onset over Kerala, Int. J. Climatol., 26, 1871–1893, https://doi.org/10.1002/joc.1340, 2006.
Karmakar, N. and Misra, V.: The relation of intraseasonal variations with local onset and demise of the Indian summer monsoon, J. Geophys. Res.-Atmos., 124, 2483–2506, https://doi.org/10.1029/2018JD029642, 2019.
Khouakhi, A., Villarini, G., and Vecchi, G. A.: Contribution of tropical cyclones to rainfall at the global scale, J. Climate, 30, 359–372, https://doi.org/10.1175/JCLI-D-16-0298.1, 2017.
Kung, E. C. and Sharif, T. A.: Regression forecasting of the onset of the India summer monsoon with antecedent upper air conditions, J. Appl. Meteorol., 19, 370–380, https://doi.org/10.1175/1520-0450(1980)019<0370:RFOTOO>2.0.CO;2, 1980.
Lal, M.: Climatic change – implications for India's water resources, J. Soc. Econ. Dev., 3, 57–87, https://ideas.repec.org/a/sch/journl/v3y2001i1p57-87.html (last access: 20 October 2023), 2000.
Liebmann, B. and Marengo, J.: Interannual variability of the rainy season and rainfall in the Brazilian Amazon basin, J. Climate, 14, 4308–4318, https://doi.org/10.1175/1520-0442(2001)014<4308:IVOTRS>2.0.CO;2, 2001.
Mason, S. J. and Graham, N. E.: Areas beneath the relative operating characteristics (ROC) and relative operating levels (ROL) curves: Statistical significance and interpretation, Q. J. Roy. Meteor. Soc., 128, 2145–2166, https://doi.org/10.1256/003590002320603584, 2002.
Misra, V.: An evaluation of the predictability of austral summer season precipitation over South America, J. Climate, 17, 1161–1175, https://doi.org/10.1175/1520-0442(2004)017<1161:AEOTPO>2.0.CO;2, 2004.
Misra, V. and DiNapoli, S.: The variability of the southeast Asian summer monsoon, Int. J. Climatol., 34, 893–901, https://doi.org/10.1002/joc.3735, 2014.
Misra, V., Bhardwaj, A., and Noska, R.: Understanding the variations of the length and the seasonal rainfall anomalies of the Indian summer monsoon, J. Climate, 30, 1753–1763, https://doi.org/10.1175/JCLI-D-16-0501.1, 2017.
Misra, V., Bhardwaj, A., and Mishra, A.: Local onset and demise of the Indian summer monsoon, Clim. Dynam., 51, 1609–1622, https://doi.org/10.1007/s00382-017-3924-2, 2018.
Misra, V., Jayasankar, C. B., Beasley, P., and Bhardwaj, A.: Operational monitoring of the evolution of rainy season over Florida, Frontiers in Climate, 4, 793959, https://doi.org/10.3389/fclim.2022.793959, 2022.
Misra, V., Dixit, S., and Jayasankar, C. B.: The regional diagnosis of onset and demise of the rainy season over tropical and subtropical Australia, Earth Interact., 27, 220026, https://doi.org/10.1175/EI-D-22-0026.1, 2023.
Mitra, A. K., Bohra, A. K., Rajeevan, M. N., and Krishnamurti, T. N.: Daily Indian precipitation analysis formed from a merge of rain-gauge data with the TRMM TMPA satellite-derived rainfall estimates, J. Meteorol. Soc. Jpn., 87A, 265–279, https://doi.org/10.2151/jmsj.87A.265, 2009.
Mooley, D. A. and Parthasarathy, B.: Fluctuations in all-India summer monsoon rainfall during 1871–1978, Climatic Change, 6, 287–301, https://doi.org/10.1007/BF00142477, 1984.
Mooley, D. A. and Shukla, J.: Variability and forecasting of the summer monsoon rainfall over India, in: Monsoon Meteorology, edited by: Chang, C. P. and Krishnamurti, T. N., Oxford Univ. Press, Oxford, UK, 26–59, ISBN 0195042549, 1987.
Moron, V. and Robertson, A. W.: Interannual variability of Indian summer monsoon rainfall onset date at local scale, Int. J. Climatol., 34, 1050–1061, https://doi.org/10.1002/joc.3745, 2014.
Narotsky, C. D., and Misra, V.: The Seasonal Predictability of the Wet Season over Peninsular Florida, Int. J. Climatol., 42(6), 3408–3417, https://doi.org/10.1002/joc.7423, 2022.
Noska, R. and Misra, V.: Characterizing the onset and demise of the Indian summer monsoon, Geophys. Res. Lett., 43, 4547–4554, https://doi.org/10.1002/2016GL068409, 2016.
Pai, D. S. and Rajeevan, M.: Indian summer monsoon onset: Variability and prediction, NCC Research Report No. 6, National Climate Centre, Indian Meteorological Department, https://www.imdpune.gov.in/reports.php, 2007.
Pai, D. S. and Rajeevan, M. N.: Summer monsoon onset over Kerala: New definition and prediction, J. Earth Syst. Sci., 118, 123–135, https://doi.org/10.1007/s12040-009-0020-y, 2009.
Pai, D. S., Rajeevan, M., Sreejith, O. P., Mukhopadhyay, B., and Satbha, N. S.: Development of a new high spatial resolution (0.25 × 0.25) long period (1901–2010) daily gridded rainfall data set over India and its comparison with existing data sets over the region, Mausam, 65, 1–18, https://doi.org/10.54302/mausam.v65i1.851, 2014.
Pai, D. S., Bandgar, A., Devi, S., Musale, M., Badwaik, M. R., Kundale, A. P., Gadgil, S., Mohapatra, M., and Rajeevan, M.: Normal dates of onset/progress and withdrawal of southwest monsoon over India, Mausam, 71, 553–570, https://doi.org/10.54302/mausam.v71i4.33, 2020.
Phadtare, J. A., Fletcher, J. K., Ross, A. N., Turner, A. G., Schiemann, R. K., and Burns, H. L.: Unravelling the mechanism of summer monsoon rainfall modes over the west coast of India using model simulations, Q. J. Roy. Meteor. Soc., 149, 3164–3182, https://doi.org/10.1002/qj.4550, 2023.
Pradhan, M., Rao, A. S., Srivastava, A., Dakate, A., Salunke, K., and Shameera, K. S.: Prediction of Indian summer-monsoon onset variability: A season in advance, Sci. Rep., 7, 14229, https://doi.org/10.1038/s41598-017-12594-y, 2017.
Prasad, V. S. and Hayashi, T.: Onset and withdrawal of Indian summer monsoon, Geophys. Res. Lett., 32, L20715, https://doi.org/10.1029/2005GL023269, 2005.
Preenu, P. N., Joseph, P. V., and Dineshkumar, P. K.: Variability of the date of monsoon onset over Kerala (India) of the period 1870–2014 and its relation to sea surface temperature, J. Earth Syst. Sci., 126, 76, https://doi.org/10.1007/s12040-017-0852-9, 2017.
Rajeevan, M. and Dubey, D. P.: Long range prediction of monsoon onset over Kerala, Mausam, 46, 287–290, https://doi.org/10.54302/mausam.v46i3.3261, 1995.
Ramage, C.: Monsoon Meteorology, in: Int. Geophys. Ser., Academic Press, San Diego, CA, 15, 296 pp., 1971.
Rao, Y. P.: Southwest monsoon, Meteorological Monograph Synoptic Meteorology, 1, 367 pp., 1976.
Rodgers, J., Misra, V., and Jayasankar, C. B.: Using the observed variations of the start date of the rainy season over Central America for its reliable seasonal outlook, J. Climate, 37, 4901–4913, https://doi.org/10.1175/JCLI-D-23-0699.1, 2024.
Saikrishna, T. S., Ramu, D. A., and Osuri, K. K.: Inter-comparison of high-resolution satellite precipitation products over India during the summer monsoon season, Meteorol. Atmos. Phys., 133, 1675–1690, https://doi.org/10.1007/s00703-021-00829-7, 2021.
Sankar, S., Kumar, M. R., and Reason, C.: On the relative roles of El Niño and Indian Ocean Dipole events on the monsoon onset over Kerala, Theor. Appl. Climatol., 103, 359–374, https://doi.org/10.1007/s00704-010-0306-7, 2011.
Sperber, K. R. and Annamalai, H.: The use of fractional accumulated precipitation for the evaluation of the annual cycle of monsoons, Clim. Dynam., 43, 3219–3244, https://doi.org/10.1007/s00382-014-2099-3, 2014.
Stolbova, V., Surovyatkina, E., Bookhagen, B., and Kurths, J.: Tipping elements of the Indian monsoon: Prediction of onset and withdrawal, Geophys. Res. Lett., 43, 3982–3990, https://doi.org/10.1002/2016GL068392, 2016.
Thakur, M. K., Kumar, T. L., Narayanan, M. S., Kundeti, K. R., and Barbosa, H.: Analytical study of the performance of the IMERG over the Indian landmass, Meteorol. Appl., 27, e1908, https://doi.org/10.1002/met.1908, 2020.
Walker, J. M. and Bordoni, S.: Onset and withdrawal of the large-scale South Asian monsoon: A dynamical definition using change point detection, Geophys. Res. Lett., 43, 11–815, https://doi.org/10.1002/2016GL071026, 2016.
Wang, B., Ding, Q., and Joseph, P. V.: Objective definition of the Indian summer monsoon onset, J. Climate, 22, 3303–3316, https://doi.org/10.1175/2008JCLI2675.1, 2009.
Wang, B. and LinHo: Rainy season of the Asia–Pacific summer monsoon, J. Climate, 15, 386–398, https://doi.org/10.1175/1520-0442(2002)015<0386:RSOTAP>2.0.CO;2, 2002.
Wang, X., Jiang, X., Yang, S., and Li, Y.: Different impacts of the two types of El Niño on Asian summer monsoon onset, Environ. Res. Lett., 8, 044053, https://doi.org/10.1088/1748-9326/8/4/044053, 2013.
Webster, P. J., Magaña, V. O., Palmer, T. N., Shukla, J., Tomas, R. A., Yanai, M., and Yasunari, T.: Monsoons: Processes, predictability, and the prospects for prediction, J. Geophys. Res., 103, 14451–14510, https://doi.org/10.1029/97JC02719, 1998.
Xavier, P. K., Marzin, C., and Goswami, B. N.: An objective definition of the Indian summer monsoon season and a new perspective on the ENSO–monsoon relationship, Q. J. Roy. Meteor. Soc., 133, 749–764, https://doi.org/10.1002/qj.45, 2007.
Xie, P., Yatagai, A., Chen, M., Hayasaka, T., Fukushima, Y., Liu, C., and Yang, S.: A gauge-based analysis of daily precipitation over East Asia, J. Hydrometeorol., 8, 607–626, https://doi.org/10.1175/JHM583.1, 2007.
Zeng, X. and Lu, E.: Globally unified monsoon onset and retreat indexes, J. Climate, 17, 2241–2248, https://doi.org/10.1175/1520-0442(2004)017<2241:GUMOAR>2.0.CO;2, 2004.