the Creative Commons Attribution 4.0 License.
the Creative Commons Attribution 4.0 License.
 | 17 Jul 2020
The role of large-scale dynamics in an exceptional sequence of severe thunderstorms in Europe May–June 2018
Jannik Wilhelm
Jan Wandel
Michael Kunz
Raphael Portmann
Heinz Jürgen Punge
Manuel Schmidberger
Julian F. Quinting
Christian M. Grams
Over 3 weeks in May and June 2018, an exceptionally large number of thunderstorms hit vast parts of western and central Europe, causing precipitation accumulations of up to 80 mm within 1 h and several flash floods. This study examines the conditions and processes that made this particular thunderstorm episode exceptional, with a particular focus on the interaction of processes across scales.
During the episode, a blocking situation persisted over northern Europe. Initially, the southwesterly flow on the western flank of the blocking anticyclone induced the advection of warm, moist, and unstably stratified air masses. Due to the low-pressure gradient associated with the blocking anticyclone, these air masses were trapped in western and central Europe, remained almost stationary, and prevented a significant air mass exchange. In addition, the weak geopotential height gradients led to predominantly weak flow conditions in the mid-troposphere and thus to low vertical wind shear that prevented thunderstorms from developing into severe organized systems. Due to a weak propagation speed in combination with high rain rates, several thunderstorms were able to accumulate enormous amounts of precipitation that affected local-scale areas and triggered several torrential flash floods.
Atmospheric blocking also increased the upper-level cut-off low frequency on its upstream regions, which was up to 10 times higher than the climatological mean. Together with filaments of positive potential vorticity (PV), the cut-offs provided the mesoscale setting for the development of a large number of thunderstorms. During the 22 d study period, more than 50 % of lightning strikes can be linked to a nearby cut-off low or PV filament. The exceptionally persistent low stability over 3 weeks combined with a weak wind speed in the mid-troposphere has not been observed during the past 30 years.
- Article
(15467 KB) - Full-text XML
-
Supplement
(4658 KB) - BibTeX
- EndNote


Historically, the period from May to mid-June 2018 was among the most active periods of severe convective storms associated with heavy rain, hail, convective wind gusts, and even tornadoes over large parts of western and central Europe (WetterOnline, 2018a, b, c; DWD, 2018a). More than 1500 reports of hazardous weather events were documented by the European Severe Weather Database (ESWD; Dotzek et al., 2009). Rainfall totals of up to 90 mm within a few hours caused (pluvial) flash floods in various municipalities. Gust speeds of up to 30 m s−1 led to numerous fallen trees and severely damaged buildings. For example, from 26 May to 1 June 2018, thunderstorms caused insured losses of about USD 300 million and overall losses of about USD 430 million according to Munich Re's NatCatSERVICE (Munich Re, 2019). Thus, it was the costliest convective storm event in western Europe that year.
In general, the development of convective storms results from scale interactions of different processes in the atmosphere. It is well known that deep moist convection depends on three necessary but not singularly sufficient ingredients (e.g. Johns and Doswell, 1992; Trapp, 2013): (i) convective instability over a layer of sufficient depth, (ii) sufficient moisture in the lower troposphere, and (iii) a suitable lifting mechanism for the triggering of convection. The first two requirements are usually controlled by processes on the synoptic scale. The latter can occur at different scale ranges. For example, lifting mechanisms on the mesoscale include orographic lifting, horizontal convective rolls, or gravity waves (e.g. Wilson and Schreiber, 1986; Browning et al., 2007; Barthlott et al., 2010), whereas large-scale lifting can be related to dry lines or cold fronts (e.g. Bennett et al., 2006; Kunz et al., 2020). A further relevant condition for the evolution of deep moist convection is the vertical wind shear, which is decisive not only for the organizational form, the longevity, and thus the severity of the convective storms (e.g. Weisman and Klemp, 1982; Thompson et al., 2007; Dennis and Kumjian, 2017) but also for their propagation (Corfidi, 2003).
The general synoptic situation during the thunderstorm episode in 2018 investigated in this study was similar to that prevailing over a 15 d period in May–June 2016, where an exceptionally large number of thunderstorms also caused several flash floods, primarily in Germany (Piper et al., 2016; Bronstert et al., 2018; Ozturk et al., 2018). During the episode in 2016, a blocking anticyclone over the North Sea and Scandinavian region prevented an exchange of the dominant unstably stratified air masses over several days. In addition, low wind speeds throughout the troposphere caused the thunderstorms to be almost stationary with the effect of torrential rain accumulations in several small regions (Piper et al., 2016, hereinafter referred to as PIP16).
Atmospheric blocking, with a typical lifetime of several days to weeks, is a quasi-stationary, persistent flow situation that modulates the large-scale extratropical circulation (Rex, 1950a, b; Barriopedro et al., 2006; Woollings et al., 2018). Such blocks typically occur either in a dipole configuration with an accompanying cut-off low on the equatorward side (Rex, 1950a; Tibaldi and Molteni, 1990) or they adopt an omega shape with cut-off lows forming at the flanks of the blocked region (Dole and Gordon, 1983). In the potential vorticity (PV) framework, a cut-off low is an upper-level closed anomaly of stratospheric high PV air (e.g. Wernli and Sprenger, 2007; Nieto et al., 2007a, 2008). PV anomalies, in general, have a far-field impact on the meteorological conditions in their surroundings (see Hoskins et al., 1985). Below the positive PV anomaly, isentropes bend upward, resulting in reduced static stability and increased lifting. Due to an induced cyclonic circulation anomaly, the positive PV anomaly favours isentropic gliding up and thus ascent along the isentropes that usually bend upward towards the pole. Finally, when the positive PV anomaly propagates, air masses ascend isentropically at the PV anomalies' upstream side. These three mechanisms associated with lifting are intrinsic to upper-level positive PV anomalies in general. Additionally, at the flanks of a mature PV cut-off, small mesoscale filaments of positive PV often separate and are advected away, particularly when the PV cut-off gradually decays (Portmann et al., 2018). When such a positive PV filament moves over air masses that are conditionally or potentially unstably stratified, the associated lifting indirectly contributes to convective initiation (triggering) and thus – if the air parcel reaches its level of free convection – to the release of convective available potential energy (CAPE) and to removal of convective inhibition (CIN). The effect of large-scale PV anomalies accompanied by cut-off lows on deep moist convection (in relation to severe precipitation events) has already been observed in other studies showing that for Europe this is an important mechanism for producing convection due to the associated patterns of advection and vertical motion (Roberts, 2000; Morcrette et al., 2007; Browning et al., 2007; Russell et al., 2012).
At first, atmospheric blocking was primarily known for its conjunction to extreme weather events such as cold spells and heatwaves (and associated droughts; e.g. Pfahl and Wernli, 2012a; Bieli et al., 2015; Schaller et al., 2018; Röthlisberger and Martius, 2019). But blocking can also create environmental conditions conducive for deep moist convection development in peripheral locations upstream and downstream of the block itself. Thus, the link to heavy precipitation events (including flood events) has already been intensively investigated in past years (e.g. Martius et al., 2013; Grams et al., 2014; Piaget et al., 2015; Sousa et al., 2017; Lenggenhager et al., 2018; Lenggenhager and Martius, 2019). A new study by Mohr et al. (2019) shows a statistical relationship between convective activity (based on lightning data) and specific blocking situations in the European sector. They found a block over the Baltic Sea frequently associated with increased thunderstorm occurrences because of southwesterly advection of warm, moist, and unstable air masses on its western flank. In addition, such situations are usually associated with weak wind speed at mid-tropospheric levels and thus weak vertical wind shear over the thunderstorm area, with the consequence that thunderstorms often become stationary and rarely develop into large organized convective systems. Recently, Tarabukina et al. (2019) also demonstrated a correlation between the annual variation in summer lightning activity in Yakutia (Russia) and the frequency of atmospheric blocking in western Siberia.
The primary objective of this paper is to examine the conditions and processes that made this particular thunderstorm episode in 2018 unique. We focus on the process interaction across scales, i.e. from the large-scale dynamics such as atmospheric blocking to mesoscale PV cut-off lows and small PV filaments to modifications of the convective environment to local-scale thunderstorm occurrences. Further objectives are to highlight the synoptic setting during the thunderstorm episode, to demonstrate the severity of the events, and to place the event in a historical context.
The paper is structured as follows: Sect. 2 presents the different datasets and the methods used. Section 3 starts with a description of the thunderstorm episode in 2018 by investigating different observational data such as lightning information, hazardous storm reports, rain gauge measurements, and radar-based storm tracks estimating the propagation speed. Subsequently, the synoptic situation prior to and during the examined thunderstorm episode is investigated by analyses of the large-scale flow situation, backward trajectories, accompanying weather regimes, and environmental conditions such as instability, moisture, or mid-tropospheric wind speed. Furthermore, we examine the role of PV cut-offs and PV filaments on the development of deep moist convection. Following this, Sect. 4 puts the results in a historical context, whereby the exceptional nature of the thunderstorm episode is assessed by relating the observed rainfall totals, the prevailing environmental conditions, and the occurrence of cut-off systems to long-term data records. Finally, Sects. 5 and 6 discuss and summarize the main results and draw conclusions.
The study area includes parts of central and western Europe – France, the Benelux (Belgium, Netherlands, Luxembourg), Germany, Switzerland, and Austria (see Fig. 1). The study period extends over 3 weeks from 22 May to 12 June 2018, where most of the thunderstorms and associated hazards such as heavy rain, hail, and convective wind gusts occurred (see Sect. 3). To highlight the synoptic situation prior to the episode and to emphasize that severe convection during the study period was embedded in a longer-lasting unusual large-scale flow situation, we consider an extended study period from 1 May to 20 June 2018. For the purpose of climatological comparison, the 30-year period from 1981 to 2010 (1 May to 30 June) is the reference period (unless otherwise indicated).
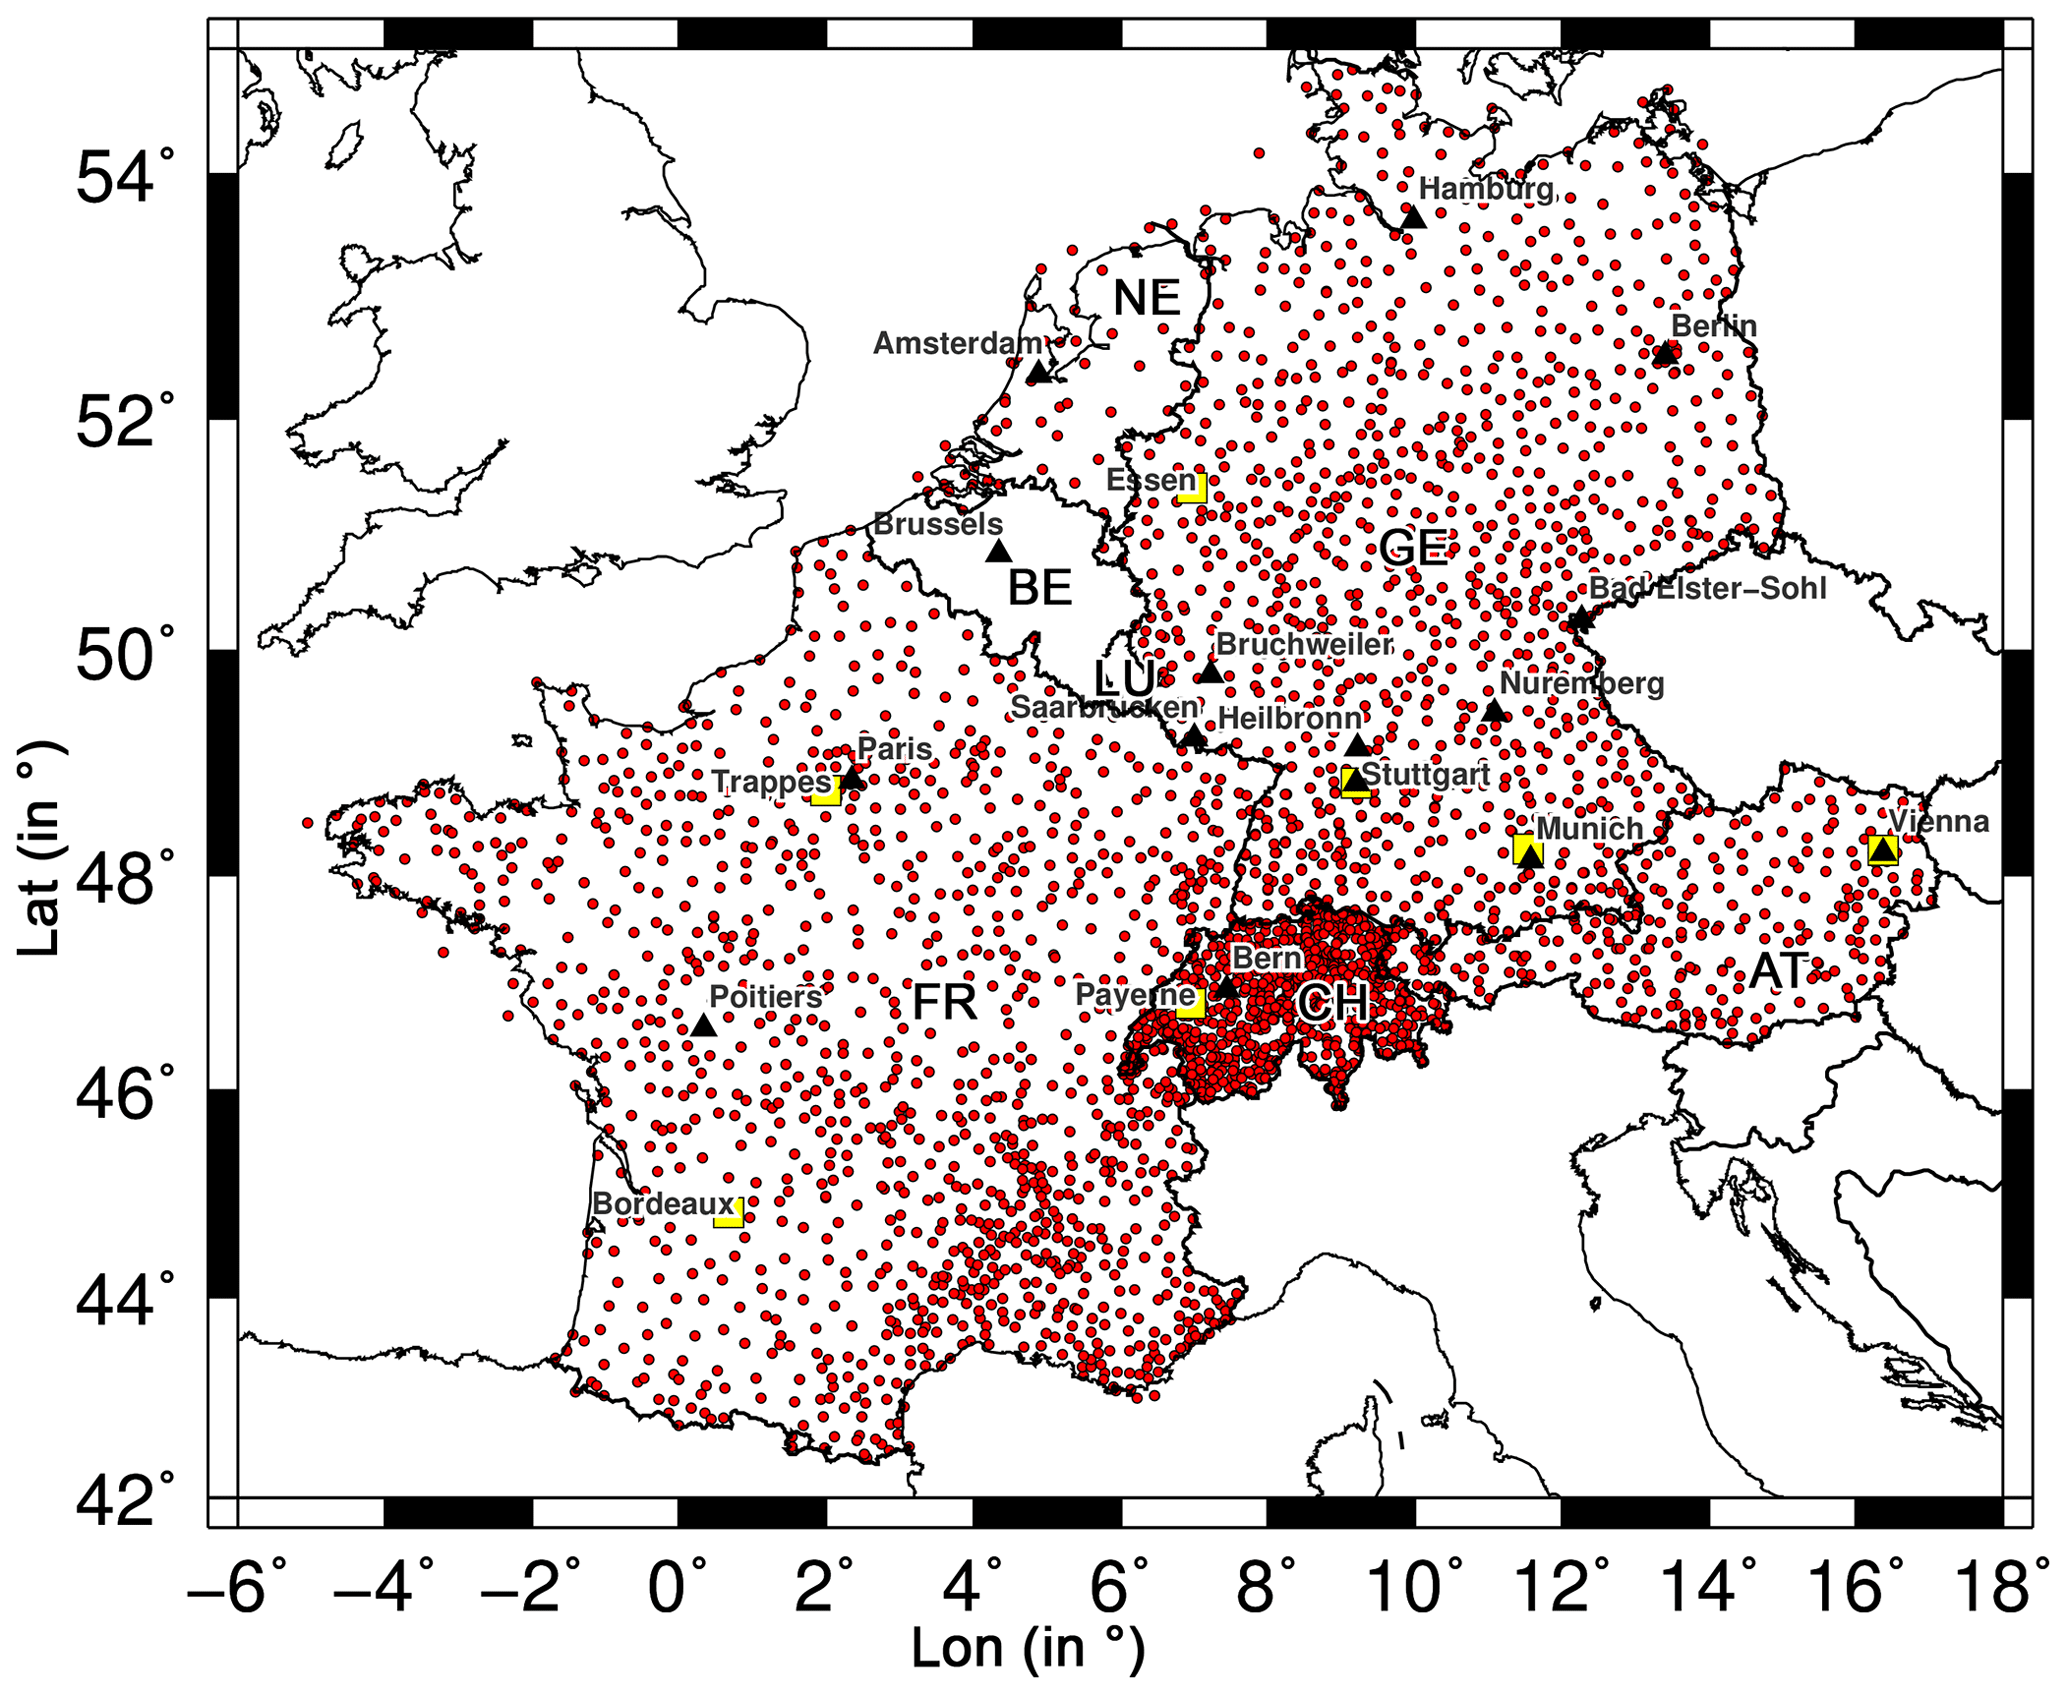
Figure 1All considered precipitation stations (in red) collected from ECA&D and the three national weather services (France, Germany, Switzerland; see Sect. 2.1.3). In addition, the seven investigated sounding stations are shown (in yellow; see Sect. 2.1.5). Some relevant locations are also presented, as they are used in the text. Defined country codes are FR (France), BE (Belgium), NE (Netherlands), LU (Luxembourg), GE (Germany), CH (Switzerland), and AT (Austria).
2.1 Observational data
For the description of the thunderstorm episode in 2018, we use different observational data. Lightning data offer the best spatially homogeneous coverage for complete thunderstorm detection, but these data do not discern according to severity. For this purpose, we use eyewitness reports of the ESWD and precipitation observations (station-based and gridded-based). Radar-based storm tracks permit an investigation of the propagation speed of the convective cells. Some investigations are limited to Germany, for which data were available (storm tracks, regionalized precipitation data) but enable a deeper insight into the exceptional nature of the phenomena. Additionally, the atmospheric conditions are examined with data from various sounding stations. Some data records are also available consistently and homogeneously over long-term periods, which allows us to compare the episode with historical conditions and events.
2.1.1 Lightning data
Lightning data are obtained from the ground-based low-frequency lightning detection system operated by Siemens as part of the EUCLID network (EUropean Cooperation for LIghtning Detection; Drüe et al., 2007; Schulz et al., 2016; Poelman et al., 2016). Available for the whole study domain, the data are projected on an equidistant grid of 10×10 km2 and accumulated over 6 h periods centred around the time steps in ERA-Interim reanalysis (e.g. for the 06:00 UTC reanalysis, the lightning period is 03:00–09:00 UTC). This allows the data to be linked to the cut-off lows (see Sect. 2.5). We consider all types of flashes including cloud-to-ground, cloud-to-cloud, and intra-cloud flashes, whereas polarity or peak current are not investigated.
2.1.2 ESWD reports
We use reports of heavy rain, hail (diameter ≥2 cm), and convective wind gusts ≥25 m s−1 from the European Severe Weather Database (ESWD; Dotzek et al., 2009; Groenemeijer et al., 2017). The ESWD is a step-by-step quality-controlled (four levels) database providing detailed information about severe convective storms in Europe, mainly based on reports from storm chasers, eyewitnesses, voluntary observers, meteorological services, and news media. We consider all records with a quality level QC0+ and above. Using a homogeneous data format, these observations contain information about hazardous weather events, such as location, time, intensity, and damage-related information. For a detailed description of the event reporting criteria, see ESSL (2014).
2.1.3 Rainfall totals
Daily rainfall totals of 232 stations distributed across the domain (41–58∘ N, 4∘ W–20∘ E) are collected from the European Climate Assessment and Dataset (ECA&D), a database of daily meteorological station observations across Europe (Klein Tank et al., 2002). In addition, hourly and daily data are obtained from Météo France (1223/1935 stations with hourly/daily data), the Royal Netherlands Meteorological Institute (KNMI; 50/322), the German Weather Service (DWD; 958/810), MeteoSwiss (952/0), and the Central Institution for Meteorology and Geodynamics (ZAMG; 254/0). For statistics of 1 and 3 h extreme rainfall events, we apply the same severity thresholds used in the ESWD (ESSL, 2014), which amount to 35 and 60 mm, respectively (Wussow, 1922; Nachtnebel, 2003). Note that the 24 h criterion of 170 mm was not measured at any of the stations.
Statistical return periods of single heavy precipitation events are estimated using regionalized precipitation data (REGionalisierte NIEderschläge, REGNIE) provided by DWD (DWD, 2018b). REGNIE is a gridded dataset of 24 h totals (from 06:00 to 06:00 UTC on the next day) based on approximately 2000 climate stations that are more or less evenly distributed across Germany. The REGNIE algorithm interpolates the measurement data to a regular grid of 1 km2, considering altitude, exposure, and climatology (Rauthe et al., 2013). The data covering only Germany are available from 1951. The long-term availability of REGNIE over almost 70 years is the decisive advantage compared to other datasets, such as RADOLAN (merger between radar and station data; DWD, 2019), which have a higher spatial and temporal resolution but are only available for 20 years. Note that the REGNIE time series are affected by temporal changes in the number of rain gauges considered by the regionalization (Rauthe et al., 2013). For our purpose, the homogeneity of the data is sufficient.
Statistical return periods of REGNIE totals are quantified using the Generalized Extreme Value (GEV) distribution (e.g. van den Besselaar et al., 2013; Ehmele and Kunz, 2019). The Fisher–Tippett Type I distribution, also known as the Gumbel distribution (Gumbel, 1958; Wilks, 2006), has been extensively used in various fields including hydrology for modelling extreme events, e.g. to estimate statistical return periods or return values (Sivapalan and Blöschl, 1998; Rasmussen and Gautam, 2003). The Gumbel cumulative distribution function (CDF) for the precipitation totals R is given by
with ζ and β as location and scale parameters, respectively. For their estimation, we use the Method of Moments (Wilks, 2006, chap. 4) and consider the 67-year period from 1951 to 2017 (summer half-year from April to September):
and
with σ as the standard deviation, as the mean of the REGNIE sample, and δ as the Euler–Mascheroni constant (≈0.5772). The return period tRP is directly related to the probability of occurrence of the threshold so that the CDF is given by . The resulting equation to estimate tRP is
2.1.4 Storm tracks computed from radar reflectivity
Storm motion vectors are computed from 3D radar reflectivity data from the radar network of DWD. The data, which include 17 radar stations with dual-polarization Doppler radars, are combined and interpolated into a radar composite with a spatial resolution of 1 × 1 km2 (Cartesian grid). The temporal resolution of the individual scans is 15 min. Radar reflectivity is available on 12 equidistant vertical levels extending from 1 to 12 km above ground level for the whole period between 2005 and 2018. These data are used to relate the storm motions computed for the investigation period to the climatology (Sect. 4.1). Data were stored in six reflectivity classes only. The two highest classes, which are considered here, range from 46 to 55 dBZ and ≥55 dBZ.
To identify storm tracks, the cell-tracking algorithm TRACE3D (Handwerker, 2002) is adapted to the DWD radar composite in Cartesian coordinates. Once the algorithm detects a convective cell core, it can be re-detected in consecutive time steps and merged into an entire cell track. Storms are defined as having a minimum reflectivity core of 55 dBZ (corresponding to the highest class) and a vertical extent of at least 1 km. Thus, only severe convective storms frequently associated with hazardous weather are considered. Thunderstorms above the 55 dBZ threshold usually form a well-defined core of high reflectivity that can be easily and reliably tracked. Based on TRACE3D, information about width, length, duration, and propagation speed, as well as direction, is available for each individual thunderstorm track. Note that we mainly use tracking to estimate the propagation speed and direction of the cells (Sects. 3 and 4.1). Even if weaker cells are not detected using the 55 dBZ thresholds, it can be assumed that weaker cells are unlikely to move with higher speeds (see Video Supplement for 2 representative days). More details about data and the tracking method can be found in Puskeiler et al. (2016) and Schmidberger (2018). Due to a lack of 3D radar data for the other countries in 2018, our investigation refers only to severe convective storms that occurred in Germany.
2.1.5 Sounding stations
Atmospheric conditions are estimated from vertical profiles of temperature, moisture, wind speed, and wind direction at seven sounding stations provided by DWD and the Integrated Global Radiosonde Archive (IGRA) from the National Climatic Data Center (Durre et al., 2006). These stations are distributed over the entire domain: Bordeaux (44.83∘ N, 0.68∘ W) and Trappes (48.77∘ N, 2.00∘ E) in France; Essen (51.41∘ N, 6.97∘ E), Stuttgart (48.83∘ N, 9.20∘ E), and Munich (48.24∘ N, 11.55∘ E) in Germany; Payerne (46.82∘ N, 6.95∘ E) in Switzerland; and Vienna (48.23∘ N, 16.37∘ E) in Austria (see Fig. 1). Other sounding stations could not be used because of multiple gaps in the time series.
Atmospheric stability can be estimated by indices such as CAPE as well as by the surface-based lifted index (SLI; Galway, 1956). The latter, which we use in the following, has proven to be as suitable as CAPE in several studies (e.g. Huntrieser et al., 1997; Sánchez et al., 2009; Westermayer et al., 2017; Rädler et al., 2018). There are studies in which SLI has even shown a better prediction skill than CAPE (e.g. Haklander and van Delden, 2003; Manzato, 2003; Kunz, 2007; Mohr and Kunz, 2013). In addition to the SLI, we also investigate the horizontal wind speed at 500 hPa (V500). Both variables are analysed at 12:00 UTC, several hours ahead of peak thunderstorm activity in central and western Europe (Wapler, 2013; Piper and Kunz, 2017; Enno et al., 2020).
2.2 Model data
We use the European Centre for Medium-Range Weather Forecasts (ECMWF) high-resolution operational analysis data and ECMWF ERA-Interim reanalysis (Dee et al., 2011) to describe the large-scale meteorological conditions and calculate weather regimes (see Sect. 2.3), perform kinematic backward trajectories (see Sect. 2.4), and identify cut-off lows (see Sect. 2.5). ECMWF analysis is available interpolated 6-hourly to a regular grid with 0.125∘ horizontal resolution. ERA-Interim used for the historical analysis is available interpolated 6-hourly to a regular grid at 1.0∘ horizontal resolution. Beside the atmospheric stability (based on SLI), in the study we examine V500, the bulk wind shear (BWS; directional shear), defined as wind difference between 10 m and 500 hPa calculated by vector subtraction (e.g. Thompson et al., 2007), 500 hPa geopotential height (Z500), and the vertically integrated water vapour (IWV).
2.3 North Atlantic–European weather regimes
The large-scale flow conditions in the Atlantic–European region are characterized in terms of a definition of seven year-round weather regimes based on 10 d low-pass-filtered 500 hPa geopotential height anomalies (Grams et al., 2017). The regimes are identified by k means clustering in the phase space spanned by the seven leading empirical orthogonal functions (EOFs). Based on these seven clusters, an active weather regime life cycle is derived from the normalized projection of each 6-hourly anomaly in the cluster mean following Michel and Rivière (2011). Thereby, time steps with weak projections are filtered out (no regime). An active regime life cycle persists for at least 5 d but fulfils further criteria as described in Grams et al. (2017).
Our weather regime definition is in line with classical concepts of four seasonal regimes for Europe (e.g. Vautard, 1990; Michelangeli et al., 1995; Ferranti et al., 2015) but reflects important seasonal differences. Three of the seven regimes are dominated by a negative Z500 anomaly and enhanced cyclonic activity (see Fig. S1 in the Supplement). These are the Atlantic Trough (AT) regime, with a trough extending towards western Europe; the zonal regime (ZO), with cyclonic activity around Iceland; and the Scandinavian Trough (ScTr) regime, with a trough shifted towards the east. The remaining four regimes are characterized by a positive Z500 anomaly centred at different locations and therefore referred to as “blocked regimes”. These are the Atlantic Ridge (AR) regime, with a blocking ridge over the eastern North Atlantic and an accompanying trough extending from eastern Europe into the central Mediterranean; the European blocking (EuBL) regime, with a blocking anticyclone extending from western Europe to the North Sea; the Scandinavian blocking (ScBL) regime, with high-latitude blocking over Scandinavia; and the Greenland blocking (GL) regime, with a blocking ridge over the Greenland–Iceland region.
2.4 Lagrangian analysis tool
The path of the air masses during the thunderstorm period from 22 May to 12 June is traced by calculating 10 d kinematic backward trajectories from ERA-Interim using the Lagrangian Analysis Tool (LAGRANTO; Wernli and Davies, 1997; Sprenger and Wernli, 2015). The trajectories are initialized every 6 h on each day of the study period from the nearest ERA-Interim grid points to the surrounding site and its immediate neighbours to the north, south, east, and west (Fig. 1, yellow squares). In order to represent the Lagrangian history of moist, lower-tropospheric air masses that contributed to the severe thunderstorms, trajectories are initialized every 50 hPa between 950 and 600 hPa.
2.5 Identification of PV cut-off low and matching with lightning data
We identify upper-level cut-off lows based on PV on the 325 K isentropic surface from ERA-Interim using the algorithm of Wernli and Sprenger (2007) and Sprenger et al. (2017). The optimal level for the inspection of weather systems on isentropic surfaces depends on the season. The specific level of 325 K used here is motivated by previous studies (cf. Röthlisberger et al., 2018) and the inspection of isentropic PV charts for our case. The algorithm searches for closed areas of PV larger than 2 PVU, which are disconnected from the main PV reservoir that expands across the North Pole.
Following earlier approaches to match weather objects with surface weather (e.g. cyclones and precipitation; Pfahl and Wernli, 2012a, b), the identified PV cut-off lows (including their PV filaments) are then related to thunderstorm events using lightning data on the 10 × 10 km2 grid cells. We utilize the smallest distance approach to link a grid cell in the lightning dataset to a grid point in the PV cut-off dataset. The different grid sizes between the model and observation datasets require matching multiple grid cells (lightning data) to one PV cut-off grid point. This means if a grid point shows the presence of a PV cut-off, all flashes from the associated grid cells are linked to it.
To account for the far-field impact of lifting and destabilization by a PV cut-off, we expand the PV cut-off mask by a buffer. This scale is estimated from the typical Rossby radius of deformation
associated with a PV cut-off. Here, N is the Brunt–Väisälä frequency, H is the scale height, and f0 is the Coriolis parameter. For characteristic values in mid-latitudes with N=0.01 s−1 and s−1, N∕f0 is typically on the order of 100. A scale height of 10 km leads to a Rossby deformation radius of 1000 km, which is typical for synoptic scales. We assume that some of the PV cut-offs during the study period have a vertical extent of less than 10 km. Therefore, we chose a conservative deformation radius (buffer) of about 500 km. The robustness of the chosen deformation radius is investigated both qualitatively and quantitatively. We found that a change in the radius of 100 km, for example, leads to an increase or decrease of around 10 % in the total amount of lightning strikes associated with a PV cut-off during our study period (see Sect. S2). Such small changes do not affect the qualitative interpretation of our results.
2.6 Persistence analysis
Days with constant atmospheric conditions tend to form temporal clusters of certain weather phenomena (here thunderstorms) lasting several days (events). This behaviour can be described statistically by the concept of persistence. The event length or duration n is determined by the number of days on which a certain criterion is fulfilled (e.g. thunderstorm day or certain atmospheric conditions). Each day is assigned either the value 1 (event day, i.e. criterion fulfilled) or 0 (non-event day, i.e. criterion not fulfilled). Within a 7 d sequence, we allow 1 non-event day (skip day, not counted in the total length n) without breaking the event. This means that an event lasting up to 7, 14, or 21 d may contain at most 1, 2, or 3 skip days, respectively. For more information on the concept, see PIP16.
In the study, we investigate the co-occurrence of low stability (using SLI) and low mid-tropospheric wind speeds (using V500). For this purpose, the same thresholds as in PIP16 are chosen, which were used to investigate the exceptional atmospheric conditions of a similar thunderstorm episode. We employ their “basic criterion”, which is fulfilled if the following conditions apply: SLI <0 K and V500<10 m s−1 (THBC). In addition, we also discuss our results in the context of the “strict criterion” of PIP16, which is fulfilled with SLI K and v500 hPa<8 m s−1 (THSC).
The period from the first of May to mid-June 2018 was characterized by a large number of thunderstorms that spread across the study area, several of which were associated with heavy rainfall, hail, and strong wind gusts (see ESWD reports in Fig. 2a). Lightning strikes were recorded on each day, and the affected area ranges between 100 km2 on 19 June and 1 140 000 km2 on 27 May (accumulations of the 10 × 10 km2 grid cell).
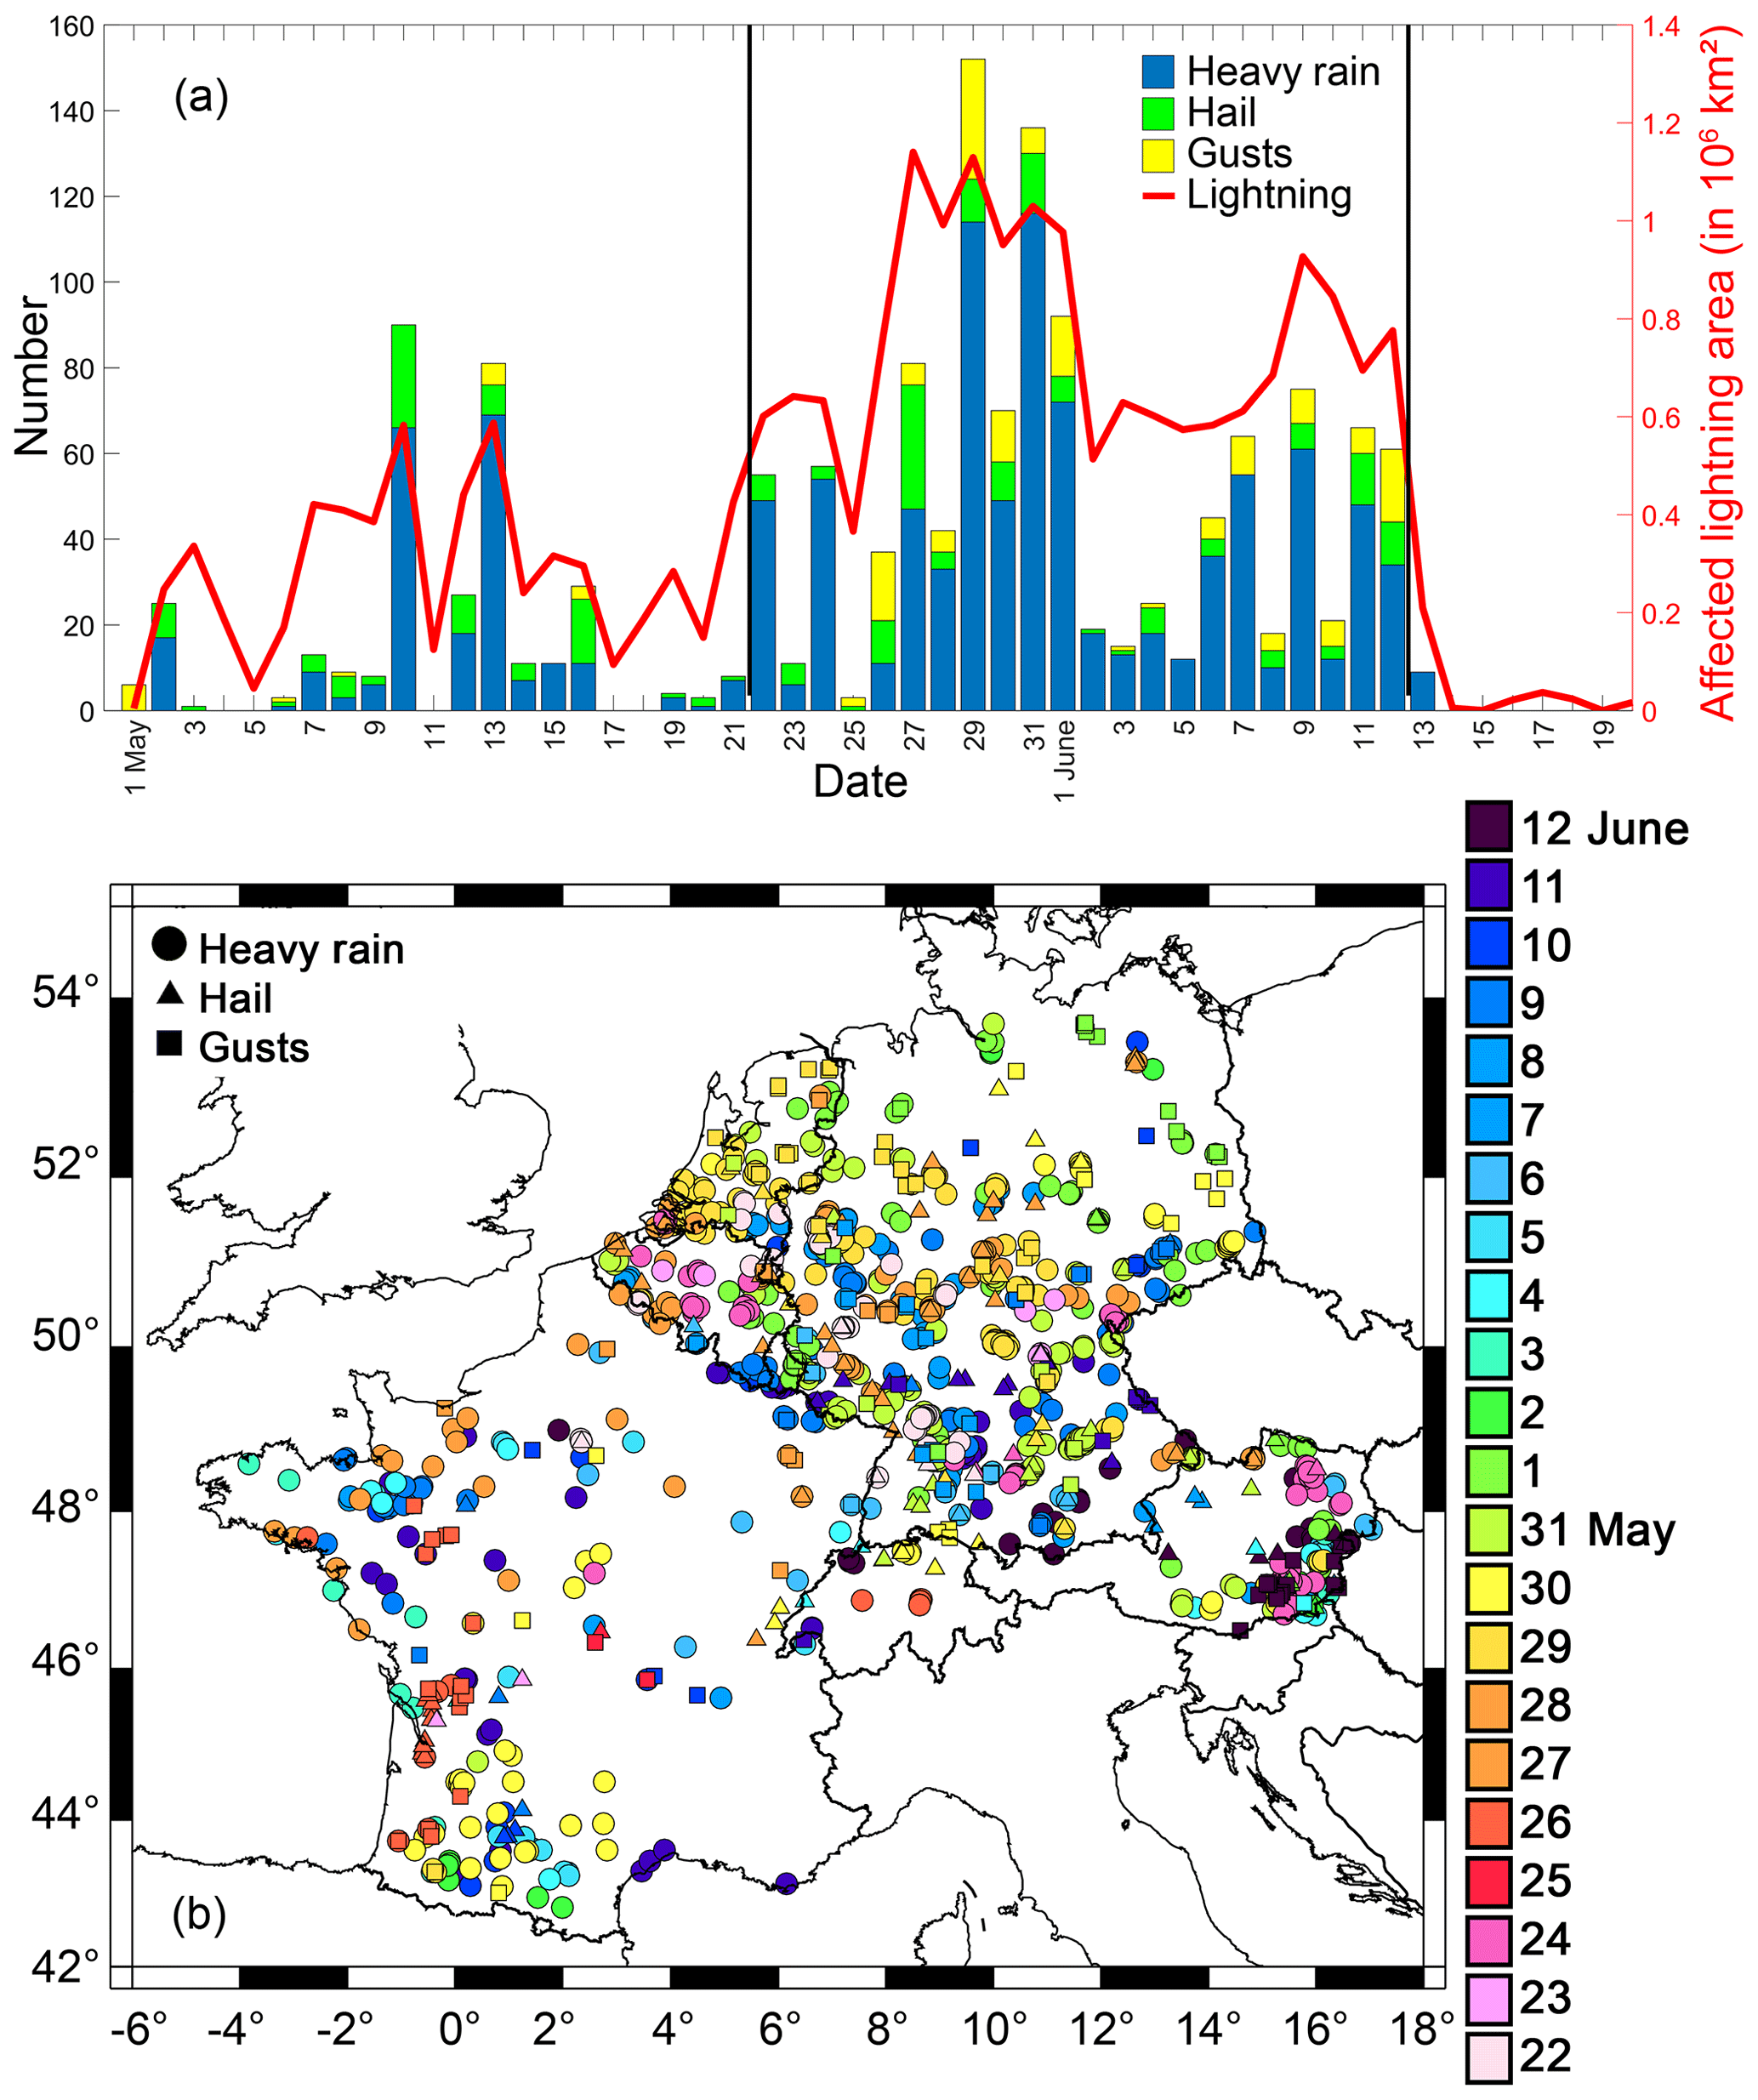
Figure 2(a) Time series of all recorded ESWD reports (heavy rain in blue, hail in green, convective gusts in yellow) in the study domain during the extended study period (i.e. 1 May to 20 June), including the daily total area affected by lightning (in km2, red). Vertical black lines indicate the study period (22 May to 12 June 2018). (b) Related regional distribution of the different phenomena (heavy rain •, hail ▴, convective gusts ▪) during the study period.
The 3-week period from 22 May until 12 June was the most active thunderstorm episode in May–June 2018 with a total of 868 heavy rain, 144 hail, and 145 convective wind gust reports based on the ESWD. The highest number (152 reports) was issued on 29 May, followed by 31 May (137 reports); most of the reports described heavy rainfall, and some of these heavy rainfall events led to several flash floods and landslides, which destroyed buildings, vehicles, streets, and even railway tracks (DWD, 2018a; WetterOnline, 2018b). On average, an area of 758 000 km2 – twice the size of Germany – was affected by lightning per day, with the result that thunderstorms covered the entire study area. As shown in Fig. 2b, most of the severe weather reports during the episode came from the western part of France, the Benelux, central and southern Germany, and the easternmost part of Austria. While the spatial distribution of the ESWD reports shows several regional gaps due to an under-representation of eyewitness reports, for example, in central and southeastern France (cf. Groenemeijer et al., 2017; Kunz et al., 2020), thunderstorm days are observed throughout the study area (see Fig. S4). The extraordinarily large number of thunderstorms, several of them severe, and the unusual persistence of that situation over 3 weeks motivated us to select that time frame as the study period.
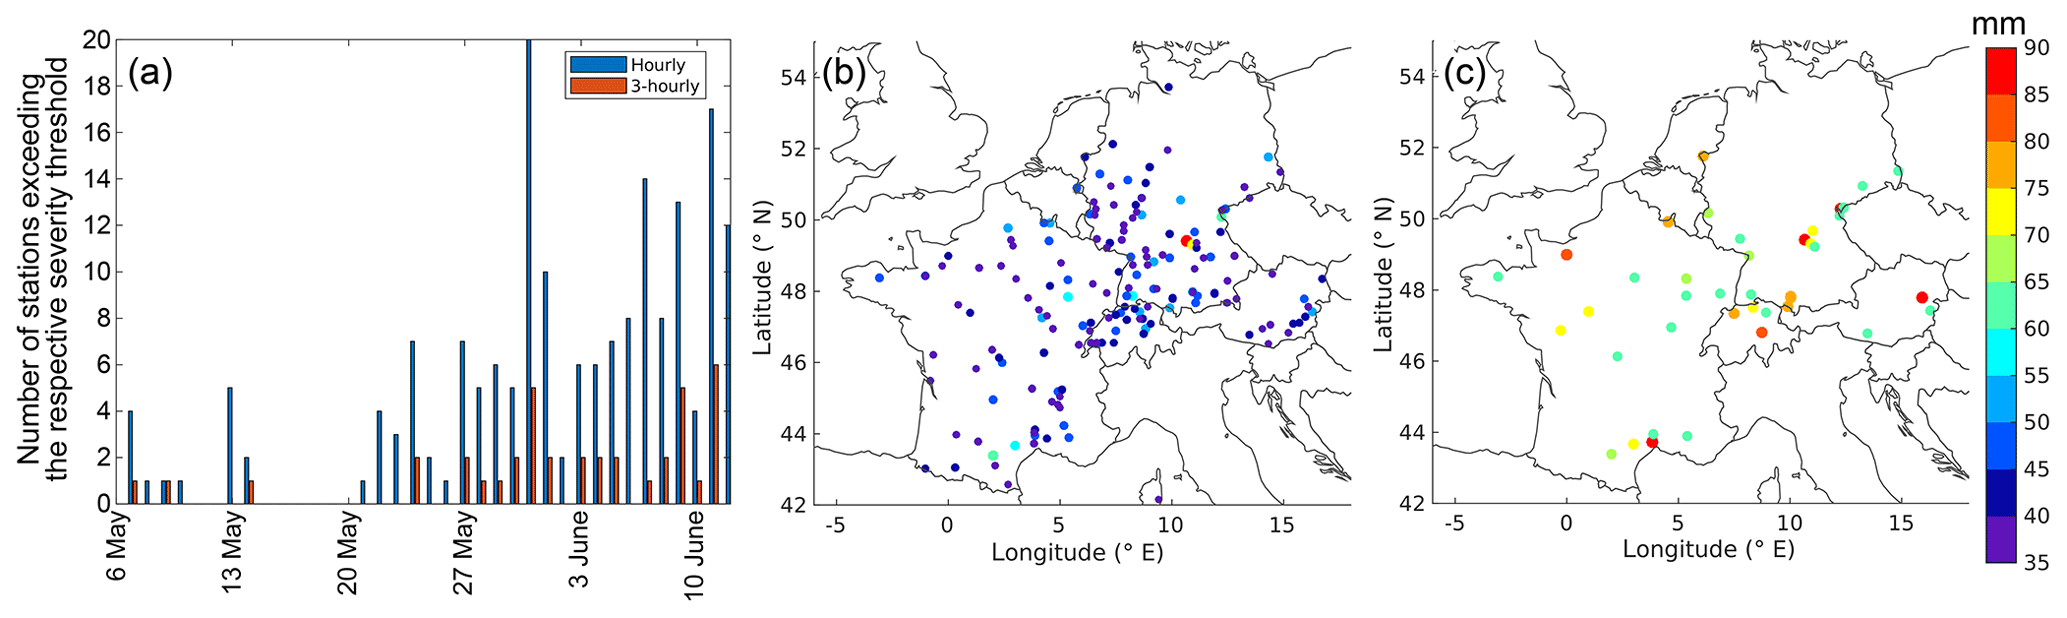
Figure 3(a) Time series of the number of stations exceeding precipitation thresholds of >35 mm over 1 h (blue) and >60 mm over 3 h (red), including the location and the maximum of (b) 1 h and (c) 3 h accumulation of the respective station during the study period (22 May to 12 June).
Figure 3 summarizes the evolution of 1 and 3 h rain gauge measurements in the study area exceeding the ESWD heavy rain criteria of 35 and 60 mm, respectively. The 1 h criterion was fulfilled during the study period 167 times (Fig. 3a) and an average of about 7.6 stations per day with a variability between 1 and 20 stations. The highest number of stations belongs to the day with the second most ESWD severe weather reports (31 May). The 3 h criterion was reached 38 times, with a maximum of at least 5 stations on 3 d. The locations of the respective stations show heavy rain events in all of the countries under consideration without any clustering (Fig. 3b, c).
During the episode, the thunderstorms developed mainly as isolated cells and clusters of several cells, the latter preferably in the early evening and at night. Larger mesoscale convective systems (MCSs) formed only on a few days (e.g. on 22 May or 1 June), which persisted during the night and early morning. Animated images of radar reflectivity can be found in the Video Supplement for two representative days: 27 and 31 May. The two animations show a large number of both isolated thunderstorms with a short lifetime of approximately 30 min (radar visibility, i.e. period of precipitation) and cell clusters persisting over several hours. Most cells moved very slowly or even remained stationary on the 2 d.
Table 1List of 1, 3, and 24 h rainfall totals records (in UTC) within the study domain during the study period (AT is Austria, FR is France, GE is Germany). Note that 24 h value means precipitation between 00:00 and 00:00 UTC the next day. Note that some stations only provide reports for the full 24 h (e.g. Bruchweiler, Mauth-Finsterau). Further analyses regarding rain duration (RD), track length (in km), and propagation speed (in m s−1) are limited to Germany due to data availability. RD3 means a rain duration with a rain rate >3 mm h−1, RD35 is >35 mm h−1, and RD60 is >60 mm h−1. Note two tracks for the German events could not be identified by TRACE3D due to the overlapping of several cells, which were relatively quasi-stationary.
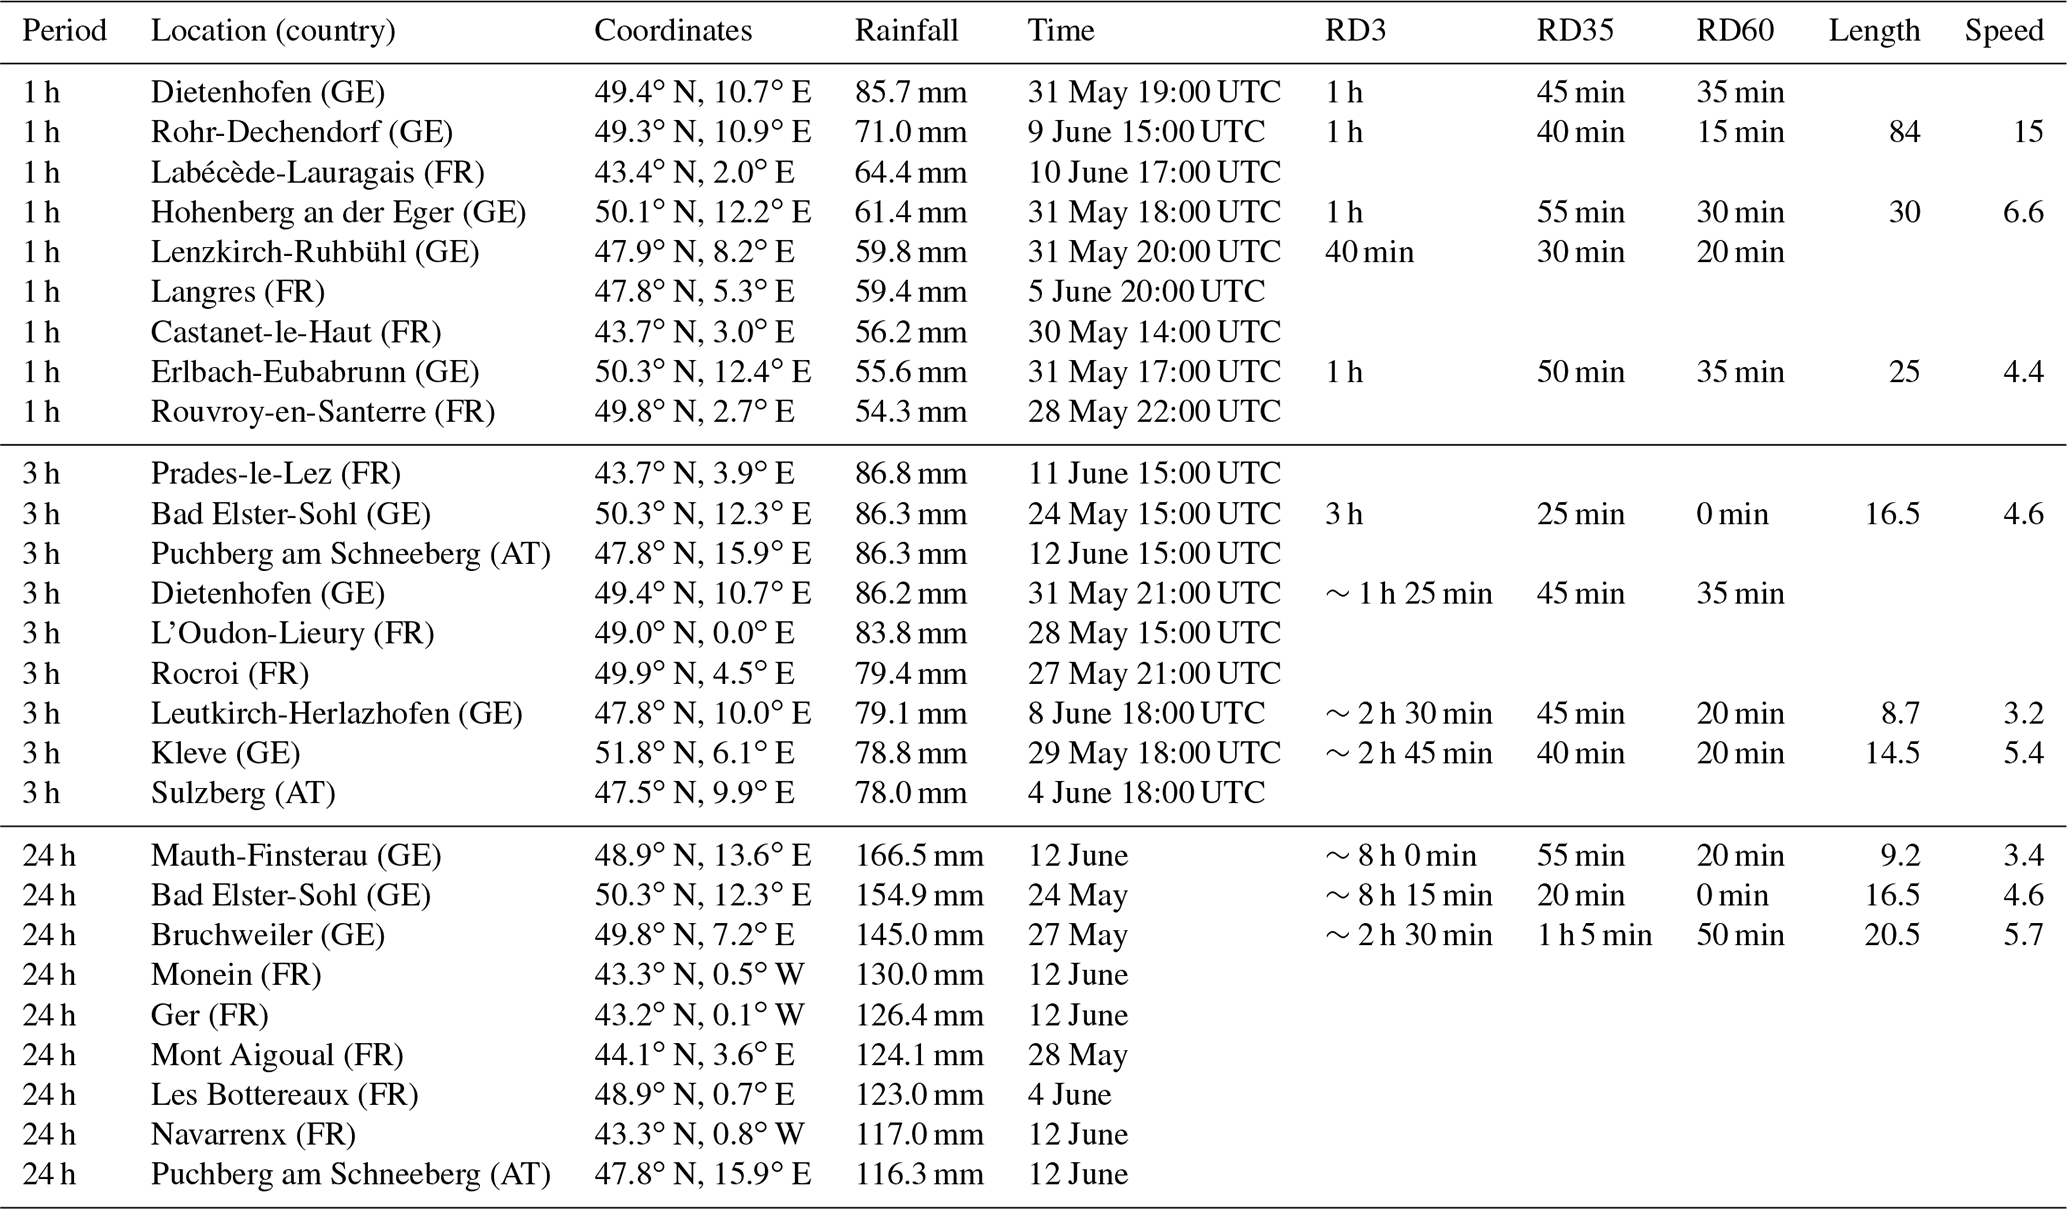
The slow movement of the convective cells, a prominent feature of the entire thunderstorm episode, was mainly due to the low wind speed at mid-tropospheric levels (cf. Sect. 3.1.2). According to the cell tracking (Germany only; see Sect. 2.1.4), about half of all cells reaching a radar reflectivity of at least 55 dBZ had a propagation speed of less than 5 m s−1 (47.3 % from 480 cells); only a few cells (1.5 %) had a speed above 15 m s−1 (Fig. 4). Mean, standard deviation, and median values are 5.9, ±2.9, and 5.2 m s−1, respectively, which each corresponds to about half of the long-term statistics (see Sect. 4.1; see also the propagation speed of some record-breaking 1 and 3 h rainfall totals in Table 1). The predominant propagation direction was from the southeast to the northwest (26.3 % of the detected cells). However, several cells moved in completely different directions on the same day – a clear sign that the propagation was not only determined by the (weak) mid-tropospheric wind but also by internal dynamic effects induced by cold pools or by pressure disturbances (Markowski and Richardson, 2010; Houston and Wilhelmson, 2012). Examples of different track directions of neighbouring cells can be seen in the radar animation on 27 May (14:00 to 15:00 UTC, at the coordinates: x∼250 km and y∼600 km) or on 31 May (21:00 to 22:00 UTC; x∼400 km and y∼700 km).
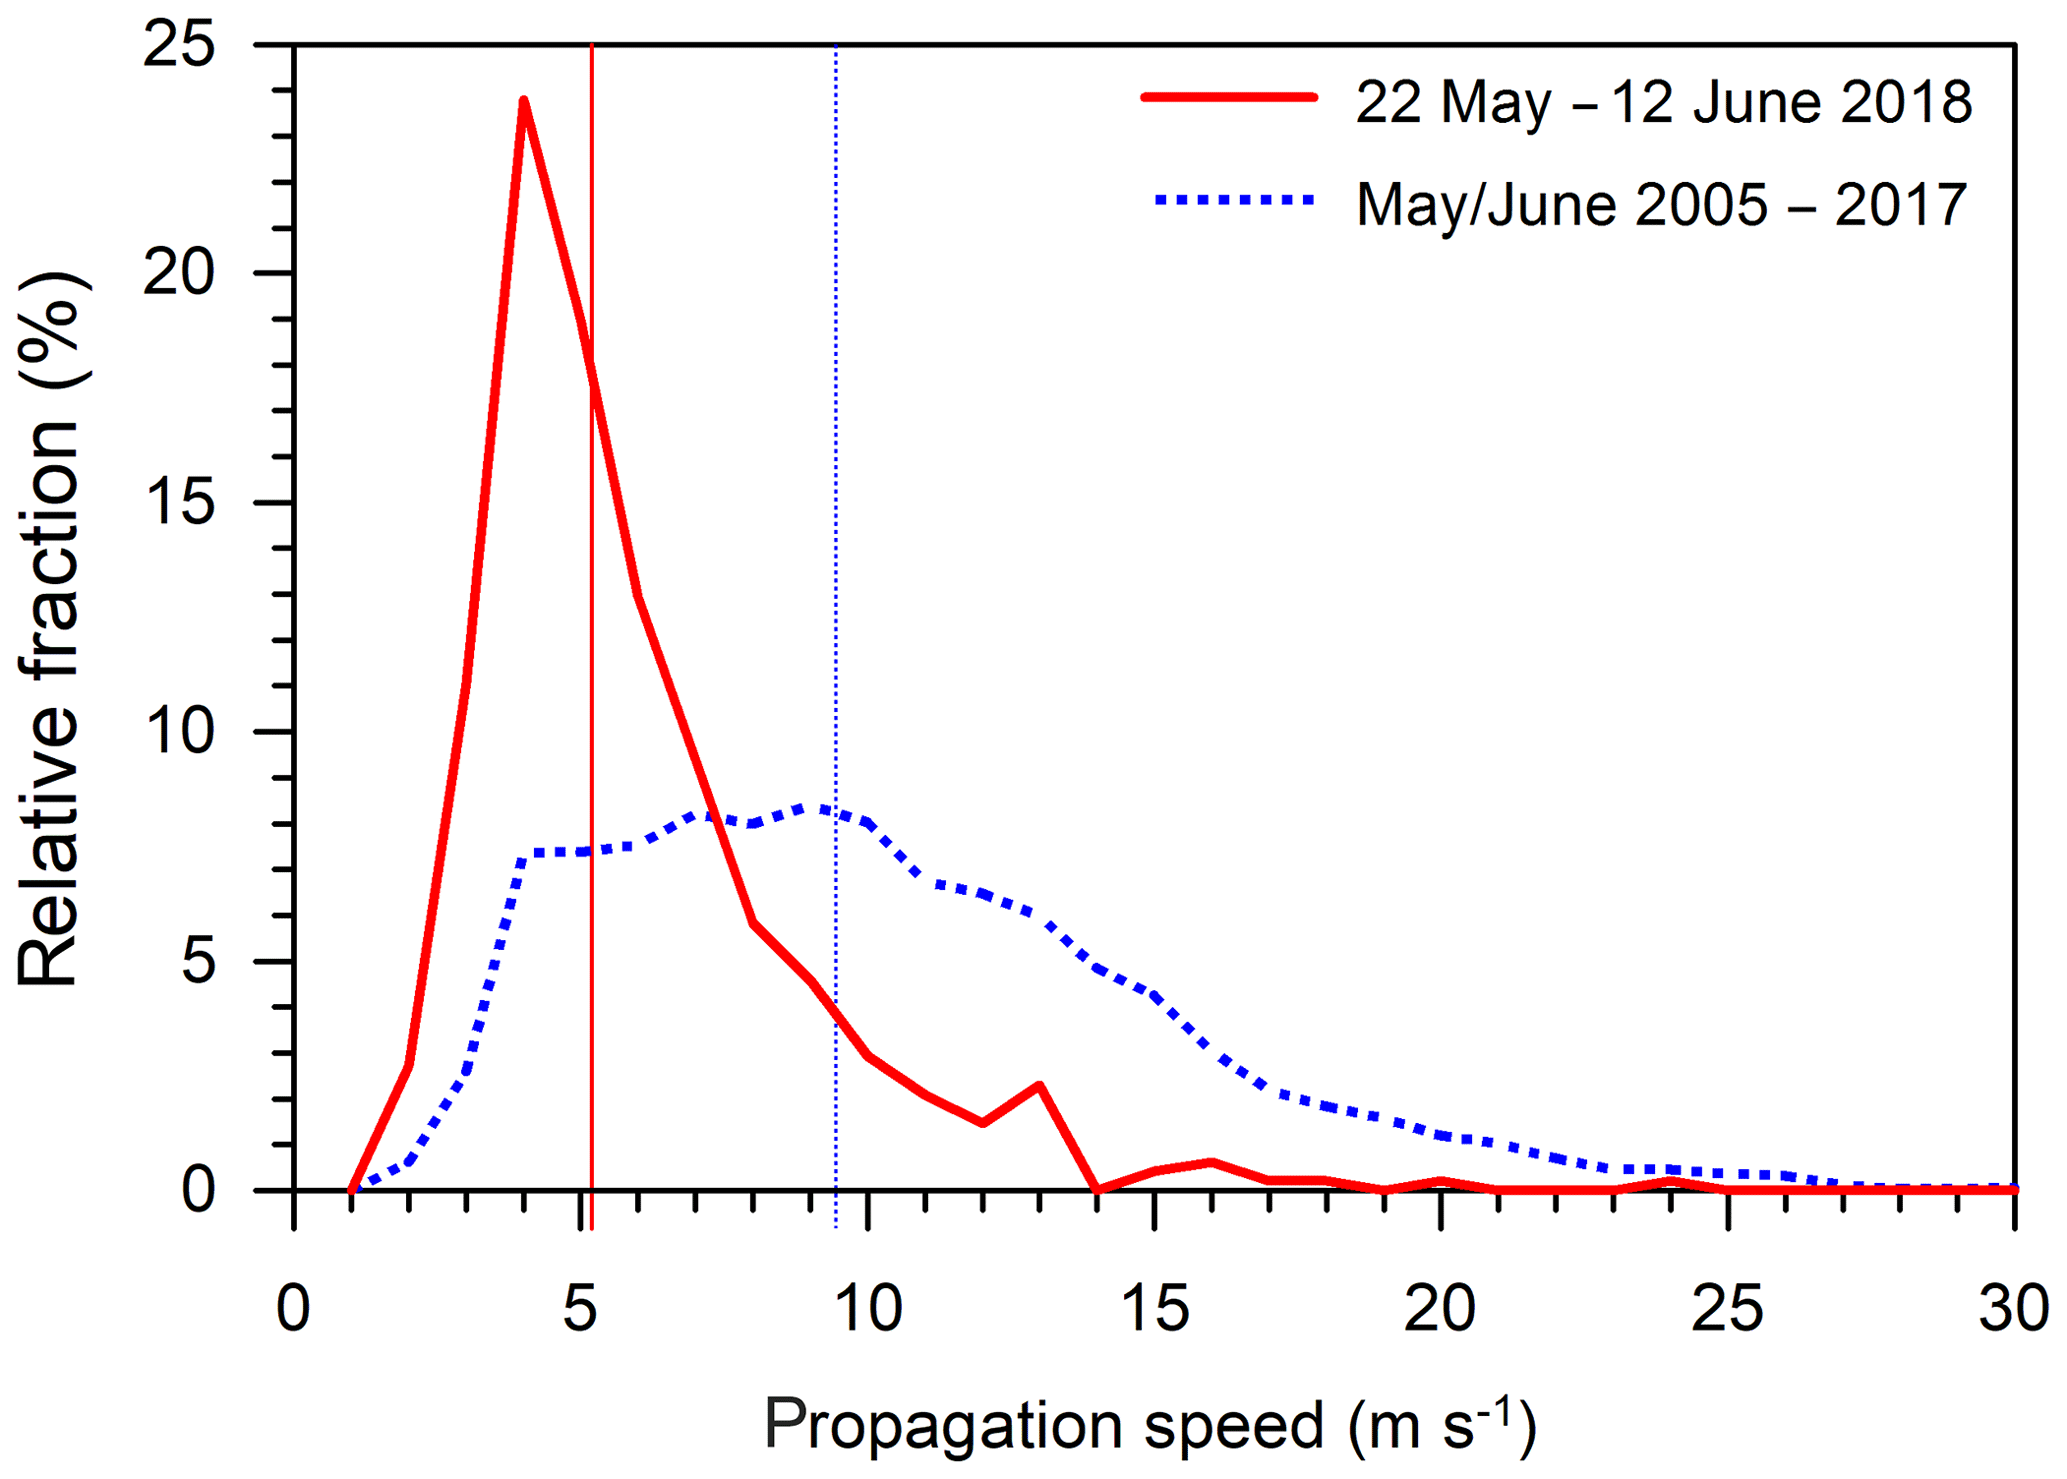
Figure 4Histogram of the propagation speed of convective cells (increments of 1 m s−1) detected by TRACE3D in Germany during the study period (red) and for all convective cells between 2005 and 2017 (May–June; blue); vertical lines indicate the median of the two samples.
A detailed look at the chronological sequence during the episode (Fig. 2b) shows that thunderstorms associated with heavy rainfall and small hail with diameters of around 2 cm were restricted to the Benelux and western Germany on 22 May. Some entries report flash floods and mudslides, for example in the Heilbronn area (southwestern Germany). On 24 May, the federal state of Saxony (eastern Germany), the east of Austria, and parts of Belgium were hit by torrential rain accumulations. The German station at Bad Elster-Sohl in Saxony (see Fig. 1), on the border with the Czech Republic, for example, measured a record of 86.3 mm (3 h)−1 and 154.9 mm (24 h)−1. On 26 May, several wind reports with gust speeds of up to 29 m s−1 (Poitiers, France; see Fig. 1) and hail reports indicating hailstones with a diameter of up to 5 cm were recorded in the French coastal region near the Bay of Biscay.
The subsequent time frame from 27 May to 1 June was the most active both in terms of the area affected by lightning and the number of ESWD reports (Fig. 2a). Widespread thunderstorms were observed mainly in Benelux, Germany, and France but also sporadically in Switzerland and Austria, many of them associated with large rain accumulations and subsequent flooding, hail between 2 and 4 cm in diameter, and damaging wind reports. Many of record-breaking 1 and 3 h rainfall totals occurred within this period (Table 1). For example, the weather station Bruchweiler (see Fig. 1), located in western Germany, measured a 24 h rain accumulation of 145.0 mm on 27 May (Note that the station only provides reports for the full 24 h). However, the rain fell in a period of 3 h, with 60 mm falling in just 50 min (see also Fig. S5a). The corresponding track, derived from TRACE3D, has a short length of 21 km and a low propagation speed of 5.7 m s−1 (Table 1). A second example is on 31 May; the exceptionally high 1 h rain accumulation of 85.7 mm measured at Dietenhofen close to Nuremberg in southern Germany (see also Fig. 3b), listed high in the ranking of highest 3 h rainfall totals as well. The station was fully hit by an isolated system, which was relatively stationary. The rain rate above 60 mm was present over 35 min (see also Fig. S5b and Video Supplement).
In the first half of June, some hail stones and heavy rainfall were still reported almost daily somewhere in the study domain, though less frequently than before. Towards the end of the study period, convective activity increased again. The proportion of gust reports (indicating wind speeds between 25 and 31 m s−1) to all reports was very large, especially on the last day of the study period, 12 June. Thereafter, when environmental conditions became more stable (see Sect. 3.1), thunderstorms rarely occurred. The area affected by lightning decreased considerably and no further severe weather reports were archived in the ESWD.
As we will show later (Sect. 3.1.2), very low wind shear values prevailed across the study area. In a few cases, deep-layer shear magnitudes were sufficient (BWS up to 20 m s−1) for the development of severe storms, with large hail up to 5 cm in diameter recorded in southwestern France on 26 and 9 June and in southern Germany on 11 June. However, these were exceptional cases.
3.1 Synoptic overview
The synoptic situation prior to the thunderstorm episode in 2018 was embedded in a longer lasting unusual large-scale flow situation. At the beginning of the extended study period, a large-scale mid-tropospheric area of high geopotential stretched out from the Azores over central Europe and the Baltic to western Russia (Fig. 5a), attended by a corresponding prolonged lower-level high-pressure system (not shown). This configuration was associated with the advection of warm and relatively dry air masses over large parts of Europe. In the second week of May, the pattern transitioned into a blocked situation over Europe (see Sect. 3.1.1). The geopotential height at 500 hPa depicts the typical omega-like structure with high geopotential over central Scandinavia, flanked by one pronounced trough upstream over the North Atlantic and one downstream over western Russia (Fig. 5b). Subsequently, the two troughs turned into enclosed cut-off lows filled with relatively cold air and finally merged into one system located over central Europe on 15 May (not shown). In the third week of May, the cut-off moved slowly northeastward on an erratic track while gradually dissipating over central and eastern Europe, leaving a moderately warm and dry air mass with weak gradients over central Europe (Fig. 5c).
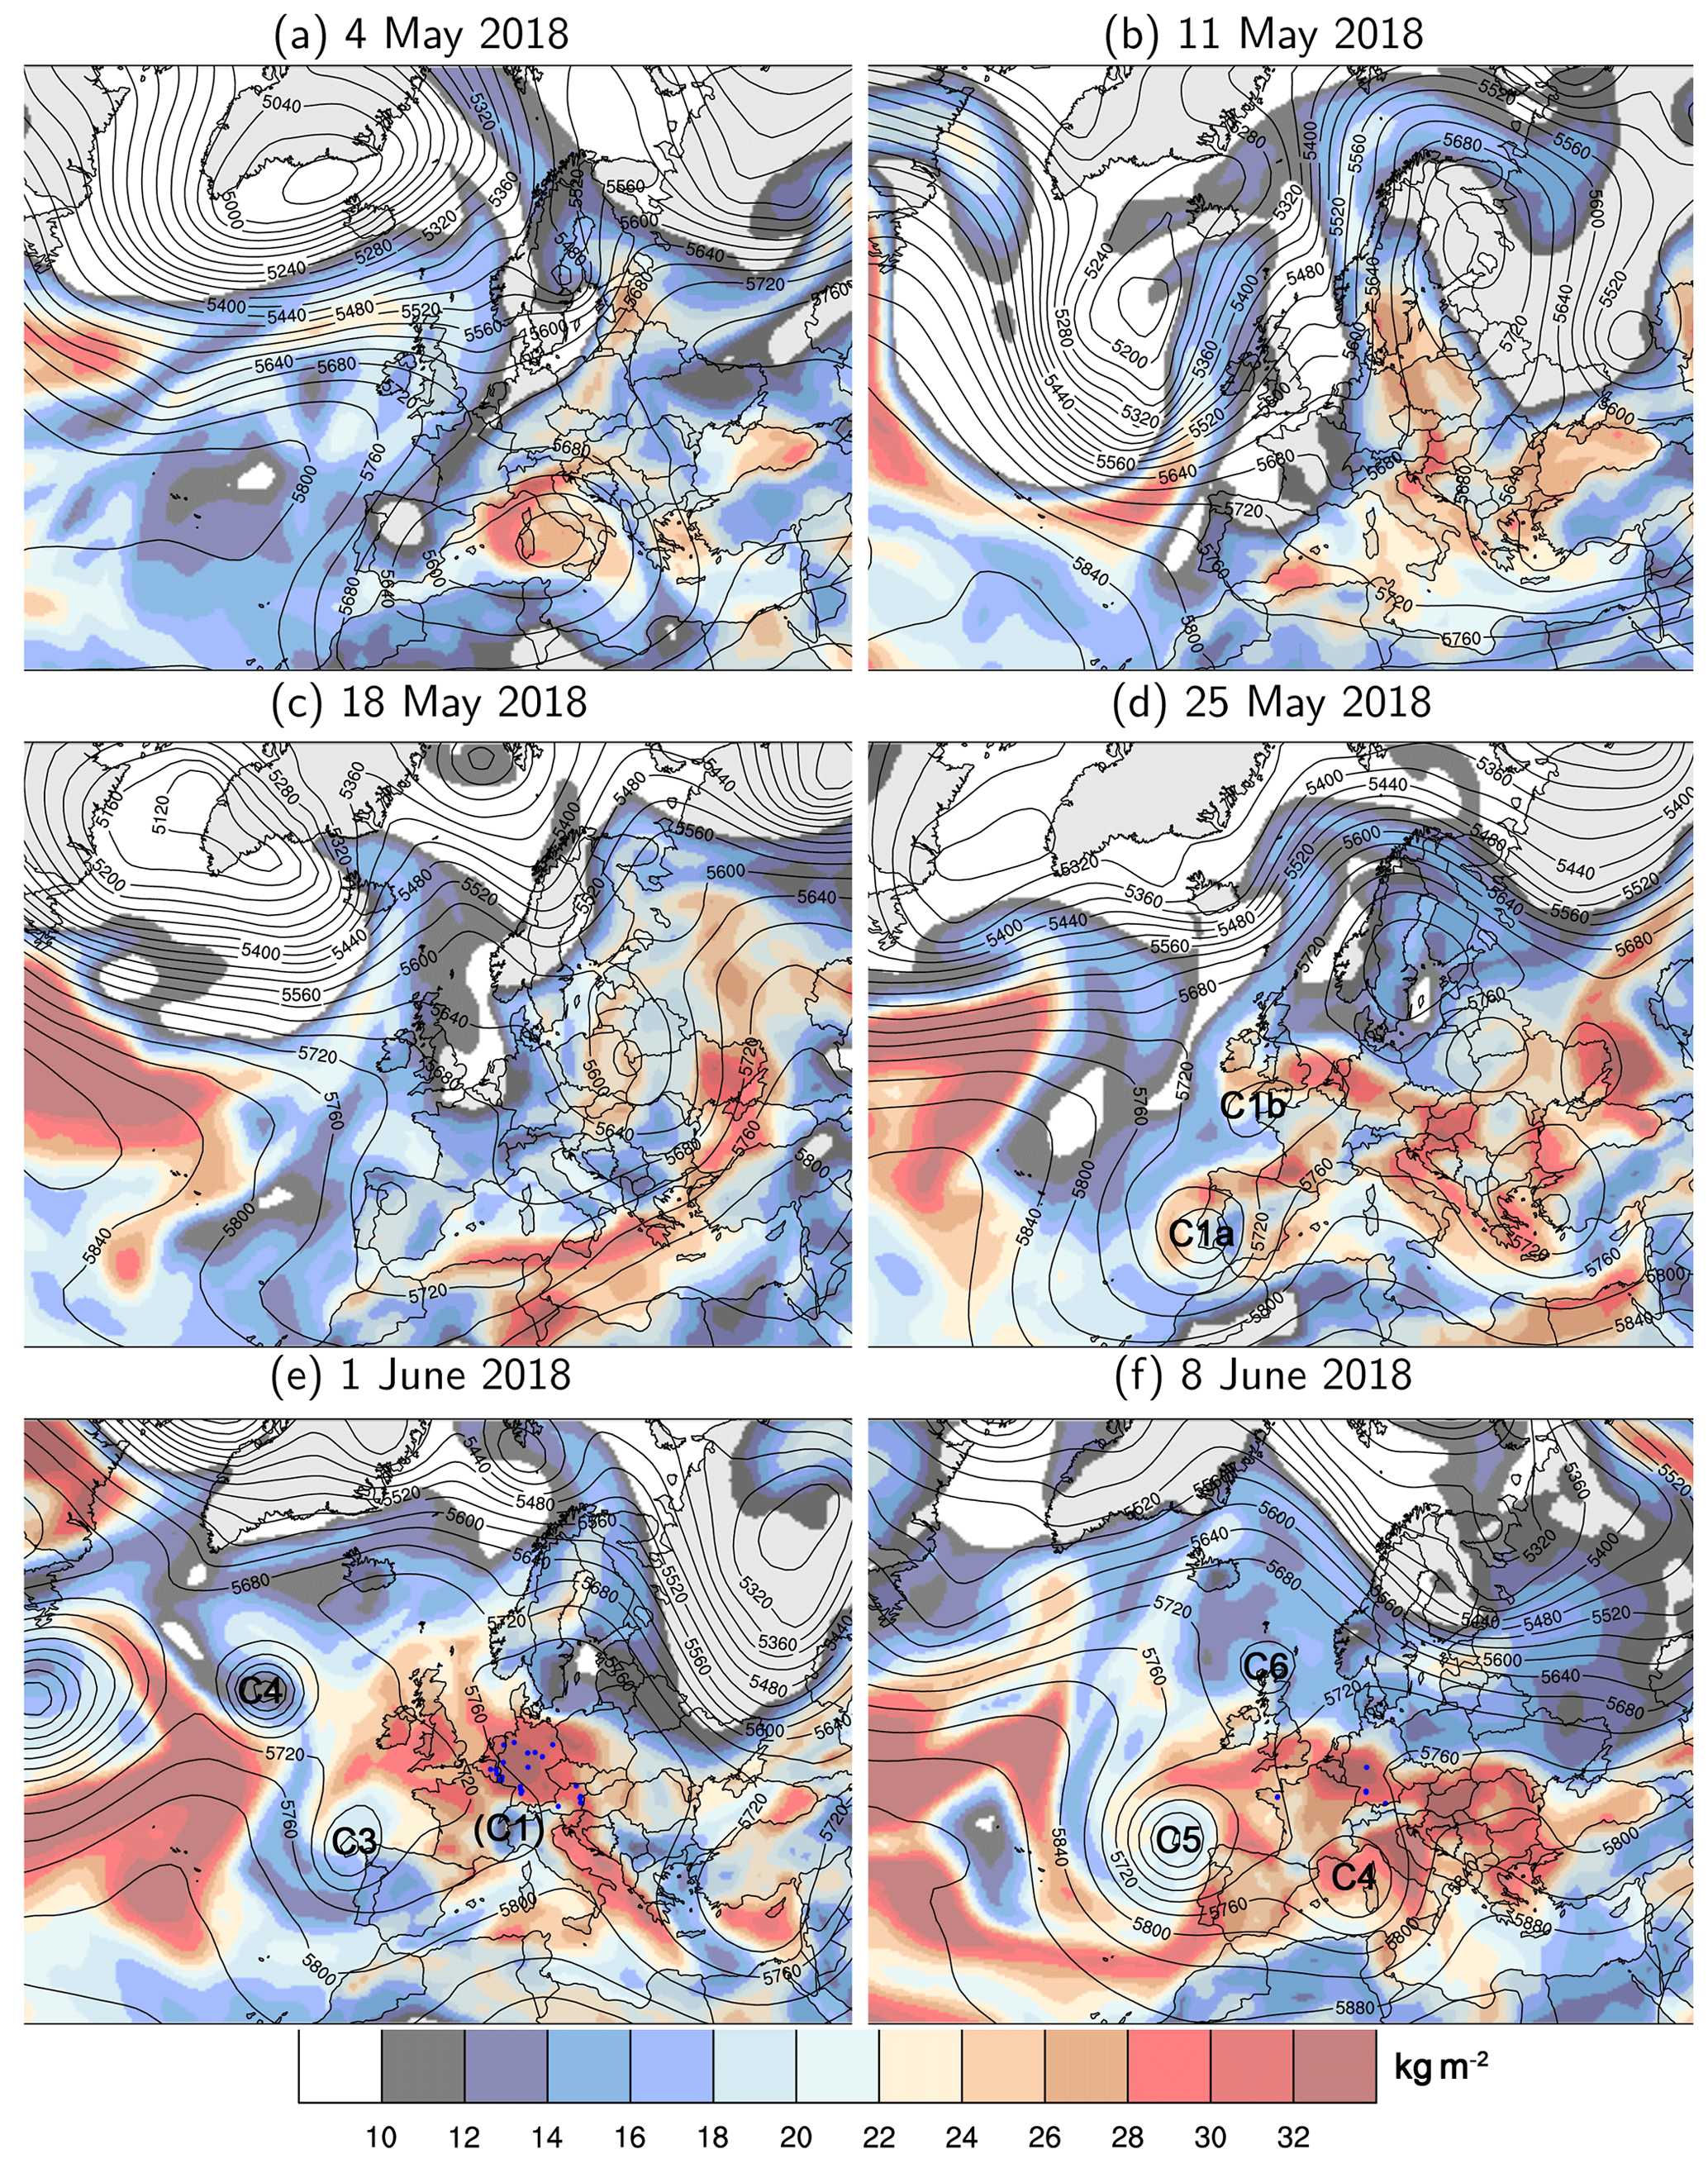
Figure 5The 500 hPa geopotential height (contours every 40 gpm) and vertically integrated water vapour (IWV, shaded in kg m−2) for selected days at 00:00 UTC during the extended study period: (a) 4 May, (b) 11 May, (c) 18 May, (d) 25 May, (e) 1 June, and (f) 8 June (ERA-Interim). Several cut-off lows during the study period mentioned in the text are indicated with numbers (C1–C6). Small blue dots in panels (e) and (f) mark the ESWD reports of heavy rain from Fig. 2. Note that there are no ESWD reports for panels (a)–(d).
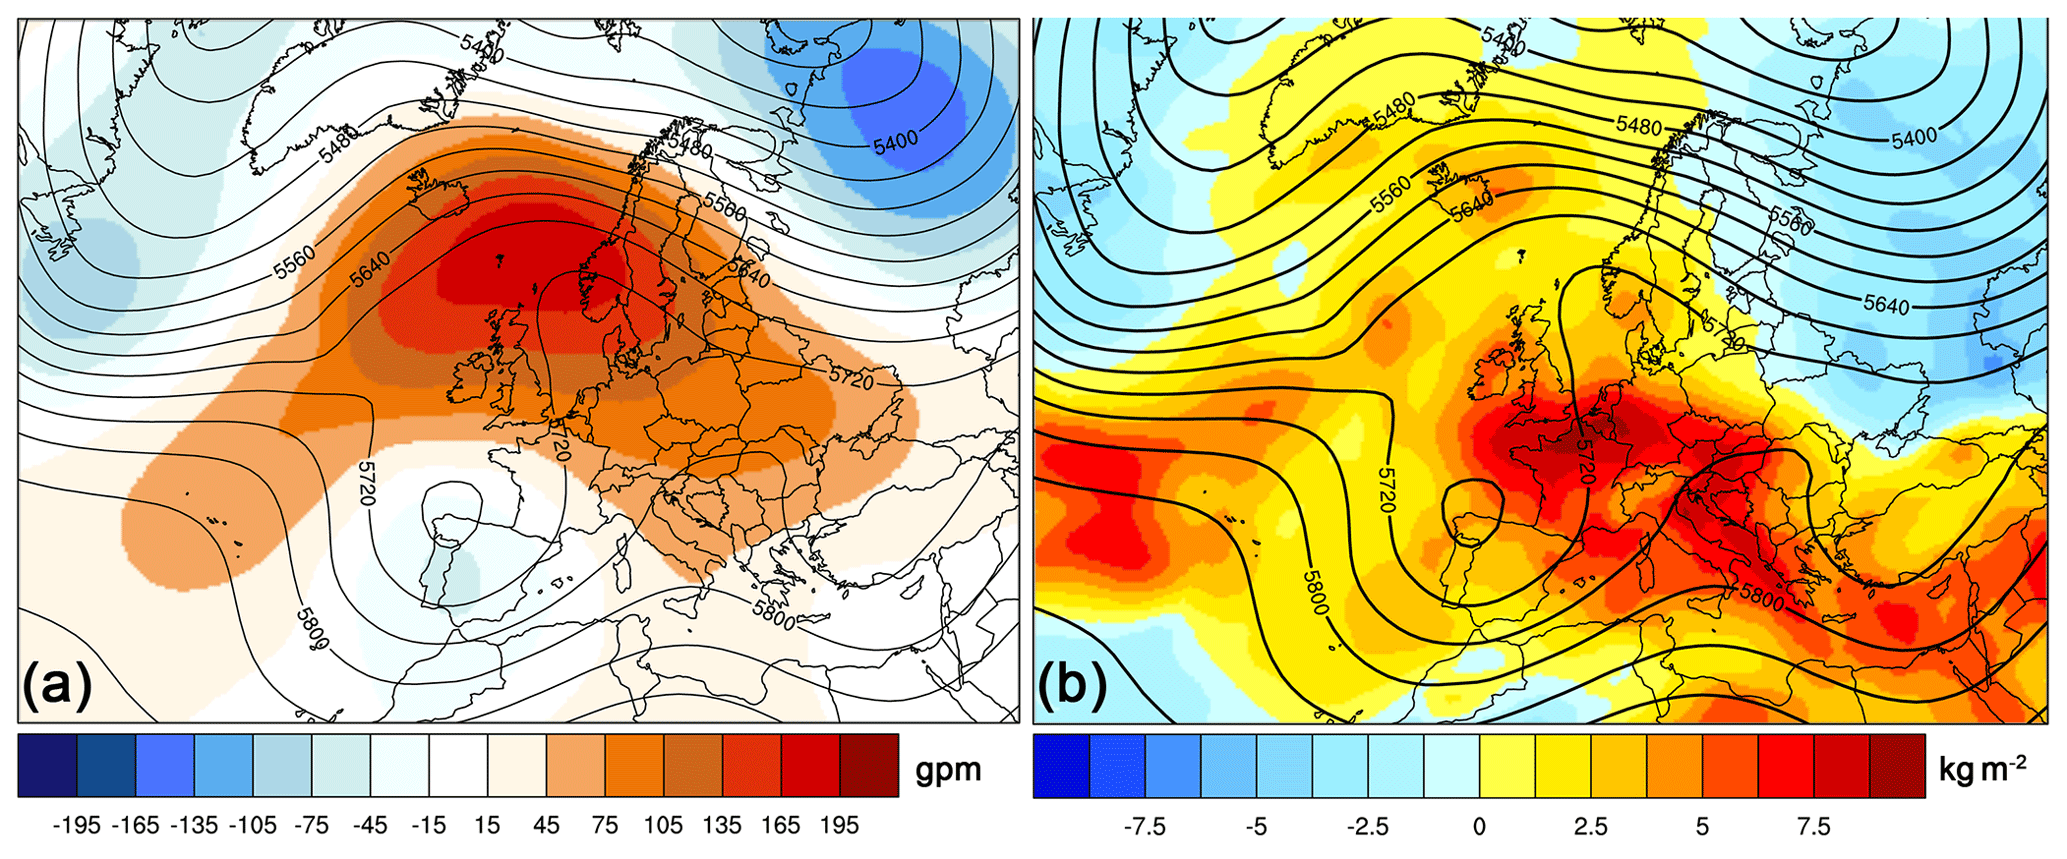
Figure 6Mean anomalies during May–June 2018 of (a) 500 hPa geopotential height anomaly (shaded in gpm) and (b) integrated water vapour anomaly (IWV; shaded in kg m−2), together with the mean 500 hPa geopotential height (contours every 40 gpm). Anomalies are computed with respect to the climatology (1981–2001; based on ERA-Interim).
The study period from 22 May to 12 June was characterized by a rather stationary and persistent synoptic situation with a pronounced blocking ridge stretching from Iceland over the North Sea to Scandinavia and northeastern Europe (Fig. 6a). As a consequence of the synoptic setting during this episode, the mid-tropospheric flow was weak over most parts of Europe (see Sect. 3.1.2). On average, the ridge was flanked by long-wave troughs: one on the western side with the axis pointing from Baffin Bay to Newfoundland, the other on the eastern side stretching from the Barents Sea to Kazakhstan, while the ridge remained relatively stationary centred over the North Sea region (Fig. 5c–f).
A noticeable feature in the mean 500 hPa geopotential height for this episode is a locally enclosed geopotential minimum over the Bay of Biscay and its surroundings (Fig. 6a) that emerges from repeating and transient cut-off lows forming on the upstream side of the blocking ridge. On 25 May (Fig. 5d), a cut-off low (C1a) approached Iberia – which merged over the next few days with the cut-off located over the Celtic Sea (C1b) – and contributed to convective initiation for several storms, first in France and then in the Benelux and Germany (see Fig. 2 and Sect. 3.3). In the following days, a new cut-off (C2; not shown) formed west of Spain, which subsequently influenced the weather there and disappeared relatively quickly. On 1 June, another cut-off (C3) advanced from the Atlantic (Fig. 5e), which, together with C1, contributed to convective activity over France and central Europe (see also the ESWD reports on heavy rain, shown as blue dots in Fig. 5e, f). Then, C3 developed into a shallow low-pressure zone in central Europe, where several convergence lines formed. In addition, this situation provided very moist air (IWV well above 30 kg m−2 over large areas) until 9 June in eastern France and central Europe (Fig. 5e, f). In the end phase of the study period, the next cut-off low (C5) with its associated fronts and convergence lines affected the western half of France and central and southern Germany and lasted until 12 June (Fig. 5f). Simultaneously, a cut-off (C6) over the British Isles influenced the weather in northern Europe.
The geopotential anomalies at the 500 hPa level, calculated as the deviation from the climatological mean (1981–2010), exhibit significant positive values of up to 200 gpm west of Norway for the study period (Fig. 6a). In contrast, the area over southwestern Europe is reflected by negative geopotential anomalies of more than 50 gpm. Qualitatively similar anomaly patterns are seen in the sea-level pressure distribution (not shown). Simultaneously, the IWV (Fig. 6b) showed distinct positive anomalies of up to 9 kg m−2 with a 22 d average of 24 to 28 kg m−2. This finding is in line with the sequential progression of several cut-off lows approaching southwestern Europe and leading to repeating the advection of warm and moist air masses towards central and western Europe during the study period.
3.1.1 North Atlantic–European weather regimes
In terms of the North Atlantic–European weather regimes, the large-scale flow situation in May was dominated by simultaneously active life cycles of a zonal regime (ZO; dark red in Fig. 7a) and European blocking regime (EuBL; green). Climatologically, the zonal regime is characterized by a negative 500 hPa geopotential height anomaly centred over southern Greenland and Iceland, accompanied by a weak positive anomaly over central Europe (see Fig. S1). The climatological European blocking regime is characterized by a strong positive geopotential height anomaly over the North Sea region, and a weak negative anomaly over Baffin Bay.
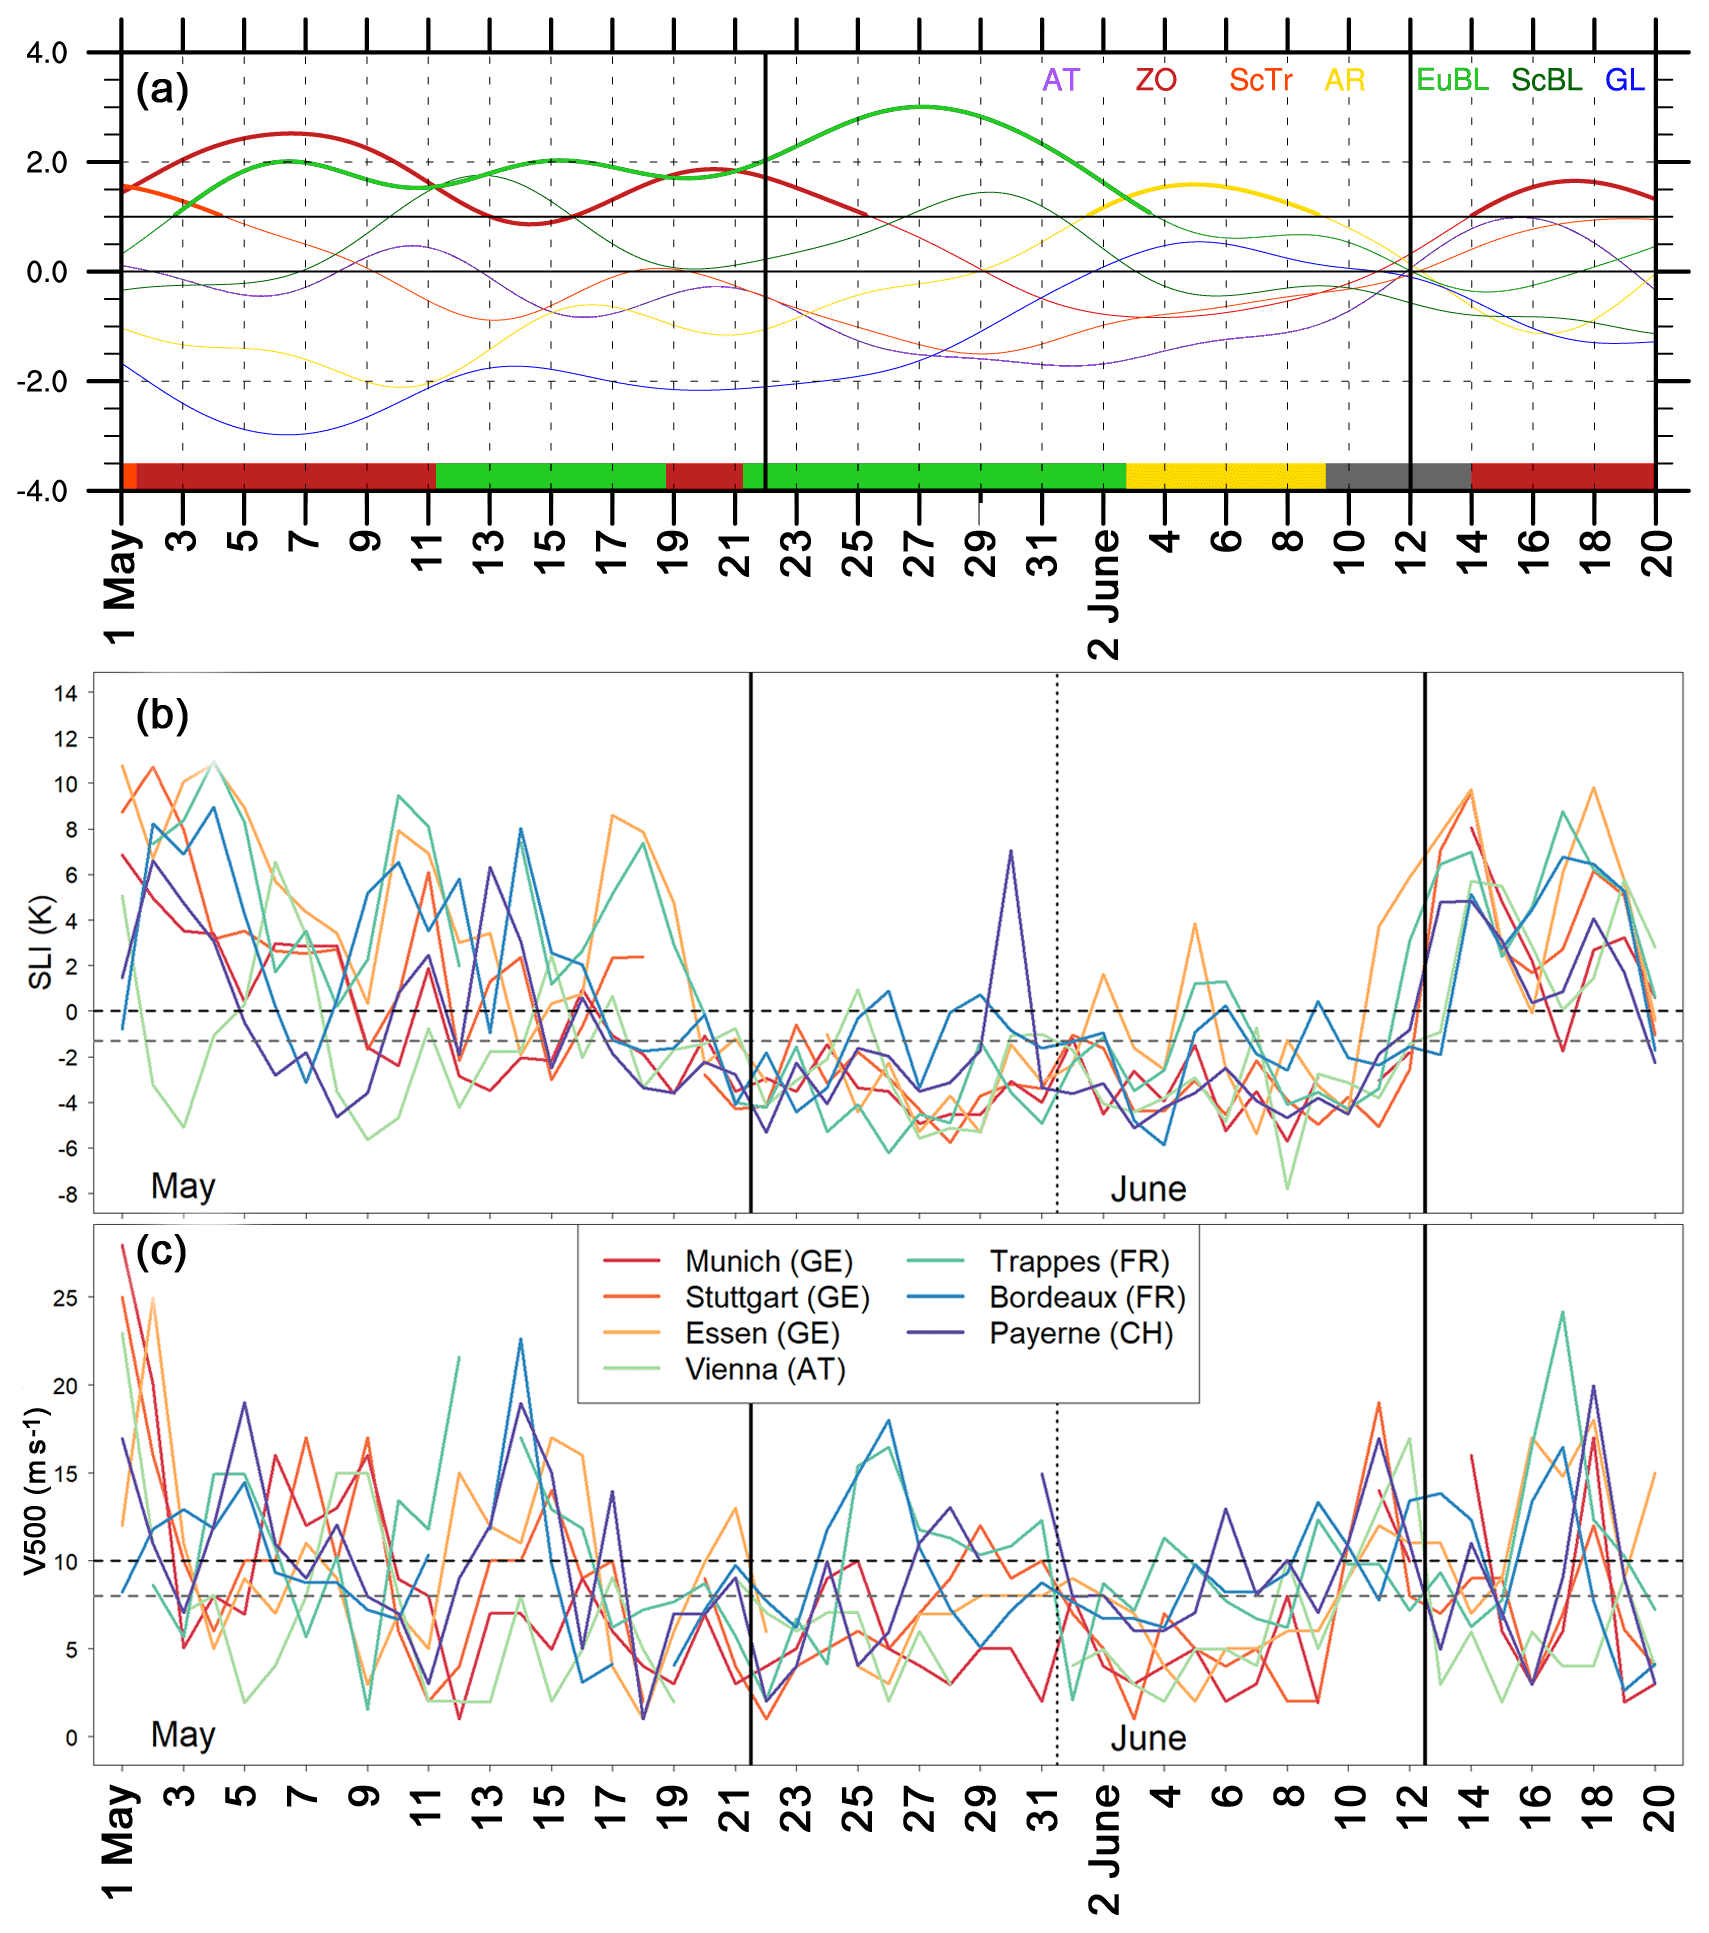
Figure 7Time series of three different parameters during the extended study period from 1 May to 20 June 2018: (a) Atlantic–European weather regime life cycles based on the normalized projection into all seven regimes (coloured curves, based on ECMWF analysis). Active regime life cycles with a projection >1.0 and persistence of at least 5 d are highlighted with bold curves (see Sect. 2.3), the dominant regime (maximum projection and active life cycle) is marked at the bottom. Relevant active regime life cycles are zonal regime (ZO, dark red), European blocking (EuBL, light green), Atlantic Ridge (AR, yellow), no regime (grey). (b) Surface-based lifted index (SLI in K) and (c) horizontal wind speed at 500 hPa (V500 in m s−1) for the 12:00 UTC sounding at seven European stations. Horizontal dashed black and grey lines indicate thresholds as defined in PIP16 (basic criterion: 0 K and 10 m s−1; strict criterion: −1.3 K and 8 m s−1; see Sect. 2.6). Vertical black lines indicate the study period.
The strong projection in both regimes in May suggests that both the cyclonic anomaly in the Icelandic region and the positive anticyclonic anomaly over Europe were pronounced but altered in their intensities – as discussed in the previous section. The alternating dominance of either regime in the first 3 weeks of May (Fig. 7a) reflects the change of zonal to meridional circulation and the persistent blocking situation during our study period. It is striking that enhanced convection and thunderstorm activity over Europe co-occurred with a weakening of the projection in the zonal regime (see information above). Specifically, the first period of widespread thunderstorms (9–16 May; see Fig. 2) coincides with a weakening of zonal conditions and a dominance of European blocking from 11 to 18 May. This is interrupted by more zonal conditions from 19 to 21 May, leading to a pronounced decrease in convective activity. The convectively most active period from 26 May to 1 June co-occurs with a very strong projection into European blocking and ends when the blocking decays. On 3 June, a transition into the Atlantic Ridge regime occurs, with blocking shifting into the northeastern Atlantic and western Europe, which coincides with the last episode of an increased number of convective events from 6 to 12 June.
3.1.2 Local-scale environmental conditions
During the entire May–June period, atmospheric stability was very low over large parts of the study domain, as indicated by sounding data (Fig. 7b). The SLI reached negative values almost every day at 12:00 UTC at one sounding station at least. During the first thunderstorm episode from 9 to 16 May with several heavy rain and hail events (see Fig. 2), several stations already show negative SLI values on some days. During the study period, all soundings (with a few exceptions) exhibit permanently negative SLI values; most of the time the values are far below the basic and strict criterion of PIP16 (see Sect. 2.6). For example, the median of the SLI during the study period was lower than −3.0 K for Stuttgart, Munich, Vienna, Trappes, and Payerne. Such low values represent very conducive conditions for thunderstorm formation (e.g. Haklander and van Delden, 2003; Manzato, 2003; Sánchez et al., 2009; Kunz, 2007; Mohr and Kunz, 2013). In the ECMWF analysis (Fig. 8a), the SLI average over the study period (12:00 UTC) was negative for most parts of the domain except for northern Germany, where thunderstorms occurred infrequently. Furthermore, over large parts of the study domain, the strict criterion was also reached. Due to the upcoming westerly flow at the end of the study period, instability decreased significantly and SLI returned to positive values less conducive for deep moist convection (Fig. 7b).
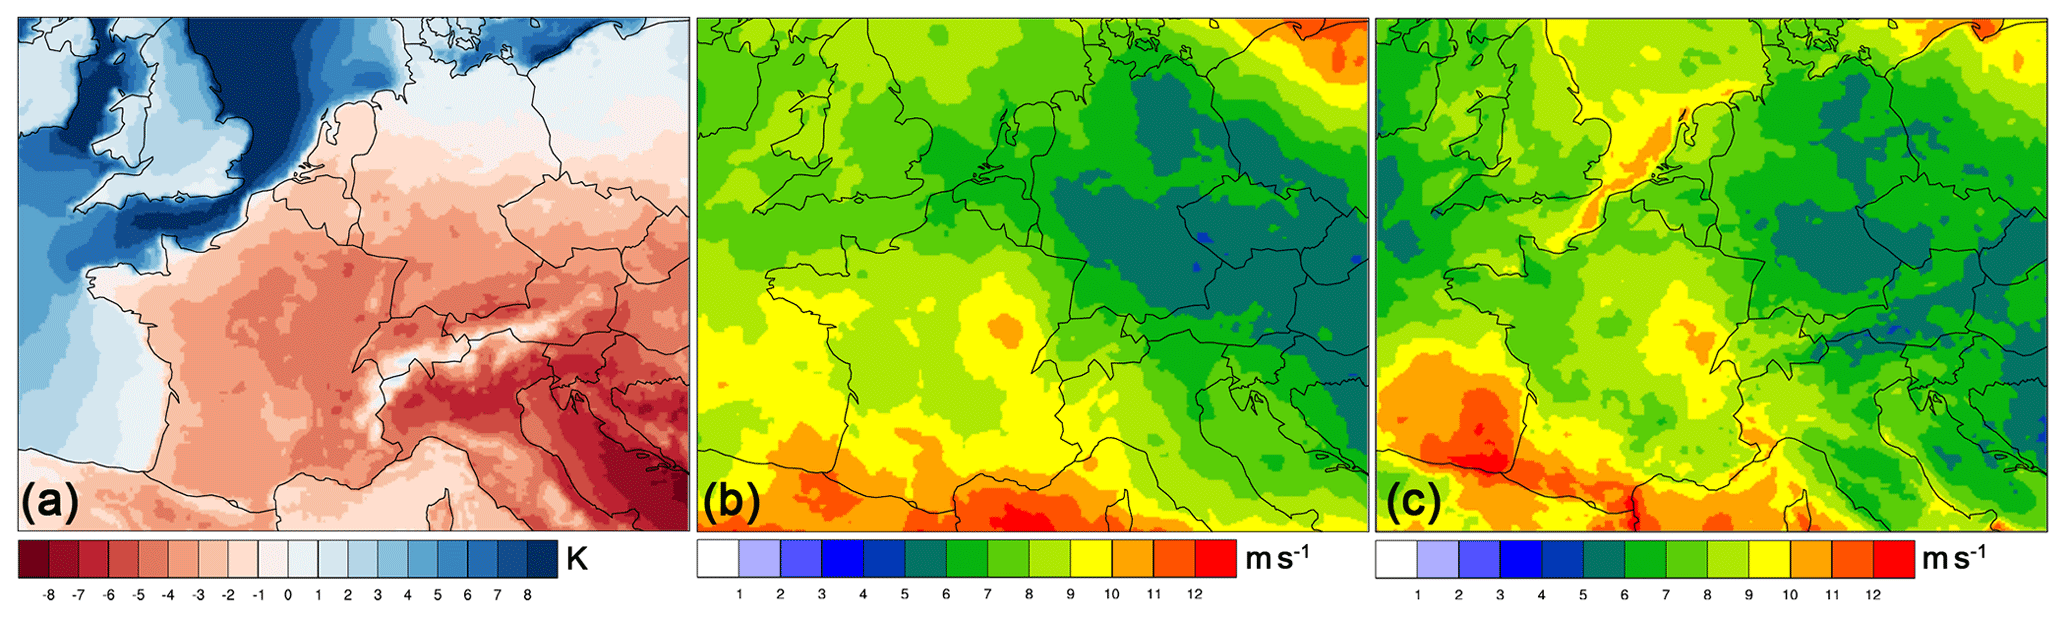
Figure 8(a) Surface-based lifted index (SLI in K), (b) horizontal wind speed at 500 hPa (V500 in m s−1), and (c) bulk wind shear between 500 hPa and 10 m (BWS in m s−1) at 12:00 UTC averaged over the study period from 22 May to 12 June 2018 (ECMWF analysis).
Due to the weak geopotential height gradients that prevailed during the study period (Fig. 6), horizontal wind speed in the mid-troposphere was likewise exceptionally low. During the first half of May, V500 was already low in the sounding data with values rarely exceeding 15 m s−1 (Fig. 7c) but further dropped significantly at the beginning of the study period. Averaged over the entire study period, median V500 was 7 m s−1 at the Essen sounding station; at Stuttgart, Munich, and Vienna values were even lower at around 5 m s−1. At the other three stations in France and Switzerland, the median was between 8 and 10 m s−1. The observations are in line with ECMWF analysis, where V500 was between 5 and 10 m s−1 on average (particularly low in large parts of Germany and Austria; Fig. 8b).
Due to the very low wind speed near the surface, V500 is similar to BWS from ECMWF analysis (12:00 UTC; Fig. 8c). Mean values of BWS between 5 and 10 m s−1 across the study area (except of the Pyrenees region) are a strong indication that the majority of storms did not develop into highly organized convective systems, MCSs, or supercells. The following analyses rely on V500 instead of BWS, especially because of the very unusually low wind speed at 500 hPa. It should be noted that the values for the speed shear are even lower compared to BWS (3–9 m s−1; not shown).
3.2 Air mass origin and paths during the event
The investigation of sounding data revealed an exceptional air mass, which conserved its key properties conducive to convection in the entire study period. This finding, together with the low-pressure gradient associated with the blocking anticyclone over the European sector (Fig. 6), suggests that the air mass was relatively stationary in western and central Europe during the study period. To test this hypothesis, 10 d kinematic backward trajectories are calculated to investigate the Lagrangian history and paths of moist, lower-tropospheric air masses. Though backward trajectories are started from all six sounding stations, Bordeaux, Stuttgart, and Vienna are chosen as representative locations for the following analysis.
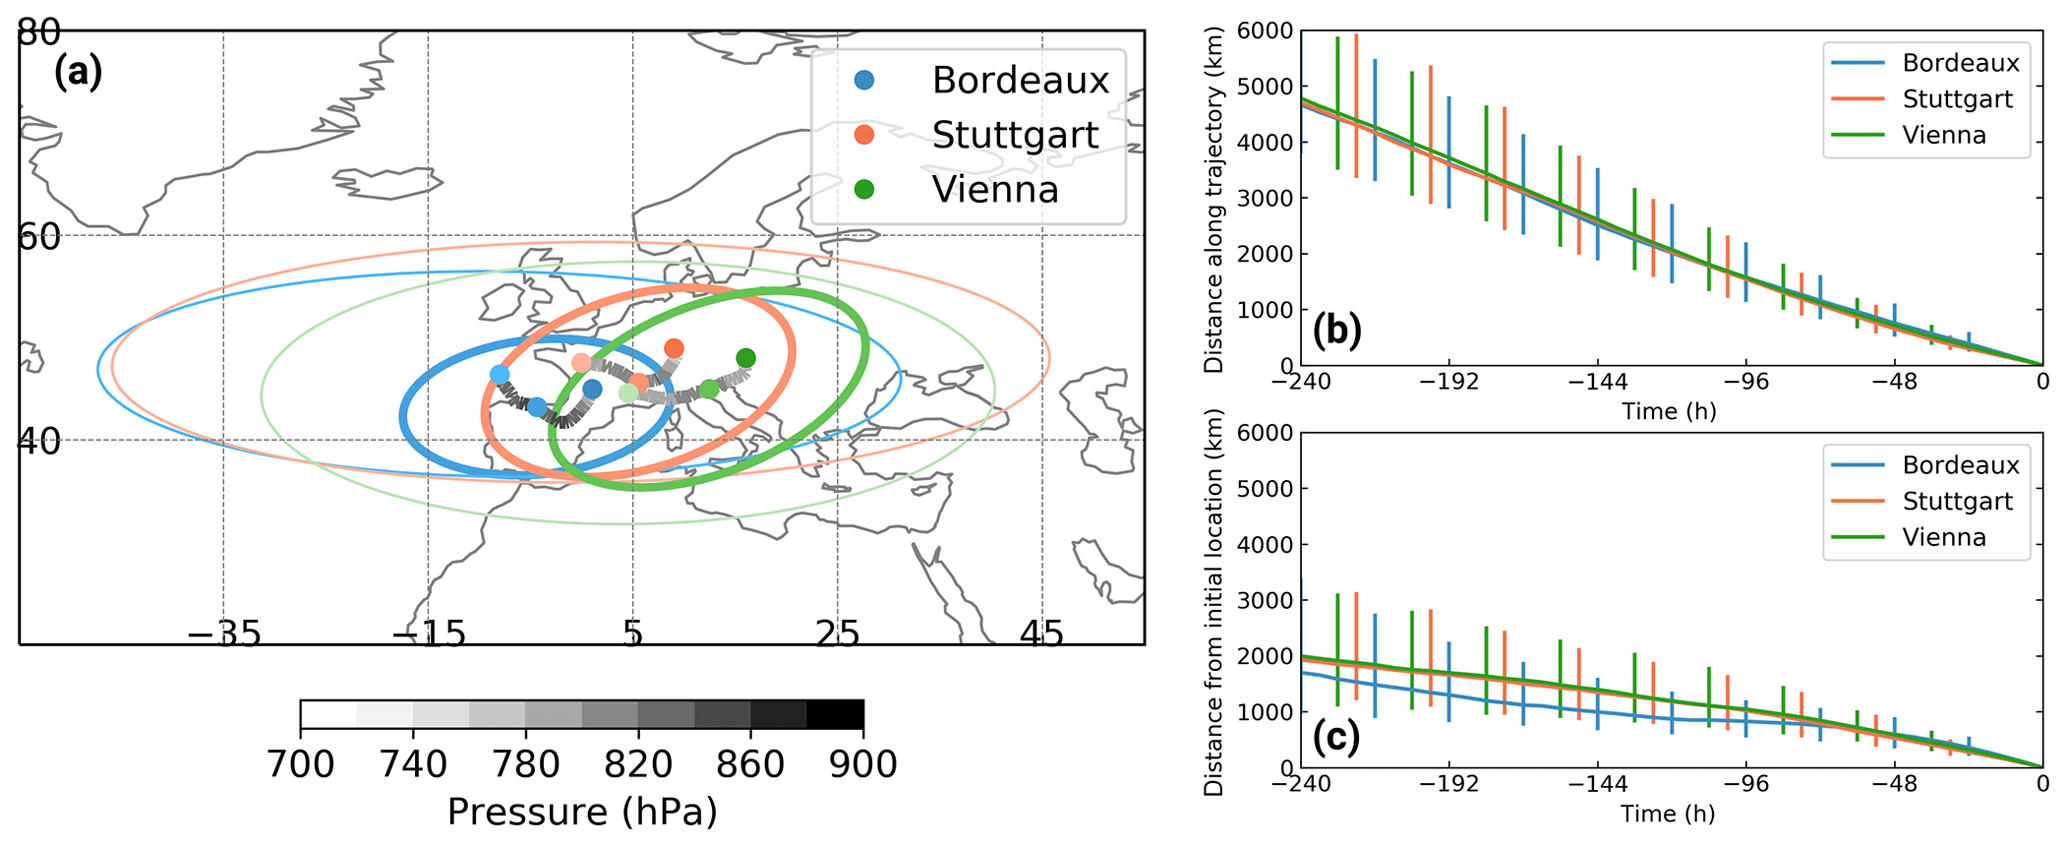
Figure 9A 10 d backward trajectory analysis from 22 May to 12 June 2018. (a) Median backward trajectories coloured by their median pressure (hPa) for three locations are given in the legend. The ellipses show the dispersion of the trajectories around their median location (dots) at 10 d (thin ellipses) and 5 d (bold ellipses) prior to arriving at the location. The dimensions of the ellipses are given by the eigenvalues of the covariance matrix of all longitude–latitudes at the respective times and the ellipses are rotated such that their semi-major axes align with the largest eigenvector. The length of the semi-major and semi-minor axes are chosen such that the ellipses enclose about two-thirds of the trajectories. (b) Temporal evolution of median distance travelled by the trajectories (km) prior to arriving at one of the locations given in the legend. Bars show the interquartile range. (c) As in panel (b) but for distance from the initial location.
The median trajectory pathways during the entire study period 22 May to 12 June consistently show that air masses originated west of the sounding stations and reached those in a southwesterly flow (Fig. 9a). Already 10 d prior to reaching the area of the sounding stations, two-thirds of the air masses were located over the Atlantic–European sector. Though about 50 % of the air masses were transported over a distance of 5000 km (Fig. 9b), the median distance from their initial location (i.e. Bordeaux, Stuttgart, Vienna) never exceeded 2000 km (Fig. 9c). This clearly indicates that air masses re-circulated while approaching the area of the sounding stations. A total of 5 d prior to arriving at the location, trajectories were mostly located over Europe (bold ellipses) and within a radius of 1000 km around the sounding stations.
3.3 Thunderstorms related to cut-off lows
Having shown that a quasi-stationary air mass, which was conducive to convection, prevailed over vast parts of central Europe during the study period, we now explore cut-off low activity that can prepare the atmosphere for convective initiation due to the associated large-scale lifting. The blocking situation over central Europe and the North Sea during the study period was accompanied by a negative geopotential height anomaly over the Iberian Peninsula (Fig. 6), which corresponds well with a significantly enhanced frequency of PV cut-offs of more than 50 % in the Bay of Biscay region (Fig. 10a). This region of enhanced PV cut-off frequencies expands over much of Spain, western France, and some parts of the British Isles with frequencies often above 25 % but does not reach Germany or eastern Europe. The fact that relatively high PV cut-off frequencies expand over a larger region of western Europe (Fig. 10a) underlines that multiple individual PV cut-offs form on the upstream flank of the blocking ridge (see Fig. 5), and intermittently move across Iberia, France, the British Isles, the North Sea, and Germany.
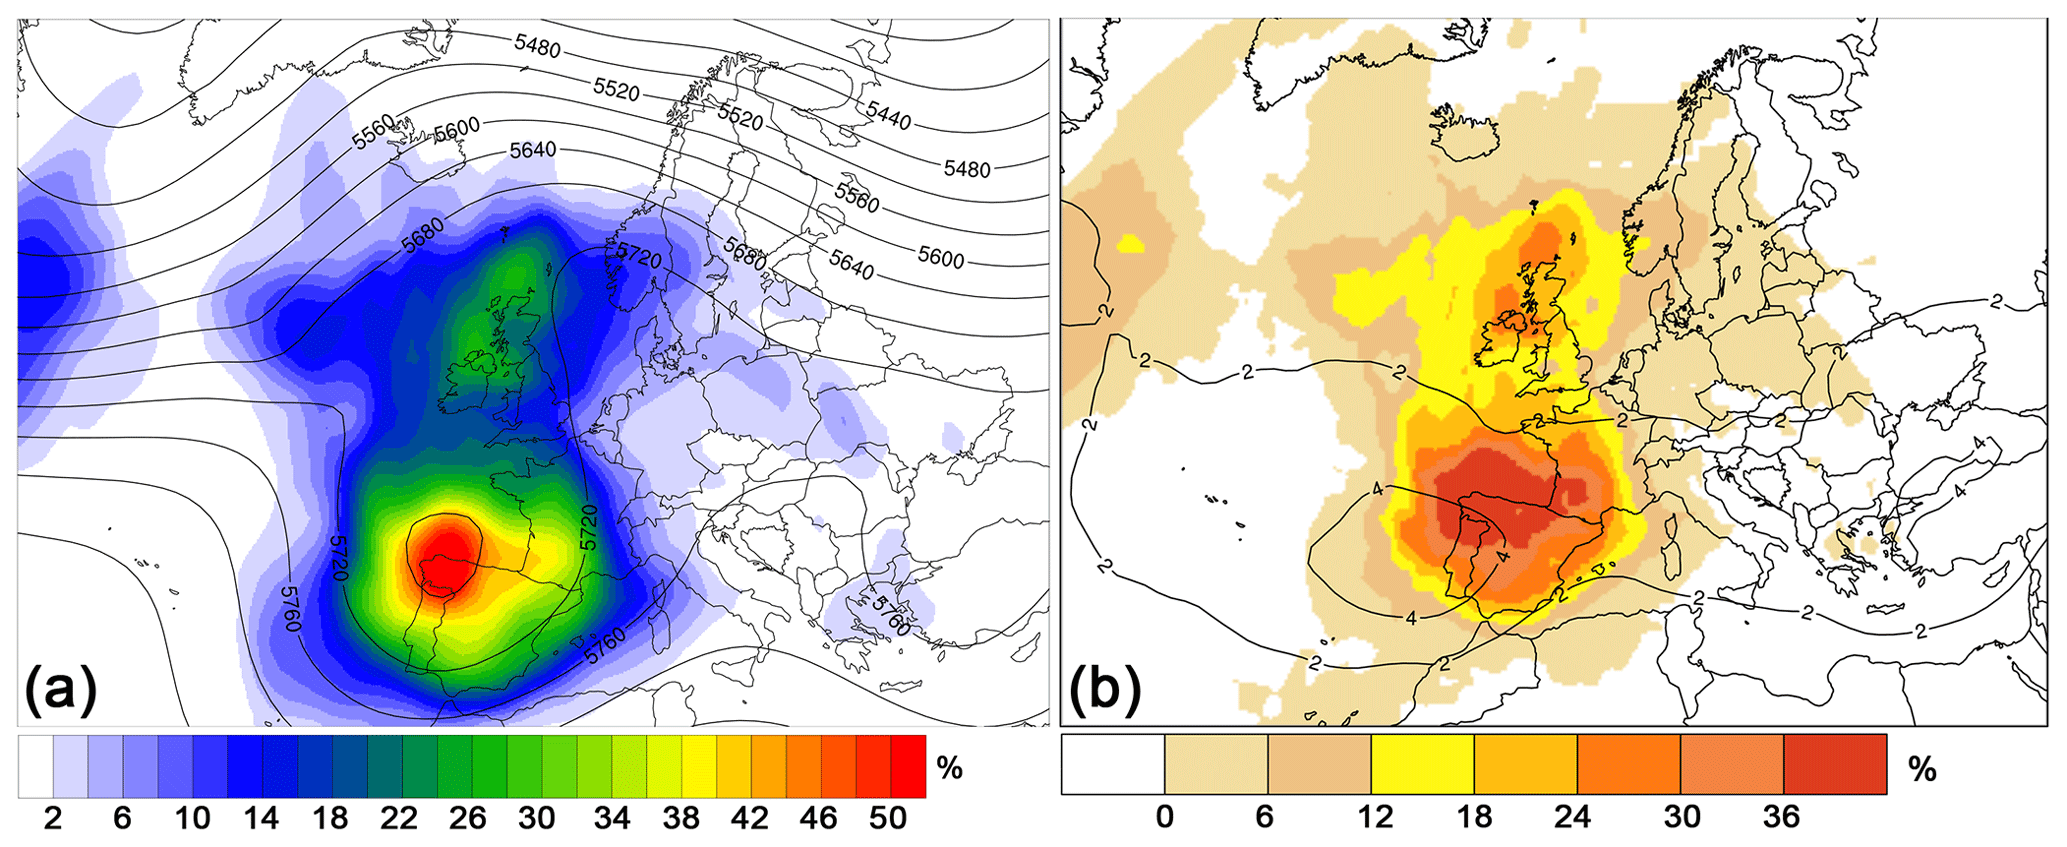
Figure 10(a) Composite mean of 500 hPa geopotential height (contours every 40 gpm) and cut-off low frequency (colour shading in %) during the study period. (b) Climatological mean percentage of days with a cut-off low in May and June (black contours; every 2 % for May and June 1981–2010) and anomaly percentage of days during the study period (shaded in % with reference to mean percentage of days in May and June, both based on ERA-Interim).
In such a configuration, filaments of positive PV that separate from the main PV cut-off may favour lifting on their downstream flank and help to initiate deep moist convection over larger areas. This relation is exemplified by a 2 d period from 31 May to 1 June representing the end of the period with the highest lightning activity and number of ESWD reports. Here, more than 700 000 lightning strikes were measured over the study domain (black bars in Fig. 11) and more than 70 % of these can be attributed to PV cut-off activity (light grey bars). On 31 May, in the early afternoon, thunderstorms primarily affected Belgium and the Netherlands first (Fig. 12a), before lightning activity re-emerged over central and northern France, Switzerland, and various parts of Germany (Fig. 12b). Several of these events were documented by heavy rain reports in the ESWD (see Fig. 2). During the following night, the slow-moving multicellular system moved from Switzerland northwards, affecting the southwestern and western parts of Germany (Fig. 12c, d; see Sect. 3). While the system dissipated in the late morning over the border regions between Germany and Belgium, severe thunderstorms developed again over eastern and northern Germany, the Czech Republic, western Poland, and the Pyrenees (Spain; Fig. 12e, f). The link to upper-level PV filaments becomes apparent by carefully investigating the 6 h evolution of the identified cut-off low masks (Fig. 12; see Sect. 2.5). Additionally, the area of negative ω values indicates upward vertical motion over larger areas (light blue). Generally, such ascent downstream of a trough or PV cut-off due to vertically increasing advection of PV is in combination with layer thickness advection and destabilization underneath the high PV air, which is well represented in our example.
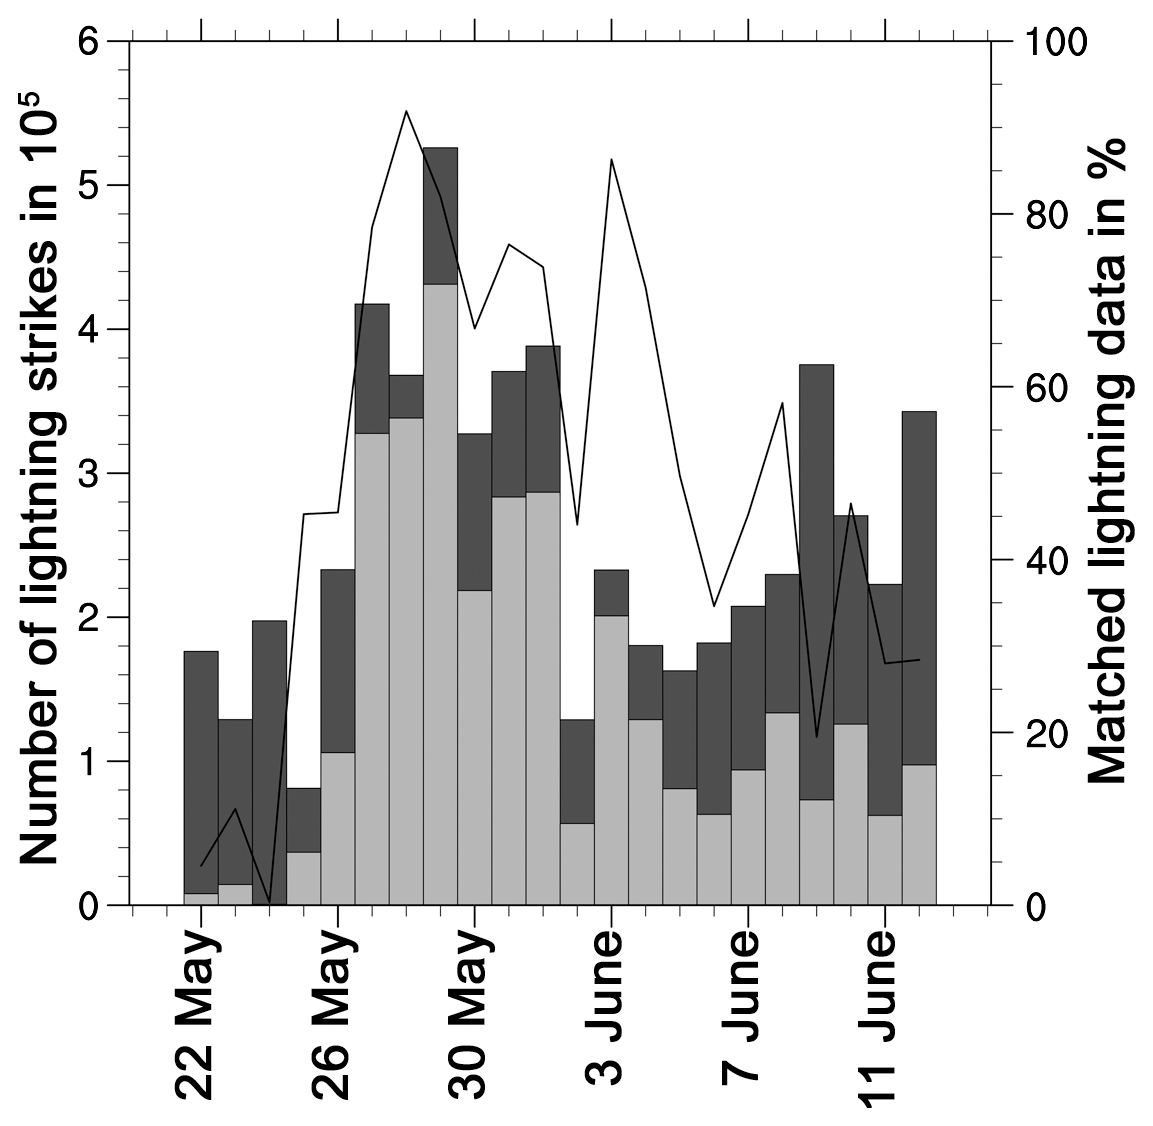
Figure 11Lightning strikes per day (03:00–03:00 UTC on the next day) during the study period for all thunderstorm events (dark grey bars) and those thunderstorms that can be linked to a cut-off low (light grey bars). The black line shows the percentage of lightning strikes per day that can be attributed to a cut-off low.
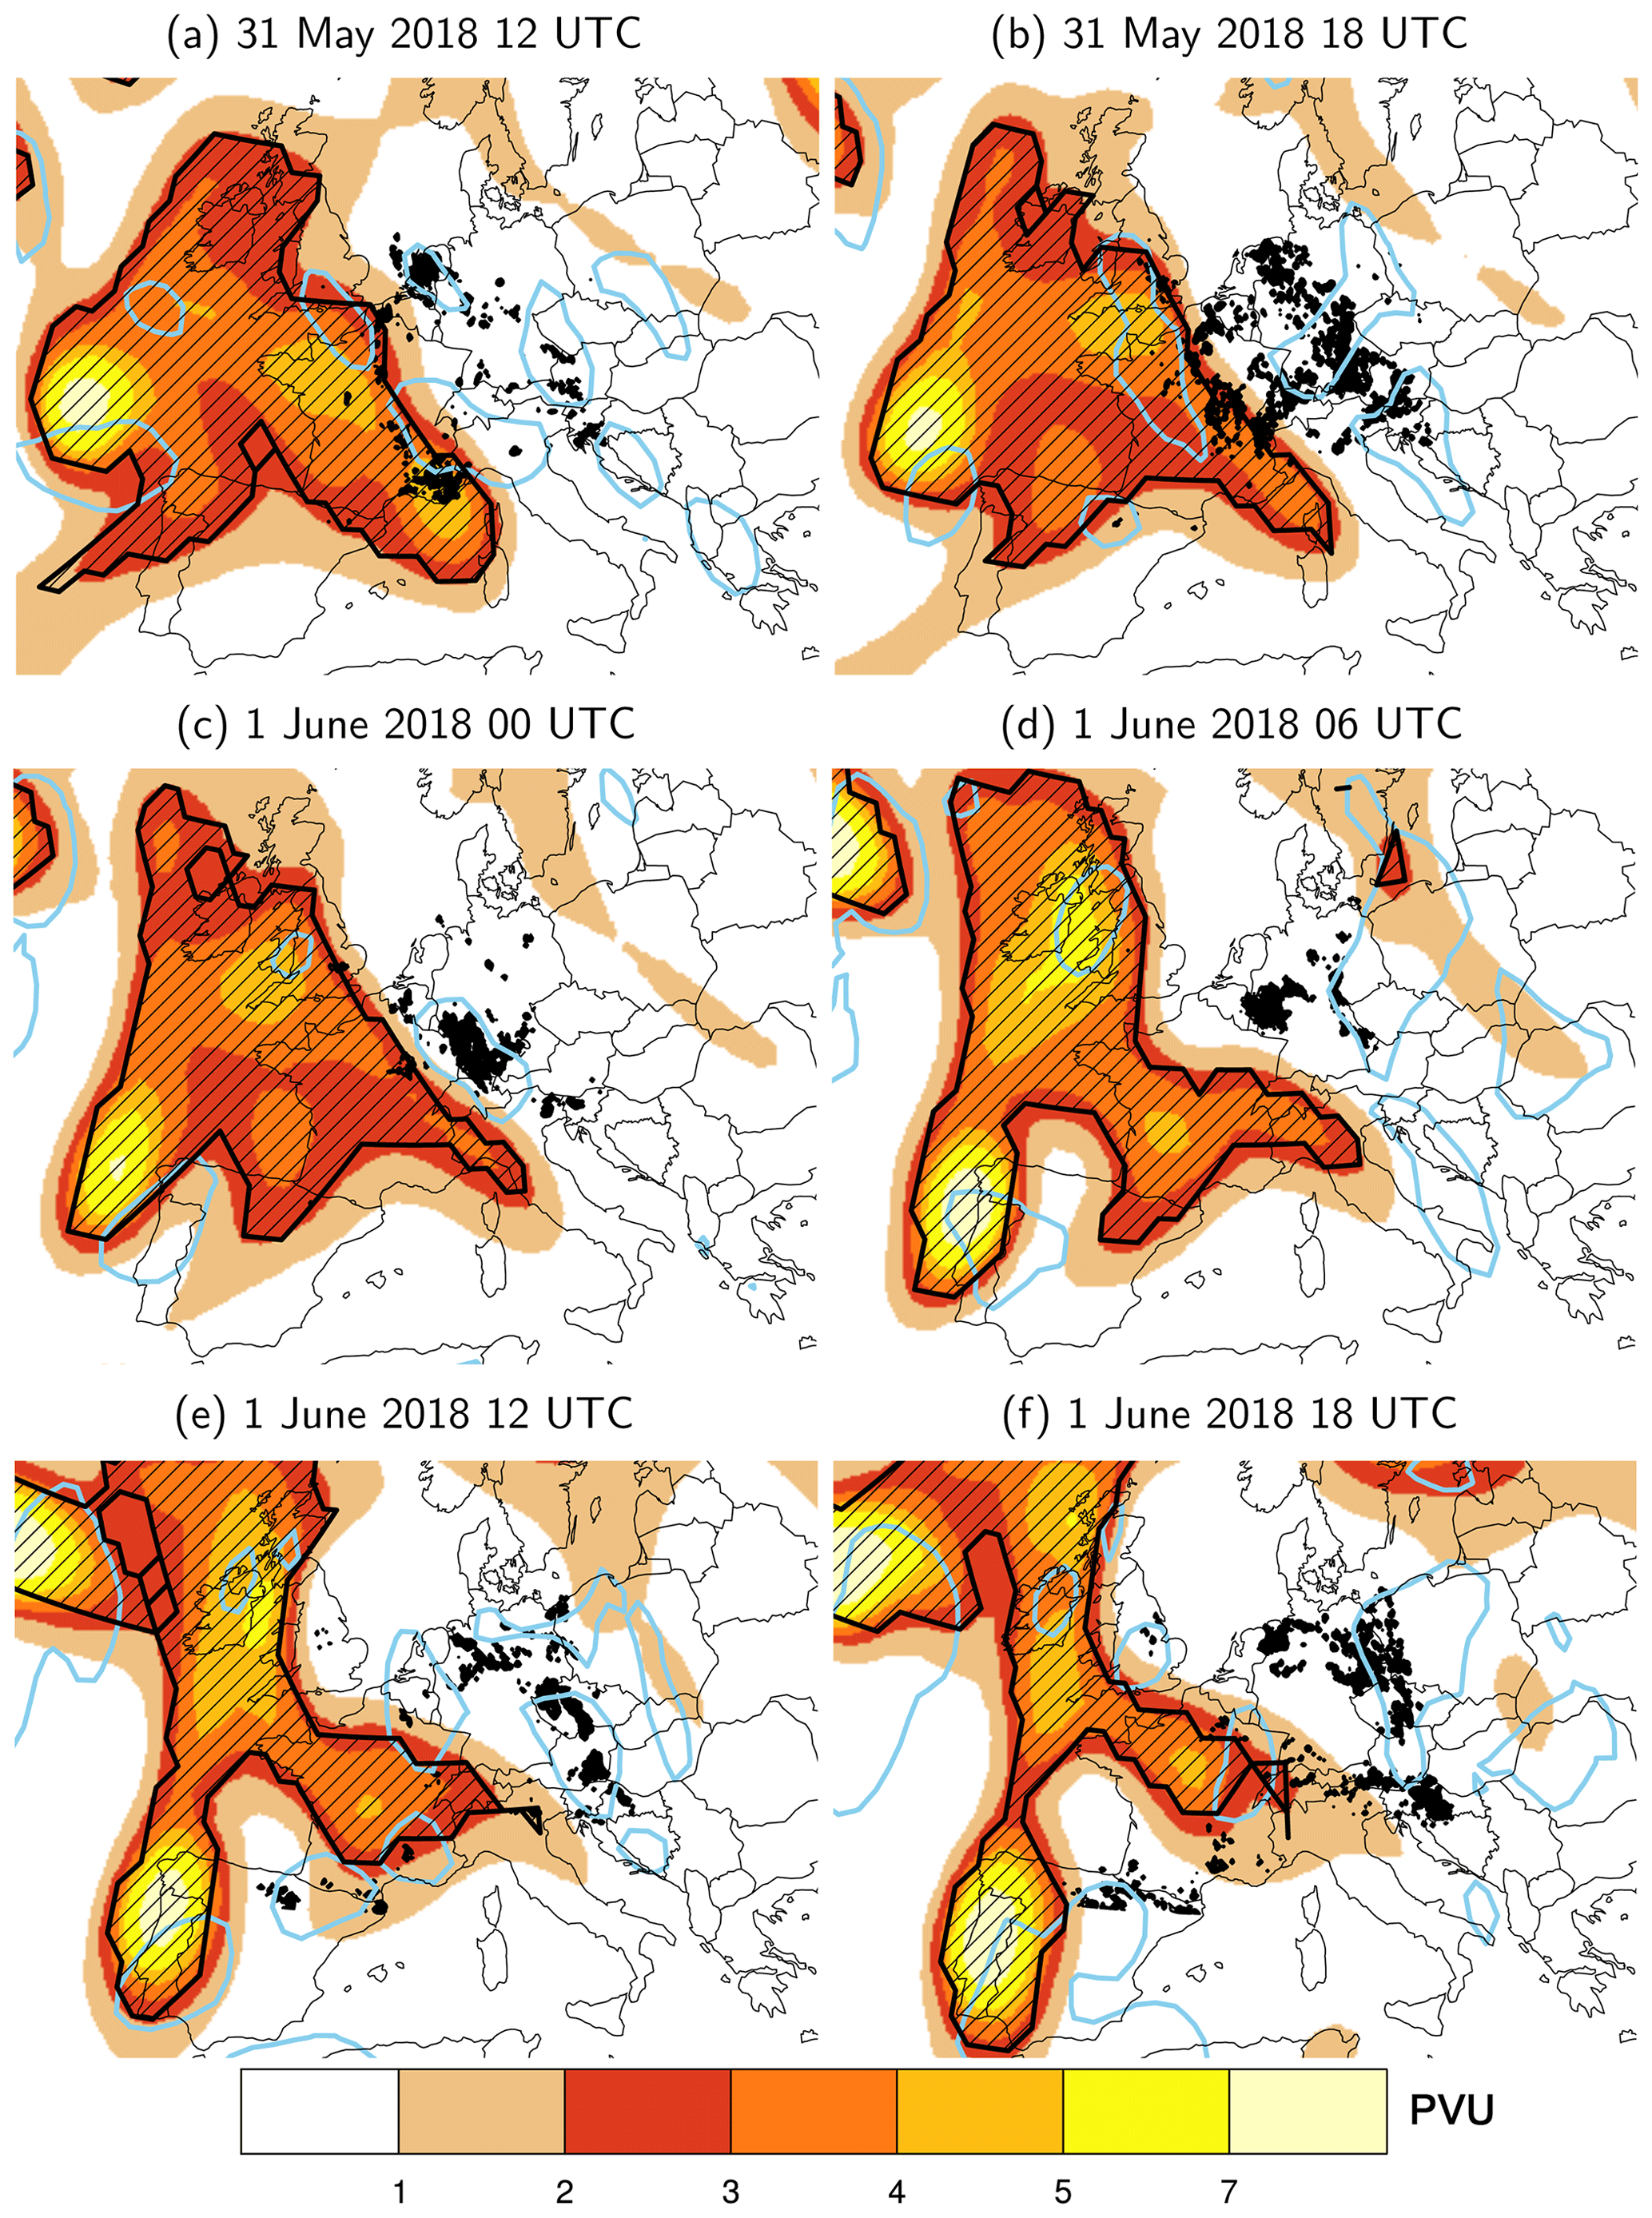
Figure 12Lightning data (dark black dots) for 6 h time spans centred around the respective time and PV on the 325 K isentropic surface (shaded in PVU; ERA-Interim). Regions of ascent at 500 hPa are indicated by light blue contours ( Pa s−1; ERA-Interim). Hatching indicates masks of objectively identified cut-offs on the 325 K isentropic surface (see Fig. S2 including the buffer zone).
On 31 May, a narrow trough approached from the Atlantic towards Iberia (see Fig. 5e), accompanied by the cut-off low (C3), which together with C1 forms the identified masks of the PV cut-offs region in Fig. 12a. In particular, C1, located above France at that time, and the associated areas of ascent (light blue) correspond well with the regions of thunderstorm activity in southeastern Germany, central France, and the Netherlands in the late afternoon (Fig. 12b). From 12:00 until 18:00 UTC the next day, this trough narrowed while moving gradually northeastward accompanied by enhanced lightning activity moving from central France and southern Germany to northeastern Germany and Poland (Fig. 12e, f). It is especially apparent that the multicellular system, which developed in the evening hours of 31 May (Sect. 3), emerged in a region of negative ω values ahead of the trough (Fig. 12c). On 1 June, ascent occurs further to the east over Austria, the Czech Republic, and northeastern Germany (Fig. 12e), which agrees well with the location of thunderstorm initiation.
The above discussion of PV filament evolution and lightning activity from 31 May to 1 June revealed an apparent link of this feature with lighting activity confined to the downstream side of PV filaments, where lifting is favoured. Considering the entire study period, we found 54 % of the lightning linked to a nearby PV cut-off (Fig. 11). Examining individual days reveals that on the day with the highest number of lightning detections (29 May) over 85 % of these events can be linked to a PV cut-off. A total of 6 out of 8 d with the highest number of lightning flashes were the days from 27 May to 1 June. During this period, more than 75 % of the lightning strikes can be connected with one of the PV cut-offs. We conclude that cut-off low activity provided the necessary environment that favoured lifting within the prevailing unstable air mass and thus indirectly contributed to convective initiation of widespread thunderstorms in western and central Europe during this period.
In this section, we assess the exceptional nature of the thunderstorm event, by relating the observed rainfall totals, the prevailing environmental conditions, and the occurrence of cut-off systems to long-term data records.
4.1 Return periods of rainfall and propagation speed of convective cells
To estimate the severity of the rainfalls with respect to the rainfall climatology, we compute return periods (RPs) for each day during the study period in the REGNIE long-term record based on Eq. (3). Afterwards, we determine the highest RP (largest 24 h rain total) for each grid point. This analysis is restricted to Germany due to the availability of long-term (>50 years), high-resolution (1 km2) gridded rainfall data. REGNIE data derived from measurements at climate stations certainly underestimate precipitation peaks, but this is the case both for the study period and the 67-year reference period.
Extreme precipitation generally occurred locally, and only a few smaller regions were affected by high rainfall totals exceeding RPs of 5 years (Fig. 13). RPs in excess of 10 years were restricted to the southern parts of Germany (south of 52∘ N), except for a few grid points south of Berlin. Most of the precipitation fields with higher RPs occurred as clusters; for example, those near the border to France in Rhineland Palatinate and the Saarland (near Saarbrücken), northeast of Stuttgart, around Bad-Elster Sohl, or north of Munich. Several local maxima have RPs of up to 50 years, but a few hot spots, unevenly distributed in southern Germany, reach values in excess of 200 years (e.g. the observation in Bad Elster-Sohl; see Sect. 3). Several hot spots have an almost circular shape, with the highest value located in the centre. This does not appear to be an artefact of insufficient gauge density, as most events are represented by multiple gauges (not shown).
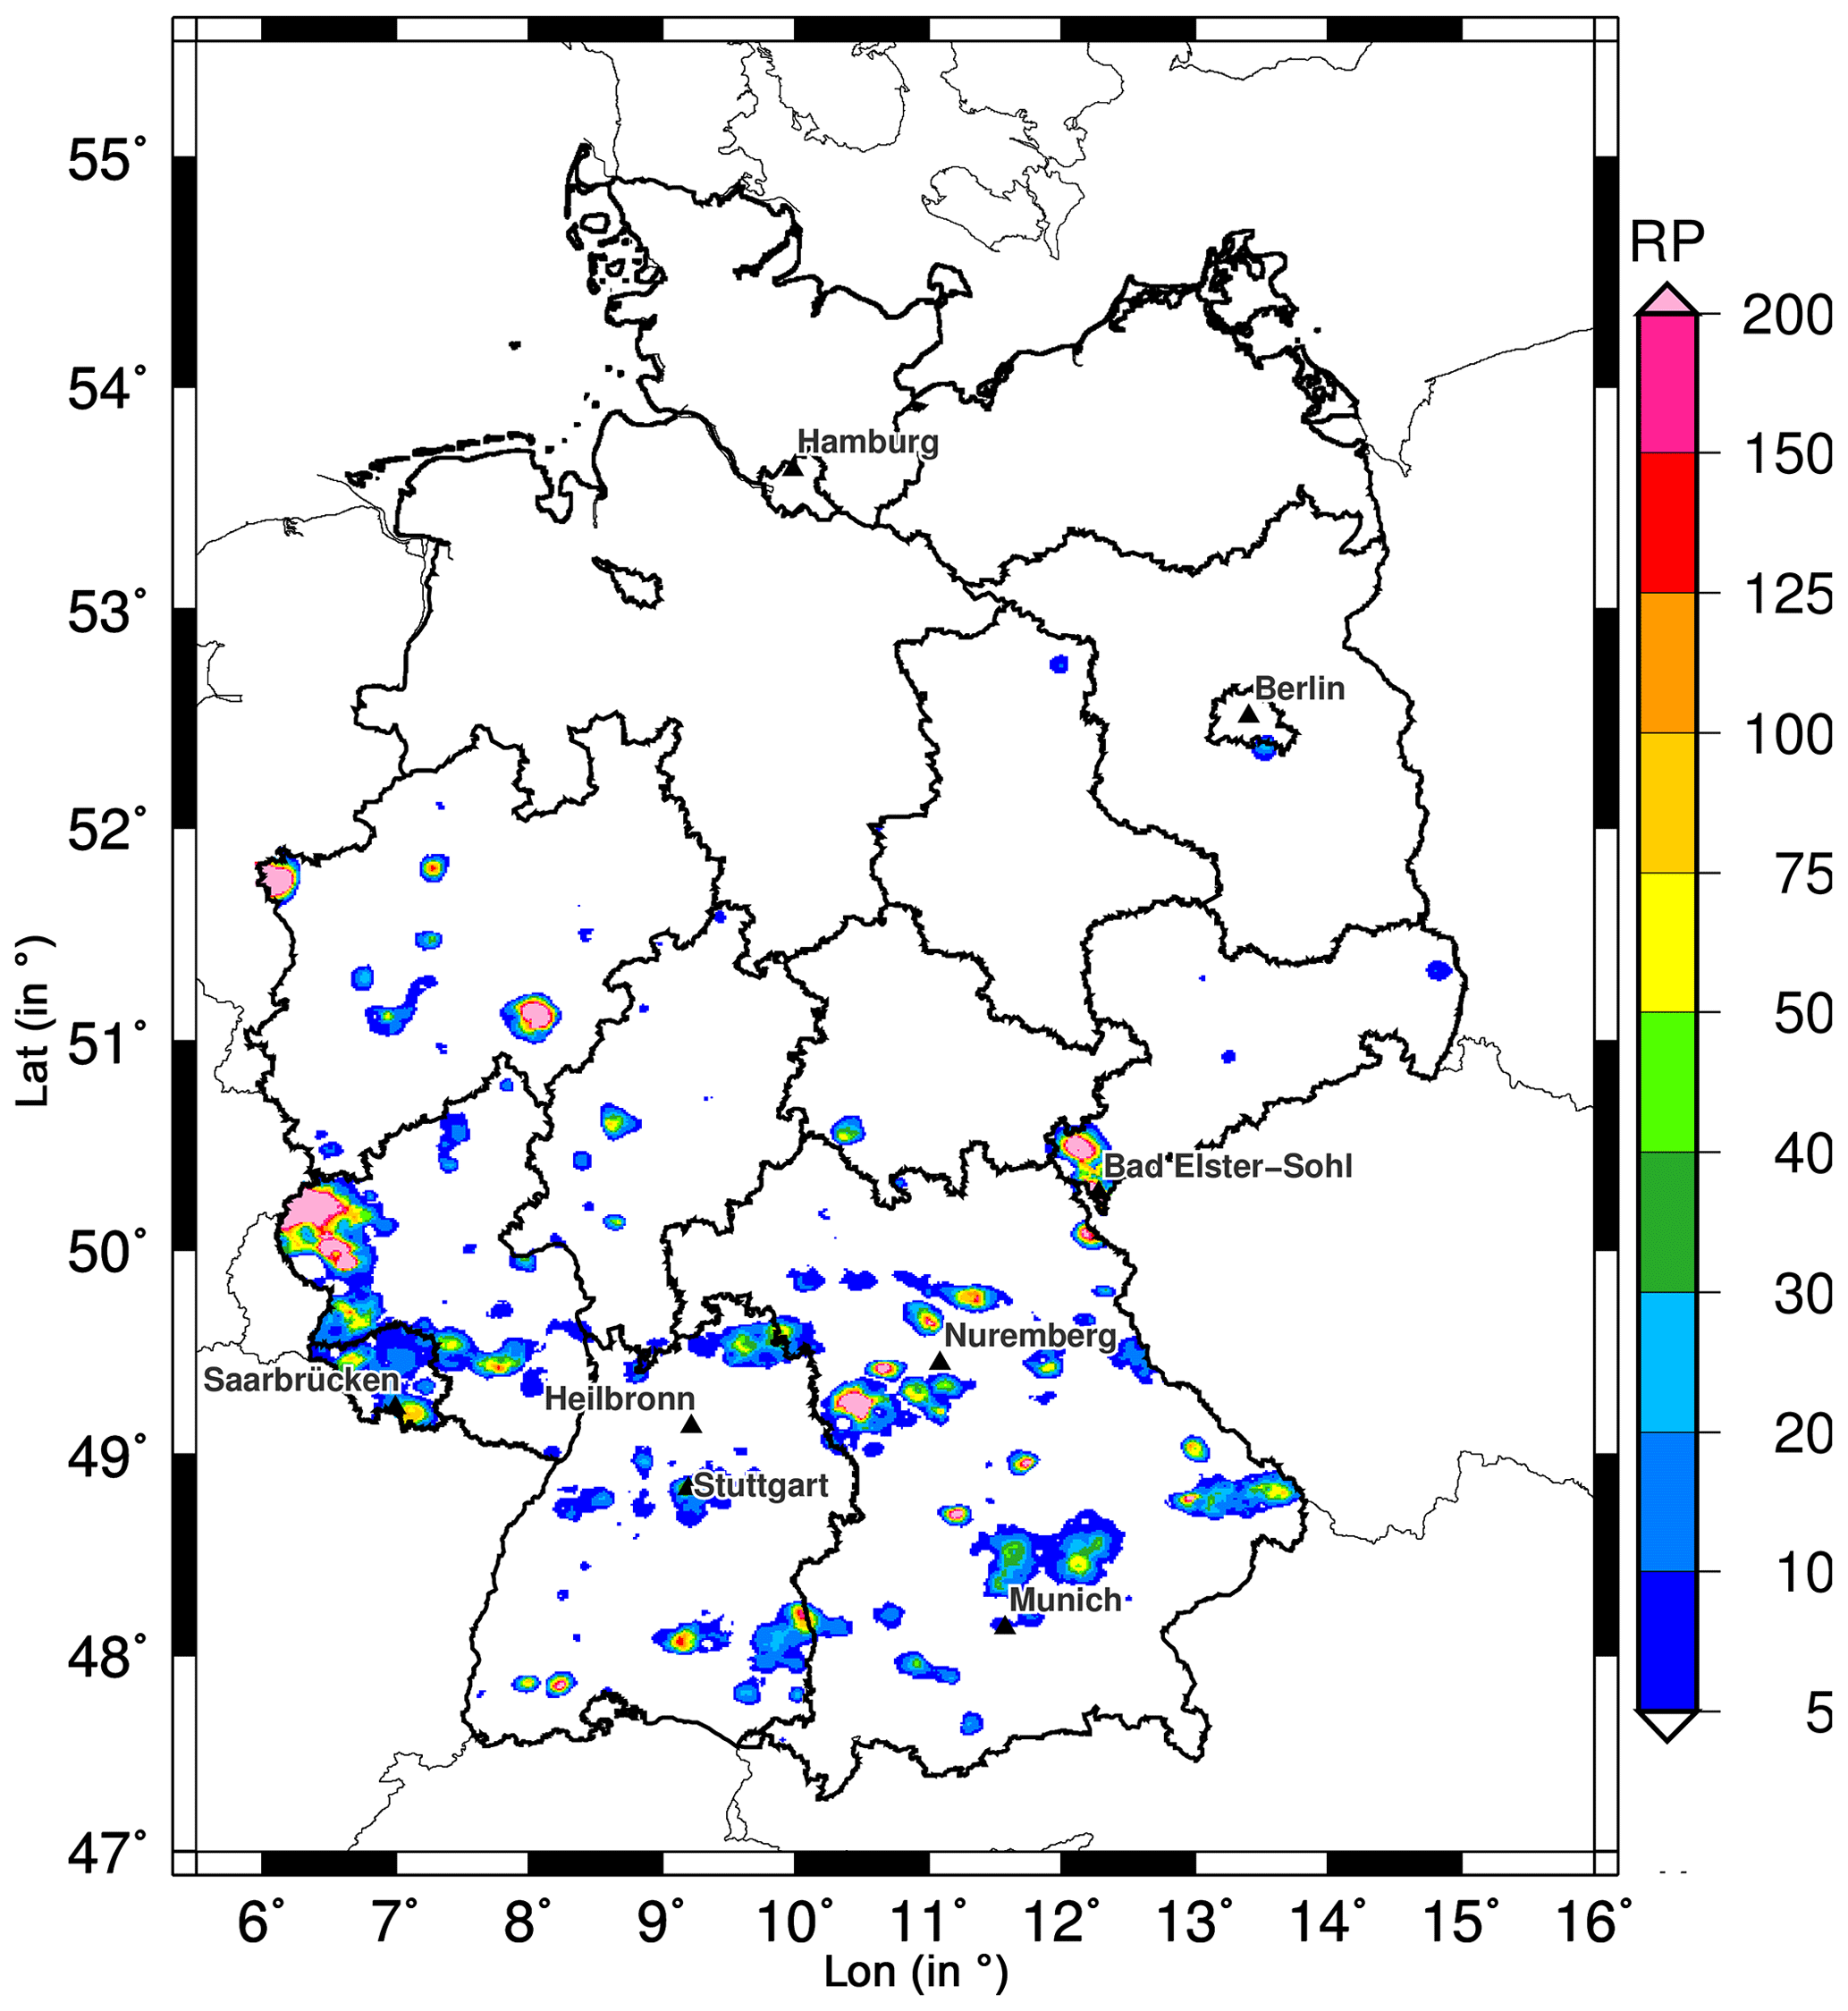
Figure 13Return period (RP) of the highest 24 h rainfall totals that occurred during the study period at each grid point (REGNIE precipitation data; reference period: 1951–2017, summer half-year).
Instead, it likely reflects the very slow propagation of storms, which was substantially lower during the study period compared to climatology (Fig. 4). Generally, convective storms detected between 2005 and 2017 (May–June: 3428 cells) show significantly higher values of 10.2±4.9 m s−1 (mean ± SD) and 9.5 m s−1 (median) compared to 5.9±2.9 and 5.2 m s−1 in the study period. Only 14.4 % of all detected cells show values below 5 m s−1, which differs significantly from the proportion in the study period with 47.3 %. A total of 15.5 % of the events propagated with a speed of at least 15 m s−1 (for the study period only this was 1.5 %; cf. Sect. 3.1.2).
4.2 Environmental conditions
We begin the analysis of the environmental conditions by comparing the SLI and V500 values observed at the seven sounding stations during the study period with comparably low values during a 30-year period. The latter is represented by the annual minimum of 22 d (same duration as study period) running mean values for May and June during 1981 and 2010. The box-and-whisker plots (Fig. 14) on the left represent conditions during our study period (all 22 daily values), and those on the right represent the historical situation (in sum 30 values). Thus, each of the 30 values taken into account in the right box plot of each station has the same temporal dimension (running mean of a 22 d period) as the median in the left box plot of each station. Recall that the low values for both SLI and V500 were the peculiarity during the 2018 thunderstorm episode.
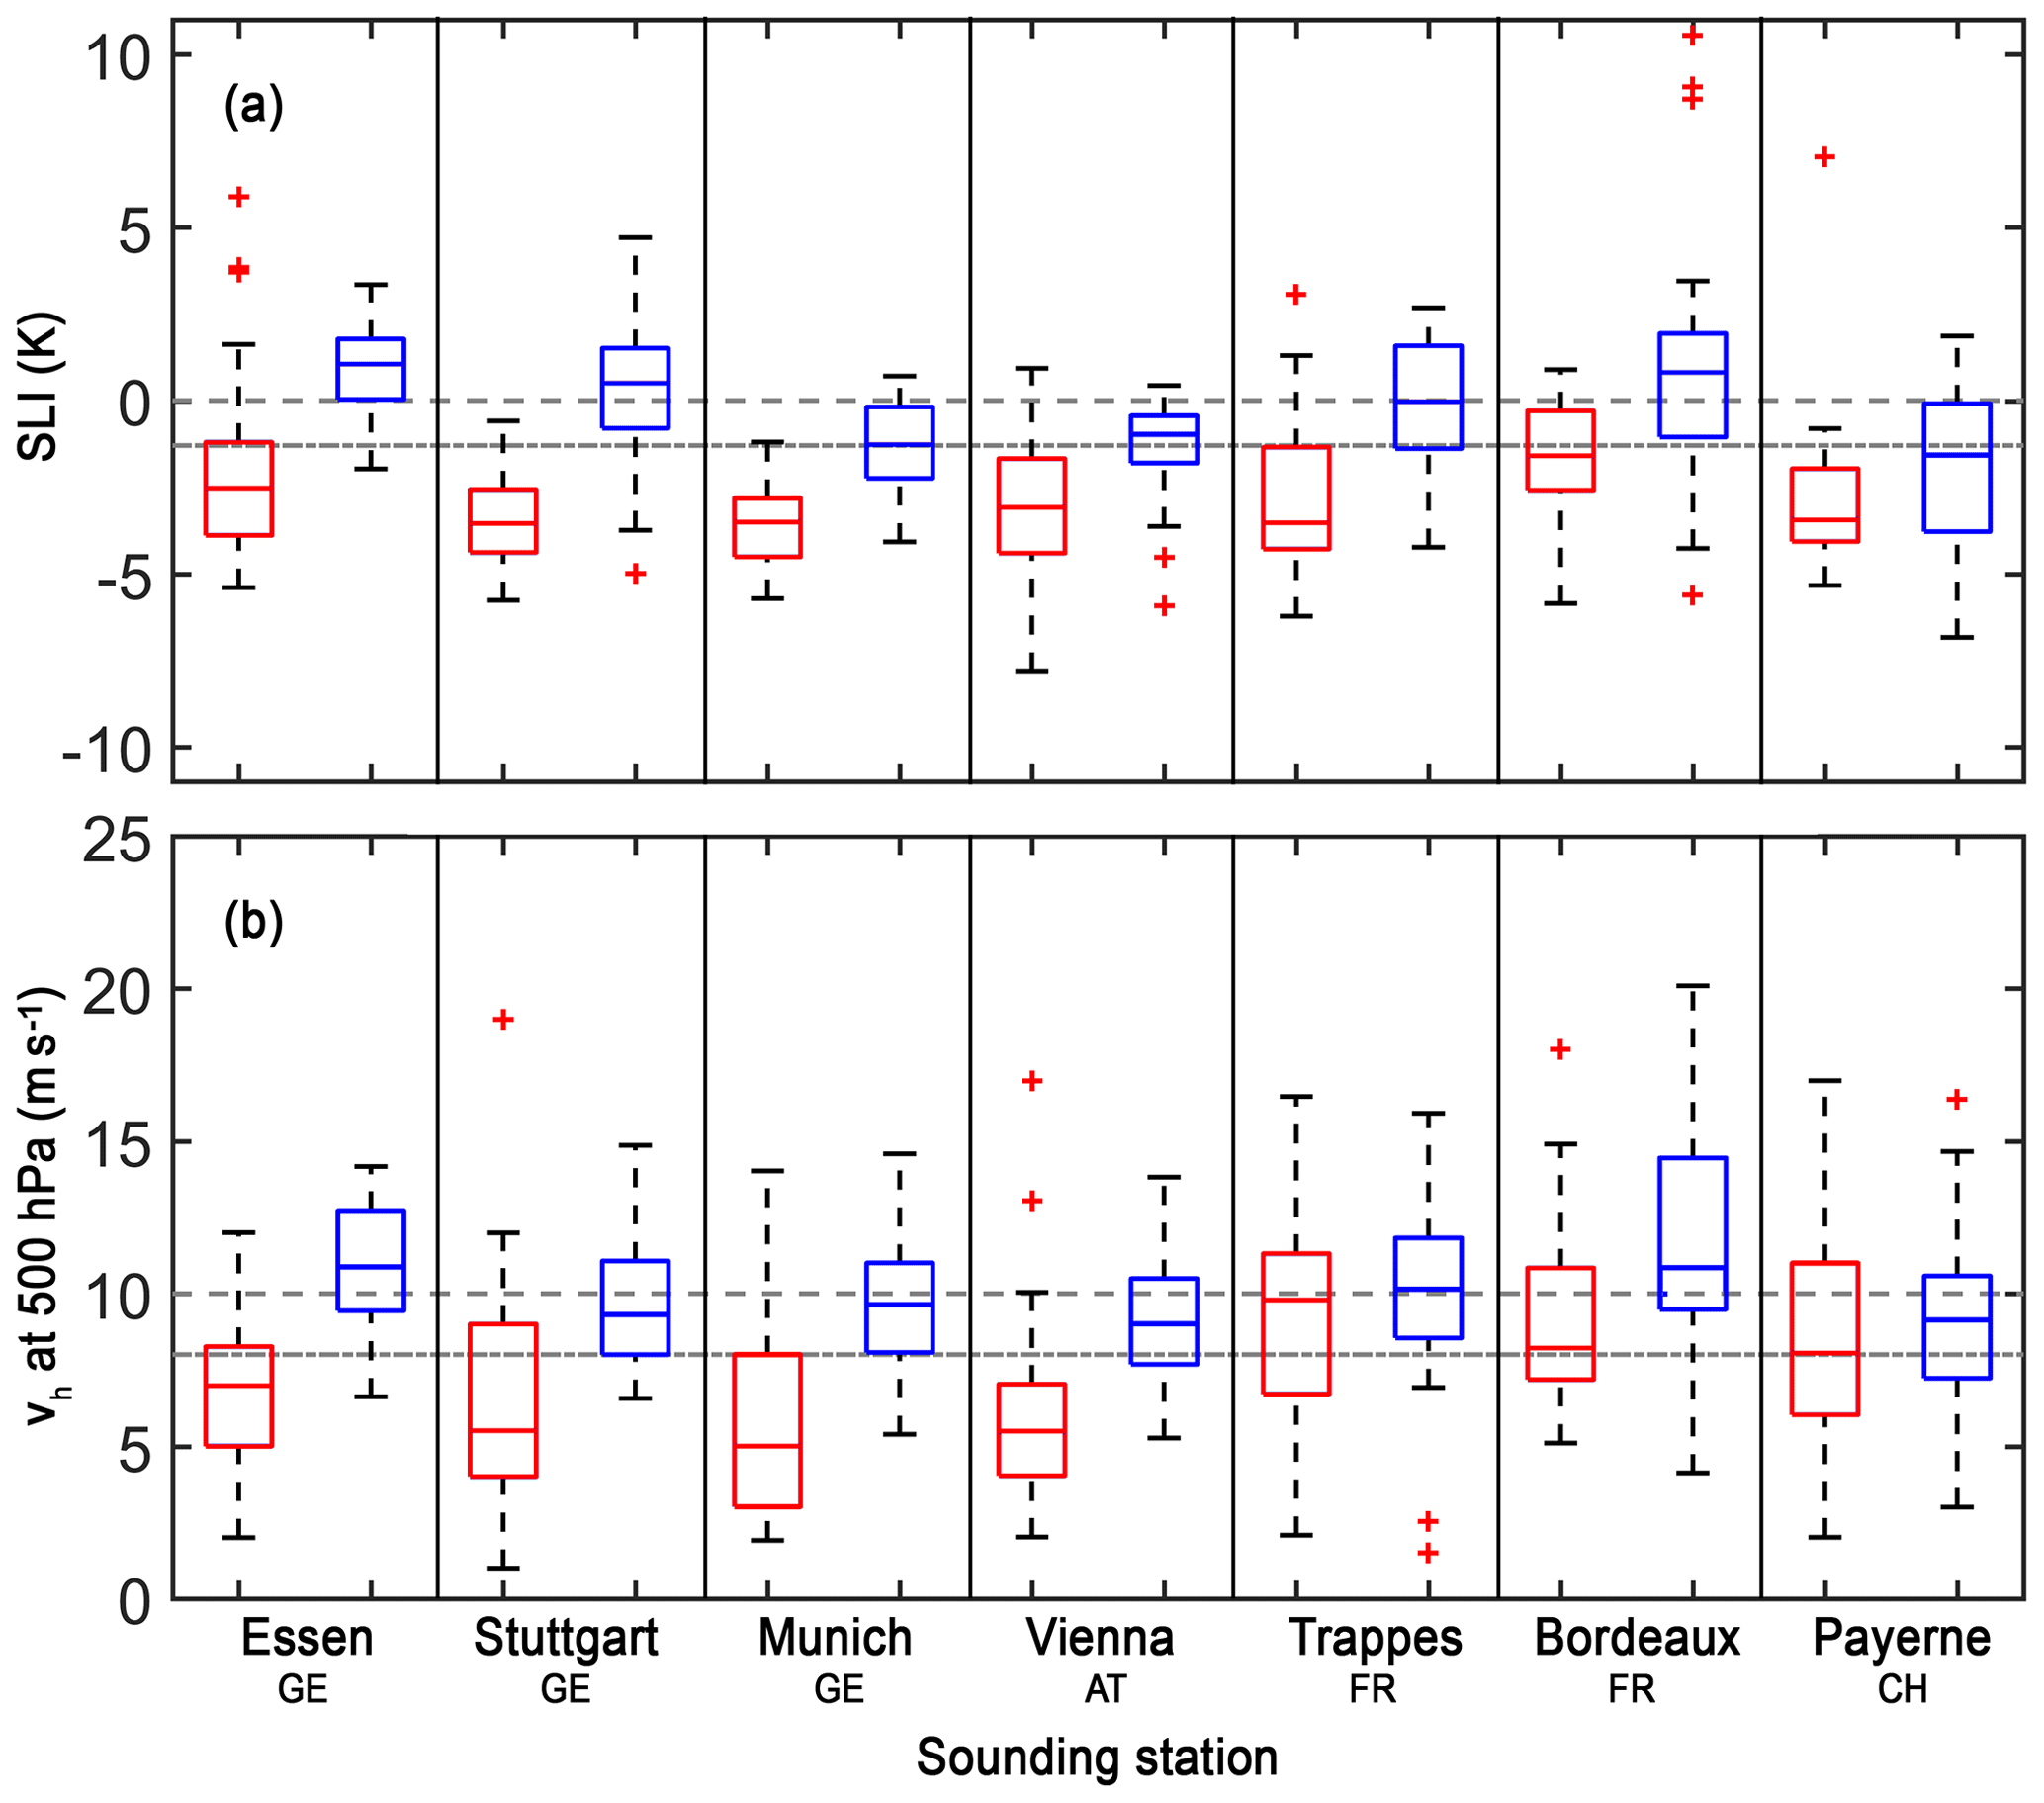
Figure 14Box-and-whisker plots (median, first and third quartiles, whisker , outliers) for the seven sounding stations. The left-hand box plots (in red) of each station include all values of (a) SLI and (b) V500 during the study period at 12:00 UTC, the right-hand box plots (in blue) include the annual minimum of the running mean (22 d) during May and June between 1981 and 2010. The two grey lines indicate thresholds as defined in PIP16 (basic criterion: 0 K and 10 m s−1; strict criterion: −1.3 K and 8 m s−1; see Sect. 2.6). Note that the median on the left-hand box plots is calculated identically to all 30 values in the right-hand box plots.
Both for atmospheric stability and mid-tropospheric flow speed, the interquartile range (the middle 50 % of all values) of the left box plot is mostly lower than the interquartile range of the right box plot, illustrating the exceptional environmental conditions of the 2018 thunderstorm episode. This applies in particular to the stations in Germany and Austria; stations in France and in Switzerland tend to overlap (slightly) between the two interquartile ranges. As already mentioned in Sect. 3.1.2, a large portion of SLI and V500 values during the event (left box plot) are well below the basic and strict thresholds (see Sect. 2.6).
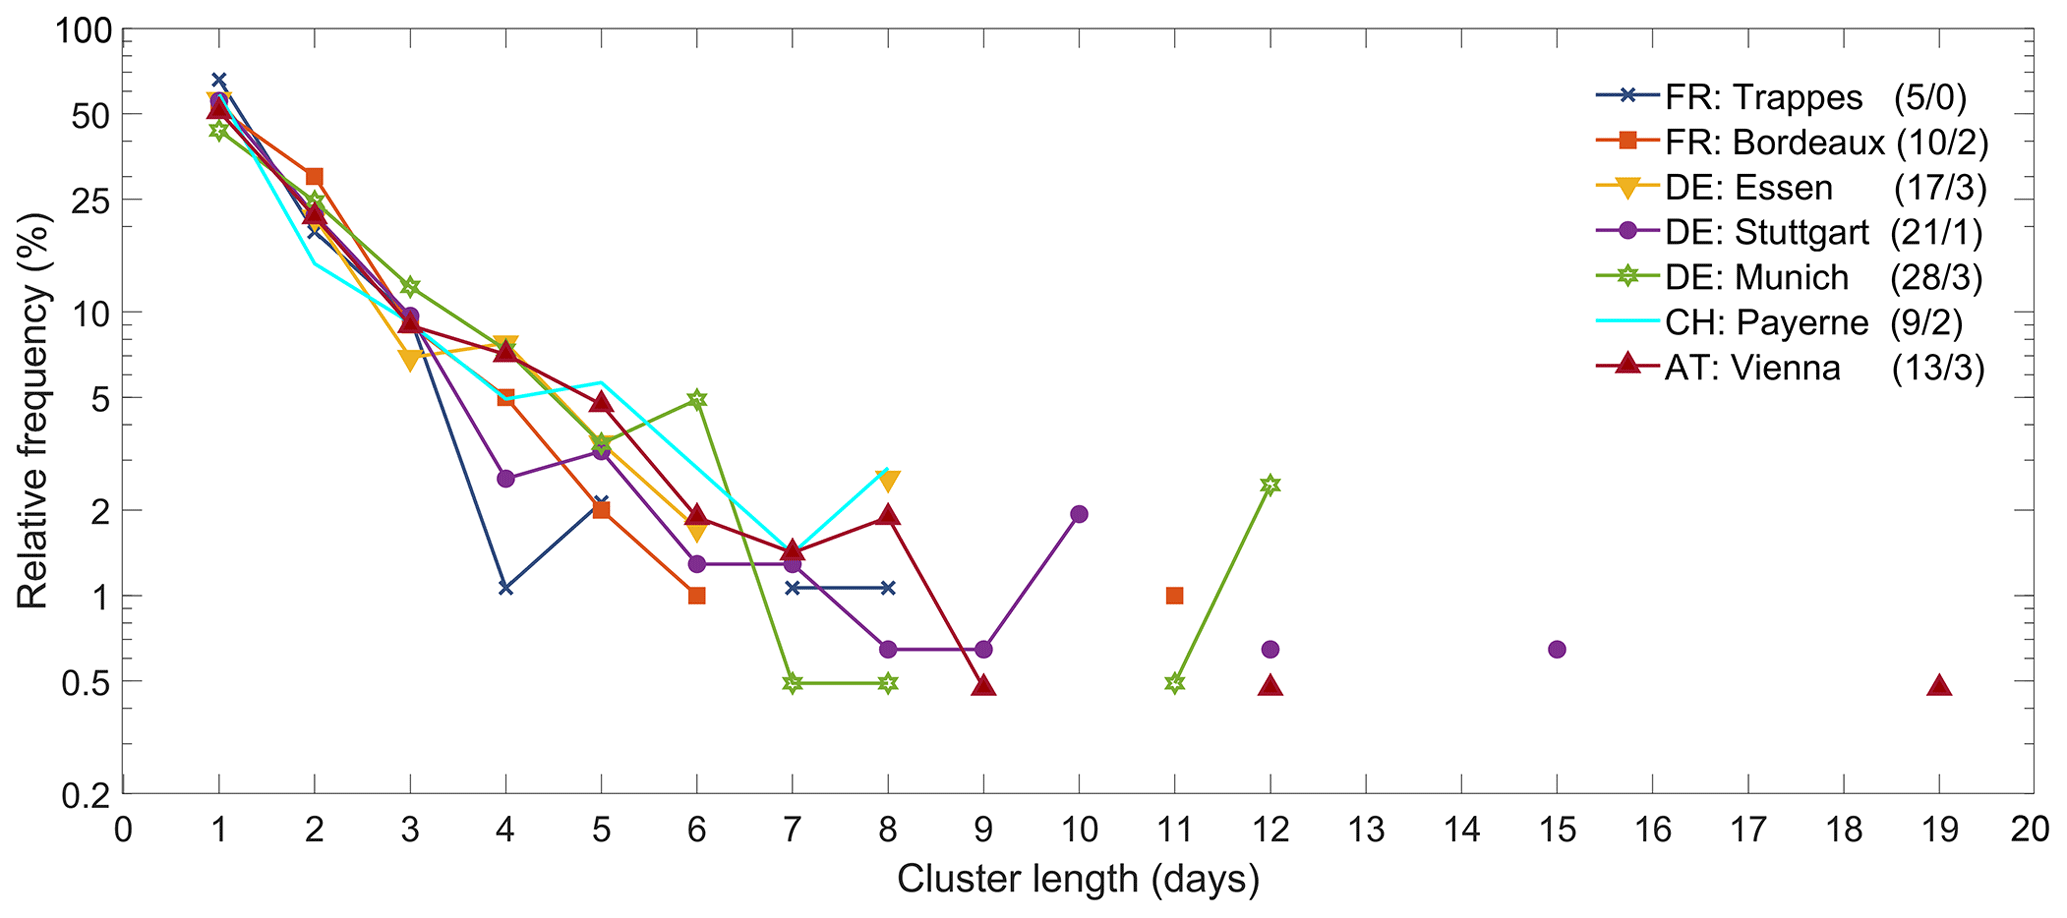
Figure 15Relative frequency of the length of consecutive days exceeding the basic criterion for concurrent events with low stability (SLI <0 K) and weak flow (V500<10 m s−1) at the seven sounding stations (Trappes, Bordeaux, Essen, Stuttgart, Munich, Payerne, Vienna) during 1981–2017 (May–June). Maximum days with event persistence n (including skip days m) during the extended study period in 2018 (May–June) are shown in the legend (n∕m).
To elaborate on both the peculiarity of the co-occurrence of low stability and weak mid-tropospheric flow and its persistence, we investigate the probability of concurrent events (CEs) by following the methodology of PIP16 (see Sect. 2.6) using the same basic criterion. The CE duration for each of the seven sounding stations during the extended study period in 2018 varies between 5 (Trappes) and 28 d (Munich; see legend in Fig. 15). At all three German stations, the defined concurrent conditions prevailed over an extraordinarily long period (Essen: 17 d including 3 skip days; Stuttgart: 21 d including 1 skip day; Munich 28 d including 3 skip days).
In order to assess the occurrence probability of long-duration CEs, we compare the CE duration for the 2018 thunderstorm episode with a frequency analysis of CEs between 1981 and 2017 (May–June; Fig. 15). In doing so, the different amount of a certain event persistence with the length n from the past between 1981 and 2017 are determined for each sounding station. Subsequently, the relative frequency of the event persistence n per station in Fig. 15 is determined by dividing the absolute number of event persistence by the total number of all events. For example, the total number of all events is approximately 100 for Trappes, Bordeaux, and Essen; approximately 150 for Stuttgart and Payerne; and approximately 200 for Munich and Vienna, reflecting the climatological distribution (north-to-south and west-to-east gradients) of atmospheric stability (Mohr and Kunz, 2013).
The exceptional nature of the atmospheric conditions in 2018 is supported by the fact that, for example, the maximum event persistence of 19 d between 1981 and 2017 (observed in Vienna) was exceeded in 2018 by two of the considered sounding stations (Stuttgart, Munich). Additionally, when examining the individual stations, it can be seen that the CE duration of 2018 at the stations Stuttgart, Essen, Munich, and Payerne have not been observed since 1981. The same applies to the Stuttgart sounding compared with the results in PIP16, where so far a maximum CE persistence of 16 d (1960–2014, but for the summer half-year) has been calculated. Furthermore, the relative frequency of CE at the other stations (Trappes, Bordeaux, Vienna) is also low (0.5 %–2 %).
4.3 Cut-off lows
In May and June, cut-off lows particularly affected southern Europe and the Mediterranean region. The highest frequency during the climatological period from 1981 to 2010 is found over Portugal and Turkey but with values of around 4 % (contour in Fig. 10b; cf. Nieto et al., 2007b; Wernli and Sprenger, 2007). This means that during a 22 d period (the same time horizon of the study period) in May and June an average of 0.9 d (4 % of 22 d) with PV cut-off can be expected. During the 2018 thunderstorm episode, the anomaly of the PV cut-off frequency from the climatological mean was exceptionally large with maximum values of around 40 % confined to northern Iberia and the Bay of Biscay in western Europe. This means that in 2018 a PV cut-off frequency was up to 10 times higher than the climatological mean, resulting in 9 additional days. The region of anomalous PV cut-off activity expands northward over the British Isles and the adjacent Atlantic Ocean and North Sea with an excess of 20 % (additional 4 d compared to climatological mean). In other regions, PV cut-off occurrence was similar to the climatological mean. As an orientation, note that the standard deviation of the cut-off low frequency between 1981 to 2010 (May–June) is 3 % over northern Iberia and the Bay of Biscay and between 1 % and 2 % over the British Isles (not shown). We conclude that the unusual blocking situation over Europe effectively caused cut-off formation on its upstream flank, which then supported a (synoptic) lifting mechanism – the third ingredient for thunderstorm development, together with instability and available moisture.
In this study, we investigated the synoptic characteristics of an unusual 3-week period of thunderstorm activity in central Europe in May–June 2018. Interestingly, atmospheric blocking was key to providing the large-scale setting conducive for convection in its vicinity. Because of the influence of large-scale mechanisms related to the block and affecting the entire continent, a very high number of thunderstorms affected large parts of western and central Europe during an unusually long period of 3 weeks. At the beginning of the thunderstorm period, southwesterly flow induced the advection of warm and moist air masses into central Europe. Several studies have identified such a flow as providing convection-favouring conditions in this region (e.g. van Delden, 2001; Kapsch et al., 2012; Mohr, 2013; Merino et al., 2014; Wapler and James, 2015; Nisi et al., 2016; Piper et al., 2019; Mohr et al., 2019). Subsequently, the low-pressure gradient associated with the blocking anticyclone over the (adjacent) European sector prevented a significant air mass change. Thus, moist and conditionally unstable stratified air masses were trapped in a stationary flow on the southern flank of high pressure for more than 3 weeks (and were re-circulated). A few authors have already identified atmospheric blocking as a relevant influencer for widespread thunderstorms. PIP16, for example, showed that the exceptional thunderstorm episode in 2016 in Germany was related to the sequence of Scandinavian and European blocking. Santos and Belo-Pereira (2019) identified a blocking-like dynamical structure in addition to a western European and a Scandinavian trough to be responsible for approximately three-quarters of all hail events across Portugal. By combining ERA-Interim reanalysis and lightning detections over a 14-year period, Mohr et al. (2019) found that the presence of a block over the Baltic Sea is frequently associated with increased odds of thunderstorm occurrence due to convection-favouring conditions on its western flank (southwesterly advection of warm, moist, and unstable air masses).
Upper-level cut-off lows or filaments of high PV that separate from the main PV cut-off were key in creating conditions conducive for convective activity on the mesoscale. Accompanying lifting provides a weak but persistent ascent, which serves to precondition the thermodynamic environment by adiabatic cooling, thereby increasing CAPE and reducing CIN (Markowski and Richardson, 2010). On several days during the peak thunderstorm activity, we found that the majority of thunderstorms (based on lightning detections) can be related to a PV cut-off. Lifting associated with these cut-offs prepared the atmosphere for convective initiation on the downstream flank. Note that the initiation processes themselves are typically associated with phenomena such as convergence lines, orographic lifting, thermally driven circulations, and boundary layer thermals (Markowski and Richardson, 2010). The large positive anomaly in PV cut-off frequency, which seems to be relevant for the exceptionally high number of thunderstorms during the study period, in turn was also related to atmospheric blocking. The latter repeatedly led to the elongation of troughs on its upstream flanks, which finally led to several cut-off lows. The general flow patterns consisting of this spatially extended ridge flanked by troughs persisted over a period of 3 weeks.
Heavy rain events are a result of continuously high rain rates, whereby the duration of an event is linked to its propagation speed and the size of the convective system (Doswell et al., 1996). In addition, a high concentration of water vapour at low levels in the presence of strong updrafts, high environmental relative humidity, and significant cloud depth below the freezing level contribute to maximize rain accumulations (Markowski and Richardson, 2010). Furthermore, weak vertical wind shear, which tends to be correlated with weak mid-tropospheric winds, reduces storm propagation speeds. Due to the low propagation speeds, which contribute to long rainfall duration during the thunderstorm episode in 2018, and high rain rates (60 mm h−1 continuously over 50 min), some of the thunderstorms were able to produce torrential amounts of rain locally. Furthermore, the stagnant flow at mid-tropospheric levels and thus the low vertical wind shear as a consequence of the blocking (cf. PIP16; Mohr et al., 2019) were also conducive and frequently prevented most thunderstorms from developing into organized systems such as large MCSs or supercells (see Weisman and Klemp, 1982; Doswell and Evans, 2003; Markowski and Richardson, 2010). Most of the thunderstorms formed as short-lived isolated cells or slow-moving multicellular clusters.
In our study, we investigated an exceptionally large number of thunderstorms in western and central Europe over a 3-week period, from mid-May to mid-June 2018, using a combination of observational data and model data to gain a more holistic view of the prevailing dynamical and thermodynamical conditions and the decisive trigger mechanisms for this unusual thunderstorm episode. Additional data over a climatological period helped to place the event in its historical context. The 2018 thunderstorm episode was exceptional in several respects: (i) the unusually large number of several thousand thunderstorms that caused more than 5 million lightning strikes (all types) in the study area, (ii) the combination of low stability (negative lifted index) and low wind speed at mid-tropospheric levels (≤5 m s−1 at some locations) that prevailed almost every day during the 22 d period, (iii) the large cut-off low frequency that contributed to convective initiation for the majority of convection development, and (iv) the high rainfall totals with several new records (e.g. Dietenhofen 86 mm (1 h)−1) mainly as a consequence of the low propagation speed of the storms in combination with high rain rates leading to several pluvial flash floods.
The other main conclusions drawn from our analyses are as follows.
-
Atmospheric blocking, albeit frequently associated with heatwaves and droughts, provided large-scale environmental conditions favouring convection in its vicinity when unstably stratified air masses are advected into Europe and/or become entrapped in stagnant flow.
-
In the present paper, blocking is accompanied by a high cut-off frequency on its upstream side, which together with filaments of high PV provided the mesoscale setting for deep moist convection. Compared to climatology, the number of cut-off lows in parts of the study area during the study period was up to 10 times higher.
-
The exceptional persistence of low stability combined with weak wind speed in the mid-troposphere prevailing over more than 3 weeks in some regions, especially in Germany and Austria, has never been observed during the past climatological period of 30 years. This situation was similar to the 2016 thunderstorm episode documented by PIP16 but with a much longer persistence.
-
Blocking often associated with low mid-tropospheric wind speeds or low wind shear (cf. Mohr et al., 2019) reduces the development in severe organized convective systems. However, because of the low propagation speed of the storms related to the low-pressure gradient within the block, torrential rainfall can occur on a local scale.
A growing understanding of the relationship between atmospheric blocking and deep moist convection can enhance – due to the associated persistence – the forecast horizon of thunderstorms on sub-seasonal timescales beyond the classical weather forecast timescale of a few days. This may, for example, help with disaster management, large outdoor activities, and the agriculture sector. It is only helpful, however, if blocked areas are correctly predicted. Recent studies show that this remains a challenge for present numerical weather prediction and climate models (Ferranti et al., 2015; Grams et al., 2018), which, for example, underestimate the blocking frequency in the Atlantic‐-European sector (Quinting and Vitart, 2019; Attinger et al., 2019).
In the future, we intend to statistically investigate some of this study’s results, such as the relationship between blocking, cut-off lows, air mass transport, and thunderstorm probability. Furthermore, we want to distinguish between different hazard types (hail, heavy rain, gusts) and associated types of thunderstorms and blocking regimes that reveal possible differences in atmospheric processes.
REGNIE (Rauthe et al., 2013), German precipitation data (DWD, 2018c), and 3D radar data used in this paper are freely available for research and the latter are only available upon request at DWD. Tracks of severe convective storms were calculated from the DWD radar data and are not freely available but can be made available on request to Michael Kunz for research purposes. Data from ECA&D can be downloaded via the project website (https://knmi-ecad-assets-prd.s3.amazonaws.com/download/ECA_blend_rr.zip, ECA&D, 2018); from Météo-France via https://donneespubliques.meteofrance.fr/?fond=rubrique&id_rubrique=26 (Météo-France, 2018); from MeteoSwiss via https://www.meteoswiss.admin.ch/home/services-and-publications/beratung-und-service/datenportal-fuer-lehre-und-forschung.html (MeteoSwiss, 2018); and from ZAMG via https://www.zamg.ac.at/cms/de/klima/produkte-und-services/daten-und-statistiken/messdaten (ZAMG, 2019). Sounding data are available from the Integrated Global Radiosonde Archive (https://www.ncdc.noaa.gov/data-access/weather-balloon/integrated-global-radiosonde-archive, NOAA, 2018) and data from the ESWD can be obtained via https://www.eswd.eu (ESSL, 2020; see terms and conditions for academic or commercial use). Lightning data are not freely available but can be requested from the Blitz-Informationsdienst von Siemens (http://blids.de, last access: 8 April 2020). ECMWF ERA-Interim reanalysis and operational analysis data are also available online via https://apps.ecmwf.int/datasets/data/interim-full-daily (ECMWF, 2019) and the TIGGE webpage (control forecast step 0; https://apps.ecmwf.int/datasets/data/tigge, ECMWF, 2018). The methods to detect cut-off lows based on these data are given in Wernli and Sprenger (2007) and Sprenger et al. (2017), and for weather regimes the methods are given in Grams et al. (2017).
A video supplement related to this paper is available from the Repository KITopen at: https://doi.org/10.5445/IR/1000118571 (Mohr, 2020a) and https://doi.org/10.5445/IR/1000118574 (Mohr, 2020b).
The supplement related to this article is available online at: https://doi.org/10.5194/wcd-1-325-2020-supplement.
All KIT authors jointly conceived the research questions of the study, continuously discussed the results, and wrote the text passages for their respective contribution. SM analysed the ESWD data and the environmental conditions during the thunderstorm episode (together with JWi) and in a historical context. In addition, SM wrote the introduction (together with CMG) and discussion (together with MK) and prepared the final version of the paper. JWi also described the synoptic overview and the rainfall statistics in 2018, which were produced by HJP. The return periods of rainfall were investigated by MK, who also examined the lightning data. Based on LAGRANTO, JFQ performed backward trajectory analysis. MS contributed the analyses of the storm track data (propagation speed of convective cells). RP generated the PV cut-off data, and its relationship to lightning activity was analysed by JWa and CMG. In addition, CMG contributed with the analysis of the weather regimes. Finally, all co-authors edited the final draft and provided substantial comments and constructive suggestions for scientific clarification and further improvements.
The authors declare that they have no conflict of interest.
The authors thank the various national weather service (DWD; MeteoSwiss; Météo-France; Royal Netherlands Meteorological Institute, KNMI; Zentralanstalt für Meteorologie und Geodynamik; ZAMG), the European Climate Assessment and Dataset (ECA&D) project, the Blitz-Informationsdienst von Siemens (BLIDS; namely Stephan Thern), the Integrated Global Radiosonde Archive (IGRA) and the European Severe Storms Laboratory (ESSL) for providing different observational datasets. In addition, we thank the European Centre for Medium-Range Weather Forecasts (ECMWF) for providing the operational analysis and the ERA-Interim reanalysis data. The data analysis and visualisation was partly done using the NCAR Command Language (UCAR/NCAR/CISL/VETS, 2019). Furthermore, we thank Michael Sprenger (ETH Zurich) for compiling the ERA-Interim PV cutoff climatology and Florian Ehmele (KIT) for the post-processing of the REGINE data (return periods). We acknowledge the constructive comments from the two anonymous reviewers, which helped to improve the quality of the paper.
Parts of this research (contributions of Christian M. Grams, Julian F. Quinting, Jan Wandel) have been supported by the Helmholtz Association as part of the Young Investigator Group “Sub-Seasonal Predictability: Understanding the Role of Diabatic Outflow” (SPREADOUT; grant no. VH-NG-1243).
This paper was edited by Martin Singh and reviewed by two anonymous referees.
Attinger, R., Keller, J. H., Köhler, M., Riboldi, J., and Grams, C. M.: Representation of atmospheric blocking in the new global non-hydrostatic weather prediction model ICON, Meteorol. Z., 28, 429–446, https://doi.org/10.1127/metz/2019/0967, 2019. a
Barriopedro, D., García-Herrera, R., Lupo, A. R., and Hernández, E.: A climatology of Northern Hemisphere blocking, J. Climate, 19, 1042–1063, https://doi.org/10.1175/JCLI3678.1, 2006. a
Barthlott, C., Schipper, J. W., Kalthoff, N., Adler, B., Kottmeier, C., Blyth, A., and Mobbs, S.: Model representation of boundary-layer convergence triggering deep convection over complex terrain: A case study from COPS, Atmos. Res., 95, 172–185, https://doi.org/10.1016/j.atmosres.2009.09.010, 2010. a
Bennett, L. J., Browning, K. A., Blyth, A. M., Parker, D. J., and Clark, P. A.: A review of the initiation of precipitating convection in the United Kingdom, Q. J. Roy. Meteor. Soc., 132, 1001–1020, https://doi.org/10.1256/qj.05.54, 2006. a
Bieli, M., Pfahl, S., and Wernli, H.: A Lagrangian investigation of hot and cold temperature extremes in Europe, Q. J. Roy. Meteor. Soc., 141, 98–108, https://doi.org/10.1002/qj.2339, 2015. a
Bronstert, A., Agarwal, A., Boessenkool, B., Crisologo, I., Fischer, M., Heistermann, M., Köhn-Reich, L., López-Tarazón, J. A., Moran, T., Ozturk, U., Reinhardt-Imjela, C., and Wendi, D.: Forensic hydro-meteorological analysis of an extreme flash flood: The 2016-05-29 event in Braunsbach, SW Germany, Sci. Total Environ., 630, 977–991, https://doi.org/10.1016/j.scitotenv.2018.02.241, 2018. a
Browning, K., Blyth, A., Clark, P., Corsmeier, U., Morcrette, C., Agnew, J., Bamber, D., Barthlott, C., Bennett, L., Beswick, K., Bitter, M., Bozier, K., Brooks, B., Collier, C., Cook, C., Davies, F., Deny, B., Feuerle, T., Forbes, R., Gaffard, C., Gray, M., Rolf Hankers, R., Hewison, T., Kalthoff, N., Khodayar, S., Kohler, M., Kottmeier, C., Kraut, S., Kunz, M., Ladd, D., Lenfant, J., Marsham, J., McGregor, J., Nicol, J., Norton, E., Parker, D., Perry, F., Ramatschi, M., Ricketts, H., Roberts, N., Russell, A., Schulz, H., Slack, E., Vaughan, G., Waight, J., Watson, R., Webb, A., and Wieser, A.: The Convective Storms Initiation Project, B. Am. Meteorol. Soc., 88, 1939–1955, https://doi.org/10.1175/BAMS-88-12-1939, 2007. a, b
Corfidi, S. F.: Cold pools and MCS propagation: Forecasting the motion of downwind-developing MCSs, Weather Forecast., 18, 997–1017, https://doi.org/10.1175/1520-0434(2003)018<0997:CPAMPF>2.0.CO;2, 2003. a
Dee, D. P., Uppala, S. M., Simmons, A. J., Berrisford, P., Poli, P., Kobayashi, S., Andrae, U., Balmaseda, M. A., Balsamo, G., Bauer, P., Bechtold, P., Beljaars, A. C. M., Van De Berg, L., Bidlot, J., Bormann, N., Delsol, C., Dragani, R., Fuentes, M., Geer, A. J., Haimberger, L., Healy, S. B., Hersbach, H., Hólm, E. V., Isaksen, L., Kållberg, P., Köhler, M., Matricardi, M., Mcnally, A. P., Monge-Sanz, B. M., Morcrette, J. J., Park, B. K., Peubey, C., De Rosnay, P., Tavolato, C., Thépaut, J. N., and Vitartv, F.: The ERA-Interim reanalysis: Configuration and performance of the data assimilation system, Q. J. Roy. Meteor. Soc., 137, 553–597, https://doi.org/10.1002/qj.828, 2011. a
Dennis, E. J. and Kumjian, M. R.: The impact of vertical wind shear on hail growth in simulated supercells, J. Atmos. Sci., 74, 641–663, https://doi.org/10.1175/JAS-D-16-0066.1, 2017. a
Dole, R. M. and Gordon, N. D.: Persistent anomalies of the extratropical Northern Hemisphere wintertime circulation: Geographical distribution and regional persistence characteristics, Mon. Weather Rev., 111, 1567–1586, https://doi.org/10.1175/1520-0493(1983)111<1567:PAOTEN>2.0.CO;2, 1983. a
Doswell, C. A. and Evans, J. S.: Proximity sounding analysis for derechos and supercells: An assessment of similarities and differences, Atmos. Res., 67, 117–133, https://doi.org/10.1016/S0169-8095(03)00047-4, 2003. a
Doswell, C. A., Brooks, H. E., and Maddox, R. A.: Flash flood forecasting: An ingredients-based methodology, Weather Forecast., 11, 560–581, https://doi.org/10.1175/1520-0434(1996)011<0560:FFFAIB>2.0.CO;2, 1996. a
Dotzek, N., Groenemeijer, P., Feuerstein, B., and Holzer, A. M.: Overview of ESSL's severe convective storms research using the European Severe Weather Database ESWD, Atmos. Res., 93, 575–586, https://doi.org/10.1016/j.atmosres.2008.10.020, 2009. a, b
Drüe, C., Hauf, T., Finke, U., Keyn, S., and Kreyer, O.: Comparison of a SAFIR lightning detection network in northern Germany to the operational BLIDS network, J. Geophys. Res.-Atmos., 112, D18114, https://doi.org/10.1029/2006JD007680, 2007. a
Durre, I., Vose, R. S., and Wuertz, D. B.: Overview of the integrated global radiosonde archive, J. Climate, 1151, 53–68, https://doi.org/10.1175/JCLI3594.1, 2006. a
DWD: Schadensrückblick des Deutschen Wetterdienstes: Gefährliche Wetterereignisse und Wetterschäden in Deutschland 2018, Deutscher Wetterdienst (DWD), Offenbach, Germany, available at: https://www.dwd.de/DE/presse/pressemitteilungen/DE/2018/20181213_schadensrueckblick2018_news.html (last access: 6 March 2020), 2018a. a, b
DWD: REGNIE: Regionalisierte Niederschläge Verfahrensbeschreibung und Nutzeranleitung, Deutscher Wetterdienst (DWD), Abteilung Hydrometeorologie, Offenbach, Germany, available at: https://www.dwd.de/DE/leistungen/regnie/regnie.html?nn=353366 (last access: 13 December 2019), 2018b. a
DWD: Niederschlagsdaten, CDC – Climate Data Center, Deutsche Wetterdienst (DWD), Offenbach, Germany, available at: https://cdc.dwd.de/portal, last access: 29 November 2018c. a
DWD: RADOLAN/RADVOR: Hoch aufgelöste Niederschlagsanalyse und -vorhersage auf der Basis quantitativer Radar-und Ombrometerdaten für grenzüberschreitende Fluss-Einzugsgebiete von Deutschland im Echtzeitbetrieb – Beschreibung des Kompositformats Version 2.5, Tech. rep., Deutscher Wetterdienst (DWD): Abteilung Hydrometeorologie, Offenbach, Germany, available at: https://www.dwd.de/DE/leistungen/radolan/radolan.html (last access: 6 March 2020), 2019. a
ECA&D: European Climate Assessment & Dataset project, ECA&D Project Team, Royal Netherlands Meteorological Institute (KNMI), De Bilt, the Netherlands, available at: https://knmi-ecad-assets-prd.s3.amazonaws.com/download/ECA_blend_rr.zip, last access: 26 October 2018. a
ECMWF: TIGGE Data Retrieval, European Centre for Medium-Range Weather Forecasts (ECMWF), Reading, UK, available at: https://apps.ecmwf.int/datasets/data/tigge, last access: 13 November 2018. a
ECMWF: ERA-Interim reanalysis, European Centre for Medium-Range Weather Forecasts (ECMWF), Reading, UK, available at: https://apps.ecmwf.int/datasets/data/interim-full-daily, last access: 13 September 2019. a
Ehmele, F. and Kunz, M.: Flood-related extreme precipitation in southwestern Germany: development of a two-dimensional stochastic precipitation model, Hydrol. Earth Syst. Sci., 23, 1083–1102, https://doi.org/10.5194/hess-23-1083-2019, 2019. a
Enno, S.-E., Sugier, J., Alber, R., and Seltzer, M.: Lightning flash density in Europe based on 10 years of ATDnet data, Atmos. Res., 235, 104769, https://doi.org/10.1016/j.atmosres.2019.104769, 2020. a
ESSL: ESWD Event reporting criteria, Last revision: May 10, 2014, European Severe Storms Laboratory e.V., Munich, Germany, available at: https://www.eswd.eu/docs/ESWD_criteria_en.pdf (last access: 13 December 2019), 2014. a, b
ESSL: European Severe Weather Database (ESWD), European Severe Storms Laboratory (ESSL), Wessling, Germany, available at: https://www.eswd.eu, last access: 9 April 2020. a
Ferranti, L., Corti, S., and Janousek, M.: Flow-dependent verification of the ECMWF ensemble over the Euro-Atlantic sector, Q. J. Roy. Meteor. Soc., 141, 916–924, https://doi.org/10.1002/qj.2411, 2015. a, b
Galway, J. G.: The lifted index as a predictor of latent instability, B. Am. Meteorol. Soc., 37, 528–529, https://doi.org/10.1175/1520-0477-37.10.528, 1956. a
Grams, C. M., Binder, H., Pfahl, S., Piaget, N., and Wernli, H.: Atmospheric processes triggering the central European floods in June 2013, Nat. Hazards Earth Syst. Sci., 14, 1691–1702, https://doi.org/10.5194/nhess-14-1691-2014, 2014. a
Grams, C. M., Beerli, R., Pfenninger, S., Staffell, I., and Wernli, H.: Balancing Europe's wind-power output through spatial deployment informed by weather regimes, Nat. Clim. Change, 7, 557–562, https://doi.org/10.1038/nclimate3338, 2017. a, b, c
Grams, C. M., Magnusson, L., and Madonna, E.: An atmospheric dynamics perspective on the amplification and propagation of forecast error in numerical weather prediction models: A case study, Q. J. Roy. Meteor. Soc., 144, 2577–2591, https://doi.org/10.1002/qj.3353, 2018. a
Groenemeijer, P., Púčik, T., Holzer, A. M., Antonescu, B., Riemann-Campe, K., Schultz, D. M., Kühne, T., Feuerstein, B., Brooks, H. E., Doswell, C. A., Koppert, H.-J., and Sausen, R.: Severe convective storms in Europe: Ten years of research at the European Severe Storms Laboratory, B. Am. Meteorol. Soc., 98, 2641–2651, https://doi.org/10.1175/BAMS-D-16-0067.1, 2017. a, b
Gumbel, E. J.: Statistics of Extremes, Columbia University Press, New York, USA, 1958. a
Haklander, A. J. and van Delden, A.: Thunderstorm predictors and their forecast skill for the Netherlands, Atmos. Res., 67–68, 273–299, https://doi.org/10.1016/S0169-8095(03)00056-5, 2003. a, b
Handwerker, J.: Cell tracking with TRACE3D – A new algorithm, Atmos. Res., 61, 15–34, https://doi.org/10.1016/S0169-8095(01)00100-4, 2002. a
Hoskins, B. J., McIntyre, M. E., and Robertson, A. W.: On the use and significance of isentropic potential vorticity maps, Q. J. Roy. Meteor. Soc., 111, 877–946, https://doi.org/10.1002/qj.49711147002, 1985. a
Houston, A. L. and Wilhelmson, R. B.: The impact of airmass boundaries on the propagation of deep convection: A modeling-based study in a high-CAPE, low-shear environment, Mon. Weather Rev., 140, 167–183, https://doi.org/10.1175/MWR-D-10-05033.1, 2012. a
Huntrieser, H., Schiesser, H. H., Schmid, W., and Waldvogl, A.: Comparison of traditional and newly developed thunderstorm indices for Switzerland, Weather Forecast., 12, 108–125, https://doi.org/10.1175/1520-0434(1997)012<0108:COTAND>2.0.CO;2, 1997. a
Johns, R. H. and Doswell, C. A.: Severe local storms forecasting, Weather Forecast., 7, 588–612, https://doi.org/10.1175/1520-0434(1992)007<0588:SLSF>2.0.CO;2, 1992. a
Kapsch, M. L., Kunz, M., Vitolo, R., and Economou, T.: Long-term trends of hail-related weather types in an ensemble of regional climate models using a Bayesian approach, J. Geophys. Res., 117, D15107, https://doi.org/10.1029/2011JD017185, 2012. a
Klein Tank, A. M. G., Wijngaard, J. B., Können, G. P., Böhm, R., Demarée, G., Gocheva, A., Mileta, M., Pashiardis, S., Hejkrlik, L., Kern-Hansen, C., Heino, R., Bessemoulin, P., Müller-Westermeier, G., Tzanakou, M., Szalai, S., Pálsdóttir, T., Fitzgerald, D., Rubin, S., Capaldo, M., Maugeri, M., Leitass, A., Bukantis, A., Aberfeld, R., van Engelen, A. F. V., Forland, E., Mietus, M., Coelho, F., Mares, C., Razuvaev, V., Nieplova, E., Cegnar, T., Antonio López, J. A., Dahlström, B., Moberg, A., Kirchhofer, W., Ceylan, A., Pachaliuk, O., Alexander, L. V., and Petrovic, P.: Daily dataset of 20th-century surface air temperature and precipitation series for the European climate assessment, Int. J. Climatol., 22, 1441–1453, https://doi.org/10.1002/joc.773, 2002. a
Kunz, M.: The skill of convective parameters and indices to predict isolated and severe thunderstorms, Nat. Hazards Earth Syst. Sci., 7, 327–342, https://doi.org/10.5194/nhess-7-327-2007, 2007. a, b
Kunz, M., Wandel, J., Fluck, E., Baumstark, S., Mohr, S., and Schemm, S.: Ambient conditions prevailing during hail events in central Europe, Nat. Hazards Earth Syst. Sci., 20, 1867–1887, https://doi.org/10.5194/nhess-20-1867-2020, 2020. a, b
Lenggenhager, S. and Martius, O.: Atmospheric blocks modulate the odds of heavy precipitation events in Europe, Clim. Dynam., 53, 4155–4171, https://doi.org/10.1007/s00382-019-04779-0, 2019. a
Lenggenhager, S., Croci-Maspoli, M., Brönnimann, S., and Martius, O.: On the dynamical coupling between atmospheric blocks and heavy precipitation events: A discussion of the southern Alpine flood in October 2000, Q. J. Roy. Meteor. Soc., 145, 530–545, https://doi.org/10.1002/qj.3449, 2018. a
Manzato, A.: A climatology of instability indices derived from Friuli Venezia Giulia soundings, using three different methods, Atmos. Res., 67, 417–454, https://doi.org/10.1016/S0169-8095(03)00058-9, 2003. a, b
Markowski, P. and Richardson, Y.: Mesoscale meteorology in midlatitudes, John Wiley & Sons, Chichester, UK, 2010. a, b, c, d, e
Martius, O., Sodemann, H., Joos, H., Pfahl, S., Winschall, A., Croci-Maspoli, M., Graf, M., Madonna, E., Mueller, B., Schemm, S., Sedlacek, J., Sprenger, M., and Wernli, H.: The role of upper-level dynamics and surface processes for the Pakistan flood of July 2010, Q. J. Roy. Meteor. Soc., 139, 1780–1797, https://doi.org/10.1002/qj.2082, 2013. a
Merino, A., Wu, X., Gascón, E., Berthet, C., García-Ortega, E., and Dessens, J.: Hailstorms in southwestern France: Incidence and atmospheric characterization, Atmos. Res., 140–141, 61–75, https://doi.org/10.1016/j.atmosres.2014.01.015, 2014. a
Météo-France: Observations In situ, Météo-France, Saint-Mandé CEDEX, France, available at: https://donneespubliques.meteofrance.fr/?fond=rubrique&id_rubrique=26, last access: 8 November 2018. a
MeteoSwiss: Bodenstationsdaten der MeteoSchweiz, MeteoSwiss, Zurich-Airport, Switzerland, available at: https://www.meteoswiss.admin.ch/home/services-and-publications/beratung-und-service/datenportal-fuer-lehre-und-forschung.html, last access: 7 November 2018. a
Michel, C. and Rivière, G.: The link between Rossby wave breakings and weather regime transitions, J. Atmos. Sci., 68, 1730–1748, https://doi.org/10.1175/2011JAS3635.1, 2011. a
Michelangeli, P.-A., Vautard, R., and Legras, B.: Weather regimes: Recurrence and quasi stationarity, J. Atmos. Sci., 52, 1237–1256, https://doi.org/10.1175/1520-0469(1995)052<1237:WRRAQS>2.0.CO;2, 1995. a
Mohr, S.: Änderung des Gewitter- und Hagelpotentials im Klimawandel, PhD thesis, Wiss. Berichte d. Instituts für Meteorologie und Klimaforschung des Karlsruher Instituts für Technologie, Vol. 58, KIT Scientific Publishing, Karlsruhe, Germany, https://doi.org/10.5445/KSP/1000033828, 2013. a
Mohr, S.: Video supplement: Animated 2D radar reflectivity of the German Weather Service (DWD) for 27 May 2018, Repository KITopen, Karlsruhe Institute of Technology (KIT), Karlsruhe, Germany, https://doi.org/10.5445/IR/1000118571, 2020a. a
Mohr, S.: Video supplement: Animated 2D radar reflectivity of the German Weather Service (DWD) for 31 May 2018, Repository KITopen, Karlsruhe Institute of Technology (KIT), Karlsruhe, Germany, https://doi.org/10.5445/IR/1000118574, 2020b. a
Mohr, S. and Kunz, M.: Recent trends and variabilities of convective parameters relevant for hail events in Germany and Europe, Atmos. Res., 123, 211–228, https://doi.org/10.1016/j.atmosres.2012.05.016, 2013. a, b, c
Mohr, S., Wandel, J., Lenggenhager, S., and Martius, O.: Relationship between atmospheric blocking and warm season thunderstorms over western and central Europe, Q. J. Roy. Meteor. Soc., 145, 3040–3056, https://doi.org/10.1002/qj.3603, 2019. a, b, c, d, e
Morcrette, C., Lean, H., Browning, K., Nicol, J., Roberts, N., Clark, P., Russell, A., and Blyth, A.: Combination of mesoscale and synoptic mechanisms for triggering an isolated thunderstorm: Observational case study of CSIP IOP 1, Mon. Weather Rev., 135, 3728–3749, https://doi.org/10.1175/2007MWR2067.1, 2007. a
Munich Re: Natural catastrophe statistics online – the new NatCatSERVICE analysis tool, Munich Re, Munich, Germany, available at: https://www.munichre.com/en/reinsurance/business/non-life/natcatservice/index.html, last access: 13 December 2019. a
Nachtnebel, H.-P.: New strategies for flood risk management after the catastrophic flood in 2002 in Europe, Third DPRI-IIASA International Symposium on Integrated Disaster Risk Management: Coping with Regional Vulnerability, Full Conference Proceedings; 3–5 July 2003, Kyoto, Japan, 2003. a
Nieto, R., Gimeno, L., Añel, J. A., De la Torre, L., Gallego, D., Barriopedro, D., Gallego, M., Gordillo, A., Redaño, A., and Delgado, G.: Analysis of the precipitation and cloudiness associated with COLs occurrence in the Iberian Peninsula, Meteorol. Atmos. Phys., 96, 103–119, https://doi.org/10.1007/s00703-006-0223-6, 2007a. a
Nieto, R., Gimeno, L., De la Torre, L., Ribera, P., Barriopedro, D., García-Herrera, R., Serrano, A., Gordillo, A., Redano, A., and Lorente, J.: Interannual variability of cut-off low systems over the European sector: The role of blocking and the Northern Hemisphere circulation modes, Meteorol. Atmos. Phys., 96, 85–101, https://doi.org/10.1007/s00703-006-0222-7, 2007b. a
Nieto, R., Sprenger, M., Wernli, H., Trigo, R. M., and Gimeno, L.: Identification and climatology of cut-off lows near the tropopause, Ann. NY Acad. Sci., 1146, 256–290, https://doi.org/10.1196/annals.1446.016, 2008. a
Nisi, L., Martius, O., Hering, A., Kunz, M., and Germann, U.: Spatial and temporal distribution of hailstorms in the Alpine region: A long-term, high resolution, radar-based analysis, Q. J. Roy. Meteor. Soc., 142, 1590–1604, https://doi.org/10.1002/qj.2771, 2016. a
NOAA: Integrated Global Radiosonde Archive (IGRA), National Centers for Environmental Information (NCEI), National Oceanic and Atmospheric Administration (NOAA), Asheville, USA, available at: https://www.ncdc.noaa.gov/data-access/weather-balloon/integrated-global-radiosonde-archive, last access: 8 October 2018. a
Ozturk, U., Wendi, D., Crisologo, I., Riemer, A., Agarwal, A., Vogel, K., López-Tarazón, J. A., and Korup, O.: Rare flash floods and debris flows in southern Germany, Sci. Total Environ., 626, 941–952, https://doi.org/10.1016/j.scitotenv.2018.01.172, 2018. a
Pfahl, S. and Wernli, H.: Quantifying the relevance of atmospheric blocking for co-located temperature extremes in the Northern Hemisphere on (sub-)daily time scales, Geophys. Res. Lett., 39, L12807, https://doi.org/10.1029/2012GL052261, 2012a. a, b
Pfahl, S. and Wernli, H.: Quantifying the relevance of cyclones for precipitation extremes, J. Climate, 25, 6770–6780, https://doi.org/10.1175/JCLI-D-11-00705.1, 2012b. a
Piaget, N., Froidevaux, P., Giannakaki, P., Gierth, F., Martius, O., Riemer, M., Wolf, G., and Grams, C. M.: Dynamics of a local Alpine flooding event in October 2011: Moisture source and large-scale circulation, Q. J. Roy. Meteor. Soc., 141, 1922–1937, https://doi.org/10.1002/qj.2496, 2015. a
Piper, D. and Kunz, M.: Spatiotemporal variability of lightning activity in Europe and the relation to the North Atlantic Oscillation teleconnection pattern, Nat. Hazards Earth Syst. Sci., 17, 1319–1336, https://doi.org/10.5194/nhess-17-1319-2017, 2017. a
Piper, D., Kunz, M., Ehmele, F., Mohr, S., Mühr, B., Kron, A., and Daniell, J.: Exceptional sequence of severe thunderstorms and related flash floods in May and June 2016 in Germany – Part 1: Meteorological background, Nat. Hazards Earth Syst. Sci., 16, 2835–2850, https://doi.org/10.5194/nhess-16-2835-2016, 2016. a, b
Piper, D. A., Kunz, M., Allen, J. T., and Mohr, S.: Investigation of the temporal variability of thunderstorms in Central and Western Europe and the relation to large-scale flow and teleconnection patterns, Q. J. Roy. Meteor. Soc., 145, 3644–3666, https://doi.org/10.1002/qj.3647, 2019. a
Poelman, D. R., Schulz, W., Diendorfer, G., and Bernardi, M.: The European lightning location system EUCLID – Part 2: Observations, Nat. Hazards Earth Syst. Sci., 16, 607–616, https://doi.org/10.5194/nhess-16-607-2016, 2016. a
Portmann, R., Crezee, B., Quinting, J., and Wernli, H.: The complex life cycles of two long-lived potential vorticity cut-offs over Europe, Q. J. Roy. Meteor. Soc., 144, 701–719, https://doi.org/10.1002/qj.3239, 2018. a
Puskeiler, M., Kunz, M., and Schmidberger, M.: Hail statistics for Germany derived from single-polarization radar data, Atmos. Res., 178–179, 459–470, https://doi.org/10.1016/j.atmosres.2016.04.014, 2016. a
Quinting, J. F. and Vitart, F.: Representation of synoptic-scale Rossby wave packets and blocking in the S2S Prediction Project Database, Geophys. Res. Lett., 46, 1070–1078, https://doi.org/10.1029/2018GL081381, 2019. a
Rädler, A. T., Groenemeijer, P., Faust, E., and Sausen, R.: Detecting severe weather trends using an Additive Regressive Convective Hazard Model (AR-CHaMo), J. Appl. Meteorl. Clim., 57, 569–587, https://doi.org/10.1175/JAMC-D-17-0132.1, 2018. a
Rasmussen, P. F. and Gautam, N.: Alternative PWM-estimators of the Gumbel distribution, J. Hydrol., 280, 265–271, https://doi.org/10.1016/S0022-1694(03)00241-5, 2003. a
Rauthe, M., Steiner, H., Riediger, U., A., M., and Gratzki, A.: A Central European precipitation climatology – Part I: Generation and validation of a high-resolution gridded daily data set (HYRAS), Meteorol. Z., 22, 235–256, https://doi.org/10.1127/0941-2948/2013/0436, 2013. a, b, c
Rex, D. F.: Blocking action in the middle troposphere and its effect upon regional climate: I. An aerological study of blocking action, Tellus, 2, 196–211, https://doi.org/10.3402/tellusa.v2i3.8546, 1950a. a, b
Rex, D. F.: Blocking action in the middle troposphere and its effect upon regional climate: II. The climatology of blocking action, Tellus, 2, 275–301, https://doi.org/10.3402/tellusa.v2i4.8603, 1950b. a
Roberts, N. M.: The relationship between water vapour imagery and thunderstorms, Joint Centre for Mesoscale Meteorology Internal Report No. 110, Met Office, Reading, UK, 2000. a
Röthlisberger, M. and Martius, O.: Quantifying the local effect of Northern Hemisphere atmospheric blocks on the persistence of summer hot and dry spells, Geophys. Res. Lett., 43, 10101–10111, https://doi.org/10.1029/2019GL083745, 2019. a
Röthlisberger, M., Martius, O., and Wernli, H.: Northern Hemisphere Rossby wave initiation events on the extratropical jet – A climatological analysis, J. Climate, 31, 743–760, https://doi.org/10.1175/JCLI-D-17-0346.1, 2018. a
Russell, A., Vaughan, G., and Norton, E. G.: Large-scale potential vorticity anomalies and deep convection, Q. J. Roy. Meteor. Soc., 138, 1627–1639, https://doi.org/10.1002/qj.1875, 2012. a
Sánchez, J. L., Marcos, J. L., Dessens, J., López, L., Bustos, C., and García-Ortega, E.: Assessing sounding-derived parameters as storm predictors in different latitudes, Atmos. Res., 93, 446–456, https://doi.org/10.1016/j.atmosres.2008.11.006, 2009. a, b
Santos, J. A. and Belo-Pereira, M.: A comprehensive analysis of hail events in Portugal: Climatology and consistency with atmospheric circulation, Int. J. Climatol., 39, 188–205, https://doi.org/10.1002/joc.5794, 2019. a
Schaller, N., Sillmann, J., Anstey, J., Fischer, E. M., Grams, C. M., and Russo, S.: Influence of blocking on Northern European and Western Russian heatwaves in large climate model ensembles, Environ. Res. Lett., 13, 054015, https://doi.org/10.1088/1748-9326/aaba55, 2018. a
Schmidberger, M.: Hagelgefährdung und Hagelrisiko in Deutschland basierend auf einer Kombination von Radardaten und Versicherungsdaten, PhD thesis, Wiss. Berichte d. Instituts für Meteorologie und Klimaforschung des Karlsruher Instituts für Technologie, Vol. 78, KIT Scientific Publishing, Karlsruhe, Germany, https://doi.org/10.5445/KSP/1000086012, 2018. a
Schulz, W., Diendorfer, G., Pedeboy, S., and Poelman, D. R.: The European lightning location system EUCLID – Part 1: Performance analysis and validation, Nat. Hazards Earth Syst. Sci., 16, 595–605, https://doi.org/10.5194/nhess-16-595-2016, 2016. a
Sivapalan, M. and Blöschl, G.: Transformation of point rainfall to areal rainfall: Intensity-duration-frequency curves, J. Hydrol., 204, 150–167, https://doi.org/10.1016/S0022-1694(03)00241-5, 1998. a
Sousa, P. M., Trigo, R. M., Barriopedro, D., Soares, P. M. M., Ramos, A. M., and Liberato, M. L. R.: Responses of European precipitation distributions and regimes to different blocking locations, Clim. Dynam., 48, 1141–1160, https://doi.org/10.1007/s00382-016-3132-5, 2017. a
Sprenger, M. and Wernli, H.: The LAGRANTO Lagrangian analysis tool – version 2.0, Geosci. Model Dev., 8, 2569–2586, https://doi.org/10.5194/gmd-8-2569-2015, 2015. a
Sprenger, M., Fragkoulidis, G., Binder, H., Croci-Maspoli, M., Graf, P., Grams, C. M., Knippertz, P., Madonna, E., Schemm, S., Škerlak, B., and Wernli, H.: Global climatologies of Eulerian and Lagrangian flow features based on ERA-Interim, B. Am. Meteorol. Soc., 98, 1739–1748, https://doi.org/10.1175/BAMS-D-15-00299.1, 2017. a, b
Tarabukina, L. D., Antokhina, O. Y., Kononova, N. K., Kozlov, V. I., and Innokentiev, D. E.: Formation of intense thunderstorms in Yakutia in periods of frequent atmospheric blocking in Western Siberia, IOP Conf. Ser.: Mater. Sci. Eng., 698, 044050, https://doi.org/10.1088/1757-899x/698/4/044050, 2019. a
Thompson, R. L., Mead, C. M., and Edwards, R.: Effective storm-relative helicity and bulk shear in supercell thunderstorm environments, Weather Forecast., 22, 102–115, https://doi.org/10.1175/WAF969.1, 2007. a, b
Tibaldi, S. and Molteni, F.: On the operational predictability of blocking, Tellus A, 42, 343–365, https://doi.org/10.1034/j.1600-0870.1990.t01-2-00003.x, 1990. a
Trapp, R. J.: Mesoscale-convective processes in the atmosphere, Cambridge University Press, New York, USA, 2013. a
UCAR/NCAR/CISL/VETS: The NCAR Command Language (Version 6.6.2), Software, Boulder, Colorado, USA, https://doi.org/10.5065/D6WD3XH5, 2019. a
van Delden, A.: The synoptic setting of thunderstorms in Western Europe, Atmos. Res., 56, 89–110, https://doi.org/10.1016/S0169-8095(00)00092-2, 2001. a
van den Besselaar, E. J. M., Klein Tank, A. M. G., and Buishand, T. A.: Trends in European precipitation extremes over 1951–2010, Int. J. Climatol., 33, 2682–2689, https://doi.org/10.1002/joc.3619, 2013. a
Vautard, R.: Multiple weather regimes over the North Atlantic: Analysis of precursors and successors, Mon. Weather Rev., 118, 2056–2081, https://doi.org/10.1175/1520-0493(1990)118<2056:MWROTN>2.0.CO;2, 1990. a
Wapler, K.: High-resolution climatology of lightning characteristics within Central Europe, Meteorol. Atmos. Phys., 122, 175–184, https://doi.org/10.1007/s00703-013-0285-1, 2013. a
Wapler, K. and James, P.: Thunderstorm occurrence and characteristics in Central Europe under different synoptic conditions, Atmos. Res., 158, 231–244, https://doi.org/10.1016/j.atmosres.2014.07.011, 2015. a
Weisman, M. L. and Klemp, J. B.: The dependence of numerically simulated convective storms on vertical wind shear and buoyancy, Mon. Weather Rev., 110, 504–520, https://doi.org/10.1175/1520-0493(1982)110<0504:TDONSC>2.0.CO;2, 1982. a, b
Wernli, H. and Davies, H. C.: A Lagrangian-based analysis of extratropical cyclones. I: The method and some applications, Q. J. Roy. Meteor. Soc., 123, 467–489, https://doi.org/10.1002/qj.49712353811, 1997. a
Wernli, H. and Sprenger, M.: Identification and ERA-15 climatology of potential vorticity streamers and cutoffs near the extratropical tropopause, J. Atmos. Sci., 64, 1569–1586, https://doi.org/10.1175/JAS3912.1, 2007. a, b, c, d
Westermayer, A. T., Groenemeijer, P., Pistotnik, G., Sausen, R., and Faust, E.: Identification of favorable environments for thunderstorms in reanalysis data, Meteorol. Z., 26, 59–70, https://doi.org/10.1127/metz/2016/0754, 2017. a
WetterOnline: Tornado wütet bei Viersen: Dutzende Häuser stark beschädigt (17.05.2018), WetterOnline Meteorologische Dienstleistungen GmbH, Bonn, Germany, available at: https://www.wetteronline.de/extremwetter/tornado-wuetet-bei-viersen-dutzende-haeuser-stark-beschaedigt-2018-05-17-tv (last access: 13 March 2020), 2018a. a
WetterOnline: Unwetterserie Ende Mai: Ganze Ortschaften verwüstet, WetterOnline Meteorologische Dienstleistungen GmbH, Bonn, Germany, available at: https://www.wetteronline.de/extremwetter/unwetterserie-ende-mai-ganze-ortschaften-verwuestet-2018-05-31-us (last access: 13 March 2020), 2018b. a, b
WetterOnline: Unwetterserie im Juni: Überflutungen und Hagelmassen (14.06.2018), WetterOnline Meteorologische Dienstleistungen GmbH, Bonn, Germany, available at: https://www.wetteronline.de/extremwetter/unwetterserie-im-juni-ueberflutungen-und-hagelmassen-2018-06-14-js (last access: 13 March 2020), 2018c. a
Wilks, D. S.: Statistical methods in the atmospheric sciences: An introduction, 2nd edn., Academie Press, Elsevier, Burlington, USA, 2006. a, b
Wilson, J. W. and Schreiber, W. E.: Initiation of convective storms at radar-observed boundary-layer convergence lines, Mon. Weather Rev., 114, 2516–2536, https://doi.org/10.1175/1520-0493(1986)114<2516:IOCSAR>2.0.CO;2, 1986. a
Woollings, T., Barriopedro, D., Methven, J., Son, S.-W., Martius, O., Harvey, B., Sillmann, J., Lupo, A. R., and Seneviratne, S.: Blocking and its response to climate change, Curr. Clim. Change Rep., 4, 287–300, https://doi.org/10.1007/s40641-018-0108-z, 2018. a
Wussow, G.: Untere Grenzwerte dichter Regenfälle, Meteorol. Z., 39, 173–178, 1922. a
ZAMG: Messdaten, Zentralanstalt für Meteorologie und Geodynamik (ZAMG), Vienna, Austria, available at: https://www.zamg.ac.at/cms/de/klima/produkte-und-services/daten-und-statistiken/messdaten, last access: 25 January 2019. a