the Creative Commons Attribution 4.0 License.
the Creative Commons Attribution 4.0 License.
 | 04 Sep 2020
An attempt to explain recent changes in European snowfall extremes
Davide Faranda
The goal of this work is to investigate and explain recent changes in total and maximum yearly snowfall from daily data in light of current global warming or the interdecadal variability of atmospheric circulation. We focus on the period 1979–2018 and compare two different datasets: the ERA5 reanalysis data and the E-OBSv20.0 data, where snowfall is identified from rainfall by applying a threshold to temperature. We compute changes as differences from quantities computed for the periods 1999–2018 and 1979–1998. On the one hand, we show that the decline in average snowfall observed in almost all European regions is coherent with previous findings and can be linked to global warming. On the other hand, we observe contrasting changes in maxima and sometimes disagreement in the sign of changes in the two datasets. Coherent positive trends are found for a few countries in the Balkans. These have been investigated in details by looking at modifications in the atmospheric weather patterns as well as local thermodynamic factors concurring to large snowfall events. We link these changes to the stronger prevalence of Atlantic Ridge or blocking patterns associated with deeper cyclonic structures over the Adriatic and Tyrrhenian seas. These cyclones find warmer surfaces and large availability of humidity and convective available potential energy (CAPE), thus producing large snowfall amounts, enhanced by the Stau effect on the Balkan topography.
- Article
(2075 KB) - Full-text XML
- BibTeX
- EndNote


Heavy snowfalls can have a great impact on economy and society. In January 2017, a cold spell affected most of eastern and central Europe and part of southern Europe, causing the death of at least 60 people. The combination of snowfalls with a series of earthquakes in central Italy caused a disastrous avalanche that hit the town of Rigopiano in Abruzzo, where a landslide swept and destroyed a hotel, causing several casualties (Frigo et al., 2018). On 8 January, accumulations of 22–23 cm have been measured at some points on the beach of Porto Cesareo, in Apulia. Inland, snow reached and exceeded 2 m in height in the Apennines. Two further recent examples of snowfalls affecting large populated areas are the February–March 2012 snowstorm in northern Italy, with up to 50 cm of snowfall measured in Bologna (Bisci et al., 2012), and the winter 2018 snowstorm Emma, which affected the UK with up to 40 cm of snowfall in Wales and the disruption of air and rail transportation in the London, Manchester and Liverpool areas (Tonks, 2018).
Besides their cost in terms of societal and economical impacts, these extreme events are often invoked by climate change denial groups to mystify the public opinion (Revkin, 2008), and it is therefore important to understand why, in an undeniable context of climate change, we do not observe a sharp decrease in their frequency and intensity. Indeed, although global temperature rise has driven an overall decrease in average snowfall in past decades (Déry and Brown, 2007), and this decreasing trend is expected to continue in future “business-as-usual” emission scenarios (Brutel-Vuilmet et al., 2013), it is not clear whether the same conclusions hold for extreme snowfall events. Atmospheric extreme weather events do not always have a trivial relation with average global warming (Murray and Ebi, 2012). The goal of this paper is to shed light on recent changes in the dynamics of extreme snowfalls by projecting the recent changes in frequency and intensity of extreme snowfalls on the large-scale (synoptic) dynamical drivers and identifying possible small-scale convective thermodynamic feedback.
The focus of this study is to understand changes in daily heavy snowfalls at the scale of European regions and countries. Daily extreme snowfalls result from the interplay of both dynamical and thermodynamic factors acting at different spatial scales and timescales: at local (few kilometers, few hours) scales, geographical features and convection may enhance snowfall precipitation. Persistence of convective snowfalls for several hours in the same region can provide large snowfall amounts detectable at daily timescales. At synoptic scales, snowfalls are driven by extratropical cyclones (∼1000 km, 2–6 d) traveling southwards in jet stream meanders formed by the disruption of the normal westerly flow (Tibaldi and Buzzi, 1983; Barnes et al., 2014; Lehmann and Coumou, 2015). Oscillations of the jet stream are associated with low-frequency variability of weather patterns that can modulate daily synoptic fields and snowfall events (Wallace and Hobbs, 2006). These conditions create a dipole consisting of high-pressure structures over some regions and low-pressure systems (extratropical cyclones) traveling southward in other regions. The most common way to link low-frequency variability to weather phenomena is the computation of daily weather regimes (Vautard, 1990; Michelangeli et al., 1995). In Yiou and Nogaj (2004), first connections between extreme weather events and weather regimes have been established. Madonna et al. (2017) found a clear link between eddy-driven jet variability and weather regimes in the North Atlantic European sector. In winter, if blocking high pressure becomes established close to Greenland, cold air from polar latitudes can be advected towards western Europe (North Atlantic Oscillation negative phase; Cattiaux et al., 2010). When this weather pattern is associated with extratropical cyclones traveling southward from northern latitudes, extreme snowfalls over the UK, France, Benelux and the Iberian Peninsula are expected. If a high-pressure ridge (Atlantic Ridge) extends from the Azores islands towards the Icelandic region or the British isles, cold air coming from Russia or Scandinavia flows to the Mediterranean Sea. This can cause cyclogenesis in the Tyrrhenian (Genoa lows) and Adriatic seas, triggering extreme snowfalls over Italy, the Balkans, Greece and Turkey (Buehler et al., 2011).
When looking at long-term decadal trends in snowfalls, the analysis of weather patterns can provide important information to assess whether the changes in frequency and intensity are due to long-term variability of atmospheric circulation or induced by anthropogenic forcing (Strong et al., 2009; Overland and Wang, 2010; Woollings et al., 2010; Wu and Zhang, 2010; Deser et al., 2017). So far, it has been very difficult to prove any significant shift in the dynamical patterns observed at midlatitudes (Shepherd, 2014). On one side, Cohen et al. (2014) and Kim et al. (2014) showed that the recent increase in temperatures in the Arctic is associated with an amplification of planetary waves, affecting storm tracks and leading to enhanced winter conditions. On the other hand, several authors found a zonalization of the midlatitude flow (Lorenz and DeWeaver, 2007; Chen et al., 2016; Screen et al., 2014; Faranda et al., 2019) and a minimal or even undetectable effect of the Arctic sea ice on the meandering of the jet at midlatitudes (Blackport et al., 2019; Screen, 2017; Screen et al., 2018).
Although heavy snowfalls are driven by large-scale atmospheric circulation, their effects can be greatly enhanced by local geographic constraints and thermodynamic feedbacks (Lüthi et al., 2019; Bartolini, 2019). Local features like the Alps in Europe, the Great Lakes in the USA or the topography of Japanese islands may increase precipitation and provide relevant feedback to extreme snowfalls (Niziol et al., 1995). For Japan, Kawase et al. (2016) have shown that thermodynamic feedbacks from anthropogenic forcing may enhance extreme snowfalls in future climates via the interaction of the Japan Sea polar air mass convergence zone with the topography. Similar mechanisms also exist for the Mediterranean Sea, as recently detailed in D'Errico et al. (2020). The midtropospheric cold winter air advection associated with the synoptic patterns flows over the relatively warmer waters of the Mediterranean Sea and picks up water vapor from the water surface. This warmer and wetter air rises and cools as it moves away from the sea towards land areas, forming convective clouds that transform moisture into snow. In the mountainous topography of the European continent, this phenomenon can be extremely powerful in triggering heavy snowfalls (Beniston et al., 2018; Bartolini, 2019), even in future climate-warming scenarios (D'Errico et al., 2020). We also consider this effect in driving convection via the analysis of convective available potential energy (CAPE) patterns during extreme events.
The paper is organized as follows. In Sect. 2, we describe the datasets used in this study and the difficulties arising in assessing the quality of snow data. In Sect. 3 we compute the changes in snowfall extremes and discuss their consistency among the datasets. In Sect. 4 we focus on those countries showing an increase in maximum snowfall and explain these changes in light of the thermodynamics and the dynamics of the atmosphere at daily scales. Conclusions and limitations of this study are presented in Sect. 5.
Good-quality snow data at synoptic or regional scales are difficult to obtain (Rasmussen et al., 2012). From an observational point of view, quality observational datasets exist only at high mountain sites and in regions where snowfalls are recurrent phenomena. Excellent snow datasets exist for Scandinavian countries as well as for the Alpine regions (Auer et al., 2005; Scherrer and Appenzeller, 2006; Isotta et al., 2014). Our goal, however, is to study changes in snowfall at a European level, not limiting our analysis to mountain areas but also including those regions where these phenomena are rare. We therefore have to rely on reanalyses as well as on gridded observational data. In this study we analyze the period 1979–2018 and use a reanalysis product (European Centre for Medium-Range Weather Forecasts, ECMWF) 5th generation reanalysis product (ERA5) as well as a gridded-observation dataset (European Climate Assessment & Data E-OBSv20.0e). The reference dataset is ERA5 Hersbach et al. (2020), a very recent product by the ECMWF with high resolution (0.25∘ horizontal resolution) and accurate physical parametrizations. For the observations, we use E-OBSv20.0e (0.25∘ horizontal resolution), which contains gridded temperature and precipitation observations (Cornes et al., 2018).
Another problem in comparing snow data issued from different sources is the choice of the variable associated with precipitating snow (Nitu and Wong, 2010). Snow precipitation can be measured both as snowfall (SF) and from snow depth on the ground. Both the measurements have pros and cons. Snowfall is obtained by melting snow falling inside a heated rain gauge, and it is expressed in kilograms per square meter or centimeter. An advantage of using this variable is the accuracy of the measurement. For obvious reasons, SF is mostly used by hydrologists as it has a direct connection with runoff and river discharge. Since the snow is immediately transformed into water, SF does not distinguish between snowfalls which produce accumulations on the ground or not. Snow depth is a measure of the snow height on the ground, and it can be affected by several problems due to gravitational settling, wind packing, melting and recrystallization. In this paper we therefore use daily SF and express it in centimeters. We now explain how to get this quantity from the different datasets considered in this study.
-
For ERA5, we use the accumulated total snowfall that has fallen to the Earth's surface. This quantity consists of snow due to both the large-scale atmospheric flow and convective precipitation. It measures the total amount of water accumulated from the beginning of the forecast time to the end of the forecast step. The units given measure the depth the water would have if the snow were melted and spread evenly over the grid box. We get the snowfall from hourly data and construct the daily SF by summing up the snowfall in intervals of 24 h. We chose the ERA5 dataset as the preferential one for our study because of its physical consistency and the use of advanced assimilation techniques for its compilation.
-
For E-OBSv20.0e (25.375–75.375∘ N, 40.375∘ W–50∘ E) we use only land points; we do not dispose directly of snowfall data. We have to infer them from daily total precipitation and daily mean temperature data. We apply a simple algorithm which entails considering as SF all precipitation that occurred on days where the average temperature was below 2 ∘C. Of course with this method we can have false positive as well as false negative events, but we have verified (not shown) that results do not depend qualitatively on the threshold, provided that it is chosen between 0 and 2.5 ∘C. Since we use a threshold of 2 ∘C, some snowfall events occurring at higher temperatures will be discarded.
We now present the climatology for the two datasets used in this study and focus on two quantities: yearly total SF (average 1979–2018) in Fig. 1 and the maximum yearly SF from daily data (average 1979–2018) in Fig. 2. We show results at two different levels, taken from the 2016 nomenclature of territorial units for statistics (NUTS) of the European union at regional (NUTS-2) and national (NUTS-0) levels (European Commission, 2016). These subdivisions are commonly used by stakeholders to assess impacts of climate variables on economy and society and are the reference adopted by several climate services such as Copernicus for its products (see e.g., Brandmueller et al., 2017). Averaging from the grid cell size to regional or national scales gives us the possibility of exploring the robustness of our study to coarse-grain, and it also allows us to remove part of the variability encountered for precipitation data at grid-level scales caused by model or data issues (Li et al., 2011; Tabari et al., 2016; Herold et al., 2017). In Figs. 1–2, NUTS-2 results are represented in panels a and c) and NUTS-0 results in panels b and d). The agreement between the ERA5 and the E-OBSv20.0e dataset largely depends on the regions considered. Overall, the climatologies of snowfall provided by the two datasets have similar ranges, although ERA5 tends to overestimate E-OBSv20.0e. This confirms that converting precipitation to snowfall using a temperature threshold of 2 ∘C is a good option to retrieve snowfall data from E-OBSv20.0e. By analyzing the climatology, we remark that, at southern latitudes and on the plains, mean and max statistics tend to coincide because the number of snow days per year is limited, i.e., all snowfall is concentrated in one or few events. We can also observe from Fig. 2 that coarse-graining from NUTS-2 to the NUTS-0 level heavily reduces the magnitude of yearly maximum SF.
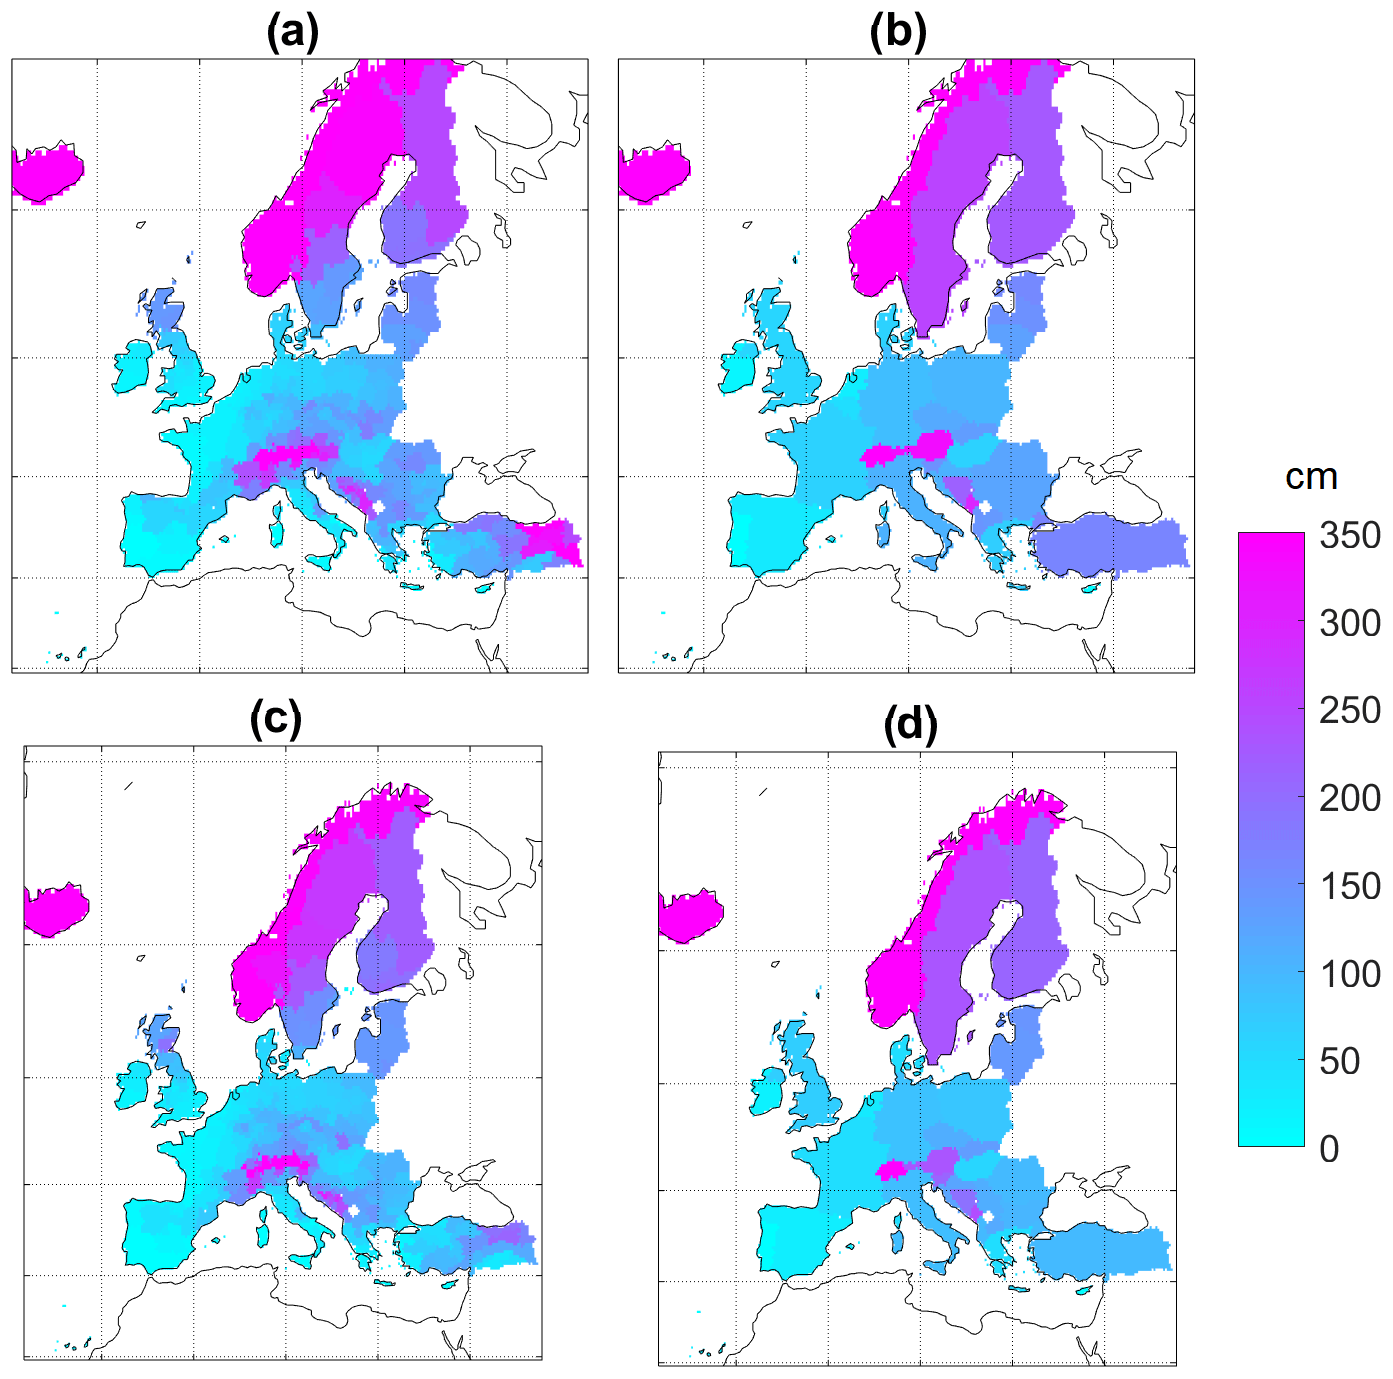
Figure 1Yearly total snowfall (SF; average 1979–2018) for the ERA5 (a, b) and the E-OBSv20.0e (c, d) datasets. (a, c) NUTS-0 level, (b, d) NUTS-2 level.
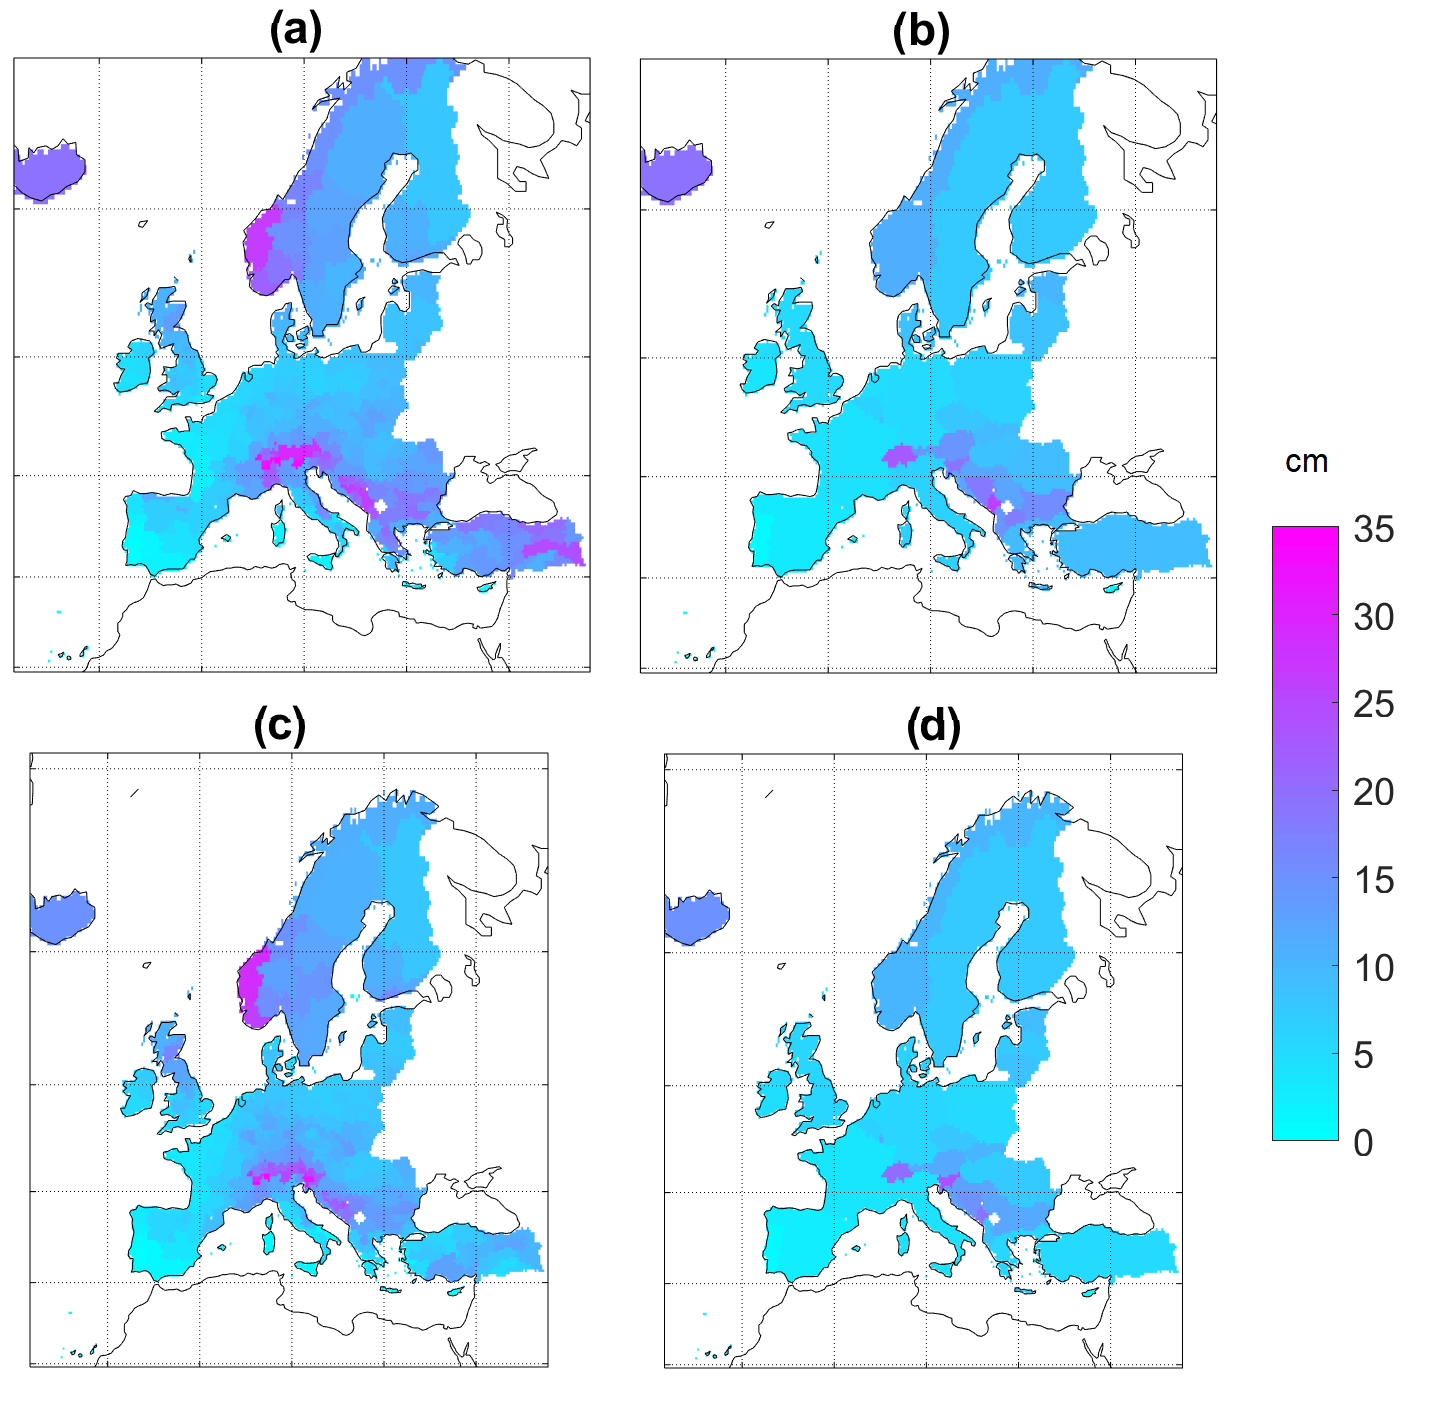
Figure 2Maximum yearly snowfall (SF; average 1979–2018) for the ERA5 (a, b) and the E-OBSv20.0e (c, d) datasets. (a,c) NUTS-0 level, (b, d) NUTS-2 level.
We now identify changes in snowfall as differences between average values of both yearly total SF and the maximum yearly SF for two different periods: 1979–1998 and 1999–2018. We subtract the first period from the second, so that positive changes correspond to an increase in snowfall and negative values to a decrease. To check the statistical significance of changes, we perform a two-sided T test with a confidence level of 0.05 (Rushton, 1952). For the yearly total SF of ERA5 (Fig. 3a, b), changes are negative for most of northern, central and eastern Europe, whereas near-zero changes are observed in western Europe. The largest negative changes are found to correspond with mountain ranges such as the Alps, the Balkans and the Scandinavian Mountains. This decrease in snowfall is significant (green shading) over most of the northern countries and the British Isles. When coarse-graining from NUTS-2 to the NUTS-0 level is applied, we can observe that positive changes tend to be averaged out, and significance of negative changes extends to almost all of northern Europe. The picture is similar for the E-OBSv20.0e dataset (Fig. 3c, d), with mountain regions and northern countries showing a large decrease in yearly total SF. Positive changes are found in the Balkans at the NUTS-2 scale, but they are partially averaged out when coarse-graining data to the NUTS-0 level (panel d). As for ERA5, negative trends are significant for Iceland, the United Kingdom, Finland, Latvia, Denmark, Italy, France and Turkey.
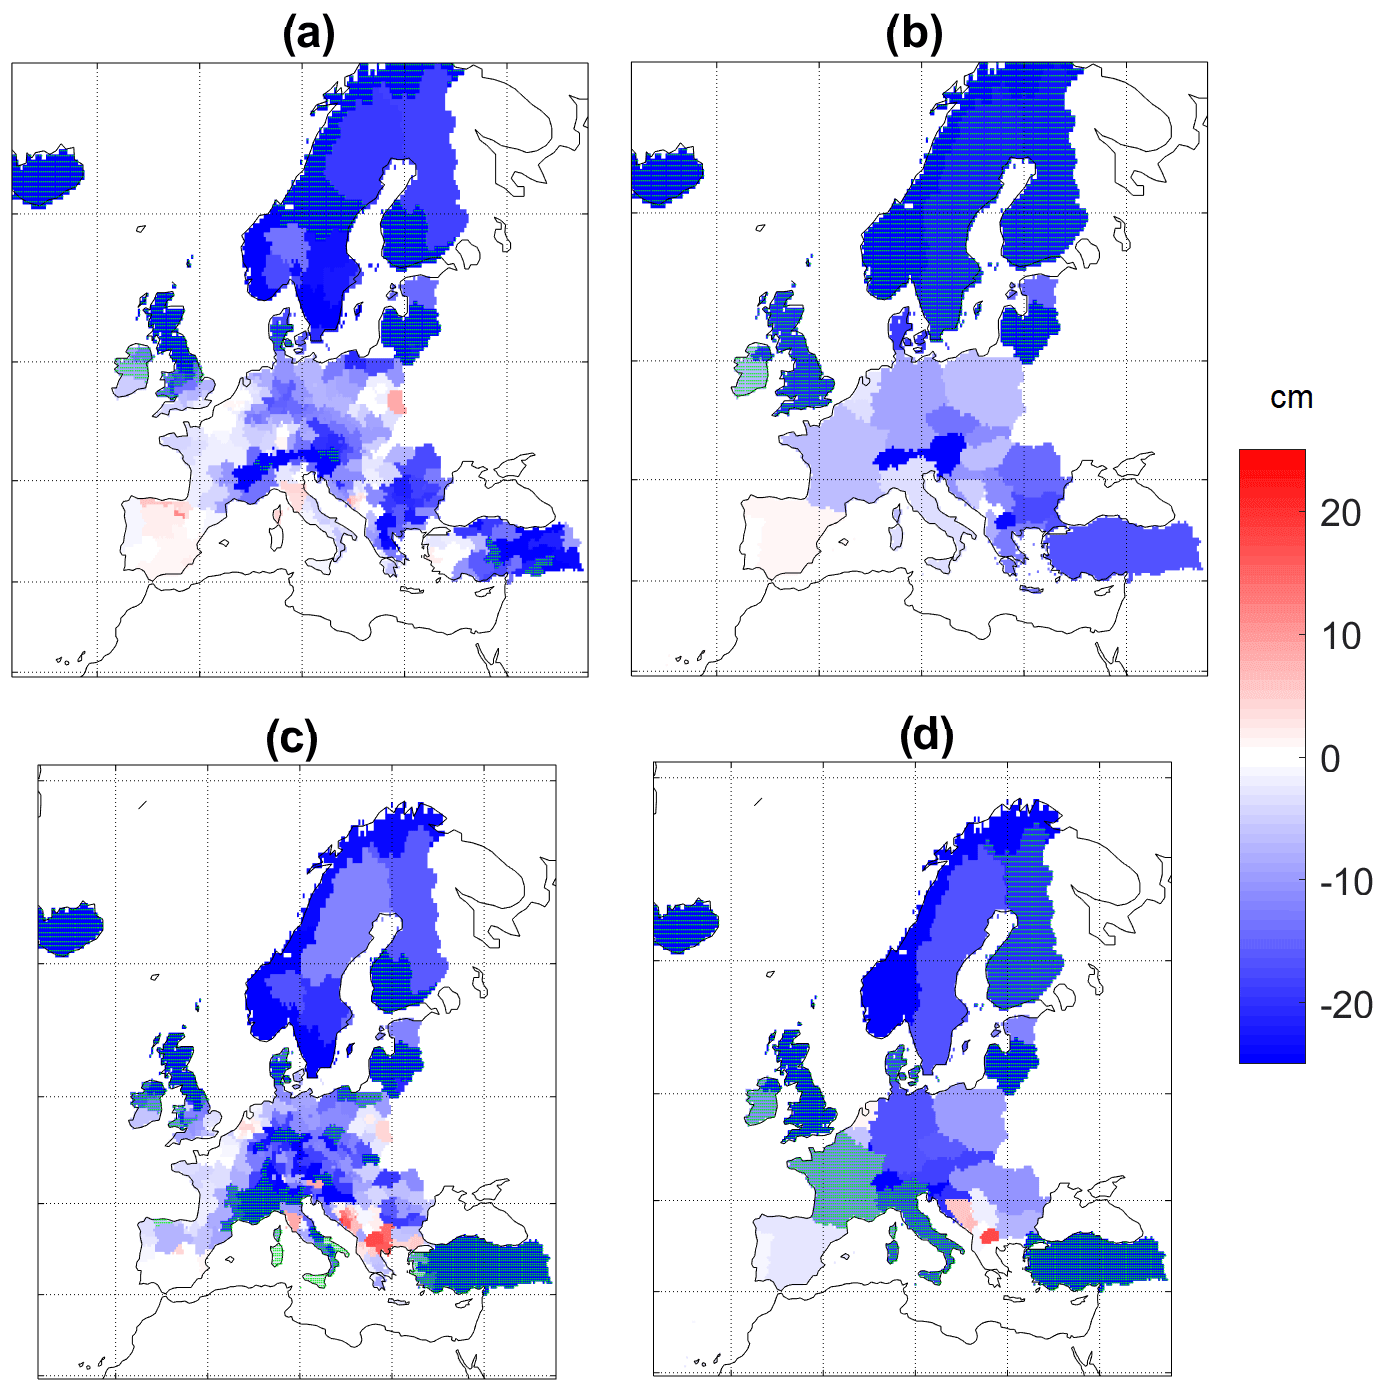
Figure 3Differences in yearly total snowfall (SF) for two periods (average 1979–1998 subtracted from average 1999–2018) for the ERA5 (a, b) and E-OBSv20.0e (c, d) datasets. (a, c) NUTS-0 level, (b, d) NUTS-2 level. Significant differences are shown in shaded green (two-sided T test, 5 % confidence level).
For the maximum yearly SF, differences observed are generally milder. Positive and negative changes are spatially scattered at the NUTS-2 level (Fig. 4a, c) for both of the datasets. There is however a certain agreement in maximum snowfall increase over eastern Europe and decrease over western Europe (excluding Spain) among the two datasets. The NUTS-0 level (Fig. 4b, d) provides a more coherent picture with western Europe, characterized by a decrease in maximum snowfall, and eastern Europe, where some countries show increasing maximum SF. The significance of changes is low and scattered spatially without a clear geographical coherence. Large differences between the two datasets are found for Switzerland, Greece and Turkey. In ERA5, trends are positive in Switzerland and Turkey (negative for Greece) and yield the opposite sign in the E-OBSv20.0e dataset. We can justify this difference for Greece and Switzerland using the data at the NUTS-2 level (Fig. 4a, c) as they show for regions within those two countries positive and negative differences. At the NUTS-0 level (Fig. 4b, d), the averaging procedure can therefore provide trends of different signs in E-OBSv20.0e and ERA5 datasets depending on the magnitude of local SF maxima. The positive trend in ERA5 for Switzerland is in contradiction with several other studies based on snow stations (see e.g., Scherrer et al., 2013; Marty and Blanchet, 2012). For Turkey, the differences between datasets are evident already at the NUTS-2 level and cannot be explained with the spatial averaging. A possible justification comes from the low coherence of the two datasets. This can be checked by computing two metrics (i) the symmetric percentage error , where x is the total average snowfall for each region, and (Fig. 5a, b), and (ii) the correlation coefficient R2 between the daily time series of accumulated snowfall of the two datasets (Fig. 5c, d). ς shows that ERA5 tends to overestimate snowfall with respect to E-OBS over southern Europe and underestimate over central Europe and the UK. Entire regions of Turkey, Portugal and southern Italy show a weak correlation R2∼0.3 between the two datasets, pointing to some problems in the data assimilation possibly due to scarce availability of good-quality meteorological data over those regions. Indeed the correlation coefficient is larger for northern European countries that dispose of high spatiotemporal data cover. The error ς decreases, and the correlation coefficient R2 increases when considering the NUTS-0 level since local differences are averaged out.

Figure 4Differences in maximum yearly snowfall (SF) for two periods (average 1979–1998 subtracted from average 1999–2018) for the ERA5 (a, b), E-OBSv20.0e (c, d) datasets. (a, c) NUTS-0 level, (b, d) NUTS-2 level. Significant differences are shown in shaded green (two-sided T test, 5 % confidence level).
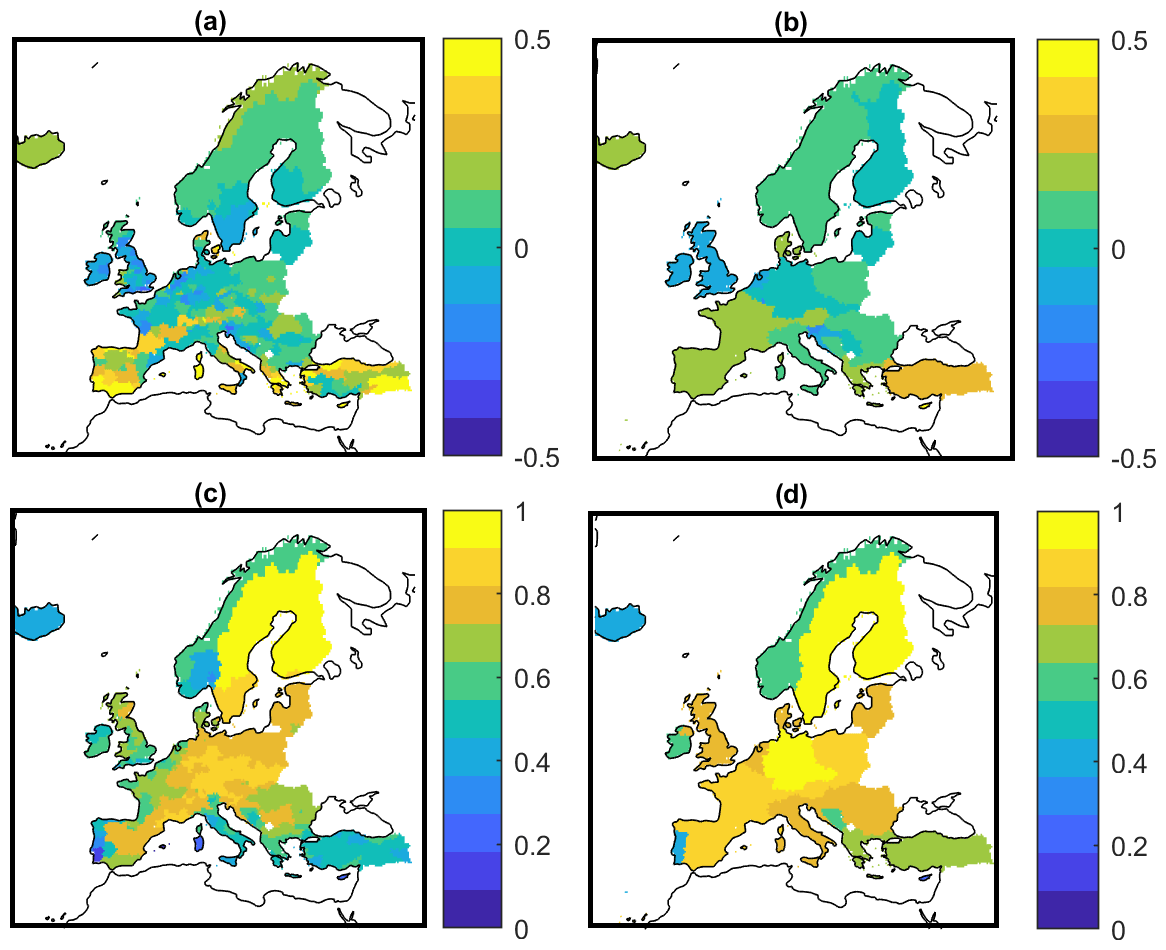
Figure 5(a, b) Symmetric percentage error ς on average snowfall (c, d) Correlation coefficient R2 for the SF daily snowfall time series for ERA5 and E-OBSv20.0e. (a, c) NUTS-2 level, (b, d) NUTS-0 level
The ensemble of these analyses suggests that whereas larger confidence can be attributed to a decrease in yearly snowfall over northern Europe, changes are more uncertain for maximum snowfall. For the maxima, some coherence appears at the country scale: negative changes over western Europe and positive ones in eastern Europe, specifically for some countries in the Balkans. The difference in the changes for the average and maxima suggests a nontrivial relation between the occurrence of extreme snowfalls and global mean warming. In order to explain such changes, we investigate the role of atmospheric circulation for the countries in the Balkans showing large positive maximum SF changes and with coherent trends between the two datasets considered.
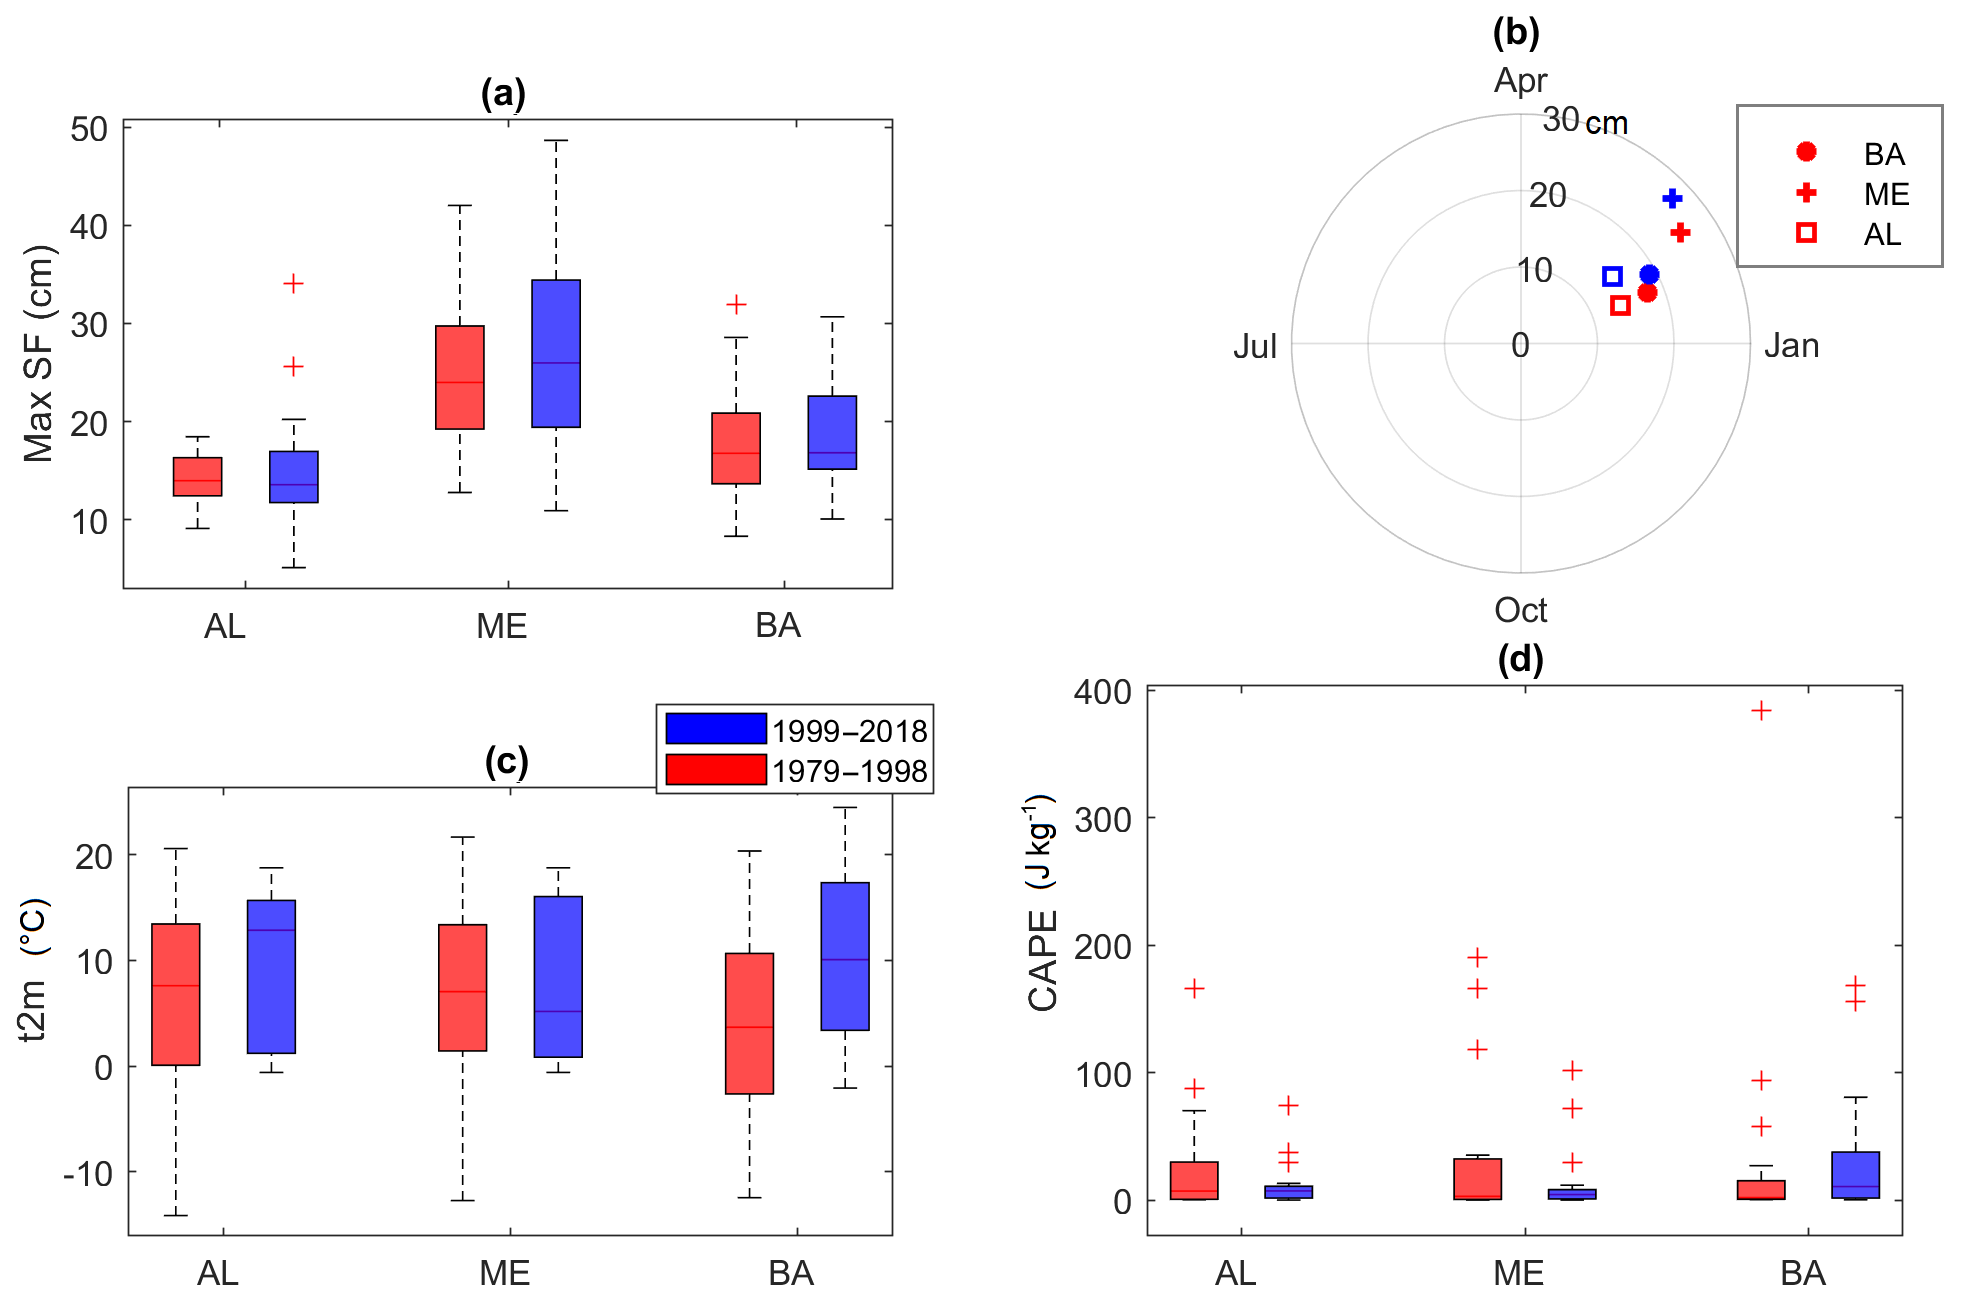
Figure 6(a) Box plots of the maxima yearly SF for two periods: 1979–1998 (red) and 1999–2018 (blue). (b) Seasonal analysis for maximum yearly SF. The polar plots show average maxima yearly snowfall for the two periods (different colors). Each symbol corresponds to a different country. The angle corresponds to a date of the year in a counterclockwise sense. Box plot of 2 m temperatures (t2m) (c) and CAPE (d) observed during extreme snowfall events. For box plots, on each box, the central mark indicates the median, and the bottom and top edges of the box indicate the 25th and 75th percentiles, respectively. The whiskers extend to the most extreme data points, and the outliers are plotted individually using the “+” symbol. Albania (AL), Montenegro (ME), Bosnia (BA).
The analysis of Figs. 2–3 suggests that changes for maximum snowfall are very scattered, and even adjacent regions can show changes of different signs. This makes the single-region analysis of trends almost meaningless as robust links between SF and large-scale fields are likely to be very weak. We therefore focus on the NUTS-0 positive trends of ERA5. We decided to use ERA5 because snowfalls are produced by the model underlying the reanalysis and naturally associated with coherent circulation patterns. We discard the E-OBSv20.0e dataset as it does not contain other atmospheric variables that could help in tracking the atmospheric thermodynamics or the large-scale atmospheric circulation. We identify the three countries showing coherent positive changes for both datasets, namely Albania (AL), Montenegro (ME) and Bosnia (BA). The countries selected in the Balkans are interesting because they also show positive or zero trends for total yearly SF in the ERA5 dataset. In this section we focus on the intensity of positive changes regardless of their significance. As pointed out by Altman and Krzywinski (2017), statistical testing based on p values presents several limitations and can produce misleading results even in designed experiments. Here, we privilege the physical complexity of the phenomenon as information about pure statistical significance has already been discussed in the previous section. In Fig. 6a we show the box plots of the yearly snowfall maxima organized in the two different periods (1979–1998 and 1999–2018) for the three regions identified. Box plots provide more detailed information on the nature of changes: whereas for Bosnia and Montenegro the bulk of the distribution shifts towards larger values in the second period, for Albania the increase in maximum snowfall is mostly due to two outliers, which occur at the end of the second period. For Albania and Montenegro the variability also increased in 1999–2018, while it is stationary for Bosnia.
The analysis presented in Fig. 6b aims to identify possible seasonal variations in extreme snowfalls. In the polar plot, the radius corresponds to the average magnitude and the angle to the date of the year of SF maxima. For the countries considered, there is a tendency to observe heavy snowfall later in the winter season, although the shift is rather modest.
To understand the nature of the changes, we analyze the synoptic environment associated with snowfall events from both a thermodynamic and dynamical point of view, analyzing indicators of stability of the atmosphere as well as circulation patterns (weather regimes) during the events.
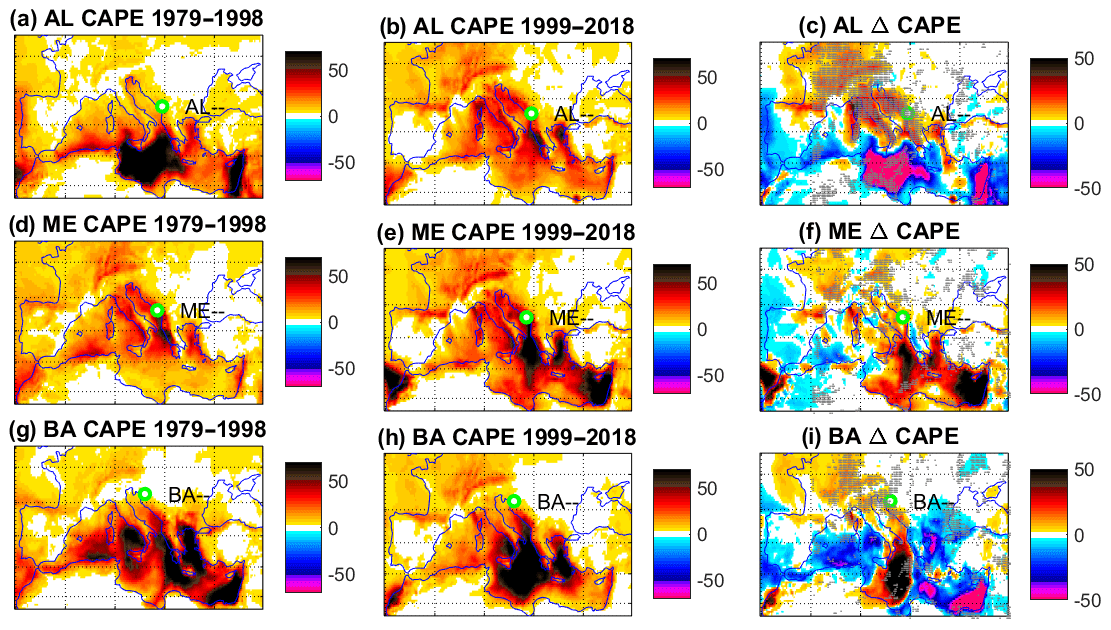
Figure 7Average of convective available potential energy (CAPE) fields (J kg−1) during days of yearly maximum snowfall for the periods 1979–1998 (a, d, g) and 1999–2018 (b, e, h). Panels (c), (f) and (i) show the differences between the second and the first periods (ΔCAPE). (a, b, c) Albania (AL), (d, e, f) Montenegro (ME), (g, h, i) Bosnia (BA). Green circles show the location of the northwesternmost point of each country. Shaded areas represent grid points where at least two-thirds of the anomalies have the same sign.
4.1 Thermodynamic changes
The first hypothesis to explain the occurrence of increasing heavy snowfalls despite the current global warming trends is that starker sea surface–troposphere temperature contrasts might enhance moisture uptake in combination with reduced stability that triggers ascending motions and local convergence during snowfall events. This possibility has been explored in other studies by looking at atmospheric stability and air–sea interaction during cold-air outbreaks, albeit for different regions (Papritz and Spengler, 2015, 2017; Czaja et al., 2019). Furthermore, in an event-based study of cold and snowy spells over Italy, D'Errico et al. (2020) link the recent enhancement in snowfalls in the Adriatic regions to the increase in convective precipitation from the Mediterranean Sea, which is warming faster than the oceans at the same latitudes because of its closed geometry (Gualdi et al., 2013). To explore this possibility, we look at changes in the stability of the flow during the maximum snowfalls using the 2 m temperatures (t2m; box plot in Fig. 6c) and the convective available potential energy (CAPE; box plot in Fig. 6d). The choice of CAPE as an indicator of stability during snowfall is motivated by previous works (e.g., Schultz, 1999; Olsson et al., 2017) where snowfall extremes were coassociated with the occurrence of high CAPE values. The box plots in Fig. 6c, d show the spatial regional average of t2m and CAPE during the days of the maximum snowfalls. The analysis for temperature (Fig. 6c) suggests that maximum snowfalls tend to be associated with temperatures above the freezing point in the recent period and a reduced variability with respect to the first period. It is not unusual to observe snowfall with ambient temperatures up to 6 ∘C (see e.g., Steinacker, 1983), and more recent studies show that snow and rain can coexist even up to 13.3 ∘C (Wen et al., 2013). The analysis for the local CAPE (Fig. 6d) is not very informative for two reasons: (i) the distribution is highly non-Gaussian; it includes zeros and presents several outliers; (ii) convective precipitation can originate in nearby regions and be transported.
In order to explore this possibility, from box plots in Fig. 6 we move to the field analysis in Fig. 7 for CAPE and Fig. 8 for t2m. From Fig. 7 we remark that heavy snowfalls for the three countries under examination are generally associated with large values of CAPE in the Adriatic Sea. For both periods, the absolute values of CAPE reached during these events (Fig. 7a, b, d, e, g, h) are consistent with the range found by Olsson et al. (2017) for the enhancement of snowfall by sea–air interactions. When looking at differences (ΔCAPE) between the warmer (1999–2018) and colder (1979–1998) period (Fig. 7c, f, i), we remark that there is an increase in CAPE (shaded regions indicate that at least two-thirds of the anomalies yield the same sign), suggesting that convective instability can be an important factor in Adriatic regions to trigger heavy precipitation in the Balkans. Furthermore, snowfall extremes tend to occur at or near the freezing point in both colder and warmer climates (O’Gorman, 2014). Figure 8 indicates that this is the case for both the periods considered and that the local temperature difference (Δt2m) between the 1979–1998 and 1999–2018 periods is small (see also box plots in Fig. 6c). The local temperature is important as it determines the maximum atmospheric moisture content and thus the thermodynamic component of the snowfall amount. While the warming of the Mediterranean Sea during these events (Fig. 8c, f, i) favors evaporation, part of the excess moisture precipitates out during the transport to this location, possibly reducing the thermodynamic enhancement of the snowfall.
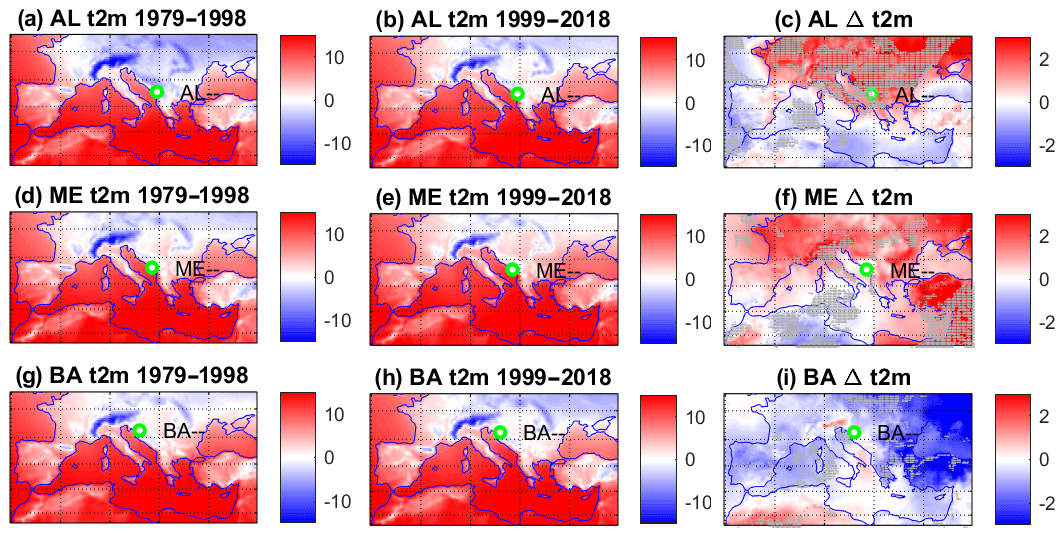
Figure 8Average of 2 m temperature fields (∘C) during days of yearly maximum snowfall for the periods 1979–1998 (a, d, g) and 1999–2018 (b, e, h). Panels (c), (f) and (i) show the differences between the second and the first periods (Δt2m). (a, b, c) Albania (AL), (d, e, f) Montenegro (ME), (g, h, i) Bosnia (BA). Green circles show the location of the northwesternmost point of each country. Shaded areas represent grid points where at least two-thirds of the anomalies have the same sign.
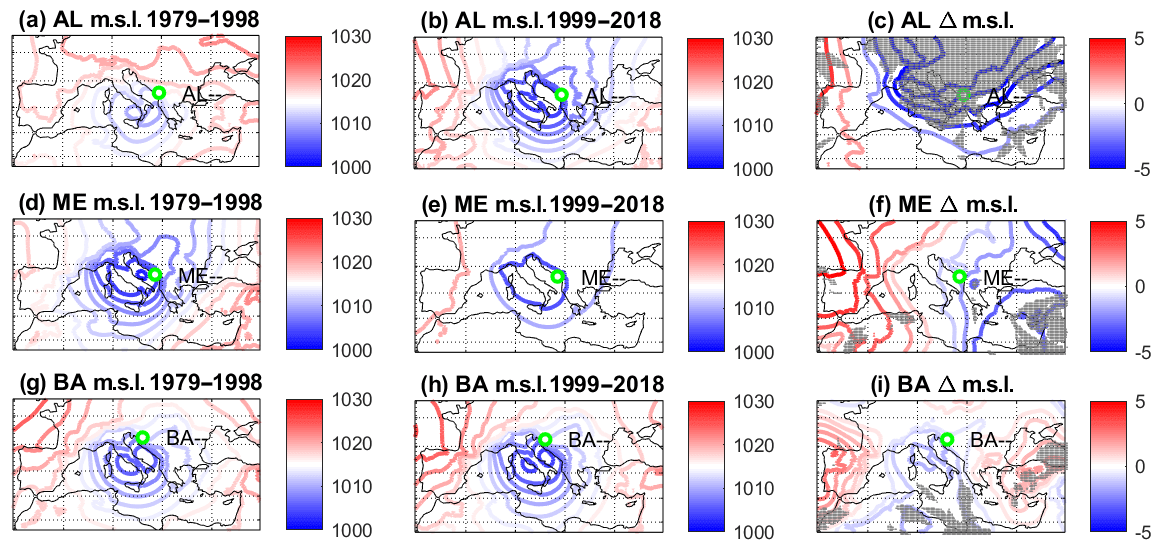
Figure 9Average of sea-level pressure (m.s.l.) fields (hPa) during days of yearly maximum snowfall for the periods 1979–1998 (a, d, g) and 1999–2018 (b, e, h). Panels (c), (f) and (i) show the differences between the second and the first periods Δm.s.l.. (a, b, c) Albania (AL), (d, e, f) Montenegro (ME), (g, h, i) Bosnia (BA). Green circles show the location of the northwesternmost point of each country. Shaded areas represent grid points where at least two-thirds of the anomalies have the same sign.
4.2 Dynamical analysis
Since thermodynamic effects alone cannot explain the positive changes in maximum snowfall, we also investigate the role of atmospheric circulation as a driver of those changes. For other regions of the world, this kind of analysis has provided evidence of a prominent role of atmospheric circulation in the variability of extreme snowfall events (see e.g., Kawase et al., 2016, for Japan; Lute et al., 2015, for Andorra; and Guan et al., 2010, for the USA). For the countries examined in the present study, the motivation for such analysis comes from the evidence that recent decades show a reduction in the abundance of zonal patterns (Guan et al., 2010).
We first present the sea-level pressure (m.s.l.) fields averaged during maxima of snowfall for both the periods in Fig. 9a, b, d, e, g, h and their differences Δm.s.l. in Fig. 9c, f, i. For the three countries considered, cyclonic patterns over the Tyrrhenian and the Adriatic seas can be identified for both the periods considered. Following pressure isobars, the flow is advected from sea to land. In 1999–2018, cyclonic conditions further strengthened in the Balkans with negative Δm.s.l. anomalies over eastern Europe, suggesting that, in the recent period, moisture advection from the Mediterranean Sea to the Balkans has favored snow accumulations in the countries examined. These cyclonic patterns can originate from two different conditions: local cyclogenesis in the Adriatic Sea driven by cold-air intrusions from Siberia (Bisci et al., 2012) or cyclogenesis in the Tyrrhenian Sea (Genoa lows) driven by polar air flowing through the Rhone Valley (Spreitzhofer, 2000). The Δm.s.l. analysis (Fig. 9c, f, i) shows the reinforcement of an eastern Mediterranean cyclonic pattern in the second period. The isobars point to southerly winds which favor uptake moisture from the Mediterranean Sea. Thus, the increase in CAPE over the Adriatic shown in Fig. 7c, f, i, together with the reinforcement of the pressure lows over Italy, could determine the increase in extreme snowfalls in these countries.
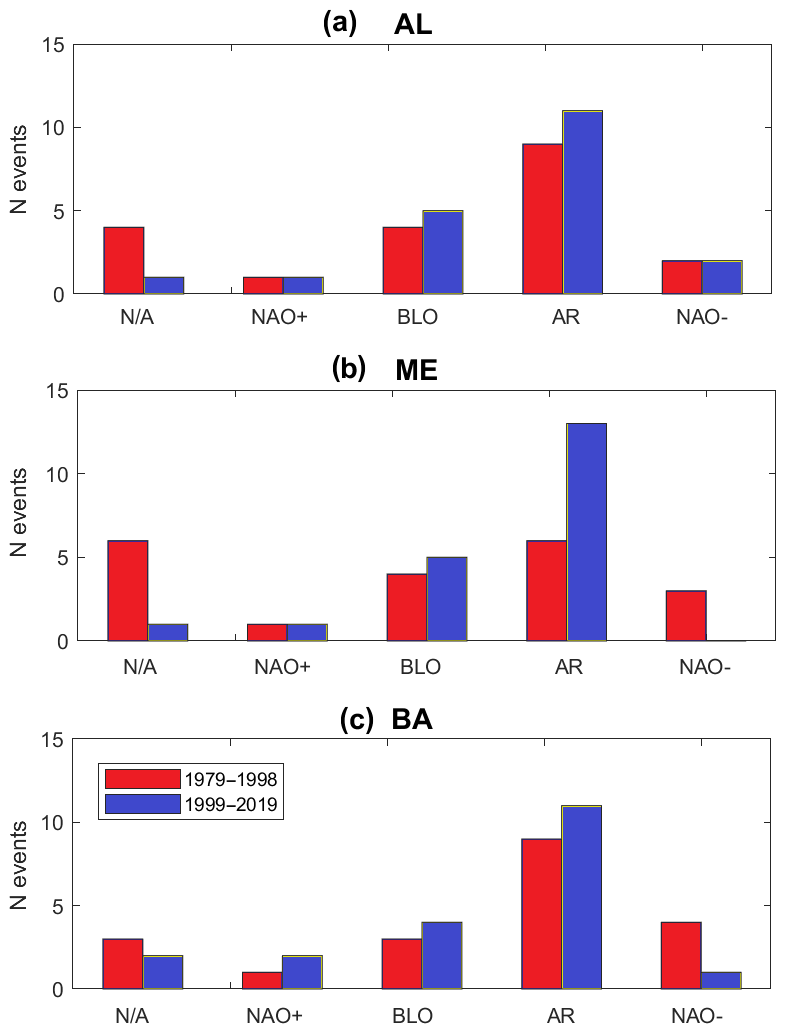
Figure 10Histograms of weather regimes during the days of maximum snowfalls. N/A: nonattributable; NAO+: North Atlantic Oscillation positive phase; BLO: blocking; AR: Atlantic Ridge; NAO−: North Atlantic Oscillation negative phase. (a) Albania (AL), (b) Montenegro (ME), (c) Bosnia (BA). Red bars correspond to 1979–1998 and blue ones to 1999–2018.
Following the approaches of Vautard (1990) and Michelangeli et al. (1995), we now analyze the shifts in daily weather regimes associated with extreme snowfalls. Weather regime search is performed by using the dynamical system indicators introduced in Faranda et al. (2017) and using the sea-level pressure fields for the same domain specified in that study, namely latitudes 22.5–70∘ N and longitudes 80∘ W–50∘ E. The technique presented in Faranda et al. (2017) allows us to determine five possible regimes: North Atlantic Oscillation positive (NAO+) and negative (NAO−) phases, blocking (BLO), Atlantic Ridge (AR), and nonattributable patterns (N/A). These patterns have been previously identified in many studies over this domain (see e.g., Vautard, 1990). The patterns obtained for ERA5 do not differ significantly from those shown in Fig. 2 in Faranda et al. (2017). Results are shown in Fig. 10 for the countries examined and show a prevalence of BLO and AR patterns during extreme snowfall events. These patterns (see e.g., D'Errico et al., 2020 and references therein) favor meridional movements of air masses and therefore the intrusion of polar air to Mediterranean latitudes. It is remarkable that, for all the three countries considered, the second period is characterized by an increase in Atlantic Ridge and blocking patterns. These patterns consist of high pressure over western or northern Europe, favoring dry conditions over western Mediterranean areas and low pressure over eastern Europe, triggering cyclogenesis in the Mediterranean and favoring the intrusion of cold air from Siberia (Raymond et al., 2018).
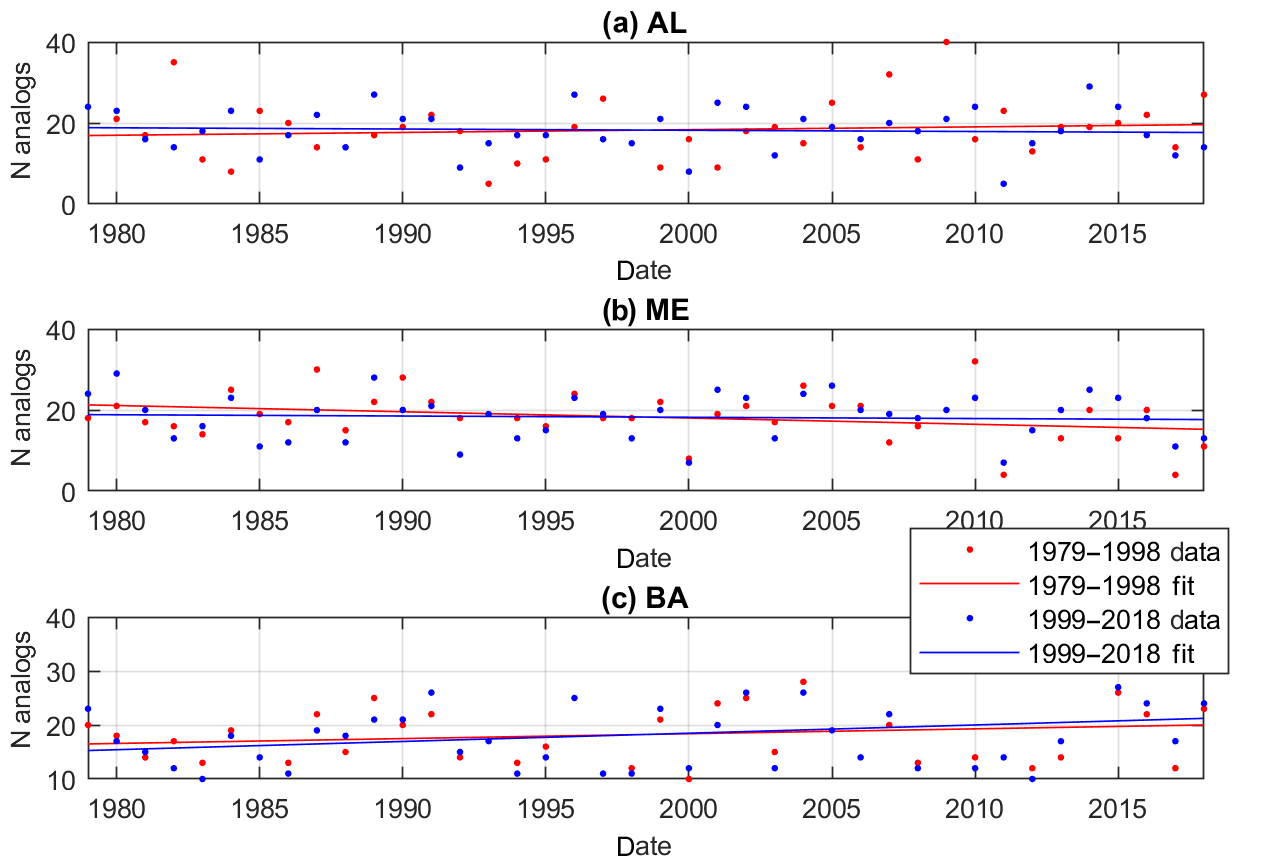
Figure 11Number of analogs per year of the average sea-level pressure fields during days of yearly maximum snowfall for the periods 1979–1998 and 1999–2018. (a) Albania (AL), (b) Montenegro (ME), (c) Bosnia (BA). Red corresponds to 1979–1998 and blue to 1999–2018.
The previous analysis shows that the weather regime shift is an important factor in determining changes in extreme snowfall. However, the statistics presented in Fig. 10 are limited by data availability. We therefore extend this analysis by performing an analog search for the closest 5 % sea-level pressure fields (according to the Euclidean distance) to those presented in Fig. 9a, b, d, e, g, h (Yiou et al., 2013). Note that the results do not depend on the threshold used for the selection of analogs in the range of 0.25 % to 5 %. For each of those fields, the analog search is performed in all the datasets (1979–2018). We then plot in Fig. 11 the number of analogs per year. A linear fit is applied to data. Besides Bosnia (Fig. 11c), for which the increasing trend in the number of analogs is significant (5 % level), for the other countries considered, trends are not significant. Furthermore, no clear differences appear when searching analogs for 1979–1998 or 1999–2018 fields associated with extreme snowfalls. This means that the changes in circulation patterns associated with extremes are specific to those events and seem to not follow some general trends of atmospheric circulation, thus suggesting a competition between thermodynamic and dynamical factors in their occurrence. The rationale for explaining the changes is the following: AR and BLO patterns occur with the same frequency in winter, but they are associated with deeper cyclogenesis in the Adriatic and Tyrrhenian seas in the recent period. These cyclones find warmer surfaces and large availability of humidity and CAPE, thus producing large snowfall amounts, enhanced by the Stau effect on the Balkan topography. This mechanism is similar to the one described for Japan in Kawase et al. (2016) and for Italy in D'Errico et al. (2020).
We have analyzed recent changes in yearly total and maximum snowfall from ERA5 reanalysis and the E-OBSv20.0e datasets. We have identified a robust signal in the general decrease in the yearly total snowfall, in particular for northern and western Europe. For snowfall maxima, changes are more contrasted: negative changes persist over western Europe, but in the proximity of the Mediterranean Sea, we have identified a certain number of countries showing positive changes. We have focused our efforts on understanding the positive trends for maximum snowfalls in some countries of the Balkans which showed consistent positive trends for both the datasets considered. The thermodynamic analysis of atmospheric stability and 2 m temperatures suggests that during recent heavy snowfall events, the instability increases, and convection is favored, an effect that could be linked to climate change (Ye et al., 1998). This can however be contrasted by the fact that excess moisture could precipitate out during the transport to the snowfall location due to temperatures close to freezing points. The thermodynamic analysis was completed by an analysis of the atmospheric circulation patterns associated with extreme snowfall over these countries. Results show an enhancement of local cyclonic patterns and a tendency to observe Atlantic Ridge patterns associated with extreme snowfalls in recent times. Even though this could suggest a relation between our findings and the arctic amplification caused by climate change (Vavrus et al., 2017), we stress that the length of the datasets used is too short to attribute these changes to climate change and that they could be produced by the interdecadal variability of the atmospheric circulation. Furthermore, the analog analysis carried out in Sect. 4 did not show any particular trends in analogs for any of the countries considered but Bosnia. Recent studies on whether these patterns are due to low-frequency variability of the Atlantic circulation or to climate change are debated (see e.g., the discussion in Screen, 2017).
To summarize our findings, there is an interplay of circulation and thermodynamic factors to explain the observed trends in maximum snowfalls in the Balkans: the analysis of CAPE shows that large values of this quantity are associated with heavy snowfalls in the selected countries. CAPE values of 70 J kg−1 are enough to trigger convection during winter time and enhance snowfall precipitation (Olsson et al., 2017). Furthermore, for all countries analyzed, the isobars associated with the cyclonic conditions embedded in Atlantic Ridge patterns indicate winds blowing from sea to land, thus favoring the advection of moisture and the formation of convective precipitation. In addition, the three countries analyzed are characterized by mountain ranges that, in the presence of sea-to-land flow associated with extratropical cyclones, favor the Stau effect on precipitation (Bica et al., 2007). Both thermodynamic and dynamic effects seem therefore to contribute to observed trends, although it is difficult to understand which factor prevails. Only the thermodynamic components of increasing instability can be linked to climate change (Ye et al., 1998). Although winter total precipitation in future climate scenarios is expected to increase over Europe (Santos et al., 2016), global and regional warming is projected to reduce average and extreme snowfall precipitation at least in central and western Europe (de Vries et al., 2014). In the same study, de Vries et al. (2014) find that positive trends in snowfalls could still be observed for high mountain areas (Alps and Scandinavia) in warmer climates. This seems coherent with the results found for Japan by Kawase et al. (2016) and in the present study for the Balkans.
This study comes with some caveats. First of all, the changes (especially those in the maxima) depend on the dataset chosen. Here we have focused on consistent trends between E-OBSv20.0e and ERA5 and then used ERA5 for the analyses because of the consistent representation of snowfalls with atmospheric circulation. The lack of longer and highly resolved datasets for snowfall is a strong limitation, and it adds up to the intrinsic difficulty of simulating snowfalls due to their highly nonlinear behavior and the fact that they involve phase transitions. In addition, we have not considered the effects on the trends of lower-frequency variability mechanisms. There are subseasonal to seasonal conditions that can trigger snowy waves over Europe by modifying winter atmospheric circulation patterns: the role of stratospheric warming as well as the magnitude of snow cover in Siberia and in the Arctic region could be taken into account in future research on this topic, e.g., by following the approaches of Handorf et al. (2015, 2017) and Mori et al. (2019). At smaller scales, where convection is important, further studies could be based on searching the origin, transport pathways and thermodynamic evolution of air masses involved in heavy snowfall episodes via novel methodologies based on tracking trajectories of air masses such as those introduced in Papritz and Spengler (2017) and by using convection-permitting models to study sea–air–snow interactions (Bartolini, 2019).
ERA-5 data used in this study can be downloaded from the CDS Copernicus webpage at https://cds.climate.copernicus.eu/cdsapp#!/dataset/reanalysis-era5-single-levels (Copernicus, 2020a). E-OBS20.0e data used in this study can be downloaded at https://surfobs.climate.copernicus.eu/dataaccess/access_eobs.php#datafiles (Copernicus, 2020b).
The author declares that there is no conflict of interest.
The author wishes to thank Flavio Pons, Sebastien Fromang, Pascal Yiou and Mathieu Vrac for the discussions and Soulivanh Thao for the help with the ERA5 dataset. The author acknowledges two anonymous reviewers as well as the editorial board of WCD for useful comments on the manuscript.
This work has been supported by the INSU-CNRS-LEFE-MANU grant (project DINCLIC), an ERA4CS grant (EUPHEME), a CEA bottom-up grant (DAMA) and an ANR-TERC grant (BOREAS).
This paper was edited by Christian M. Grams and reviewed by two anonymous referees.
Altman, N. and Krzywinski, M.: Points of significance: interpreting P values, Nat. Methods, 14, 213–214, 2017. a
Auer, I., Böhm, R., Jurković, A., Orlik, A., Potzmann, R., Schöner, W., Ungersböck, M., Brunetti, M., Nanni, T., Maugeri, M., Briffa, K., Jones, P., Efthymiadis, D., Mestre, O., Moisselin, J.-M., Begert, M., Brazdil, R., Bochnicek, O., Cegnar, T., Gajić‐Čapka, M., Zaninović, K., Majstorović, Ž., Szalai, S., Szentimrey, T., and Mercalli, L.: A new instrumental precipitation dataset for the greater alpine region for the period 1800–2002, Int. J. Climatol., 25, 139–166, 2005. a
Barnes, E. A., Dunn-Sigouin, E., Masato, G., and Woollings, T.: Exploring recent trends in Northern Hemisphere blocking, Geophys. Res. Lett., 41, 638–644, 2014. a
Bartolini, W. M.: Convection-Permitting Ensemble Forecasts of the 10–12 December 2013 Lake-Effect Snow Event: Sensitivity to Microphysical, Planetary Boundary Layer, and Surface Layer Parameterizations, Ph.D. thesis, State University of New York at Albany, 2019. a, b, c
Beniston, M., Farinotti, D., Stoffel, M., Andreassen, L. M., Coppola, E., Eckert, N., Fantini, A., Giacona, F., Hauck, C., Huss, M., Huwald, H., Lehning, M., López-Moreno, J.-I., Magnusson, J., Marty, C., Morán-Tejéda, E., Morin, S., Naaim, M., Provenzale, A., Rabatel, A., Six, D., Stötter, J., Strasser, U., Terzago, S., and Vincent, C.: The European mountain cryosphere: a review of its current state, trends, and future challenges, The Cryosphere, 12, 759–794, https://doi.org/10.5194/tc-12-759-2018, 2018. a
Bica, B., Knabl, T., Steinacker, R., Ratheiser, M., Dorninger, M., Lotteraner, C., Schneider, S., Chimani, B., Gepp, W., and Tschannett, S.: Thermally and dynamically induced pressure features over complex terrain from high-resolution analyses, J. Appl. Meteorol. Clim., 46, 50–65, 2007. a
Bisci, C., Fazzini, M., Beltrando, G., Cardillo, A., and Romeo, V.: The February 2012 exceptional snowfall along the Adriatic side of Central Italy, Meteorologische Z., 21, 503–508, 2012. a, b
Blackport, R., Screen, J. A., van der Wiel, K., and Bintanja, R.: Minimal influence of reduced Arctic sea ice on coincident cold winters in mid-latitudes, Nat. Clim. Change, 9, 697–704, 2019. a
Brandmueller, T., Schäfer, G., Ekkehard, P., Müller, O., and Angelova-Tosheva, V.: Territorial indicators for policy purposes: NUTS regions and beyond, Regional Statistics, 7, 78–89, 2017. a
Brutel-Vuilmet, C., Ménégoz, M., and Krinner, G.: An analysis of present and future seasonal Northern Hemisphere land snow cover simulated by CMIP5 coupled climate models, The Cryosphere, 7, 67–80, https://doi.org/10.5194/tc-7-67-2013, 2013. a
Buehler, T., Raible, C. C., and Stocker, T. F.: The relationship of winter season North Atlantic blocking frequencies to extreme cold or dry spells in the ERA-40, Tellus A, 63, 174–187, 2011. a
Cattiaux, J., Vautard, R., Cassou, C., Yiou, P., Masson-Delmotte, V., and Codron, F.: Winter 2010 in Europe: A cold extreme in a warming climate, Geophys. Res. Lett., 37, L20704, https://doi.org/10.1029/2010GL044613, 2010. a
Chen, H. W., Zhang, F., and Alley, R. B.: The robustness of midlatitude weather pattern changes due to Arctic sea ice loss, J. Climate, 29, 7831–7849, 2016. a
Cohen, J., Screen, J. A., Furtado, J. C., Barlow, M., Whittleston, D., Coumou, D., Francis, J., Dethloff, K., Entekhabi, D., Overland, J., and Jones, J.: Recent Arctic amplification and extreme mid-latitude weather, Nat. Geosci., 7, 627–637, 2014. a
Copernicus: ERA-5 data, available at: https://cds.climate.copernicus.eu/cdsapp#!/dataset/reanalysis-era5-single-levels, last access: 3 September 2020a. a
Copernicus: E-OBS data access, available at: https://surfobs.climate.copernicus.eu/dataaccess/access_eobs.php#datafiles, last access: 3 September 2020b. a
Cornes, R. C., van der Schrier, G., van den Besselaar, E. J., and Jones, P. D.: An Ensemble Version of the E-OBS Temperature and Precipitation Data Sets, J. Geophys. Res.-Atmos., 123, 9391–9409, 2018. a
Czaja, A., Frankignoul, C., Minobe, S., and Vannière, B.: Simulating the Midlatitude Atmospheric Circulation: What Might We Gain From High-Resolution Modeling of Air-Sea Interactions?, Current Climate Change reports, 5, 390–406, 2019. a
D'Errico, M., Yiou, P., Nardini, C., Lunkeit, F., and Faranda, D.: A dynamical and thermodynamic mechanism to explain heavy snowfalls in current and future climate over Italy during cold spells, Sci. Rep., under review, hal-02367559, 2020 a, b, c, d, e
Déry, S. J. and Brown, R. D.: Recent Northern Hemisphere snow cover extent trends and implications for the snow-albedo feedback, Geophys. Res. Lett., 34, GL031474, https://doi.org/10.1029/2007GL031474, 2007. a
Deser, C., Hurrell, J. W., and Phillips, A. S.: The role of the North Atlantic Oscillation in European climate projections, Clim. Dynam., 49, 3141–3157, 2017. a
de Vries, H., Lenderink, G., and van Meijgaard, E.: Future snowfall in western and central Europe projected with a high-resolution regional climate model ensemble, Geophys. Res. Lett., 41, 4294–4299, 2014. a, b
European Commission: Commission Regulation (EU) 2016/2066 of 21 November 2016 Amending the Annexes to Regulation (EC) No 1059/2003 of the European Parliament and of the Council on the Establishment of a Common Classification of Territorial Units for Statistics (NUTS), European Parliament, Council of the European Union, 2016. a
Faranda, D., Messori, G., and Yiou, P.: Dynamical proxies of North Atlantic predictability and extremes, Sci. Rep., 7, 41278, https://doi.org/10.1038/srep41278, 2017. a, b, c
Faranda, D., Alvarez-Castro, M. C., Messori, G., Rodrigues, D., and Yiou, P.: The hammam effect or how a warm ocean enhances large scale atmospheric predictability, Nat. Commun., 10, 1316, https://doi.org/10.1038/s41467-019-09305-8, 2019. a
Frigo, B., Chiaia, B., Chiambretti, I., Bartelt, P., Maggioni, M., and Freppaz, M.: The January 18th 2017 Rigopiano disaster in Italy – analysis of the avalanche dynamics, in: Proc. Intl. Snow Science Workshop, Innsbruck, Austria, 6–10, 2018. a
Gualdi, S., Somot, S., Li, L., Artale, V., Adani, M., Bellucci, A., Braun, A., Calmanti, S., Carillo, A., Dell'Aquila, A., Déqué, M., Dubois, C., Elizalde, A., Harzallah, A., Jacob, D., L'Hévéder, B., May, W., Oddo, P., Ruti, P., Sanna, A., Sannino, G., Scoccimarro, E., Sevault, F., and Navarra, A.: The CIRCE simulations: regional climate change projections with realistic representation of the Mediterranean Sea, B. Am. Meteorol. Soc., 94, 65–81, 2013. a
Guan, B., Molotch, N. P., Waliser, D. E., Fetzer, E. J., and Neiman, P. J.: Extreme snowfall events linked to atmospheric rivers and surface air temperature via satellite measurements, Geophys. Res. Lett., 37, GL044696, https://doi.org/10.1029/2010GL044696, 2010. a, b
Handorf, D., Jaiser, R., Dethloff, K., Rinke, A., and Cohen, J.: Impacts of Arctic sea ice and continental snow cover changes on atmospheric winter teleconnections, Geophys. Res. Lett., 42, 2367–2377, 2015. a
Handorf, D., Dethloff, K., Erxleben, S., Jaiser, R., and Kurgansky, M. V.: Arctic-mid-latitude linkages in a nonlinear quasi-geostrophic atmospheric model, Adv. Meteorol., 2691368, https://doi.org/10.1155/2017/2691368, 2017. a
Herold, N., Behrangi, A., and Alexander, L. V.: Large uncertainties in observed daily precipitation extremes over land, J. Geophys. Res.-Atmos., 122, 668–681, 2017. a
Hersbach, H., Bell, B., Berrisford, P., Hirahara, S., Horányi, A., Muñoz-Sabater, J., Nicolas, J., Peubey, C., Radu, R., Schepers, D., Simmons, A., Soci, C., Abdalla, S., Abellan, X., Balsamo, G., Bechtold, P., Biavati, G., Bidlot, J., Bonavita, M., De Chiara, G., Dahlgren, P., Dee D., Diamantakis, M., Dragani, R., Flemming, J., Forbes, R., Fuentes, M., Geer, A., Haimberger, L., Healy, S., Hogan, R. J., Hólm, E., Janisková, M., Keeley, S., Laloyaux, P., Lopez, P., Lupu, C., Radnoti, G., de Rosnay, P., Rozum, I., Vamborg, F., Villaume, S., and Thépaut J.-N.: The ERA5 global reanalysis, Q. J. Roy. Meteor. Soc., 2020, https://doi.org/10.1002/qj.3803, 2020. a
Isotta, F. A., Frei, C., Weilguni, V., Perčec Tadić, M., Lassegues, P., Rudolf, B., Pavan, V., Cacciamani, C., Antolini, G., Ratto, S. M., Munari, M., Micheletti, S., Bonati, V., Lussana, C., Ronchi, C., Panettieri, E., Marigo, G., and Vertačnik, G.: The climate of daily precipitation in the Alps: development and analysis of a high-resolution grid dataset from pan-Alpine rain-gauge data, Int. J. Climatol., 34, 1657–1675, 2014. a
Kawase, H., Murata, A., Mizuta, R., Sasaki, H., Nosaka, M., Ishii, M., and Takayabu, I.: Enhancement of heavy daily snowfall in central Japan due to global warming as projected by large ensemble of regional climate simulations, Clim. Change, 139, 265–278, 2016. a, b, c, d
Kim, B.-M., Son, S.-W., Min, S.-K., Jeong, J.-H., Kim, S.-J., Zhang, X., Shim, T., and Yoon, J.-H.: Weakening of the stratospheric polar vortex by Arctic sea-ice loss, Nat. Commun., 5, 4646, https://doi.org/10.1038/ncomms5646, 2014. a
Lehmann, J. and Coumou, D.: The influence of mid-latitude storm tracks on hot, cold, dry and wet extremes, Sci. Rep., 5, 17491, https://doi.org/10.1038/srep17491, 2015. a
Li, F., Collins, W. D., Wehner, M. F., Williamson, D. L., Olson, J. G., and Algieri, C.: Impact of horizontal resolution on simulation of precipitation extremes in an aqua-planet version of Community Atmospheric Model (CAM3), Tellus A, 63, 884–892, 2011. a
Lorenz, D. J. and DeWeaver, E. T.: Tropopause height and zonal wind response to global warming in the IPCC scenario integrations, J. Geophys. Res.-Atmos., 112, JD008087, https://doi.org/10.1029/2006JD008087, 2007. a
Lute, A., Abatzoglou, J., and Hegewisch, K.: Projected changes in snowfall extremes and interannual variability of snowfall in the western United States, Water Resour. Res., 51, 960–972, 2015. a
Lüthi, S., Ban, N., Kotlarski, S., Steger, C. R., Jonas, T., and Schär, C.: Projections of Alpine Snow-Cover in a High-Resolution Climate Simulation, Atmosphere, 10, 463, https://doi.org/10.3390/atmos10080463, 2019. a
Madonna, E., Li, C., Grams, C. M., and Woollings, T.: The link between eddy-driven jet variability and weather regimes in the North Atlantic-European sector, Q. J. Roy. Meteor. Soc., 143, 2960–2972, 2017. a
Marty, C. and Blanchet, J.: Long-term changes in annual maximum snow depth and snowfall in Switzerland based on extreme value statistics, Clim. Change, 111, 705–721, 2012. a
Michelangeli, P.-A., Vautard, R., and Legras, B.: Weather regimes: Recurrence and quasi stationarity, J. Atmos. Sci., 52, 1237–1256, 1995. a, b
Mori, M., Kosaka, Y., Watanabe, M., Nakamura, H., and Kimoto, M.: A reconciled estimate of the influence of Arctic sea-ice loss on recent Eurasian cooling, Nat. Clim. Change, 9, 123–129, 2019. a
Murray, V. and Ebi, K. L.: IPCC special report on managing the risks of extreme events and disasters to advance climate change adaptation (SREX), Cambridge University Press. Cambridge UK, 2012. a
Nitu, R. and Wong, K.: CIMO survey on national summaries of methods and instruments for solid precipitation measurement at automatic weather stations, WMO, Geneva, Switzerland, 2010. a
Niziol, T. A., Snyder, W. R., and Waldstreicher, J. S.: Winter weather forecasting throughout the eastern United States. Part IV: Lake effect snow, Weather Forecast., 10, 61–77, 1995. a
O’Gorman, P. A.: Contrasting responses of mean and extreme snowfall to climate change, Nature, 512, 416–418, 2014. a
Olsson, T., Perttula, T., Jylhä, K., and Luomaranta, A.: Intense sea-effect snowfall case on the western coast of Finland, Adv. Sci. Res., 14, 231–239, https://doi.org/10.5194/asr-14-231-2017, 2017. a, b, c
Overland, J. E. and Wang, M.: Large-scale atmospheric circulation changes are associated with the recent loss of Arctic sea ice, Tellus A, 62, 1–9, 2010. a
Papritz, L. and Spengler, T.: Analysis of the slope of isentropic surfaces and its tendencies over the North Atlantic, Q. J. Roy. Meteor. Soc., 141, 3226–3238, 2015. a
Papritz, L. and Spengler, T.: A Lagrangian climatology of wintertime cold air outbreaks in the Irminger and Nordic Seas and their role in shaping air–sea heat fluxes, J. Climate, 30, 2717–2737, 2017. a, b
Rasmussen, R., Baker, B., Kochendorfer, J., Meyers, T., Landolt, S., Fischer, A. P., Black, J., Thériault, J. M., Kucera, P., Gochis, D., Smith, C., Nitu, R., Hall, M., Ikeda, K., and Gutmann, E.: How well are we measuring snow: The NOAA/FAA/NCAR winter precipitation test bed, B. Am. Meteorol. Soc., 93, 811–829, 2012. a
Raymond, F., Ullmann, A., Camberlin, P., Oueslati, B., and Drobinski, P.: Atmospheric conditions and weather regimes associated with extreme winter dry spells over the Mediterranean basin, Clim. Dynam., 50, 4437–4453, 2018. a
Revkin, A.: Skeptics on human climate impact seize on cold spell, The New York Times, New York, USA, 2, 2008. a
Rushton, S.: On a two-sided sequential t-test, Biometrika, 39, 302–308, 1952. a
Santos, J. A., Belo-Pereira, M., Fraga, H., and Pinto, J. G.: Understanding climate change projections for precipitation over western Europe with a weather typing approach, J. Geophys. Res.-Atmos., 121, 1170–1189, 2016. a
Scherrer, S. C. and Appenzeller, C.: Swiss Alpine snow pack variability: major patterns and links to local climate and large-scale flow, Clim. Res., 32, 187–199, 2006. a
Scherrer, S. C., Wüthrich, C., Croci-Maspoli, M., Weingartner, R., and Appenzeller, C.: Snow variability in the Swiss Alps 1864–2009, Int. J. Climatol., 33, 3162–3173, 2013. a
Schultz, D. M.: Lake-effect snowstorms in northern Utah and western New York with and without lightning, Weather Forecast., 14, 1023–1031, 1999. a
Screen, J. A.: The missing Northern European winter cooling response to Arctic sea ice loss, Nat. Commun., 8, 14603, https://doi.org/10.1038/ncomms14603, 2017. a, b
Screen, J. A., Deser, C., Simmonds, I., and Tomas, R.: Atmospheric impacts of Arctic sea-ice loss, 1979–2009: Separating forced change from atmospheric internal variability, Clim. Dynam., 43, 333–344, 2014. a
Screen, J. A., Deser, C., Smith, D. M., Zhang, X., Blackport, R., Kushner, P. J., Oudar, T., McCusker, K. E., and Sun, L.: Consistency and discrepancy in the atmospheric response to Arctic sea-ice loss across climate models, Nat. Geosci., 11, 155–163, 2018. a
Shepherd, T. G.: Atmospheric circulation as a source of uncertainty in climate change projections, Nat. Geosci., 7, 703–708, 2014. a
Spreitzhofer, G.: On the characteristics of heavy multiple-day snowfalls in the Eastern Alps, Nat. Hazards, 21, 35–53, 2000. a
Steinacker, R.: Diagnose und prognose der schneefallgrenze, Wetter und Leben, 35, 81–90, 1983. a
Strong, C., Magnusdottir, G., and Stern, H.: Observed feedback between winter sea ice and the North Atlantic Oscillation, J. Climate, 22, 6021–6032, 2009. a
Tabari, H., De Troch, R., Giot, O., Hamdi, R., Termonia, P., Saeed, S., Brisson, E., Van Lipzig, N., and Willems, P.: Local impact analysis of climate change on precipitation extremes: are high-resolution climate models needed for realistic simulations?, Hydrol. Earth Syst. Sci., 20, 3843–3857, https://doi.org/10.5194/hess-20-3843-2016, 2016. a
Tibaldi, S. and Buzzi, A.: Effects of orography on Mediterranean lee cyclogenesis and its relationship to European blocking, Tellus A, 35, 269–286, 1983. a
Tonks, A.: Storm Emma in pictures: Worst snow storm to hit the UK in 50 years, The Express, London, UK, 2018. a
Vautard, R.: Multiple weather regimes over the North Atlantic: Analysis of precursors and successors, Monthly Weather Rev., 118, 2056–2081, 1990. a, b, c
Vavrus, S. J., Wang, F., Martin, J. E., Francis, J. A., Peings, Y., and Cattiaux, J.: Changes in North American atmospheric circulation and extreme weather: Influence of Arctic amplification and Northern Hemisphere snow cover, J. Climate, 30, 4317–4333, 2017. a
Wallace, J. M. and Hobbs, P. V.: Atmospheric science: an introductory survey, vol. 92, Elsevier Academic Press, Amsterdam, Boston, 2006. a
Wen, L., Nagabhatla, N., Lü, S., and Wang, S.-Y.: Impact of rain snow threshold temperature on snow depth simulation in land surface and regional atmospheric models, Adv. Atmos. Res., 30, 1449–1460, 2013. a
Woollings, T., Hannachi, A., Hoskins, B., and Turner, A.: A regime view of the North Atlantic Oscillation and its response to anthropogenic forcing, J. Climate, 23, 1291–1307, 2010. a
Wu, Q. and Zhang, X.: Observed forcing-feedback processes between Northern Hemisphere atmospheric circulation and Arctic sea ice coverage, J. Geophys. Res.-Atmos., 115, JD013574, https://doi.org/10.1029/2009JD013574, 2010. a
Ye, B., Del Genio, A. D., and Lo, K. K.: CAPE variations in the current climate and in a climate change, J. Climate, 11, 1997–2015, 1998. a, b
Yiou, P. and Nogaj, M.: Extreme climatic events and weather regimes over the North Atlantic: When and where?, Geophys. Res. Lett., 31, GL019119, https://doi.org/10.1029/2003GL019119, 2004. a
Yiou, P., Salameh, T., Drobinski, P., Menut, L., Vautard, R., and Vrac, M.: Ensemble reconstruction of the atmospheric column from surface pressure using analogues, Clim. Dynam., 41, 1333–1344, 2013. a