the Creative Commons Attribution 4.0 License.
the Creative Commons Attribution 4.0 License.
 | 16 Dec 2021
A characterisation of Alpine mesocyclone occurrence
Urs Germann
Marco Gabella
Alexis Berne
This work presents a characterisation of mesocyclone occurrence and frequency in the Alpine region, as observed from the Swiss operational radar network; 5 years of radar data are processed with a thunderstorm detection and tracking algorithm and subsequently with a new mesocyclone detection algorithm. A quality assessment of the radar domain provides additional information on the reliability of the tracking algorithms throughout the domain. The resulting data set provides the first insight into the spatiotemporal distribution of mesocyclones in the Swiss domain, with a more detailed focus on the influence of synoptic weather, diurnal cycle and terrain. Both on the northern and southern side of the Alps mesocyclonic signatures in thunderstorms occur regularly. The regions with the highest occurrence are predominantly the Southern Prealps and to a lesser degree the Northern Prealps. The parallels to hail research over the same region are discussed.
- Article
(9659 KB) - Full-text XML
- BibTeX
- EndNote


Severe convection in Europe is an increasing weather hazard that causes significant damage and loss every year (Hoeppe, 2015; Púčik et al., 2019; Kron et al., 2019). Switzerland's Prealpine areas are known to be one of the most active regions in Europe (Taszarek et al., 2019; Nisi et al., 2018). Supercells are a part of severe convection; the consequential hazards include lightning, downbursts, severe precipitation, hail and tornadoes (Markowski and Richardson, 2010). Thus, they pose a risk to infrastructure, property and lives. Identifying mesocyclone structures in deep, moist convection allows for the detection of supercell thunderstorms and a monitoring of their occurrence (Zrnić et al., 1985; Miller et al., 2013).
Supercells and particularly tornadoes have largely been studied in the Great Plains and the southeastern United States, where the terrain is flat. Many field campaigns have taken place there to obtain in situ and close-range measurements of supercell environments, ranging from early campaigns in the 1970s (Bluestein, 1999), the 25-year VORTEX project (Verification of the Origins of Rotation in Tornadoes EXperiment; NSSL, 2019) and the ongoing TORUS campaign (Targeted Observation by Radars and UAS of Supercells; unoccupied aircraft system; Frew et al., 2020; Garcia de Jesus, 2019). VORTEX-SE (Southeast; NSSL, 2021) began covering the beginning of the Appalachian chain, including more complex orography. The observational climatology established in this region is also one of the longest, with mesocyclone detection algorithms having been introduced in the 1990s (Zrnić et al., 1985; Stumpf et al., 1998). However, terrain is no obstacle to the initiation of supercells, and recent studies have focused more on studying supercells in diverse geographical contexts. The data stemming from the recent RELAMPAGO-CACTI (Remote sensing of Electrification, Lightning, And Mesoscale/microscale Processes with Adaptive Ground Observations; Clouds, Aerosols, and Complex Terrain Interactions; Varble et al., 2021; Nesbitt et al., 2021) field campaign contain the potential to dissect the role of terrain (here the conjunction of the Andes and the Sierras de Córdoba) in the upscale growth of supercells to mesoscale convective complexes (Mulholland et al., 2019, 2020). However, most studies focus on single cases or a small number of cases, as the amount of data from a field campaign is limited. The ongoing TEAMx project (Multi-scale transport and exchange processes in the atmosphere over mountains – programme and experiment; Serafin et al., 2020) in the Alps specifically targets transport and exchange processes over the mountains and also contains a section targeting the evolution of convection. All these recent campaigns show the relevance of investigating the nature of severe convection in mountainous areas.
Only very little research in Switzerland has thus far focused on mesocyclones and supercells specifically. Houze et al. (1993) investigated the behaviour of severe convection in the Northern Prealps, with 7 years of data from a single-polarisation radar. Rotation was inferred from radar reflectivity images. This analysis produced 42 rotating storms during the observation period within the 60 km range of the radar. Only a few more right-moving storms occurred than left-moving storms, indicating that there is no strict preference in rotation direction. The study also showed a significant overlap with hailstorms observed during this period.
With hail being a prominent risk factor of severe convection in Switzerland, it is the focus of many recent studies. They range from case studies on hailstorms (Trefalt et al., 2018) over collecting crowdsourced hail reports (Barras et al., 2019) and investigating hail in radar data (Nisi et al., 2016, 2018, 2020) to building a conclusive hail climatology from multiple data sources (NCCS, 2021). Barras et al. (2021) investigates the dynamic conditions leading to hail clusters, as opposed to single hail events, whereas Schemm et al. (2016) analyses the connection between hail and approaching fronts. The link between lightning jumps and hail occurrence for the purpose of nowcasting has also been investigated (Figueras i Ventura et al., 2019). Particularly Nisi et al. (2018) describes the general occurrence and frequency of hail events in Switzerland, taking into account the effects of the seasonal and diurnal cycle and investigating the influence of the weather situation at the synoptic scale. Key takeaways are the importance of weather situations with southwesterly and westerly flow, as well as the dominance of rather large, persistent hailstorms at hours of the night with low convective activity.
While tornadoes are rare in Switzerland, they nonetheless occur approximately once per year, as estimated by the Swiss Severe Weather Database (Sturmarchiv Schweiz, 2021). Most tornadoes are very weak and classify as F0 events, but on rare occasions, a more significant event can take place. Both Peyraud (2013) and Grazioli et al. (2019) show case studies of tornadoes in western Switzerland. Avolio et al. (2020) describe the case of a supercell that the media reported to have produced a suspected tornado, just beyond the southern Swiss border.
In Germany, mesocyclone detection has been implemented more recently (Hengstebeck et al., 2018; Wapler et al., 2016). Studies there also show that supercells can occur in all parts of the country, including areas with complex topography, such as the Bavarian Prealps (Wapler et al., 2016; Wapler, 2017, 2021). The majority of hailstorms have a mesocyclone structure before and during the production of hail, indicating the relevance of detecting mesocyclones for nowcasting purposes. Mirroring the overall behaviour of convection, there is a pronounced seasonal and diurnal cycle, with a large influence of the synoptic weather. In comparison with (Nisi et al., 2018), the dominant flow situations initiating severe convection in Germany differ from Switzerland due to the different geographical location. Over southern, western and central Europe in general, southwesterly situations can lead to deep, moist convection (Piper et al., 2019; Mohr et al., 2019; Wapler et al., 2016; Morris, 1986), as the advection of moist, warm air from the Mediterranean provides favourable conditions. In addition, other flow situations can be beneficial regionally, depending on the geographic situation (Piper et al., 2019; Nisi et al., 2018; Wapler et al., 2016). Mohr et al. (2020) show the influence of synoptic weather on a series of severe thunderstorms from southwestern France to northeastern Germany in June 2018, highlighting the importance of the large-scale flow on widespread outbreaks of severe weather including supercells. With the potential of severe convection rising not only globally (Diffenbaugh et al., 2013) but also in central Europe (Rädler et al., 2019; Mohr and Kunz, 2013; Púčik et al., 2017), we have a large incentive to better understand and characterise mesocyclones in the Swiss domain.
Our work focuses on the region covered by the Swiss operational radar network Rad4Alp (Germann et al., 2016; MeteoSwiss, 2018a), which extends over the main Alpine ridge, Prealps, Jura mountains (along the northeastern border between Switzerland and France; see locations in Nisi et al., 2016, Fig. 1) and parts of the neighbouring countries Germany, France, Italy and Austria. The Alps dominate the topography of this area, allowing for a study of supercell behaviour in complex terrain and high-altitude environments. We here establish a systematic detection of mesocyclones in the entire radar domain over 5 years. This allows for a first-time characterisation of the spatiotemporal distribution of mesocyclones in the Swiss domain and builds the basis for operational automatic mesocyclone detection and nowcasting. Recent improvements in the processing of radar Doppler velocity (Feldmann et al., 2020) now allow for the implementation of a robust, radar-data-based mesocyclone detection algorithm. The data set established here permits us to investigate the occurrence and evolution of supercells in high-altitude, complex terrain. The analysis focuses on identifying spatial patterns, the influence of the synoptic flow and the diurnal cycle.
Our work presented is organised as follows. Section 2 describes the data sets used in our analyses, while Sect. 3 introduces the methods applied. The results are presented and discussed in Sect. 4, followed by our conclusion (Sect. 5). The Appendices include more detailed descriptions of the thunderstorm detection algorithm (A), mesocyclone detection algorithm (B), the radar network quality assessment C) and further example cases (D).
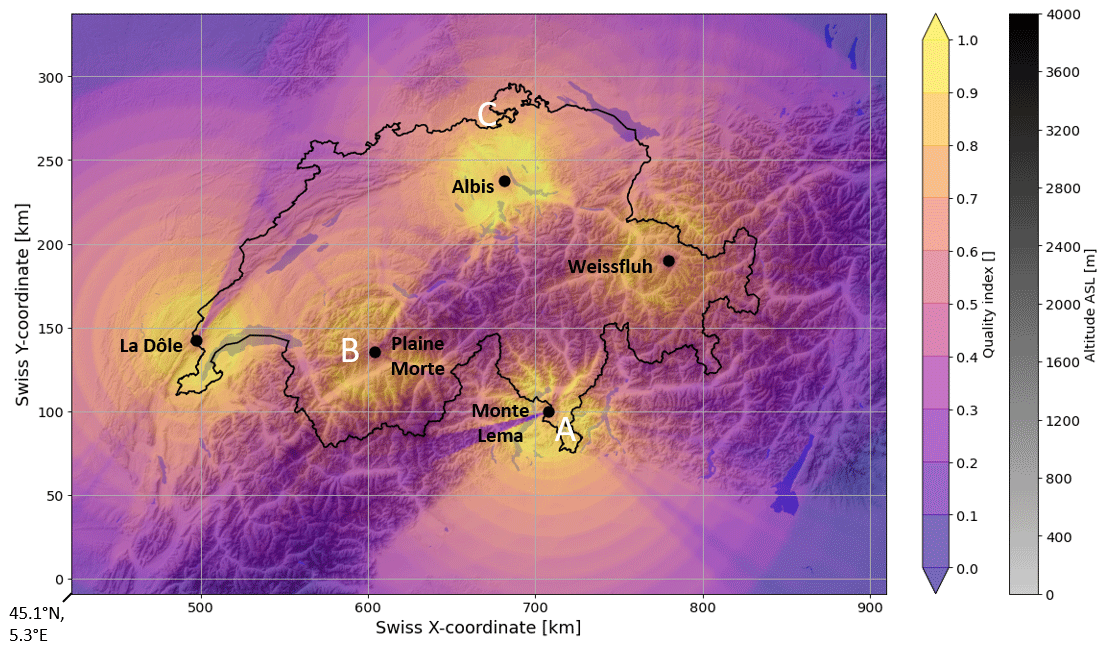
Figure 1Relative quality index for mesocyclone and thunderstorm detection in the Swiss weather radar network depicted over an elevation map. Case study locations (Figs. 2, D1 and D2) indicated with white letters; radar locations shown with black dots. Radar altitudes: Albis – 938 m, La Dôle – 1682 m, Monte Lema – 1626 m, Plaine Morte – 2937 m and Weissfluh – 2840 m.
All data are analysed for the years 2016–2020, for the months April through October. As the occurrence of supercells in Switzerland was a priori unknown, we consider an extended convective season to ensure an analysis of all significant events. As shown in Barras et al. (2021), this timeframe extends beyond the expected seasonal occurrence of severe convection. In this study we largely rely on the operational radar data of the Swiss Rad4Alp network. To pre-process the Doppler velocity data, the numerical weather prediction model COSMO (Consortium for Small-scale Modeling; Consortium for Small Scale Modelling, 2018; de Morsier et al., 2012) provides velocity data as an initialisation. We here use COSMO-1 analysis data which are produced operationally by MeteoSwiss at a spatial resolution of 1 km and a temporal resolution of 1 h, extracted within the Swiss radar domain. The model assimilates data from surface observations, radiosonde and wind profiles, as well as radar data. It is a convection-permitting model that partially resolves convective dynamics. As we use hourly model data to initialise a first-guess for 5 min radar data, the data are convolved using a 20 km kernel to smooth out smaller-scale convective dynamics and retain primarily the larger-scale flow (Feldmann et al., 2020).
Additional information is drawn from an operational classification of the general weather situation (Weusthoff, 2011) and a digital elevation model of Switzerland (©swisstopo, 2005; Jarvis et al., 2008). The digital elevation model, which is a merged product from ©swisstopo (2005) and Jarvis et al. (2008), provides elevation data over the Swiss radar domain. It is used to provide topographical context for our analyses and investigate the first-order influences of terrain. To characterise the meteorological and topographical environment of convection, we use a synoptic-type weather classification and a digital elevation model. The so-called GrossWetterTypes (GWT) weather classification provides eight different weather types over Switzerland that are based on the synoptic flow at 500 hPa geopotential height (Weusthoff, 2011). The classes directly correspond to the eight cardinal flow directions.
2.1 Operational radar network
The operational radar network of Switzerland, Rad4Alp, consists in five polarimetric C-band radars (see Fig. 1), as described in Germann et al. (2016) and MeteoSwiss (2018a). They are situated throughout the country at altitudes from 900 to 3000 m a.s.l. and provide a good coverage of both the plains, as well as the Alpine region. The data are processed at a resolution of . With the observation range extending up to 246 km, the coverage extends far beyond the country boundaries and allows for the observation of convective evolution that is approaching Switzerland. Each radar performs 20 elevation scans between −0.5 and 40∘ every 5 min. The high temporal resolution facilitates observing convective lifecycles, particularly in complex environments such as the Alpine terrain. The large range of elevation scans provides a dense vertical layering of observations, allowing for a measurement of precipitation as close to the surface as possible over complex terrain and extending up to high altitudes to cover the vertical extent of convection.
We use the 2-D Cartesian maximum-reflectivity product, as well as the 3-D dealiased Doppler velocity in polar coordinates. Due to relatively low Nyquist velocities in the raw Doppler velocity and complex airflow situations in thunderstorms, the aliased Doppler velocity poses a challenging dealiasing problem. Therefore, we initialise the Region-based Recursive Doppler Dealiasing (R2D2) algorithm (Feldmann et al., 2020) with a radial wind estimate from COSMO-1 analysis data (Consortium for Small Scale Modelling, 2018) to remove all velocity aliases. During this 5-year period, all five radars provide homogeneous data coverage with the same, synchronised scan strategy, and COSMO-1 data are available. Prior to 2016 the two high-altitude radars were not yet installed, and COSMO was operated at a 2 km spatial resolution.
To reliably detect mesocyclones in an Alpine context, we combine a 2-D thunderstorm detection and tracking algorithm with a 3-D mesocyclone detection algorithm. The mesocyclone detection activates within the identified thunderstorms.
3.1 Thunderstorm Detection and Tracking (T-DaTing)
The thunderstorm detection is based on a dynamic threshold algorithm, which works very similarly to MeteoSwiss's operational Thunderstorm Radar Tracking (TRT) algorithm (Hering et al., 2004). Cells are identified based on thresholds in the Cartesian maximum-reflectivity field. Adjoining cells' boundaries are identified by using a watershed algorithm. From one time step to the next, the motion of the cells is estimated by the pySTEPS optical flow (Pulkkinen et al., 2019) approach. Newly identified cells in the next time step with a large spatial overlap to previously advected cells are then matched. A more detailed description of the T-DaTing algorithm can be found in Appendix A. Key differences between TRT and T-DaTing are a fixed minimal detection threshold in T-DaTing, as opposed to the dynamic minimum threshold in TRT, and the cell advection with optical flow in T-DaTing versus extrapolating previous motion in TRT.
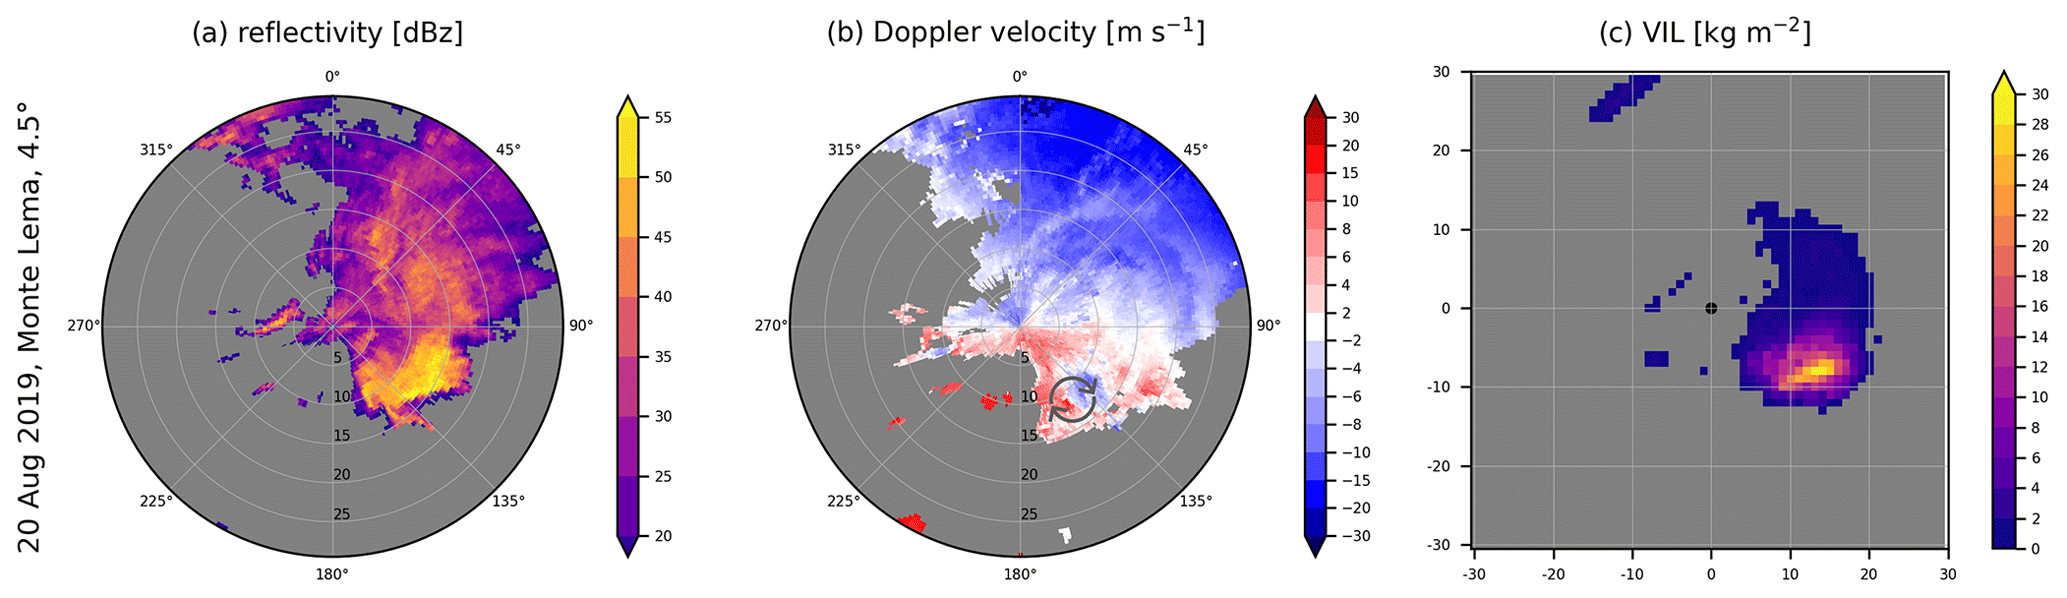
Figure 2Example of a supercell in the Southern Prealps; 20 August 2019 at 17:30 UTC.
3.2 Mesocyclone detection
Within the contours of the identified thunderstorm cells, the mesocyclone detection algorithm becomes active. This algorithm is modelled after the existing approaches of Stumpf et al. (1998) and Hengstebeck et al. (2018) but tailored to the specific requirements of the Swiss radar network. Identifying mesocyclonic rotation in radar data relies on estimating vertical rotation (around a vertical axis) from Doppler velocity data (Stumpf et al., 1998). As Doppler velocity only measures the radial component of the full velocity vector, it denotes the incoming or outgoing velocity of particles with respect to the radar. The azimuthal derivative is an approximation of vertical rotation (Miller et al., 2013) and corresponds to roughly half of the vertical vorticity component (see Appendix B, Eq. B2). Areas of a consistently high positive or negative azimuthal derivative indicate rotation phenomena. As there is no clear preference in rotation direction in Switzerland (Houze et al., 1993), we retain detections for both directions. At each radar elevation we employ object detection techniques to identify these areas and compute additional rotational metrics such as rotational velocity and vorticity per object (see Appendix B, Eqs. B2 and B1). All identified objects that meet the detection criteria are grouped within each cell and evaluated for vertical and temporal continuity (Hengstebeck et al., 2018). The definition of a mesocyclone applied here requires a minimum vorticity of 10−2 s−1 (Hengstebeck et al., 2018), a minimum rotational velocity of 10 m s−1 (Stumpf et al., 1998) and a signature depth of 3000 m (Stumpf et al., 1998). All of these criteria linearly decrease towards far ranges to compensate for decreasing spatial resolution (Stumpf et al., 1998), allowing for detections at more than 100 km distance from the radar and compensating for the decreasing spatial resolution. Signatures must persist over at least three detections, each at maximum two time steps apart. A detailed description of the algorithm is provided in Appendix B.
3.3 Data quality assessment
Considering the complexity of radar observations in mountainous terrain, this section introduces a method of estimating observational uncertainties within a radar network. We combine different aspects of the radar network to obtain a qualitative index that represents the relative quality of observations at a given location.
The considered properties are theoretical visibility, minimum and maximum altitude of measurements, spatial resolution, and numerical noise stemming from data quantisation. These metrics are assessed for each radar and merged onto a Cartesian grid, where the highest-quality metric is retained. The metrics are then rescaled between 0 (lowest quality) and 1 (highest quality) and combined into a general quality index. A detailed description of the computation of the quality index is in Appendix C.
This results in a spatial map of the quality index of the radar network. It is a qualitative index and only represents a relative comparison of detection probability, not a quantitative measure of correcting for detection gaps.
While the components contributing to the quality index are based on the full radar network and represent impacts to all radar products, not all observed meteorological phenomena are impacted equally by the limitations. The selection here is tailored to convective phenomena that can reach very high altitudes and require a high spatial resolution. Other combinations of these components lead to differing results; however the overall spatial pattern of the quality index is robust and representative of radar product quality in general.
Figure 1 depicts the results of the quality index assessment over the Swiss domain (the influence of each considered property is shown in Fig. C1 in Appendix C). The black dots indicate the locations of the five radars. With the topography underlain in the background, we can see the clear influence orography has on the quality index. This is primarily a consequence of radar beam blockage, which decreases visibility, particularly at low levels. Two noticeable artefacts are a dip in quality to the northeast of La Dôle and a similar gap in observations to the west of the Monte Lema radar. These artefacts stem from constructions in the vicinity of the radars blocking the visibility. The obstruction of Monte Lema is more recent and does not affect the entire analysis period. The decrease in quality in the main Alpine ridge is caused by beam blockage of terrain.
As an introduction to mesocyclonic rotation in an Alpine context, we first show an example case from the Southern Prealps, which are very prone to thunder- and hailstorms (Nisi et al., 2018; Schemm et al., 2016). Figure 2 shows the radar reflectivity, Doppler velocity and vertically integrated liquid (VIL) measured from the Monte Lema radar (marked A in Fig. 1) at 17:30 UTC on 20 August 2019. In the reflectivity data we can clearly see the location of the convective cell at 10–15 km range and 90–150∘ azimuth with values exceeding 45 dBZ, indicating strong convection. The shape of the area of high reflectivity shows the typical hook echo, which suggests the presence of prominent rotation (Markowski, 2002; Kumjian and Ryzhkov, 2008). The storm here is observed at an altitude of approximately 2500 m a.s.l. In the Doppler velocity data, we can see the opposition of inbound (red, following the Swiss convention of depicting Doppler velocity) and outbound (blue) velocities close to the hook, here presenting anticyclonic rotation (indicated with arrows), confirming the presence of a mesocyclone. While these signatures are quite clear, the rotational velocity is not particularly high in comparison to supercells in other regions (e.g. in the Great Plains, USA), here averaging around 12 m s−1. We can also see that VIL is elevated in the area of highest reflectivity but not extremely high. This indicates significant precipitation but not necessarily hail. The proximity to the radar may lead to an underestimation of VIL, as the upper part of the storm is above the highest radar beam. To represent the spatial heterogeneity in Switzerland, two additional case studies from the high Alpine region (marked B in Fig. 1) and the Rhine Valley (C) are provided in Appendix D. They show that supercells in Switzerland exhibit a range of rotational intensities and reflectivity features.
From here we will inspect the overall distribution and occurrence of mesocyclonic rotation over the Swiss domain during the 5 analysed years and compare this to the general occurrence of thunderstorms and the quality of the radar network. Table 1 gives an overview of the annual average convective activity.
Table 1Overall annual average occurrence of mesocyclones and thunderstorms during 2016–2020 in the Swiss weather radar network.
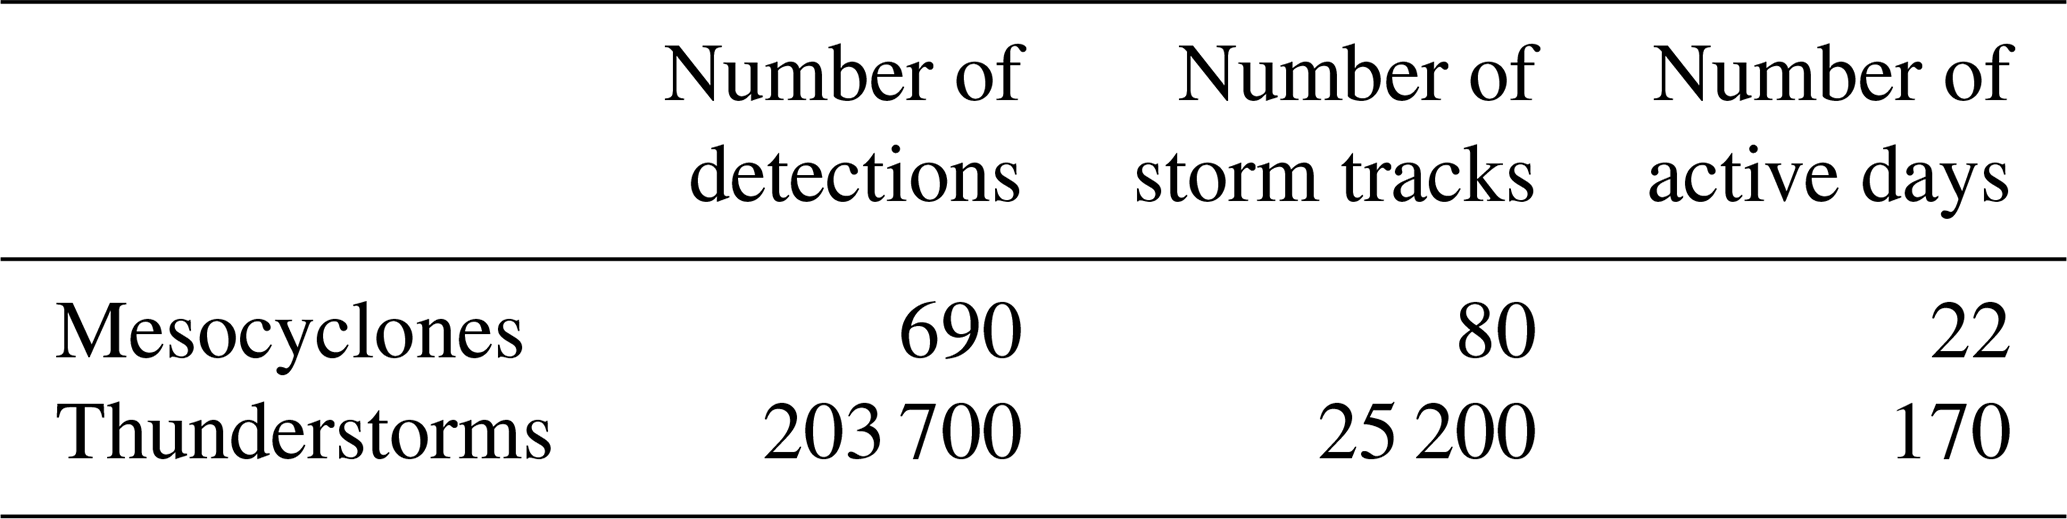
Approximately 10 % of days during the convective season had at least one mesocyclone within the Swiss domain. T-DaTing is configured to detect storms exceeding 50 km2 to focus on more significant convective systems (see Appendix A); 0.3 % of all detected thunderstorms showed mesocyclonic rotation. Overall the earliest detected mesocyclone was in the last week of April, and the latest was in the beginning of the last week of October.

Figure 3Annual average individual detections of (a) thunderstorms and (b) mesocyclones from 2016–2020 per 25 km2. Highlighted regions of interest: Zurich Oberland, Napf, Bernese Alps and Southern Prealps.
Figure 3a shows the annual average spatial distribution and density of the 5-year thunderstorm and mesocyclone analysis. Thunderstorms are clustered in the Prealpine valleys in moderately high topography. In absolute terms the main hotspot is to the south of the Alps in the canton Ticino. The Alps serve as a meteorological divide, separating northern Switzerland from Mediterranean air masses (MeteoSwiss, 2018b). Ticino experiences more subtropical, Mediterranean conditions than the rest of Switzerland, with generally higher temperatures and frequently high relative humidity (Nisi et al., 2016; MeteoSwiss, 2018b). These conditions are more conducive to convective initiation and development. Topography can induce convection through valley wind systems (Linder et al., 1999; Rampanelli et al., 2004; Nisi et al., 2016). Particularly in the afternoon hours, upslope winds cause convergence over ridges and can provide the initial lift needed to overcome convective inhibition. We can also see that the frequency of thunderstorm detections is higher in the vicinity of the radars. If we compare the spatial distribution of thunderstorms to the relative-quality map of the Swiss domain, we can clearly see that more thunderstorms are detected in locations where the quality index is high. While we do not establish a quantitative relationship, a lower quality index increases the probability of underestimating thunderstorm occurrence. Nonetheless, the dominant spatial trends of convective preference in the Prealps are meteorologically consistent with orographic convection and can be confirmed with lightning climatologies (Enno et al., 2020; MeteoSwiss, 2016). The clearest deviation from meteorological expectations can be seen to the northeast and southwest of the Jura. Beam blockage significantly lowers the capability of the La Dôle radar to accurately observe convective events in these areas. While we may underestimate thunderstorm occurrence in the inner Alpine regions, where the quality index is lower, the reduced convective activity here is confirmed by independent lightning climatologies (Enno et al., 2020; MeteoSwiss, 2016). Moreover, the spatial patterns do not significantly change in the vicinity of the Alpine radars Plaine Morte and Weissfluh, where the quality index is higher.
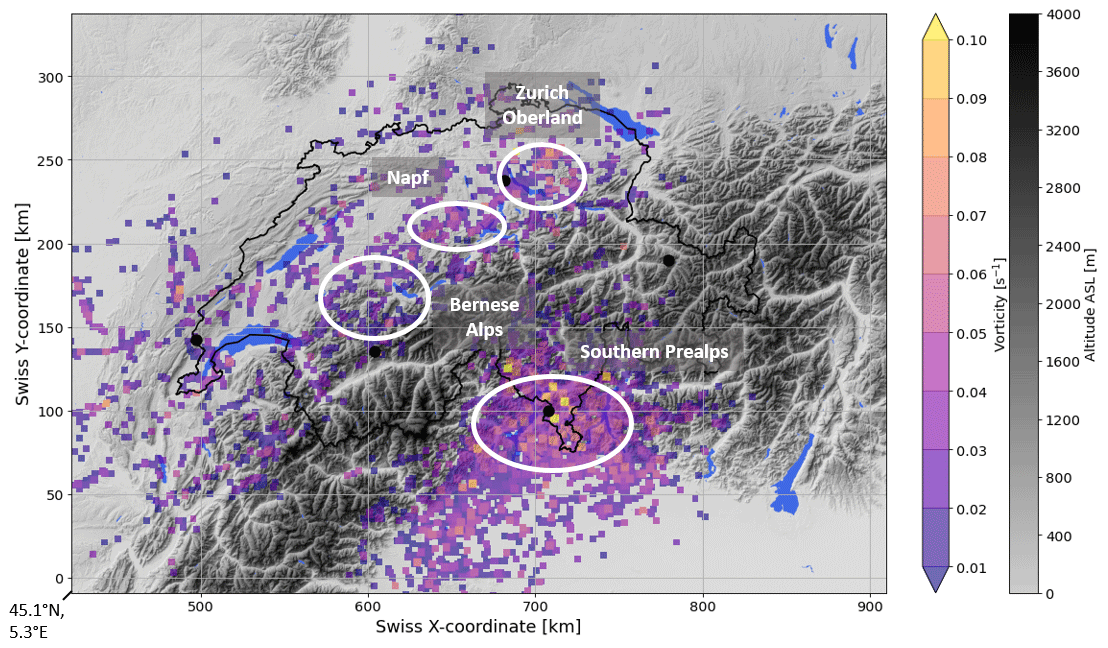
Figure 4Maximum detected vorticity per 25 km2 during 5 years (2016–2020).
Shifting our focus to the annual average spatial distribution of thunderstorm tracks that contain a mesocyclone in Fig. 3b, we can see a similar spatial pattern. Most mesocyclonic storms occur to the south of the Alps. In the north, they largely occur in Prealpine areas. A small but relevant hotspot can be seen in the Napf area to the west of Lake Lucerne. Additionally the Bernese Alps and Zurich Oberland are areas of elevated frequency. Both the global maximum in Ticino and the local maxima in the Northern Prealps correspond to hail occurrence maxima (NCCS, 2021; Nisi et al., 2018; Trefalt et al., 2018). Considering that hail is a known consequence of severe weather of mesocyclones, this overlap reinforces the robustness of the obtained spatial distribution. We can see a lesser dependence of detections on the quality index. This may be due to the fact that mesocyclones generally have a large vertical extent and can be detected in multiple consecutive elevation scans, thus being less dependent on accurate measurements in single elevation scans. Range-dependent rotation thresholds compensate for decreasing measurement resolution with range and allow mesocyclones to be detected even beyond a range of 100 km per radar. The most issues can still be noted over the Jura, where the beam blockage of the La Dôle radar impacts the first 10 elevation scans. The beam blockage in this area is severe enough that confirmed cases of mesocyclones are missed in this region. This is illustrated by the case study of a tornado near Neuchâtel in Grazioli et al. (2019), in which the data from both a mobile, X-band radar that was tracking this storm cell and the operational C-band data are analysed. The rotation is clearly visible in the X-band data; however from the La Dôle radar the rotation is undetectable, and the location is at a far range from the Albis radar.
Figure 4 shows the maximum measured vorticity values of all detected mesocyclones. The values range from to s−1, with a mean of s−1. The typical mesocyclone definition (Stumpf et al., 1998) requires a vorticity of 10−2 s−1, showing that the average event is twice as strong and the extremes exceed this value by an order of magnitude. The lower minimum value stems from the use of range-dependent thresholds, where we lower the vorticity requirement with increasing distance to the radars to compensate for decreasing spatial resolution (see Appendix B).
The largest cluster of high vorticity values is located around the Ticino hotspot. The Napf area and Zurich Oberland also show consistently elevated values of vorticity. This is not the case for the Bernese Alps, where the vorticity values are on the low end of the spectrum and close to the detection threshold. The topography is significantly more complex here, which may impact a storm's capability to maintain strong rotation.
The spatial overlap of the strongest rotation concurring with the largest size hail in the Napf region and southern Ticino established in longer-term hail climatologies (NCCS, 2021) indicates that stronger rotation usually favours larger hail (Allen, 2018; Blair et al., 2017; Witt et al., 2018). However the differences in the Bernese Alps, where we have large hail but low rotation velocities, and Zurich Oberland, where we have high rotation velocities but smaller hail, show that there may also be other factors at play, warranting further investigation. The Bernese Alps have a reduced quality index, due to beam blockage to the northeast of the Plaine Morte radar. This may interfere with the ability to reliably detect and estimate the intensity of vortices. Discrepancies may also be owed to the relatively short duration of the 5-year analysis.
4.1 Dependency on synoptic-weather situation
The synoptic weather classification GrossWetterTypes (GWT) provides insight in which conditions mesocyclones are likely to occur. Figure 5a shows the complete tracks of all detected mesocyclones (lines) as well as the location of mesocyclone initiation (dots), colour-coded by the corresponding flow direction. Figure 5b provides a histogram of the overall occurrence of all weather classes during the analysed period, in comparison to the histogram focusing on the days with mesocyclone activity. Figure 5c presents the fraction of days in each weather class that produce a mesocyclone during the analysis period.
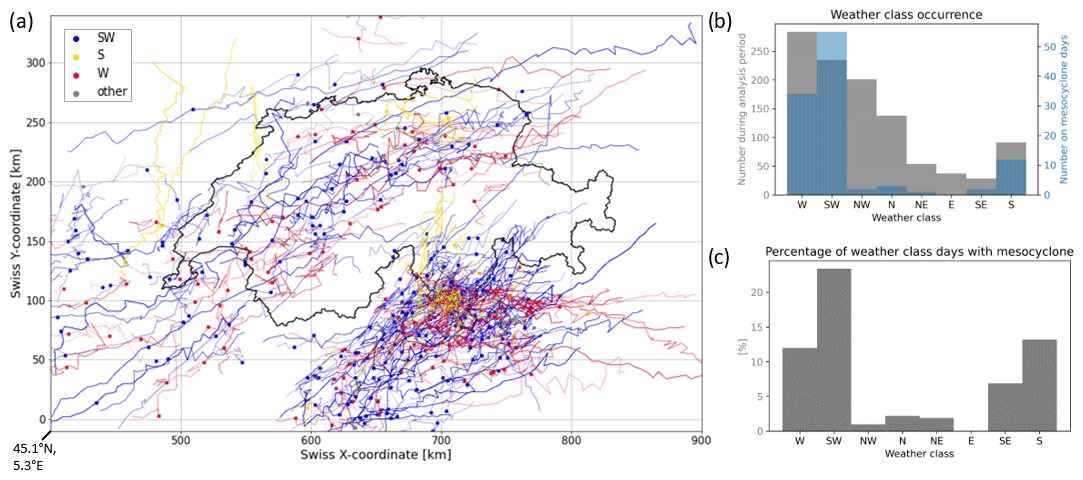
Figure 5(a) Spatial dependency of the synoptic situation based on prevailing flow at 500 hPa. Lines show complete tracks of mesocyclones; dots depict mesocyclone initiation. (b) Histograms of weather class occurrence during entire analysis period and during mesocyclone days. (c) Percentage of days per weather class with mesocyclone activity.
Flow from the southwest is responsible for the majority (55 %) of mesocyclone detections. These situations are generally characterised by air masses originating in the warm, humid Mediterranean area. They hold high amounts of convective available potential energy (CAPE) and moisture, thus presenting favourable conditions for severe convection. In the analysed time period, approximately 25 % of days with a southwesterly flow produced at least one mesocyclone (see Fig. 5c). Amongst others, Mohr et al. (2020) and Wapler and James (2014) show that a southwesterly flow induces favourable conditions for deep, moist convection in most of central and western Europe. A particularly potent synoptic constellation is called the “Spanish plume” (Morris, 1986; Peyraud, 2013), where the low-level southwesterly flow is in the prefrontal zone of an approaching cold front over France; the mid-level flow supplies warm, dry air stemming from the Iberian peninsula; and the upper-level flow is westerly, with cooler, Atlantic air. This leads to high amounts of CAPE in addition to lifting occurring through the approaching front. The vertical change in flow direction provides directional wind shear, which is beneficial for mesocyclone development (Peyraud, 2013). Depending on the altitude of the transition to the westerly upper-level flow, a fraction of Spanish plume events may also be classified as westerly flow in the GWT classification. As shown in Schemm et al. (2016), approaching fronts also play an important role in hail formation, particularly in Swiss regions, where hail falls less frequently.
Westerly flow is the second most frequent flow direction during mesocyclones, contributing to a third of all detections, followed by southerly flow at ∼10 %. Both have similar characteristics as southwesterly flow but less reliably yield the optimal conditions for severe convection (each approximately 12 % of the time; see Fig. 5c). As Fig. 5b shows, westerly flow is the most common flow situation in Switzerland (MeteoSwiss, 2018b) and rather brings Atlantic air masses to Switzerland. Roughly 10 % of days with westerly flow produce at least one mesocyclone. Southerly flow is more prevalent to the south of the Alps but already leads to much less mesocyclone cases. To the north, there are only few cases that are displaced further north, as descending air crossing the Alps does not provide favourable conditions. Other flow directions play a very small role and are only responsible for very few cases (<5 %).
As the track lines in Fig. 5a indicate, the synoptic flow steers the main direction of storm tracks while allowing for the deviation of left- and right-moving storms. Histograms of storm direction per weather class cluster in a Gaussian distribution around the direction of synoptic flow (figures not shown). Given the synoptic-scale criteria for the weather classification, the mesoscale flow at the steering level of convection (5000–7000 m a.s.l.; Foresti et al., 2018) can also deviate from the classification.
While southwesterly flow also plays an important role in hailstorms, it is not the dominant weather class (Nisi et al., 2018). Hailstorms predominantly form in westerly flow, which is also the most frequent weather class. With hail also occurring much more frequently (Barras et al., 2019; Nisi et al., 2018), it appears that westerly flow yields conditions that are sufficient for hail production but not as frequently for mesocyclone formation. Westerly flow also leads to a hail hotspot in the northern Jura, where the quality of Doppler velocity data is limited and we potentially miss mesocyclones.

Figure 6Diurnal cycle of convection (a). Each 2 h bin shows the number of tracks beginning at this time. Diurnal cycle of mesocyclone track properties (b). Each 2 h bin shows the cumulative track area and length of tracks beginning at this time.
4.2 Diurnal cycle
The occurrence of mesocyclones shows a pronounced diurnal cycle that mirrors the cycle of convection in general (see Fig. 6a). The majority of storms occur in the afternoon and first half of the night, with the peak of formation at 15:00 UTC. Mesocyclones, however, show a local, smaller peak, during the second half of the night as well (00:00–04:00 UTC) and then a minimum in the early morning at 04:00 UTC. Thunderstorms in general drop to a lower occurrence from 00:00–10:00 UTC but can initiate at all hours of the day. The base frequency at unfavourable hours in the late night and early morning is almost constant.
In comparison to this frequency distribution, there is also a diurnal cycle reflected in cumulated storm area and track length, as shown in Fig. 6b. The storm area refers to the cumulative area over the entire storm track, whereas the track length refers to the overall distance along the path of the storm track. The behaviour of the track duration mirrors the track length (not shown here). In contrast to the occurrence histogram, the global peak of both variables is at 12:00 UTC, before the peak mesocyclone occurrence time in the day. A local peak is additionally found at 04:00 UTC during the minimum of mesocyclone occurrence. Even though the sample size is very small (<10), this shows parallels to research conducted on hailstorms, where the longest and largest storms also occur outside hours of the convective peak (Nisi et al., 2018). Due to the significant drop in convective activity at this time of day, this indicates a significant overlap between mesocyclones identified here and hailstorms analysed in Nisi et al. (2018). In spite of the small sample present, this agreement with severe-hailstorm behaviour also reinforces the notion found in Nisi et al. (2018) that convective storms that initiate during unfavourable hours of the day are more likely to be severe, whereas the most active hours of the day contain a larger fraction of less intense storms. As this hypothesis based on the small sample in the mesocyclone data set is rather speculative, it should be revisited once longer homogeneous data series are available.
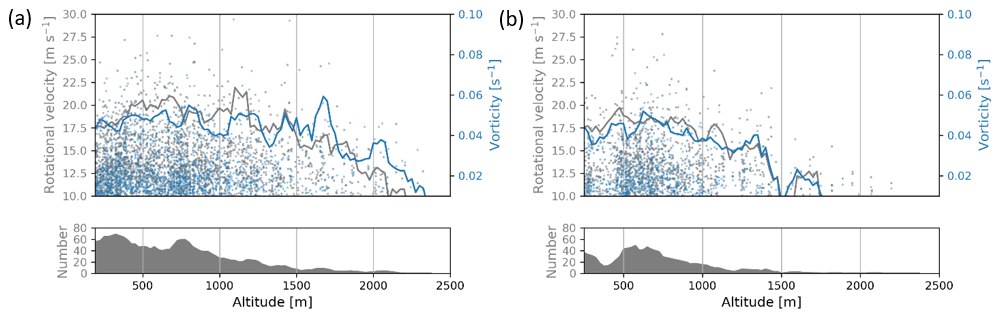
Figure 7Topographical influence on rotational metrics; scatterplot of rotational velocity and vorticity versus altitude. The grey and blue lines indicate the smoothed 95th percentile; the lower graph shows the number of detection per altitude. (a) Cases detected by the Monte Lema radar (south); (b) cases detected by the Albis and La Dôle radars (north).
4.3 Terrain
Utilising the data from the digital elevation model, we can see that the majority of rotating storms move uphill during their lifetime. With the majority of storms occurring in Ticino (∼60 % of mesocyclones are detected from the Monte Lema radar) and a southwesterly flow direction dominating here, many storms follow a northeasterly path towards the main Alpine ridge (see Fig. 5), thus moving uphill. As Fig. 7a shows, in the south of the Alps, up to an altitude of approximately 1500 m, the storms do not show an intensity correlation to altitude. Beyond that, a higher altitude negatively impacts the upper potential of intensity metrics such as rotational velocity and vorticity, here shown by the decreasing trend in the 95th percentile. The same effect can be seen to the north of the Alps, however at a lower altitude. With the storm tracks being more parallel to the Alps (see Fig. 5), fewer storms move uphill and encounter higher altitudes. In both cases the lowering in intensity is mirrored by a lowering in case numbers with altitude. Similar trends can be observed for vertical extent and maximum reflectivity (not shown). Storms with weak rotation occur throughout the entire domain and dominate the intensity distribution; however with increasing altitude the upper percentiles decrease, indicating a limit to the potential rotational intensity a storm can achieve in this environment. As the number distribution with altitude shows, the majority of storms are detected in lower-altitude regions. This concentration in relatively flat areas within the Prealpine region, such as the larger valleys and lakes, is also shown in Fig. 3. At high altitudes beyond 1500 m a.s.l. the terrain becomes increasingly complex with steep slopes and rapid altitude changes. We hypothesise that this could impact the low-level dynamics of a supercell, disturbing the generation of vorticity at the outflow boundary and its advection back into the storm in the inflow.
As the quality index also decreases over the main Alpine ridge, the probability of underestimating mesocyclone occurrence here also rises. However, as shown in Enno et al. (2020) and MeteoSwiss (2016), the overall thunderstorm frequency, derived from radar-independent lightning data, also decreases significantly here, indicating that we are observing a true trend and not a limitation of the radar network.
With the majority of storms located in the Prealpine regions, orographic triggers for convective initiation play an important role in Switzerland (Nisi et al., 2016; Linder et al., 1999). The main Alpine ridge poses a strong separation for thunderstorms. With the thunderstorm frequency dropping substantially over the inner Alpine regions in Fig. 3a, we can see that thunderstorm tracks generally do not persist crossing the Alpine ridge. In Fig. 3b we can see the inner Alpine regions devoid of rotation detections. Additionally, Fig. 5a shows only one mesocyclone track crossing the Alps, while all other tracks heading towards the main Alpine ridge decay priorly. This supports the hypothesis that high-altitude mountainous terrain has an inhibiting impact on the rotation dynamics of a thunderstorm.
The implementation of a radar-based mesocyclone detection algorithm and the analysis of the years 2016–2020 allows for a first-time assessment of the occurrence of mesocyclones in Switzerland. Around 80 thunderstorms per convective season (April–October) had a mesocyclone, distributed over 22 d per convective season. It is evident that mesocyclones can be detected and tracked in a large portion of the Swiss radar domain. While range is usually a limitation, the maximum detectable range for mesocyclones in the Swiss radar network exceeds 100 km per radar. The accompanying relative quality index map helps interpret where the mesocyclone detection is impeded by the physical limitations of the radar network. The most pronounced limitations are over the Jura in northwestern Switzerland and over the inner, main Alpine ridge, as well as at far ranges outside of Switzerland.
The 5-year analysis allows for a first assessment of the overall frequency and spatial distribution of mesocyclones in the Swiss domain. The absolute maximum of detections lies in the Southern Prealps. The Monte Lema radar, situated in this region, detects approximately 60 % of all mesocyclones, with the other half being distributed rather evenly between the other four radars. Smaller, local maxima lie in the Prealpine valleys to the north of the Alps, such as in the Bernese Alps, the Napf region and the Zurich Oberland. This spatial distribution parallels that of hailstorms (NCCS, 2021).
Clear characteristics emerge and show parallels to other features of convection in Switzerland, such as the importance of the synoptic flow and the pronounced diurnal cycle. Southwesterly flow is the most conducive for mesocyclone occurrence, followed by westerly and southerly flow. The diurnal cycle of mesocyclone initiation shows a clear peak in the late-afternoon hours and a minimum in the early-morning hours, mirroring the diurnal cycle of thunderstorms in general. Size metrics such as area and track length however indicate that the few storms occurring during the minimum tend to be larger and last longer. This tendency can also be observed in hailstorms (Nisi et al., 2018), indicating a probable overlap between the two storm populations. The importance of southwesterly flow to convection in central and western Europe is also shown in Wapler and James (2014) and Mohr et al. (2020), which highlights the significance of synoptic flow for large regions.
With mesocyclones being rather rare events, longer timelines are necessary to establish robust assessments of interannual variability and seasonal trends. The spatial distribution can also be evaluated more robustly with a longer analysis period, as low-activity regions are currently dominated by the characteristics of single events. Data prior to 2016 were not used in this study, as major changes in the radar network took place at that time.
The spatial distribution of both thunderstorms and mesocyclones shows that terrain has a clear influence on the initiation of convection. Similarly, the inner Alpine regions are devoid of mesocyclones, indicating that steep, high-altitude environments have a negative influence on rotational dynamics. Rotational metrics show a negative correlation with increasingly high altitudes as well.
After establishing this first-time assessment of mesocyclones in Switzerland, future work is required to clarify the severe-weather consequences of mesocyclones in Switzerland and further investigate the interactions with the complex terrain.
The Thunderstorm Detection and Tracking (T-DaTing) algorithm utilises image processing, computer vision and optical flow techniques to identify thunderstorms and track them in time. The 2-D Cartesian maximum-reflectivity field of the Swiss operational radar network is used as input. Its spatial resolution is 1×1 km2, and it is generated every 5 min. All thresholds are tuned to this input data (Hering et al., 2004) but are adaptable to other data sets. This algorithm has been published as a part of the pySTEPS package (PySteps developers, 2021).
A1 Thunderstorm detection
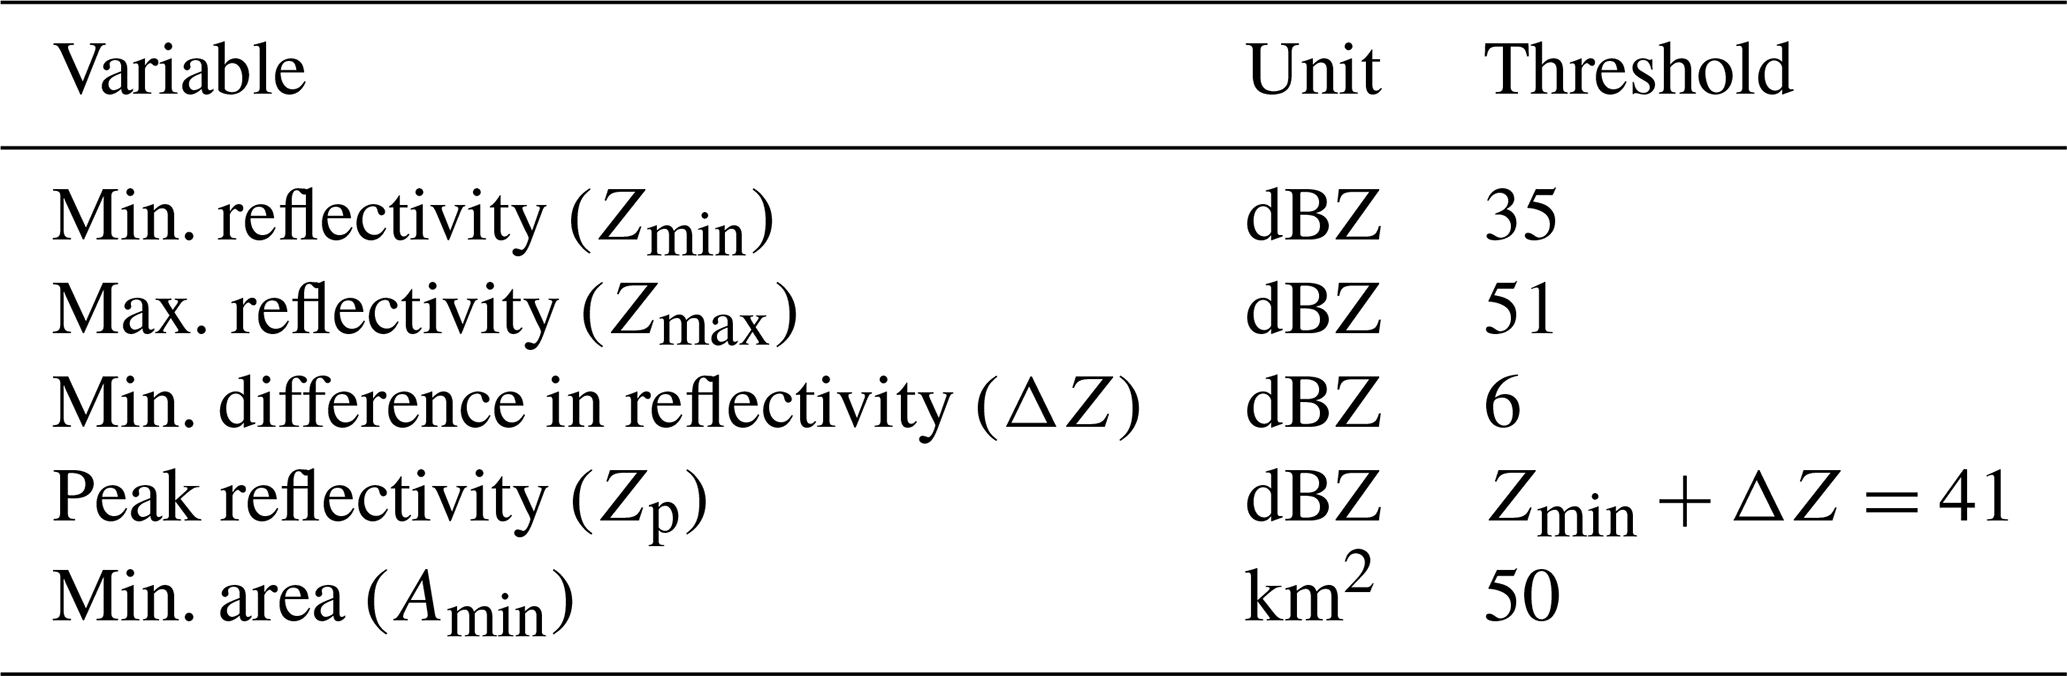
The detection of thunderstorms follows a dynamic, multi-threshold approach. The procedure is modelled after MeteoSwiss's operationally running TRT algorithm (Hering et al., 2004). All thresholds are listed in Table A1 and stem from Hering et al. (2004).
Utilising the 2-D maximum-reflectivity composite from all five radars, in a first step, all areas below the minimum reflectivity Zmin are discarded. All remaining areas need to have a peak reflectivity value exceeding Zp and be larger than the area Amin. We chose a relatively large size limit here, as we are interested in supercellular convection, which generally takes place on larger spatial scales. The next step uses local maxima within the area boundaries to determine whether these should be further split into separate convective cells. To avoid excessive splitting in areas of very high reflectivity values, where there are many extreme local maxima, the data are saturated at the maximum reflectivity Zmax. Within these areas exceeding Zmin, a local maximum detection algorithm is employed (van der Walt et al., 2014). Maxima within a consecutive area are counted as separate if the path of least change between them decreases by at least ΔZ. Maxima within 10 km of each other are merged to avoid excessive cell splitting. The remaining maxima are used as anchors for the cells. To separate cells that lie within the same connected area, an inverted watershed algorithm (Beucher and Lantuejoul, 1979; van der Walt et al., 2014) assigns the corresponding areas to each maximum. Thus the boundaries of the inverted watershed algorithm lie along the lowest values of reflectivity in between maxima that are within the same consecutive area but have a reflectivity drop of at least ΔZ in between them.
This produces the labelled areas for the identified thunderstorm cells. The detection part of the algorithm can be performed on any length of data and does not require temporal continuity. It yields results very similar to Hering et al. (2004); the main deviations are a larger minimum size and the introduction of the minimum distance between maxima. Additionally contours are slightly larger, as they always extend to the boundary of Zmin.
A2 Thunderstorm tracking
After detecting the thunderstorm cells, the tracking part of the algorithm estimates the future path of each cell, propagates it and matches it to the detected cells in the next time step.
The movement of the cells is estimated from three consecutive frames of the 2-D input data. The Lucas–Kanade optical flow algorithm (Lucas and Kanade, 1981) applied to the current and previous two time steps of the maximum-reflectivity field yields the projected movement for the next time step (Pulkkinen et al., 2019). Each cell of the previous time step is propagated according to the results from the optical flow. This is then compared to the identified cells of the current time step. If the overlap between two cells is more than 50 %, they are considered the same cell and assigned the same ID as before. If there is no overlap to a new cell, the cell track ends, and this ID is no longer used. If there is no previous cell matching a new cell, a new ID is generated, and thus a new track is initiated. If a cell splits, the smaller fraction is considered a new cell and obtains a new ID. In the case of merging, the smaller (area) cell is considered decayed where the track of the larger one continues in the merged cell.
For each step, the x and y coordinates, maximum reflectivity, centroids, area, and distance from last detection are recorded.
In a final step the detections from each time step are resorted into the tracks assigned to their IDs. Tracks shorter than three detections are rejected.
The tracking procedure follows the same steps as Hering et al. (2004). However where previously the cell motion from one detection to the next was estimated by the past track of the cell, we extrapolate the motion from one detection to the next utilising the output of the optical flow algorithm (PySteps developers, 2021; Pulkkinen et al., 2019) applied to the three latest time steps.
T-DaTing provides the constraints for the mesocyclone detection algorithm. The detected thunderstorm areas are used as a mask to filter out data unrelated to convection. Additionally, all rotation detected within a cell is assigned to this cell.
B1 Data preparation
To filter the relevant data, the detected thunderstorm areas are dilated with a 5×5 km2 kernel. Since mesocyclones can be located outside of the area of largest reflectivity (Kumjian and Ryzhkov, 2008), we consider areas slightly larger than each detected cell. One by one, the algorithm then iterates through the detected cells.
To compute rotation, the dealiased velocity data from all 5 radars and 20 elevations is used. The dealiasing procedure is performed with the novel algorithm R2D2, and COSMO-1 analysis data are used as a first guess. As the velocity data are in polar coordinates, the filter obtained from the Cartesian reflectivity filter is regridded to the polar grid of each radar. Additionally the first 5 km in range from each radar are excluded from processing, due to excessive noise in the data.
For each elevation the azimuthal-velocity shear is computed using a centred-difference method. In the case of residual velocity folds or dealiasing errors, a quality check is in place. If an area of more than three adjacent pixels exceeds the Nyquist velocity (Fabry, 2015) of the corresponding elevation, the Nyquist interval is added or subtracted to reduce the absolute value of the shear in this area. With Nyquist velocities being quite low (Feldmann et al., 2020), particularly in the lower elevations, the azimuthal shear can physically exceed the Nyquist interval. However, usually this will occur in isolated high-shear gates and not in larger areas. Velocity folds and dealiasing errors however produce contiguous lines of erroneous azimuthal shear and can thus be corrected for in this method. The mesocyclone detection presented here is thus less sensitive to dealiasing errors as long as the edges of folds can be distinguished from physical shear and the estimation of rotational velocity does not cross a velocity alias.
B2 Rotation detection
Within each elevation, the convective cells are evaluated iteratively. From the azimuthal shear , first pattern vectors are constructed. Consecutive areas of shear exceeding a threshold are conserved if they exceed 1 km in length and contain at least three gates. All other data are discarded. These pattern vectors are merged over the ranges using 8-bit connectivity. If pattern vectors neighbour each other over a corner or directly, they are considered one area. These resulting areas are then further evaluated. They each need to exceed a minimum rotational velocity and vorticity threshold Δv (Eq. B1) and ζ (Eq. B2; see Table B1). Additionally, their aspect ratio needs to be less than 1:3, approximating circular objects.
and
where Δx is the Cartesian distance between the velocity maxima.
All rotation areas identified in this way are collected. For each area the location of the centroids, size, rotational metrics, elevation and thunderstorm ID are recorded. Within one cell, more than one detection is possible per elevation, as rotational signatures can be fragmented. Positive and negative azimuthal shear are evaluated separately to differentiate cyclonic and anticyclonic rotation signatures.
B3 Vertical continuity
After processing all elevations of one radar, the detected rotation objects are merged. All objects of one thunderstorm ID are considered to belong together and are stacked vertically, as the storm structure can be slanted and detections can be discontinuous due to residual aliasing in the velocity data. Additionally, the vertical depth of the lowest and highest detection must exceed a certain depth h.
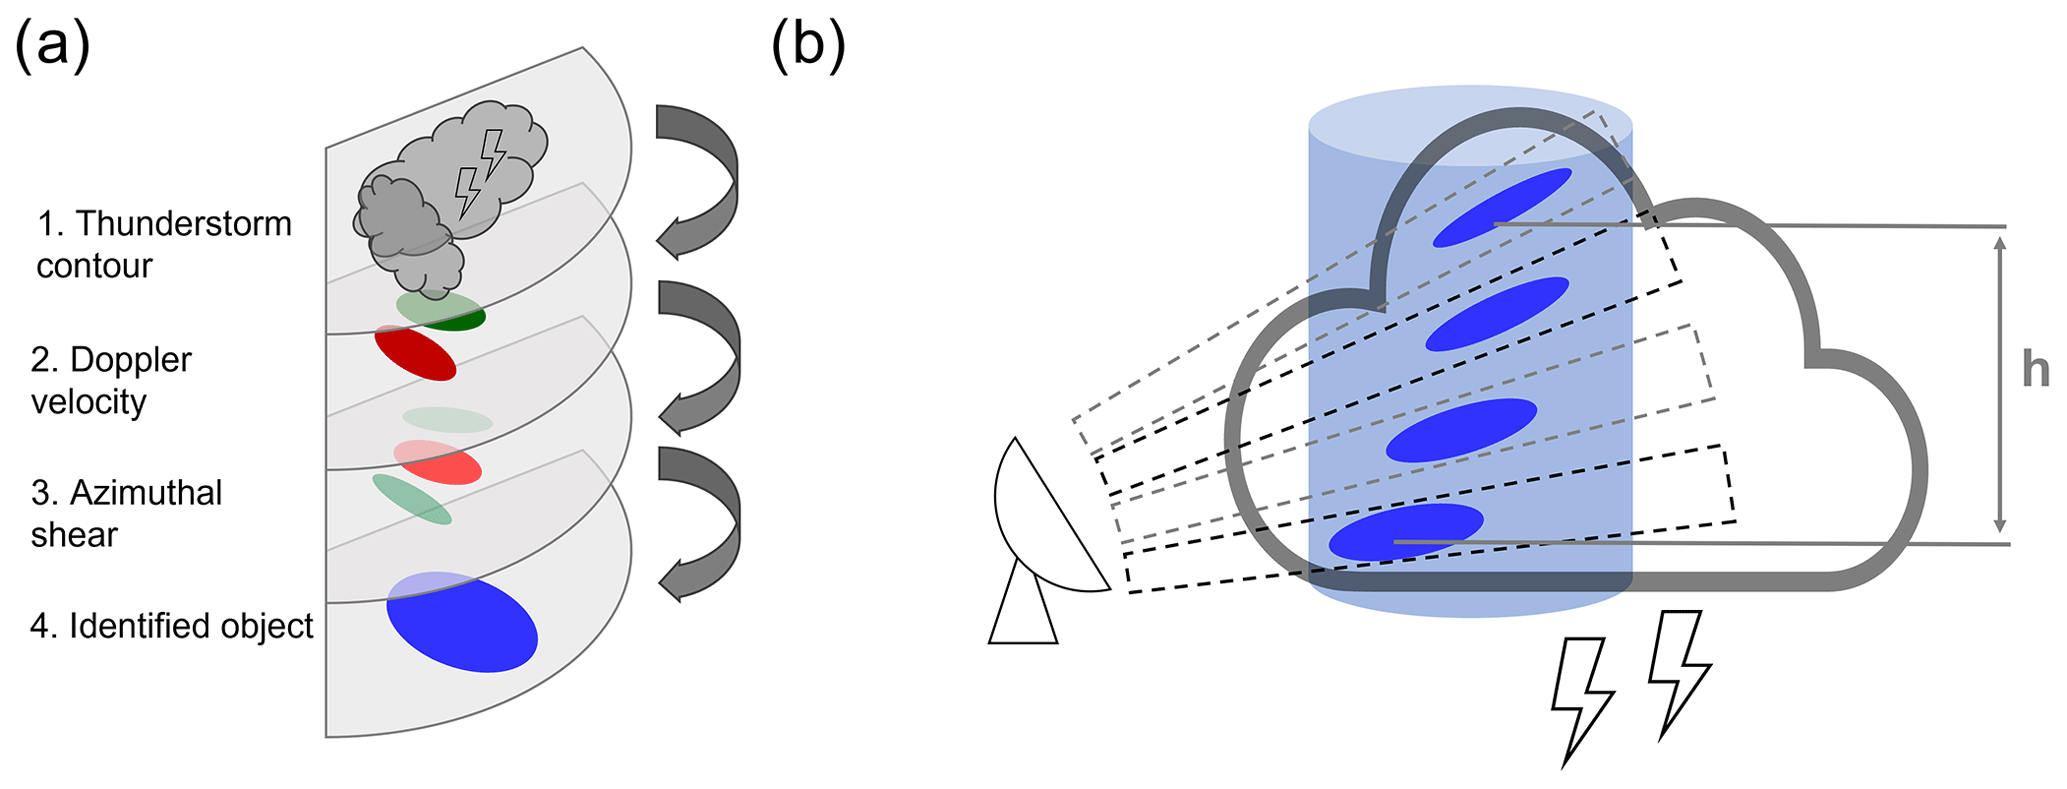
Figure B1Schematic of mesocyclone detection. (a) Detection of rotation within radar elevations. (b) Vertical merging of detections within thunderstorm contours.
Table B1Mesocyclone detection thresholds following Stumpf et al. (1998) and Hengstebeck et al. (2018).
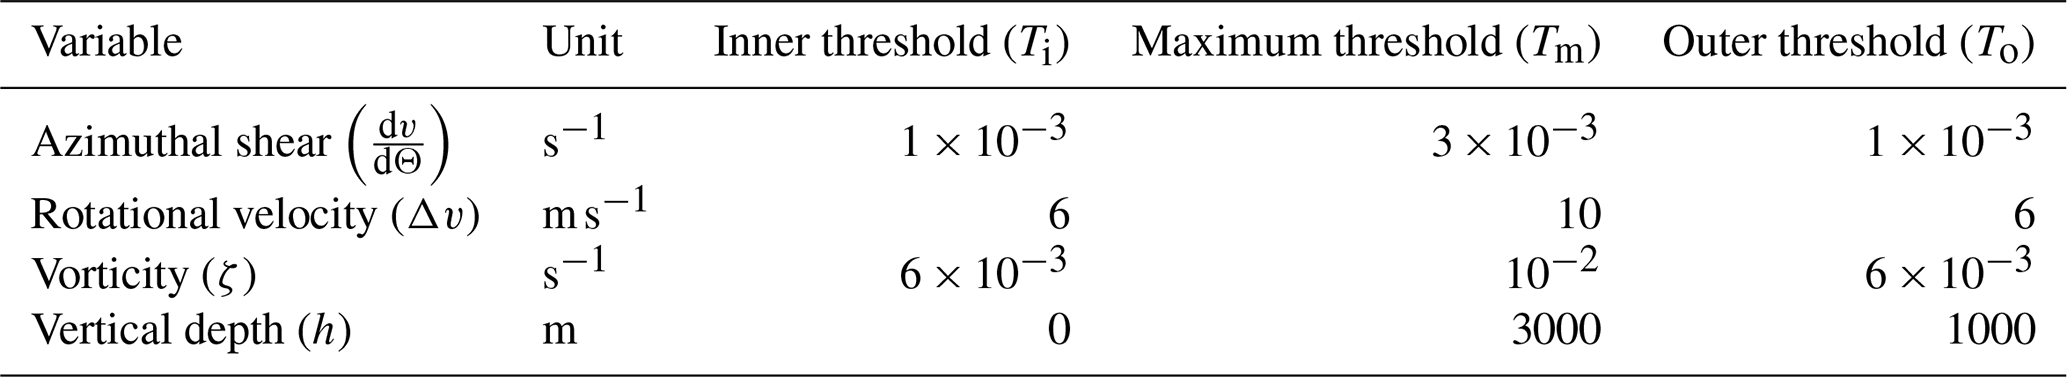
Figure B1 shows a schematic overview of the detection process until this point. Figure B1a shows the process within a radar elevation. First the data are filtered with the contours identified in T-DaTing, here approximated with the dark-grey cloud (1). Then the velocity data (2) are evaluated. Here green denotes outbound velocity from the radar, and red denotes inbound velocity. From the velocity, the azimuthal derivative is derived (3), which results in anomalies in the derivative around the velocity couplet. Cyclonic anomalies are shown in light red here, and anticyclonic anomalies are in light green. Within these anomalies the rotational velocity and vorticity are computed and measured against thresholds, here resulting in one final rotation object shown in blue (4). In Fig. B1b the aggregation of rotation objects within a thunderstorm contour is shown. Detections (blue ovals) from each elevation (dashed slices) within the contour contribute to the overall vertical structure. To these identified objects the vertical continuity constraints on h are applied. After exceeding all criteria, the objects are summarised as one rotation column (light-blue column) for the corresponding convective cell. Also here, anticyclonic and cyclonic signatures are considered separately and must each fulfil all criteria to be recorded and are stored as separate columns.
B4 Range-dependent thresholds
All detection criteria are range-dependent thresholds T (Stumpf et al., 1998). The thresholds are most strict at a range of 20 km at Tm and decrease outwards until 100 km to To, from where they remain stationary. Within 20 km they decrease towards the radar to Ti. The decrease of the thresholds with range compensates for the reduction in resolution in the data. Within 20 km, the decreased thresholds aim to allow for detections in the noisy shear data at small azimuthal distances. The following table depicts the values chosen in the algorithm here.
The range-dependent thresholds help detect significant rotation in complex observation situations. Due to the complex nature of the Swiss terrain, there is often no visibility of the lower portion of a storm. Additionally, the environmental conditions allowing for supercellular convection in Switzerland generally show a lower vertical shear than e.g. in the US plains. We tuned the thresholds by investigating visually confirmed cases of supercellular convection and range-dependent thresholds that relax at very close and far ranges. While this may detect more storms as supercells that were merely exhibiting significant rotation but otherwise lack the typical storm structure, we avoid missing detections due to observational issues.
B5 Temporal continuity
Within a valid thunderstorm track, rotation of the same sign must have been detected at least three times within 10 min of each other. Additionally the rotation track must leave the range of 20 km around a radar. In strong linear wind situations, the geometric nature of the radial velocity produces artificial rotation signatures at opposing sides of the radar that remain stationary. These can produce false detections but are easily removable considering that thunderstorms generally propagate.
The relative quality index combines multiple physical constraints of the Swiss radar network and combines them to a single, summarising quality index. The characteristics we include are the vertical sum of theoretical visibility V (dimensionless; ranging from 0–1 for each elevation, in total ranging from 0–20), minimum altitude of observation hmin (m), maximum altitude of observation hmax (m), azimuthal resolution ΔΘ (m) and discretisation in velocity shear ϵ (s−1).
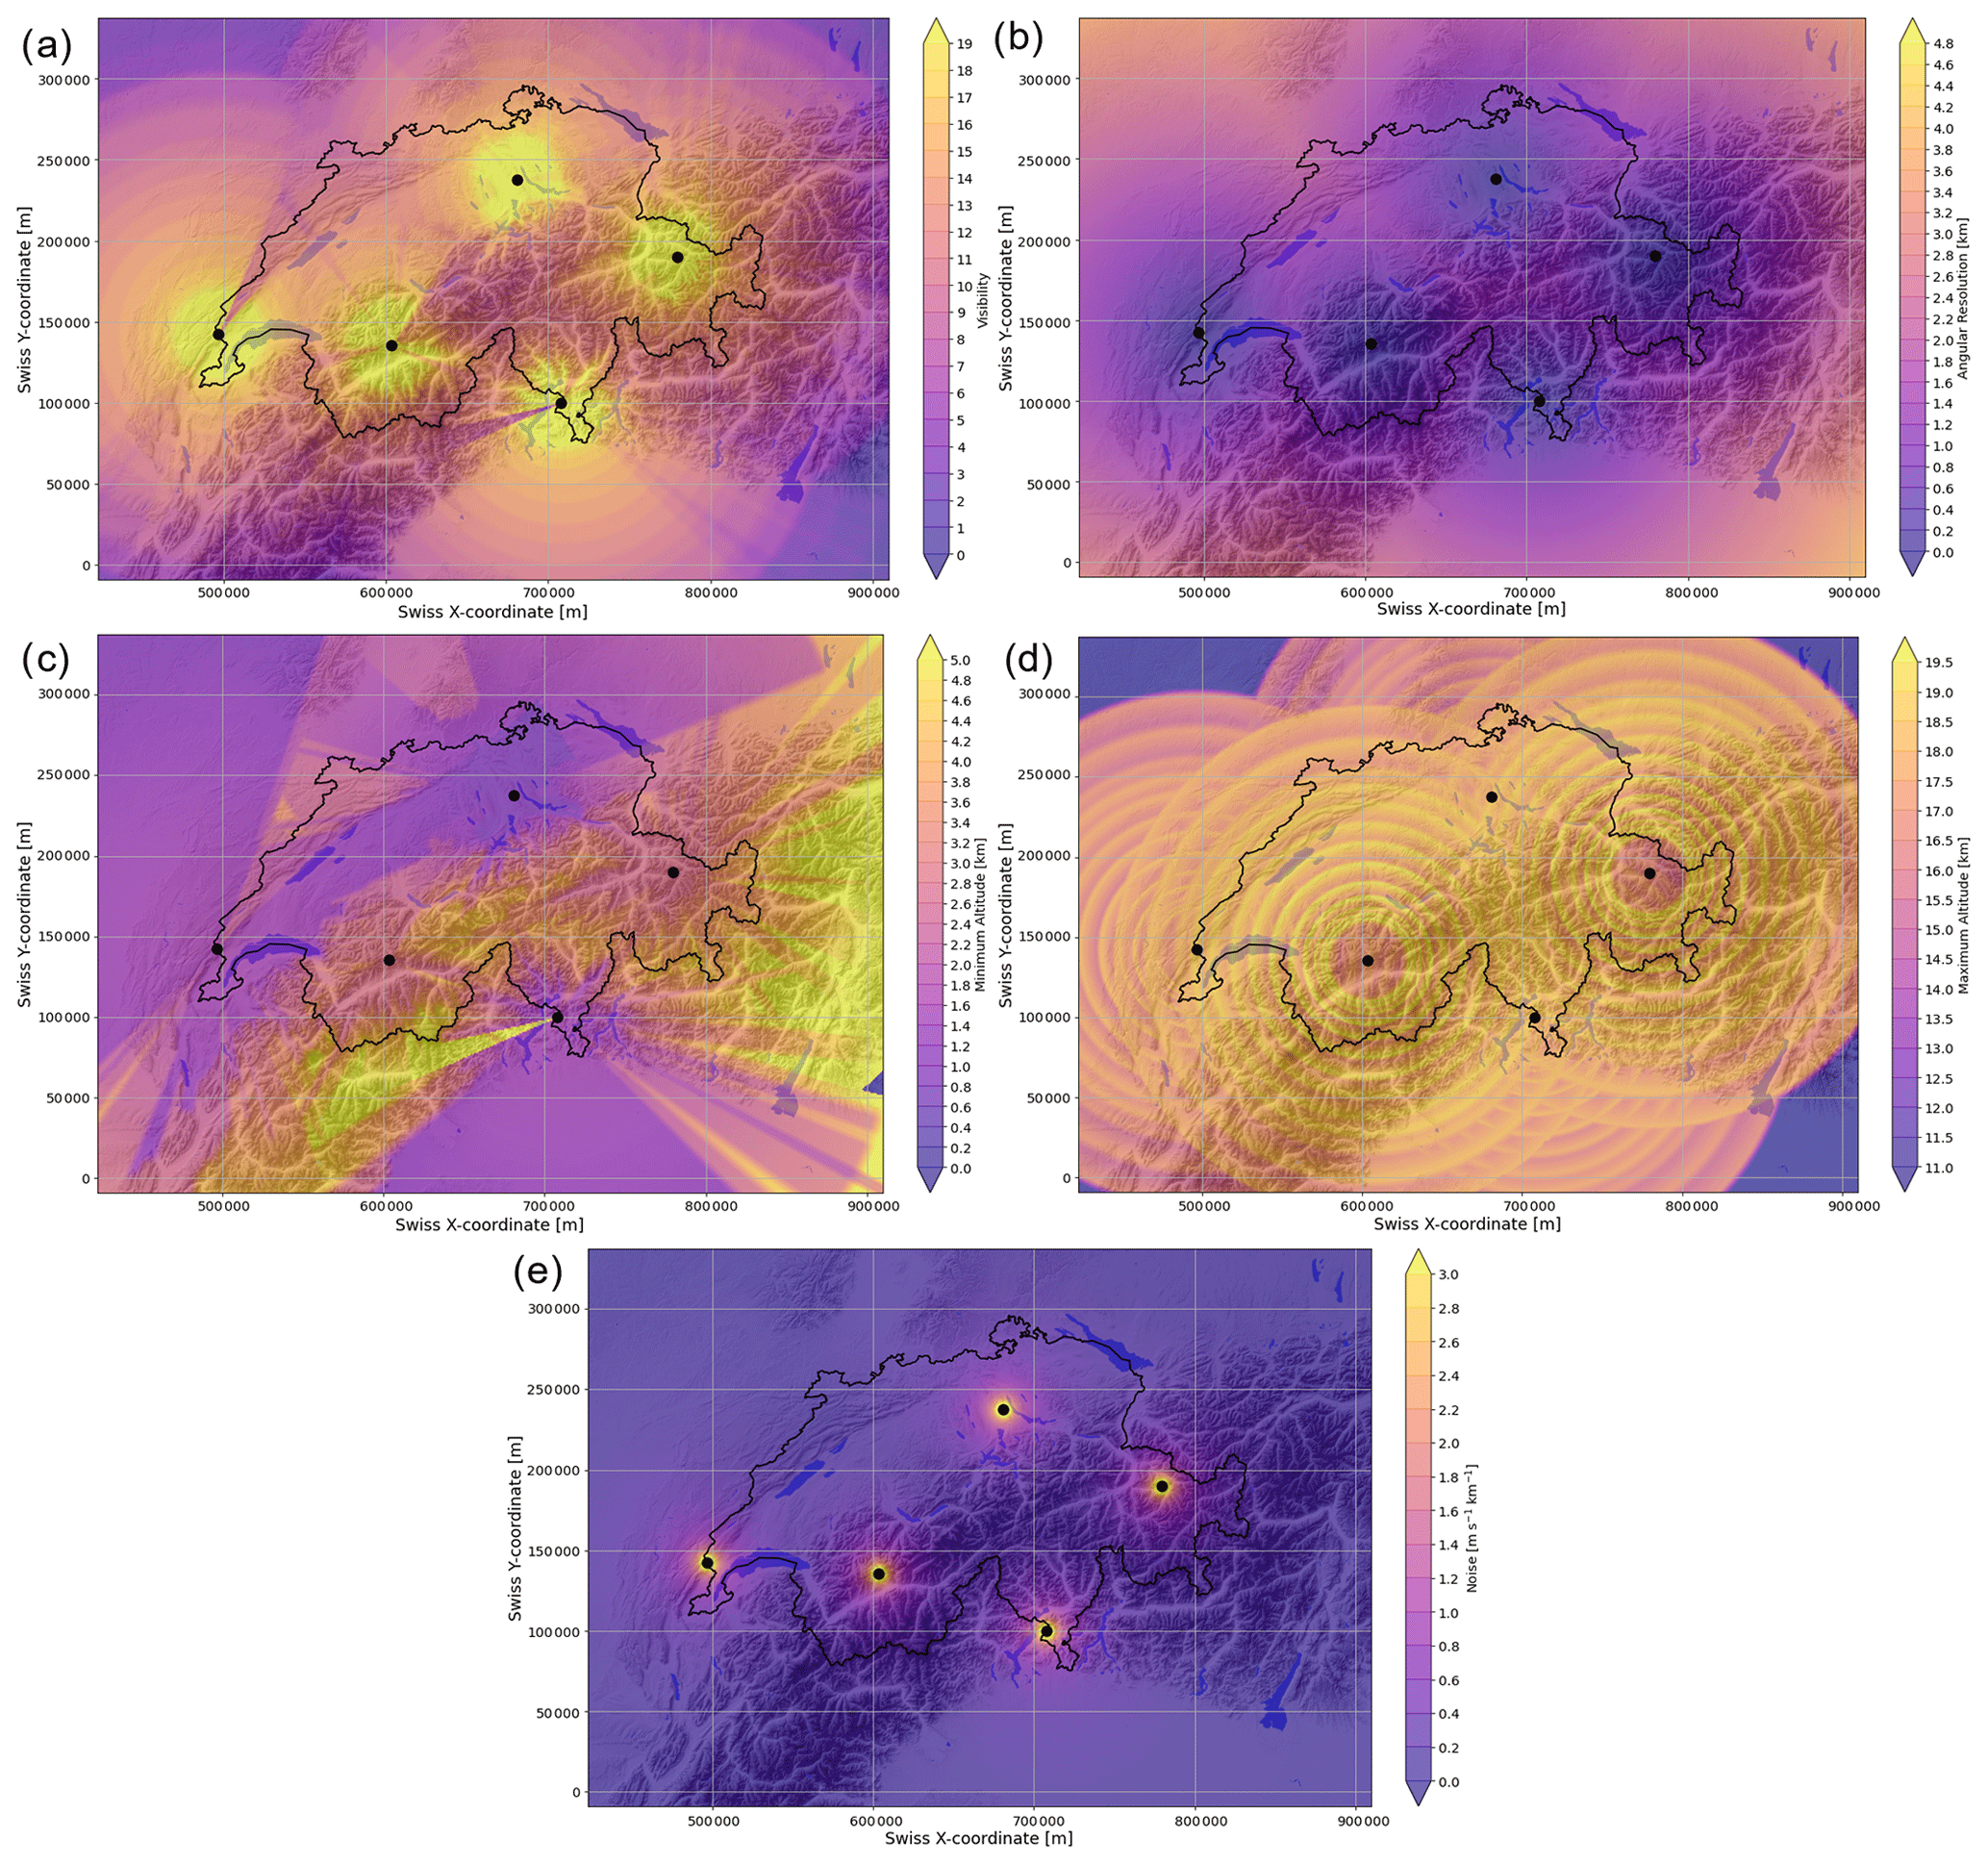
Figure C1Components contributing to the relative quality index for mesocyclone detection in the Swiss radar network: (a) vertical sum of visibility, (b) azimuthal resolution, (c) minimum altitude of observations, (d) maximum altitude of observations and (e) numerical noise in the azimuthal-velocity derivative.
The theoretical visibility corresponds to the unblocked fraction of a radar beam at each location. It is derived combining the effective earth radius model (AMS Glossary of Meteorology, 2012) with a refractive index of and a digital elevation model to estimate beam blockage. The vertical sum over all 20 elevations is computed on a 2-D polar grid for each radar. In a similar fashion, the minimum and maximum altitudes of measurements are obtained from the altitude of the lowest and highest radar beam with 100 % visibility, each yielding a 2-D polar grid per radar. The resolution corresponds to the distance of each radar bin to its azimuthal neighbours. As we here work with the azimuthal derivative of Doppler velocity, we additionally introduce the quantisation noise. The numeric resolution at which the Doppler velocity is stored introduces a small level of noise. The azimuthal derivative is strongly range-dependent, as it utilises the azimuthal resolution. In the vicinity of the radars this noise reaches high levels and thus impacts the data quality. We here compute the noise level by dividing the numerical resolution by the azimuthal resolution.
After obtaining the radar-based grids for each variable, these are regridded to a 1 km resolution Cartesian grid, where the highest quality index at each location of overlap is retained. The contribution of each variable is shown in Fig. C1.
To constrain the fields to values that correspond to strong quality degradations, some fields are saturated at threshold values. The minimum-altitude field's upper bound is saturated at 5 km a.s.l., corresponding to an inability to observe the lower atmosphere. The maximum-altitude field's lower bound is saturated at 11 km, indicating a lack of convective top observations. The noise field's upper bound is saturated at s−1, which is a critical threshold for rotation detection.
Each Cartesian field of a characteristic is then rescaled between 0 and 1, utilising the highest and lowest values present in the domain so that 0 represents the lowest-quality value and 1 represents the highest-quality value. The normalisation for the positively (Eq. C1) as well as negatively (Eq. C2) correlating variables is given in the following:
and
Positively correlating variables are visibility and the maximum altitude of measurements, where high values correspond to a high quality index. Negatively correlating variables are resolution, the minimum altitude of measurements and noise, where a low value corresponds to a high quality index. All characteristics are then combined by the following formula:
As visibility can degrade the quality to 0 in absolute terms, it is used as a multiplicative factor. The other variables do not directly influence each other and are thus averaged at equal weights. To account for both horizontal and vertical azimuthal resolution, it is squared.
Case B, as indicated in the map of Fig. 2, is located in the Valais Alps and was observed from the Plaine Morte radar. It shows a case in complex, high-altitude terrain, observed at ∼4800 m a.s.l. Figure D1 shows the supercell at 10–30 km range and 200–240∘ azimuth; in the Doppler velocity panel the location and direction of rotation are indicated with arrows. The hook shape in the reflectivity is less evident here compared to the event presented in Fig. 2, but we can see a clear indentation in the high reflectivity values at the location of outgoing (blue) Doppler velocities, showing the perturbation from the rotation. The high values of VIL also indicate the large moisture content in the atmospheric column. This storm was associated with multiple extreme precipitation and wind gust measurements (MeteoSwiss, 2019).
The second case (Fig. D2) stems from the Rhine Valley and comes closest to convection without orography in Switzerland and is shown in the radar imagery at an altitude of approximately 2000 m a.s.l. Nonetheless the proximity of the Black Forest to the northwest and Jura in the southwest indicate that topography is a relevant factor for thunderstorm initiation and development everywhere in Switzerland. The supercell is at a further range than the previous cases (30–50 km, 330–30∘) but nonetheless well observed. We can see a clear perturbation in the high-reflectivity signature. The rotation in the Doppler velocity fields is quite strong, averaging around 20 m s−1. The main region of the thunderstorm shows high values of VIL. This storm was responsible for a new precipitation record in Switzerland (36.1 mm in 10 min) at the time (MeteoSwiss, 2017). During the evolution of the storm, the reflectivity data also showed significant attenuation behind the storm core. The probability of hail is also estimated to be close to 100 % throughout large parts of the track; however no hail was reported on the ground, possibly due to the storm taking place at night.
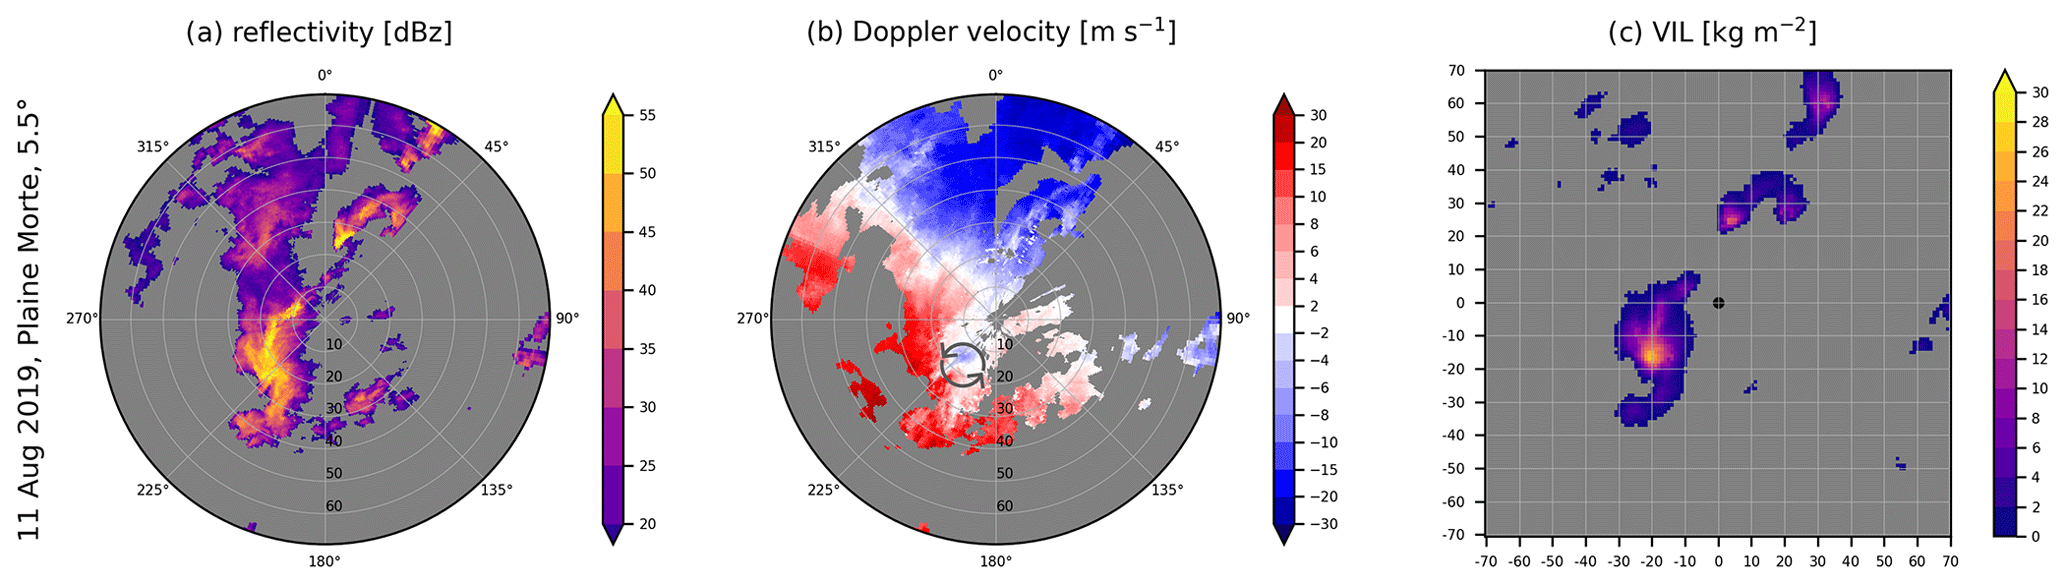
Figure D1Supercell in Valais, 11 August 2019.
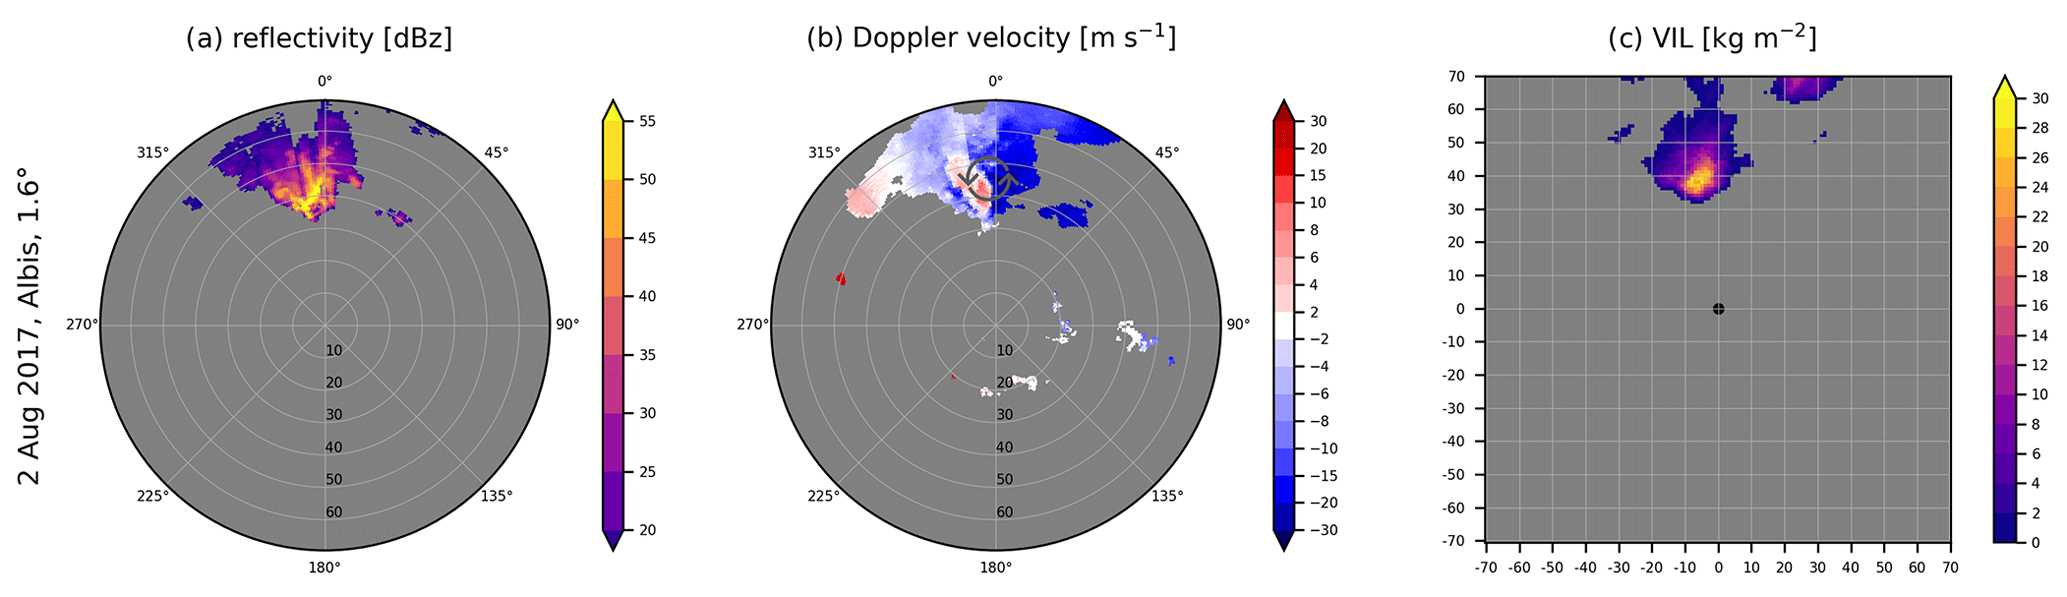
Figure D2Supercell along the Rhine Valley, 2 August 2017.
The T-DaTing algorithm is available in the pySTEPS package (https://pysteps.readthedocs.io/en/latest/; PySteps developers, 2021). The data set of mesocyclones has been published in Feldmann et al. (2021) (https://doi.org/10.5281/zenodo.5122519).
This work has been done by MF as part of her PhD thesis under the supervision and with the support of AB, MG and UG.
The contact author has declared that neither they nor their co-authors have any competing interests.
Publisher's note: Copernicus Publications remains neutral with regard to jurisdictional claims in published maps and institutional affiliations.
We would like to thank MeteoSwiss and EPFL for the possibility of conducting this research in this collaborative framework. We are particularly grateful for the assistance of Daniele Nerini and Loris Foresti in adding the T-DaTing algorithm to the pySTEPS package. Advice and feedback provided by Alessandro Hering on the reconstruction of a thunderstorm tracking algorithm was greatly appreciated. We also thank Susanna Mohr and one anonymous reviewer for their thoughtful feedback and suggestions to improve this article.
This paper was edited by Johannes Dahl and reviewed by Susanna Mohr and one anonymous referee.
Allen, J. T.: Climate Change and Severe Thunderstorms, January, Oxford Research Encyclopedia of Climate Science, Oxford University Press, Oxford, https://doi.org/10.1093/acrefore/9780190228620.013.62, 2018. a
AMS Glossary of Meteorology: Effective earth radius model, https://glossary.ametsoc.org/wiki/Effective_earth_radius (last access: 4 October 2021), 2012. a
Avolio, E., Nisi, L., Panziera, L., Peyraud, L., and Miglietta, M. M.: A multi-sensor and modeling analysis of a severe convective storm in Lake Maggiore area (northwestern Italy), Atmos. Res., 242, 105008, https://doi.org/10.1016/j.atmosres.2020.105008, 2020. a
Barras, H., Hering, A., Martynov, A., Noti, P. A., Germann, U., and Martius, O.: Experiences with >50,000 crowdsourced hail reports in Switzerland, B. Am. Meteorol. Soc., 100, 1429–1440, https://doi.org/10.1175/BAMS-D-18-0090.1, 2019. a, b
Barras, H., Martius, O., Nisi, L., Schroeer, K., Hering, A., and Germann, U.: Multi-day hail clusters and isolated hail days in Switzerland – large-scale flow conditions and precursors, Weather Clim. Dynam. Discuss. [preprint], https://doi.org/10.5194/wcd-2021-25, in review, 2021. a, b
Beucher, S. and Lantuejoul, C.: Use of watersheds in contour detection, International workshop on image processing: Real-time Edge and Motion Detection/Estimation, available at: https://people.cmm.minesparis.psl.eu/users/beucher/publi/watershed.pdf (last access: 8 October 2021), 1979. a
Blair, S. F., Laflin, J. M., Cavanaugh, D. E., Sanders, K. J., Currens, S. R., Pullin, J. I., Cooper, D. T., Deroche, D. R., Leighton, J. W., Fritchie, R. V., Mezeul II, M. J., Goudeau, B. T., Kreller, S. J., Bosco, J. J., Kelly, C. M., and Mallinson, H. M.: High-Resolution Hail Observations: Implications for NWS Warning Operations, Weather Forecast., 32, 1101–1119, https://doi.org/10.1175/WAF-D-16-0203.1, 2017. a
Bluestein, H. B.: A History of Severe-Storm-Intercept Field Programs, Weather Forecast., 14, 558–577, https://doi.org/10.1175/1520-0434(1999)014<0558:AHOSSI>2.0.CO;2, 1999. a
Consortium for Small Scale Modelling: MeteoSwiss Operational Applications within COSMO, http://www.cosmo-model.org/content/tasks/operational/meteoSwiss/default.htm#cosmo-1 (last access: 20 January 2020), 2018. a, b
de Morsier, G., Fuhrer, O., and Arpagaus, M.: Challenges for a new 1 km non-hydrostatic model over the Alpine area, in: AMS 15th International Conference on Mountain Meteorology, available at: https://ams.confex.com/ams/15MountMet/webprogram/Paper210187.html (last access: 1 April 2020), 2012. a
Diffenbaugh, N. S., Scherer, M., and Trapp, R. J.: Robust increases in severe thunderstorm environments in response to greenhouse forcing, P. Natl. Acad. Sci. USA, 110, 16361–16366, https://doi.org/10.1073/pnas.1307758110, 2013. a
Enno, S.-E., Sugier, J., Alber, R., and Seltzer, M.: Lightning flash density in Europe based on 10 years of ATDnet data, Atmos. Res., 235, 104769, https://doi.org/10.1016/j.atmosres.2019.104769, 2020. a, b, c
Fabry, F.: Radar Meteorology, Cambridge University Press, Cambridge, https://doi.org/10.1017/CBO9781107707405, 2015. a
Feldmann, M., James, C. N., Boscacci, M., Leuenberger, D., Gabella, M., Germann, U., Wolfensberger, D., and Berne, A.: R2D2: A Region-Based Recursive Doppler Dealiasing Algorithm for Operational Weather Radar, J. Atmos. Ocean. Tech., 37, 2341–2356, https://doi.org/10.1175/JTECH-D-20-0054.1, 2020. a, b, c, d
Feldmann, M., Germann, U., Gabella, M., and Berne, A.: Radar-based mesocyclone detections in Switzerland from 2016–2020, Zenodo [data set], https://doi.org/10.5281/zenodo.5122519, 2021. a
Figueras i Ventura, J., Pineda, N., Besic, N., Grazioli, J., Hering, A., van der Velde, O. A., Romero, D., Sunjerga, A., Mostajabi, A., Azadifar, M., Rubinstein, M., Montanyà, J., Germann, U., and Rachidi, F.: Analysis of the lightning production of convective cells, Atmos. Meas. Tech., 12, 5573–5591, https://doi.org/10.5194/amt-12-5573-2019, 2019. a
Foresti, L., Sideris, I. V., Panziera, L., Nerini, D., and Germann, U.: A 10 year radar-based analysis of orographic precipitation growth and decay patterns over the Swiss Alpine region, Q. J. Roy. Meteor. Soc., 144, 2277–2301, https://doi.org/10.1002/qj.3364, 2018. a
Frew, E. W., Argrow, B., Borenstein, S., Swenson, S., Hirst, C. A., Havenga, H., and Houston, A.: Field observation of tornadic supercells by multiple autonomous fixed-wing unmanned aircraft, J. Field Robot., 37, 1077–1093, https://doi.org/10.1002/rob.21947, 2020. a
Garcia de Jesus, E. I.: Tornado scientists send drone fleet into violent thunderstorms, Nature, https://doi.org/10.1038/d41586-019-01486-y, in press, 2019. a
Germann, U., Boscacci, M., Gabella, M., and Schneebelie, M.: Weather radar in Switzerland, in: From weather observations to atmospheric and climate sciences in Switzerland, edited by: Willemse, S. and Furger, M., vdf, Zurich, https://doi.org/10.3218/3746-3, 2016. a, b
Grazioli, J., Leuenberger, A., Peyraud, L., Figueras, J., Gabella, M., Hering, A., and Germann, U.: Adaptive thunderstorm measurements using C-band and X-band radar data, IEEE Geosci. Remote S., 16, 1673–1677, https://doi.org/10.1109/LGRS.2019.2909970, 2019. a, b
Hengstebeck, T., Wapler, K., Heizenreder, D., and Joe, P.: Radar Network – Based Detection of Mesocyclones at the German Weather Service, J. Atmos. Ocean. Tech., 35, 299–321, https://doi.org/10.1175/JTECH-D-16-0230.1, 2018. a, b, c, d, e
Hering, A. M., Morel, C., Galli, G., Ambrosetti, P., and Boscacci, M.: Nowcasting thunderstorms in the Alpine Region using a radar based adaptive thresholding scheme, in: Proc. ERAD Conference 2004, 206–211, available at: https://www.researchgate.net/profile/Paolo-Ambrosetti/publication/238716076_Nowcasting_thunderstorms _in_the_Alpine_region_using_a_radar_based_adaptive_ thresholding_scheme/links/02e7e533991efe4d62000000/ Nowcasting-thunderstorms-in-the-Alpine-region-using-a-radar- based-adaptive-thresholding-scheme.pdf (last access: 20 January 2020), 2004. a, b, c, d, e, f
Hoeppe, P.: Trends in weather related disasters – Consequences for insurers and society, Weather and Climate Extremes, 11, 70–79, https://doi.org/10.1016/j.wace.2015.10.002, 2015. a
Houze, R. A., Schmid, W., Fovell, R. G., and Schiesser, H.-H.: Hailstorms in Switzerland: Left Movers, Right Movers, and False Hooks, Mon. Weather Rev., 121, 3345–3370, https://doi.org/10.1175/1520-0493(1993)121<3345:hislmr>2.0.co;2, 1993. a, b
Jarvis, A., Reuter, H., Nelson, A., and Guevara, E.: Hole-filled SRTM for the globe Version 4, available from the CGIAR-CSI SRTM 90 m Database, SRTM [data set], http://srtm.csi.cgiar.org (last access: 12 May 2021), 2008. a, b
Kron, W., Löw, P., and Kundzewicz, Z. W.: Changes in risk of extreme weather events in Europe, Environ. Sci. Policy, 100, 74–83, https://doi.org/10.1016/j.envsci.2019.06.007, 2019. a
Kumjian, M. R. and Ryzhkov, A. V.: Polarimetric Signatures in Supercell Thunderstorms, J. Appl. Meteorol. Clim., 47, 1940–1961, https://doi.org/10.1175/2007JAMC1874.1, 2008. a, b
Linder, W., Schmid, W., and Schiesser, H.-H.: Surface Winds and Development of Thunderstorms along Southwest–Northeast Oriented Mountain Chains, Weather Forecast., 14, 758–770, https://doi.org/10.1175/1520-0434(1999)014<0758:SWADOT>2.0.CO;2, 1999. a, b
Lucas, B. D. and Kanade, T.: An Iterative Image Registration Technique with an Application to Stereo Vision, in: vol. 2, Proceedings of 7th International Joint Conference on Artificial Intelligence (IJCAI '81), 24–28 August 1981, Vancouver, British Columbia, 674–679, 1981. a
Markowski, P. and Richardson, Y.: Mesoscale Meteorology in Midlatitudes, Wiley-Blackwell, Chichester, West Sussex, UK, https://doi.org/10.1002/9780470682104, 2010. a
Markowski, P. M.: Hook Echoes and Rear-Flank Downdrafts: A Review, Mon. Weather Rev., 130, 852–876, https://doi.org/10.1175/1520-0493(2002)130<0852:HEARFD>2.0.CO;2, 2002. a
MeteoSwiss: Climatologie des éclairs, https://www.meteosuisse.admin.ch/home/actualite/meteosuisse-blog/meteosuisse-blog-recherche.subpage.html/fr/data/blogs/2016/5/climatologie-des-eclairs.html (last access: 8 October 2021), 2016. a, b, c
MeteoSwiss: Stabilisierung nach nächtlichem Rekordgewitter, https://www.meteoschweiz.admin.ch/home/aktuell/meteoschweiz-blog/meteoschweiz-blog-suche.subpage.html/de/data/blogs/2017/8/stabiliserung-nach-naechtlichem-rekordgewitter-.html (last access: 8 October 2021), 2017. a
MeteoSwiss: Das Schweizer Wetterradarnetz, https://www.meteoswiss.admin.ch/content/dam/meteoswiss/de/Mess-und-Prognosesysteme/Atmosphaere/Radarnetz/doc/20170830_Radarnetz_DE_einzeln.pdf (last access: 12 December 2021), 2018a. a, b
MeteoSwiss: The climate of Switzerland, https://www.meteoswiss.admin.ch/home/climate/the-climate-of-switzerland.html (last access: 27 September 2021), 2018b. a, b, c
MeteoSwiss: Orage supercellulaire en Valais, https://www.meteosuisse.admin.ch/home/actualite/meteosuisse-blog/meteosuisse-blog-recherche.subpage.html/fr/data/blogs/2019/8/orage-supercellulaire-en-valais.html (last access: 8 October 2021), 2019. a
Miller, M. L., Lakshmanan, V., and Smith, T. M.: An Automated Method for Depicting Mesocyclone Paths and Intensities, Weather Forecast., 28, 570–585, https://doi.org/10.1175/WAF-D-12-00065.1, 2013. a, b
Mohr, S. and Kunz, M.: Recent trends and variabilities of convective parameters relevant for hail events in Germany and Europe, Atmos. Res., 123, 211–228, https://doi.org/10.1016/j.atmosres.2012.05.016, 2013. a
Mohr, S., Wandel, J., Lenggenhager, S., and Martius, O.: Relationship between atmospheric blocking and warm-season thunderstorms over western and central Europe, Q. J. Roy. Meteor. Soc., 145, 3040–3056, https://doi.org/10.1002/qj.3603, 2019. a
Mohr, S., Wilhelm, J., Wandel, J., Kunz, M., Portmann, R., Punge, H. J., Schmidberger, M., Quinting, J. F., and Grams, C. M.: The role of large-scale dynamics in an exceptional sequence of severe thunderstorms in Europe May–June 2018, Weather Clim. Dynam., 1, 325–348, https://doi.org/10.5194/wcd-1-325-2020, 2020. a, b, c
Morris, S. M.: The Spanish plume – testing the forecaster's nerve, Meteorol. Mag., 115, 349–357, 1986. a, b
Mulholland, J. P., Nesbitt, S. W., and Trapp, R. J.: A Case Study of Terrain Influences on Upscale Convective Growth of a Supercell, Mon. Weather Rev., 147, 4305–4324, https://doi.org/10.1175/MWR-D-19-0099.1, 2019. a
Mulholland, J. P., Nesbitt, S. W., Trapp, R. J., and Peters, J. M.: The Influence of Terrain on the Convective Environment and Associated Convective Morphology from an Idealized Modeling Perspective, J. Atmos. Sci., 77, 3929–3949, https://doi.org/10.1175/JAS-D-19-0190.1, 2020. a
NCCS: Hail Climate Switzerland – National hail hazard maps, National Centre for Climate Services, http://www.hailclimatology.ch, last access: 11 May 2021. a, b, c, d
Nesbitt, S. W., Salio, P. V., Ávila, E., Bitzer, P., Carey, L., Chandrasekar, V., Deierling, W., Dominguez, F., Dillon, M. E., Garcia, C. M., Gochis, D., Goodman, S., Hence, D. A., Kosiba, K. A., Kumjian, M. R., Lang, T., Luna, L. M., Marquis, J., Marshall, R., McMurdie, L. A., Nascimento, E. L., Rasmussen, K. L., Roberts, R., Rowe, A. K., Ruiz, J. J., São Sabbas, E. F., Saulo, A. C., Schumacher, R. S., Skabar, Y. G., Machado, L. A. T., Trapp, R. J., Varble, A., Wilson, J., Wurman, J., Zipser, E. J., Arias, I., Bechis, H., and Grover, M. A.: A storm safari in Subtropical South America: proyecto RELAMPAGO, B. Am. Meteorol. Soc., 102, E1621–E1644, https://doi.org/10.1175/BAMS-D-20-0029.1, 2021. a
Nisi, L., Martius, O., Hering, A., Kunz, M., and Germann, U.: Spatial and temporal distribution of hailstorms in the Alpine region: A long-term, high resolution, radar-based analysis, Q. J. Roy. Meteor. Soc., 142, 1590–1604, https://doi.org/10.1002/qj.2771, 2016. a, b, c, d, e
Nisi, L., Hering, A., Germann, U., and Martius, O.: A 15 year hail streak climatology for the Alpine region, Q. J. Roy. Meteor. Soc., 144, 1429–1449, https://doi.org/10.1002/qj.3286, 2018. a, b, c, d, e, f, g, h, i, j, k, l, m
Nisi, L., Hering, A., Germann, U., Schroeer, K., Barras, H., Kunz, M., and Martius, O.: Hailstorms in the Alpine region: Diurnal cycle, 4D-characteristics, and the nowcasting potential of lightning properties, Q. J. Roy. Meteor. Soc., 146, 4170–4194, https://doi.org/10.1002/qj.3897, 2020. a
NSSL: VORTEX @ NSSL, https://www.nssl.noaa.gov/projects/vortex/ (last access: 17 May 2021), 2019. a
NSSL: VORTEX SOUTHEAST, https://www.nssl.noaa.gov/projects/vortexse/, last access: 23 September 2021. a
Peyraud, L.: Analysis of the 18 July 2005 Tornadic Supercell over the Lake Geneva Region, Weather Forecast., 28, 1524–1551, https://doi.org/10.1175/waf-d-13-00022.1, 2013. a, b, c
Piper, D. A., Kunz, M., Allen, J. T., and Mohr, S.: Investigation of the temporal variability of thunderstorms in central and western Europe and the relation to large-scale flow and teleconnection patterns, Q. J. Roy. Meteor. Soc., 145, 3644–3666, https://doi.org/10.1002/qj.3647, 2019. a, b
Púčik, T., Groenemeijer, P., Rädler, A. T., Tijssen, L., Nikulin, G., Prein, A. F., van Meijgaard, E., Fealy, R., Jacob, D., and Teichmann, C.: Future Changes in European Severe Convection Environments in a Regional Climate Model Ensemble, J. Climate, 30, 6771–6794, https://doi.org/10.1175/JCLI-D-16-0777.1, 2017. a
Púčik, T., Castellano, C., Groenemeijer, P., Kühne, T., Rädler, A. T., Antonescu, B., and Faust, E.: Large Hail Incidence and Its Economic and Societal Impacts across Europe, Mon. Weather Rev., 147, 3901–3916, https://doi.org/10.1175/MWR-D-19-0204.1, 2019. a
Pulkkinen, S., Nerini, D., Pérez Hortal, A. A., Velasco-Forero, C., Seed, A., Germann, U., and Foresti, L.: Pysteps: an open-source Python library for probabilistic precipitation nowcasting (v1.0), Geosci. Model Dev., 12, 4185–4219, https://doi.org/10.5194/gmd-12-4185-2019, 2019. a, b, c
PySteps developers: pySTEPS – The nowcasting initiative, PySteps developers [code], https://pysteps.readthedocs.io/en/latest/, last access: 17 May 2021. a, b, c
Rädler, A. T., Groenemeijer, P. H., Faust, E., Sausen, R., and Púčik, T.: Frequency of severe thunderstorms across Europe expected to increase in the 21st century due to rising instability, npj Climate and Atmospheric Science, 2, 3–7, https://doi.org/10.1038/s41612-019-0083-7, 2019. a
Rampanelli, G., Zardi, D., and Rotunno, R.: Mechanisms of Up-Valley Winds, J. Atmos. Sci., 61, 3097–3111, https://doi.org/10.1175/JAS-3354.1, 2004. a
Schemm, S., Nisi, L., Martinov, A., Leuenberger, D., and Martius, O.: On the link between cold fronts and hail in Switzerland, Atmos. Sci. Lett., 17, 315–325, https://doi.org/10.1002/asl.660, 2016. a, b, c
Serafin, S., Rotach, M. W., Arpagaus, M., Colfescu, I., Cuxart, J., De Wekker, S. F. J., Evans, M., Grubišić, V., Kalthoff, N., Karl, T., Kirshbaum, D. J., Lehner, M., Mobbs, S., Paci, A., Palazzi, E., Raudzens Bailey, A., Schmidli, J., Wohlfahrt, G., and Zardi, D.: Multi-scale transport and exchange processes in the atmosphere over mountains, 1st Edn., Innsbruck University Press, Innsbruck, https://doi.org/10.15203/99106-003-1, 2020. a
Stumpf, G. J., Witt, A., Mitchell, E. D., Spencer, P. L., Johnson, J. T., Eilts, M. D., Thomas, K. W., and Burgess, D. W.: The National Severe Storms Laboratory Mesocyclone Detection Algorithm for the WSR-88D, Weather Forecast., 13, 304–326, https://doi.org/10.1175/1520-0434(1998)013<0304:TNSSLM>2.0.CO;2, 1998. a, b, c, d, e, f, g, h, i
Sturmarchiv Schweiz: Sturmarchiv Schweiz – Tornados, https://www.sturmarchiv.ch/index.php?title=Tornados (last access: 15 May 2021), 2021. a
© swisstopo: DHM25/200 m, swisstopo [data set], https://www.swisstopo.admin.ch/de/geodata/height/dhm25200.html (last access: 12 May 2021), 2005. a, b
Taszarek, M., Allen, J., Púčik, T., Groenemeijer, P., Czernecki, B., Kolendowicz, L., Lagouvardos, K., Kotroni, V., and Schulz, W.: A Climatology of Thunderstorms across Europe from a Synthesis of Multiple Data Sources, J. Climate, 32, 1813–1837, https://doi.org/10.1175/JCLI-D-18-0372.1, 2019. a
Trefalt, S., Martynov, A., Barras, H., Besic, N., Hering, A. M., Lenggenhager, S., Noti, P., Röthlisberger, M., Schemm, S., Germann, U., and Martius, O.: A severe hail storm in complex topography in Switzerland – Observations and processes, Atmos. Res., 209, 76–94, https://doi.org/10.1016/j.atmosres.2018.03.007, 2018. a, b
van der Walt, S., Schönberger, J. L., Nunez-Iglesias, J., Boulogne, F., Warner, J. D., Yager, N., Gouillart, E., Yu, T., and the scikit-image contributors: scikit-image: image processing in Python, PeerJ, 2, e453, https://doi.org/10.7717/peerj.453, 2014. a, b
Varble, A. C., Nesbitt, S. W., Salio, P., Hardin, J. C., Bharadwaj, N., Borque, P., DeMott, P. J., Feng, Z., Hill, T. C. J., Marquis, J. N., Matthews, A., Mei, F., Öktem, R., Castro, V., Goldberger, L., Hunzinger, A., Barry, K. R., Kreidenweis, S. M., McFarquhar, G. M., McMurdie, L. A., Pekour, M., Powers, H., Romps, D. M., Saulo, C., Schmid, B., Tomlinson, J. M., van den Heever, S. C., Zelenyuk, A., Zhang, Z., and Zipser, E. J.: Utilizing a Storm-Generating Hotspot to Study Convective Cloud Transitions: The CACTI Experiment, B. Am. Meteorol. Soc., 102, E1597–E1620, https://doi.org/10.1175/BAMS-D-20-0030.1, 2021. a
Wapler, K.: The life-cycle of hailstorms: Lightning, radar reflectivity and rotation characteristics, Atmos. Res., 193, 60–72, https://doi.org/10.1016/j.atmosres.2017.04.009, 2017. a
Wapler, K.: Mesocyclonic and non-mesocyclonic convective storms in Germany: Storm characteristics and life-cycle, Atmos. Res., 248, 105186, https://doi.org/10.1016/j.atmosres.2020.105186, 2021. a
Wapler, K. and James, P.: Thunderstorm occurrence and characteristics in Central Europe under different synoptic conditions, Atmos. Res., 158–159, 231–244, https://doi.org/10.1016/j.atmosres.2014.07.011, 2014. a, b
Wapler, K., Hengstebeck, T., and Groenemeijer, P.: Mesocyclones in Central Europe as seen by radar, Atmos. Res., 168, 112–120, https://doi.org/10.1016/j.atmosres.2015.08.023, 2016. a, b, c, d
Weusthoff, T.: Weather Type Classification at MeteoSwiss, Arbeitsberichte der MeteoSchweiz, Bundesamt für Meteorologie und Klimatologie, MeteoSchweiz, © 2011, Zurich, 46 pp., 2011. a, b
Witt, A., Burgess, D. W., Seimon, A., Allen, J. T., Snyder, J. C., and Bluestein, H. B.: Rapid-Scan Radar Observations of an Oklahoma Tornadic Hailstorm Producing Giant Hail, Weather Forecast., 33, 1263–1282, https://doi.org/10.1175/WAF-D-18-0003.1, 2018. a
Zrnić, D. S., Burgess, D. W., and Hennington, L. D.: Automatic Detection of Mesocyclonic Shear with Doppler Radar, J. Atmos. Ocean. Tech., 2, 425–438, https://doi.org/10.1175/1520-0426(1985)002<0425:adomsw>2.0.co;2, 1985. a, b
- Abstract
- Introduction
- Data
- Methods
- Mesocyclone characterisation
- Conclusions
- Appendix A: Thunderstorm Detection and Tracking
- Appendix B: Mesocyclone detection
- Appendix C: Relative quality index
- Appendix D: Case studies
- Code and data availability
- Author contributions
- Competing interests
- Disclaimer
- Acknowledgements
- Review statement
- References