the Creative Commons Attribution 4.0 License.
the Creative Commons Attribution 4.0 License.
 | 11 Jun 2021
Seasonal climate influences on the timing of the Australian monsoon onset
Joel Lisonbee
Joachim Ribbe
The timing of the first monsoon burst of the season, or the monsoon onset, can be a critical piece of information for agriculture, fire management, water management, and emergency response in monsoon regions. Why do some monsoon seasons start earlier or later than others? Previous research has investigated the impact of climate influences such as the El Niño–Southern Oscillation (ENSO) on monsoon variability, but most studies have considered only the impact on rainfall and not the timing of the onset. While this question could be applied to any monsoon system, this research presented in this paper has focused on the Australian monsoon. Even with the wealth of research available on the variability of the Australian monsoon season, the timing of the monsoon onset is one aspect of seasonal variability that still lacks skilful seasonal prediction. To help us better understand the influence of large-scale climate drivers on monsoon onset timing, we recreated 11 previously published Australian monsoon onset datasets and extended these to all cover the same period from the 1950/1951 through the 2020/2021 Australian wet seasons. The extended datasets were then tested for correlations with several standard climate indices to identify which climate drivers could be used as predictors for monsoon onset timing. The results show that many of the relationships between monsoon onset dates and ENSO that were previously published are not as strong when considering the extended datasets. Only a strong La Niña pattern usually has an impact on monsoon onset timing, while ENSO-neutral and El Niño patterns lacked a similar relationship. Detrended Indian Ocean Dipole (IOD) data showed a weak relationship with monsoon onset dates, but when the trend in the IOD data is retained, the relationship with onset dates diminishes. Other patterns of climate variability showed little relationship with Australian monsoon onset dates. Since ENSO is a tropical climate process with global impacts, it is prudent to further re-examine its influences in other monsoon regions too, with the aim to evaluate and improve previously established prediction methodologies.
- Article
(862 KB) - Full-text XML
- BibTeX
- EndNote


The livelihood of about 50 % to 60 % of the world's population is impacted by the global monsoon system (e.g. Qiao et al., 2012; Wang and Ding, 2008; Yancheva et al., 2007). The monsoon is generally understood to be the seasonal change from dry to wet along with a reversal of the prevailing winds (Ramage, 1971). Monsoonal climates are characterised by dry winters followed by very wet summers when, by at least one definition, over 70 % of the annual rainfall accumulates (CLIVAR, 2015; Qian et al., 2002; Zhang and Wang, 2008). With all regional monsoon systems, the seasonal monsoon onset, or the first burst of monsoon rains of the season, is a much-anticipated event with documented temporal variability (Ali et al., 2020; Fitzpatrick et al., 2015; Lisonbee et al., 2020; Parija, 2018; Pradhan et al., 2017). This variability may be driven by larger-scale climate variability, such as the El Niño–Southern Oscillation (ENSO). Correlations between ENSO and the monsoon onset have been reported for the South Asian and East Asian monsoons (Wang et al., 2008b; Zhou and Chan, 2007), the Indian monsoon (Misra et al., 2018; Misra and Bhardwaj, 2019; Noska and Misra, 2016), the African and southern African monsoons (Semazzi et al., 2015), the South American monsoon (Grimm et al., 2015), the Mexican and southwest US monsoon (Gochis, 2015), and the Australian monsoon (Drosdowsky, 1996; Holland, 1986; Kajikawa et al., 2010; Lisonbee et al., 2020). However, for the Australian monsoon the literature does not completely agree on the degree of influence had by ENSO.
The Drosdowsky (1996) monsoon onset definition is often used as a standard for Australian monsoon onset research (e.g. Berry and Reeder, 2016; Davidson et al., 2007; Evans et al., 2014; Kajikawa et al., 2010; Kim et al., 2006; Pope et al., 2009; Wheeler and Hendon, 2004; Zhang and Wang, 2008) and its practical application in an operational environment in the Darwin Regional Forecast Centre (Shaik and Lisonbee, 2012). Drosdowsky (1996) defined the Australian monsoon as a burst of westerly winds as represented by a deep layer tropospheric mean, with easterly winds aloft as measured at Darwin, Northern Territory, Australia. Using data from the 35 years from 1957/1958 to 1991/1992, Drosdowsky (1996) calculated a −56 % correlation with the September–November (SON) Southern Oscillation Index (SOI), a measure of the state of ENSO. During those years, there were eight El Niño and six La Niña events. Subsequently, there have been seven more El Niño events and seven more La Niña events until the 2020/2021 season (see Sect. 5.2). The original motivation for this research was to test if the correlations reported by Drosdowsky (1996) are still valid when including 28 more years of data (i.e. seasons 1992/1993–2020/2021) in the calculation with the overall goal to better understand and utilise the potential predictability of the climate system based on seasonal-scale climate variations. The subsequent research questions that arose are these. Firstly, can a similar correlation be seen from other ENSO or non-ENSO indices? Drosdowsky (1996) was published before the discovery of the Indian Ocean Dipole (IOD) by Saji et al. (1999) and other climate indices, such as central Pacific sea surface temperatures (SSTs), rose to prominence. What other seasonal-scale climate variations may be influencing the timing of the Australian monsoon onset? Secondly, this research question was extended to other Australian monsoon onset methodology. Others have defined the monsoon onset in ways that pin the “onset” to different events in the wet season (Lisonbee et al., 2020) and report varying relationships with ENSO. For example, Kajikawa et al. (2010) reported a correlation coefficient between the SON SOI and Australian monsoon onset of −0.48, while Holland (1986) showed no significant correlation between seasonal monsoon onset and the SOI prior to the summer monsoon season. Do these correlations remain robust when more decades of data are considered? How can the relationships between monsoon onset and climate influences from different onset criteria accurately be compared when each respective dataset covers different time periods? Therefore, the aim of this study is to further investigate how much seasonal-scale climate drivers influence the timing of the Australian monsoon onset based on various onset criteria over the same time period.
For this analysis we will focus on monsoon onset definitions that include a dynamical component, such as a wind reversal. Lisonbee et al. (2020) categorised Australian monsoon onset definitions by those that are based on a wind-criteria and those that are based on a rainfall-criteria. We consider “monsoon” definitions based solely on rainfall to indicate the onset date of the wet season rains and not the dynamical monsoon. While defining and predicting the beginning of the rainy season has useful applications (Balston and English, 2009; Cook and Heerdegen, 2001; Cowan et al., 2020; Drosdowsky and Wheeler, 2014; Lo et al., 2007; Nicholls, 1984; Nicholls et al., 1982; Smith et al., 2008), understanding and predicting the onset of the dynamical monsoon on a seasonal timescale aids our understanding of what drives variability in the monsoon weather pattern and is thus likely to improve monsoon onset forecasting skill when using statistical models. While this study focuses on the Australian monsoon, from a global perspective an understanding of the dynamical monsoon onset is important because tropical cyclones are more likely to form along the monsoon trough (Choi and Kim, 2020; Davidson et al., 1989; Mcbride, 1983; Wheeler and McBride, 2011); and monsoon bursts, whether they include a tropical cyclone or not, can have serious impacts on public health and safety (Martinez et al., 2020), transport and aviation (Pramono et al., 2020), flooding and ecological effects (Crook et al., 2020), and the local economy (Jain et al., 2015). The impacts of wet season rainfall may appear in the early wet season, but the likelihood increases under a persistent monsoon pattern. Nicholls et al. (1982) showed that 30 % of the wet season rainfall occurs before the monsoon onset. Pope et al. (2009) showed that pre-monsoonal rainfall is characterised by meso-scale thunderstorms, which may produce large rainfall totals locally on individual days, while monsoonal rainfall can produce large rainfall totals for multiple days and over a very broad area. It is known that early wet season (October–December, OND) rainfall correlates well with ENSO (McBride and Nicholls (1983), but even with the wealth of research available on the variability in the Australian monsoon season, the timing of the dynamical monsoon onset is one aspect of the monsoon that still lacks skilful seasonal prediction. The Madden–Julian Oscillation (MJO) provides predictability of the monsoon onset at multi-week timescales. If there was a connection between monsoon onset and climate drivers on a seasonal (multi-month) timescale, it could provide a valuable planning mechanism for agricultural producers and so many others in tropical Australia. This paper presents a statistical analysis of seasonal-scale (1–6 month) climate influences on the timing of the dynamical onset of the Australian monsoon for the period 1950/1951 to 2020/2021. With the acknowledgement that monsoon onset occurs on a sub-seasonal timescale, we are investigating this possibility because it has been proposed in previous research (Drosdowsky, 1996; Hendon et al., 1989; Kim et al., 2006; Kullgren and Kim, 2006; Nicholls, 1984; Smith et al., 2008; Webster et al., 1998), and we would like to test these possible connections.
To do this we, firstly, isolated monsoon onset definitions that (1) focus on northern Australia, (2) required some dynamical component (e.g. reversal of lower tropospheric winds) to determine when the monsoon was active over the region, and (3) included a list of onset dates within the respective publications (see Lisonbee et al., 2020). Secondly, we recreated the annual monsoon onset dates using the methods described in each of these papers. Thirdly, we extended these monsoon onset datasets to cover the same time period (1950/1951 through 2020/2021). Finally, with a standard dataset for each monsoon onset definition, we computed statistical correlations with known seasonal-scale climate drivers to investigate if the timing of the Australian monsoon onset can be reliably predicted on a seasonal timescale (including testing the correlations reported in Drosdowsky, 1996) and also which climate drivers and which monsoon onset definitions provide the best predictability.
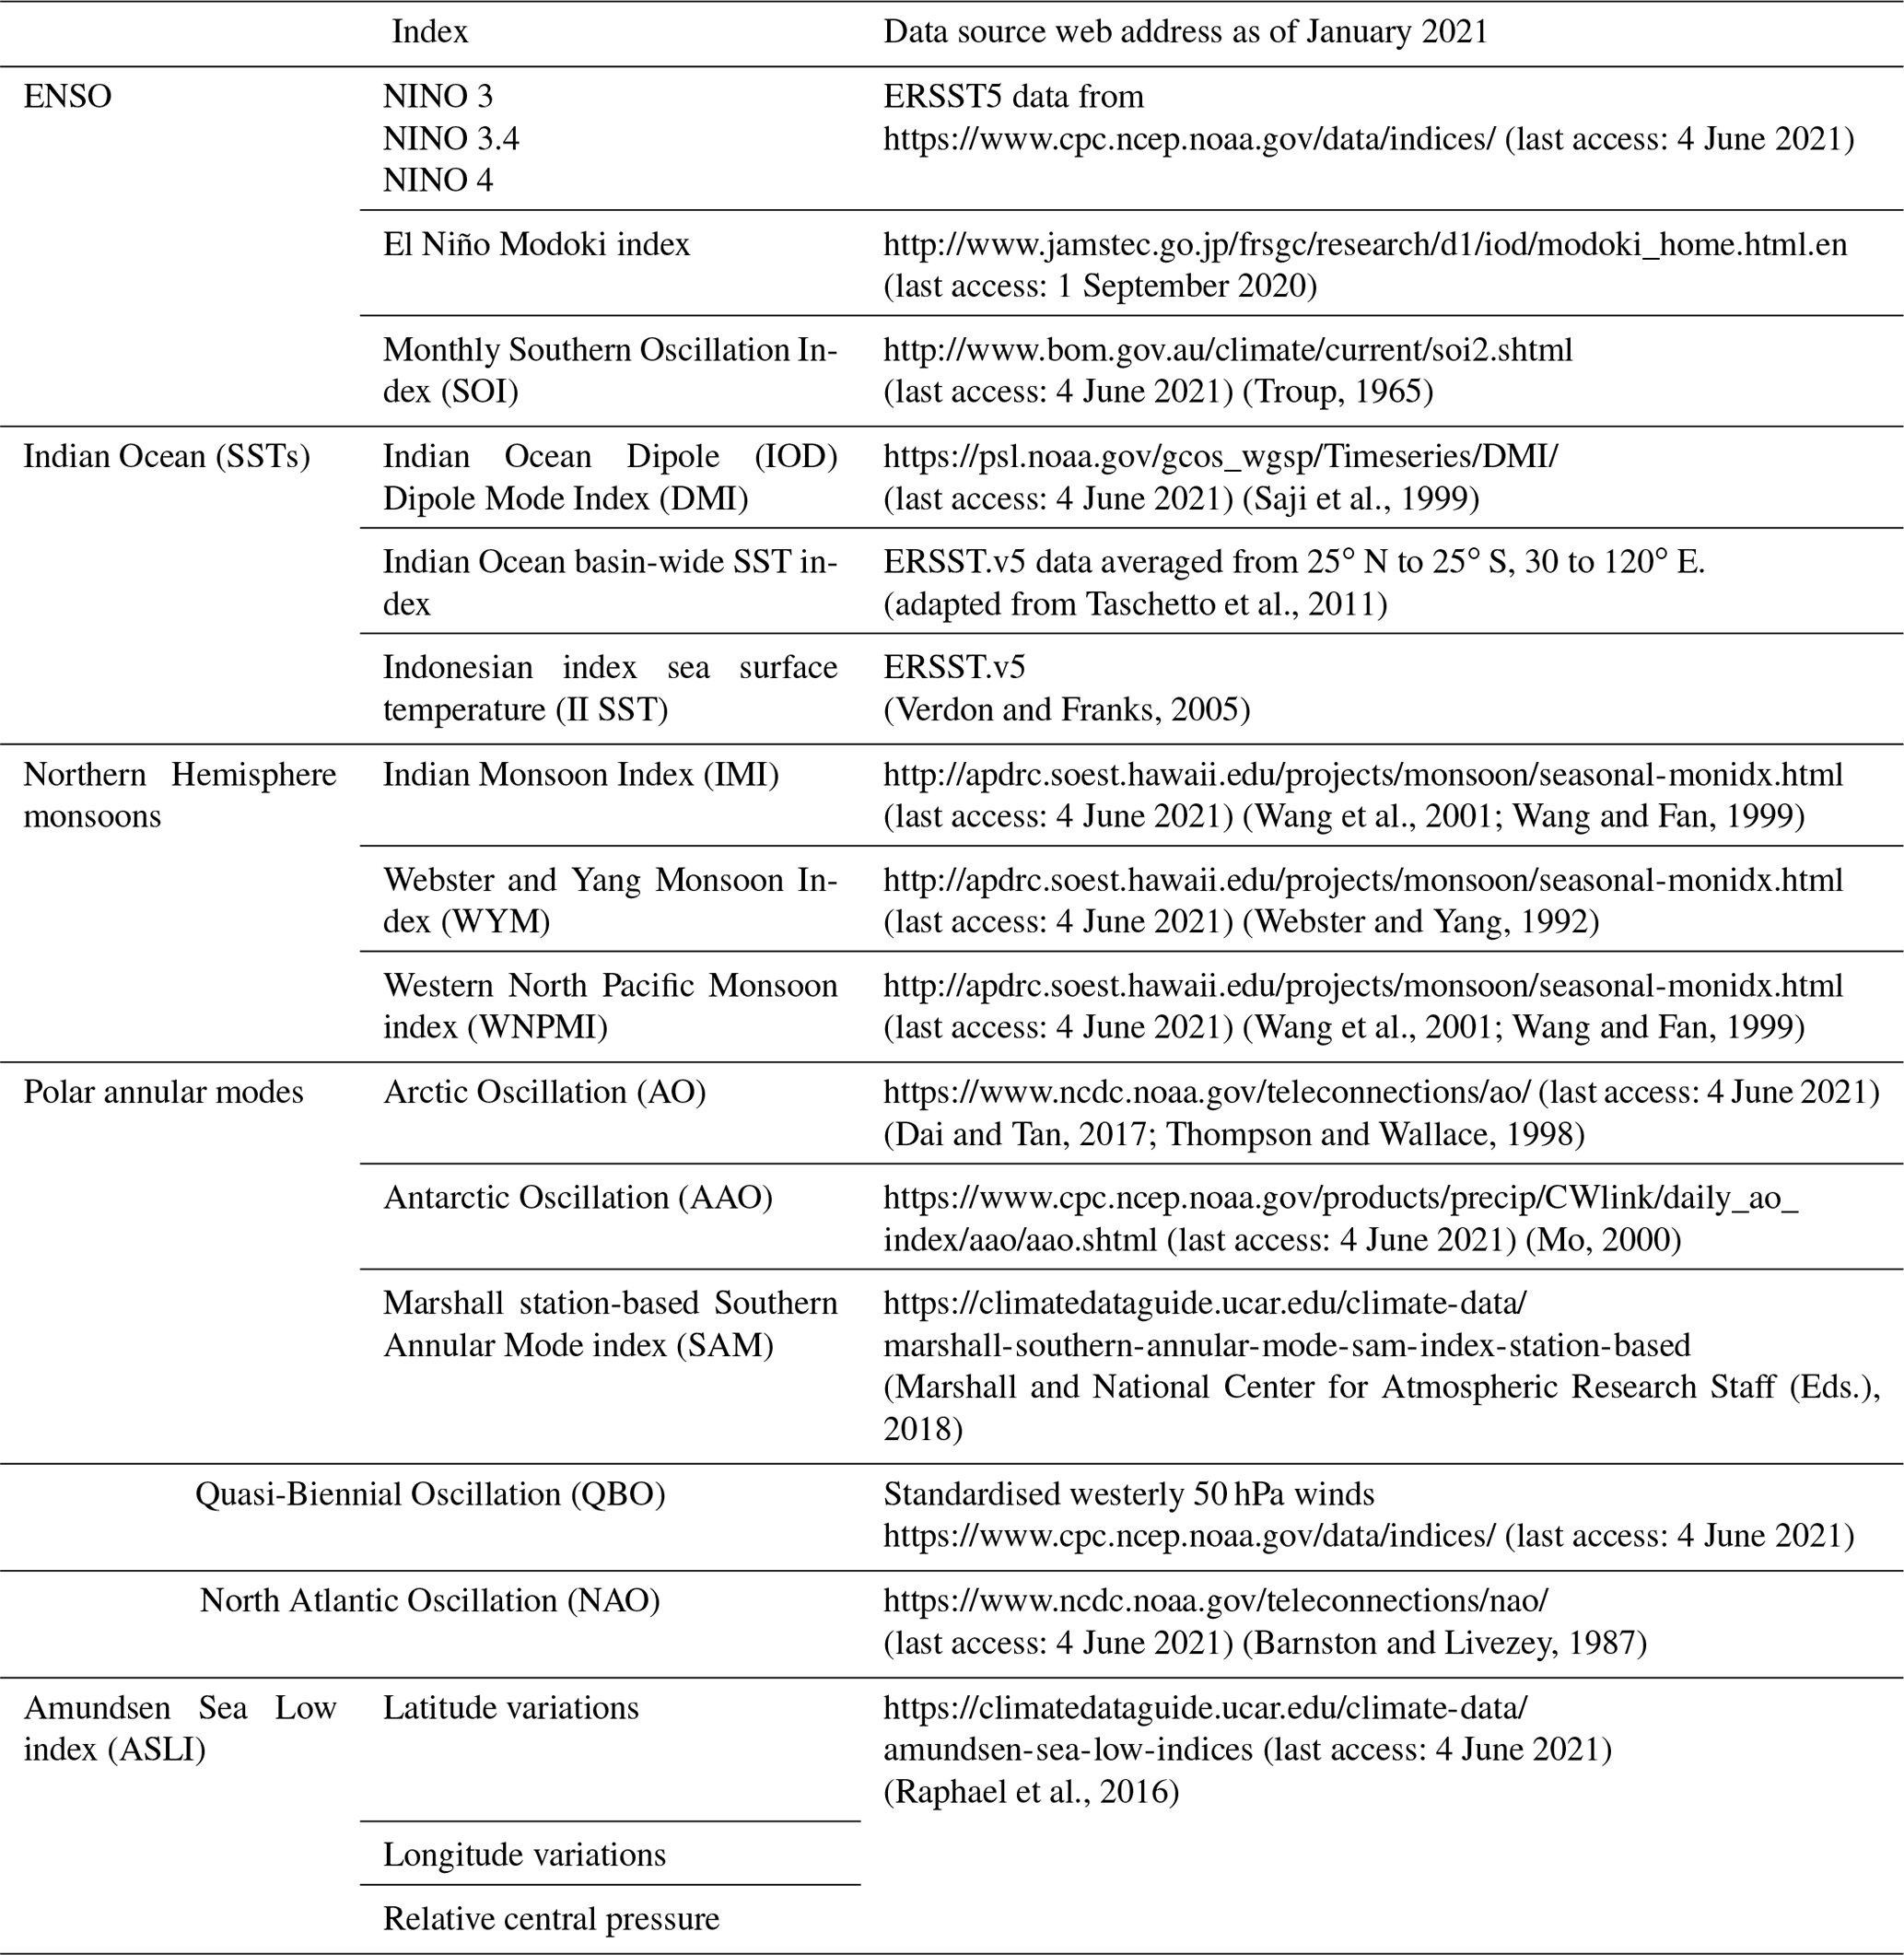
The climate indices considered in this study include six ENSO indices, three Indian Ocean SST indices including the Dipole Mode Index (DMI) as a measure of the IOD (Saji et al., 1999; Taschetto et al., 2011; Verdon and Franks, 2005), three polar annular mode indices (Dai and Tan, 2017; Marshall and National Center for Atmospheric Research Staff (Eds.), 2018; Mo, 2000; Thompson and Wallace, 1998), the stratospheric Quasi-Biennial Oscillation (QBO), the North Atlantic Oscillation (Barnston and Livezey, 1987), the three components of the Amundsen Sea index (Raphael et al., 2016), and three Northern Hemisphere monsoon indices (Wang et al., 2001; Wang and Fan, 1999; Webster and Yang, 1992). The physical connection between the Indian monsoon and the Australian monsoon has been investigated previously (Chang and Li, 2000; Kim and Kim, 2016; Li et al., 2001; Meehl, 1994; Meehl and Arblaster, 2002; Pillai and Mohankumar, 2007; Stuecker et al., 2015; Suppiah, 1992; Wang et al., 2003, 2008a; Wu and Chan, 2005; Yu et al., 2003), but these studies considered seasonal rainfall and not the timing of the Australian monsoon onset; hence we have chosen to include these in our analysis. The Madden–Julian Oscillation (MJO) was not included in this study for two reasons. First, the link between the MJO and the onset of the Australian monsoon has been heavily investigated in the literature (most notably by Wheeler and Hendon, 2004 but also by Hendon and Liebmann, 1990a, b; Hendon et al., 1989; Joseph et al., 1991; Pope et al., 2009; Wheeler and McBride, 2012). Secondly, the MJO provides skilful predictability on a timescale of weeks (Lim et al., 2018), while the analysis presented in this paper focuses on the predictive correlations at the seasonal timescale.
The data used in this research came from various sources, including the European Centre for Medium-Range Weather Forecasts (ECMWF), the National Centre for Atmospheric Research (NCAR), and the Australian Bureau of Meteorology. As much as possible, the reproduced monsoon onset dates used the same data used in each respective publication. When those data are no longer available, substitutions were made. The original data used and the data used in the recreation are listed in Sect. 2.1. The climate indices used, including their source data, are listed in Sect. 2.2.
2.1 Onset data
In this study, it is important to compare all previously published monsoon onset detection methods to the same temporal period to ensure all cover the same “events” of climate variability (i.e. the same ENSO, IOD, etc. patterns). Table 1 includes the reference of each of the onset criteria reproduced, the description of the meteorological data from the original source, and the data used to reproduce that methodology.
Table 1Data used to calculate Australian monsoon onset dates. The web links listed in the table were valid as of the date this work was submitted.

Darwin sounding data were used for several monsoon onset recreations (Drosdowsky, 1996; Holland, 1986; Troup, 1961). Sounding data were obtained from the Australian Bureau of Meteorology directly (available upon request from http://www.bom.gov.au/climate/data-services/, last access: 4 June 2021). One of the limitations of this study is the use of pre-1957 sounding data at Darwin. It should be noted that prior to 1957/58 the sounding timings, methods, and reported heights were non-standard and sometimes irregular (Ramella Pralungo et al., 2014). The inclusion of these data means that onset dates that were calculated using sounding data pre-1957 should be used and interpreted with caution.
2.2 Climate data
The data sources for seasonal climate indices that were used to check for correlations in this study are listed in Table 2.
Table 2Data sources for major climate drivers used in this study. The web links listed in the table were valid as of the date this work was submitted.
The method to test the correlations of monsoon onset criteria with seasonal climate influences took four steps:
-
The first step was to isolate Australian monsoon onset definitions that fit the scope and desired outcomes of this project. We required some dynamical component (e.g. reversal of lower tropospheric winds) to determine when the monsoon was active over the region. A final limit in the scope of this work was to recreate only those works that included a list of onset dates within the respective publications so that we could test if we were recreating the onset dates correctly (see Lisonbee et al., 2020).
-
The second step was to recreate the onset dates by following the methodology described in each paper. Only those works that could be sufficiently reproduced were tested for correlations with climate indices.
-
The third step was to extend each of the selected monsoon onset datasets to cover the same time period. The extended datasets cover the period from the 1950/1951 Australian wet season to the 2020/2021 season. This period is limited based on data availability in that, in this study, the ECMWF ERA-5 reanalysis used for the Hung and Yanai (2004) recreation begins in 1950 and, thus, presented the limit in dataset reproductions. This allowed comparisons of monsoon onset datasets that cover the same “events” of climate variability (i.e. the same ENSO, IOD, etc. patterns). For example, Kajikawa et al. (2010) show a correlation coefficient between the September–November (SOI) and monsoon onset of −0.48, calculated using the years 1948–2005 and including 10 La Niña events (SON SOI > 0.8), while Drosdowsky (1996) showed a correlation coefficient between onset date and the SON SOI of −0.56 for 1957 through 1992 which included only six La Niña events (SON SOI > 0.8). In the full period from 1950 to 2020, there were 11 positive IOD events (SON DMI > 0.4) and 16 negative IOD events (SON DMI < −0.4), and 16 positive and 21 negative ENSO events (this count using the SON NINO3.4 SST anomalies > 0.7 ∘C and < −0.7 ∘C, respectively).
-
The final step was to test the correlations of the monsoon onset dates with the climate indices. Each monsoon onset definition (Table 1) was paired with each of the climate indices (Table 2). Each pair was tested for normalcy. When both pairs fit a Gaussian distribution, then the Pearson coefficient (ρ) and corresponding two-tailed significance test value (p) were calculated. When either of the two pairs did not fit a Gaussian distribution, then the Kendall's coefficient (τ) and corresponding p value were calculated. (As a matter of convention) we have considered p<0.05 to represent statistical significance. When the correlations were larger than ±0.3, we considered the monsoon onset to be somewhat influenced by the climate driver, and when the correlation coefficients were larger than ±0.6, we considered the monsoon onset to be largely influenced by the climate driver and sufficient to be used as a predictive tool.
3.1 Troup (1961) onset definition
Troup (1961) described the Australian monsoon onset using both wind and rainfall. For a rainfall onset, Troup (1961) analysed rainfall data at six locations near Darwin for the wet seasons from 1955/1956 to 1958/1959. For each season in the study period, Troup defined the onset to have occurred when four out of the six stations experienced their first rainfall event simultaneously after 1 November and the area-averaged rainfall over N days exceeded 0.75(N+1) in. (19 mm/d). Using upper-air data from Darwin airport, Troup isolated the westerly wind component at “3000 feet” (915 m) and identified spells of moderate west winds. A westerly wind spell of N days occurred when the cumulative westerly component exceeds 10(N+1) kn and ended when this component was less than 5 kn for 2 consecutive days. When extending the dataset, we considered the rainfall onset and wind onset separately, but we also noted the first day when both the wind and the rainfall criteria were met at the same time (similar to Hendon and Liebmann, 1990b).
3.2 Murakami and Sumi (1982) onset definition
Murakami and Sumi (1982) used the enhanced observation data networks of the Global Weather Experiment and of its component experiment, the Winter Monsoon Experiment (WMONEX), to analyse the Australian monsoon. They defined monsoon onset using the mean 850 hPa westerly wind averaged along 10∘ S from 100 to 180∘ E; onset occurred at the first appearance of mean westerlies along this line. Murakami and Sumi (1982) provided the onset date for only one monsoon season, 1978/1979. Following the Murakami and Sumi (1982) methodology, we were able to reproduce the 1978/1979 onset and extend the onset dataset using the NCEP/NCAR 40 year reanalysis data (Kalnay et al., 1996).
3.3 Holland (1986) onset definition
Holland (1986) defined monsoon onset as the first westerly winds at the 850 hPa level at Darwin Airport. Holland (1986) analysed seasons 1952/1953–1982/1983, and took a special focus in the 1978/1979 wet season as the year of the WMONEX study. Holland averaged the daily 850 hPa level winds to remove diurnal variations and produce a daily time series. He then smoothed out other minor variations in the data using a cubic spline method to the yearly time sequence of the daily mean winds. He was then able to analyse the onset and retreat and the burst and break periods within any season. Drosdowsky (1996) attempted to recreate the onset dates from Holland (1986) but was unable to recreate the results. To explain the differing results, Drosdowsky (1996) pointed to, and criticised, the use of a smoothed time series at a single pressure level. Drosdowsky (1996) points out examples when the smoothed single-level winds miss the actual onset events because either the winds at 850 hPa are not representative of the lower mid-tropospheric westerly wind or the low-pass filtering over the data blurs an abrupt change in the deep-layer winds over several days. Hendon and Liebmann (1990a) built upon the wind definition of Holland (1986), but they replaced the cubic spline with a 1-2-3-2-1 running mean to smooth out synoptic fluctuations.
3.4 Hendon and Liebmann (1990a) onset definition
Hendon and Liebmann published two papers on the NAM in 1990. The first (Hendon and Liebmann, 1990a) was specifically regarding the Australian monsoon onset, while the second (Hendon and Liebmann, 1990b) examined the mechanisms for the variability within the season. In these papers, Hendon and Liebmann define the onset using both wind and rainfall. The wind data are taken from the Darwin Airport upper-air record, and the rainfall is taken as the daily area averaged rainfall for stations north of 15∘ S in Australia. The seasons from 1957/1958 through 1986/1987 were considered. Onset was determined by the first detection of “wet westerlies” at 850 hPa – meaning area averaged rainfall of at least 7.5 mm/d coincident with the wind criteria adopted from Holland (1986) but filtered with a 1-2-3-2-1 running mean as opposed to the cubic spline filter that Holland used.
Drosdowsky (1996) attempted to recreate the Hendon and Liebmann (1990a) results without much success. He points to the lack of clarity in their description of their techniques and datasets. Drosdowsky (1996) is also very critical of the use of a filter to smooth the daily wind data, pointing to examples when the wind reversal was quite abrupt but the smoothed data produce a gradual reversal over several days.
Hendon and Liebmann (1990a) are vague on their description of the data used. For the 850 hPa westerly wind the use of the upper-air record at Darwin is “as per Holland (1986)”. In attempting to recreate these results we used all available sounding data each day to produce daily averages of the 850 hPa level winds (as per the reproduction of Holland, 1986). We then smoothed the daily data with a 1-2-3-2-1 weighted running mean. Drosdowsky suspects that Hendon and Liebmann may have also removed the annual cycle from their daily wind dataset, although this was not mentioned in the Hendon and Liebmann (1990a) methodology (Drosdowsky, 1996). We did not attempt to remove an annual cycle.
The rainfall data used in Hendon and Liebmann (1990a) are described as “the daily record of area averaged rainfall for stations north of 15∘ S in Australia”. They provide a list of rainfall stations used in their Table 1, but in that table Darwin Airport is the only location listed that is north of 15∘ S in Australia. In attempting to reproduce the Hendon and Liebmann (1990a) onset dates we used both the daily rainfall record at Darwin Airport and the gridded rainfall data for all points in Australia north of 15∘ S. These data were obtained from the SILO dataset (https://www.longpaddock.qld.gov.au/silo/gridded-data/, last access: 4 June 2021).
3.5 Drosdowsky (1996) onset definition
The Drosdowsky (1996) deep layer mean westerly wind definition defines the monsoon onset at Darwin using Darwin sounding data. Drosdowsky (1996) developed definitions of active and break cycles and the onset and retreat of the monsoon. Using the 23:00 UTC upper-air data from Darwin Airport, the monsoon was defined as deep low-level westerly flow overlain by strong upper-level easterlies. The mass-weighted deep layer mean winds in the lower troposphere is calculated using Eq. (1), and the mass-weighted deep layer mean winds in the upper troposphere is calculated using Eq. (2):
where U is the westerly wind component and the subscripts indicate the pressure level of that wind measurement. Monsoon onset was considered when the average DLMlower over N days exceeded 2.5(N+1)/N (in units of m/s) and DLMupper is easterly (U<0). These lower level westerly winds had to be in place for at least 2 consecutive days to be considered an active monsoon period, and the minimum break period between bursts is 3 d such that westerly wind bursts separated by only 1 or 2 d were concatenated. The monsoon onset was defined as the first day of the first active monsoon period within the season.
Drosdowsky (1996) found that some subjective assessment of onset dates cannot be avoided, but the onset dates from the 5 years from 1987/1988 to 1991/1992 were determined completely objectively. The years when a subjective analysis was needed, the choices made by Drosdowsky (1996) seemed logical and were also used in the recreation. In most years when objective analysis was applied the onset criteria were met for DLMlower, but the upper level easterlies had not been established. For some other years missing data made objective analysis impossible – one obvious example was the monsoon onset on 25 December 1974 for which there are missing data from 25 to 30 December due to the passage of tropical Cyclone Tracey. The treatment of missing data is described in Drosdowsky (1996). For the extended dataset (1992/1993–2019/2020) subjective analysis was applied to the 1998/1999 and 2004/2005 seasons.
3.6 Hung and Yanai (2004) onset definition
Hung and Yanai (2004) defined the onset of the Australian monsoon using the reanalyses from the European Centre for Medium-Range Weather Forecasts (ECMWF) ERA-15, outgoing long-wave radiation (OLR), and precipitation data for 1979–1993. Onset is defined as the first day with average 850 hPa westerly wind exceeding 2 m/s over a north Australian–Arafura sea domain (2–15∘ S, 115–150∘ E) when the westerly wind is sustained for longer than 10 d and the OLR is lower than 210 W/m2 for “at least several days” during the 10 d period. Using this definition, the mean onset date from the 14 years studied is 25 December with a standard deviation of 2 weeks.
In reproducing the Hung and Hung and Yanai (2004) onset dates the ERA-15 data were no longer available. ERA-5 and ERA-interim reanalysis data were used as a substitution, both producing the same results; ERA-5 data are shown here. The recreated onset dataset matched the original dates to within 1 d in all but two cases (see Fig. 1) which will be discussed in the results section.
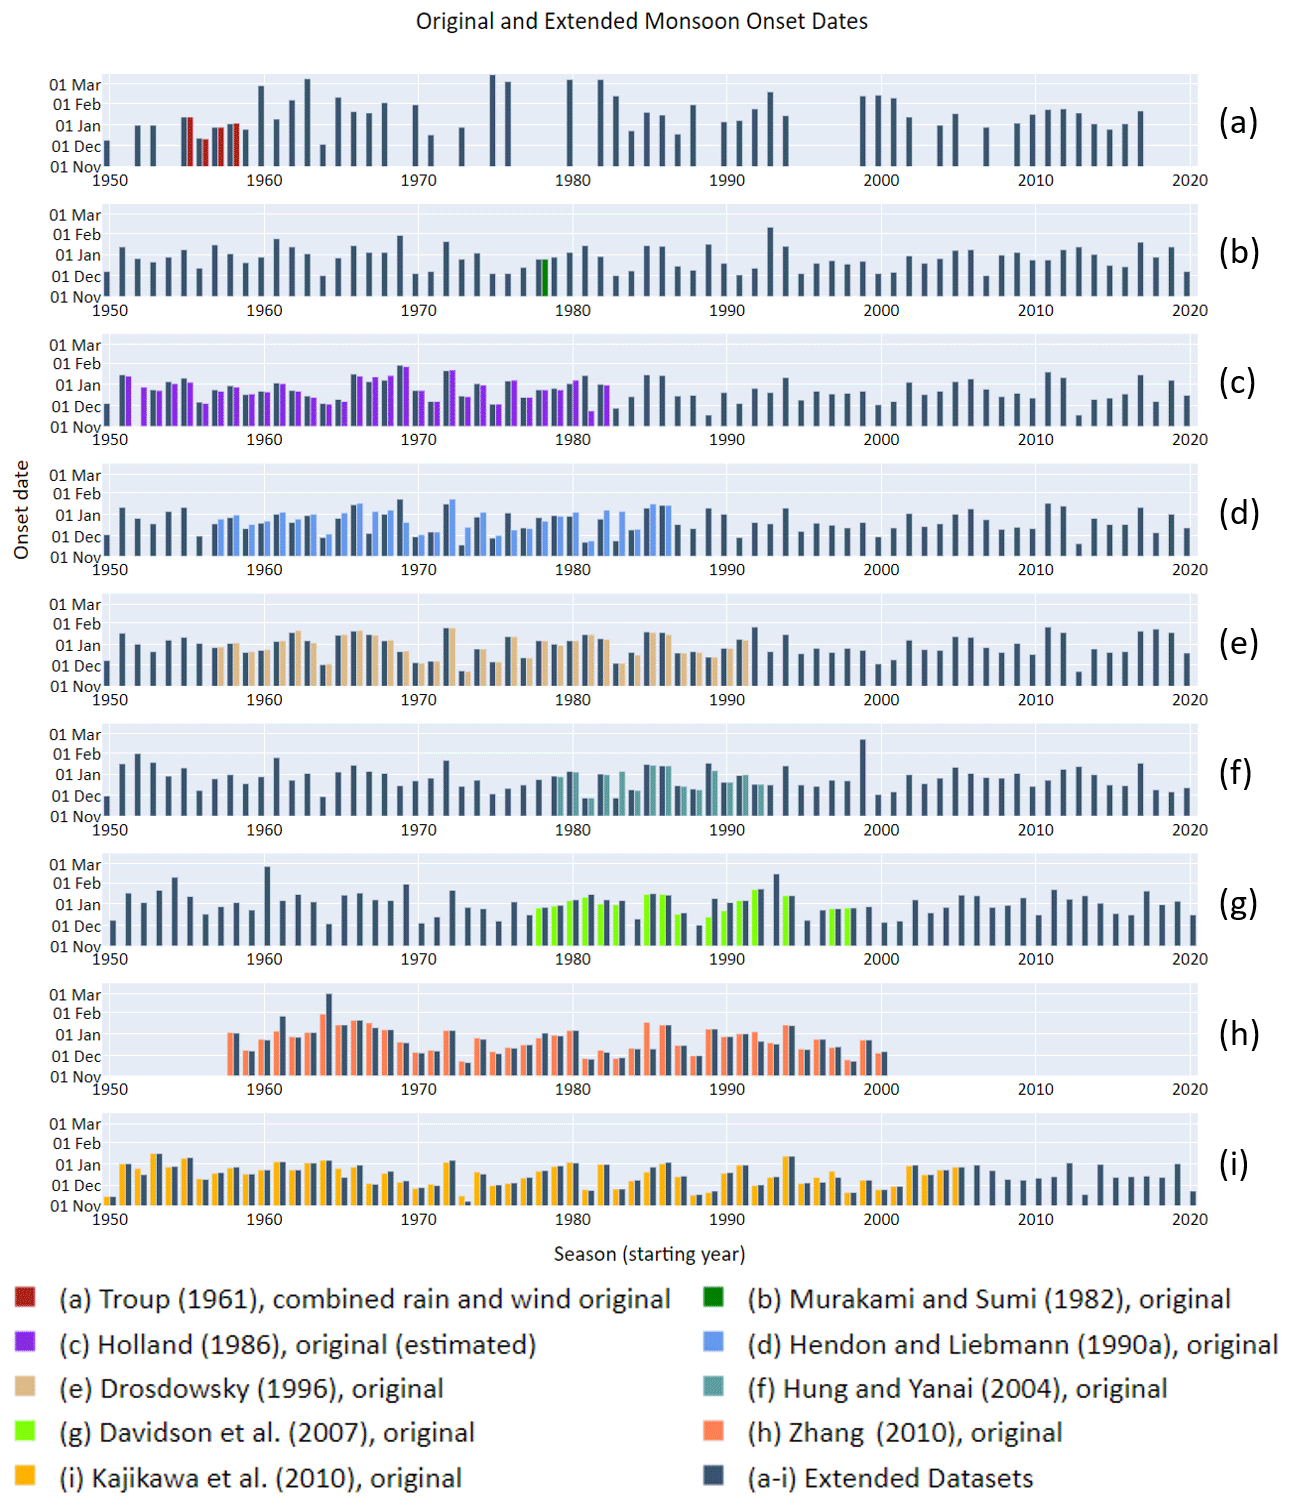
Figure 1Recreated and extended monsoon onset dates using the methods described in each respective paper.
3.7 Davidson et al. (2007) onset definition
Davidson et al. (2007) defined the NAM onset using wind-only criteria in a fashion similar to Drosdowsky (1996) but for a general monsoon region as opposed to the point observations at Darwin Airport that were used in Drosdowsky (1996). Davidson et al. (2007) began with a comparison between both the NCEP and ERA-40 datasets. The close agreement in the westerly wind and mean sea level pressure (MSLP) indicated consistency in the datasets for these standard variables. They concluded that either of the reanalyses are suitable for their purposes since the temporal changes are consistent within each dataset, and they used the NCEP dataset in their analysis of monsoon onset dates. Davidson et al. (2007) defined the monsoon onset as a sudden strengthening and deepening in tropical westerly winds, which are overlain with upper-tropospheric easterlies over a monsoonal region (15∘–5∘ S, 110∘–140∘ E). The lower-tropospheric westerly winds had to meet a minimum threshold of 2.5 m/s and extend to at least 600 hPa. Easterlies in the upper troposphere must overlay the westerlies. This structure must persist for at least 4 d. The authors did not specify which pressure levels they considered to be “the lower troposphere” or which levels they considered to be “the upper troposphere”. In both the reproduced and extended datasets, we used 1000–500 hPa to represent the lower troposphere and levels 250–150 to represent the upper troposphere. For all other aspects of this reproduction we were able to follow the methodology described in Davidson et al. (2007).
3.8 Kajikawa et al. (2010) onset definition
Kajikawa et al. (2010) derived an Australian monsoon index (AUSMI) to examine intra-seasonal variability, including the onset. This index is defined using 850 hPa westerly wind averaged over the area 5–15∘ S, 110–130∘ E using daily NCEP reanalysis data in which positive values indicate a westerly wind.
Kajikawa et al. (2010) patterned their onset criteria after the Wang et al. (2004) monsoon onset definition for the South China Sea monsoon onset. The Australian monsoon onset is defined as the first day after 1 November that satisfies the following three criteria: (1) on the onset day and during the 5 d after the onset day the averaged AUSMI must be positive; (2) the pentad mean AUSMI is positive in at least three of the subsequent four pentads; and (3) the accumulative four-pentad mean AUSMI > 1 m/s (Kajikawa et al., 2010).
3.9 Zhang (2010) onset definition
Zhang (2010) defined the Australian monsoon onset using a normalised precipitable water index similar to Zeng and Lu (2004), who created a global monsoon index based on a normalised precipitable water index. Zhang (2010) used this same index to define onset and retreat dates for northern Australia and Darwin. The normalised precipitable water (PW) index is defined as
where PWmax and PWmin are the 44 year mean of daily PW maximum and minimum in each of the 44 years during the period of 1958–2001 and at each grid point. Once PWn was calculated for each day and each grid point, they then define monsoon onset/retreat as follows: first, they assess if the PWn exceeds 0.65 for 3 continuous days for at least seven of the nine points around a location; then they assess whether 850 hPa monsoon westerly is established, with averaged westerly wind of the nine points around the location remaining westerly for the same 3 d.
Zhang (2010) used daily and monthly ERA-40 reanalysis data for the period of 1958–2001. To test the ability to recreate the Zhang (2010) methodology we used the daily westerly wind component and total column water data from ERA-40. The primary limitation to using ERA-40 data is that they only cover the years 1958 to 2002. To extend the dataset we would need to use a different reanalysis dataset such as ERA-interim or ERA-5. As will be shown below, we could not satisfactorily recreate the Zhang (2010) methodology for ERA-40, and, therefore, we did not repeat the process with a longer dataset.
In the following subsections are the results of each stage of this analysis. First is a report on the accuracy of the recreated monsoon onset datasets in Sect. 4.1, followed by a detailed analysis of correlations with climate indices with the Drosdowsky (1996) extended dataset in Sect. 4.2, and then a summary of the same analysis for the other eight extended monsoon onset datasets in Sect. 4.3.
4.1 Monsoon onset reproductions
To answer the research question posed in the Introduction, we created monsoon onset data that covered a standard time period such that correlations of the individual onset methodologies overlapped with the same climate indices. Out results in reproducing the onset methods described in Section 3 are described here in chronological order of the respective publication date and are also shown in Fig. 1a–k. Recreated data are shown in comparison to the original data. Also shown are the onset data using each definition for the extended period.
Troup (1961) considered the rainfall onset and the wind onset to be two separate events that occasionally overlapped. When extending the dataset, we also considered the rainfall onset and wind onset separately, but we also noted the first day when both the wind and the rainfall criteria were met at the same time (similar to Hendon and Liebmann, 1990b). This method successfully reproduced the onset from the 4 years studied by Troup (1961; Fig. 1a), but we found that, when extending the dataset to the present, there were a few years when both criteria were not met at the same time at any point within the season. This also provided for a few very late onset dates (e.g. February and March). While Troupe (1961) included the dates for all monsoon “bursts” – a term Troup (1961) used to describe an active monsoon period – within each season, here we are considering only the dates of the first burst each season as the “onset”. The extended dataset captured the onset for each year precisely; however, it did not capture the exact dates of each burst as described by Troup (1961), although the dates were off by only a day or two. We suspect Troup (1961) used some subjective analysis in determining these dates. The extended Troup (1961) dataset showed mean onset dates of 31 December using the rainfall criteria, 29 December using the wind criteria, and 20 January using both criteria combined, each with a standard deviation of 25 d.
Murakami and Sumi (1982) provided the onset date for only one monsoon season, 1978/1979 (Fig. 1b). Following the Murakami and Sumi (1982) methodology, we were able to reproduce the 1978/1979 onset and extend the onset dataset using the NCEP/NCAR 40 year reanalysis data (Kalnay et al., 1996). The reconstructed dataset shows a mean onset date of 26 December with a standard deviation of 16 d.
The Holland (1986) onset dates and associated uncertainty estimates were taken from Table 3 in Lisonbee et al. (2020). We could not recreate the Holland (1986) onset dates using a cubic spline smoothing method, experiencing similar problems as Drosdowsky (1996). Through some experimentation we were able to recreate most of the Holland (1986) dates to within the uncertainty estimates using 19 iterations of a 1-2-3-2-1 filter similar to Hendon and Liebmann (1990a). We recreated 22 onset dates (79 %) to within the uncertainty estimates, 5 onset dates (18 %) that are less than 1 week outside the uncertainty estimates, and 1 onset date that was more than 1 week outside the uncertainty estimate (Fig. 1c). Holland (1986) showed the average onset date for the 30 years from 1952/1953 to 1982/1983 was 24 December, with the earliest onset date of 23 November and the latest date of 27 January. When considering the full extended dataset, the mean onset date is 22 December with a standard deviation of 16 d. We could not recreate the earliest onset date from the original dataset, but later in the reconstructed dataset the earliest onset date is 15 November.
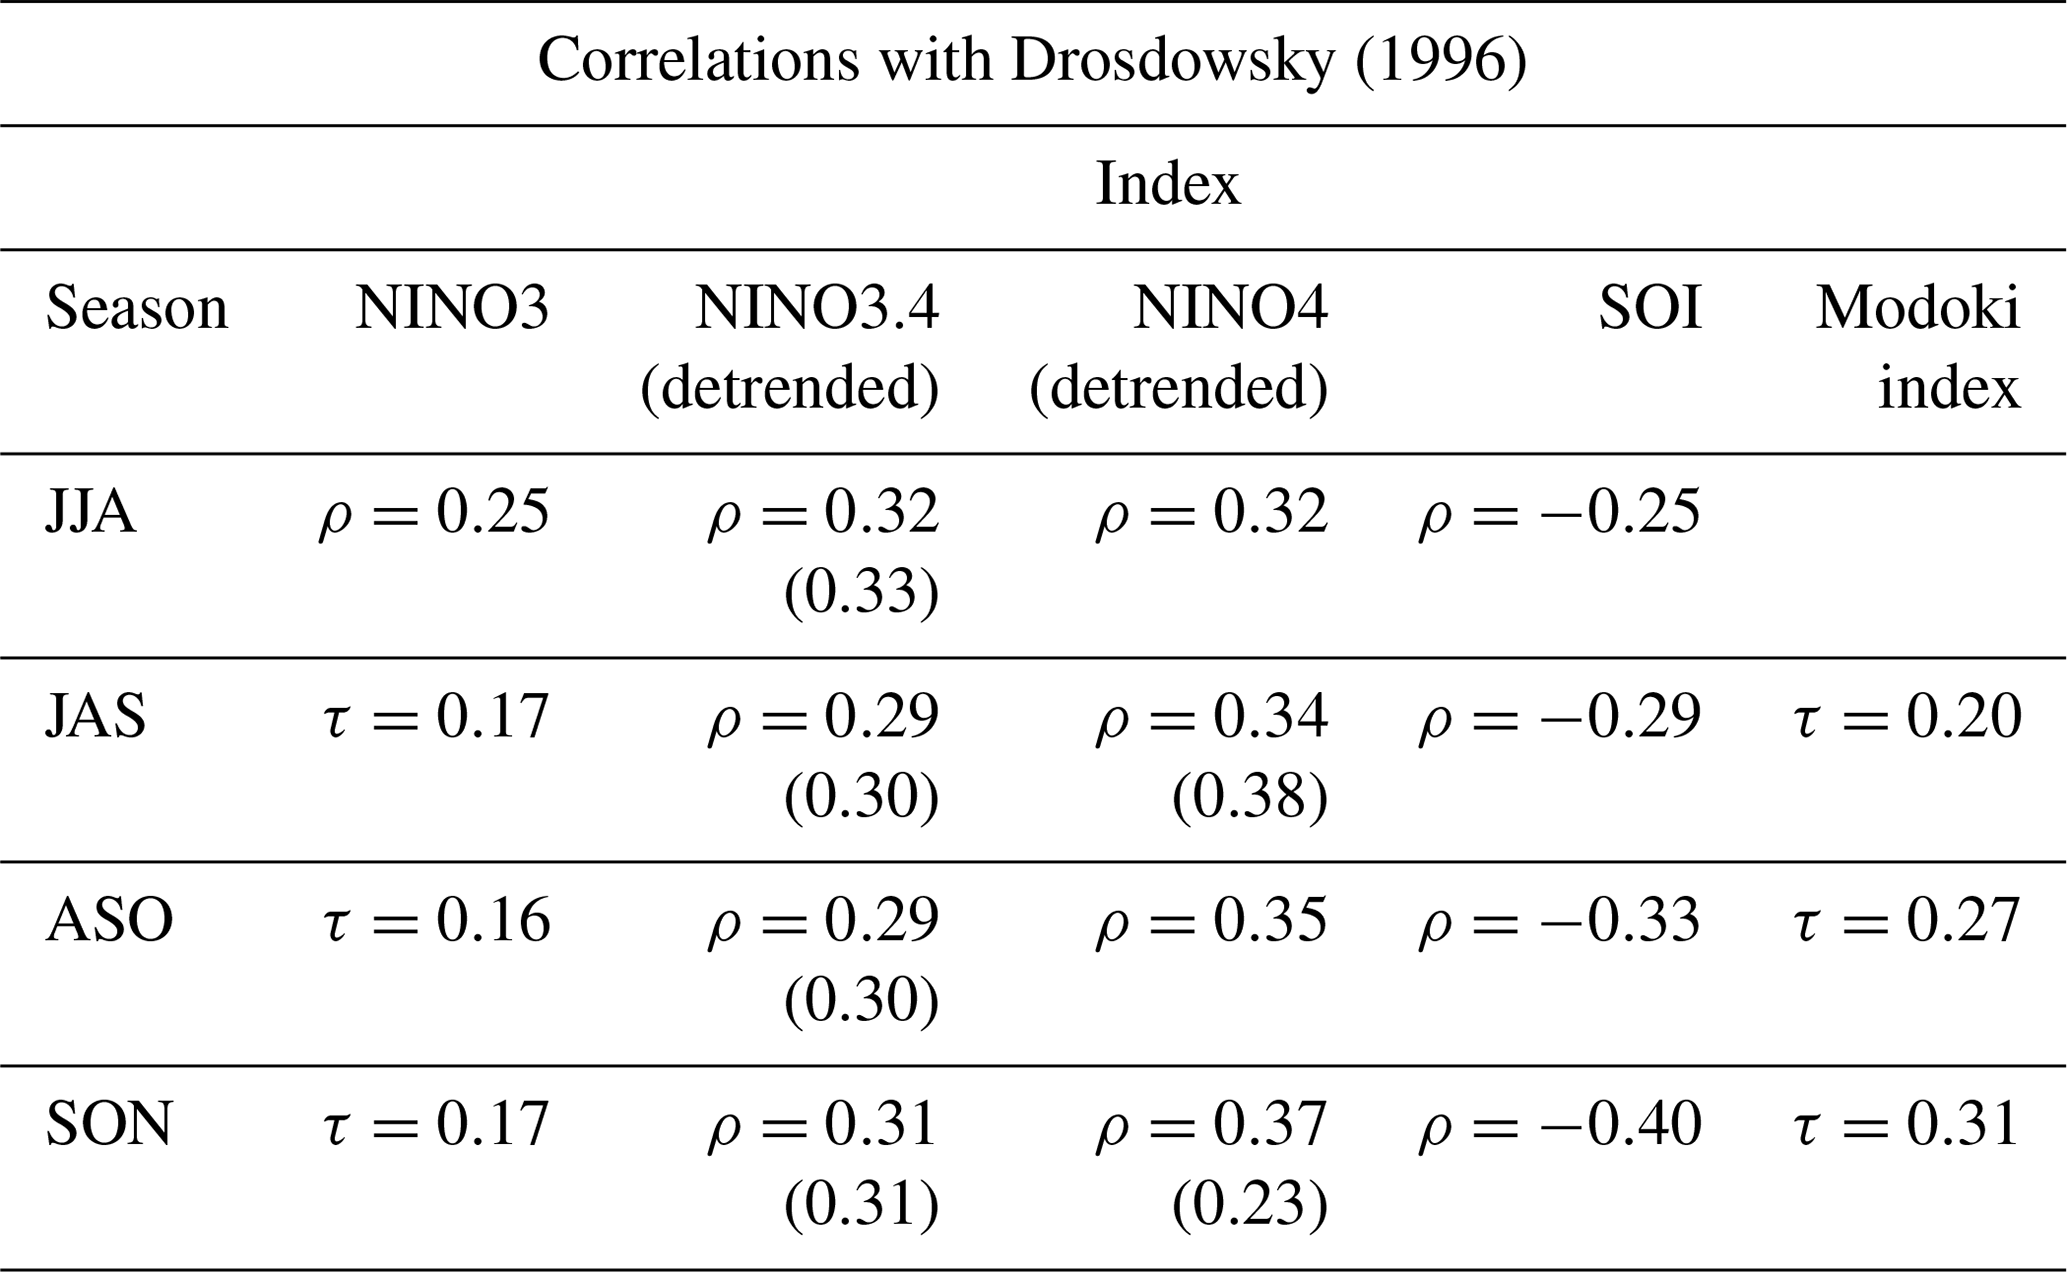
Table 3Correlation coefficients of seasonal ENSO indices with Drosdowsky (1996) monsoon onset dates. Only statistically significant (p<0.05) values are shown.
For the Hendon and Liebmann (1990a) onset dates, only 4 of the 30 seasons (13 %) were successfully reproduced, 17 seasons (47 %) were within 7 d, and 9 seasons (30 %) were more than 7 d away from the original Hendon and Liebmann (1990a) dates (Fig. 1d). Similar to the Drosdowsky (1996) attempt to reproduce the Hendon and Liebmann (1990a) onset dates, we found that there were aspects of their methodology and data used that were unclear. It is possible that Hendon and Liebmann (1990a) did not use daily averaged 850 hPa winds; perhaps they used only the 12:00 or 23:00 UTC soundings. Drosdowsky (1996) suggests Hendon and Liebmann (1990a) may have removed the mean seasonal wind cycle from their wind data without mentioning this in their methodology. It is also possible that the averaged gridded daily rainfall data we are using do not match the areal averaged station data for stations north of 15∘ S in Australia. Overall, we did not consider this a successful reproduction, and the extended Hendon and Liebmann (1990a) dataset was not included in correlations calculations.
Our recreation and extension of the Drosdowsky (1996) onset dates is shown in Fig. 1e. Our analysis reproduced the precise onset dates for 13 of 35 years (37 %), was different by 1 d for 17 of the 35 years (48 %), and was different by more than 1 d but less than 5 d for 5 of the 35 years (14 %). Drosdowsky (1996) included some subjective analysis in determining the onset data, but the 5 years from the 1987/1988 season to the 1991/1992 season were found completely by objective analysis, and we were also able to reproduce the dates precisely for three seasons and with a 1 d difference for the 1988/1989 and 1991/1992 seasons. Drosdowsky (1996) showed the average onset date for the 35 years from 1957/1958 to 1991/1992 was “28–29 December”. When considering the full extended dataset, the mean onset date is 29 December with a standard deviation of 16 d.
The recreated Hung and Yanai (2004) onset dataset matched the original dates to within 1 d in all but two cases (Fig. 1f). The 1983/1984 and 1989/1990 seasons present a very large discrepancy which is probably due to using the ERA-5 data rather than the ERA-15 data. In the 1983/1984 season both the ERA-interim and the ERA5 data show a 12 d run of days with westerly wind greater than 2 m/s with 5 d of OLR below 220 w/m2. If only 2 d within this spell did not meet the 2 m/s threshold in the ERA-15 data, then the next monsoonal burst, which occurred on 5 January 1984, would have been counted as the onset date, as was shown in Hung and Yanai (2004). In the 1989/1990 season the westerly winds reached the 2 m/s threshold on 6 January (the onset date for that season from Hung and Yanai, 2004) but dropped below 2 m/s on the 7th and then above it again on the 8th through the 14th, making only a 7 d run, and then above the threshold again from the 14th through the 31st. On the days below the threshold, the winds are still westerly and are close to 2 m/s. It is quite possible that the ERA-15 data maintained a strong enough burst to show a 10+ day run beginning on the 6th.
The extended Hung and Yanai (2004) dataset, with the outliers retained, shows a mean onset date of 27 December with a standard deviation of 20 d.
Davidson et al. (2007) report the mean onset date is 2 January. The reproduced dataset captured the precise onset dates as the original dataset in only 4 of the 15 seasons analysed by Davidson et al. (2007); it was off by only 1 d for 6 of the 15 seasons, off by more than 1 d but less than 7 d for 3 of the 15 seasons, and different by more than 1 week for two seasons (1989/1990 and 1990/1991; see Fig. 1g). The extended dataset shows a mean monsoon onset of 2 January with a standard deviation of 17 d.
Zhang (2010) original onset dates and the recreated onset dates are compared in Fig. 1h. Of the 43 years considered by Zhang (2010), we were able to successfully recreate the precise onset date for only 15 (35 %) of the years and within 3 d for 36 seasons (84 %). Of the remaining six seasons, the recreation differed from the original dates by 1 to almost 6 weeks, with the largest difference of −39 d in the 1985/1986 season. Because of the large differences in these seasons, we do not consider this to be a successful reproduction. It is not clear what caused the differences, although we found the analysis to be very sensitive to the period selected for the climatological mean PWmax and PWmin (i.e. whether the PWmax and PWmin were calculated over the full wet season or just the monsoon months). Due to these large discrepancies for more than 10 % of the recreated dataset and the limitations with the ERA-40 reanalysis data (mentioned in Sect. 3.9), we chose not to calculate an extended dataset (see Fig. 1h), and Zhang (2010) data are not included in the correlations calculations (Sect. 4.3).
For the Kajikawa et al. (2010) reproduction, we were able to successfully recreate the daily AUSMI values but found some discrepancies when applying the onset criteria. By adjusting the threshold of the third criterion listed in Sect. 3.8 we were able to find a closer match for most years. Of the 58 years included in the original study, we were able to reproduce 52 seasons (90 %) to within 3 d of the original dates including 20 onset dates matching the Kajikawa et al. (2010) dates precisely (see Fig. 1i). Two of the onset dates were different by more than 3 d but less than 1 week, and four had more than 7 d but less than 2 weeks difference between the original and reproduced onset dates. Kajikawa et al. (2010) noted a mean onset date of 15 December with a standard deviation of 16 d. The recreated dataset shows the same statistics for the same years, but when using the extended dataset, the standard deviation is 15 d.
4.2 Comparison with climate indices
Here we show the full analysis of statistics for the Drosdowsky (1996) onset methodology. We will then report the results of applying the same methodology to the other monsoon onset datasets.
Drosdowsky (1996) reported a correlation coefficient between onset date and the September–November (SON) SOI of for the period of 1957 through 1992. However, when this dataset is extended to 2021, the correlation drops to (p<0.05), and when analysing only the extended data (i.e. 1992 to 2021), the correlation is even lower (). Using an arbitrary threshold of a seasonal SON SOI value of to define the ENSO state (i.e. values >+7 indicate a La Niña state and values <−7 indicate an El Niño state), we can see that in the original dataset there were eight El Niño years and six La Niña years. In the latter part of the dataset there were seven more El Niño years and seven more La Niña years with some strong La Niña events (SOI > 10, or 1 standard deviation of MSLP anomalies) that are not present in the earlier part of the record.
When considering sea surface temperatures rather than the SOI, the correlations are equally small. The correlation coefficient between the monsoon onset dates and ENSO indices are in Table 3. The onset dates showed the highest correlation with the SON NINO4 index (ρ=0.37); however, that correlation weakens when the background warning trend is removed from the SST index. Both the NINO3.4 and the ENSO Modoki index showed correlation coefficients of 0.31. When filtering out neutral years (NINO3.4 anomaly >−0.7 and <0.7), the correlation coefficient increases to ρ=0.40, and when filtering out all neutral and weak events (NINO3.4 index within 1 SD), the correlation coefficient increases to ρ=0.43 (p=0.06).
The delay in onset during strong El Niño years is small compared to the expedition of onset dates during strong La Niña years, +2 and −14 d, respectively (see Fig. 2c). Figure 2a shows the Drosdowsky (1996) onset dates for each season from 1950/1951 to 2020/2021 with each season shaded by weak/strong and ENSO state based on the NINO3.4 index. In Fig. 2b the data have been sorted by onset date, and in Fig. 2c the data have been grouped by ENSO state. The same analyses for the SOI, NINO3, NINO4, and ENSO Modoki (not shown) show similar patterns as the NINO3.4 analysis shown in Fig. 2. Our results show that only a strong La Niña has a meaningful impact on Australian monsoon onset timing at Darwin using the Drosdowsky (1996) onset method. The monsoon onset was earlier than the average for 12 out of 15 strong La Niña years, compared to 7 of 12 weak La Niña years, 10 out of 23 ENSO-neutral years, 5 out of 13 weak El Niño years, and 3 out of 8 strong El Niño years. Note that the three strong La Niña years that saw a later than average onset date all occurred before 1957 (see Fig. 2a), which, as stated in Sect. 2.1, should be interpreted with caution.

Figure 2Analysis of Drosdowsky (1996) onset dates with NINO3.4 SST anomalies. Colours are as follows: dark blue = SST <−0.99 ∘C; light blue = −0.99 ∘C ≤ SST <−0.5 ∘C; grey = −5 ∘C ≤ SST ∘C; pink ∘C < SST ∘C; and red = SST >+0.99 ∘C. (a) Monsoon onset dates for each season, coloured by NINO3.4 SST anomalies. (b) Monsoon onset dates sorted by onset date and coloured by NINO3.4 SST anomalies. (c) Monsoon onset dates grouped by ENSO state and coloured by NINO3.4 SST anomalies.
Using the 70 years in this study as a basic statistical model, there is a 60 % probability that onset will be delayed given an El Niño with SON NINO3.4 anomaly > 0.98 ∘C (1 standard deviation) and an 81 % probability that onset will be early given a La Niña with SON NINO3.4 anomaly <−0.98 ∘C, compared with a 48 % probability when using all data.
The correlations with non-ENSO climate drivers listed in Table 2 showed mixed results. Most of the correlations did not show statistical significance. Only the IOD, the Western North Pacific Monsoon Index (WNPMI) index, and the Indonesian Index SST (II SST; Verdon and Franks, 2005) showed statistical significance, yet the correlations were relatively low.
The detrended IOD showed positive correlations of over 30 % for the month of September (ρ=0.37) and for the season of August–October (ASO; ρ=0.34). When the trends were retained, the correlations were similar. A positive IOD has a stronger tendency toward delaying the monsoon onset than a negative IOD has in expediting the onset. Of the 70 years considered, 83 % of the monsoon onsets during a positive IOD were delayed, while only 58 % of the onset dates during a negative IOD were early. There were 2 years when the monsoon onset occurred in November (1973, 2013), and these were both neutral IOD years, suggesting the IOD was not a factor in the early onset. Nearly half of the onset dates occurred in December, although the IOD pattern has usually diminished by the time the monsoon has begun; there is no statistically significant link between the December IOD index and December onset dates.
The June–September WNPMI showed a correlation coefficient with monsoon onset timing of ρ=0.37 (p<0.05). The II SST showed a small negative correlation with Drosdowsky (1996) onset dates. The mean SST for June–August had a correlation of (p<0.05) which gradually increased to (p<0.05) in the SON season. The present study found that the correlation between the June–September Indian Monsoon Index and the Drosdowsky (1996) monsoon onset dates was low and lacked statistical significance.
4.3 Correlation analysis
Following the same process as was followed to test the correlations with the Drosdowsky (1996) onset dates, here we show the results of the correlations with the other extended datasets.
For Troup (1961), the timing of neither the wind nor the rainfall onset criteria showed a significant correlation with any ENSO, IOD, or SST indicators. The extended dataset showed statistically significant, albeit small, correlations with high latitude variability, specifically the Amundsen Sea Low Index and a delayed correlation with the Antarctic Oscillation. The Troup (1961) rainfall onset correlated with the AAO for the seasons August–September (ρ=0.33) and September–November (ρ=0.31), as well as the October–December mean relative central pressure variation of the Amundsen Sea Low Index (). The Troup (1961) wind onset correlated with the longitude variation of the Amundsen Sea Low Index for the seasonal mean of June–August (), July–September (JAS; ), and August–October () and the latitude variation of the Amundsen Sea Low Index for the seasonal mean of September–November (ρ=0.37) and October–December (ρ=0.45). The physical mechanism causing this relationship should be the topic of future research but may be related to teleconnections with mid-latitude variability (see, for example, Berry and Reeder, 2016). The combined Troup (1961) wind and rainfall criteria did not show a statistically significant relationship with any climate indices.
Murakami and Sumi (1982) showed a statistically significant correlation with the detrended NINO4 index for the season July–September (ρ=0.32). However, when the trend is retained, the relationship weakens such that only the September–November season shows a relationship with a correlation greater than 30 % (ρ=0.33). Murakami and Sumi (1982) also showed a statistically significant correlation with the ENSO Modoki index and the NINO3 and NINO3.4 SST indices, but in all cases the correlation coefficient is less than ±30 %. When considering strong ENSO events, in which the seasonal index exceeds ±1 standard deviation, the correlations with the Murakami and Sumi (1982) onset dates increased. For the detrended SON NINO3.4 index the correlation coefficient increased from ρ=0.23 to ρ=0.40. Of the 70 years considered, 70 % of the monsoon onsets during a strong El Niño were delayed, while 90 % of the onset dates during a strong La Niña were early. We also considered the correlations with non-ENSO climate drivers listed in Table 2. Most of the correlations did not show statistical significance. Only the detrended IOD indices showed statistical significance, but the correlations were small, i.e. within ±30 %. When retaining the trend in the IOD pattern, the correlation coefficients were lower in every case, suggesting that what little correlation exists between the Murakami and Sumi (1982) monsoon onset dates and the IOD is diminishing over time. When the IOD is not present or the DMI is neutral, it is not a factor in driving monsoon onset timing, the correlation (τ) is near 7 % and onset dates range from 1 December to 10 February. However, when considering only the events when the detrended SON IOD is not neutral (seasonal average DMI is <−0.4 or >+0.4), the correlation coefficient with onset dates increases to τ=0.43 with p<0.05. This relationship is stronger for positive IOD events than for negative. For 9 of 10 events when the SON mean DMI was greater than +0.4, the onset was delayed. Only 1997 showed a positive IOD event with an early onset, and this onset date came only 4 d before the long-term average. Of the eight negative IOD events, six showed an early onset. This pattern breaks down when the trend is retained, for which the probability of a delayed onset for neutral, negative, and positive events are 49 %, 58 %, and 75 %, respectively. Thus, we conclude that when using Murakami and Sumi (1982) onset criteria, a positive IOD is likely to delay the monsoon onset, while neutral and negative IODs have little to no impact on onset timing.
Holland (1986) reported “no significant correlation” between SOI values prior to onset and monsoon onset timing. The extended dataset also shows a lack of significant correlation with the SOI, any other ENSO index, the IOD, or any index used in this study. Due to the lack of statistical significance and the low correlation coefficients, we conclude that the Holland (1986) method of monitoring the onset of the Australian monsoon has low predictability on a seasonal timescale.
The recreated Hung and Yanai (2004) extended dataset showed a statically significant correlation with the ENSO Modoki indices, the WNPMI, and the seasonal IOD indices, but all the correlations were small, i.e. within ±30 %. The Hung and Yanai (2004) monsoon onset dates showed the highest correlation with the detrended monthly September IOD index with ρ=0.30 (p<0.05)
The extended Davidson et al. (2007) onset dates show only a very weak correlation with ENSO indices. Of all the correlations with p<0.05, only three showed any correlation >±30 %, and they are the detrended seasonal JAS NINO4 (ρ=0.34), detrended seasonal June–August (JJA) NINO3.4 (ρ=0.31), and the JAS seasonal average Amundsen Sea Low relative central pressure index, showing a correlation of ρ=0.35.
Table 4Correlation coefficients of seasonal climate indices with Kajikawa et al. (2010) monsoon onset dates. Only and p<0.05 are shown.

Table 5Correlation coefficients of September–October–November ENSO indices with monsoon onset dates from each onset dataset. Bolded values indicate statistically significant correlations (p<0.05).

The extended Kajikawa et al. (2010) monsoon onset dataset showed the strongest link with seasonal-scale climate indices of all the monsoon onset datasets examined here. These correlations are listed in Table 4 – correlation coefficients of seasonal climate indices with Kajikawa et al. (2010) monsoon onset dates. Only and p<0.05 are shown. Kajikawa et al. (2010) reported correlation coefficients of −0.48 for onset dates and the SOI during November and December. Our recreated onset dates correlate with the SOI for November with and for December with 0.48. When the datasets are extended to the 2020 season, the correlation coefficients become and for November and December, respectively, and for the seasonal SON mean SOI.
Drosdowsky (1996) calculated a correlation of with September–November (SON) mean SOI. We found the same correlation when considering the same time period (1957–1992), but the correlation lowered to when the dataset is extended from 1950 to 2021. We suppose two possible explanations for this change: (1) the initial sample size was too small to correctly capture the full range of climate variability (and may still be) and/or (2) background trends in climate patterns are changing the link between the onset and the SOI in the months before the onset.
To roughly test these explanations, we split the data into two periods of 36 years each. A bootstrapping technique was applied to both periods, and changes in the data between the two periods were analysed. The mean onset date and SD changed by less than a day between each period. The SOI differs by only 0.4 between the two periods, and it is concluded that these changes are small compared to the changes seen in the correlation between the two datasets.
We then tested the correlation with the extended Drosdowsky (1996) onset dates and other ENSO indices. Correlation coefficients with NINO3, NINO4, NINO3.4, and ENSO Modoki indices all showed statistical significance, but the correlation values were all low with the highest correlation being the SON NINO4 index with ρ=0.37. When using the statistical correlation as an indicator of possible predictability (i.e. >60 % correlation), we found that none of the ENSO indices showed a strong link with Australian monsoon onset timing at Darwin using the Drosdowsky (1996) onset method. When not considering the statistical correlation but simply analysing onset dates by ENSO state, we found that only a strong La Niña had a meaningful impact on monsoon onset timing (Fig. 2), suggesting a non-linearity in the relationship between ENSO and monsoon onset (see Sect. 4.2 for details).
We also considered the correlations with non-ENSO climate indices in seasons before the monsoon onset. Climate influences from the previous season that do not correlate well with the timing of the Drosdowsky (1996) onset dates include the stratospheric QBO, polar annular modes, the Indian monsoon in the previous season, the Amundsen Sea low, and Indian Ocean SST. The monthly September and October IOD, and the seasonal average ASO and SON IOD, measured by the Dipole Mode Index (DMI), showed a weak (30 %–40 %) correlation. The IOD pattern usually dissipates before the monsoon onset in late December or early January (Saji et al., 1999), as does the correlation with the DMI and onset dates in the OND season and the individual months, November and December. When isolating IOD states and then comparing with onset dates, it appears that a positive IOD tends to delay onsets more than negative IOD expedites onset, suggesting a non-linear relationship.
When considering other onset definitions of the dynamical monsoon onset, neither the Troup (1961) combined wind and rain index, Holland (1986), nor Hung and Yanai (2004) extended onset dates showed a statistically significant correlation larger than ±30 % with ENSO variability, Indian Ocean SST or any other climate indices considered in this study. Overall, these monsoon onset methods lacked a relationship with large-scale climate patterns. The Holland (1986) Australian monsoon onset definition was especially problematic when also considering the difficulty in recreating the methodology. The correlation coefficients for each monsoon onset definition and September–November ENSO and IOD indices are shown in Table 5.
The extended Kajikawa et al. (2010) dataset showed correlations with ENSO indices that were similar to the extended Drosdowsky (1996) dataset when all the data were considered, but when considering only strong ENSO events, the Drosdowsky (1996) data showed a stronger relationship with the seasonal NINO3.4 indices, while the Kajikawa et al. (2010) correlations showed little change. Overall, both the Drosdowsky (1996) and Kajikawa et al. (2010) methods provided insight into the monsoon dynamics and some level of predictability with seasonal-scale climate patterns.
The extended Murakami and Sumi (1982) onset dataset showed statistically significant but low (<30 %) correlations with the IOD and ENSO indices. These correlations changed when removing neutral ENSO and IOD events from the analysis; specifically, a positive SON mean DMI is often associated with a delayed monsoon onset, while neutral and negative SON mean DMIs have no relationship with onset timing. This onset criterion was relatively easy to calculate and use and could be included with the Drosdowsky (1996) and Kajikawa et al. (2010) methodologies as one that provides some prognostic capabilities.
The relationships between the SOI and monsoon onset dates that were reported in Drosdowsky (1996) weaken when the dataset is extended to include the monsoon seasons from 1950/1951 through 2020/2021. When considering other ENSO indices, only a strong La Niña (e.g. SON NINO3.4 index > 0.98 ∘C) has an impact on monsoon onset timing, in which 8 of 10 strong La Niña events were associated with an expedited monsoon onset. The extended Murakami and Sumi (1982) onset dataset and the extended Kajikawa et al. (2010) dataset showed similar relationships, although the correlations with Murakami and Sumi (1982) showed smaller correlations, and the Kajikawa et al. (2010) dataset did not show differences between strong and neutral ENSO events.
When considering the influence of other climate patterns on the monsoon onset dates, the seasonal and monthly detrended DMI showed similar correlations as the ENSO indices with the Drosdowsky (1996), Murakami and Sumi (1982), and Kajikawa et al. (2010) onset methodologies. However, these were small to moderate correlations (<±40 %) which diminish as the IOD pattern breaks down (usually in December). Also, when the trend in the IOD data is retained, the relationship with onset dates diminishes in most (but not all) cases.
To conclude, the relationship between ENSO and Australian monsoonal variability has been heavily studied, with most studies pointing to a positive correlation. However, we have shown that the timing of the dynamical monsoon onset is one aspect of variability that does not show a strong link with ENSO or other seasonal-scale indices. We have also shown that the relationship with some of these indices is non-linear, with a strong La Niña showing a stronger influence than a strong El Niño, and a strong positive IOD in the season leading up to onset tends to have a stronger influence than a negative onset. We have also shown that the already weak relationships between onset timing and the IOD and ENSO are weakening over time, but we have not assessed if this weakening is due to simply more data capturing a larger breadth of the climate variability or if the background warming trend in sea surface temperatures is changing the physical relationship between the climate pattern and the monsoon. Other global monsoon patterns, such as the Indian and the Southeast Asian monsoons, show a similar link with ENSO; could similar analysis of onset timing further our understanding of these monsoon patterns? Future research should look at the linkages to other monsoon patterns and the teleconnections and other physical relationships linking these climate drivers with onset dates. Another question for future research is, while statistical relationships are weak, could dynamical models predict the onset of the monsoon on seasonal timescales?
All data analysed in this research are available via the URLs provided in Tables 1 and 2.
JL designed the study, carried out the analysis underpinning the paper, and wrote the draft manuscript. JR advised JL throughout this work and contributed to the interpretation of the results and to the writing of the manuscript.
The authors declare that they have no conflict of interest.
The authors would like to thank Wassyl Drosdowsky for providing advice on recreating the onset method from his 1996 paper. We also express gratitude to Huqiang Zhang, Yoshiyuki Kajikawa, Bin Wang, and Qiong He for sharing or assisting with data from their original papers. Finally, thanks to the two reviewers who provided very useful suggestions in strengthening the final manuscript.
This paper was edited by Martin Singh and reviewed by Sugata Narsey and one anonymous referee.
Ali, S., Khalid, B., Kiani, R. S., Babar, R., Nasir, S., Rehman, N., Adnan, M., and Goheer, M. A.: Spatio-Temporal Variability of Summer Monsoon Onset over Pakistan, Asia-Pacific J. Atmos. Sci., 56, 147–172, https://doi.org/10.1007/s13143-019-00130-z, 2020.
Balston, J. and English, B.: Defining and predicting the “break of the season” for north-east Queensland grazing areas, Rangel. J., 31, 151, https://doi.org/10.1071/RJ08054, 2009.
Barnston, A. G. and Livezey, R. E.: Classification, Seasonality and Persistence of Low-Frequency Atmospheric Circulation Patterns, Mon. Weather Rev., 115, 1083–1126, 1987.
Berry, G. J. and Reeder, M. J.: The dynamics of Australian monsoon bursts, J. Atmos. Sci., 73, 55–69, https://doi.org/10.1175/JAS-D-15-0071.1, 2016.
Chang, C.-P. and Li, T.: A Theory for the Tropical Tropospheric Biennial Oscillation, J. Atmos. Sci., 57, 2209–2224, https://doi.org/10.1175/1520-0469(2000)057<2209:ATFTTT>2.0.CO;2, 2000.
Choi, J. and Kim, H.: Relationship of the Southeast Asian summer monsoon and Mascarene High to the tropical cyclone activity in the western North Pacific, Int. J. Climatol., 40, 4067–4081, https://doi.org/10.1002/joc.6441, 2020.
CLIVAR: CLIVAR special monsoons issue: Persistence of Systematic errors in the Asian-Australian monsoon Precipitation in climate models: a way forward H., CLIVAR Exch., 19, 10–15, available at: http://www.clivar.org/documents/exchanges-66 (last access: 4 June 2021), 2015.
Cook, G. D. and Heerdegen, R. G.: Spatial Variation In The Duration Of The Rainy Season In Monsoonal Australia, Int. J. Climatol., 1732, 1723–1732, https://doi.org/10.1002/joc.704, 2001.
Copernicus Climate Change Service (C3S): ERA5: Fifth generation of ECMWF atmospheric reanalyses of the global climate. Copernicus Climate Change Service Climate Data Store (CDS), available at: https://cds.climate.copernicus.eu/cdsapp#!/home (last access: 28 August 2020), 2017.
Cowan, T., Wheeler, M., and Stone, R.: Prediction of Northern Australian Rainfall Onset Using the ACCESS-Seasonal Model, Proceedings, 36, 189, https://doi.org/10.3390/proceedings2019036189, 2020.
Crook, D. A., Buckle, D. J., Morrongiello, J. R., Allsop, Q. A., Baldwin, W., Saunders, T. M., and Douglas, M. M.: Tracking the resource pulse: Movement responses of fish to dynamic floodplain habitat in a tropical river, J. Anim. Ecol., 89, 795–807, https://doi.org/10.1111/1365-2656.13146, 2020.
Dai, P. and Tan, B.: The nature of the Arctic oscillation and diversity of the extreme surface weather anomalies it generates, J. Clim., 30, 5563–5584, https://doi.org/10.1175/JCLI-D-16-0467.1, 2017.
Davidson, N. E., Hendon, H. H., Davidson, N. E., and Hendon, H. H.: Downstream Development in the Southern Hemisphere Monsoon during FGGE/WMONEX, Mon. Weather Rev., 117, 1458–1470, https://doi.org/10.1175/1520-0493(1989)117<1458:DDITSH>2.0.CO;2, 1989.
Davidson, N. E., Tory, K. J., Reeder, M. J., and Drosdowsky, W. L.: Extratropical–Tropical Interaction during Onset of the Australian Monsoon: Reanalysis Diagnostics and Idealized Dry Simulations, J. Atmos. Sci., 64, 3475–3498, https://doi.org/10.1175/JAS4034.1, 2007.
Drosdowsky, W.: Variability of the Australian summer monsoon at Darwin: 1957–1992, J. Clim., 9, 85–96, https://doi.org/10.1175/1520-0442(1996)009<0085:VOTASM>2.0.CO;2, 1996.
Drosdowsky, W. and Wheeler, M. C.: Predicting the Onset of the North Australian Wet Season with the POAMA Dynamical Prediction System, Weather Forecast., 29, 150–161, https://doi.org/10.1175/WAF-D-13-00091.1, 2014.
Evans, S., Marchand, R., and Ackerman, T.: Variability of the Australian Monsoon and precipitation trends at Darwin, J. Clim., 27, 8487–8500, https://doi.org/10.1175/JCLI-D-13-00422.1, 2014.
Fitzpatrick, R. G. J., Bain, C. L., Knippertz, P., Marsham, J. H., and Parker, D. J.: The West African monsoon onset: A concise comparison of definitions, J. Clim., 28, 8673–8694, https://doi.org/10.1175/JCLI-D-15-0265.1, 2015.
Gochis, D.: Emerging challenges in advancing predictions of the North American Monsoon, CLIVAR Exch., 66, 19, 3–5, 2015.
Grimm, A. M., Cavalcanti, I. F. A., and Berbery, H. E.: The South American Monsoon, CLIVAR Exch., 66, 6–8, 2015.
Hai-Tien, L. and NOAA CDR_Program: NOAA Climate Data Record (CDR) of Daily Outgoing Longwave Radiation (OLR), Version 1.2. NOAA National Climatic Data Center, https://doi.org/10.7289/V5SJ1HH2, 2011.
Hendon, H. H. and Liebmann, B.: A Composite Study of Onset of the Australian Summer Monsoon, J. Atmos. Sci., 47, 2227–2240, https://doi.org/10.1175/1520-0469(1990)047<2227:ACSOOO>2.0.CO;2, 1990a.
Hendon, H. H. and Liebmann, B.: The Intraseasonal (30–50 d) Oscillation of the Australian Summer Monsoon, J. Atmos. Sci., 47, 2909–2924, https://doi.org/10.1175/1520-0469(1990)047<2909:TIDOOT>2.0.CO;2, 1990b.
Hendon, H. H., Davidson, N. E., and Gunn, B.: Australian Summer Monsoon Onset during AMEX 1987, Mon. Weather Rev., 117, 370–390, https://doi.org/10.1175/1520-0493(1989)117<0370:ASMODA>2.0.CO;2, 1989.
Holland, G. J.: Interannual Variability of the Australian Summer Monsoon at Darwin: 1952–82, Mon. Weather Rev., 114, 594–604, https://doi.org/10.1175/1520-0493(1986)114<0594:IVOTAS>2.0.CO;2, 1986.
Hung, C.-W. and Yanai, M.: Factors contributing to the onset of the Australian summer monsoon, Q. J. Roy. Meteor. Soc., 130, 739–758, https://doi.org/10.1256/qj.02.191, 2004.
Gibson, J. K., Kållberg, P., Uppala, S., Hernandez, A., Nomura, A., and Serrano, E.: 1. ERA-15 Description (Version 2 – January 1999), ECMWF Re-Analysis Proj. Rep. Ser., 19, 243–247, 1999.
Jain, M., Naeem, S., Orlove, B., Modi, V., and DeFries, R. S.: Understanding the causes and consequences of differential decision-making in adaptation research: Adapting to a delayed monsoon onset in Gujarat, India, Glob. Environ. Chang., 31, 98–109, https://doi.org/10.1016/j.gloenvcha.2014.12.008, 2015.
Joseph, P. V., Liebmann, B., and Hendon, H. H.: Interannual Variability of the Australian Summer Monsoon Onset: Possible Influence of Indian Summer Monsoon and El Niño, J. Clim., 4, 529–538, https://doi.org/10.1175/1520-0442(1991)004<0529:IVOTAS>2.0.CO;2, 1991.
Kajikawa, Y., Wang, B., and Yang, J.: A multi-time scale Australian monsoon index, Int. J. Climatol., 30, 1114–1120, https://doi.org/10.1002/joc.1955, 2010.
Kalnay, E., Kanamitsu, M., Kistler, R., Collins, W., Deaven, D., Gandin, L., Iredell, M., Saha, S., White, G., Woollen, J., Zhu, Y., Leetmaa, A., Reynolds, R., Chelliah, M., Ebisuzaki, W., Higgins, W., Janowiak, J., Mo, K. C., Ropelewski, C., Wang, J., Jenne, R., and Joseph, D.: The NCEP/NCAR 40-Year Reanalysis Project, B. Am. Meteorol. Soc., 77, 437–471, https://doi.org/10.1175/1520-0477(1996)077<0437:TNYRP>2.0.CO;2, 1996.
Kim, J. and Kim, K. Y.: The tropospheric biennial oscillation defined by a biennial mode of sea surface temperature and its impact on the atmospheric circulation and precipitation in the tropical eastern Indo-western Pacific region, Clim. Dyn., 47, 2601–2615, https://doi.org/10.1007/s00382-016-2987-9, 2016.
Kim, K.-Y., Kullgren, K., Lim, G.-H., Boo, K.-O., and Kim, B.-M.: Physical mechanisms of the Australian summer monsoon: 2. Variability of strength and onset and termination times, J. Geophys. Res., 111, 1–17, https://doi.org/10.1029/2005JD006808, 2006.
Kullgren, K. and Kim, K. Y.: Physical mechanisms of the Australian summer monsoon: 1. Seasonal cycle, J. Geophys. Res.-Atmos., 111, 1–13, https://doi.org/10.1029/2005JD006807, 2006.
Li, T., Zhang, Y., Chang, C. P., and Wang, B.: On the relationship between Indian ocean sea surface temperature and Asian summer monsoon, Geophys. Res. Lett., 28, 2843–2846, https://doi.org/10.1029/2000GL011847, 2001.
Lim, Y., Son, S. W., and Kim, D.: MJO prediction skill of the subseasonal-to-seasonal prediction models, J. Clim., 31, 4075–4094, https://doi.org/10.1175/JCLI-D-17-0545.1, 2018.
Lisonbee, J., Ribbe, J., and Wheeler, M.: Defining the north Australian monsoon onset: A systematic review, Prog. Phys. Geogr. Earth Environ., 44, 398–418, https://doi.org/10.1177/0309133319881107, 2020.
Lo, F., Wheeler, M. C., Meinke, H., and Donald, A.: Probabilistic Forecasts of the Onset of the North Australian Wet Season, Mon. Weather Rev., 135, 3506–3520, https://doi.org/10.1175/MWR3473.1, 2007.
Marshall, G. and National Center for Atmospheric Research Staff (Eds.): The Climate Data Guide: Marshall Southern Annular Mode (SAM) Index (Station-based), available at: https://climatedataguide.ucar.edu/climate-data/marshall-southern-annular-mode-sam-index-station-based (last access: 5 August 2020), 2018.
Martinez, P. P., Mahmud, A. S., Yunus, M., Faruque, A. S. G., Ahmed, T., Pascual, M., and Buckee, C. O.: Tube Well Use as Protection Against Rotavirus Infection During the Monsoons in an Urban Setting, J. Infect. Dis., 221, 238–242, https://doi.org/10.1093/infdis/jiz436, 2020.
Mcbride, J. L.: Satellite observations of the southern hemisphere monsoon during Winter MONEX, Tellus A, 35 A, 189–197, https://doi.org/10.1111/j.1600-0870.1983.tb00196.x, 1983.
Meehl, G. A.: Coupled land-ocean-atmosphere processes and South Asian monsoon variability, Science, 266, 263–267, https://doi.org/10.1126/science.266.5183.263, 1994.
Meehl, G. A. and Arblaster, J. M.: The tropospheric biennial oscillation and Asian-Australian monsoon rainfall, J. Clim., 15, 722–744, https://doi.org/10.1175/1520-0442(2002)015<0722:TTBOAA>2.0.CO;2, 2002.
Misra, V. and Bhardwaj, A.: Defining the northeast monsoon of India, Mon. Weather Rev., 147, 791–807, https://doi.org/10.1175/MWR-D-18-0287.1, 2019.
Misra, V., Bhardwaj, A., and Mishra, A.: Local onset and demise of the Indian summer monsoon, Clim. Dyn., 51, 1609–1622, https://doi.org/10.1007/s00382-017-3924-2, 2018.
Mo, K. C.: Relationships between low-frequency variability in the Southern Hemisphere and sea surface temperature anomalies, J. Clim., 13, 3599–3610, https://doi.org/10.1175/1520-0442(2000)013<3599:RBLFVI>2.0.CO;2, 2000.
Murakami, T. and Sumi, A.: Southern Hemisphere Summer Monsoon Circulation during the 1978–79 WMONEX Part II: Onset, Active and Break Monsoons, J. Meteorol. Soc. Japan, 60, 649–670, 1982.
Nicholls, N.: A system for predicting the onset of the north Australian wet-season, J. Climatol., 4, 425–435, https://doi.org/10.1002/joc.3370040407, 1984.
Nicholls, N., McBride, J. L., and Ormerod, R. J.: On Predicting the Onset of Australian Wet Season at Darwin, Mon. Weather Rev., 110, 14–17, https://doi.org/10.1175/1520-0493(1982)110<0014:OPTOOT>2.0.CO;2, 1982.
Noska, R. and Misra, V.: Characterizing the onset and demise of the Indian summer monsoon, Geophys. Res. Lett., 43, 4547–4554, https://doi.org/10.1002/2016GL068409, 2016.
Parija, P.: India's Monsoon, Bloomberg, available at: https://www.bloomberg.com/quicktake/indias-monsoon (last access: 4 June 2021), 2018.
Pillai, P. A. and Mohankumar, K.: Tropospheric biennial oscillation of the Indian summer monsoon with and without the El Nino-Southern Oscillation, Int. J. Climatol., 27, 2095–2101, https://doi.org/10.1002/joc.1503, 2007.
Pope, M., Jakob, C., and Reeder, M. J.: Regimes of the north Australian wet season, J. Clim., 22, 6699–6715, https://doi.org/10.1175/2009JCLI3057.1, 2009.
Pradhan, M., Rao, A. S., Srivastava, A., Dakate, A., Salunke, K., and Shameera, K. S.: Prediction of Indian Summer-Monsoon Onset Variability: A Season in Advance, Sci. Rep., 7, 1–14, https://doi.org/10.1038/s41598-017-12594-y, 2017.
Pramono, A., Middleton, J. H., and Caponecchia, C.: Civil Aviation Occurrences in Indonesia, J. Adv. Transp., 2020, 1–17, https://doi.org/10.1155/2020/3240764, 2020.
Qian, W., Deng, Y., Zhu, Y., and Dong, W.: Demarcating the Wolrdwide Monsoon, Theor. Appl. Climatol., 71, 1–16, https://doi.org/10.1007/s704-002-8204-0, 2002.
Qiao, Y., Huang, W., and Jian, M.: Impacts of El Niño-Southern Oscillation and local sea surface temperature on moisture source in Asian-Australian monsoon region in boreal summer, Aquat. Ecosyst. Health Manag., 15, 31–38, https://doi.org/10.1080/14634988.2012.649667, 2012.
Ramage, C. S.: Monsoon Meteorology, Academic Press, New York, 1971.
Ramella Pralungo, L., Haimberger, L., Stickler, A., and Brönnimann, S.: A global radiosonde and tracked balloon archive on 16 pressure levels (GRASP) back to 1905 – Part 1: Merging and interpolation to 00:00 and 12:00 GMT, Earth Syst. Sci. Data, 6, 185–200, https://doi.org/10.5194/essd-6-185-2014, 2014.
Raphael, M. N., Marshall, G. J., Turner, J., Fogt, R. L., Schneider, D., Dixon, D. A., Hosking, J. S., Jones, J. M., and Hobbs, W. R.: The Amundsen sea low: Variability, change, and impact on Antarctic climate, B. Am. Meteorol. Soc., 97, 111–121, https://doi.org/10.1175/BAMS-D-14-00018.1, 2016.
Saji, N., Goswami, B., Vinayachandran, P., and Yamagata, T.: A dipole mode in the Tropical Ocean, Nature, 401, 360–363, 1999.
Semazzi, F., Liu, B., Xie, L., Smith, K., Angus, M., Gudoshava, M., Argent, R., Sun, X., Liess, S., and Bhattacharya, A.: Decadal Variability of the East African Monsoon, CLIVAR Exch., 19, 15–18, 2015.
Shaik, H. and Lisonbee, J.: The tropical circulation in the Australian/Asian region – November 2010 to April 2011, Aust. Meteorol. Oceanogr. J., 62, 51–61, https://doi.org/10.22499/2.6201.006, 2012.
Smith, I. N., Wilson, L., and Suppiah, R.: Characteristics of the Northern Australian Rainy Season, J. Clim., 21, 4298–4311, https://doi.org/10.1175/2008JCLI2109.1, 2008.
Stuecker, M. F., Timmermann, A., Yoon, J., and Jin, F. F.: Tropospheric Biennial Oscillation (TBO) indistinguishable from white noise, Geophys. Res. Lett., 42, 7785–7791, https://doi.org/10.1002/2015GL065878, 2015.
Sumi, A. and Murakami, T.: Large-scale Aspects of the 1978–79 Winter Circulation over the Greater WMONEX Region, J. Meteorol. Soc. Japan. Ser. II, 59, 625–645, https://doi.org/10.2151/jmsj1965.59.5_625, 1981.
Suppiah, R.: The Australian summer: a review, Prog. Phys. Geogr., 16, 283–318, 1992.
Taschetto, A. S., Gupta, A. Sen, Hendon, H. H., Ummenhofer, C. C., and England, M. H.: The contribution of Indian Ocean sea surface temperature anomalies on Australian summer rainfall during EL Niño events, J. Clim., 24, 3734–3747, https://doi.org/10.1175/2011JCLI3885.1, 2011.
Thompson, D. W. J. and Wallace, J. M.: The Arctic oscillation signature in the wintertime geopotential height and temperature fields, Geophys. Res. Lett., 25, 1297–1300, https://doi.org/10.1029/98GL00950, 1998.
Troup, A. J.: Variation in Upper Tropospheric Flow associated with the onset of the Australian Summer Monsoon, Indian J. Meteorol. Geophys., 12, 217–230, 1961.
Troup, A. J.: The “southern oscillation”, Q. J. Roy. Meteor. Soc., 91, 490–506, https://doi.org/10.1002/qj.49709139009, 1965.
Verdon, D. C. and Franks, S. W.: Indian Ocean sea surface temperature variability and winter rainfall: Eastern Australia, Water Resour. Res., 41, 1–10, https://doi.org/10.1029/2004WR003845, 2005.
Wang, B. and Ding, Q.: Global monsoon: Dominant mode of annual variation in the tropics, Dyn. Atmos. Ocean., 44, 165–183, https://doi.org/10.1016/j.dynatmoce.2007.05.002, 2008.
Wang, B. and Fan, Z.: Choice of South Asian Summer Monsoon Indices, B. Am. Meteorol. Soc., 80, 629–638, https://doi.org/10.1175/1520-0477(1999)080<0629:COSASM>2.0.CO;2, 1999.
Wang, B., Wu, R., and Lau, K. M.: Interannual variability of the asian summer monsoon: Contrasts between the Indian and the Western North Pacific-East Asian monsoons, J. Clim., 14, 4073–4090, https://doi.org/10.1175/1520-0442(2001)014<4073:IVOTAS>2.0.CO;2, 2001.
Wang, B., Wu, R., and Li, T.: Atmosphere-warm ocean interaction and its impacts on Asian-Australian monsoon variation, J. Clim., 16, 1195–1211, https://doi.org/10.1175/1520-0442(2003)16<1195:AOIAII>2.0.CO;2, 2003.
Wang, B., Ho, L., Zhang, Y., and Lu, M.-M.: Definition of South China Sea Monsoon Onset and Commencement of the East Asia Summer Monsoon, J. Clim., 17, 699–710, 2004.
Wang, B., Lee, J. Y., Kang, I. S., Shukla, J., Kug, J. S., Kumar, A., Schemm, J., Luo, J. J., Yamagata, T., and Park, C. K.: How accurately do coupled climate models predict the leading modes of Asian-Australian monsoon interannual variability?, Clim. Dyn., 30, 605–619, https://doi.org/10.1007/s00382-007-0310-5, 2008a.
Wang, B., Yang, J., Zhou, T., and Wang, B.: Interdecadal changes in the major modes of Asian-Australian monsoon variability: Strengthening relationship with ENSO since the late 1970s, J. Clim., 21, 1771–1789, https://doi.org/10.1175/2007JCLI1981.1, 2008b.
Webster, P. J. and Yang, S.: Monsoon and Enso: Selectively Interactive Systems, Q. J. Roy. Meteor. Soc., 118, 877–926, https://doi.org/10.1002/qj.49711850705, 1992.
Webster, P. J., Magaña, V. O., Palmer, T. N., Shukla, J., Tomas, R. A., Yanai, M., and Yasunari, T.: Monsoons: Processes, predictability, and the prospects for prediction, J. Geophys. Res.-Ocean., 103, 14451–14510, https://doi.org/10.1029/97JC02719, 1998.
Wheeler, M. C. and Hendon, H. H.: An All-Season Real-Time Multivariate MJO Index: Development of an Index for Monitoring and Prediction, Mon. Weather Rev., 132, 1917–1932, https://doi.org/10.1175/1520-0493(2004)132<1917:AARMMI>2.0.CO;2, 2004.
Wheeler, M. C. and McBride, J. L.: Australasian monsoon, in Intraseasonal Variability in the Atmosphere-Ocean Climate System (2nd edition), 147–198, Springer-Verlag Berlin Heidelberg, 2011.
Wheeler, M. C. and McBride, J. L.: Australasian monsoon, Intraseasonal Var. Atmos. Clim. Syst., 1814, 147–197, https://doi.org/10.1007/978-3-642-13914-7_5, 2012.
Wu, M. C. and Chan, J. C. L.: Observational relationships between summer and winter monsoons over East Asia. Part II: Results, Int. J. Climatol., 25, 453–468, https://doi.org/10.1002/joc.1153, 2005.
Yancheva, G., Nowaczyk, N. R., Mingram, J., Dulski, P., Schettler, G., Negendank, J. F. W., Liu, J., Sigman, D. M., Peterson, L. C., and Haug, G. H.: Influence of the intertropical convergence zone on the East Asian monsoon, Nature, 445, 74–77, https://doi.org/10.1038/nature05431, 2007.
Yu, J. Y., Weng, S. P., and Farrara, J. D.: Ocean roles in the TBO transitions of the Indian-Australian monsoon system, J. Clim., 16, 3072–3080, https://doi.org/10.1175/1520-0442(2003)016<3072:ORITTT>2.0.CO;2, 2003.
Zeng, X. and Lu, E.: Notes and Correspondence: Globally unified monsoon onset and retreat indexes, J. Clim., 17, 2241–2248, https://doi.org/10.1175/1520-0442(2004)017<2241:GUMOAR>2.0.CO;2, 2004.
Zhang, H.: Diagnosing Australia-Asian monsoon onset / retreat using large-scale wind and moisture indices, Clim. Dyn., 35, 601–618, https://doi.org/10.1007/s00382-009-0620-x, 2010.
Zhang, S. and Wang, B.: Global summer monsoon rainy seasons, Int. J. Climatol., 28(12), 1563–1578, https://doi.org/10.1002/joc.1659, 2008.
Zhou, W. and Chan, J. C. L.: ENSO and the South China Sea summer monsoon onset, Int. J. Climatol., 27, 157–167, https://doi.org/10.1002/joc.1380, 2007.