the Creative Commons Attribution 4.0 License.
the Creative Commons Attribution 4.0 License.
 | 31 Aug 2021
A numerical study to investigate the roles of former Hurricane Leslie, orography and evaporative cooling in the 2018 Aude heavy-precipitation event
Olivier Caumont
In south-eastern France, the Mediterranean coast is regularly affected by heavy-precipitation events. On 14–15 October 2018, in the Aude department, a back-building quasi-stationary mesoscale convective system produced up to about 300 mm of rain in 11 h. At synoptic scale, the former Hurricane Leslie was involved in the formation of a Mediterranean surface low that channelled conditionally unstable air towards the coast. At mesoscale, convective cells focused west of a decaying cold front that became quasi-stationary and downwind of the terrain. To investigate the roles of the moisture provided by Leslie, orography and evaporative cooling among the physical processes that led to the location and intensity of the observed rainfall, numerical simulations are run at 1 km and 500 m horizontal grid spacing and evaluated with independent near-surface analyses including novel crowd-sourced observations of personal weather stations. Simulations show that, in a first part of the event, low-level conditionally unstable air parcels found inside strong updraughts mainly originated from areas east of the Balearic Islands, over the Mediterranean Sea, whereas in a second part, an increasing number originated from Leslie's remnants. Air masses from areas east of the Balearic Islands appeared as the first supplier of moisture over the entire event. Still, Leslie contributed to substantially moistening mid-levels over the Aude department, diminishing evaporation processes. Thus, the evaporative cooling over the Aude department did not play any substantial role in the stationarity of the quasi-stationary front. Regarding lifting mechanisms, the advection of conditionally unstable air by a low-level jet towards the quasi-stationary front, confined to altitudes below 2 km, reactivated convection along and downwind of the front. Most of the air parcels found inside strong updraughts near the location of the maximum rainfall were lifted above the quasi-stationary front. Downwind of the Albera Massif, mountains bordering the Mediterranean Sea, cells formed by orographic lifting were maintained by low-level leeward convergence, mountain lee waves and a favourable directional wind shear; when terrain is flattened, rainfall is substantially reduced. The location of the exceptional precipitation was primarily driven by the location of the quasi-stationary front and secondarily by the location of convective bands downwind of orography.
- Article
(33015 KB) - Full-text XML
- BibTeX
- EndNote


Heavy-precipitation events (HPEs), usually defined as events with daily rainfall exceeding 150 mm (Ricard et al., 2012), affect all the coastal areas of the western Mediterranean region, often producing flash floods (Nuissier et al., 2008). Due to the large societal impact of these events causing casualties and damage, they were extensively studied during the HyMeX programme extending from 2010 to 2020 (Ducrocq et al., 2016). Large rainfall amounts observed in time periods from a few hours to several days during HPEs are the result of deep convection focusing over the same area. Convective organization often consists of continuous convective cell renewal constituting quasi-stationary mesoscale convective systems (MCSs).
Ricard et al. (2012) built a climatology of HPE environments over the north-western Mediterranean area based on 3D-Var ALADIN (Aire Limitée Adaptation Dynamique Développement InterNational) mesoscale analyses of a 5-year period (2002–2006). With this climatology, synoptic situations favouring HPEs over Languedoc-Roussillon, the maritime part of the Occitanie region in southern France (Fig. 1), are now well known (e.g. Fig. 11 of Ricard et al., 2012; Fig. 1 of Ducrocq et al., 2016). At upper levels, a trough extends over the Iberian peninsula in a south-east–north-west orientation. This trough is associated with a cold low in the middle and high troposphere and generally entails a diffluent south-westerly flow at upper levels. MCSs develop preferentially northwards of a slowly evolving surface low located between the Iberian Peninsula and the Balearic Islands focusing a south-easterly low-level jet (LLJ). The location and the deepening of the slowly evolving surface low is a key ingredient in focusing convection over the same area and continuously initiating convection inside MCSs (Duffourg et al., 2016; Nuissier et al., 2016). The Mediterranean Sea supplies moisture – up to 60 % of the total air parcel moisture in previous HPEs according to water budgets of Duffourg and Ducrocq (2013) – and heat to this low-level airflow through evaporation and heat exchange, which both depend on the sea surface temperature (SST). Thus, abnormally warm SSTs can destabilize atmospheric lower levels up to 2–3 km a.s.l. (above sea level) (Lebeaupin et al., 2006), modulating the intensity of convective precipitation. All these ingredients favour a persistent LLJ transporting low-level conditionally unstable air parcels over the Gulf of Lion.
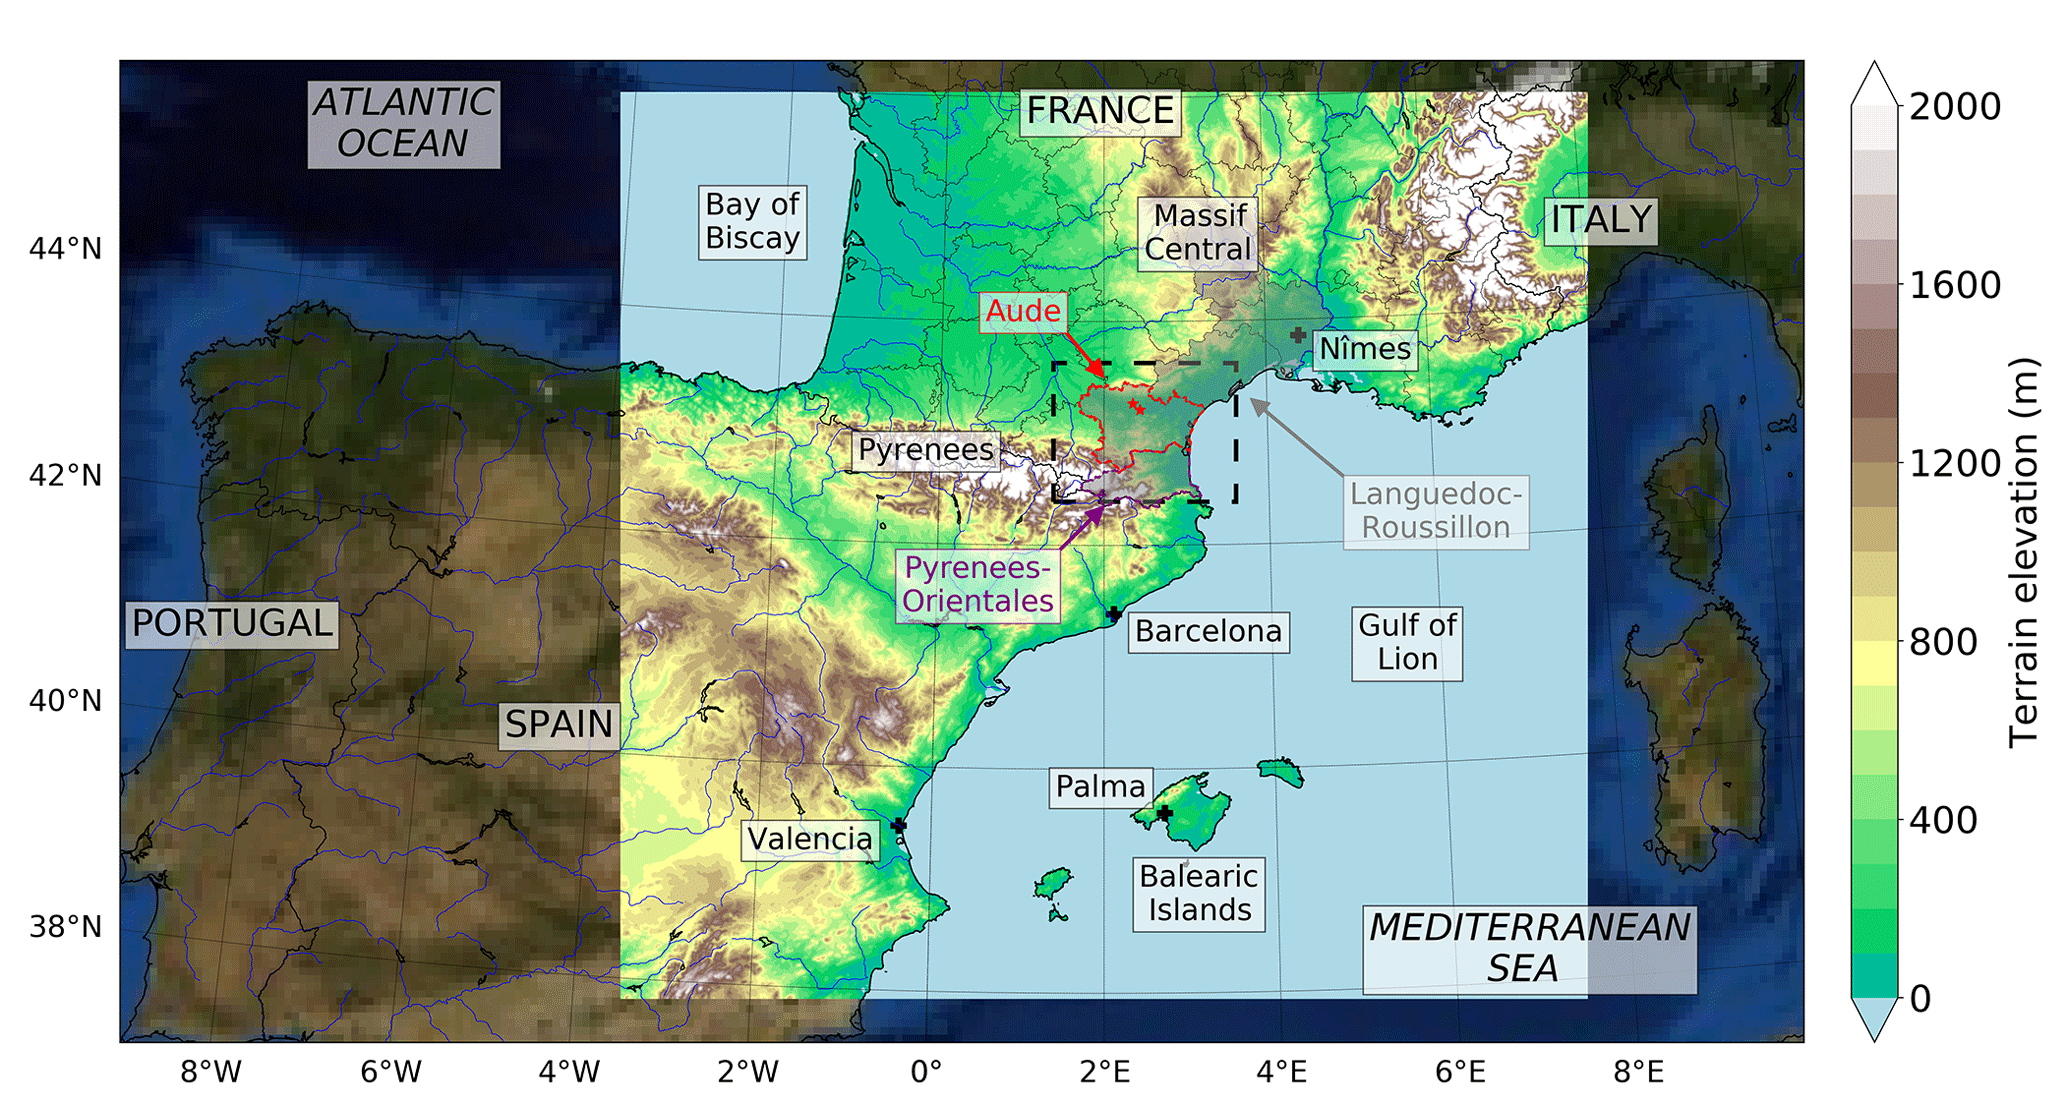
Figure 1Map of south-western Europe. The bright square and the dashed black line correspond to the two grid-nested model domains. Inside the bright square, terrain elevation from the parent model is shown; outside, it is the NASA visible blue marble image (from https://visibleearth.nasa.gov, last access: 20 July 2021). Solid black lines indicate French departments and country borders. Languedoc-Roussillon, a region including Aude and Pyrenees-Orientales departments, is shaded. The two little red stars, landmarks displayed in other figures, indicate from north to south the locations of Villegailhenc and Trèbes, which are two towns that were affected by the HPE.
Several mechanisms are responsible for lifting this conditionally unstable low-level marine flow, triggering convection over the same area. First, the mountainous terrain bordering the Mediterranean shore leads to orographic lifting. Secondly, in the lower levels of the atmosphere, mesoscale boundaries, when stationary, can lift air parcels over the same areas. Such stationary boundaries can be fronts (Trapero et al., 2013), outflow boundaries of cold pools (Ducrocq et al., 2008) or local convergence lines (Buzzi et al., 2014) among others. Lifting mechanisms include mechanical lifting in convergence areas and buoyancy differences between air masses. The action of these mesoscale boundaries is combined with the action of the terrain itself and explains why large rainfall amounts are observed over the mountains as well as in the Mediterranean plains and over the sea (Duffourg et al., 2018). Once convection initiated, the locations of these mesoscale boundaries and the amplitudes of their temperature, humidity, pressure and wind speed gradients can be continuously modified by the MCS thanks to small-scale feedback mechanisms of the convection to the environment (Duffourg et al., 2016). Cold pools, which are favoured by a dry or weak upstream low-level flow according to the idealized study of Bresson et al. (2012) over southern France, are affected by such feedback mechanisms. In previous HPEs, dry air parcels at altitudes between 1 and 4 km a.s.l., when mixed with precipitation of the MCS, were humidified and cooled through evaporation processes, forming vigorous downdraughts, which resulted in the formation or maintenance of cold pools (Ducrocq et al., 2008; Duffourg et al., 2018).
Among these mechanisms, those at the origin of the HPE of the night of 14 to 15 October 2018, on which this article focuses, are studied. During that night, in the centre and north-west of the Aude department (Fig. 1), part of Languedoc-Roussillon, rainfall accumulations over 200 mm in less than 12 h affected an approximately 60 km long and 10 km wide band oriented south-east to north-west. Inside the band, an automatic rain gauge in Trèbes (Fig. 2) measured 295.5 mm in 11 h, including 243.5 mm in 6 h and 110.5 mm in 2 h. Météo-France volunteer observers measured 318.9 mm in Conques-sur-Orbiel and 306.6 mm in Cuxac-Cabardès with manual rain gauges in 2 d, probably fallen almost entirely in 12 h as 93 % to 99 % of the 2 d rainfall fell in 12 h in nearby Météo-France automatic rain gauges. In the centre and north-western part of the band, such 12 h rainfall accumulations were unprecedented in recent meteorological records, and return periods were estimated over 100 years. The orientation of the band, parallel to the small Trapel river catchment, led to a major flash flood in this catchment in particular, overflowing and destroying bridges. It caused 15 fatalities; injured 75; and caused around EUR 325 million of damages, including EUR 256 million in insurable assets for around 29 000 insurance claims and EUR 69 million in non-insurable assets (Préfecture de l'Aude, 2018; Ayphassorho et al., 2019; French Insurance Federation, 2019; Petrucci et al., 2020). This episode is part of a series of HPEs that occurred in October and November 2018 over the north-western Mediterranean and particularly affected the Balearic Islands on 9 October (Lorenzo-Lacruz et al., 2019) and Italy between 27 and 30 October (Davolio et al., 2020).
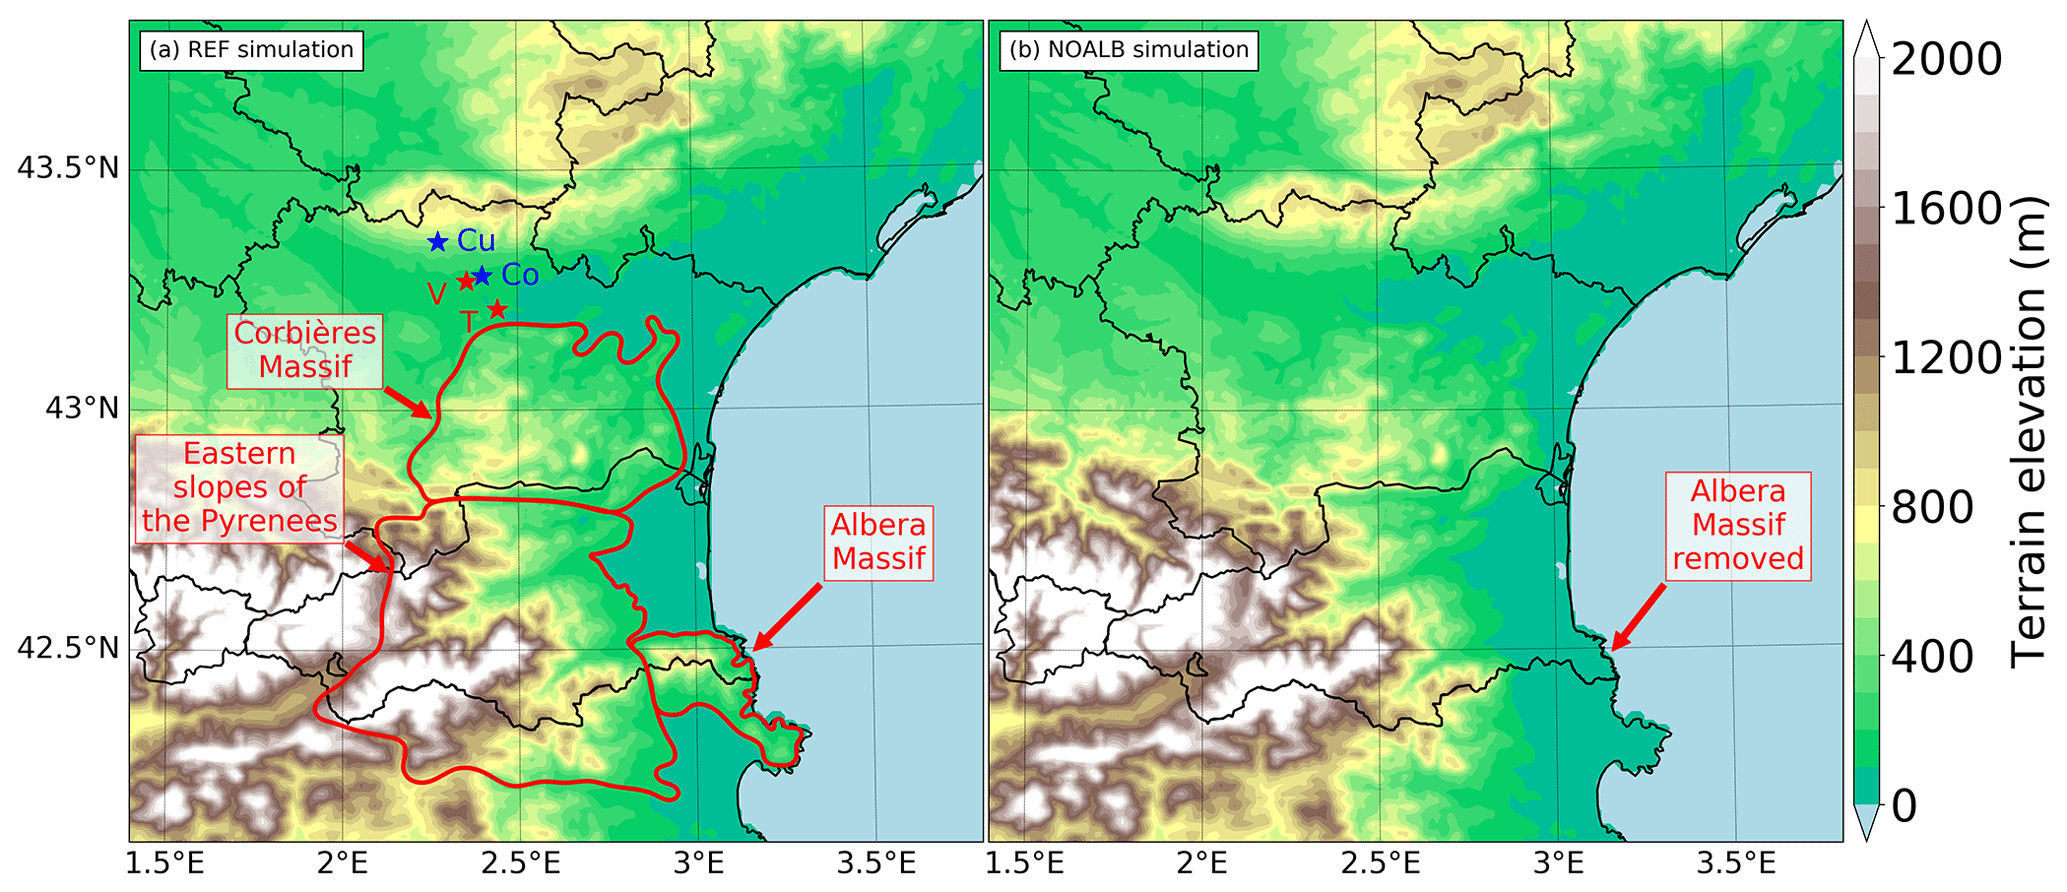
Figure 2Orography of the south Languedoc-Roussillon including the Aude department in the simulations (a) REF and (b) NOALB, in which the Albera Massif is removed. Solid black lines indicate French departments and country borders. Stars indicate towns which were affected by the HPE: “V” is Villegailhenc, “T” is Trèbes, “Cu” is Cuxac-Cabardès, and “Co” is Conques-sur-Orbiel. Red contours indicate mountain massifs.
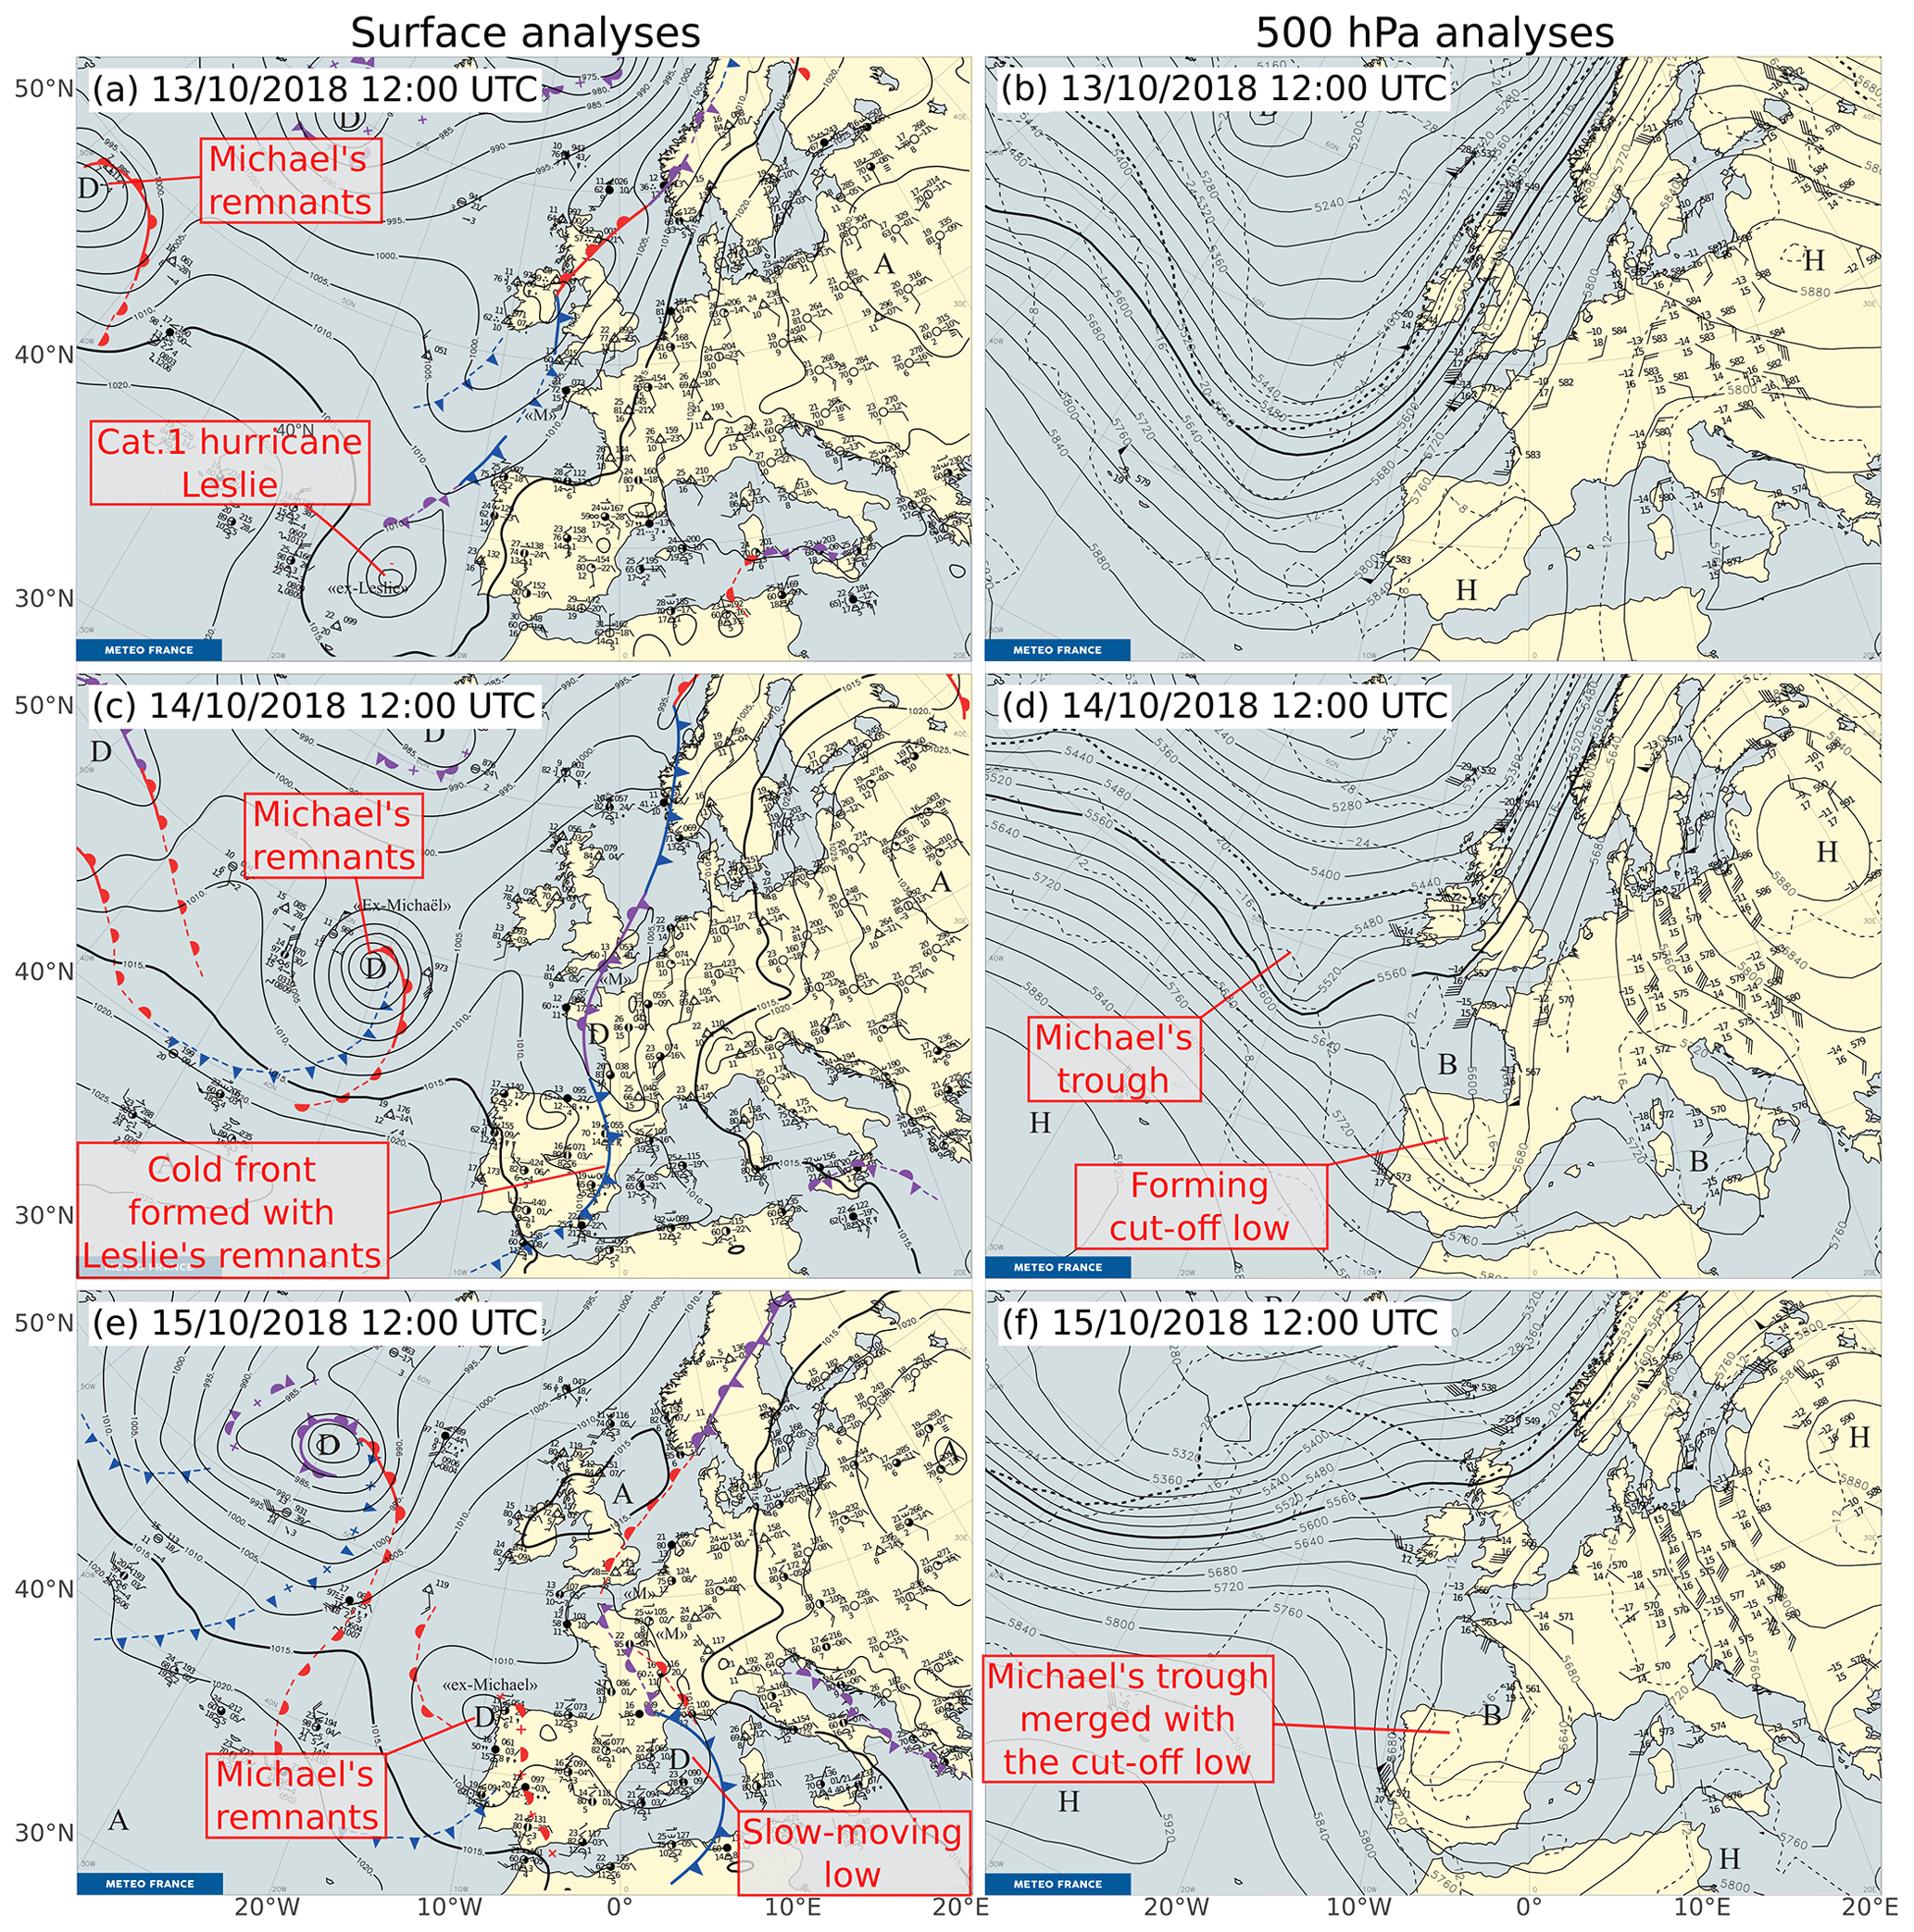
Figure 3Météo-France (a, c, e) surface and (b, d, f) 500 hPa analyses (Santurette and Joly, 2002) at (a, b) 12:00 UTC on 13 October 2018, (c, d) 12:00 UTC on 14 October 2018 and (e, f) 12:00 UTC on 15 October 2018. Surface fronts are manually drawn using conventional observations, satellite and radar images, and short-term forecasts (instead of analyses due to availability time constraints). Mean sea level pressure (in hPa), 500 hPa geopotential height (in geopotential metres, gpm) and temperature (in ∘C) are from the operational global model ARPEGE (Courtier et al., 1991) 6 h forecast of the T−6 h run (T: time of the chart). Surface (altitude) low-pressure centres are indicated by “D” (“B”) and high-pressure centres by “A” (“H”).
As described by Kreitz et al. (2020) and Caumont et al. (2021), at large scale, a remarkable feature was the extratropical transition of Hurricane Leslie before landfall in the Portuguese coast on the evening of 13 October, 1 d before the HPE started. Transitioning hurricanes over the North Atlantic are known to disturb the midlatitude flow close to or downstream of them, causing or modifying the location and intensity of high-impact weather such as HPEs (Grams and Blumer, 2015; Pantillon et al., 2015). As hurricanes can supply large amounts of moisture and because the moisture structure in the lower troposphere was shown to play a key role in the timing and location of precipitation of previous HPEs (Lee et al., 2018), it is of interest to quantify the amount of moisture supplied by Leslie to the convective system. At a smaller scale, the largest rainfall accumulations were aligned along bands downstream of the Pyrenees relief. Within the bands, the largest accumulations were found west of a quasi-stationary front and a quasi-stationary mesoscale trough. Because of the heavy convective rain observed west of this front, evaporative cooling may have additionally cooled the west side of the front. This additional cold air may have caused a dynamic feedback that contributed to the stationarity of the front. A similar dynamic feedback was described by Davolio et al. (2016) over north-eastern Italy: in cases of upstream events, a cold air layer formation preceded the convection onset, and evaporation and sublimation of precipitation beneath the convective system were able to additionally cool this cold air layer, which influenced the propagation of this cold air mass. Consequently, the goal of the article is to address the following questions raised by Caumont et al. (2021): what were the roles of (i) the moisture provided by Leslie, (ii) the eastern Pyrenees relief and (iii) the evaporative cooling in the physical processes that led to the location and intensity of the observed rainfall? Investigation of these questions is carried out as follows. First, the case study is presented in Sect. 2. Numerical simulations of this HPE are described in Sect. 3. The realism of the reference simulation is evaluated in particular near the surface through a comparison with independent analyses built from screen-level observations of standard and personal weather stations (Mandement and Caumont, 2020) in Sect. 4. The reference simulation and a simulation to study the sensitivity to the terrain are used in Sect. 5 to investigate processes that led to the observed rainfall, in particular the role of Leslie. Then, the role of the cooling associated with the evaporation of precipitation is evaluated in Sect. 6.

Figure 4ARPEGE analyses of water vapour mixing ratio and geopotential height (in gpm) at 925 hPa on 13 October 2018 at (a) 18:00 UTC; on 14 October 2018 at (b) 00:00 UTC, (c) 06:00 UTC, (d) 12:00 UTC and (e) 18:00 UTC; and (f) on 15 October 2018 at 00:00 UTC. The approximate location of moist air masses carried by Leslie (solid red line) or found over the Mediterranean Sea (dashed red line) is circled.
2.1 Synoptic-scale situation
Between 13 and 15 October, the synoptic situation over western Europe was disturbed by the remnants of hurricanes Leslie and Michael (NOAA NESDIS, 2018), while the situation remained blocked over eastern Europe due to a quasi-stationary high at all levels of the troposphere. At 500 hPa, on 13 October at 12:00 UTC, a large trough extended from the west of Iceland towards the west of Portugal (Fig. 3b). The trough split and evolved in a cut-off low over Spain on 14 October at 12:00 UTC (Fig. 3d), while the remnants of former Hurricane Michael generated a secondary trough at the rear of the cut-off. On 15 October at 12:00 UTC (Fig. 3f), this secondary trough merged with the existing cut-off low, which slowed its eastward movement.
Near the surface, on 13 October at 12:00 UTC (Fig. 3a), category 1 Hurricane Leslie approached the Portuguese coast (NOAA NWS National Hurricane Center, 2018a). Leslie brought a large amount of moisture at all levels of the troposphere: over large areas, water vapour mixing ratio exceeded 12 g kg−1 at 925 hPa (Fig. 4a), 7 g kg−1 at 700 hPa (not shown) and 2.5 g kg−1 at 500 hPa (not shown) according to ARPEGE analyses on 13 October at 18:00 UTC. These values are in the upper range of mixing ratios observed within the boundary layer over the Gulf of Lion by Di Girolamo et al. (2016) (8–15 g kg−1) or within the free troposphere below 3 km a.g.l. (2–8 g kg−1) over the Balearic Islands by Chazette et al. (2016) during southerly marine flows of the HyMeX SOP1. Leslie made landfall in Portugal between 21:00 and 22:00 UTC (NOAA NWS National Hurricane Center, 2018b) as a post-tropical cyclone. After landfall, Leslie's mean sea level pressure (MSLP) low filled up quickly, and Leslie's remnants participated in extending towards the south and increase the activity over Spain and France of the existing cold front on 14 October (Fig. 3c). During the evening and the night of 14–15 October, around the cold front, in an area of deep convection, a low rapidly deepened over the Mediterranean Sea, between the Balearic Islands and Valencia region (Fig. 3e). A trough formed and extended this Mediterranean low towards Languedoc-Roussillon (Caumont et al., 2021). This low moved slowly northwards overnight, which increased the MSLP gradient along the Languedoc-Roussillon coast. Consequently, the east–south-easterly wind between the surface and 925 hPa strengthened (not shown). This resulting LLJ supplied significantly moist air from the Mediterranean Sea (dashed lines in Fig. 4d–f).
In the meantime, on 14 October, the active part of the cold front located north of the Pyrenees (called CF1; Fig. 3c) moved eastwards. CF1 decayed (precipitation along it decreased and almost stopped) as it moved east (not shown), while its near-surface mark in the form of a thermal gradient remained (Caumont et al., 2021). Then CF1 stopped in the middle of the Aude department and became a quasi-stationary front, slightly west of the MSLP trough. Both CF1 and the MSLP trough remained quasi-stationary between 22:30 UTC on 14 October and 04:00 UTC on 15 October (Caumont et al., 2021).
In the morning of 15 October, the north-eastwards advance of the slow-moving low and its associated cold front (CF2; Fig. 3c and e) brought additional low-level moisture over Languedoc-Roussillon. This moisture originated from both Leslie's remnants and a moist area over southern Spain (Fig. 4).
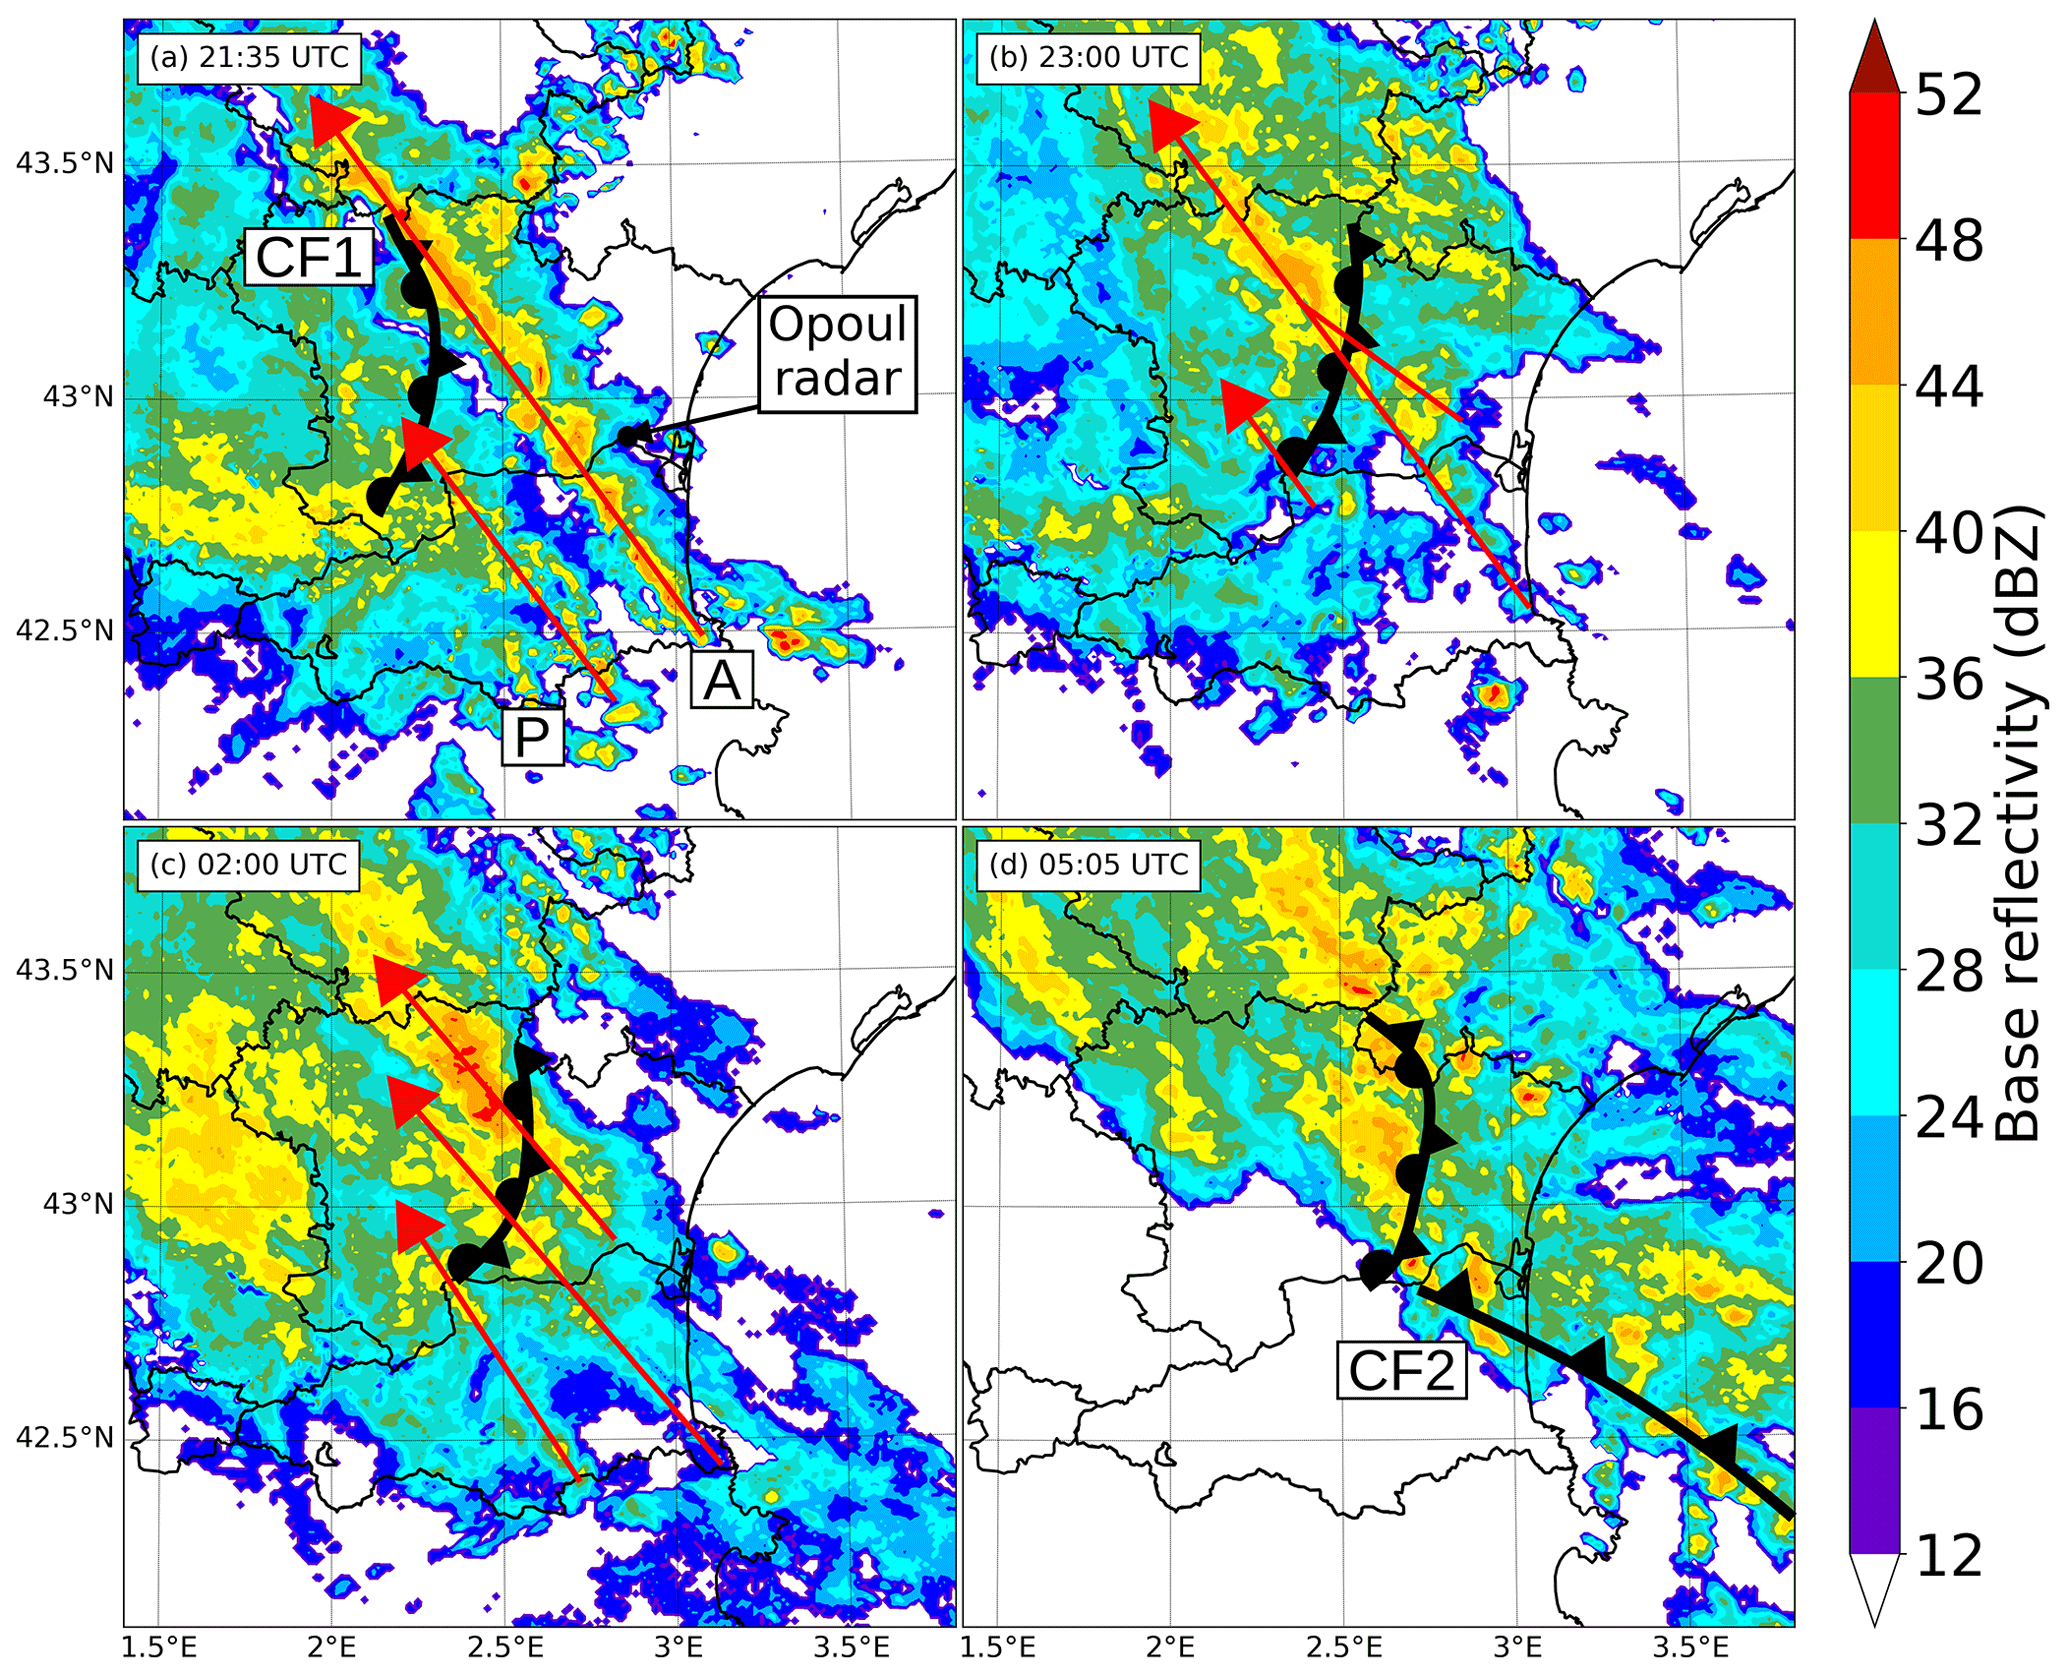
Figure 5Radar base reflectivity from the Météo-France operational mosaic on 14 October at (a) 21:35 UTC and (b) 23:00 UTC and on 15 October at (c) 02:00 UTC and (d) 05:05 UTC. Red arrows show the axes of continuous convective cell renewal and the movement of individual cells shown by radar. “A” and “P” recall the location of the Albera Massif and the eastern slopes of the Pyrenees, respectively. Locations of CF1 and CF2 are indicated by bold black frontal symbols.
2.2 Mesoscale situation
At mesoscale, rain started over the Pyrenees-Orientales and Aude departments in the morning of 14 October. A first part of the HPE began around 19:00 UTC on 14 October: east of a large area of stratiform rain advected from Spain, two parallel lines of convective cells formed (red arrows in Fig. 5a), starting over the Albera Massif and the eastern slopes of the Pyrenees, and rapidly became the active parts of a back-building MCS. The eastern line was more active than the western line: reflectivities exceeded 40 dBZ at 21:35 UTC along the eastern line but remained below 40 dBZ along the western line (Fig. 5a). One shall note that the Opoul radar (Fig. 5a), well covering the area, had a failure between 21:55 UTC on 14 October and 06:05 UTC on 15 October: observed reflectivities are likely underestimated in Fig. 5b–d, particularly south of this radar.
At 23:00 UTC, Fig. 5b shows that convective cores fed the eastern line from its eastern flank and that reflectivities were particularly strengthened in the north-western part of the line, west of CF1. This organization in two lines was observed until around 00:00 UTC. After 00:00 UTC, the eastern line orientation slightly turned anticlockwise, and a third active line formed (Fig. 5c) starting from the upstream slopes of the Corbières Massif. Reflectivities of all lines were still strengthened in their north-western parts. At 02:00 UTC (Fig. 5c), an extended region of reflectivity >12 dBZ appeared over the Mediterranean Sea showing the advance of the rain band associated with CF2. After 02:00 UTC, in a second part of the HPE, this rain band modified the MCS organization in lines observed until then: active cells with reflectivity above 40 dBZ were continuously advected from the sea. Heavy rainfall persisted over the Aude department and strengthened in particular west of CF1 (Fig. 5d). After 05:00 UTC, the large rain band associated with CF2 headed slowly north-eastwards, and precipitation stopped around 07:00 UTC over the western part of the Aude department (around 09:00 UTC over the entire department; not shown).
Figure 6a shows the resulting 24 h accumulated precipitation from the standard and personal weather stations (SPWSs) ANTILOPE quantitative precipitation estimate (QPE) at 1 km horizontal grid spacing, blending radar and SPWS rain gauge observations, described by Caumont et al. (2021). Estimated accumulated precipitation reached 342 mm a few kilometres south-west of Trèbes, close to where an automatic rain gauge measured 295.5 mm, and a personal weather station measured 311 mm. The line organization identified on radar observations resulted in two precipitation bands, referred to as eastern and western bands, with the eastern band a little curved due to the formation of the aforementioned third line between 00:00 and 02:00 UTC. The consequences were catastrophic near the precipitation maximum because most of the rain fell in 6 to 12 h (Préfecture de l'Aude, 2018; Ayphassorho et al., 2019). Another local maximum of 317 mm was estimated over mountains north-east of the bands but without reported consequences since hourly precipitation accumulations remained moderate.
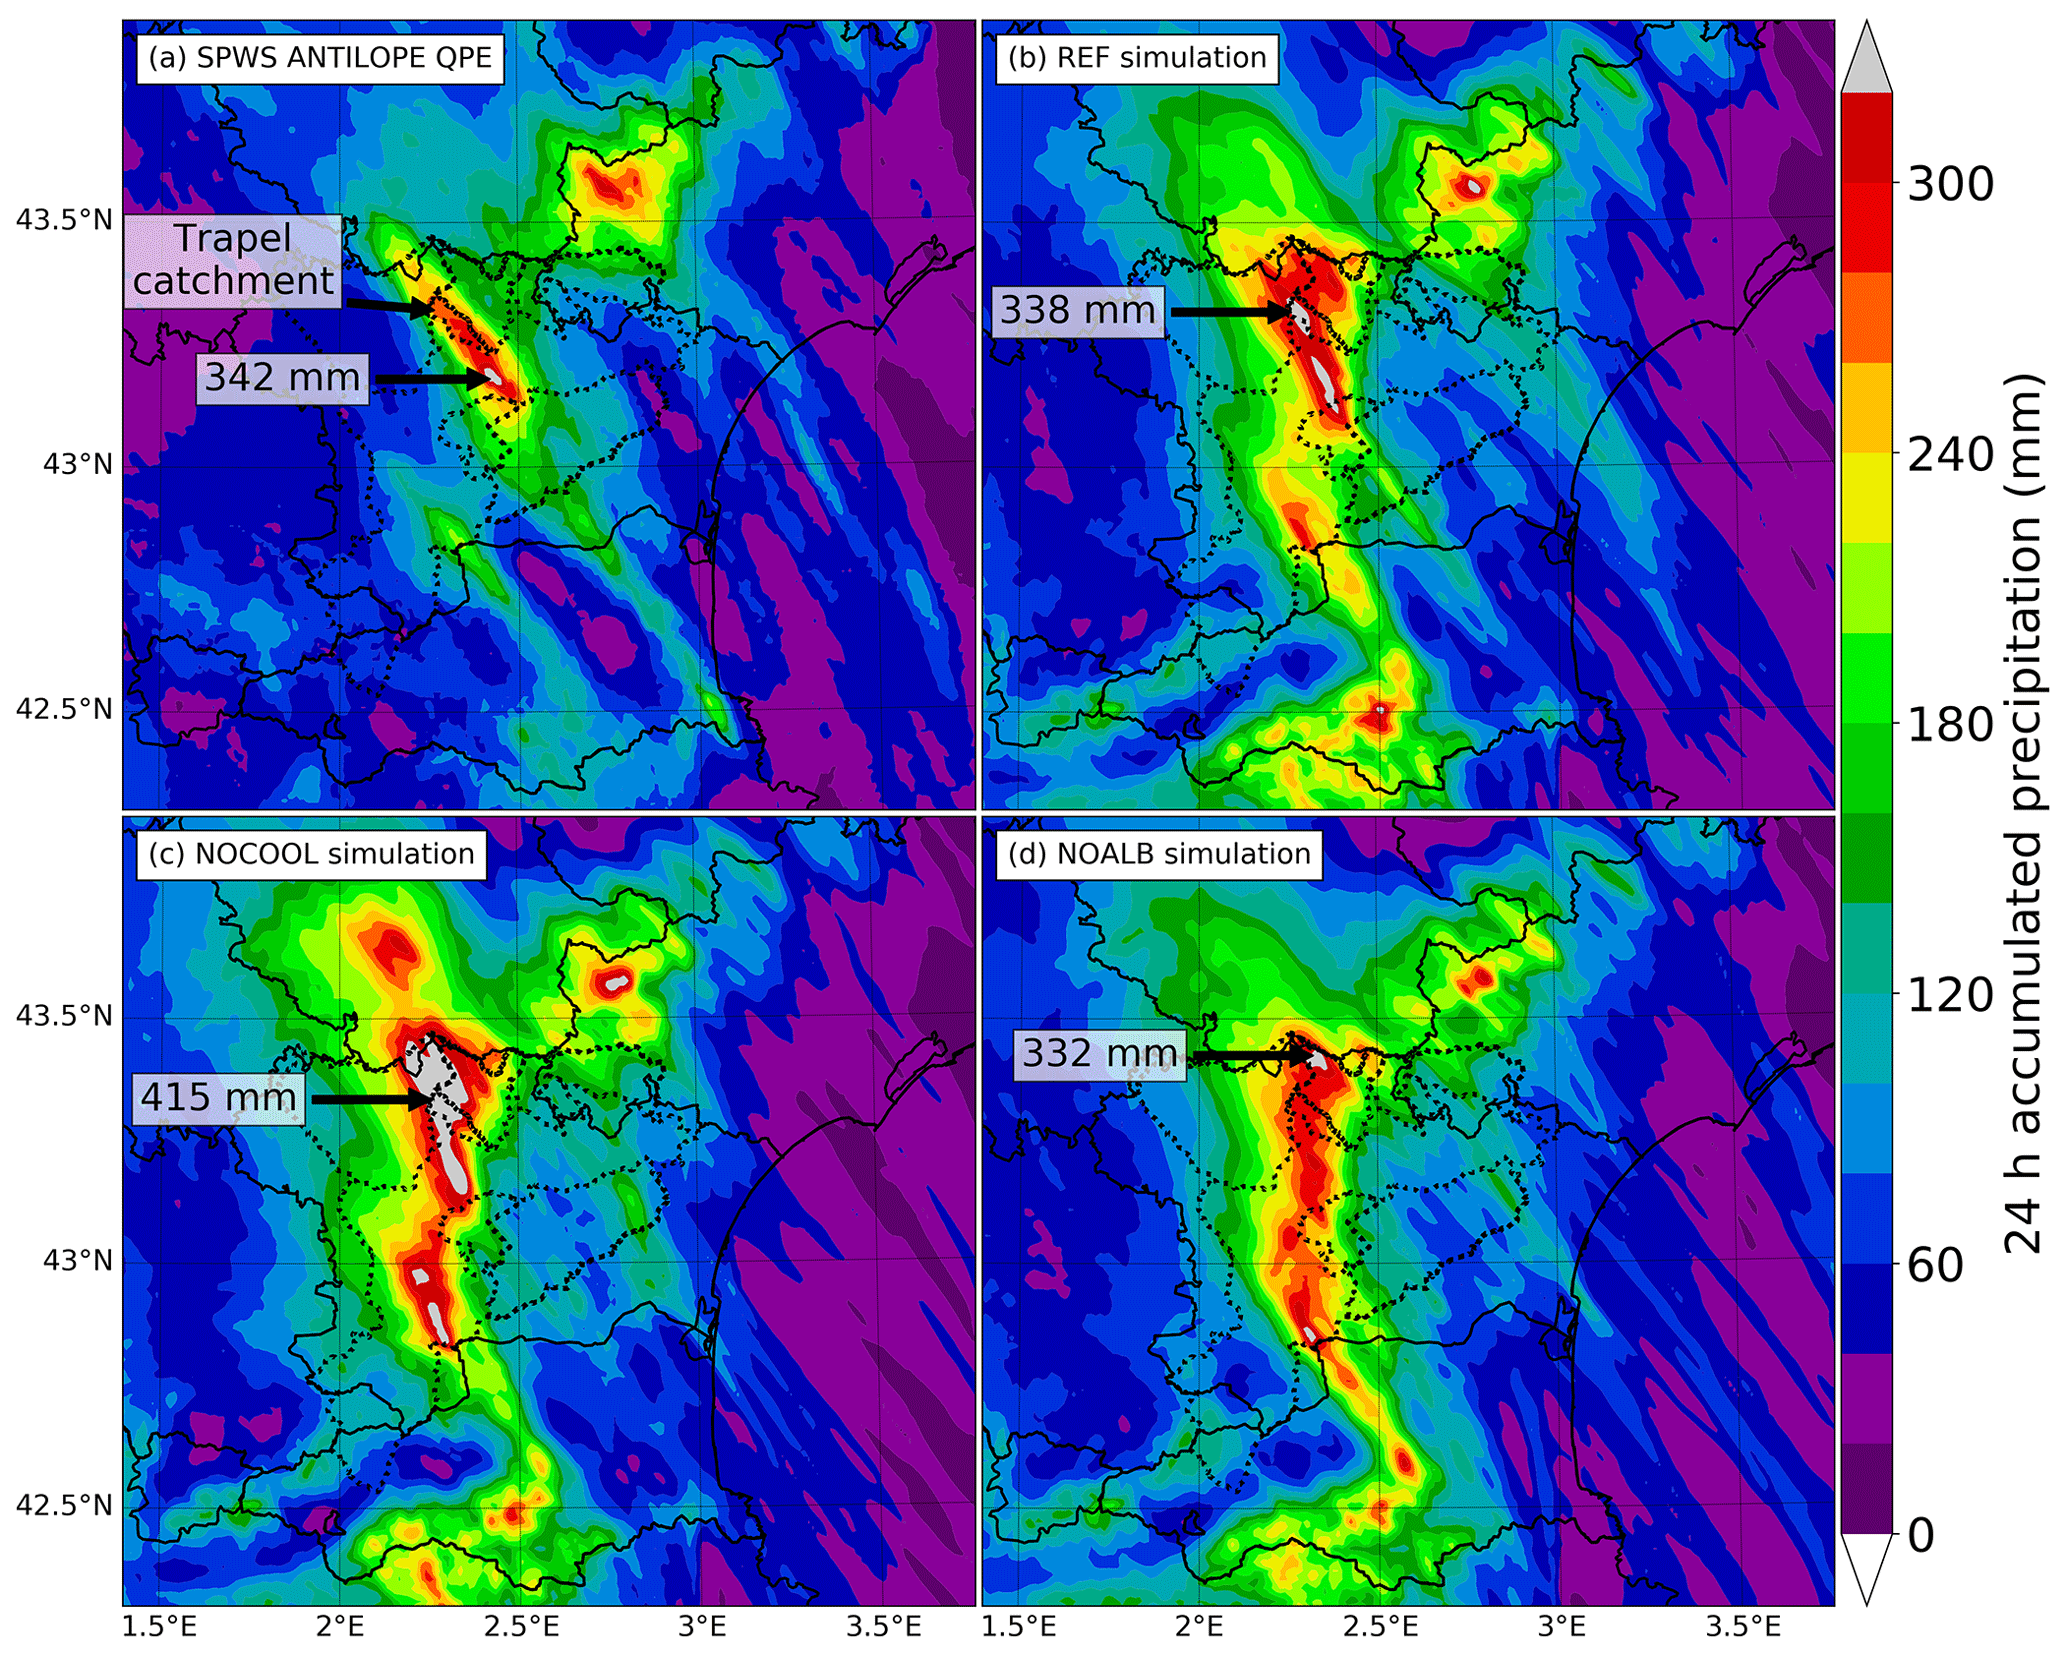
Figure 6Accumulated precipitation over 24 h between 12:00 UTC on 14 October and 12:00 UTC on 15 October from the (a) SPWS ANTILOPE QPE, (b) REF, (c) NOCOOL and (d) NOALB simulations. Solid black lines indicate French departments and country borders. Dotted black lines indicate catchment limits of the Aude basin and its tributaries.
Simulations are performed with the non-hydrostatic numerical research model Meso-NH version 5.4.2 (Lac et al., 2018), extensively used to study Mediterranean MCSs (Bouin et al., 2017; Martinet et al., 2017; Duffourg et al., 2018).
3.1 Meso-NH configuration
A two-way interactive grid nesting is chosen in order to study the sensitivity to a modification of model physics only within the child domain. A 960 km×900 km horizontal domain with a 1 km grid spacing covering southern France and the north-western Mediterranean Sea is chosen for the parent domain, and a 180 km×135 km horizontal domain with a 500 m grid spacing centred over Aude is chosen for the child domain (Fig. 1). For both domains, configurations close to the AROME operational model (Seity et al., 2011; Brousseau et al., 2016) are chosen to realistically simulate deep convection. The Gal-Chen and Somerville (1975) height-based vertical coordinate is used with 89 stretched vertical levels from 5 m up to 23.75 km, including 33 levels below 2 km height. Simulations start on 14 October at 12:00 UTC and last 24 h, with initial and lateral boundary conditions of the parent model given by AROME analyses every 3 h. Further details are given in Appendix A.
3.2 Experiments
Three simulations are shown in the study. The first one is carried out to realistically simulate the rainfall observed during the case and is called REF hereafter.
The second simulation, called NOALB, investigates the role of the Albera Massif in precipitation. The Albera Massif is the easternmost massif of the Pyrenees, bordering the Mediterranean Sea (Fig. 2); its highest mountain is the Neulos peak, which culminates at an altitude of 1256 m. Its altitude is 1023 m (1128 m) in the parent (child) model. In the 2018 Aude HPE, radar observations in Fig. 5a–c show that a large number of convective cells were continuously initiated during several hours over the Albera Massif and remained aligned downstream. These observations support the occurrence of quasi-stationary convective banding. Similar convective band generation was observed in the south-eastern flank of the Massif Central by Miniscloux et al. (2001) and Cosma et al. (2002): rainfall bands were enhanced on the lee side of small-scale topography ridges. Cosma et al. (2002) showed in both idealized and real-case simulations that the extension of precipitation lines downwind of orography resulted from (i) the formation of a mountain wave immediately downwind of the crest and (ii) the lee-side convergence created by deflection around the obstacle. Sensitivity tests indicated that the structure (length, width) and the intensity of the rain band were quite dependent on the upwind meteorological conditions and on the topographic configuration. The strengthening of convection downstream of small-scale topographic structures due to lee-side convergence was also noted by Ricard (2005) during the 1995 Cévennes HPE or Barrett et al. (2015) over the United Kingdom, combined in that last case with thermally forced convergence. Also, the Albera Massif could have played a role in precipitation in previous HPEs such as the 1999 Aude HPE described by Nuissier et al. (2008) and Ducrocq et al. (2008). In 1999, precipitation remained stationary along a narrow line, and the precipitation maximum was found 30 km east of the 2018 Aude HPE maximum, downstream of the Albera Massif, which was identified as one of the sources of lifting (see parcel number 1 in Fig. 9 of Ducrocq et al., 2008). In NOALB, the Albera Massif (Fig. 2a, red solid lines) is flattened at a constant altitude of 25 m a.s.l., except west of the massif in order to avoid an abrupt transition to higher terrain. West of the Albera Massif, terrain elevations are set to gradually decrease at a rate of 40 m every kilometre eastwards (4 % slope) until reaching 25 m a.s.l. Such transition is not necessary north or south of the Albera Massif because terrain elevation is mainly below 25 m a.s.l. The topography resulting from these changes is shown in Fig. 2b.
The third simulation, called NOCOOL, investigates the role of the evaporation of raindrops in cooling the cold sector west of CF1 and its influence on the movement of CF1. Indeed, because convective cells are formed or enhanced downstream of CF1 (Fig. 5), enhanced evaporative cooling could serve to anchor CF1 at the same location since downdraughts of these cells do not destroy the frontal zone (Chappell, 1986). In NOCOOL, negative temperature tendency from evaporation of raindrops is set to zero for the child model (black dashed square in Fig. 1), which allows us to quantify the impact of this process only over the area affected by the HPE.
Since the initial conditions of REF are provided by the AROME analyses in which all conventional observations are assimilated, there is little deviation from these observations at the initial time. At 12:00 UTC on 14 October, comparison of REF fields on all vertical levels to high-resolution soundings of Nîmes, Barcelona and Palma (not shown; see Fig. 1 for the locations) reveal absolute bias (root mean square error) of <0.3 K (<0.6 K) in temperature, <0.3 g kg−1 (<0.8 g kg−1) in water vapour mixing ratio, <0.5 m s−1 (<1.9 m s−1) in wind speed and <7∘ (<16∘) in wind direction.
Because the stationarity of precipitation is correlated to the quasi-stationarity of an MSLP trough and a virtual potential temperature (θv) gradient (Sect. 2.1) and because of the availability of near-surface observations that are not assimilated in the AROME model, this section focuses on validating the REF simulation near the surface. Near-surface fields of the REF simulation are compared to independent SPWS analyses built from screen-level observations of SPWS described by Mandement and Caumont (2020). Instead of directly comparing the two fields, to disentangle physical departures from departures due to both gridding methods and model features that cannot be resolved by the observation network used in the SPWS analyses, REF is interpolated in the same way as the SPWS analyses. This interpolation, called REF_SP, consists of replacing the value and altitude of each weather station used in the SPWS analyses with the value and altitude of the nearest REF grid point, keeping the exact same weights and gridding method. Thus, in this section, the REF_SP fields are compared to the SPWS analyses (the REF fields are also shown to illustrate the method). For precipitation, REF is directly compared to the SPWS ANTILOPE QPE since the horizontal resolution of radar observations used in the QPE is close to the horizontal grid spacing of REF.
Regarding rainfall accumulations, the REF simulation is able to reproduce the organization in two bands oriented south-east to north-west (Fig. 6a and b) found in the QPE. Both bands, including local maxima, are located quite correctly. Along the eastern band, two local precipitation maxima are simulated: a first one north of the Trapel catchment with 338 mm and another one with 331 mm at the same latitude but 7.3 km west of the 342 mm QPE maximum. Rainfall along the southern part of this eastern band is underestimated. Along the western band, the local maximum is largely overestimated with 296 mm, whereas the QPE estimates 206 mm, and in the southern part of the band, simulated rainfall amounts reach more than twice the observations. In the upper right corner of Fig. 6b, the shape of the area affected by heavy rainfall and the maximum accumulated rainfall simulated (343 mm) are similar to QPE (317 mm estimated). Elsewhere, the REF simulation generally overestimates rainfall, particularly over orography. These overestimations are substantial north and east of the local maximum indicated by the black arrow (Fig. 6b) or over the Pyrenees mountains.
Regarding the timing of rainfall (not shown), REF simulates longer rain than observed over the Aude department, particularly over its western part. The HPE begins at the same time as in observations, but the beginning of the second part (around 05:00 UTC in REF) and the end of rainfall over the western part of the Aude department (around 10:00 UTC in REF) are delayed by 3 h; this delay reduces to 1.5 h regarding the end of rainfall over the entire Aude department (around 10:30 UTC in REF).
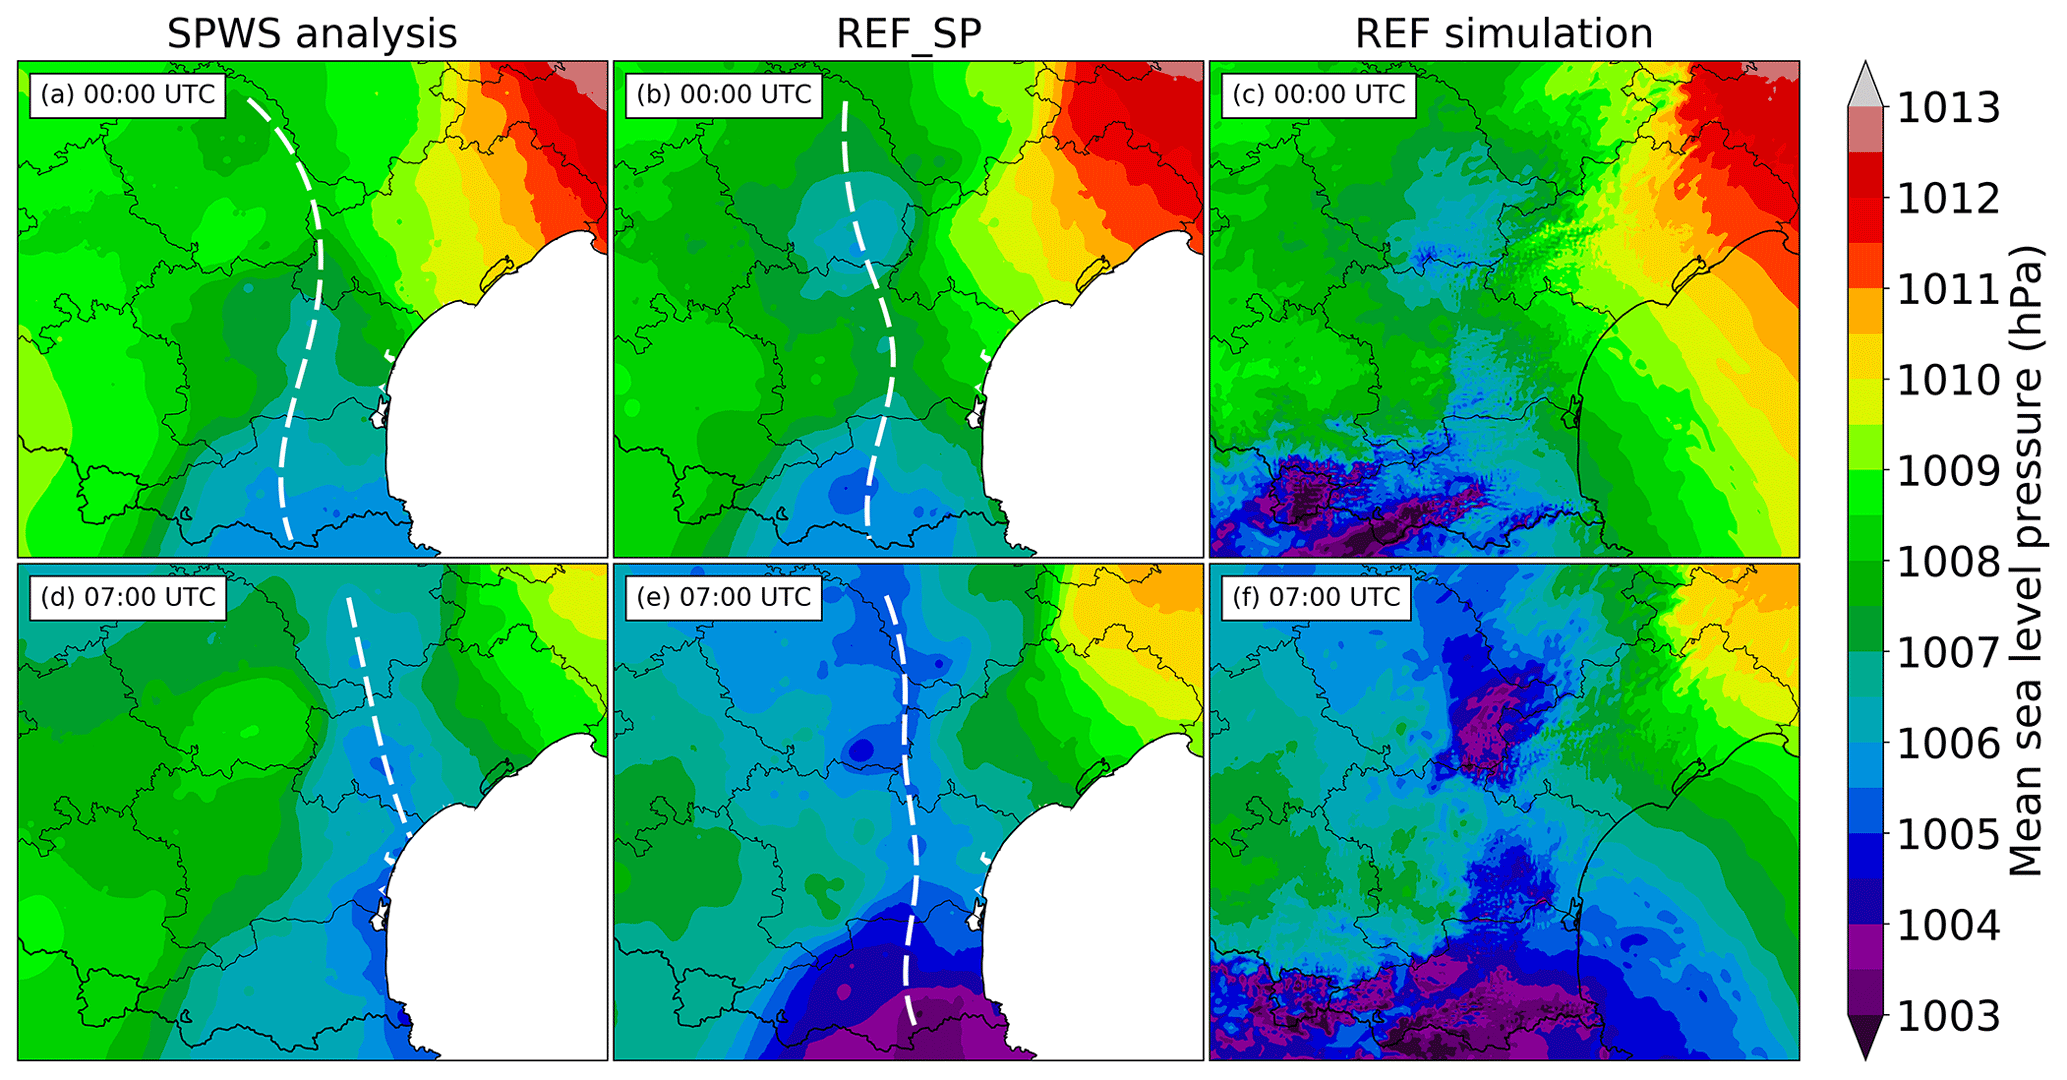
Figure 7Mean sea level pressure on 15 October at (a–c) 00:00 UTC and (d–f) 07:00 UTC from (a, d) the SPWS analysis, (b, e) REF_SP and (c, f) the REF simulation. Solid black lines indicate French departments and country borders. Dashed white lines indicate the approximate location of the MSLP trough. Analyses are not computed over the Mediterranean Sea (in white) because of the lack of near-surface observations over the sea.
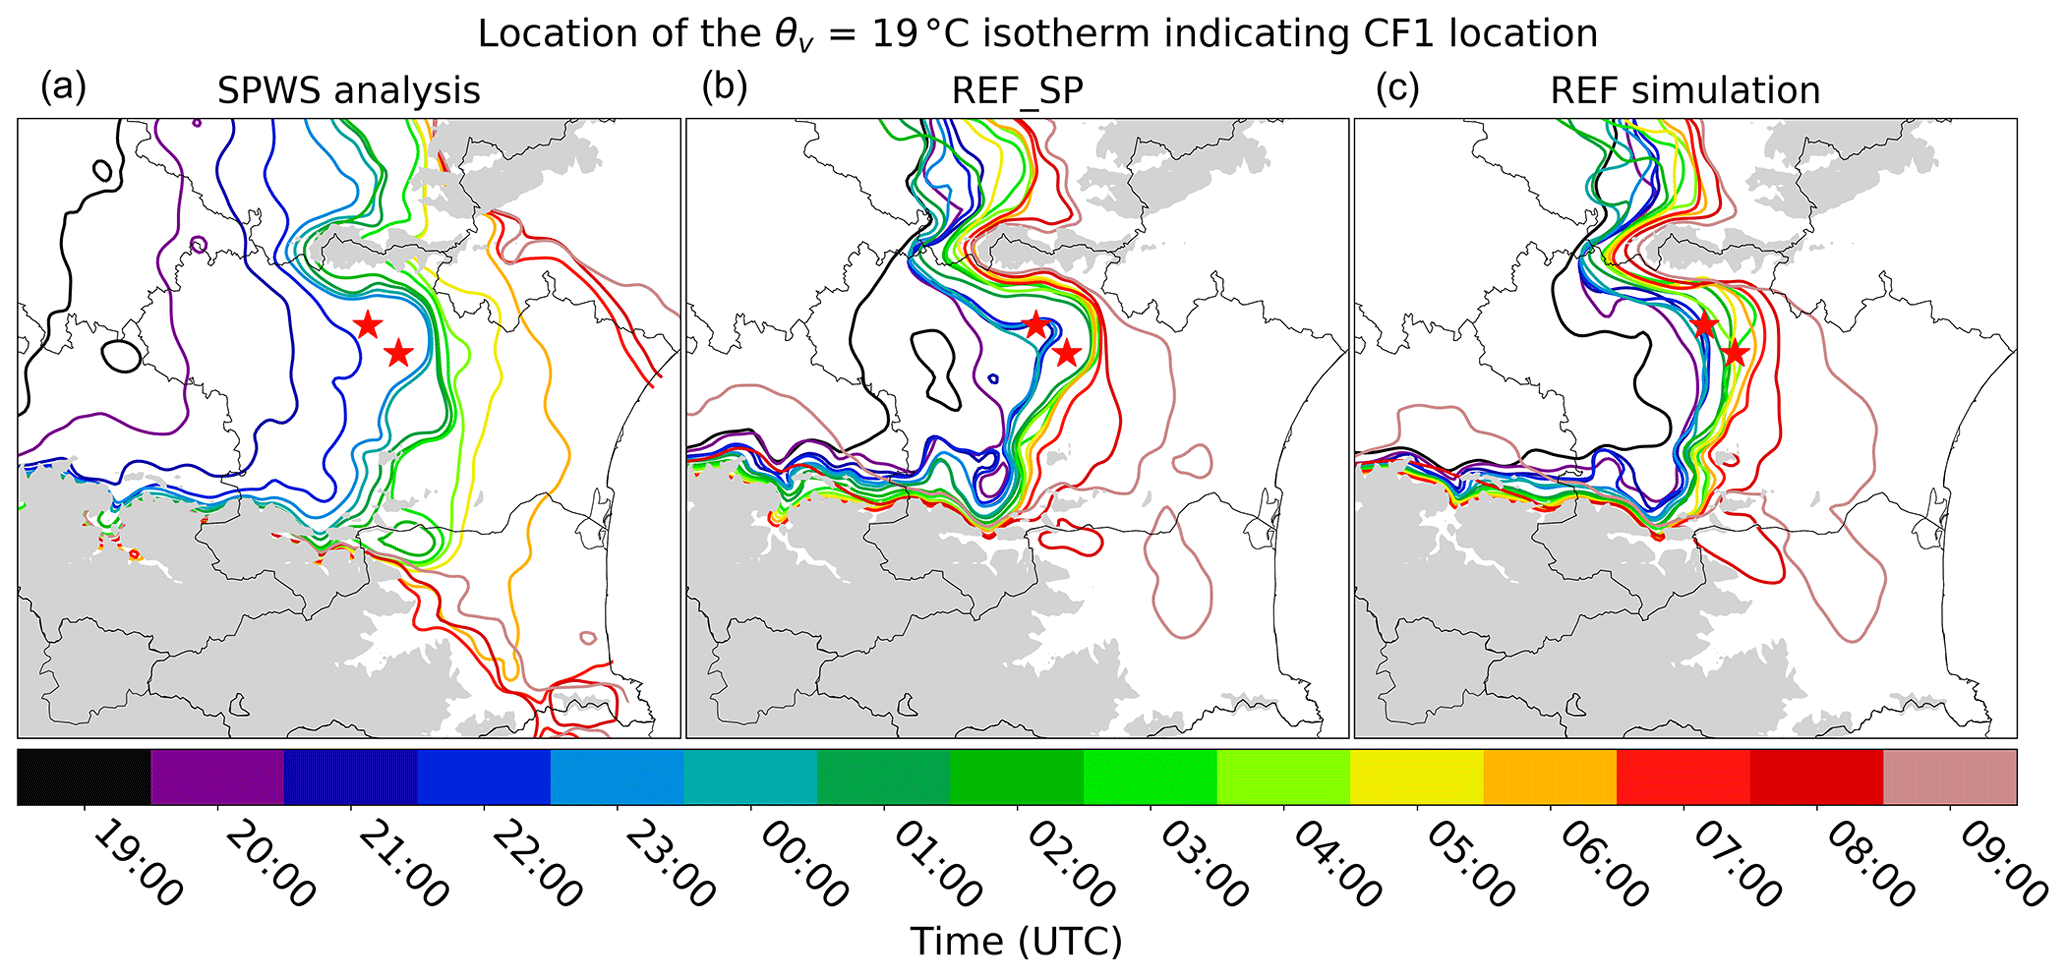
Figure 8Location of the 19 ∘C virtual potential temperature (θv) isotherm at 2 m height between 19:00 UTC on 14 October and 09:00 UTC on 15 October from (a) the SPWS analysis, (b) REF_SP and (c) the REF simulation. Terrain elevations above 750 m a.s.l. are shaded in grey. Red stars are as in Figs. 1 and 2.
Regarding the location of the MSLP trough, at 00:00 UTC, REF_SP (Fig. 7b) locates it slightly west compared to the SPWS analysis (Fig. 7a). Then, the trough remains quasi-stationary in REF_SP until about 07:00 UTC (Fig. 7e), which reveals a time lag of approximately 3 h in the movement of the trough compared to the SPWS analysis.
Regarding the movement of CF1, whose location is indicated by the 19 ∘C θv isotherm, REF_SP simulates a quasi-stationarity that begins around 21:00 UTC (22:30 UTC in the SPWS analysis) and ends around 07:00 UTC (04:00 UTC in the SPWS analysis) according to Fig. 8a and b. Thus, CF1 is quasi-stationary approximately 4.5 h longer in REF than in analyses.
Regarding the location where CF1 remained quasi-stationary, setting aside delays, REF_SP generally locates CF1 slightly farther west than the SPWS analyses, but the westwards shift remains mostly below 10 km. Comparison between REF_SP and REF (Fig. 8b and c) shows some small-scale movements of CF1 simulated by REF that cannot be reproduced in REF_SP, indicating the magnitude of departures that cannot be seized by the SPWS analyses and thus should not be considered to be substantial. This small westward shift is confirmed by the comparison of 10 m height REF wind fields with near-surface observations (not shown), comparison which also reveals that inland, between CF1 and the coast, REF slightly underestimates the wind speed and simulates south-easterly instead of easterly wind directions in some places.
Regarding θv gradient amplitude (not shown), at 23:00 UTC, REF_SP simulates a similar amplitude as the SPWS analyses even if θv is 1 ∘C higher in REF_SP than in analyses on both sides of CF1. Between 23:00 and 04:00 UTC, west of CF1, θv is simulated to decrease by less than 1 ∘C, while analyses indicate a decrease of 2 ∘C, showing little difference between simulation and observations.
In summary, the REF simulation produces realistic near-surface fields in comparison with the SPWS analyses and scattered wind observations. The main differences are substantial time lags in the stationarity of mesoscale boundaries: the MSLP trough and CF1 remain quasi-stationary between 3 and 4.5 h longer over the Aude department in the REF simulation than in the SPWS analyses. After 04:00 UTC, it results in an approximately 3 h delay in the movement of these mesoscale boundaries in REF compared to analyses. This longer stationary period probably causes prolonged rainfall over the area that may explain some of the overestimations found. Also, the westerly shift of about 10 km found between REF and the SPWS analyses in the quasi-stationary location of CF1 or the MSLP trough is correlated with the similar westerly shift found in the location of the heaviest precipitation between REF and the SPWS ANTILOPE QPE. Keeping in mind these departures, the REF simulation is taken as the reference in the following sections.
This section investigates which mechanisms supply conditionally unstable air to the convective system, including studying whether its moisture comes from areas that are particularly humidified by Leslie's remnants. Trajectories and thermodynamic properties of air parcels that contribute to the formation of the strongest convective cells in the REF simulation as well as those of cold parcels located west of CF1 are described. Lifting mechanisms are also studied, in particular the role of the Albera Massif. To carry out the investigation, a series of backward trajectories are computed using the Lagrangian trajectory tool of Gheusi and Stein (2002). It is based on the technique of Schär and Wernli (1993) in which three Eulerian passive tracers are initialized with the initial grid point position and are advected online by the resolved and subgrid-scale wind; a review of existing Lagrangian trajectory tools is given by Miltenberger et al. (2013). Starting points of the backward trajectories constitute atmospheric columns with strong mid-level updraughts close to the location of the 24 h maximum rainfall. Inside each column, 40 air parcels taken every two vertical levels of the model from the second level (18 m height) to the 80th (about 13.5 km height) are followed, and their trajectories are shown in the figures. Some trajectories (in grey in Fig. 9a) are not projected on vertical sections either when vertical movements of the air parcels are of small amplitude around the Aude department or when a trajectory intersects the terrain along the projection axis because the terrain along the axis differs substantially from the one along the trajectory.
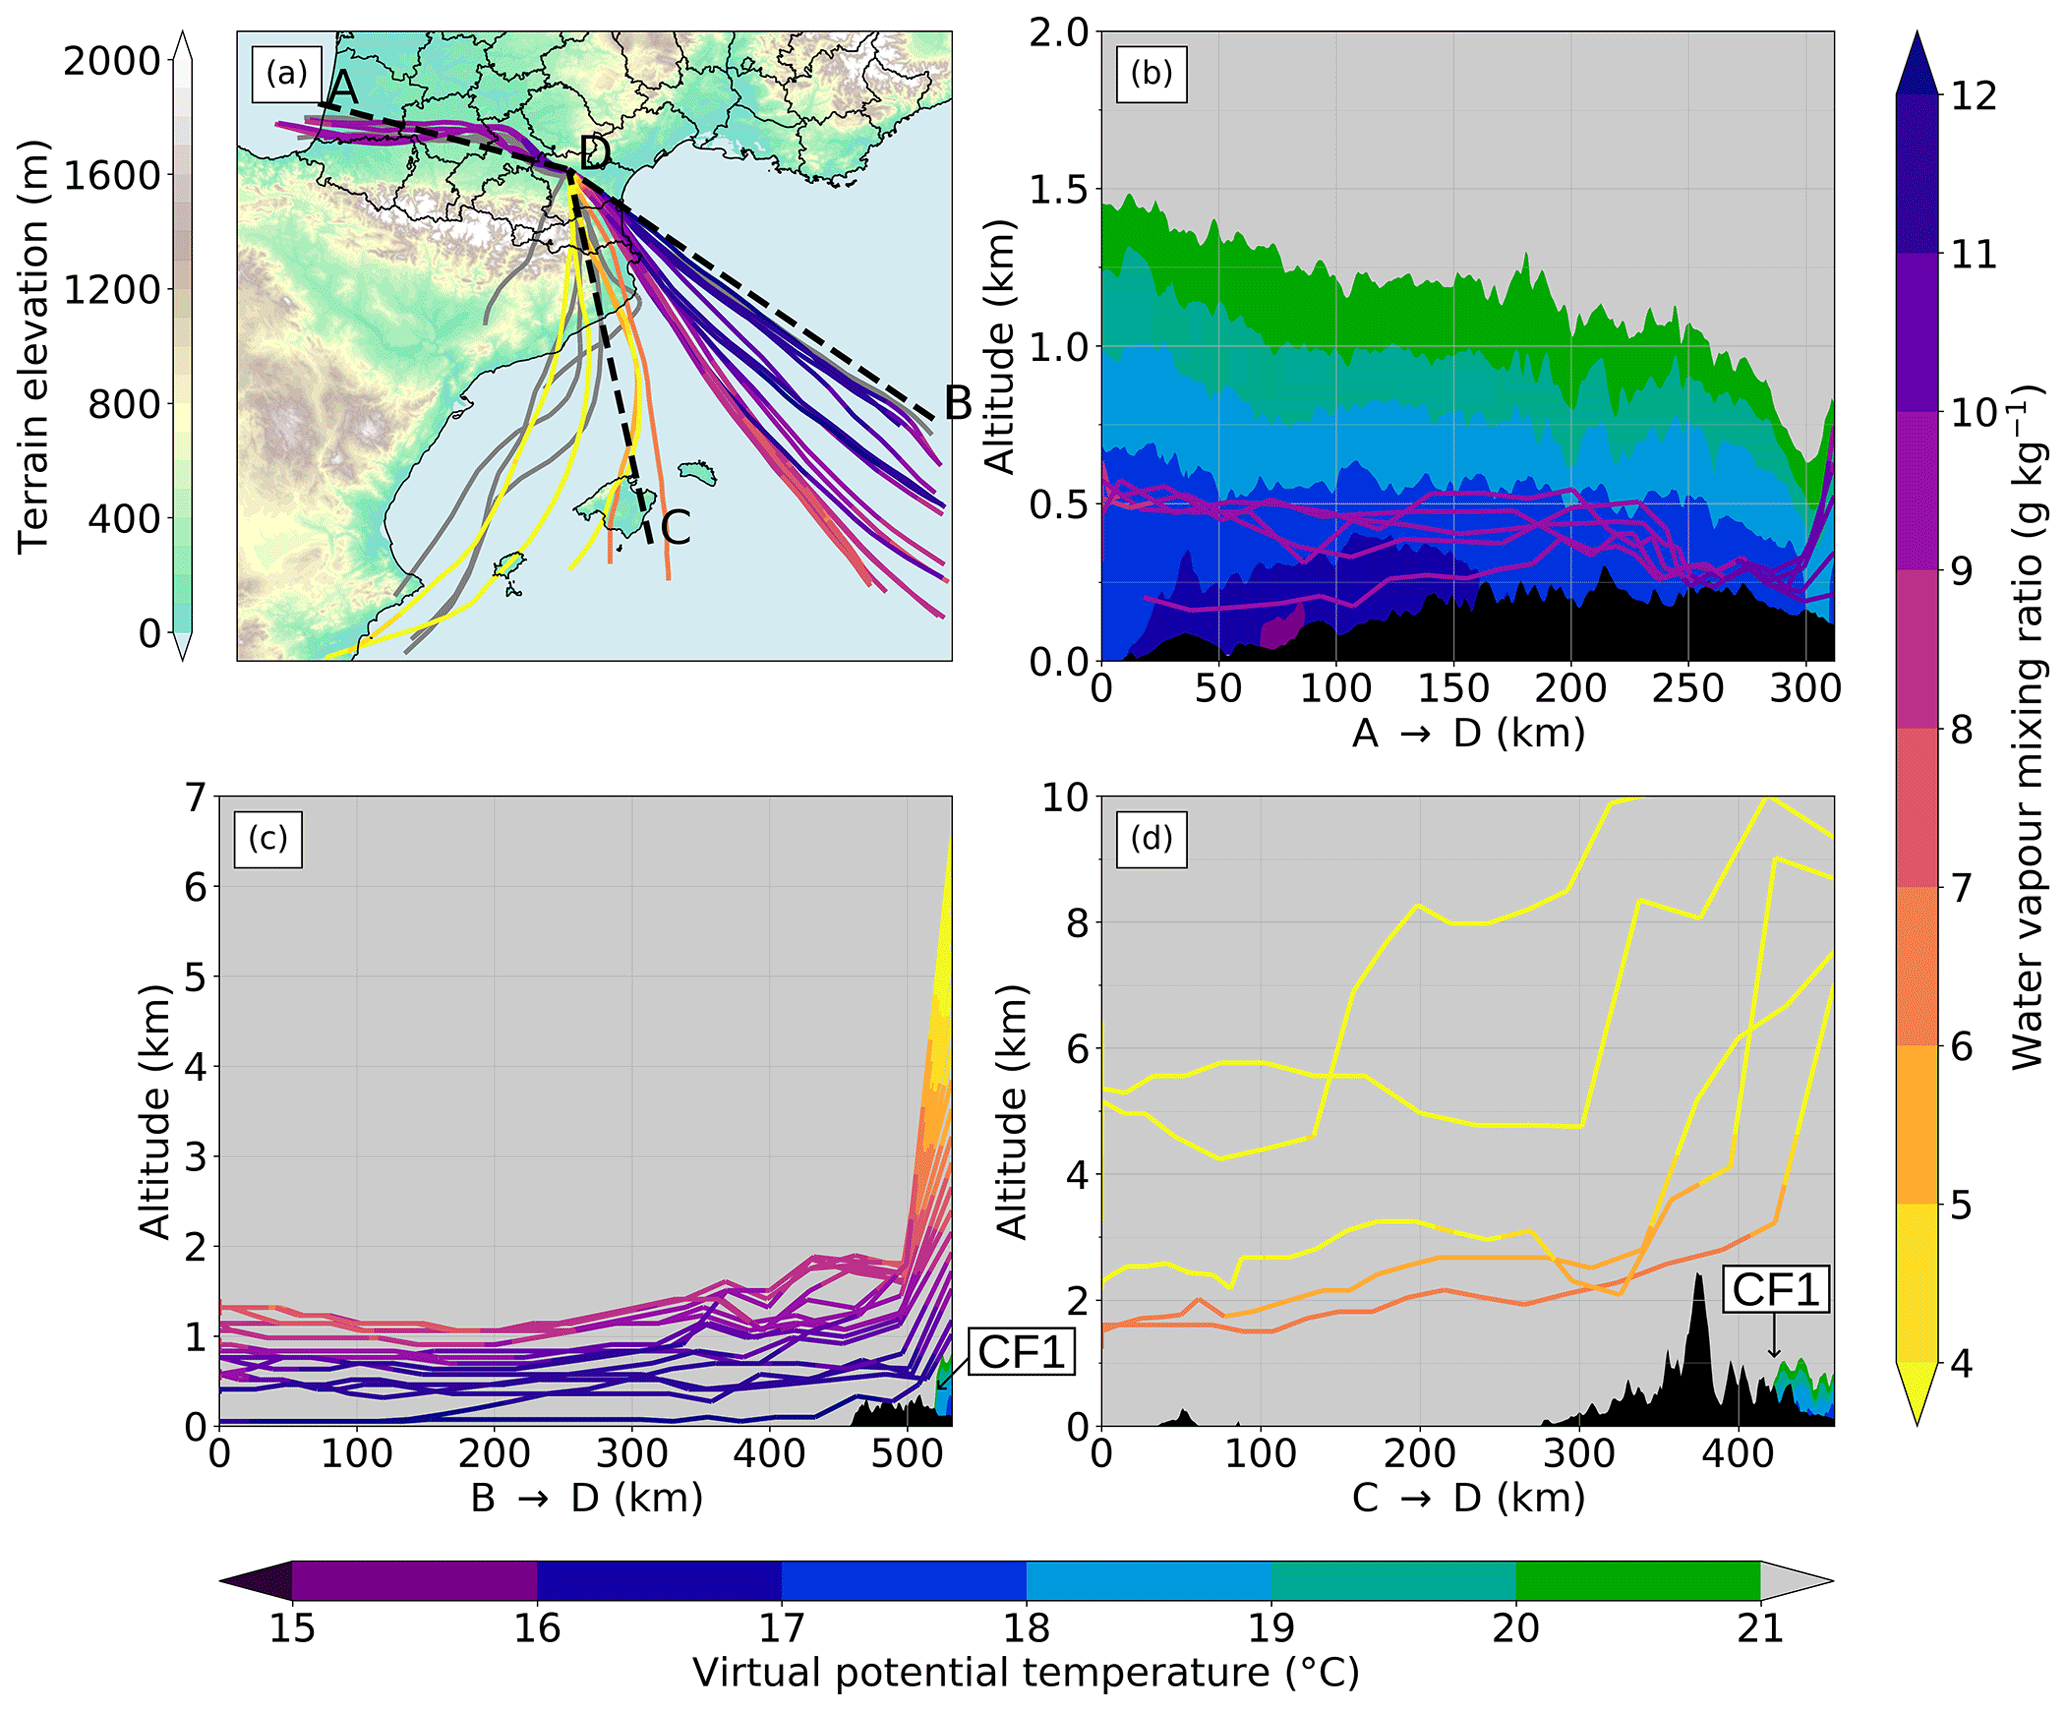
Figure 9(a) Horizontal projection of the 40 backward trajectories from air parcels taken inside the atmospheric column located in “D” (43.25∘ N, 2.25∘ E) at 00:00 UTC on 15 October in the REF simulation. Trajectories in colour are the ones projected in (b–d): their colour varies according to the water vapour mixing ratio of the parcels. Other trajectories are in grey. Trajectories are computed until 12:00 UTC on 14 October, except for parcels that reach domain boundaries before that time. (b–d) Vertical projections of backward trajectories along the dashed black lines shown in (a) and corresponding cross-sections of virtual potential temperature at 00:00 UTC on 15 October. Each parcel is projected on the section closest to its trajectory inland. Terrain is in black.
5.1 First part of the HPE
This part lasts approximately between 19:00 UTC on 14 October and 05:00 UTC on 15 October in the REF simulation. At 00:00 UTC on 15 October, air parcels below 10 km a.s.l. found in the atmospheric column “D” (Fig. 9a) where a convective updraught is simulated originate from 3 preferential directions. Backward trajectories simulated at the end of this first part, e.g. at 04:00 UTC on 15 October (not shown), are similar to 00:00 UTC backward trajectories, showing that the latter are representative of this first part.
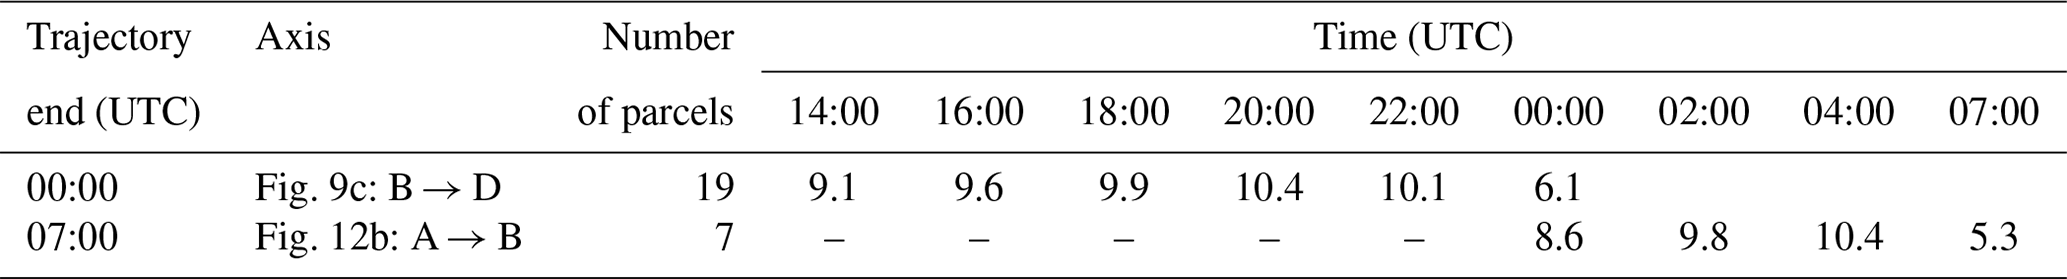
Table 1Mean water vapour mixing ratio (g kg−1) of air parcels originating from below 1500 m height along axes shown in Figs. 9 and 12 as a function of time. Dashes indicate that at least one parcel was out of the simulated domain at that time.
Parcels found under 800 m a.s.l. in “D”, shown along the axis A–D, are inside the cold sector west of CF1, where virtual potential temperature is below 21 ∘C (Fig. 9b). They originate from the west, mainly the south-east of the Bay of Biscay and the north of Spain, following the same trajectory as CF1 (see Fig. 3c). They remain below 500 m a.s.l. most of the time, and some are slightly lifted near the CF1 boundary.
Parcels found between 800 m a.s.l. and 7 km a.s.l. in “D”, shown along the axis B–D, are ascending air parcels (Fig. 9c). These parcels originate from east and north-east of the Balearic Islands, over the Mediterranean Sea, away from the convective system ahead of CF2 located between the Balearic Islands and the Pyrenees at 00:00 UTC (Fig. 10c). They are carried over the Mediterranean Sea by the marine LLJ shown in Fig. 10b and remain at an almost constant altitude between 0 and 1.4 km a.s.l. At 697 m height, the speed of this south-easterly LLJ exceeds 20 m s−1 between the east of the Balearic Islands and the Aude department, up to 26 m s−1 near the Languedoc-Roussillon shore and inland. Such a wind speed transports these air parcels quickly: they travel from B to D (Fig. 9a) in approximately 12 h. When they reach the coast, some experience slight lifting over the Albera Massif and the Corbières Massif but remain below 2 km a.s.l. They are finally lifted up to 6.5 km a.s.l. above CF1. Over the Aude department, large wind convergence is simulated: horizontal wind speed decreases from 26 m s−1 to near 0 m s−1, leading to enhanced ascending movements along CF1.
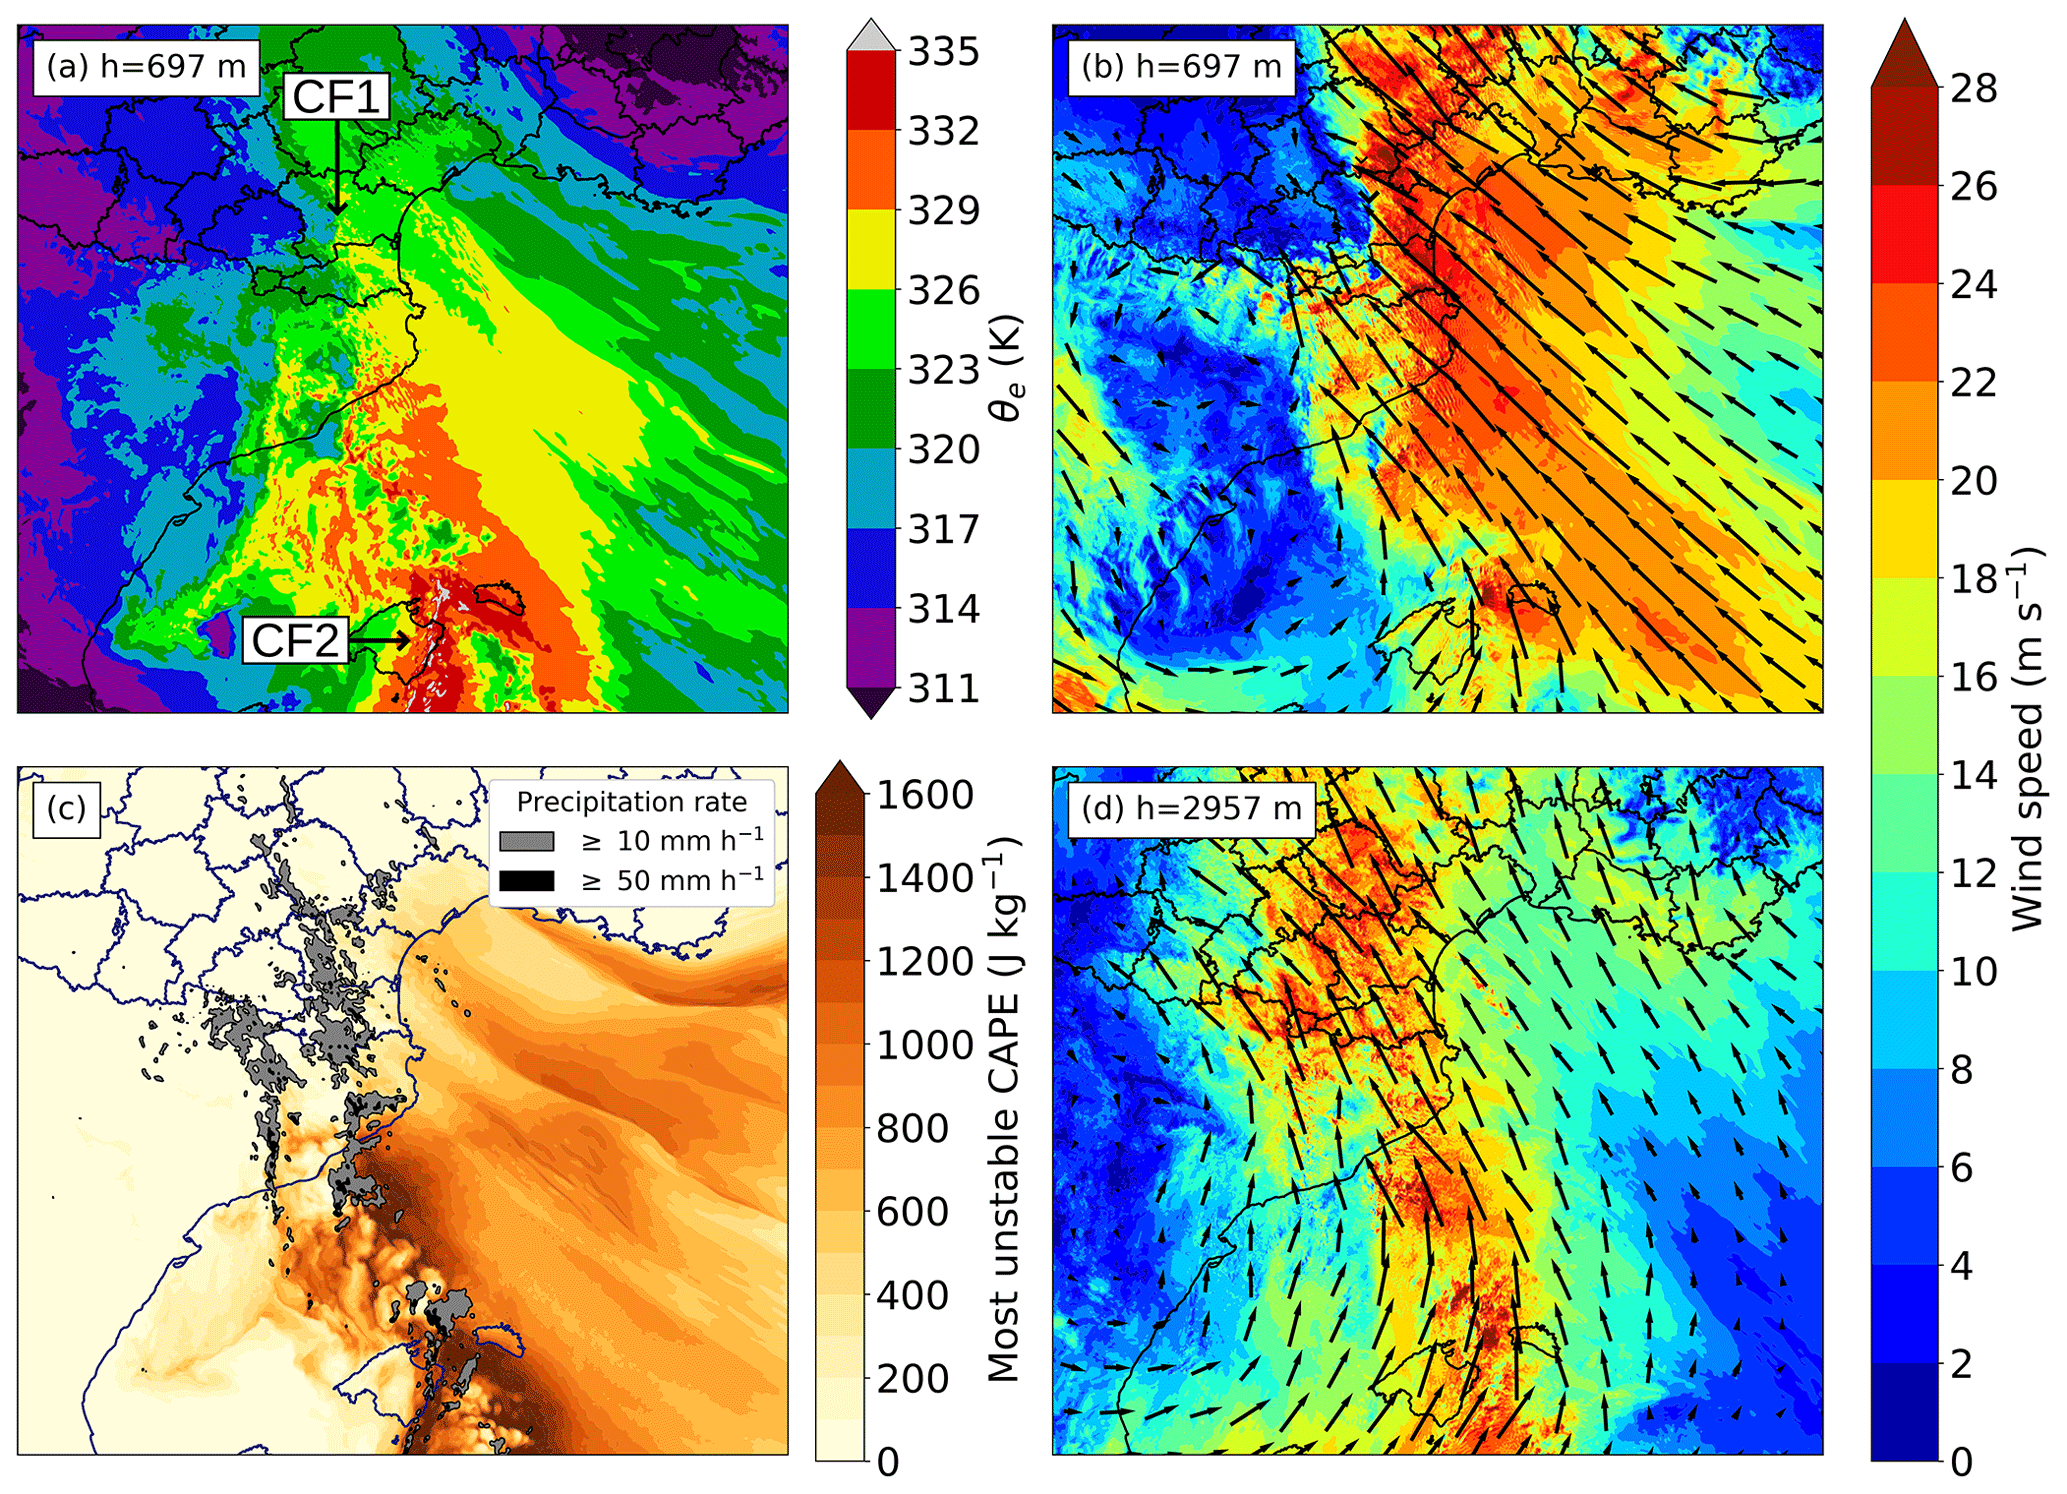
Figure 10REF simulation at 00:00 UTC on 15 October of (a) equivalent potential temperature (θe) at 697 m height, (b) wind at 697 m height, (c) MUCAPE with instantaneous precipitation rate and (d) wind at 2957 m height.
These 19 air parcels shown in Fig. 9c originate from moist areas over the Mediterranean Sea (dashed lines in Fig. 4b): at 14:00 UTC on 14 October, they already have a mean water vapour mixing ratio of 9.1 g kg−1 (Table 1). Their mean water vapour mixing ratio increases through their transport above the Mediterranean Sea by 1.3 g kg−1, reaching 10.4 g kg−1 at 20:00 UTC on 14 October. During their lifting, between 22:00 and 00:00 UTC, they release moisture: their water vapour mixing ratio decreases by an average of 4.0 g kg−1. Some of this moisture is released through condensation processes inside the convective clouds before some of the water condensates eventually precipitate. The high moisture and relatively warm temperatures in the area of origin of these parcels is shown in Fig. 10a by equivalent potential temperatures above 326 K at 697 m height. Consequently, air parcels carried by the LLJ are conditionally unstable: simulated most unstable convective available potential energy (MUCAPE) reaches 100 to 600 J kg−1 over Languedoc-Roussillon and 600 to 1200 J kg−1 over the sea. The 3D convective available potential energy (CAPE) field (not shown) indicates that the highest CAPE values are mostly reached at the first model level (5 m height) and decrease rapidly with height.
The MSLP low that drives the LLJ is located in the area of light winds over Spain shown in Fig. 10b. North-east and east of it, between the Balearic Islands and the Pyrenees, strong convective cells are triggered ahead of CF2. Several convective cells are advected by the south–south-easterly mid-level wind towards Languedoc-Roussillon. Thus, in Fig. 9d some parcels above 7 km a.s.l., shown along the axis C–D, originate from the Mediterranean low and its associated front CF2. These parcels, from altitudes between 1.8 and 5.5 km, have lower water vapour mixing ratios than parcels carried by the LLJ. Some of these parcels are lifted over the Pyrenees mountains, and one is lifted over CF1.
REF simulates a directional wind shear in the lower part of the troposphere: inland, wind veers from east–south-east at 10 m height (not shown) to south-east at 697 m height (Fig. 10b) to south–south-east at 2957 m height (Fig. 10d). Backward trajectories confirm it: the lower the air parcel comes, the farther east it originates (Fig. 9a).
5.2 Second part and end of the HPE
This part lasts approximately between 05:00 and 10:00 UTC on 15 October in the REF simulation and begins when the rain band associated with the cold front CF2 reaches the Pyrenees-Orientales coast. Contrary to the first part, during which most convection is triggered inland, in this second part, convection is triggered over the Mediterranean Sea (Fig. 11c) and carried inland by the mid-level wind (see wind around 3 km height in Fig. 11d), diminishing the influence of local forcing in triggering convection. Convection triggered over the sea is fed by a warm and moist air mass ahead of CF2 with equivalent potential temperature up to 332 K (Fig. 11a). Consequently, this air mass is more unstable than in the first part: simulated MUCAPE values are up to 1600 J kg−1 (Fig. 11c).
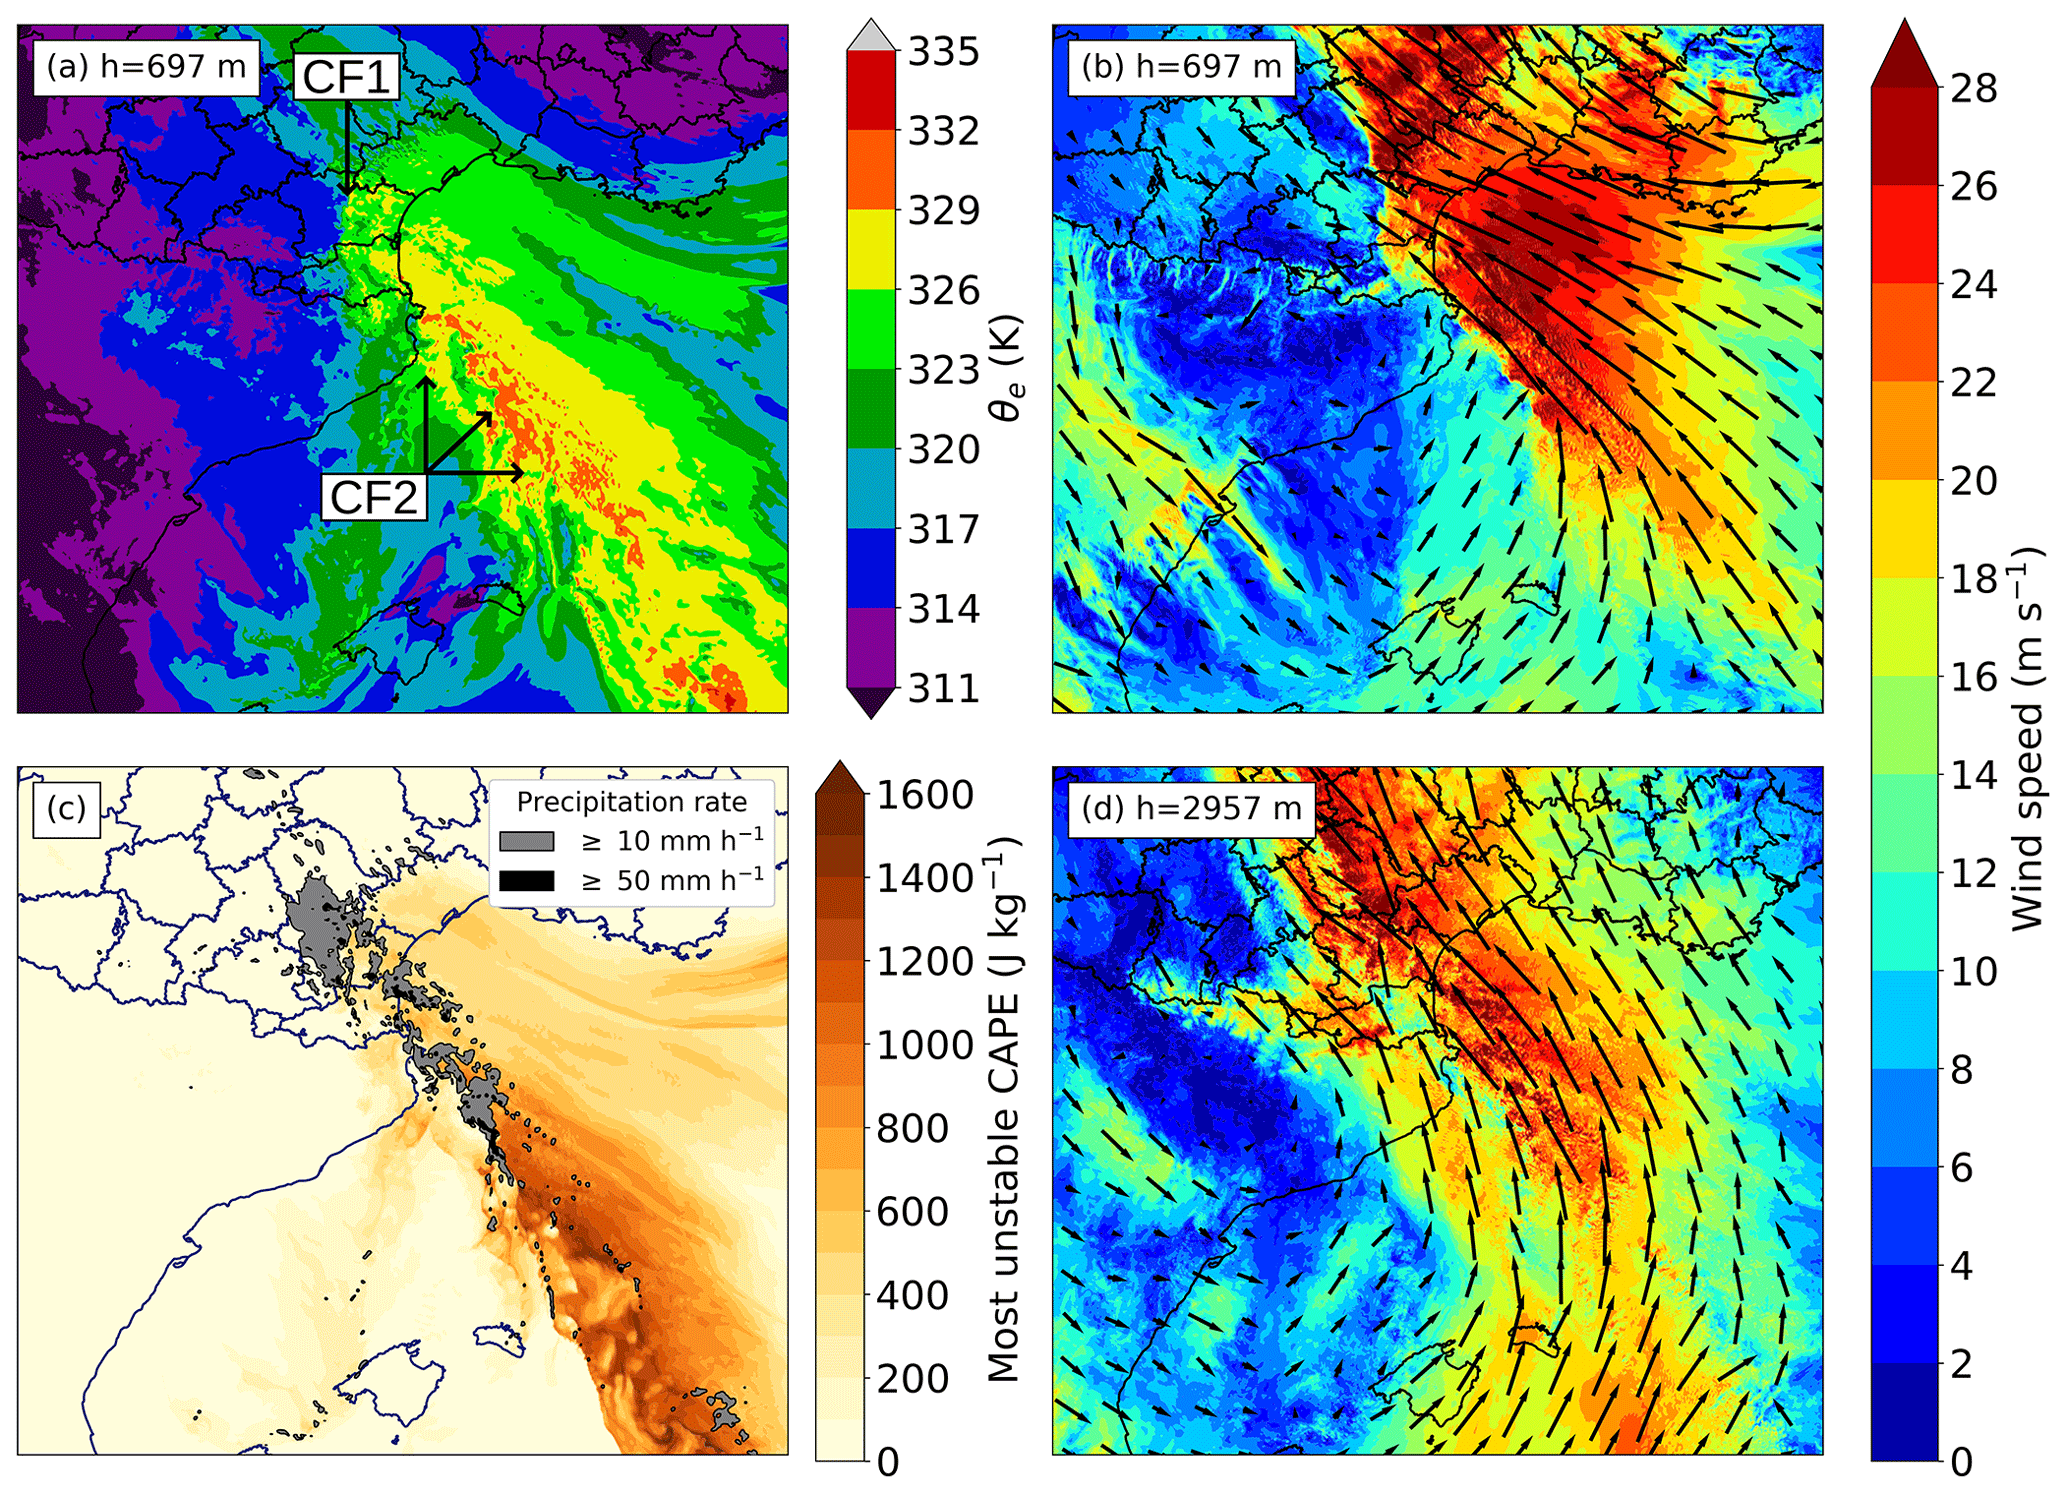
Figure 11As Fig. 10 at 07:00 UTC on 15 October.
At 07:00 UTC an increasing number of air parcels found inside updraughts over the Aude department originate from south of the Balearic Islands, i.e. from the front CF2 formed with Leslie's remnants (Fig. 12a), in comparison with the first part. These parcels, projected in Fig. 12c, originate from altitudes between 1 and 4 km, altitudes generally higher than in the first part. Some air parcels carried by the LLJ, coming from the east of the domain at altitudes between 0 and 1 km, are still found (Fig. 12b). If their number decreases compared to the first part, their average water vapour mixing ratio of 10.4 g kg−1 remains high and increases through their transport above the Mediterranean Sea by 1.8 g kg−1 (Table 1). Some descending dry air parcels are also found to originate from dry mid-level areas located at the rear of CF2 (Fig. 12d).
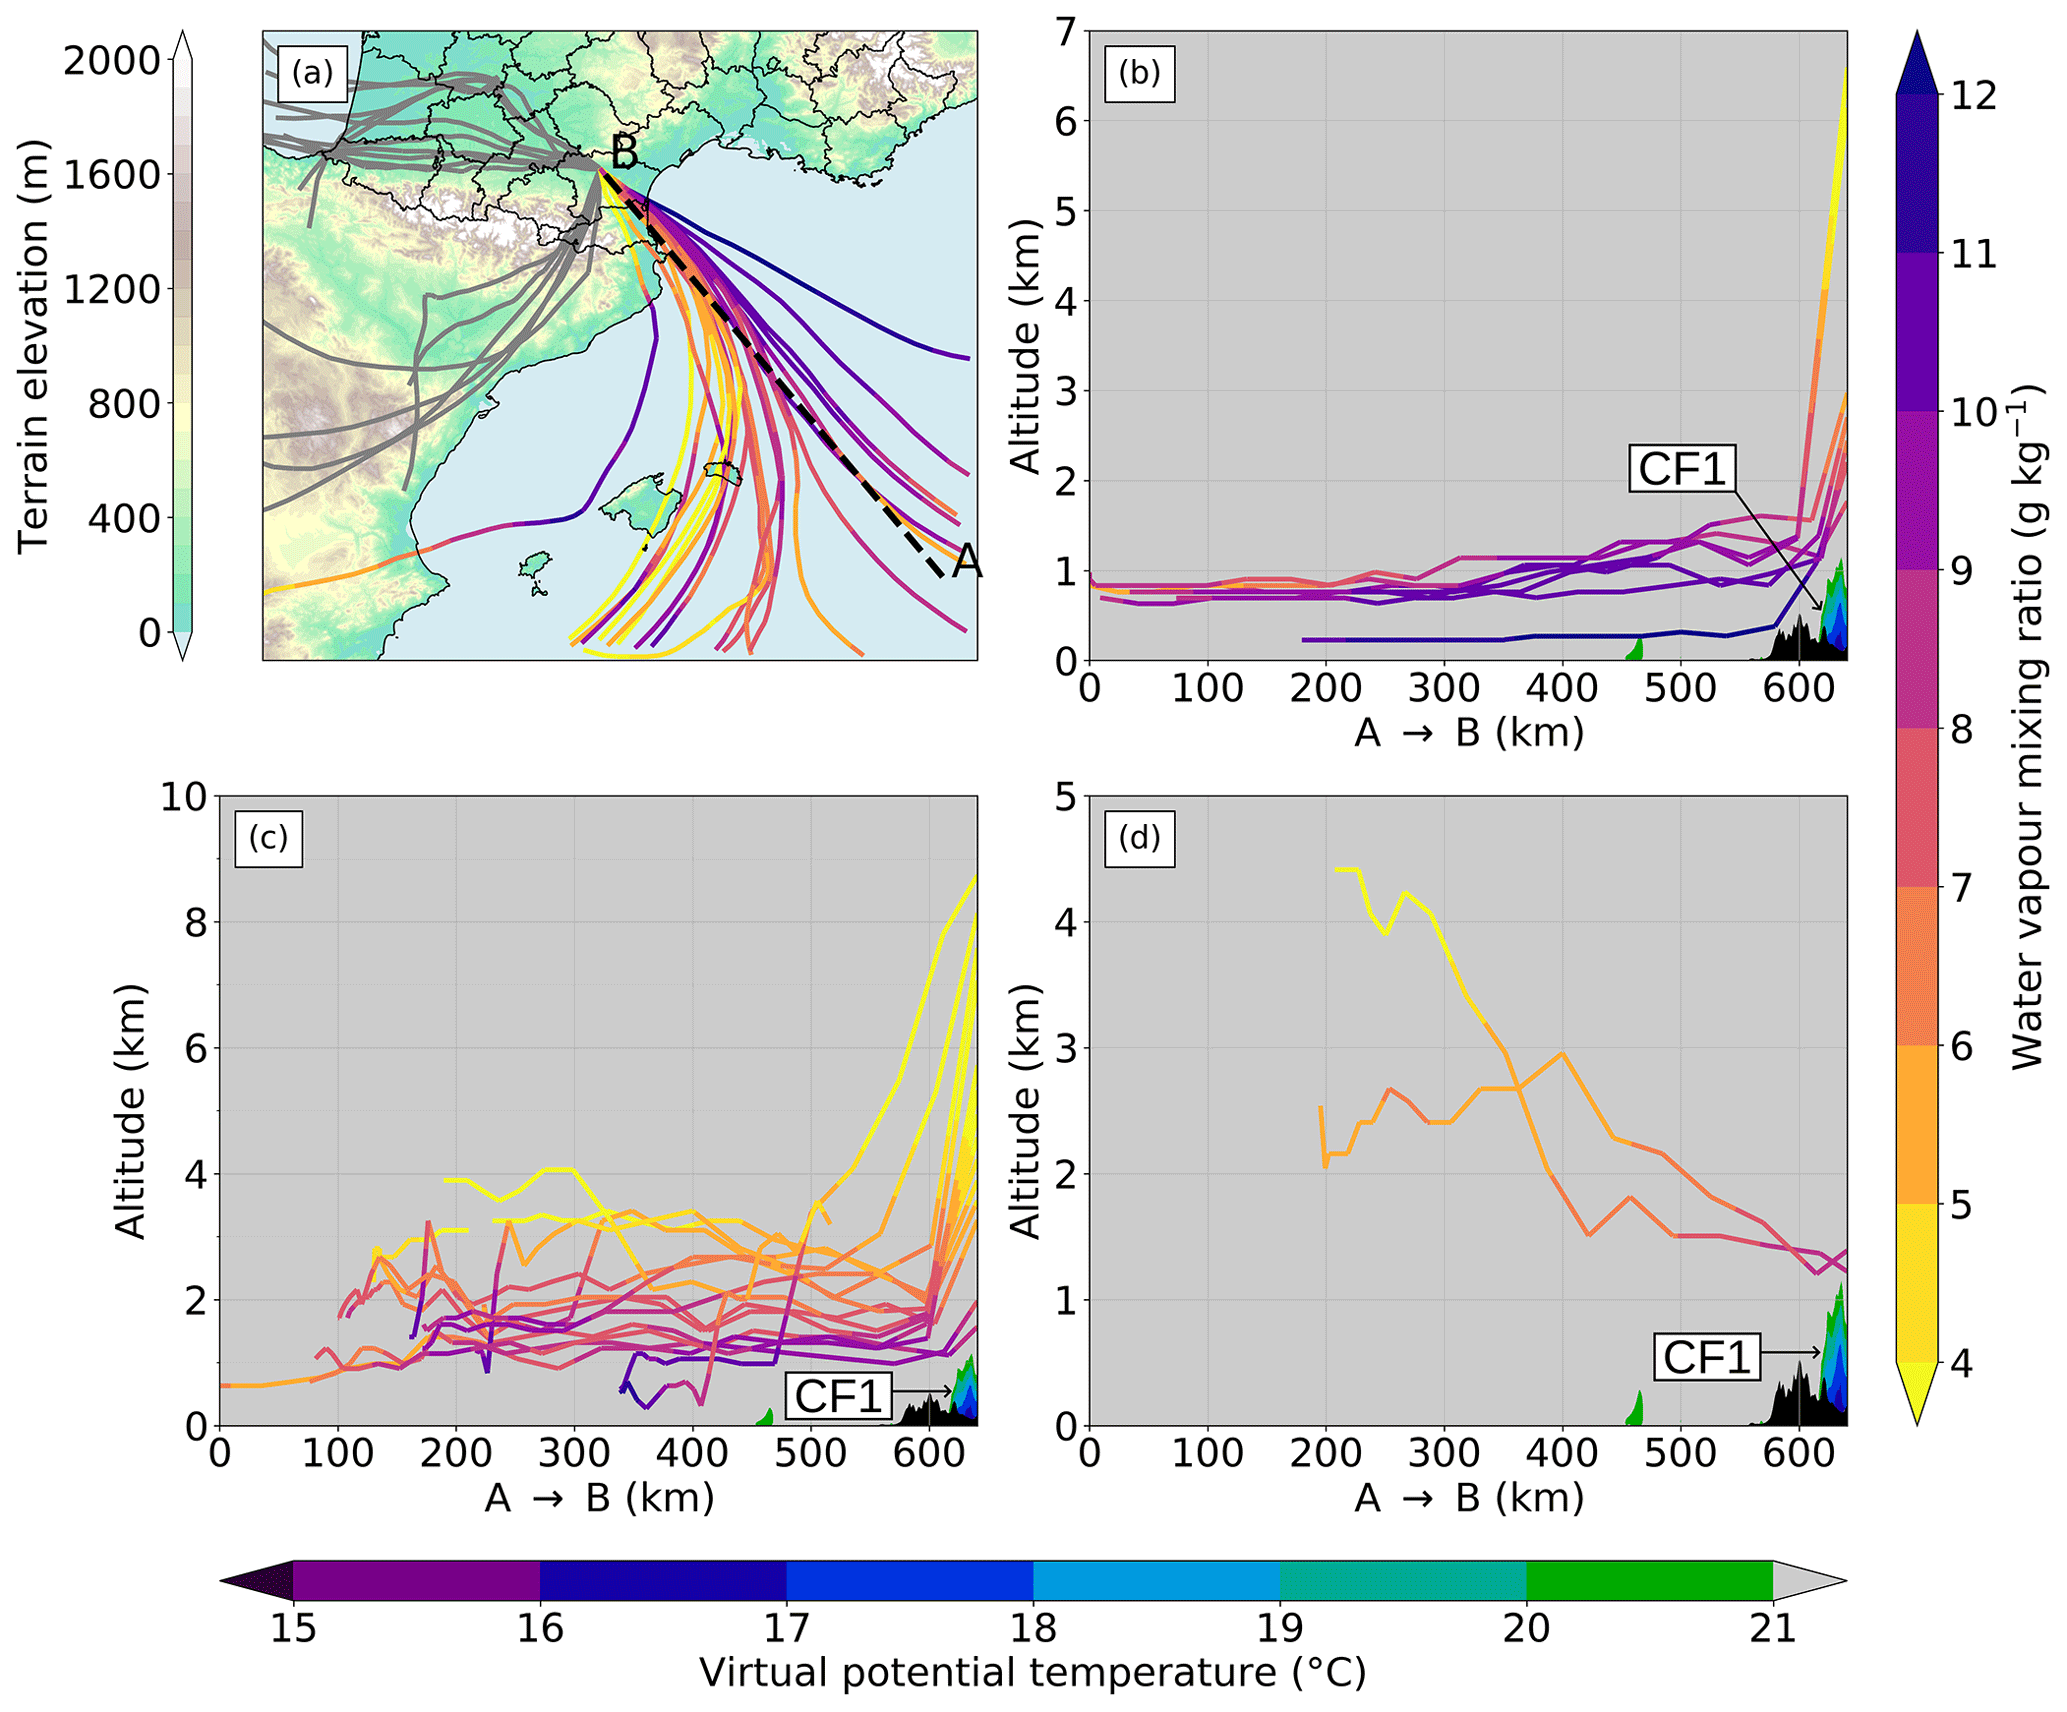
Figure 12(a–d) As Fig. 9 for trajectories ending at 07:00 UTC on 15 October at 43.26∘ N, 2.34∘ E. Air parcels are projected along the same A–B axis but separated depending on their origin and behaviour: (b) ascending parcels from the east, (c) ascending parcels from the south or west, and (d) descending parcels from the south.
In the lower levels, at 697 m, REF simulates a strong wind variation along CF2: ahead of CF2, the south-easterly LLJ reaches 22 to 26 m s−1, while at the rear wind turns south-westerly and only reaches 6 to 12 m s−1 (Fig. 11b). Between 07:00 and 09:30 UTC, the north-eastwards advance of CF2 propagates this wind variation over the Aude department (not shown). When wind speed abruptly decreases along CF1, CF1 stationarity breaks, and the cold air west of CF1 immediately starts flowing eastwards in a similar manner to a density current and later spreads out circularly over the Mediterranean Sea (not shown). It indicates that, during the HPE, the propagation of the cold air located west of CF1 is countered by the LLJ blowing perpendicularly to it, in a similar manner to the propagation of a cold pool being countered by the environmental wind (Miglietta and Rotunno, 2014).
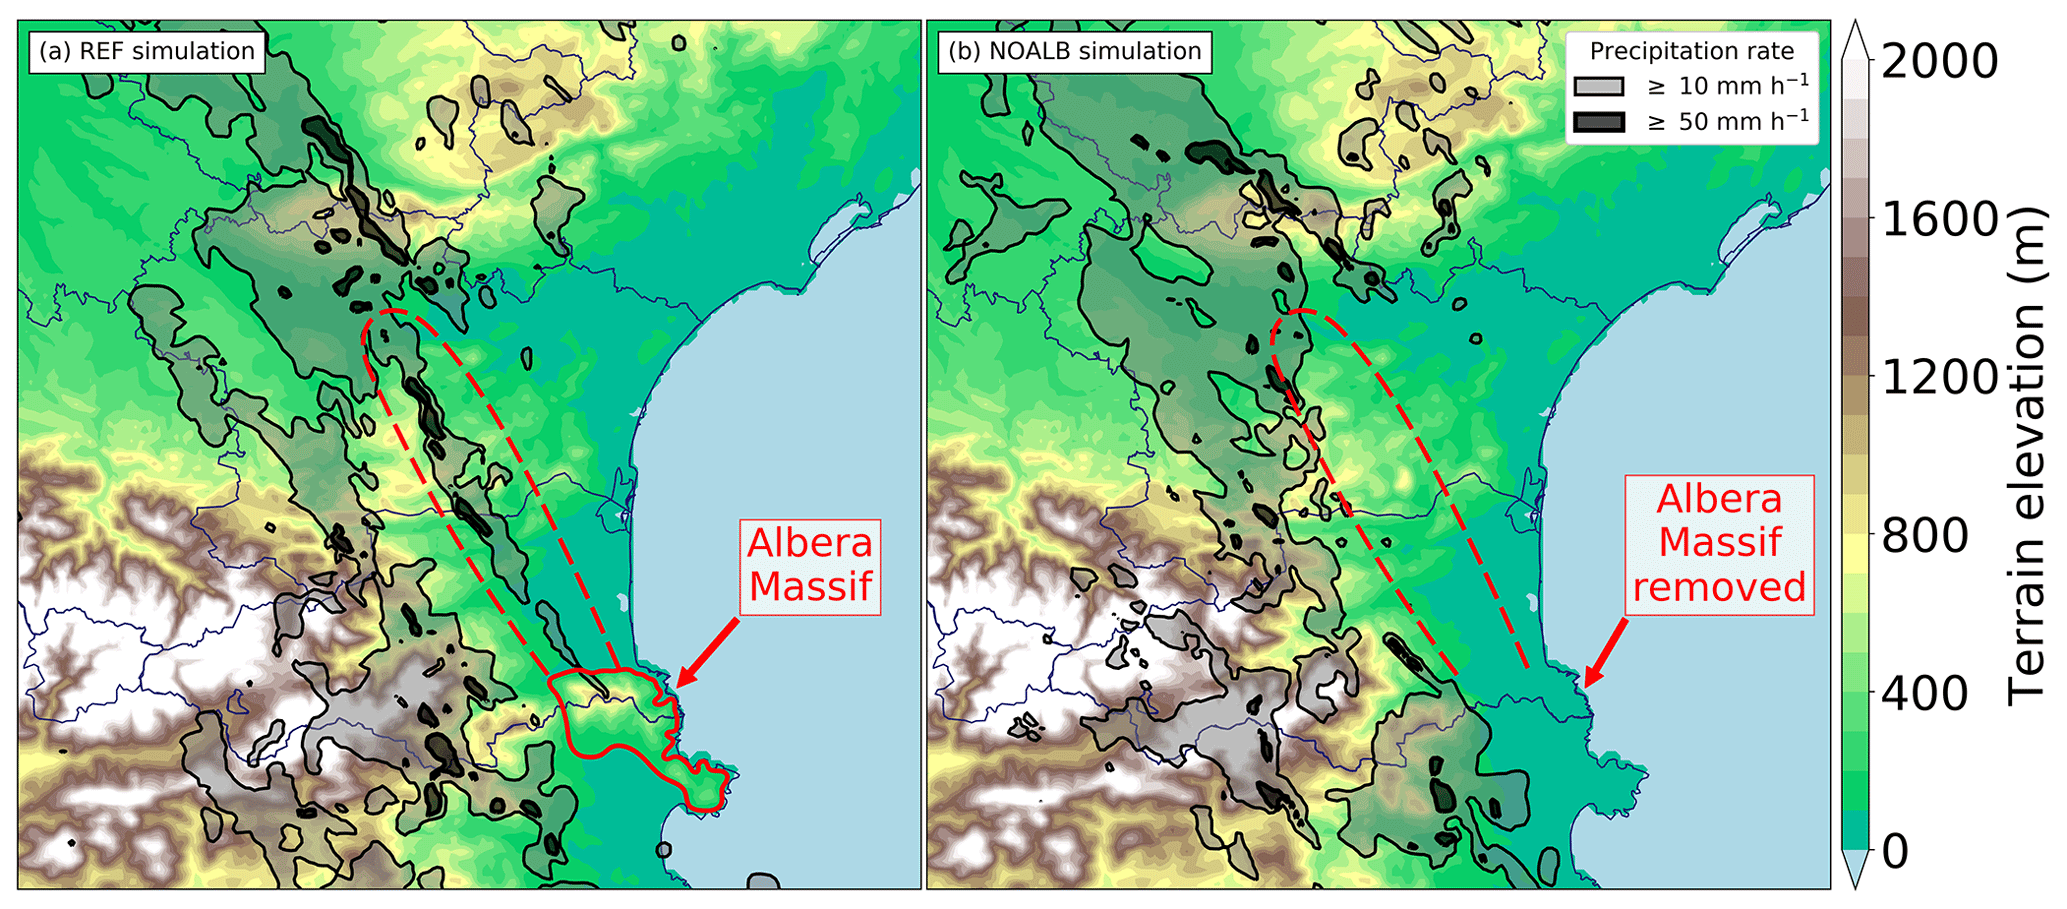
Figure 13Instantaneous precipitation rate at 05:00 UTC on 15 October superimposed on the terrain elevation of (a) REF and (b) NOALB simulations.
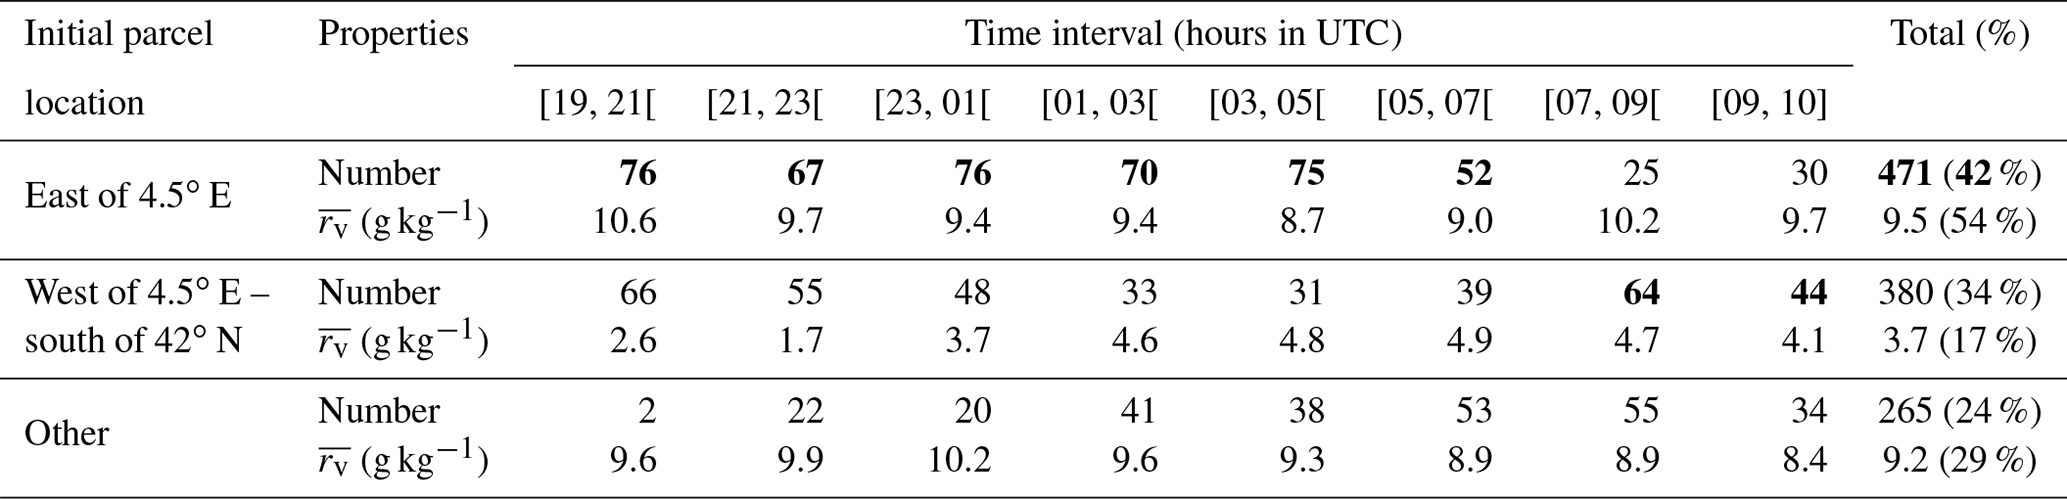
Table 2Properties and geographic origin of air parcels found in the atmospheric column C338 as a function of time, aggregated in time intervals from 19:00 UTC on 14 October to 10:00 UTC on 15 October. Mean water vapour mixing ratio 2 h before reaching C338 (i.e. before some parcels are lifted) is indicated by . Bold values indicate the highest number at each time interval.
5.3 Amount of moisture supplied by Leslie's remnants
To quantify the amount of moisture brought over the Aude department during the HPE by Leslie's remnants, the geographic origin of air parcels found in the atmospheric column above the 338 mm precipitation maximum simulated by REF (see Fig. 6b; now referred to as C338) is tracked. Every 30 min from 19:00 UTC on 14 October to 10:00 UTC on 15 October (the time period of the HPE in the REF simulation), backward trajectories of 36 air parcels taken every two vertical levels of the model between 18 m and about 10 km height are computed until the beginning of the REF simulation. Here, parcels above 10 km height are not taken because most parcels followed above this height are not found inside any updraught over the Aude department.
The computation of backward trajectories provides the initial parcel location: it is either its location at 12:00 UTC on 14 October or where the parcel enters the parent domain if the parcel is out of the domain at that time. The geographical origin is divided into three categories (Table 2): east of 4.5∘ E; west of 4.5∘ E and south of 42∘ N, corresponding to air parcels from Leslie's remnants; and other. The “other” category includes mostly low-level cold and stable air parcels located west of CF1 (Fig. 9b). Because these parcels are stable, only the first categories including conditionally unstable air parcels are compared.
Table 2 shows that 42 % of air parcels found in C338 originate from east of 4.5∘ E, i.e. from east of the Balearic Island, and they carry 54 % of the water vapour mixing ratio of all air parcels tracked. In contrast, 34 % of air parcels coming from Leslie's remnants carry only 17 % of the water vapour mixing ratio of all air parcels tracked, although their number increases particularly in the second part of the event. This result suggests that air parcels originating from the Mediterranean Sea, east of the Balearic Islands, supply more moisture to convective cells than air parcels originating from Leslie's remnants.
5.4 Lifting by the Albera Massif and effect on precipitation
To understand the role of the Albera Massif in generating convective bands downwind, as is observed and simulated by REF, the simulations REF and NOALB are compared.
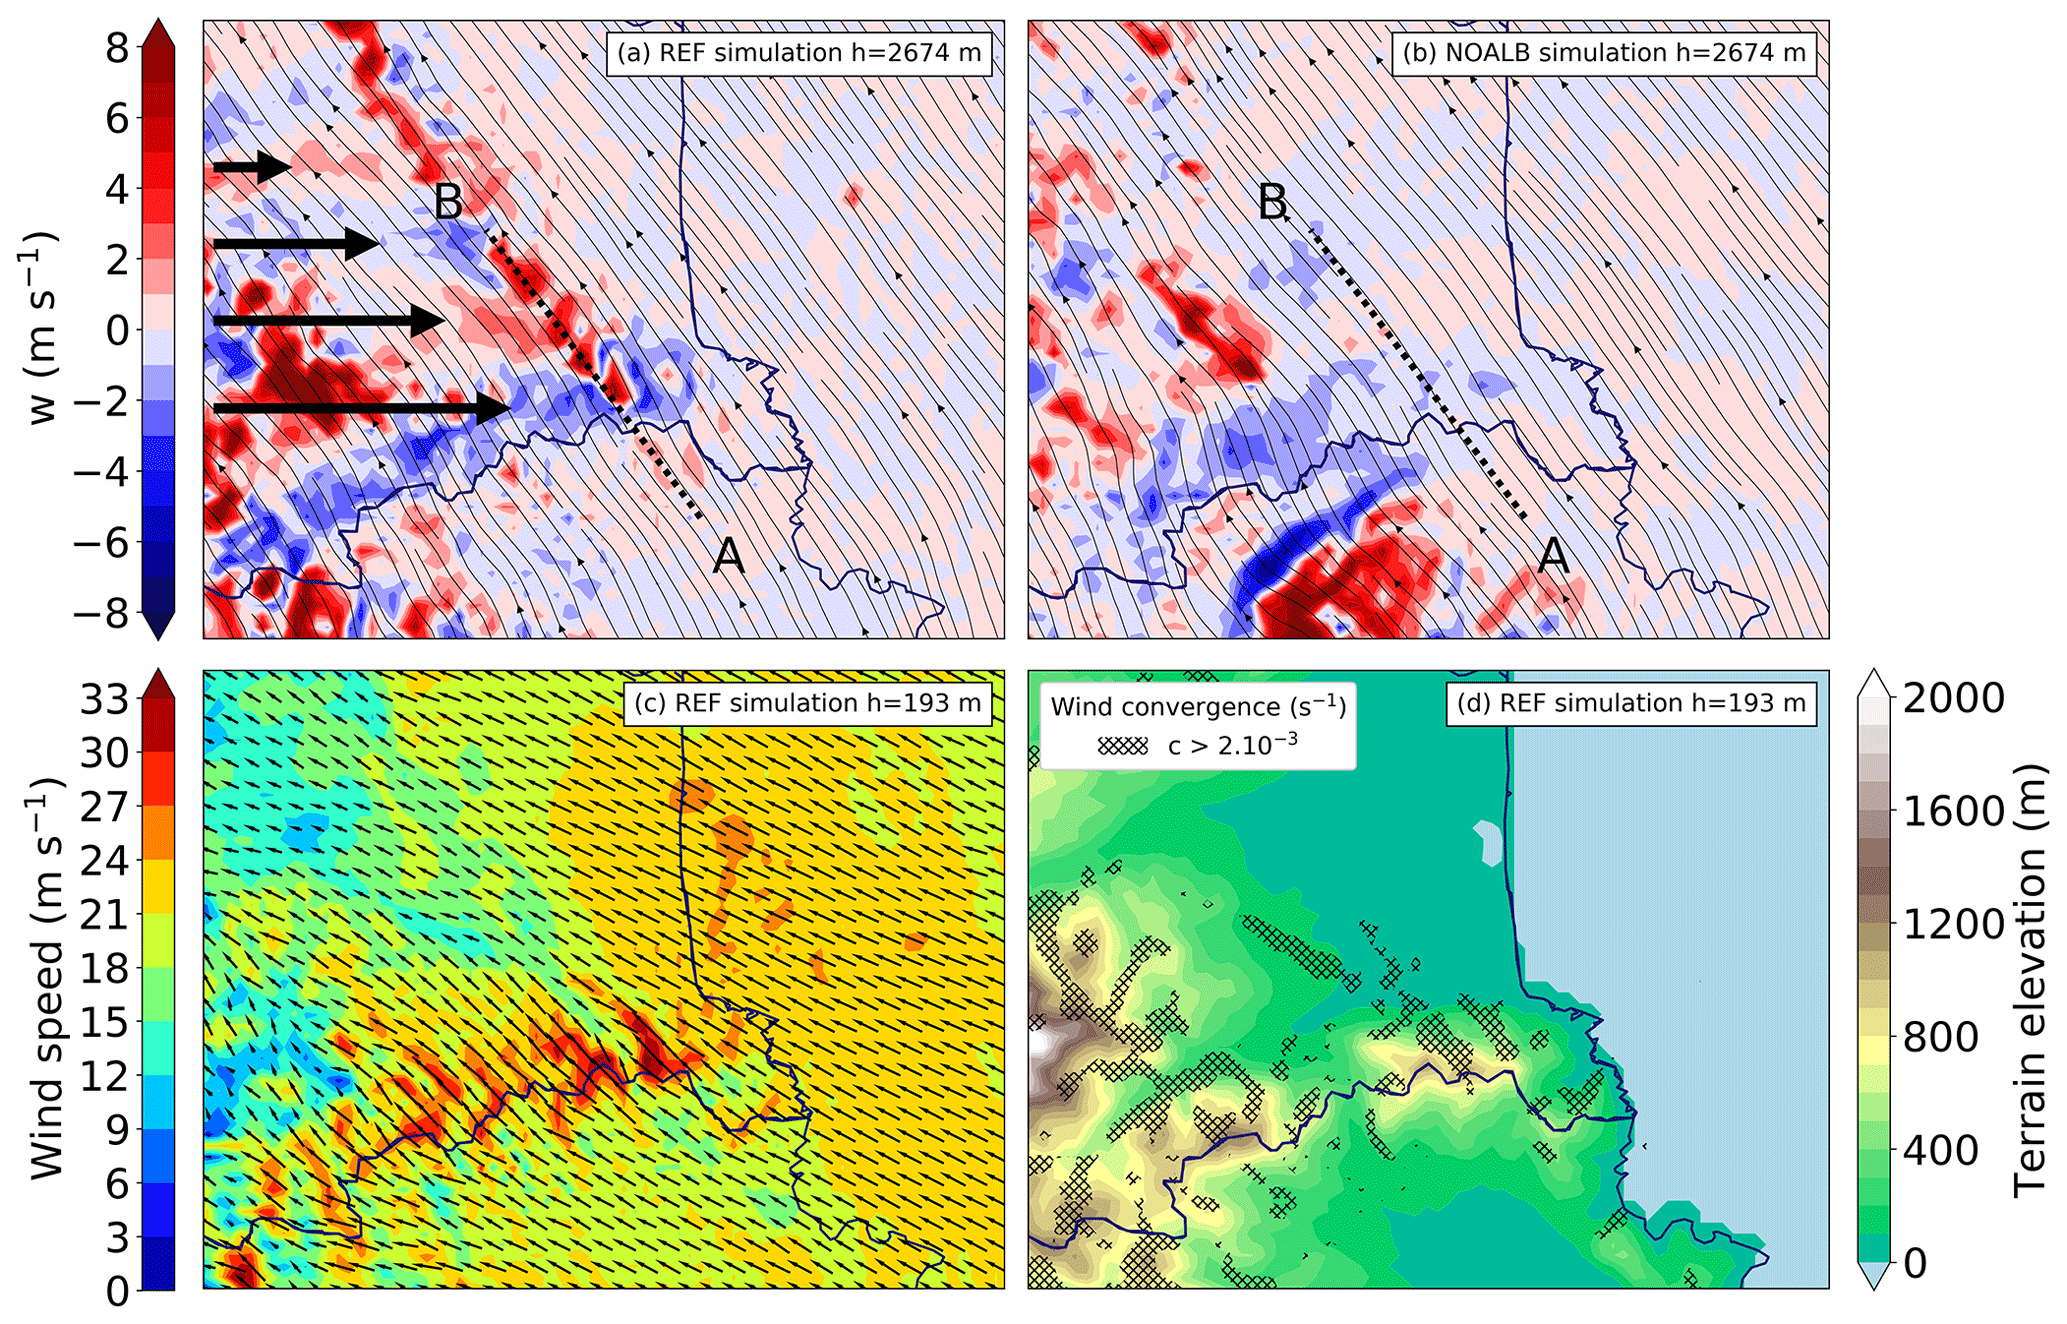
Figure 14Vertical velocity (w) and horizontal wind streamlines at 2674 m height in the (a) REF and (b) NOALB simulations. Horizontal wind (c) speed and direction and (d) convergence > s−1 at 193 m height in the REF simulation at 05:00 UTC on 15 October.
Heavy precipitation is simulated by REF at 05:00 UTC over the highest slopes of the Albera Massif and along a line downstream of the massif (Fig. 13a, dashed red area). When the Albera Massif is removed in NOALB (Fig. 13b), no precipitation is simulated over or downstream of it. Also, along the eastern Pyrenees, west of the dashed red line, a slightly larger area of instantaneous precipitation above 10 mm h−1 is found than in REF. Over and downstream of the Albera Massif, heavy precipitation in REF results from aligned convective cells exhibiting ascending vertical velocities above 4 m s−1 (Fig. 14a), whereas no substantial ascending movement is found along this line in NOALB (Fig. 14b). The orientation of the line of updraughts (along the A–B axis in Fig. 14a) is parallel to the horizontal wind streamlines at 2674 m height, showing that convective cells are aligned with the south–south-easterly mid-level wind direction. Superimposed with this line of updraughts, lee waves resulting in quasi-stationary, evenly spaced couplets of positive and negative vertical velocities are simulated by REF (Fig. 14a, large black arrows) but are not found in NOALB (Fig. 14b).
To quantify the flow regime of the situation at 05:00 UTC on 15 October, the mountain Froude number (Kirshbaum et al., 2018) is estimated, where U is the mean wind speed of the layer, N is the Brunt–Väisälä frequency, and h is the mountain height. Here h=1128 m, the maximum height of the Albera Massif in the model. To compute N, the bulk method described by Reinecke and Durran (2008) is used considering a single layer which has approximately the height of the mountain: , where g=9.81 m s−2 is the standard acceleration of gravity, θ(n) is the potential temperature at model level n (1st level is at 5 m height, and the 25th is at 1143 m height), and is the mean potential temperature over the layer. The moist Froude number (Chen and Lin, 2005) is also computed, where Nw is the moist Brunt–Väisälä frequency that differs from N because θ is replaced by θv. The computation of U, N and Nw is an average over 100 grid points located upwind of the mountain, precisely the grid points less than 10 km east and 10 km south of grid point A (A is shown in Fig. 14a). Computation leads to U=21.3 m s−1, s−1 and s−1, which gives Frm=1.9 and Frw=2.1. According to Kirshbaum et al. (2018), indicates that the flow tends to directly ascend the terrain over the windward slope instead of being deflected around the obstacle. This ascent mechanically lifts the conditionally unstable air parcels supplied by the LLJ but also likely triggers the aforementioned lee waves. Frw=2.1 corresponds to the flow regime IV of Chen and Lin (2005), described as a flow with an orographic stratiform precipitation system over the mountain and possibly a downstream-propagating cloud system (a stratiform cloud is defined by the authors as having a cloud depth less than 4 km).
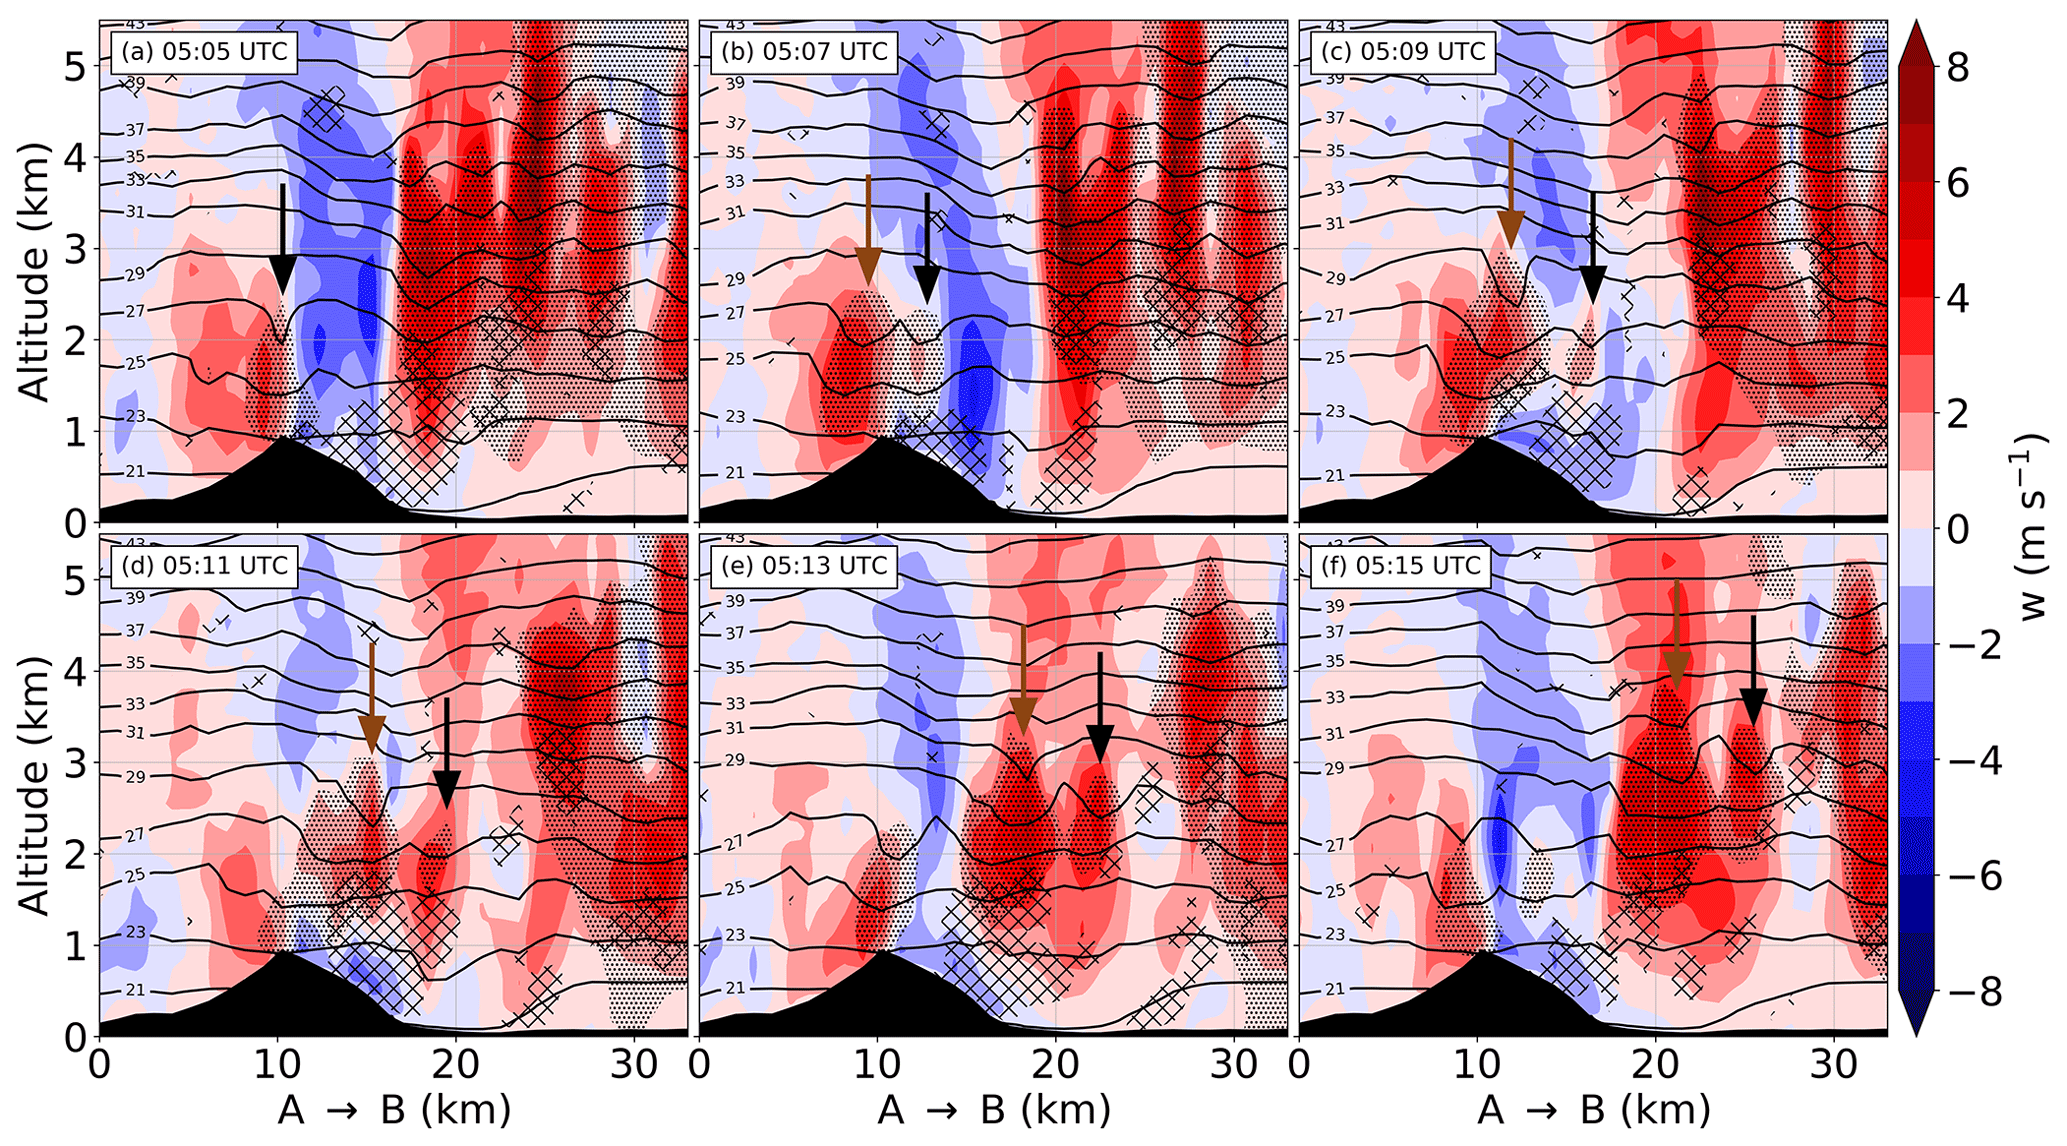
Figure 15Vertical velocity (w; m s−1), potential temperature (black contours; ∘C), horizontal convergence > s−1 (black diagonal hatches) and hydrometeor mixing ratio > 1 g kg−1 (little black dots) between 05:05 and 05:15 UTC on 15 October. Terrain is in black.
To closely look at how convective cells are initiated and maintained, a time evolution of the vertical cross-section A–B simulated by REF is shown in Fig. 15. At 05:05 UTC, a convective cell containing hydrometeors is formed above the Albera Massif (Fig. 15a, black arrow). Inside this cell, the potential temperature is higher than the environment around 2 km height probably due to latent heat release associated with water phase changes. This cell is advected towards B by the mid-level wind. A second cell is initiated at the rear of the first one by orographic lifting, and the surface of hydrometeor mixing ratio above 1 g kg−1 rapidly increases (Fig. 15b, brown arrow). On the lee side of the mountain, these convective cells propagate in the middle of a large subsidence area (related to the aforementioned lee wave). Subsidence appears counteracted by a quasi-stationary wind convergence zone located near the ground, which connects with the updraughts and invigorates them. This wind convergence zone is simulated downwind of the mountain (Fig. 14d) and seems to be due to rapid wind decrease and some wind confluence on the lee side of the Albera Massif (Fig. 14c). Then, as shown by Fig. 15d and e, both cells connect with an ascending zone of the lee wave around 20 km along the axis A–B and rapidly grow: the hydrometeor mixing ratio surface above 1 g kg−1 and the vertical velocity are found to rapidly increase inside both cells. These findings are consistent with the description of the flow regime IV of Chen and Lin (2005): vertical velocities above 1 m s−1 and hydrometeor mixing ratios above 1 g kg−1 remain below 4 km a.s.l. over the mountain, and convective cells propagate downstream of the mountain.
Once convective cells are on the lee side of the mountain, as they are advected by the south–south-easterly mid-level wind (Fig. 14a), the south-easterly LLJ (Fig. 14c) supplies conditionally unstable air parcels that do not cross the Albera Massif to the cells from their south-eastern flank. Backward trajectories starting from their updraughts (not shown) indicate that the number of low-level moist air parcels that do not cross the Albera Massif found inside the cells increases as they are advected. This slight directional vertical wind shear simulated in the lower part of the troposphere possibly explains the maintenance of the convective cells long after they are formed.
This preferential organization of convection along a line downstream of the Albera Massif results in substantial departures in 24 h rainfall accumulations between NOALB and REF (Figs. 6b and d). Precipitation along the eastern band (see Sect. 2), downstream of the Albera Massif, is reduced by as much as 100 mm in NOALB compared to REF. Maximum precipitation over plains is reduced from 338 mm in REF to 310 mm in NOALB, and the maximum in NOALB (332 mm) is shifted over mountains. Concomitantly, precipitation is enhanced along the western band downstream of the eastern slopes of the Pyrenees: maximum precipitation is increased from 296 to 327 mm in NOALB compared to REF. Precipitation is also enhanced between both bands, along the quasi-stationary CF1. Consequently, the south-east–north-west orientation of the precipitation zone exceeding 240 mm in REF is replaced by a south–north orientation in NOALB.
This sensitivity experiment shows the large importance of the Albera Massif in the shape of the precipitation field, focusing precipitation downstream of it while reducing precipitation elsewhere. The proposed mechanism describing convection initiation over the Albera Massif – first relief intercepting the marine LLJ – and the convective cell maintenance downstream of the Albera Massif may be applied to similar reliefs. Additional simulations (not shown) in which the Corbières Massif and the eastern slopes of the Pyrenees are successively flattened show a substantial decrease in maximum accumulated precipitation downstream of these peaks, associated with a spread of precipitation above 200 mm over a larger area along the quasi-stationary front.

Figure 16Virtual potential temperature at 5 m height for the (a) REF and (b) NOCOOL simulations at 04:00 UTC on 15 October. Vertical cross-sections of virtual potential temperature along the A–B axis are drawn for the (c) REF and (d) NOCOOL simulations.
This section investigates the possible influence of the cooling associated with the evaporation of precipitation over the Aude department on CF1. The following questions are addressed. Does this process (i) modify the location of CF1, (ii) extend the duration of CF1 stationarity and (iii) enhance the temperature gradient along CF1?
Regarding 24 h accumulated precipitation, it is globally higher in NOCOOL than in REF while remaining organized in two major bands whose orientation is slightly rotated clockwise compared to REF (Fig. 6b and c). Maximum precipitation reaches 415 mm in NOCOOL and only 338 mm in REF.
At 04:00 UTC, both REF and NOCOOL exhibit a sharp east–west virtual potential temperature (θv) gradient that delineates the location of CF1 (Fig. 16). At 5 m height, REF shows about 0.5 to 1 ∘C colder temperatures than NOCOOL on both sides of CF1. The highest departures are found over the Pyrenees. South of the A–B axis, CF1 is shifted from 0 to 10 km west in NOCOOL compared to REF, depending on the latitude. Along the A–B axis (Fig. 16c and d), near the ground, CF1 is very close between REF and NOCOOL: it is only about 4 km farther west in NOCOOL than in REF. The θv gradient is visible up to 2 km a.s.l. in both simulations. East of CF1, departures of generally less than 0.5 ∘C are found between simulations. West of CF1, generally higher θv values are found in NOCOOL compared to REF, with NOCOOL up to 2 ∘C higher than REF near A above 1500 m a.s.l.
The evaporative cooling does not shift the location of CF1 by more than a few kilometres or substantially modify the θv gradient along it. Comparison of REF and NOCOOL does not show any extended duration of CF1 stationarity or substantial time lag between simulations. However, higher θv values simulated in NOCOOL than in REF are explained by the evaporative cooling being switched off. These higher θv values result in globally higher MUCAPE and consequently stronger convective cells and stronger rain rates in NOCOOL than in REF (not shown). This difference possibly explains why precipitation is substantially higher in NOCOOL than in REF (Fig. 6b and c).
One of the reasons for the small evaporative cooling west of CF1, where the highest precipitation is observed, is the small evaporation due to near saturation of air masses in the lower troposphere according to the REF simulation (Fig. 17). At 04:00 UTC, relative humidity exceeds 90 % over most of Languedoc-Roussillon, and a dry air mass is only found over Spain, at the rear of CF2. The fact that the cooling associated with evaporation processes does not have any substantial impact on the stationarity of the simulated MCS in this HPE agrees with the same observation of Ducrocq et al. (2008) for the 1999 Aude HPE.

Figure 17Relative humidity in the REF simulation at 04:00 UTC on 15 October at (a) 697 m height, (b) 1507 m height, (c) 2957 m height and (d) 5160 m height.
The synoptic situation on 14 and 15 October 2018 was favourable to an HPE over Languedoc-Roussillon. The rapid deepening of a Mediterranean surface low, extended by a trough over Languedoc-Roussillon, contributed to strengthening a low-level jet (LLJ) over the Mediterranean Sea. Meanwhile, a decaying cold front (CF1) remained quasi-stationary in the middle of the Aude department, west of the trough. The slow movement northwards of the surface low and its associated cold front (CF2) as well as the quasi-stationarity of the trough sustained quasi-stationary atmospheric conditions that continuously supplied conditionally unstable air parcels during several hours over the Aude department.
A two-way grid-nested numerical simulation at 1 km and 500 m horizontal grid spacing is carried out with the Meso-NH model. The realism of this simulation is assessed using in particular near-surface analyses built from observations of standard and personal weather stations. Compared to observations, the simulation delays the arrival of precipitation ahead of CF2 over the Aude department as well as the end of the HPE over the west of this department. Also, the location where both CF1 and the trough remain quasi-stationary is well simulated, but the stationarity duration of both low-level mesoscale boundaries is longer than observed. Consistent with these longer stationarities and the delay, simulated 24 h accumulated precipitation is slightly overestimated.
The simulation reveals that the main origin of lifted air parcels and dominant mechanisms that trigger convection differ during the HPE. In a first part, conditionally unstable air parcels mainly originate from east of the Balearic Islands, over the Mediterranean Sea, at altitudes between 0 and 1.5 km. They are carried by the LLJ towards the Languedoc-Roussillon shore and moistened during their transport over the Mediterranean Sea. Once inland, these air parcels are continuously lifted over the upwind slopes of the first mountains encountered, i.e. mostly eastern Pyrenees relief, the Albera Massif and the Corbières Massif. Convective cells organize along quasi-stationary lines downwind of the mountains, forming the active parts of a back-building MCS. Cells are maintained and reinforced downwind of the terrain by low-level leeward convergence, ascending areas created by mountain lee waves and favoured supply in conditionally unstable air due to the low-level directional wind shear. A sensitivity study shows that the convective line downwind of the Albera Massif disappears when the Albera Massif terrain is flattened, revealing the crucial role of terrain in the formation of these lines. In a second part, an increasing number of conditionally unstable air parcels originate from south of the Balearic Islands, i.e. from the vicinity of the Mediterranean surface low and CF2 at altitudes mostly between 1 and 4 km. Convective cells are triggered within the conditionally unstable air mass located ahead of CF2, over the Mediterranean Sea, and advected towards the Languedoc-Roussillon coast. Inland, the MCS loses progressively its organization in lines. The end of the HPE is driven by the advance of CF2 north-eastwards.
Throughout the event, convection is particularly enhanced above and west of the quasi-stationary front CF1, whose mark is confined below 2 km and along which strong wind convergence as well as a substantial virtual potential temperature gradient is simulated. Most parcels found in large updraughts near the simulated precipitation maximum are lifted above CF1. Regarding the quasi-stationary location of CF1, the simulation indicates that CF1 propagation towards the east is countered by the LLJ that blows in the opposite direction: when the wind speed drops, the cold air mass west of CF1 flows rapidly eastwards, which breaks the stationarity. A sensitivity study shows that evaporative cooling plays no role in the stationarity of CF1, possibly because of the low evaporation due to the near saturation of the middle and lower troposphere.
Consequently, in decreasing order of importance, the location of the exceptional precipitation over the Aude department is the result of convection focusing (i) west of the quasi-stationary CF1 and (ii) downwind of the Albera Massif and the Corbières Massif. Precipitation maximum is found at the junction between these areas in the REF simulation and observations. Regarding the role of the remnants of Hurricane Leslie, they contribute to (i) supplying low-level conditionally unstable air in the second part of the event and (ii) moistening mid-levels of the troposphere, diminishing evaporation processes which therefore play no role in modifying the location of CF1. However, low-level moisture that contributes to precipitation over the Aude department mainly originates from air masses located east of the Balearic Islands rather than Leslie's remnants.
Future work could quantify Leslie's direct contribution in the formation of the Mediterranean low and its associated cold front CF2 but also the remote impact of Leslie's extratropical transition in a similar way as Grams and Blumer (2015) or Pantillon et al. (2015): it could help to understand how accurately these systems need to be tracked to improve HPE forecasts. As they allow the tracking of low-level mesoscale boundaries which are involved in the stationarity of precipitation, rapidly updated near-surface analyses comprising personal weather stations could be used as an independent means to evaluate in real time the accuracy of near-surface model forecasts. In parallel, the assimilation of these station data could be tested in convective-scale models such as AROME.
The lateral coupling is performed through a combination of a radiation boundary condition and a five-grid-point flow relaxation scheme with a damping rate of 0.002 s−1. Near the upper boundary, a Rayleigh damping with a rate of 0.001 s−1 is progressively applied above 15 km height in order to prevent spurious reflections. Both dampings are applied to the perturbations of the wind components and the thermodynamical variables with respect to their large-scale values.
The transport scheme chosen is a fourth-order centred discretization for the momentum and a monotonic version of the piecewise parabolic method (Colella and Woodward, 1984) for meteorological (temperature, water substances and turbulent kinetic energy) and scalar variables. The time integration scheme is a fourth-order explicit Runge–Kutta for the momentum and a forward scheme for meteorological and scalar variables. The model time step is 2 s for the parent domain and 1 s for the child domain. To suppress very-short-wavelength modes, a fourth-order diffusion operator is applied to the wind components (u, v, w) with an e-folding time (time at which waves are damped by a factor e−1) of 1800 s.
Earth surface variables and fluxes are simulated with the SURFEX model version 8.1 (Masson et al., 2013). Each grid mesh is divided into four main tiles. The following schemes are used for each tile: a three-layer force-restore version of ISBA for natural land surface (Noilhan and Planton, 1989), TEB for urban area (Masson, 2000), the roughness length formula of Charnock (1955) with Louis (1979) exchange coefficients for lakes and the COARE 3.0 parameterization (Fairall et al., 2003) for sea surface fluxes. Optional corrections of sea surface fluxes due to density effects during heat and water vapour transfer (Webb et al., 1980) and precipitation effects (Gosnell et al., 1995; Fairall et al., 1996) are applied. The SST field comes from the initial AROME analysis and remains constant for the entire simulation. Physiographic files used include the land cover database ECOCLIMAP-II/Europe version 2.5 (Faroux et al., 2013), topography from the Shuttle Radar Topography Mission (Farr et al., 2007) and soil properties derived from the Harmonized World Soil Database (FAO, IIASA, ISRIC, ISS-CAS, JRC, 2012).
Regarding physical parameterizations, the longwave radiation scheme used is the Rapid Radiation Transfer Model (Mlawer et al., 1997), while the shortwave scheme is based on the Fouquart and Bonnel (1980) method. For turbulence, the one-dimensional parameterization used is based on a 1.5-order closure (Cuxart et al., 2000) of the turbulent kinetic energy equation with the Bougeault and Lacarrere (1989) mixing length. For the child model with a horizontal grid spacing of 500 m, in the so-called turbulence “grey zone”, the choice of a 1D turbulence parameterization can be questioned (Machado and Chaboureau, 2015). Here, this choice is made to keep consistency between the two coupled models. At horizontal grid spacing lower than or equal to 1 km, deep convection is assumed to be resolved explicitly by the model's dynamics. Shallow convection is parameterized with the Pergaud et al. (2009) scheme. The bulk one-moment mixed microphysical scheme used is ICE3 (Pinty and Jabouille, 1998), which includes six water species (water vapour, cloud droplets, raindrops, pristine ice crystals, snow or aggregates, and graupel).
The Meso-NH model is freely available online at http://mesonh.aero.obs-mip.fr/ (last access: 20 July 2021) (Centre national de la recherche scientifique, Météo-France, Université Toulouse-III-Paul-Sabatier, 2021).
Standard weather station data, manual rain gauge data, the radar mosaic, SPWS ANTILOPE QPE, and ARPEGE and AROME analyses are provided by and property of Météo-France. World Meteorological Organization essential weather station data, the radar mosaic at a 15 min time step, and the ARPEGE and AROME models are available in real time at https://donneespubliques.meteofrance.fr/ (last access: 20 July 2021) (Météo-France, 2021). Direct online access of most datasets used in the study is not available: most of them can be provided on request by the corresponding author only for research purposes.
This work was carried out by MM as part of his PhD thesis under the supervision of OC. MM and OC designed the study, interpreted the results and wrote the paper.
The authors declare that they have no conflict of interest.
Publisher's note: Copernicus Publications remains neutral with regard to jurisdictional claims in published maps and institutional affiliations.
This work is a contribution to the HyMeX programme supported by MISTRALS. We wish to particularly thank Quentin Rodier as well as the PHY-NH and PRECIP teams for valuable discussions about the Meso-NH model. The authors would like to thank the three anonymous referees for their useful comments that helped improve the quality of the article.
This paper was edited by Shira Raveh-Rubin and reviewed by three anonymous referees.
Ayphassorho, H., Pipien, G., Guion de Meritens, I., and Lacroix, D.: Retour d'expérience des inondations du 14 au 17 octobre 2018 dans l'Aude, available at: https://cgedd.documentation.developpement-durable.gouv.fr/notice?id=Affaires-0011552&reqId=548839ae-f685-4c3d-bbdb-9452154f508c&pos=12 (last access: 20 July 2021), 2019. a, b
Barrett, A. I., Gray, S. L., Kirshbaum, D. J., Roberts, N. M., Schultz, D. M., and Fairman Jr., J. G.: Synoptic versus orographic control on stationary convective banding, Q. J. Roy. Meteorol. Soc., 141, 1101–1113, https://doi.org/10.1002/qj.2409, 2015. a
Bougeault, P. and Lacarrere, P.: Parameterization of Orography-Induced Turbulence in a Mesobeta–Scale Model, Mon. Weather Rev., 117, 1872–1890, https://doi.org/10.1175/1520-0493(1989)117<1872:POOITI>2.0.CO;2, 1989. a
Bouin, M.-N., Redelsperger, J.-L., and Lebeaupin Brossier, C.: Processes leading to deep convection and sensitivity to sea-state representation during HyMeX IOP8 heavy precipitation event, Q. J. Roy. Meteorol. Soc., 143, 2600–2615, https://doi.org/10.1002/qj.3111, 2017. a
Bresson, E., Ducrocq, V., Nuissier, O., Ricard, D., and de Saint-Aubin, C.: Idealized numerical simulations of quasi-stationary convective systems over the Northwestern Mediterranean complex terrain, Q. J. Roy. Meteorol. Soc., 138, 1751–1763, https://doi.org/10.1002/qj.1911, 2012. a
Brousseau, P., Seity, Y., Ricard, D., and Léger, J.: Improvement of the forecast of convective activity from the AROME-France system, Q. J. Roy. Meteorol. Soc., 142, 2231–2243, https://doi.org/10.1002/qj.2822, 2016. a
Buzzi, A., Davolio, S., Malguzzi, P., Drofa, O., and Mastrangelo, D.: Heavy rainfall episodes over Liguria in autumn 2011: numerical forecasting experiments, Nat. Hazards Earth Syst. Sci., 14, 1325–1340, https://doi.org/10.5194/nhess-14-1325-2014, 2014. a
Caumont, O., Mandement, M., Bouttier, F., Eeckman, J., Lebeaupin Brossier, C., Lovat, A., Nuissier, O., and Laurantin, O.: The heavy precipitation event of 14–15 October 2018 in the Aude catchment: a meteorological study based on operational numerical weather prediction systems and standard and personal observations, Nat. Hazards Earth Syst. Sci., 21, 1135–1157, https://doi.org/10.5194/nhess-21-1135-2021, 2021. a, b, c, d, e, f
Centre national de la recherche scientifique, Météo-France, Université Toulouse-III-Paul-Sabatier: MESO-NH mesoscale non-hydrostatic model, available at: http://mesonh.aero.obs-mip.fr/, last access: 20 July 2021. a
Chappell, C. F.: Quasi-Stationary Convective Events, American Meteorological Society, Boston, MA, 289–310, https://doi.org/10.1007/978-1-935704-20-1_13, 1986. a
Charnock, H.: Wind stress on a water surface, Q. J. Roy. Meteorol. Soc., 81, 639–640, https://doi.org/10.1002/qj.49708135027, 1955. a
Chazette, P., Flamant, C., Shang, X., Totems, J., Raut, J.-C., Doerenbecher, A., Ducrocq, V., Fourrié, N., Bock, O., and Cloché, S.: A multi-instrument and multi-model assessment of atmospheric moisture variability over the western Mediterranean during HyMeX, Q. J. Roy. Meteorol. Soc., 142, 7–22, https://doi.org/10.1002/qj.2671, 2016. a
Chen, S.-H. and Lin, Y.-L.: Effects of Moist Froude Number and CAPE on a Conditionally Unstable Flow over a Mesoscale Mountain Ridge, J. Atmos. Sci., 62, 331–350, https://doi.org/10.1175/JAS-3380.1, 2005. a, b, c
Colella, P. and Woodward, P. R.: The Piecewise Parabolic Method (PPM) for gas-dynamical simulations, J. Comput. Phys., 54, 174–201, https://doi.org/10.1016/0021-9991(84)90143-8, 1984. a
Cosma, S., Richard, E., and Miniscloux, F.: The role of small-scale orographic features in the spatial distribution of precipitation, Q. J. of Roy. Meteorol. Soc., 128, 75–92, https://doi.org/10.1256/00359000260498798, 2002. a, b
Courtier, P., Freydier, C., Geleyn, J.-F., Rabier, F., and Rochas, M.: The Arpege project at Météo-France, in: vol. 2, Seminar on Numerical Methods in Atmospheric Models, 9–13 September 1991, 193–232, ECMWF, available at: https://www.ecmwf.int/node/8798 (last access: 20 July 2021), 1991. a
Cuxart, J., Bougeault, P., and Redelsperger, J.-L.: A turbulence scheme allowing for mesoscale and large-eddy simulations, Q. J. Roy. Meteorol. Soc., 126, 1–30, https://doi.org/10.1002/qj.49712656202, 2000. a
Davolio, S., Volonté, A., Manzato, A., Pucillo, A., Cicogna, A., and Ferrario, M. E.: Mechanisms producing different precipitation patterns over north-eastern Italy: insights from HyMeX-SOP1 and previous events, Q. J. Roy. Meteorol. Soc., 142, 188–205, https://doi.org/10.1002/qj.2731, 2016. a
Davolio, S., Fera, S. D., Laviola, S., Miglietta, M. M., and Levizzani, V.: Heavy Precipitation over Italy from the Mediterranean Storm “Vaia” in October 2018: Assessing the Role of an Atmospheric River, Mon. Weather Rev., 148, 3571–3588, https://doi.org/10.1175/MWR-D-20-0021.1, 2020. a
Di Girolamo, P., Flamant, C., Cacciani, M., Richard, E., Ducrocq, V., Summa, D., Stelitano, D., Fourrié, N., and Saïd, F.: Observation of low-level wind reversals in the Gulf of Lion area and their impact on the water vapour variability, Q. J. Roy. Meteorol. Soc., 142, 153–172, https://doi.org/10.1002/qj.2767, 2016. a
Ducrocq, V., Nuissier, O., Ricard, D., Lebeaupin, C., and Thouvenin, T.: A numerical study of three catastrophic precipitating events over southern France. II: Mesoscale triggering and stationarity factors, Q. J. Roy. Meteorol. Soc., 134, 131–145, https://doi.org/10.1002/qj.199, 2008. a, b, c, d, e
Ducrocq, V., Davolio, S., Ferretti, R., Flamant, C., Santaner, V. H., Kalthoff, N., Richard, E., and Wernli, H.: Introduction to the HyMeX Special Issue on `Advances in understanding and forecasting of heavy precipitation in the Mediterranean through the HyMeX SOP1 field campaign', Q. J. Roy. Meteorol. Soc., 142, 1–6, https://doi.org/10.1002/qj.2856, 2016. a, b
Duffourg, F. and Ducrocq, V.: Assessment of the water supply to Mediterranean heavy precipitation: a method based on finely designed water budgets, Atmos. Sci. Lett., 14, 133–138, https://doi.org/10.1002/asl2.429, 2013. a
Duffourg, F., Nuissier, O., Ducrocq, V., Flamant, C., Chazette, P., Delanoë, J., Doerenbecher, A., Fourrié, N., Di Girolamo, P., Lac, C., Legain, D., Martinet, M., Saïd, F., and Bock, O.: Offshore deep convection initiation and maintenance during the HyMeX IOP 16a heavy precipitation event, Q. J. Roy. Meteorol. Soc., 142, 259–274, https://doi.org/10.1002/qj.2725, 2016. a, b
Duffourg, F., Lee, K.-O., Ducrocq, V., Flamant, C., Chazette, P., and Di Girolamo, P.: Role of moisture patterns in the backbuilding formation of HyMeX IOP13 heavy precipitation systems, Q. J. Roy. Meteorol. Soc., 144, 291–303, https://doi.org/10.1002/qj.3201, 2018. a, b, c
Fairall, C. W., Bradley, E. F., Rogers, D. P., Edson, J. B., and Young, G. S.: Bulk parameterization of air-sea fluxes for Tropical Ocean-Global Atmosphere Coupled-Ocean Atmosphere Response Experiment, J. Geophys. Res.-Oceans, 101, 3747–3764, https://doi.org/10.1029/95JC03205, 1996. a
Fairall, C. W., Bradley, E. F., Hare, J. E., Grachev, A. A., and Edson, J. B.: Bulk Parameterization of Air–Sea Fluxes: Updates and Verification for the COARE Algorithm, J. Climate, 16, 571–591, https://doi.org/10.1175/1520-0442(2003)016<0571:BPOASF>2.0.CO;2, 2003. a
FAO, IIASA, ISRIC, ISS-CAS, JRC: Harmonized World Soil Database version 1.2, available at: https://webarchive.iiasa.ac.at/Research/LUC/External-World-soil-database/HTML/ (last access: 20 July 2021), 2012. a
Faroux, S., Kaptué Tchuenté, A. T., Roujean, J.-L., Masson, V., Martin, E., and Le Moigne, P.: ECOCLIMAP-II/Europe: a twofold database of ecosystems and surface parameters at 1 km resolution based on satellite information for use in land surface, meteorological and climate models, Geosci. Model Dev., 6, 563–582, https://doi.org/10.5194/gmd-6-563-2013, 2013. a
Farr, T. G., Rosen, P. A., Caro, E., Crippen, R., Duren, R., Hensley, S., Kobrick, M., Paller, M., Rodriguez, E., Roth, L., Seal, D., Shaffer, S., Shimada, J., Umland, J., Werner, M., Oskin, M., Burbank, D., and Alsdorf, D.: The Shuttle Radar Topography Mission, Rev. Geophys., 45, RG2004, https://doi.org/10.1029/2005RG000183, 2007. a
Fouquart, Y. and Bonnel, B.: Computations of solar heating of the Earth's atmosphere: a new parameterization, Beitr. Phys. Atmos., 53, 35–62, 1980. a
French Insurance Federation: The lethal floods that affected south-east France from 22–24 November caused losses with a provisional estimated cost of 285 million Euros, available at: https://www.ffa-assurance.fr/en/media-room/press-release/lethal-floods-affected-south-east-france-22-24-november- caused-losses (last access: 20 July 2021), 2019. a
Gal-Chen, T. and Somerville, R. C.: On the use of a coordinate transformation for the solution of the Navier-Stokes equations, J. Comput. Phys., 17, 209–228, https://doi.org/10.1016/0021-9991(75)90037-6, 1975. a
Gheusi, F. and Stein, J.: Lagrangian description of airflows using Eulerian passive tracers, Q. J. Roy. Meteorol. Soc., 128, 337–360, https://doi.org/10.1256/00359000260498914, 2002. a
Gosnell, R., Fairall, C. W., and Webster, P. J.: The sensible heat of rainfall in the tropical ocean, J. Geophys. Res.-Oceans, 100, 18437–18442, https://doi.org/10.1029/95JC01833, 1995. a
Grams, C. M. and Blumer, S. R.: European high-impact weather caused by the downstream response to the extratropical transition of North Atlantic Hurricane Katia (2011), Geophys. Res. Lett., 42, 8738–8748, https://doi.org/10.1002/2015GL066253, 2015. a, b
Kirshbaum, D. J., Adler, B., Kalthoff, N., Barthlott, C., and Serafin, S.: Moist Orographic Convection: Physical Mechanisms and Links to Surface-Exchange Processes, Atmosphere, 9, 80, https://doi.org/10.3390/atmos9030080, 2018. a, b
Kreitz, M., Calas, C., and Baille, S.: Inondations de l'Aude du 15 octobre 2018: analyse météorologique, conséquences hydrologiques et prévisibilité, La Météorologie, 8, 46–64, https://doi.org/10.37053/lameteorologie-2020-0067, 2020. a
Lac, C., Chaboureau, J.-P., Masson, V., Pinty, J.-P., Tulet, P., Escobar, J., Leriche, M., Barthe, C., Aouizerats, B., Augros, C., Aumond, P., Auguste, F., Bechtold, P., Berthet, S., Bielli, S., Bosseur, F., Caumont, O., Cohard, J.-M., Colin, J., Couvreux, F., Cuxart, J., Delautier, G., Dauhut, T., Ducrocq, V., Filippi, J.-B., Gazen, D., Geoffroy, O., Gheusi, F., Honnert, R., Lafore, J.-P., Lebeaupin Brossier, C., Libois, Q., Lunet, T., Mari, C., Maric, T., Mascart, P., Mogé, M., Molinié, G., Nuissier, O., Pantillon, F., Peyrillé, P., Pergaud, J., Perraud, E., Pianezze, J., Redelsperger, J.-L., Ricard, D., Richard, E., Riette, S., Rodier, Q., Schoetter, R., Seyfried, L., Stein, J., Suhre, K., Taufour, M., Thouron, O., Turner, S., Verrelle, A., Vié, B., Visentin, F., Vionnet, V., and Wautelet, P.: Overview of the Meso-NH model version 5.4 and its applications, Geosci.Model Dev., 11, 1929–1969, https://doi.org/10.5194/gmd-11-1929-2018, 2018. a
Lebeaupin, C., Ducrocq, V., and Giordani, H.: Sensitivity of torrential rain events to the sea surface temperature based on high-resolution numerical forecasts, J. Geophys. Res.-Atmos., 111, D12110, https://doi.org/10.1029/2005JD006541, 2006. a
Lee, K.-O., Flamant, C., Duffourg, F., Ducrocq, V., and Chaboureau, J.-P.: Impact of upstream moisture structure on a back-building convective precipitation system in south-eastern France during HyMeX IOP13, Atmos. Chem. Phys., 18, 16845–16862, https://doi.org/10.5194/acp-18-16845-2018, 2018. a
Lorenzo-Lacruz, J., Amengual, A., Garcia, C., Morán-Tejeda, E., Homar, V., Maimó-Far, A., Hermoso, A., Ramis, C., and Romero, R.: Hydro-meteorological reconstruction and geomorphological impact assessment of the October 2018 catastrophic flash flood at Sant Llorenç, Mallorca (Spain), Nat. Hazards Earth Syst. Sci., 19, 2597–2617, https://doi.org/10.5194/nhess-19-2597-2019, 2019. a
Louis, J.-F.: A parametric model of vertical eddy fluxes in the atmosphere, Bound.-Lay. Meteorol., 17, 187–202, https://doi.org/10.1007/BF00117978, 1979. a
Machado, L. A. T. and Chaboureau, J.-P.: Effect of Turbulence Parameterization on Assessment of Cloud Organization, Mon. Weather Rev., 143, 3246–3262, https://doi.org/10.1175/MWR-D-14-00393.1, 2015. a
Mandement, M. and Caumont, O.: Contribution of personal weather stations to the observation of deep-convection features near the ground, Nat. Hazards Earth Syst. Sci., 20, 299–322, https://doi.org/10.5194/nhess-20-299-2020, 2020. a, b
Martinet, M., Nuissier, O., Duffourg, F., Ducrocq, V., and Ricard, D.: Fine-scale numerical analysis of the sensitivity of the HyMeX IOP16a heavy precipitating event to the turbulent mixing-length parametrization, Q. J. Roy. Meteorol. Soc., 143, 3122–3135, https://doi.org/10.1002/qj.3167, 2017. a
Masson, V.: A Physically-Based Scheme For The Urban Energy Budget In Atmospheric Models, Bound.-Lay. Meteorol., 94, 357–397, https://doi.org/10.1023/A:1002463829265, 2000. a
Masson, V., Le Moigne, P., Martin, E., Faroux, S., Alias, A., Alkama, R., Belamari, S., Barbu, A., Boone, A., Bouyssel, F., Brousseau, P., Brun, E., Calvet, J.-C., Carrer, D., Decharme, B., Delire, C., Donier, S., Essaouini, K., Gibelin, A.-L., Giordani, H., Habets, F., Jidane, M., Kerdraon, G., Kourzeneva, E., Lafaysse, M., Lafont, S., Lebeaupin Brossier, C., Lemonsu, A., Mahfouf, J.-F., Marguinaud, P., Mokhtari, M., Morin, S., Pigeon, G., Salgado, R., Seity, Y., Taillefer, F., Tanguy, G., Tulet, P., Vincendon, B., Vionnet, V., and Voldoire, A.: The SURFEXv7.2 land and ocean surface platform for coupled or offline simulation of earth surface variables and fluxes, Geosci. Model Dev., 6, 929–960, https://doi.org/10.5194/gmd-6-929-2013, 2013. a
Météo-France: Portail de données publiques de Météo-France, available at: https://donneespubliques.meteofrance.fr/, last access: 20 July 2021. a
Miglietta, M. M. and Rotunno, R.: Numerical Simulations of Sheared Conditionally Unstable Flows over a Mountain Ridge, J. Atmos. Sci., 71, 1747–1762, https://doi.org/10.1175/JAS-D-13-0297.1, 2014. a
Miltenberger, A. K., Pfahl, S., and Wernli, H.: An online trajectory module (version 1.0) for the nonhydrostatic numerical weather prediction model COSMO, Geosci. Model Dev., 6, 1989–2004, https://doi.org/10.5194/gmd-6-1989-2013, 2013. a
Miniscloux, F., Creutin, J. D., and Anquetin, S.: Geostatistical Analysis of Orographic Rainbands, J. Appl. Meteorol., 40, 1835–1854, https://doi.org/10.1175/1520-0450(2001)040<1835:GAOOR>2.0.CO;2, 2001. a
Mlawer, E. J., Taubman, S. J., Brown, P. D., Iacono, M. J., and Clough, S. A.: Radiative transfer for inhomogeneous atmospheres: RRTM, a validated correlated-k model for the longwave, J. Geophys. Res.- Atmos., 102, 16663–16682, https://doi.org/10.1029/97JD00237, 1997. a
NOAA NESDIS: Remnants of Hurricanes Michael and Leslie Reach Europe, available at: https://www.nesdis.noaa.gov/content/remnants-hurricanes-michael-and-leslie-reach-europe (last access: 20 July 2021), 2018. a
NOAA NWS National Hurricane Center: Hurricane Leslie Advisory Number 69, available at: https://www.nhc.noaa.gov/archive/2018/al13/al132018.public.069.shtml (last access: 20 July 2021), 2018a. a
NOAA NWS National Hurricane Center: Hurricane Leslie Advisory Number 70, available at: https://www.nhc.noaa.gov/archive/2018/al13/al132018.public.070.shtml (last access: 20 July 2021), 2018b. a
Noilhan, J. and Planton, S.: A Simple Parameterization of Land Surface Processes for Meteorological Models, Mon. Weather Rev., 117, 536–549, https://doi.org/10.1175/1520-0493(1989)117<0536:ASPOLS>2.0.CO;2, 1989. a
Nuissier, O., Ducrocq, V., Ricard, D., Lebeaupin, C., and Anquetin, S.: A numerical study of three catastrophic precipitating events over southern France. I: Numerical framework and synoptic ingredients, Q. J. Roy. Meteorol. Soc., 134, 111–130, https://doi.org/10.1002/qj.200, 2008. a, b
Nuissier, O., Marsigli, C., Vincendon, B., Hally, A., Bouttier, F., Montani, A., and Paccagnella, T.: Evaluation of two convection-permitting ensemble systems in the HyMeX Special Observation Period (SOP1) framework, Q. J. Roy. Meteorol. Soc., 142, 404–418, https://doi.org/10.1002/qj.2859, 2016. a
Pantillon, F., Chaboureau, J.-P., and Richard, E.: Remote impact of North Atlantic hurricanes on the Mediterranean during episodes of intense rainfall in autumn 2012, Q. J. Roy. Meteorol. Soc., 141, 967–978, https://doi.org/10.1002/qj.2419, 2015. a, b
Pergaud, J., Masson, V., Malardel, S., and Couvreux, F.: A Parameterization of Dry Thermals and Shallow Cumuli for Mesoscale Numerical Weather Prediction, Bound.-Lay. Meteorol., 132, 1573–1472, https://doi.org/10.1007/s10546-009-9388-0, 2009. a
Petrucci, O., Aceto, L., Bianchi, C., Bigot, V., Brázdil, R., Pereira, S., Inbar, M., Kahraman, A., Kılıç, O., Kotroni, V., Llasat, M. C., Llasat-Botija, M., Mercuri, M., Papagiannaki, K., Řehoř, J., Rossello-Geli, J., Salvati, P., Vinet, F., and Zêzere, J. L.: EUropean Flood Fatalities (EUFF) database 1980–2018 (updated), https://doi.org/10.4121/UUID:489D8A13-1075-4D2F-ACCB-DB7790E4542F, 2020. a
Pinty, J.-P. and Jabouille, P.: A mixed-phase cloud parameterization for use in mesoscale non-hydrostatic model: simulations of a squall line and of orographic precipitations., in: Proceedings of the Conference of Cloud Physics, American Meteorological Society, 17–21 August 1998, Everett, WA, USA, 217–220, 1998. a
Préfecture de l'Aude: Communiqué de presse du 17 octobre 2018, available at: http://www.aude.gouv.fr/IMG/pdf/20181017_cp_21h00.pdf (last access: 20 July 2021), 2018. a, b
Reinecke, P. A. and Durran, D. R.: Estimating Topographic Blocking Using a Froude Number When the Static Stability Is Nonuniform, J. Atmos. Sci., 65, 1035–1048, https://doi.org/10.1175/2007JAS2100.1, 2008. a
Ricard, D.: Modélisation à haute résolution: des pluies intenses dans les Cévennes – Le système convectif des 13 et 14 octobre 1995, La Météorologie, 8, 28–38, https://doi.org/10.4267/2042/56316, 2005. a
Ricard, D., Ducrocq, V., and Auger, L.: A Climatology of the Mesoscale Environment Associated with Heavily Precipitating Events over a Northwestern Mediterranean Area, J. Appl. Meteorol. Clim., 51, 468–488, https://doi.org/10.1175/JAMC-D-11-017.1, 2012. a, b, c
Santurette, P. and Joly, A.: ANASYG/PRESYG, Météo-France's new graphical summary of the synoptic situation, Meteorol. Appl., 9, 129–154, https://doi.org/10.1017/S1350482702002013, 2002. a
Schär, C. and Wernli, H.: Structure and evolution of an isolated semi-geostrophic cyclone, Q. J. Roy. Meteorol. Soc., 119, 57–90, https://doi.org/10.1002/qj.49711950904, 1993. a
Seity, Y., Brousseau, P., Malardel, S., Hello, G., Bénard, P., Bouttier, F., Lac, C., and Masson, V.: The AROME-France Convective-Scale Operational Model, Mon. Weather Rev., 139, 976–991, https://doi.org/10.1175/2010MWR3425.1, 2011. a
Trapero, L., Bech, J., and Lorente, J.: Numerical modelling of heavy precipitation events over Eastern Pyrenees: Analysis of orographic effects, Atmos. Res., 123, 368–383, https://doi.org/10.1016/j.atmosres.2012.09.014, 2013. a
Webb, E. K., Pearman, G. I., and Leuning, R.: Correction of flux measurements for density effects due to heat and water vapour transfer, Q. J. Roy. Meteorol. Soc., 106, 85–100, https://doi.org/10.1002/qj.49710644707, 1980. a
- Abstract
- Introduction
- Case description
- Numerical simulations
- Validation of the REF simulation
- Origin of the conditionally unstable air and lifting mechanisms
- Influence of the cooling associated with the evaporation of precipitation
- Conclusions
- Appendix A: Details on the Meso-NH configuration
- Code availability
- Data availability
- Author contributions
- Competing interests
- Disclaimer
- Acknowledgements
- Review statement
- References