the Creative Commons Attribution 4.0 License.
the Creative Commons Attribution 4.0 License.
 | 27 Oct 2022
Impact of grid spacing, convective parameterization and cloud microphysics in ICON simulations of a warm conveyor belt
Anubhav Choudhary
Aiko Voigt
Warm conveyor belts are important features of extratropical cyclones and are characterized by active diabatic processes. Previous studies reported that simulations of extratropical cyclones can be strongly impacted by the horizontal grid spacing. Here, we study to what extent and in which manner simulations of warm conveyor belts are impacted by the grid spacing. To this end, we investigate the warm conveyor belt (WCB) of the North Atlantic cyclone Vladiana that occurred around 23 September 2016 and was observed as part of the North Atlantic Waveguide and Downstream Impact Experiment. We analyze a total of 18 limited-area simulations with the ICOsahedral Nonhydrostatic (ICON) model run over the North Atlantic that cover grid spacings from 80 to 2.5 km, including those of current coarse-resolution global climate models with parameterized convection, as well as those of future storm-resolving climate models with explicit convection. The simulations also test the sensitivity with respect to the representation of convection and cloud microphysics. As the grid spacing is decreased, the number of WCB trajectories increases systematically, WCB trajectories ascend faster and higher, and a new class of anticyclonic trajectories emerges that is absent at 80 km. We also diagnose the impact of grid spacing on the ascent velocity and vorticity of WCB air parcels and the diabatic heating that these parcels experience. Ascent velocity increases at all pressure levels by a factor of 3 between the 80 and 2.5 km simulations, and vorticity increases by a factor of 2 in the lower and middle troposphere. We find a corresponding increase in diabatic heating as the grid spacing is decreased, arising mainly from cloud-associated phase changes in water. The treatment of convection has a much stronger impact than the treatment of cloud microphysics. When convection is resolved for grid spacings of 10, 5 and 2.5 km, the above changes to the WCB are amplified but become largely independent of the grid spacing. We find no clear connection across the different grid spacings between the strength of diabatic heating within the WCB and the deepening of cyclone Vladiana measured by its central pressure. An analysis of the pressure tendency equation shows that this is because diabatic heating plays a minor role in the deepening of Vladiana, which is dominated by temperature advection.
- Article
(13945 KB) - Full-text XML
-
Supplement
(3039 KB) - BibTeX
- EndNote


A typical feature of extratropical cyclones are warm conveyor belts (WCBs; Wernli and Davies, 1997; Binder et al., 2016), which are coherent streams of ascending air. WCBs originate in the boundary layer of the cyclones' warm sector and ascend poleward, moving ahead of the cold front (Carlson, 1980; Joos and Wernli, 2012). During their cross-isentropic ascent to the upper troposphere, they are associated with cloud formation and precipitation generation (Browning, 1990; Madonna et al., 2014; Pfahl et al., 2014). The diabatic processes occurring within WCBs can play an important role in cyclone intensification (Binder et al., 2016). WCBs also play a key role in the vertical transport of heat, moisture and atmospheric tracers (Stohl, 2001), as well as the evolution of the large-scale circulation, including blocking events (e.g., Grams et al., 2011; Pfahl et al., 2015; Joos and Forbes, 2016). Recent studies found convective activity embedded within WCBs, leading to the rapid vertical ascent of air parcels and intensified localized diabatic heating that further modifies potential vorticity, cyclone strength and the jet stream (Martinez-Alvarado et al., 2014; Rasp et al., 2016; Oertel et al., 2019, 2020; Blanchard et al., 2020, 2021; Mazoyer et al., 2021). Finally, WCBs modulate cloud-radiative effects and the extratropical radiation budget (Joos, 2019).
An adequate representation of WCBs in models and the diabatic processes within them is crucial for accurate predictions of extratropical cyclones at the weather timescale and might also be needed in climate models for adequate simulations of extratropical cyclones and their response to climate change (Flack et al., 2021). However, at the current resolutions of weather and climate models, diabatic processes within WCBs occur below the grid scale and need to be parameterized. This in particular includes convection and cloud processes that despite decades of model development have remained a primary source of model biases and model uncertainty in projections of climate change (Randall et al., 2003; Jakob, 2010; Palmer and Stevens, 2019), hindering the development of regional adaptation strategies to global climate change.
Acknowledging the limitations of coarse-resolution global models and given the long history of unsuccessful attempts to solve the convection parameterization challenge, modeling centers around the world have started to develop storm-resolving models at the global scale in which horizontal grid spacing is reduced to a few kilometers so that the most rigorous aspects of deep convective motions in the atmosphere can be simulated directly and the parameterization for deep convection can be turned off (Satoh et al., 2019; Stevens et al., 2019, 2020). By refining the grid spacing and treating deep convection in an explicit manner, it is hoped and in fact often reported that simulations of climate improve. For example, Senf et al. (2020) found that in the ICOsahedral Nonhydrostatic (ICON) model, refining the grid spacing to storm-resolving scales of 2.5 km and representing deep convection explicitly leads to marked improvements in simulated top-of-atmosphere cloud-radiative effects over the North Atlantic. Vergara-Temprado et al. (2020) found notable improvements in precipitation and the diurnal cycle for year-long simulations of European climate in fine-resolution models with explicit deep convection.
There is hence reason to hope that the extratropical circulation improves in a similar manner in storm-resolving models. Model simulations of extratropical cyclones have often reported a strong sensitivity with respect to horizontal grid spacing (Champion et al., 2011; Jung et al., 2006; Willison et al., 2015). In particular, a finer grid spacing tends to lead to more intense cyclones (e.g., Chang and Fu, 2003; Jung et al., 2006; Colle et al., 2013; Eichler et al., 2013). Willison et al. (2013) suggested that the resolution sensitivity arises from a positive feedback between latent heating and cyclone strength, indicating that an inaccurate representation of moist processes and their associated latent heating can significantly affect simulations of storm tracks and the larger-scale circulation of the extratropics. These findings are of concern when simulating the future climate, as in a warmer atmosphere the combined effects of altered meridional temperature gradients and mesoscale latent heating complicate the warming response of extratropical storm tracks (Ulbrich et al., 2008, 2009).
With global storm-resolving models coming into application, we find it important to understand how the grid spacing and the representation of convection and microphysical processes affect simulations of extratropical cyclones, their WCBs and the diabatic processes associated with them. A number of recent studies have started to look into this question. Flack et al. (2021) investigated how a decrease in the grid spacing from 150 to 50 km affects diabatic processes and the intensification of extratropical cyclones and concluded that the relative importance of diabatic heating remains unchanged, and model improvement equally results from a better representation of dynamics. Wimmer et al. (2022) and Rivière et al. (2021) found that the representation of deep convection substantially affects diabatic processes, the WCB activity and the vertical structure of the jet stream. In particular, Rivière et al. (2021) showed that WCB ascents are quick and abrupt with explicit deep convection but slow and long-lived for parameterized deep convection. Mazoyer et al. (2021) highlighted the impact of cloud microphysics on WCB and associated upper-level dynamics.
However, we are not aware of a study that systematically addresses how the simulation of WCBs changes as the grid spacing is decreased from current coarse values of around 100 km to storm-resolving values of a few kilometers. We here address this question by means of a cyclone case study from the NAWDEX field campaign (Schäfler et al., 2018). We study the NAWDEX cyclone named Vladiana that occurred during 22–25 September 2016, over the North Atlantic and whose WCB was well developed (Oertel et al., 2019, 2020). We analyze a suite of simulations of Vladiana with the ICON model (Zängl et al., 2015) in a limited-area setup over a large North Atlantic domain at six horizontal grid spacings ranging from 80 to 2.5 km. The simulations are performed with one-moment and two-moment bulk cloud microphysics, and the simulations at 10, 5 and 2.5 km are performed with parameterized and explicit convection. As such, we also study the impacts of the representation of convection and cloud microphysics and how these impacts might change with the grid spacing.
We address the following questions:
-
How do horizontal grid spacing, the treatment of convection and the treatment of cloud microphysics affect the simulation of the WCB associated with cyclone Vladiana?
-
How sensitive is diabatic heating within the WCB to these modeling choices?
-
Do the sensitivities of the WCB diabatic processes affect the deepening of cyclone Vladiana?
The paper is organized in the following order. Section 2 describes the model simulation and analysis methods. This is followed by an analysis of the WCB and diabatic processes in Sect. 3 and an analysis of the impact of diabatic processes on the deepening of the cyclone by means of the pressure tendency equation in Sect. 4. The paper concludes with a summary of the main findings in Sect. 5.
2.1 Model simulations
We analyze simulations of the North Atlantic extratropical cyclone Vladiana. Vladiana occurred during the NAWDEX field campaign in fall 2016 (Schäfler et al., 2018) and exhibited a pronounced WCB. Oertel et al. (2019, 2020) studied this case using the COSMO model to understand the convective processes embedded within the WCB and their impact on the large-scale circulation. Here, we use the atmospheric component of the ICON modeling system to study in detail the diabatic processes within the WCB as represented by ICON.
We apply ICON version 2.1.00 in limited-area setup with the physics package for numerical weather prediction (Zängl et al., 2015). The simulations are run for 4 d in September 2016, starting on 22 September 2016 at 00:00 and ending on 26 September 2016 at 00:00 (all times given in UTC). The simulation domain covers the North Atlantic, as well as much of Europe and northern Africa (23–80∘ N, 78∘ W–40∘ E; see Fig. 3 of Stevens et al., 2020). This ensures that the simulations include the entire temporal and spatial extent of Vladiana. The simulations are initialized with analysis data from the ECMWF IFS (Integrated Forecasting System) at around 9 km horizontal grid spacing, which is the highest available resolution. Lateral boundary data are updated every 3 h and again taken from ECMWF IFS at 9 km grid spacing. At 00:00 and 12:00 UTC, ECMWF IFS analysis data are available and used as lateral boundary data. In between the analysis steps, ECMWF IFS forecast data at 3, 6 and 9 h lead times are used. Therefore the model stays close to the actual large-scale meteorology over the simulation period. The simulations analyzed here are a subset of those analyzed by Senf et al. (2020). For further details regarding the model setup, readers are referred to Senf et al. (2020), who evaluated the simulation in terms of clouds and top-of-atmosphere cloud-radiative effects.
Six horizontal grid spacings are considered: 80, 40, 20, 10, 5 and 2.5 km. For all simulations, 75 model levels are used. For the 80, 40 and 20 km simulations, convection is parameterized based on the mass flux schemes for shallow and deep convection of Tiedtke (1989) and Bechtold et al. (2008). For the three finest grid spacings of 10, 5 and 2.5 km we analyze simulations in which convection is parameterized, as well as simulations in which convection is represented explicitly; i.e., the deep and shallow convection schemes are disabled. The simulations with explicit convection are distinguished by “EC” in the following.
All simulations are available for both one- and two-moment cloud microphysics, which are based on Doms et al. (2005) and Seifert and Beheng (2006), respectively. The one-moment scheme includes the specific mass of water vapor, cloud liquid, cloud ice, rain, snow and graupel, with graupel being relevant for the explicit simulation of deep convection (Baldauf et al., 2011). The two-moment scheme in addition includes the number concentration of the aforementioned hydrometeor species and includes hail. The one-moment scheme is used in operational forecasts of the German weather service (DWD). The two-moment scheme has been developed for simulations with grid spacings of a few kilometers and explicit convection. We here apply the two-moment scheme also for simulations with coarser grid spacings and parameterized convection. Although this is not recommended (Prill et al., 2020), these simulations corroborate our finding that the treatment of cloud microphysics has a minor effect on our results.
In total, we analyze a suite of 18 simulations. For each of the two microphysics schemes, nine simulations are available: six for the different grid spacings from 80 to 2.5 km and parameterized convection, as well as three additional simulations with explicit convection run at 10, 5 and 2.5 km.
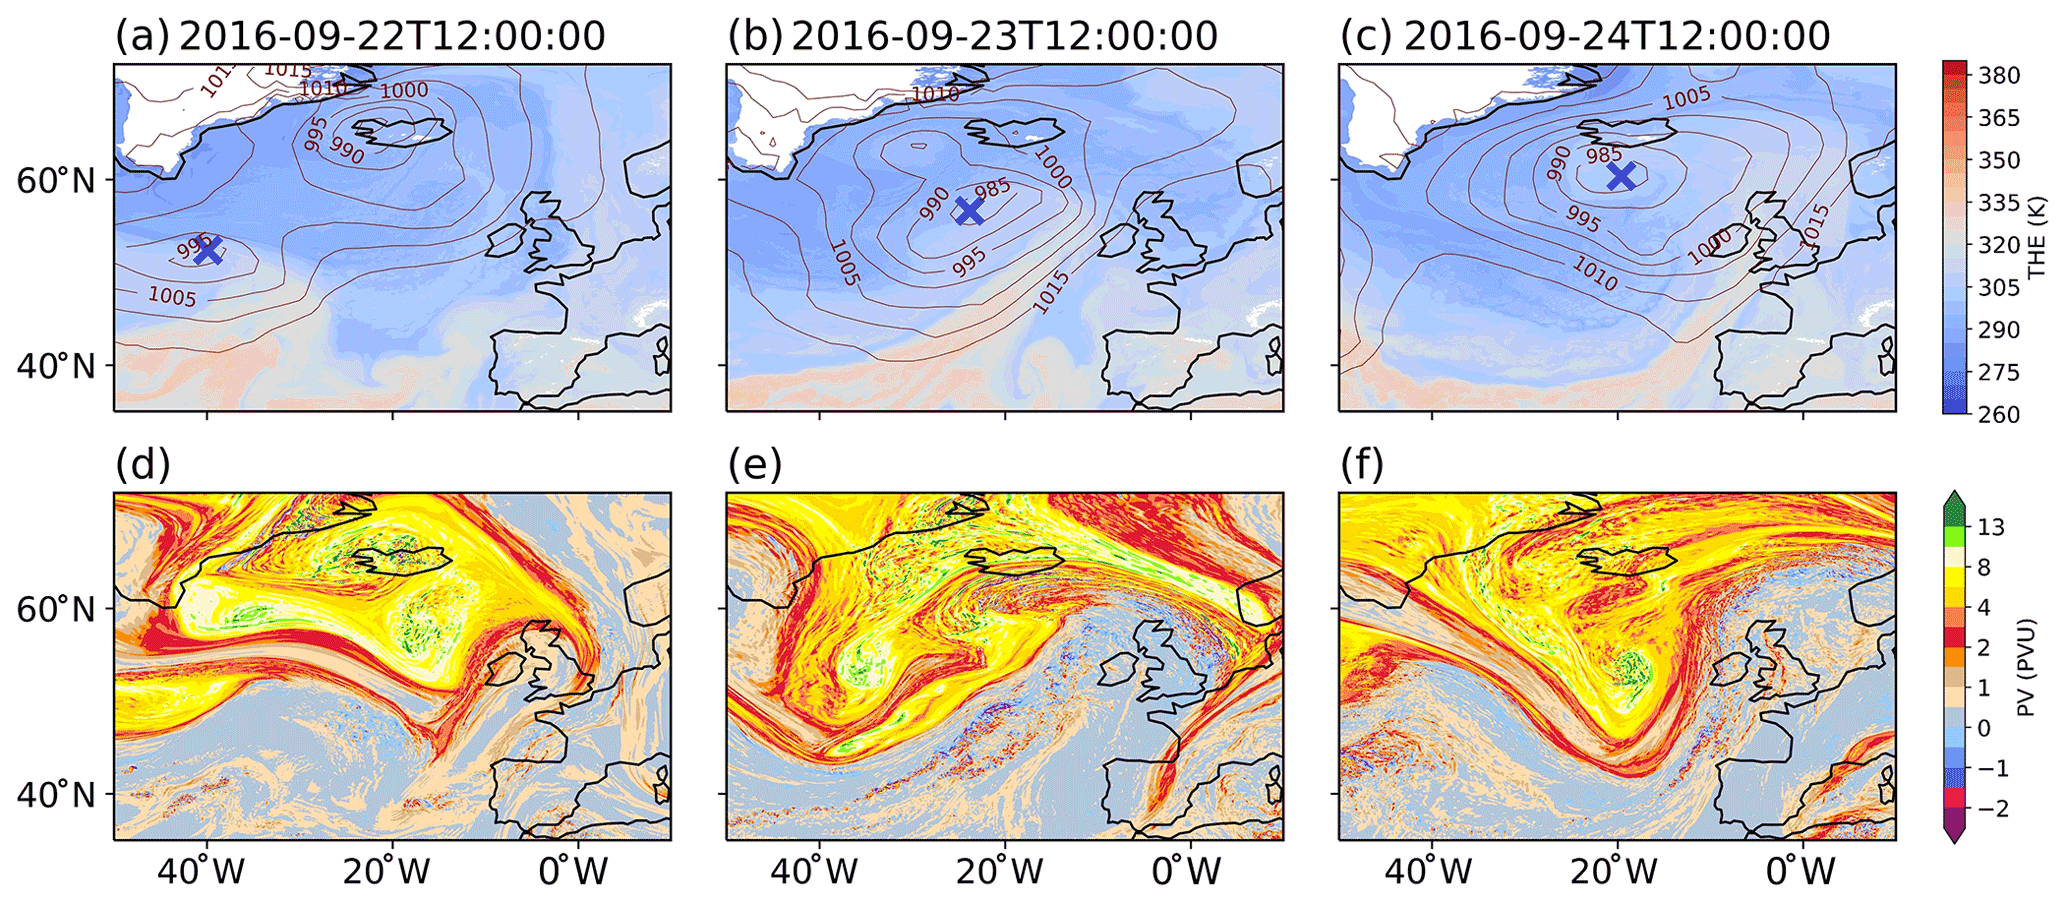
Figure 1Synoptic evolution of cyclone Vladiana from 22 September 2016 at 12:00 to 24 September 2016 at 12:00. (a–c) Equivalent potential temperature (THE) at 850 hPa (color shading) and mean sea level pressure (contour lines, units of hPa). The cyclone position as given by the minimum sea level pressure is shown by the blue cross. (d–f) Potential vorticity (PV) on the 320 K isentrope. The figure is based on the 2.5 km EC simulation with one-moment cloud microphysics. For PV the same color scale is used as in Fig. 2 of Oertel et al. (2020) for easier comparison.
2.2 Synoptic development of cyclone Vladiana
Figure 1 provides an overview of the simulated synoptic evolution of cyclone Vladiana based on the 2.5 km EC simulation with one-moment cloud microphysics. Vladiana intensified during 22 and 23 September 2016. In the beginning, on 22 September 2016 at 12:00, an upper-level positive potential vorticity (PV) anomaly occurred around 60∘ N in a strong baroclinic zone. On 23 September 2016 at 12:00, 24 h later, the cyclone had intensified and deepened to a minimum sea level pressure of below 980 hPa (exact values depend on the model setup; see Fig. 9). At this time, the upper-level PV distribution formed a strong elongated ridge that was aligned with the warm front of the cyclone, with low PV values in a broad region over the British Isles and west of it. Distinct surface cold and warm fronts during this time were evident in the 850 hPa equivalent potential temperature field (Fig. 1b). In the next 24 h, the cyclone moved further northwards while keeping its strength.
The simulated evolution agrees well with the synoptic evolution described by Oertel et al. (2019) based on ECMWF data (their Fig. 2) and the PV evolution described in Oertel et al. (2020) based on simulations with the COSMO model (their Fig. 2). Moreover, Senf et al. (2020) showed that the ICON simulations are in good agreement with the spatial pattern of the WCB cloud band derived from satellites (their Fig. 2). In summary, the simulations analyzed here capture the overall evolution of cyclone Vladiana and the associated cloud fields.
2.3 Computation of WCB trajectories
To investigate the diabatic processes occurring within the WCB, we perform Lagrangian trajectory analyses for all 18 simulations using LAGRANTO (Sprenger and Wernli, 2015) and hourly model output. LAGRANTO requires input data on a regular latitude–longitude grid. We therefore remap the model output from the ICON triangular grid to a regular latitude–longitude grid using conservative remapping implemented in the Climate Data Operators (Schulzweida, 2019). The regular grid corresponds to the grid spacing of the associated ICON grid. For the 80, 40, 20, 10, 5 and 2.5 km simulations, the model output is remapped to regular grids with a longitudinal and latitudinal spacing of 0.8, 0.4, 0.2, 0.1, 0.05 and 0.025∘, respectively. Based on remapped fields of wind and pressure, 48 h forward-running trajectories beginning on 22 September 2016 at 00:00 are calculated. The trajectories are started at 14 equally spaced pressure levels between 1050 and 790 hPa in a seeding region near the warm sector of the cyclone (35–60∘ N, 45–0∘ W), where the seeding region is defined based on the WCB starting positions identified from ECMWF offline trajectories by Oertel et al. (2019) (their Fig. 1). The seeding points are based on the 20 km grid; their total number is 395 825. All simulations use the same seeding points, allowing us to compare the number of trajectories across grid spacings and model physics. The approach provides good sampling of the WCB while limiting the number of trajectories to a practicable amount, especially for the 2.5 km simulations. After the trajectories are calculated, the WCB trajectories are selected as those with an ascent larger than 600 hPa within 48 h (Wernli and Davies, 1997), and the variables of interest are traced along them.
Two methodological choices should be pointed out. First, trajectories are seeded only once at the starting time step; therefore there is only one trajectory starting from each seeding point. We found this to be sufficient to sample the evolution of the WCB in time and space, as some trajectories ascend earlier and some trajectories ascend later in the considered 48 h period. This is illustrated Fig. S1 in the Supplement. Second, we use offline trajectories. This was necessary as ICON NWP (numerical weather prediction) in version 2.1.00 does not include the capacity for online trajectories. Because the offline trajectories are calculated by hourly instantaneous wind fields and the convective updrafts are short-lived and sparse, our analysis emphasizes the slantwise ascent of the WCB trajectories, similar to the offline trajectories calculated by Oertel et al. (2019) from ECMWF IFS data (their Fig. 2). The slantwise character is illustrated in Fig. S2, which shows that the region of strong updrafts is unpopulated except for a few trajectories for the finest grid spacings and explicit convection. However, because slantwise-ascending trajectories represent the majority for Vladiana (Oertel et al., 2019), we expect our analysis to sample the mean diabatic processes within the WCB in an adequate manner.
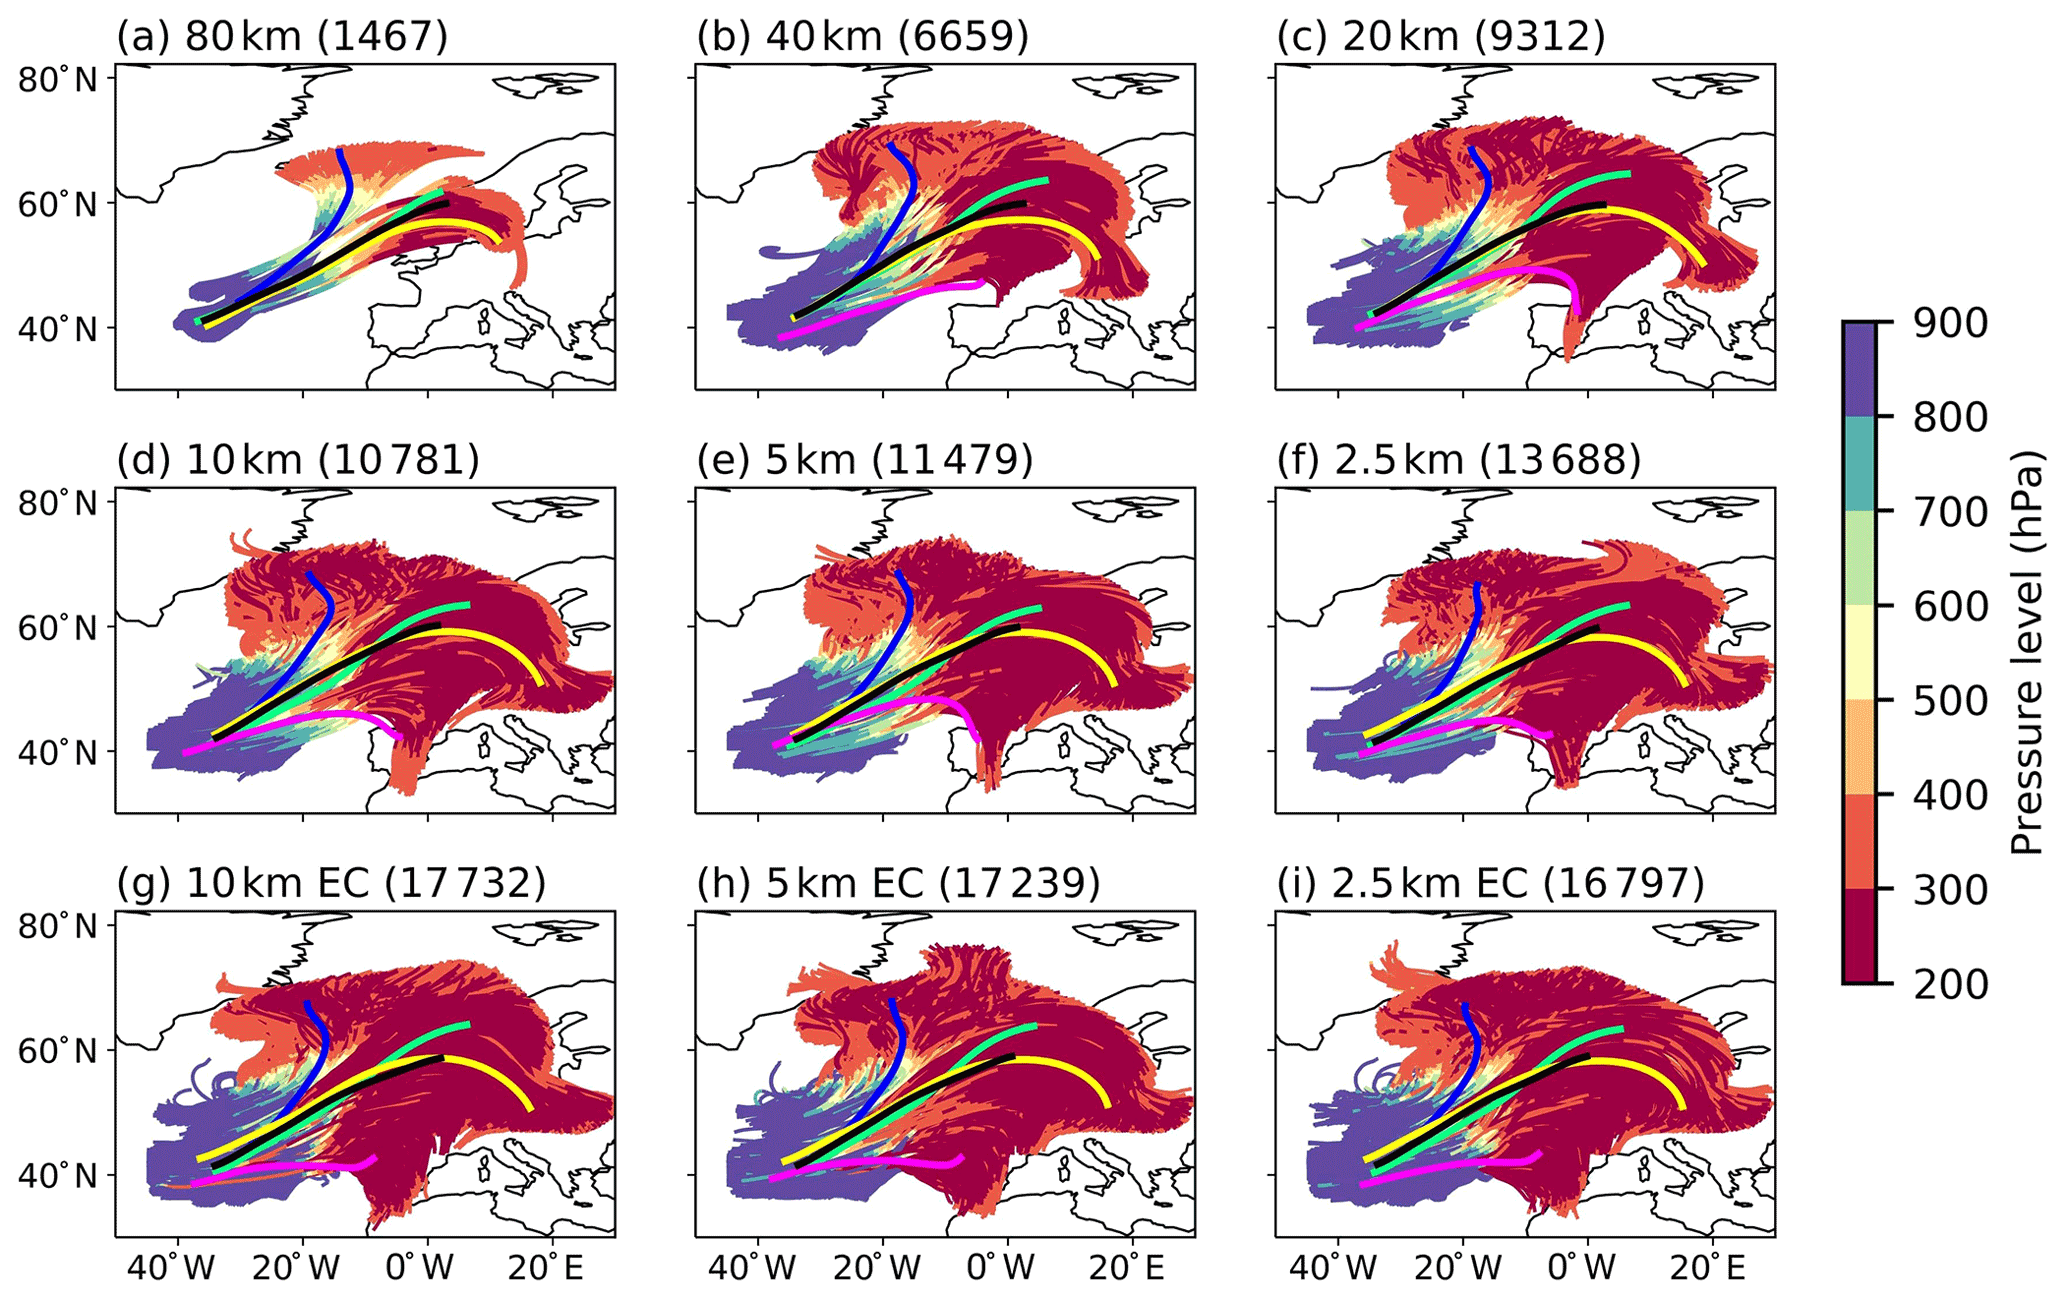
Figure 2WCB trajectories identified from 48 h forward trajectories depending on horizontal grid spacing. The lower row (g–i) shows simulations for explicit convection (indicated by EC). The number in the brackets gives the number of WCB trajectories. Trajectories are colored according to their pressure level. The thick colored lines represent the mean path of different subclasses of trajectory, namely Trajectory 1 (blue), Trajectory 2 (green), Trajectory 3 (yellow) and Trajectory 4 (magenta). The mean of all trajectories is shown in black. All simulations use the one-moment cloud microphysics.
2.4 Diabatic heating
The atmospheric physics package of ICON contains various schemes to represent subgrid-scale diabatic processes and their impact on the resolved circulation. A detailed description of the formulation of diabatic processes is provided in the ICON tutorial (Prill et al., 2020). For the purpose of our study, the temperature tendencies due to diabatic processes are most important, i.e., the diabatic heating rates (DHRs). In ICON, DHRs result from microphysical processes (including saturation adjustment), radiation interaction, turbulence, parameterized convection, horizontal diffusion, and drag from subgrid-scale orography and non-orographic gravity waves. In our simulations total DHR and its individual components are diagnosed online during the model run. DHR from horizontal diffusion and subgrid-scale orography and non-orographic gravity waves is found to be small and thus not shown separately. DHR from water phase changes, i.e., latent heating, can occur as part of the microphysics scheme, most notably via the saturation adjustment, as well as in the convection scheme (where it leads to convective precipitation). Total DHR and its components are written out every 1 h as instantaneous values. Joos and Wernli (2012) showed that instantaneous values provide a good approximation of DHR accumulated over 1 h.
Motivated by the work of Schäfer and Voigt (2018) on the cloud-radiative impact on an idealized extratropical cyclone, we also diagnose DHR from cloud–radiation interaction. Cloud-radiative heating is computed by means of all-sky and clear-sky radiative fluxes as
where ρ is air density, cv is the specific heat capacity of air at constant volume, and F is the net radiative flux in all-sky (with clouds) and clear-sky (without clouds) conditions, respectively. Clear-sky fluxes are diagnosed by an additional diagnostic radiative transfer calculation with the cloud fraction set to zero. Radiative flux divergence is converted to radiative heating using cv instead of cp because ICON uses isochoric coupling between its physics parameterizations and its dynamical core (Prill et al., 2020).
We first study WCB trajectories across model setups in terms of their number, subclasses and mean ascent characteristics in Sect. 3.1. We then study the evolution of diabatic heating along the trajectories in more detail in Sect. 3.2.
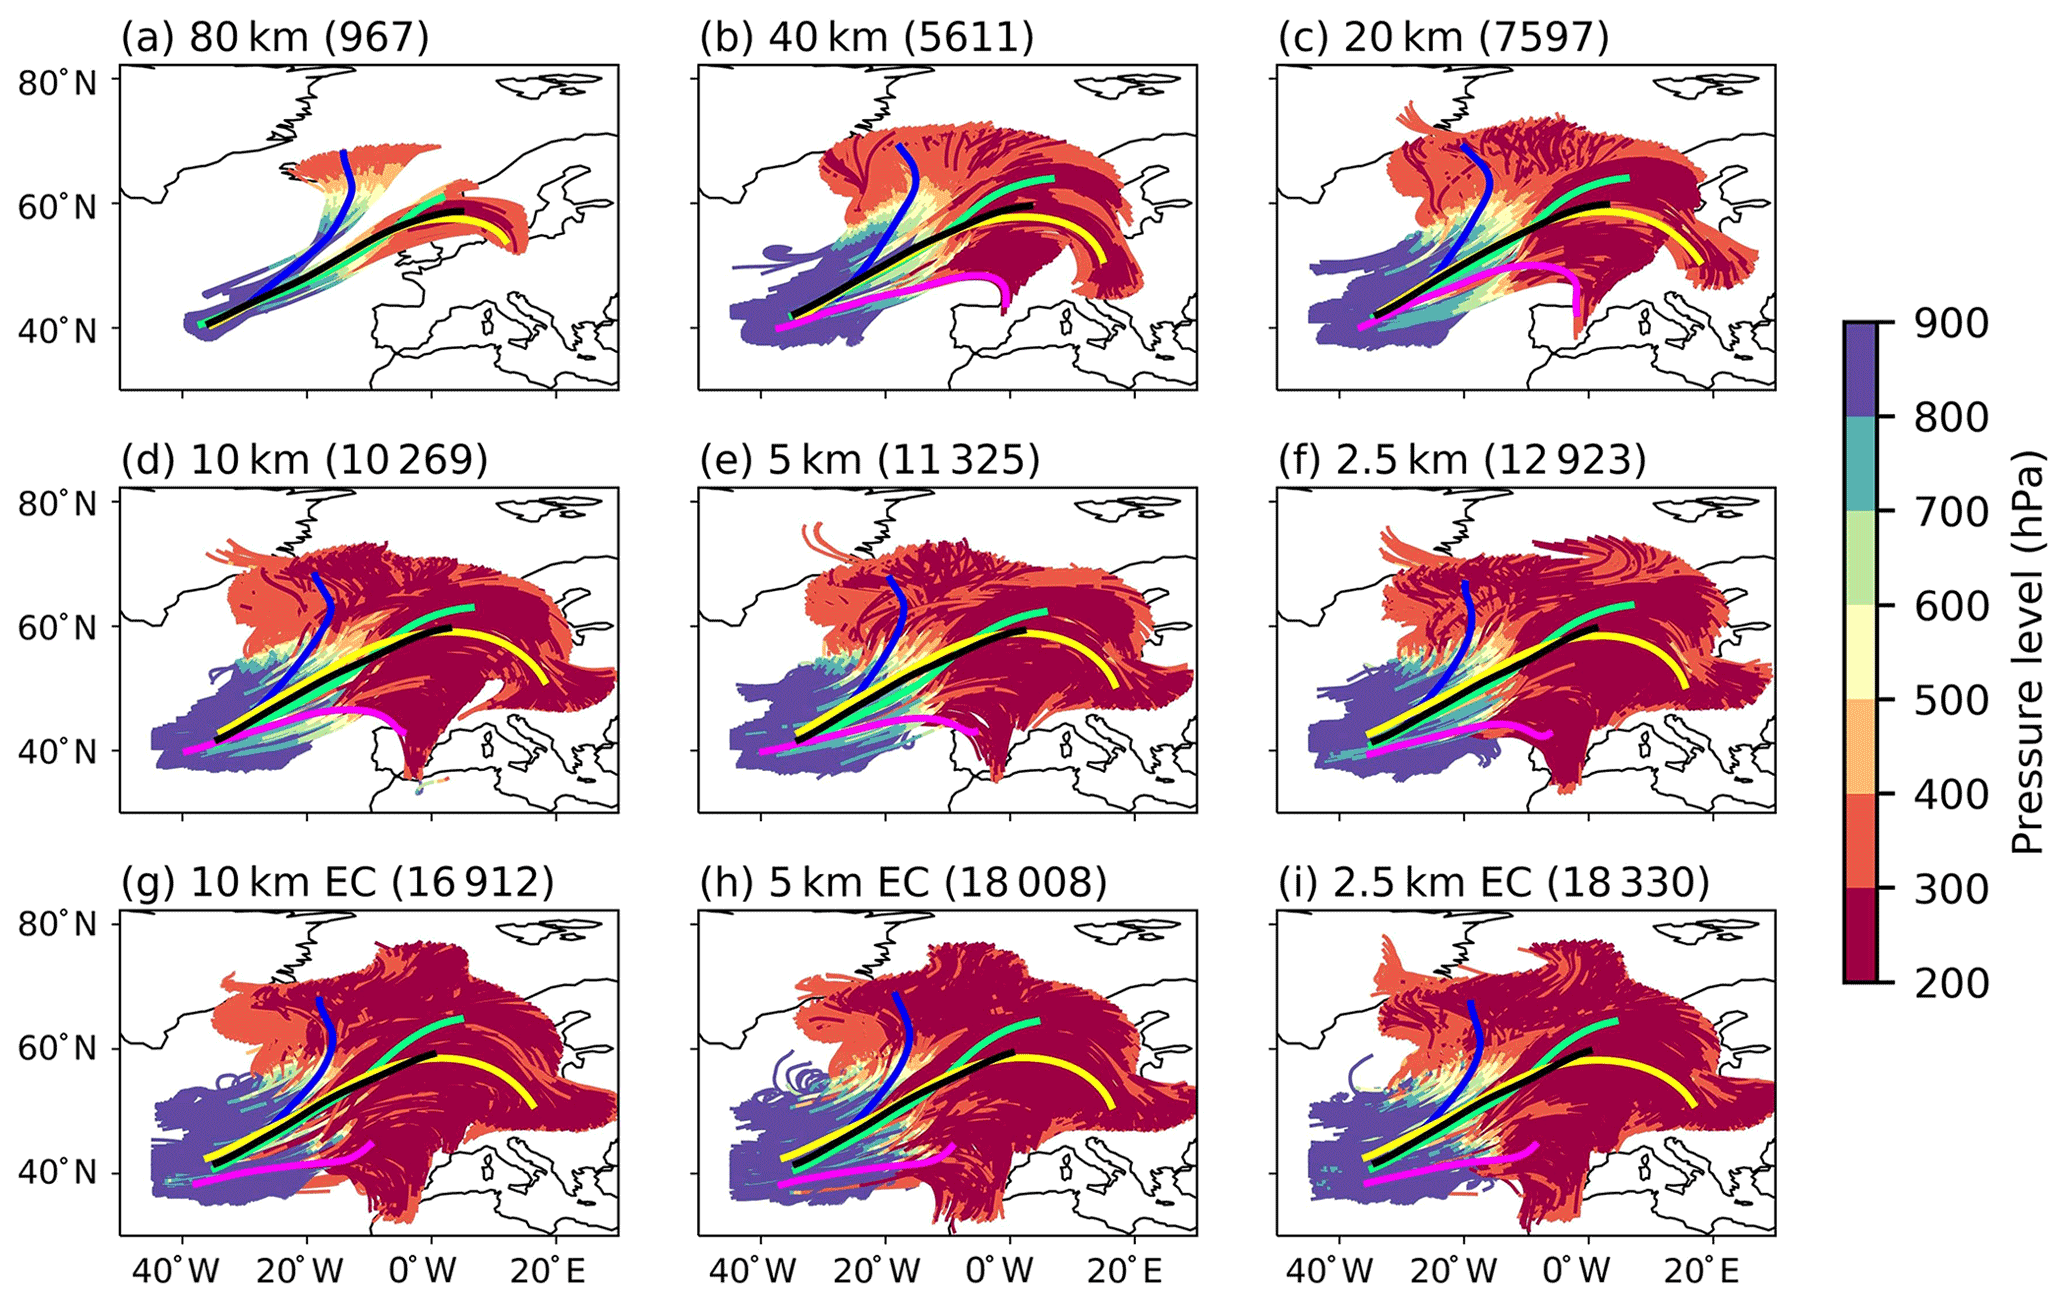
Figure 3Same as Fig. 2 but for the simulations with two-moment cloud microphysics.
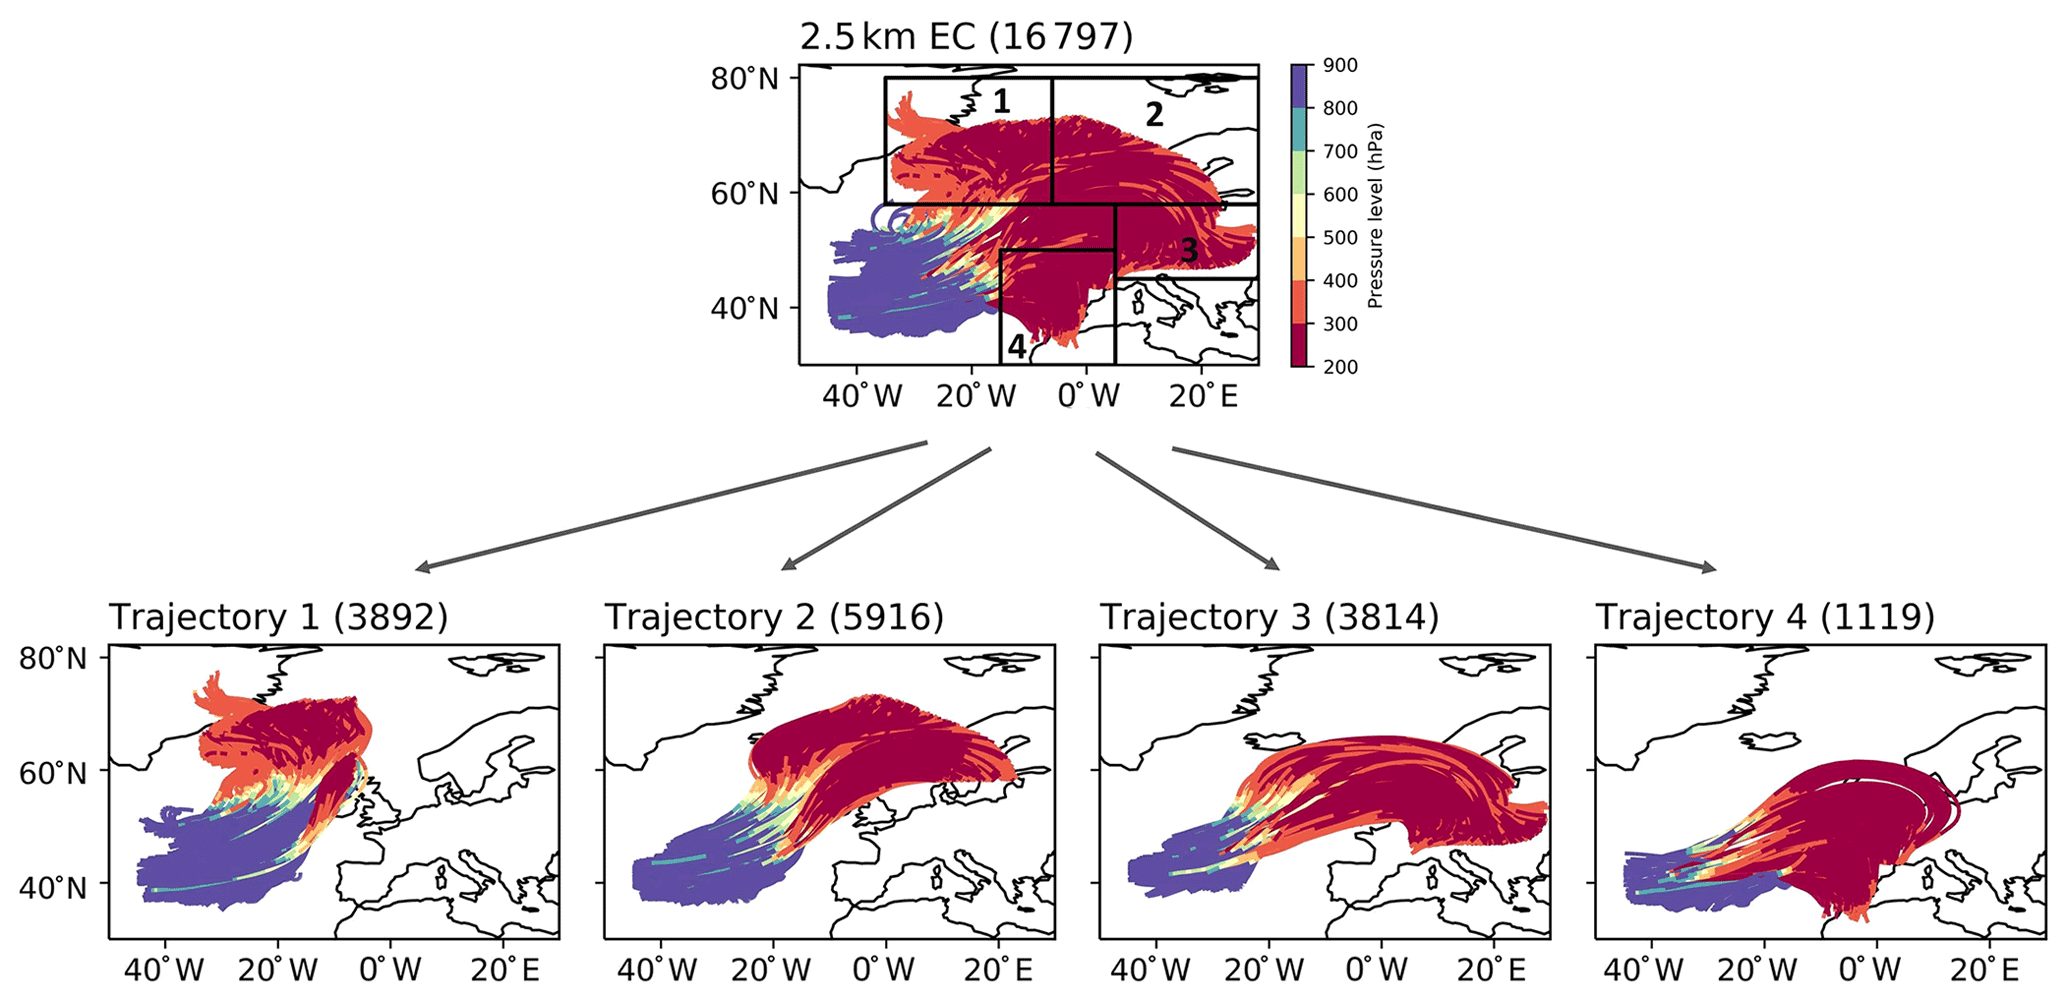
Figure 4Separation of WCB trajectories into four subclasses. An example is shown here for the 2.5 km EC simulation with one-moment cloud microphysics. The trajectories are clustered based on their final location. The regions are defined as latitude–longitude boxes shown in the top figure. Their spatial extent is as follows. Trajectory 1: 60–80∘ N, 35–6∘ W; Trajectory 2: 58–80∘ N, 6∘ W–30∘ E; Trajectory 3: 47–56∘ N, 5–30∘ E; Trajectory 4: 30–50∘ N, 20∘ W–0∘ E.
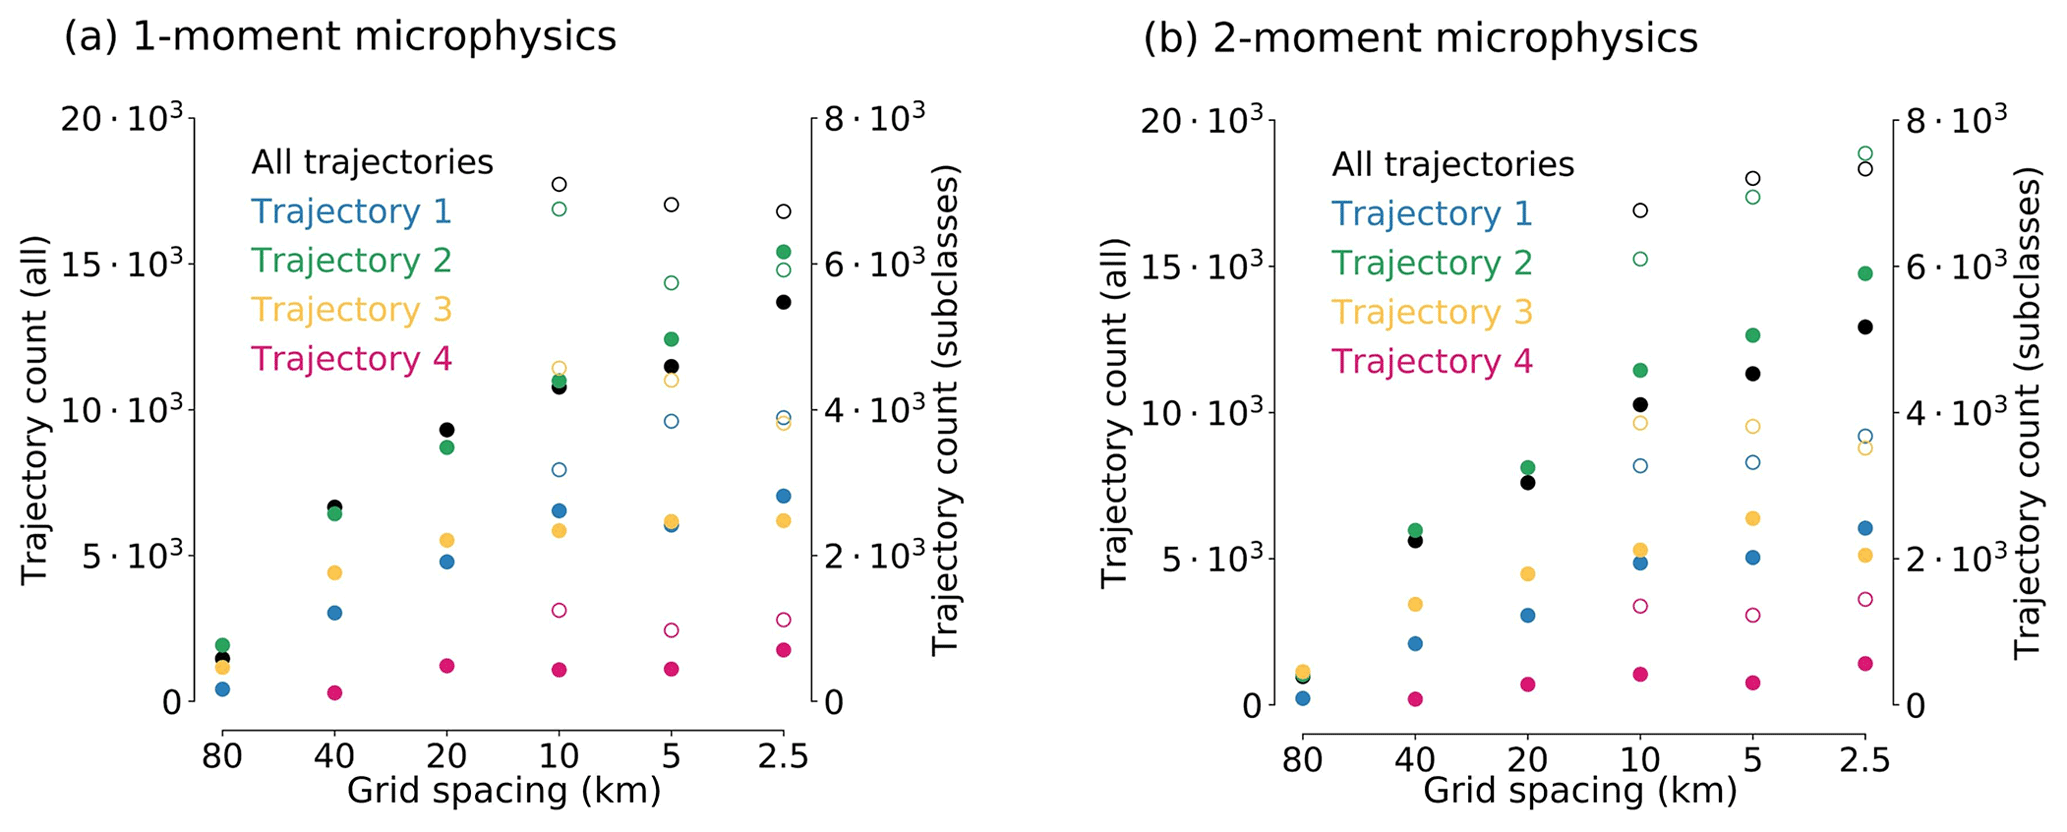
Figure 5(a) Number of WCB trajectories as a function of horizontal grid spacing. The total number of trajectories is shown in black, with values given by the left y axis. The number of trajectories in the four subclasses is shown in colors, with values given by the right y axis. Filled and open markers correspond to parameterized and explicit convection, respectively. Panel (a) is for one-moment microphysics and panel (b) for two-moment microphysics.
3.1 Number, subclasses and mean ascent properties
As described by Oertel et al. (2019), the ascending region of the WCB was located around 40–50∘ N and 40–10∘ W in the warm sector of the cyclone. This can be inferred from the maps of potential temperature shown in Fig. 1a–c and WCB trajectories calculated for our ICON simulations shown in Figs. 2 and 3. Our simulations capture the multiple outflow branches of the WCB, i.e., its dichotomous nature (Martinez-Alvarado et al., 2014). About three-quarters of the WCB trajectories turn anticyclonically into the downstream upper-level ridge. A smaller fraction, about one-quarter, of the trajectories form a cyclonic branch that wraps around the center of the cyclone. The split into different classes of trajectories will be analyzed further below by means of Figs. 4 and 5.
Figures 2 and 3 also illustrate how the WCB trajectories change depending on grid spacing and the treatment of convection and microphysics. The WCB strength – measured by the number of identified WCB trajectories – differs considerably across grid spacings. The number of trajectories increases substantially as the grid spacing is decreased. In fact, around 10 times more trajectories are identified at 2.5 km than at 80 km (Figs. 2a–f and 3a–f). When convection is treated explicitly, the number of trajectories increases further and is 50 % higher compared to simulations that use the same grid spacing but parameterized convection (Figs. 2g–i and 3g–i). When convection is explicit at grid spacings of 10, 5 and 2.5 km, the number of trajectories becomes largely independent of the grid spacing and varies by only 5 %, indicating convergence with respect to grid spacing. This convergence is not found when convection is parameterized. Comparing Figs. 2 and 3 shows that the treatment of microphysics has no substantial impact. Overall, we find that the WCB becomes more pronounced as the grid is refined and convection is treated explicitly, while microphysics has no marked impact.
Another finding from Figs. 2 and 3 is that the WCB consists of several subclasses of trajectories that differ in terms of their direction and ascent pattern. To investigate this further, we separate the WCB trajectories into four subclasses based on their final location. We refer to these subclasses as Trajectory 1, Trajectory 2, Trajectory 3 and Trajectory 4. Figure 4 presents an example of the separation for the 2.5 km EC simulation with one-moment cloud microphysics. In Figs. 2 and 3, the mean trajectory of each subclass is included as a colored line. Trajectory 1 corresponds to the cyclonic branch of the WCB, whereas trajectories 2, 3 and 4 belong to the anticyclonic branch.
Figure 5 depicts the number of trajectories in each subclass, as well as the total number of trajectories as a function of grid spacing. The largest contribution stems from the anticyclonically turning subclass Trajectory 2, which contributes about 50 % to the total number of trajectories. The subclasses Trajectory 3 and Trajectory 1 contribute about equally. The subclass Trajectory 4 contributes relatively little and is absent for the 80 km grid spacing. For parameterized convection, the number of trajectories for each subclass increases as the grid spacing is decreased from 80 to 10 km. For finer grids, however, the number of trajectories in the subclasses 1, 3 and 4 has in fact converged, and only the number of trajectories in subclass 2 increases further. The increase results from trajectories that start their ascent during the mature stage of cyclone Vladiana on 23 September 2016 at around 18:00 (see Fig. S2). Consistent with Figs. 2 and 3 the impact of microphysics is weak.
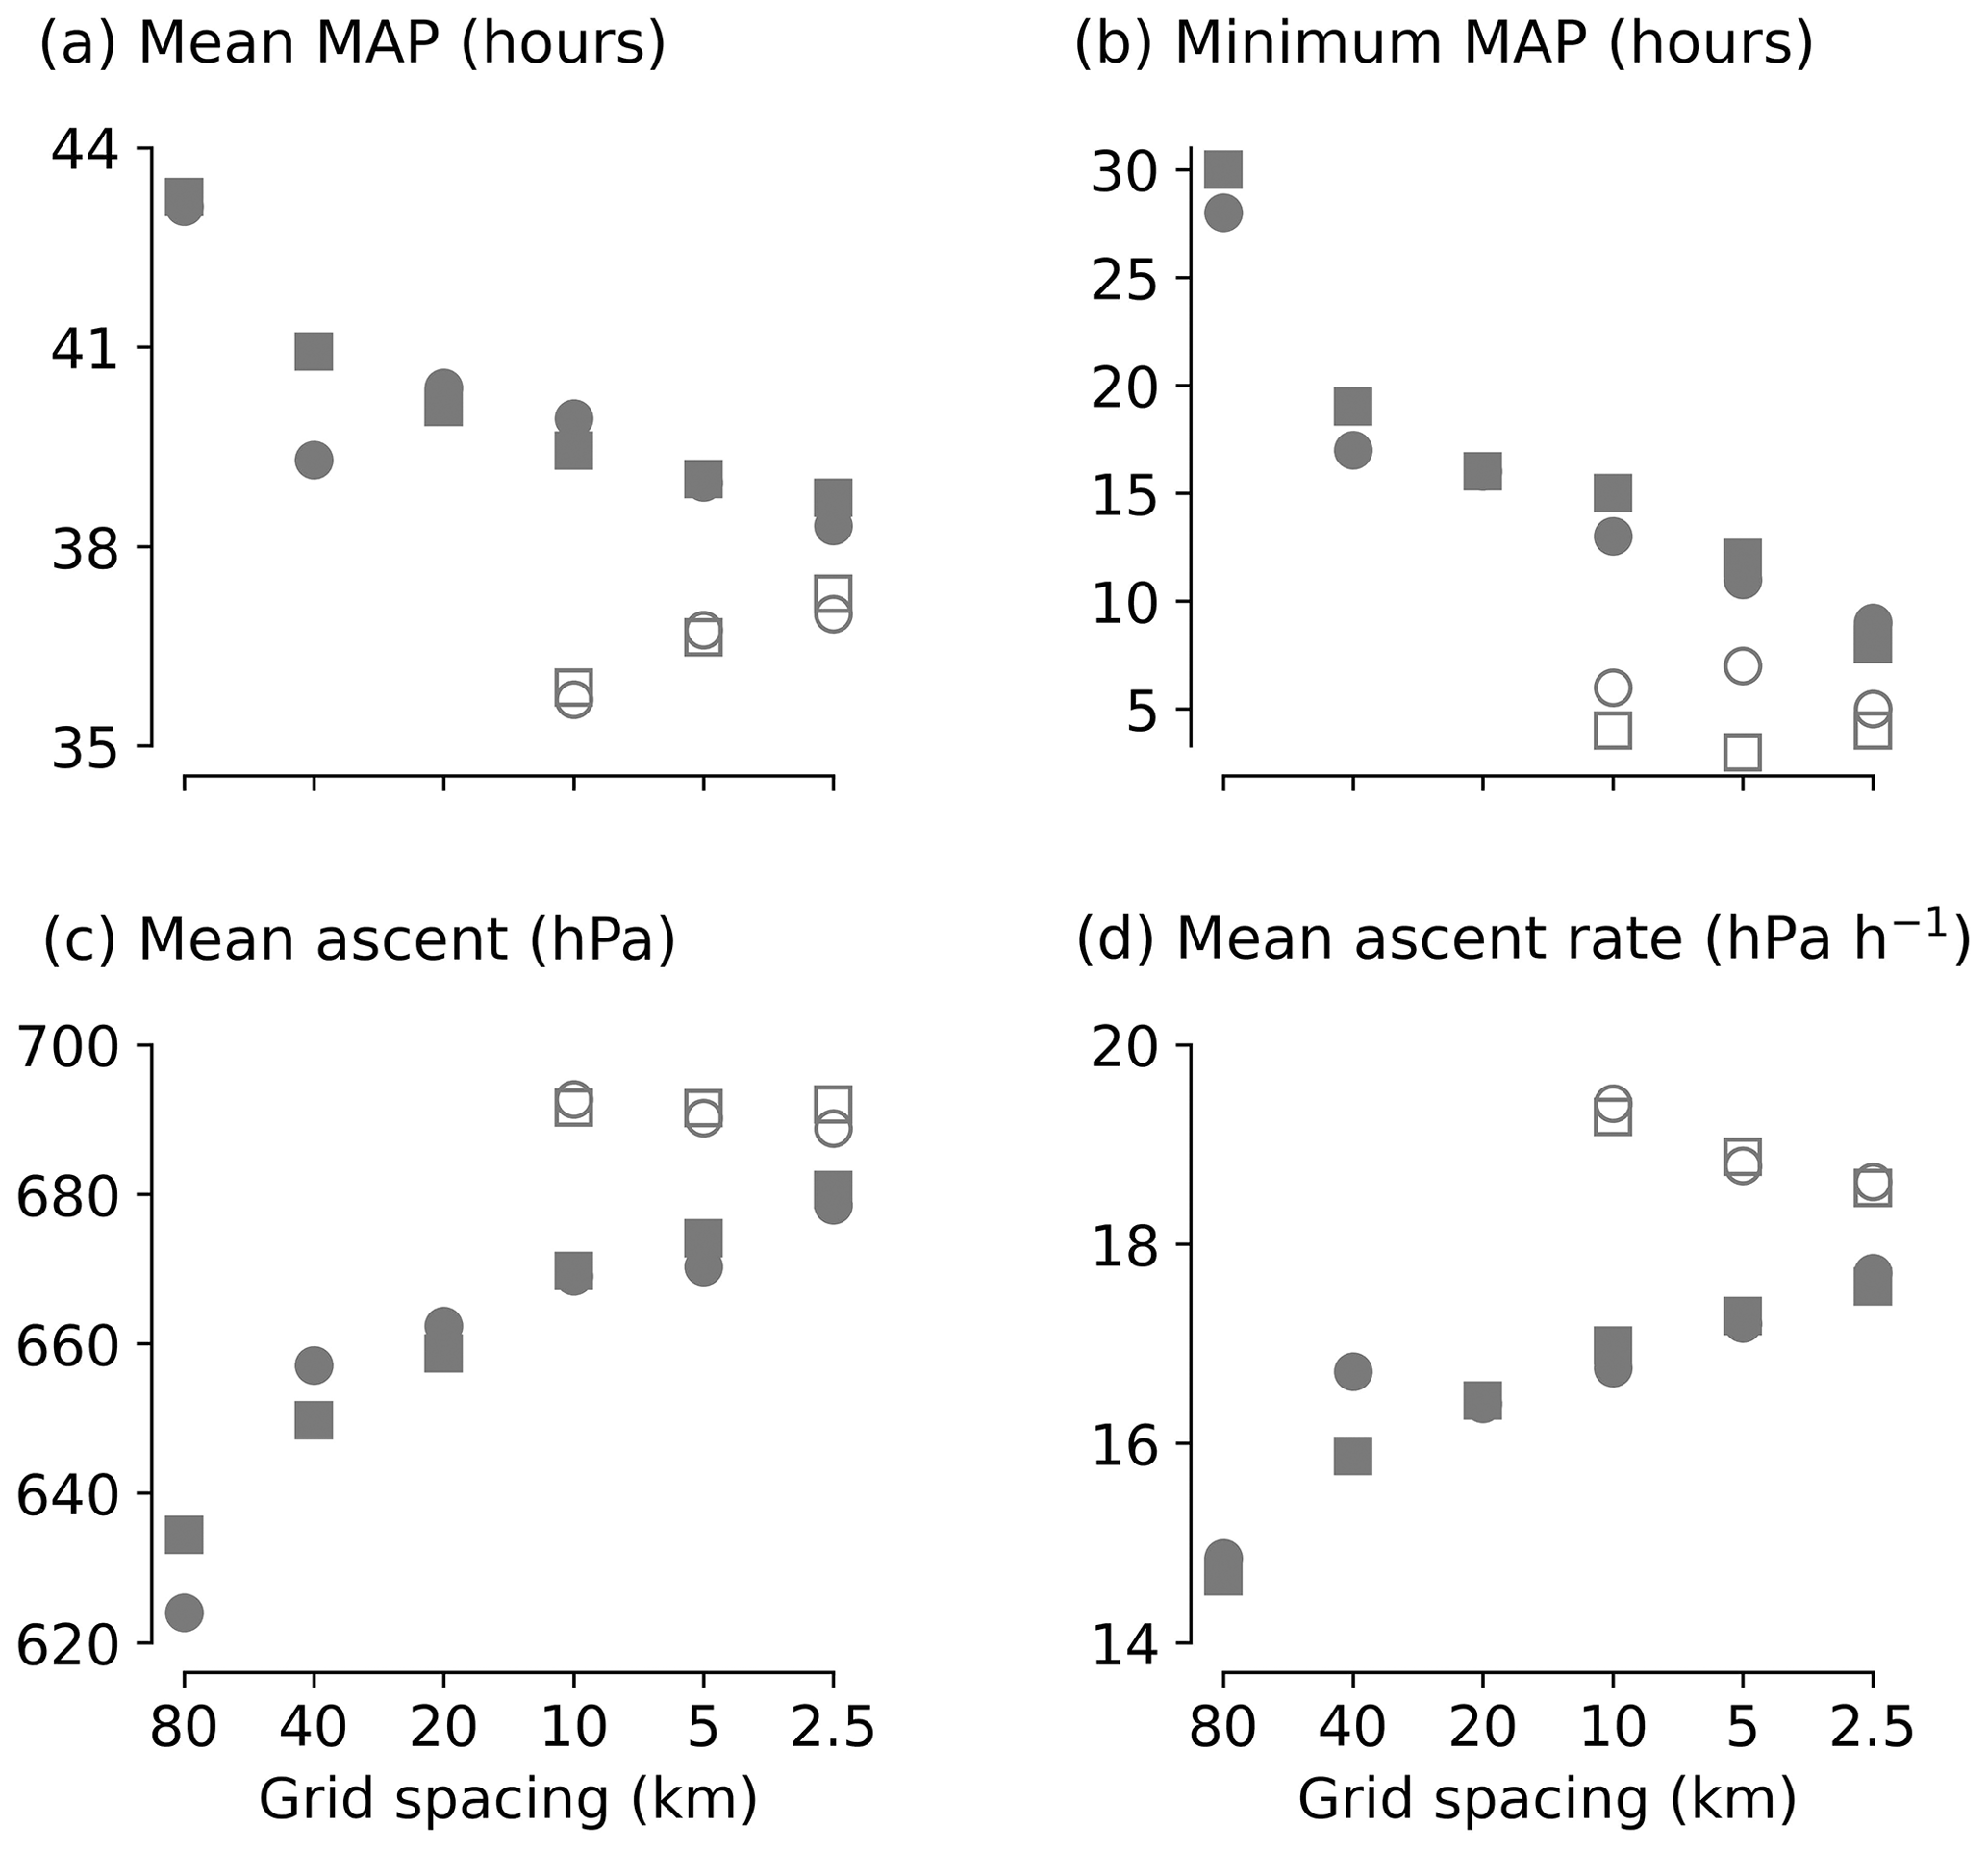
Figure 6Statistics of the main ascent period (MAP) as a function of horizontal grid spacing. The filled and empty markers represent parameterized and explicit convection, respectively, while circle and square markers represent one- and two-moment cloud microphysics.
We quantify the impact of grid spacing on the ascent dynamics of the WCB air parcels by analyzing the main ascent period (MAP) in Fig. 6. MAP is defined as the period during which the actual ascent occurs, i.e., the time period between the minimum and maximum pressure level of the parcel (Oertel et al., 2019). Figure 6a shows the mean MAP, while Fig. 6b shows the minimum MAP. We note that for all grid spacings, the maximum MAP is 48 h, as there always exists at least one trajectory that takes the whole 48 h period to complete its ascent. Figure 6c shows the mean ascent, which is defined as the mean pressure level difference between the beginning and the end of the ascent. This quantity is equivalent to that described in Table 1 of Oertel et al. (2019). Figure 6d shows the mean ascent rate, which is the ratio of mean ascent and mean MAP.
As the grid is refined, parcels on average ascend faster and higher. For parameterized convection, the effect is nearly linear: each grid refinement by a factor of 2 leads to roughly the same decrease in mean MAP and increase in mean ascent and rate. When comparing the finest and coarsest grids, we find that the 2.5 km grid results in an ascent that is 6 h faster and 60 hPa higher compared to the 80 km grid. When convection is treated explicitly, the ascent occurs even faster and over a larger vertical distance. This finding is consistent with Rivière et al. (2021), who showed that WCB ascents are quicker and more abrupt for explicit convection but more moderate and steadier for parameterized convection. The impact of treating convection explicitly is largest for the 10 km grid and smallest for the 2.5 km grid. This finding is consistent with the expectation that the resolved circulation gradually replaces the convection scheme as the grid spacing is decreased, because of which the effect of the convection scheme should decrease with the grid spacing. In contrast to the marked impact of model resolution and treatment of convection, we again find no substantial impact of the treatment of microphysics. This can be seen by the close overlap of the circle and square symbols that distinguish the one- and two-moment cloud microphysics in Fig. 6. In summary, for finer grids and explicit convection, the model simulates a quicker and higher ascent of WCB parcels.
Oertel et al. (2019) (their Table 1) considered online trajectories from COSMO simulations and offline trajectories from ECMWF IFS data. The COSMO simulations were run with explicit deep but parameterized shallow convection and a grid spacing of 2.2 km. Our ICON simulations at 2.5 km show slower ascent that reaches somewhat higher for explicit convection compared to the COSMO results of Oertel et al. (2019). We believe the slower ascent is a result of our use of offline trajectories calculated with 1-hourly model output. Our trajectories are unable to properly sample the short-lived events of embedded convection (see Sect. 2.3), leading to a bias in MAP. The ECMWF IFS data were obtained from simulations with parameterized convection and a grid spacing of 9 km. Our ICON simulation with parameterized convection and 10 km grid spacing agrees well with the ECMWF IFS results of Oertel et al. (2019), with very similar values for mean and minimum MAP (39 vs. 40 h; 13 vs. 13 h), mean ascent (653 vs. 669 hPa), and mean ascent rate (17 vs. 16.8 hPa h−1). Overall, this indicates that the differences between the ECMWF IFS and COSMO trajectories analyzed by Oertel et al. (2019) result both from differences in the grid spacing and treatment of convection and from differences in the use of online versus offline trajectories.
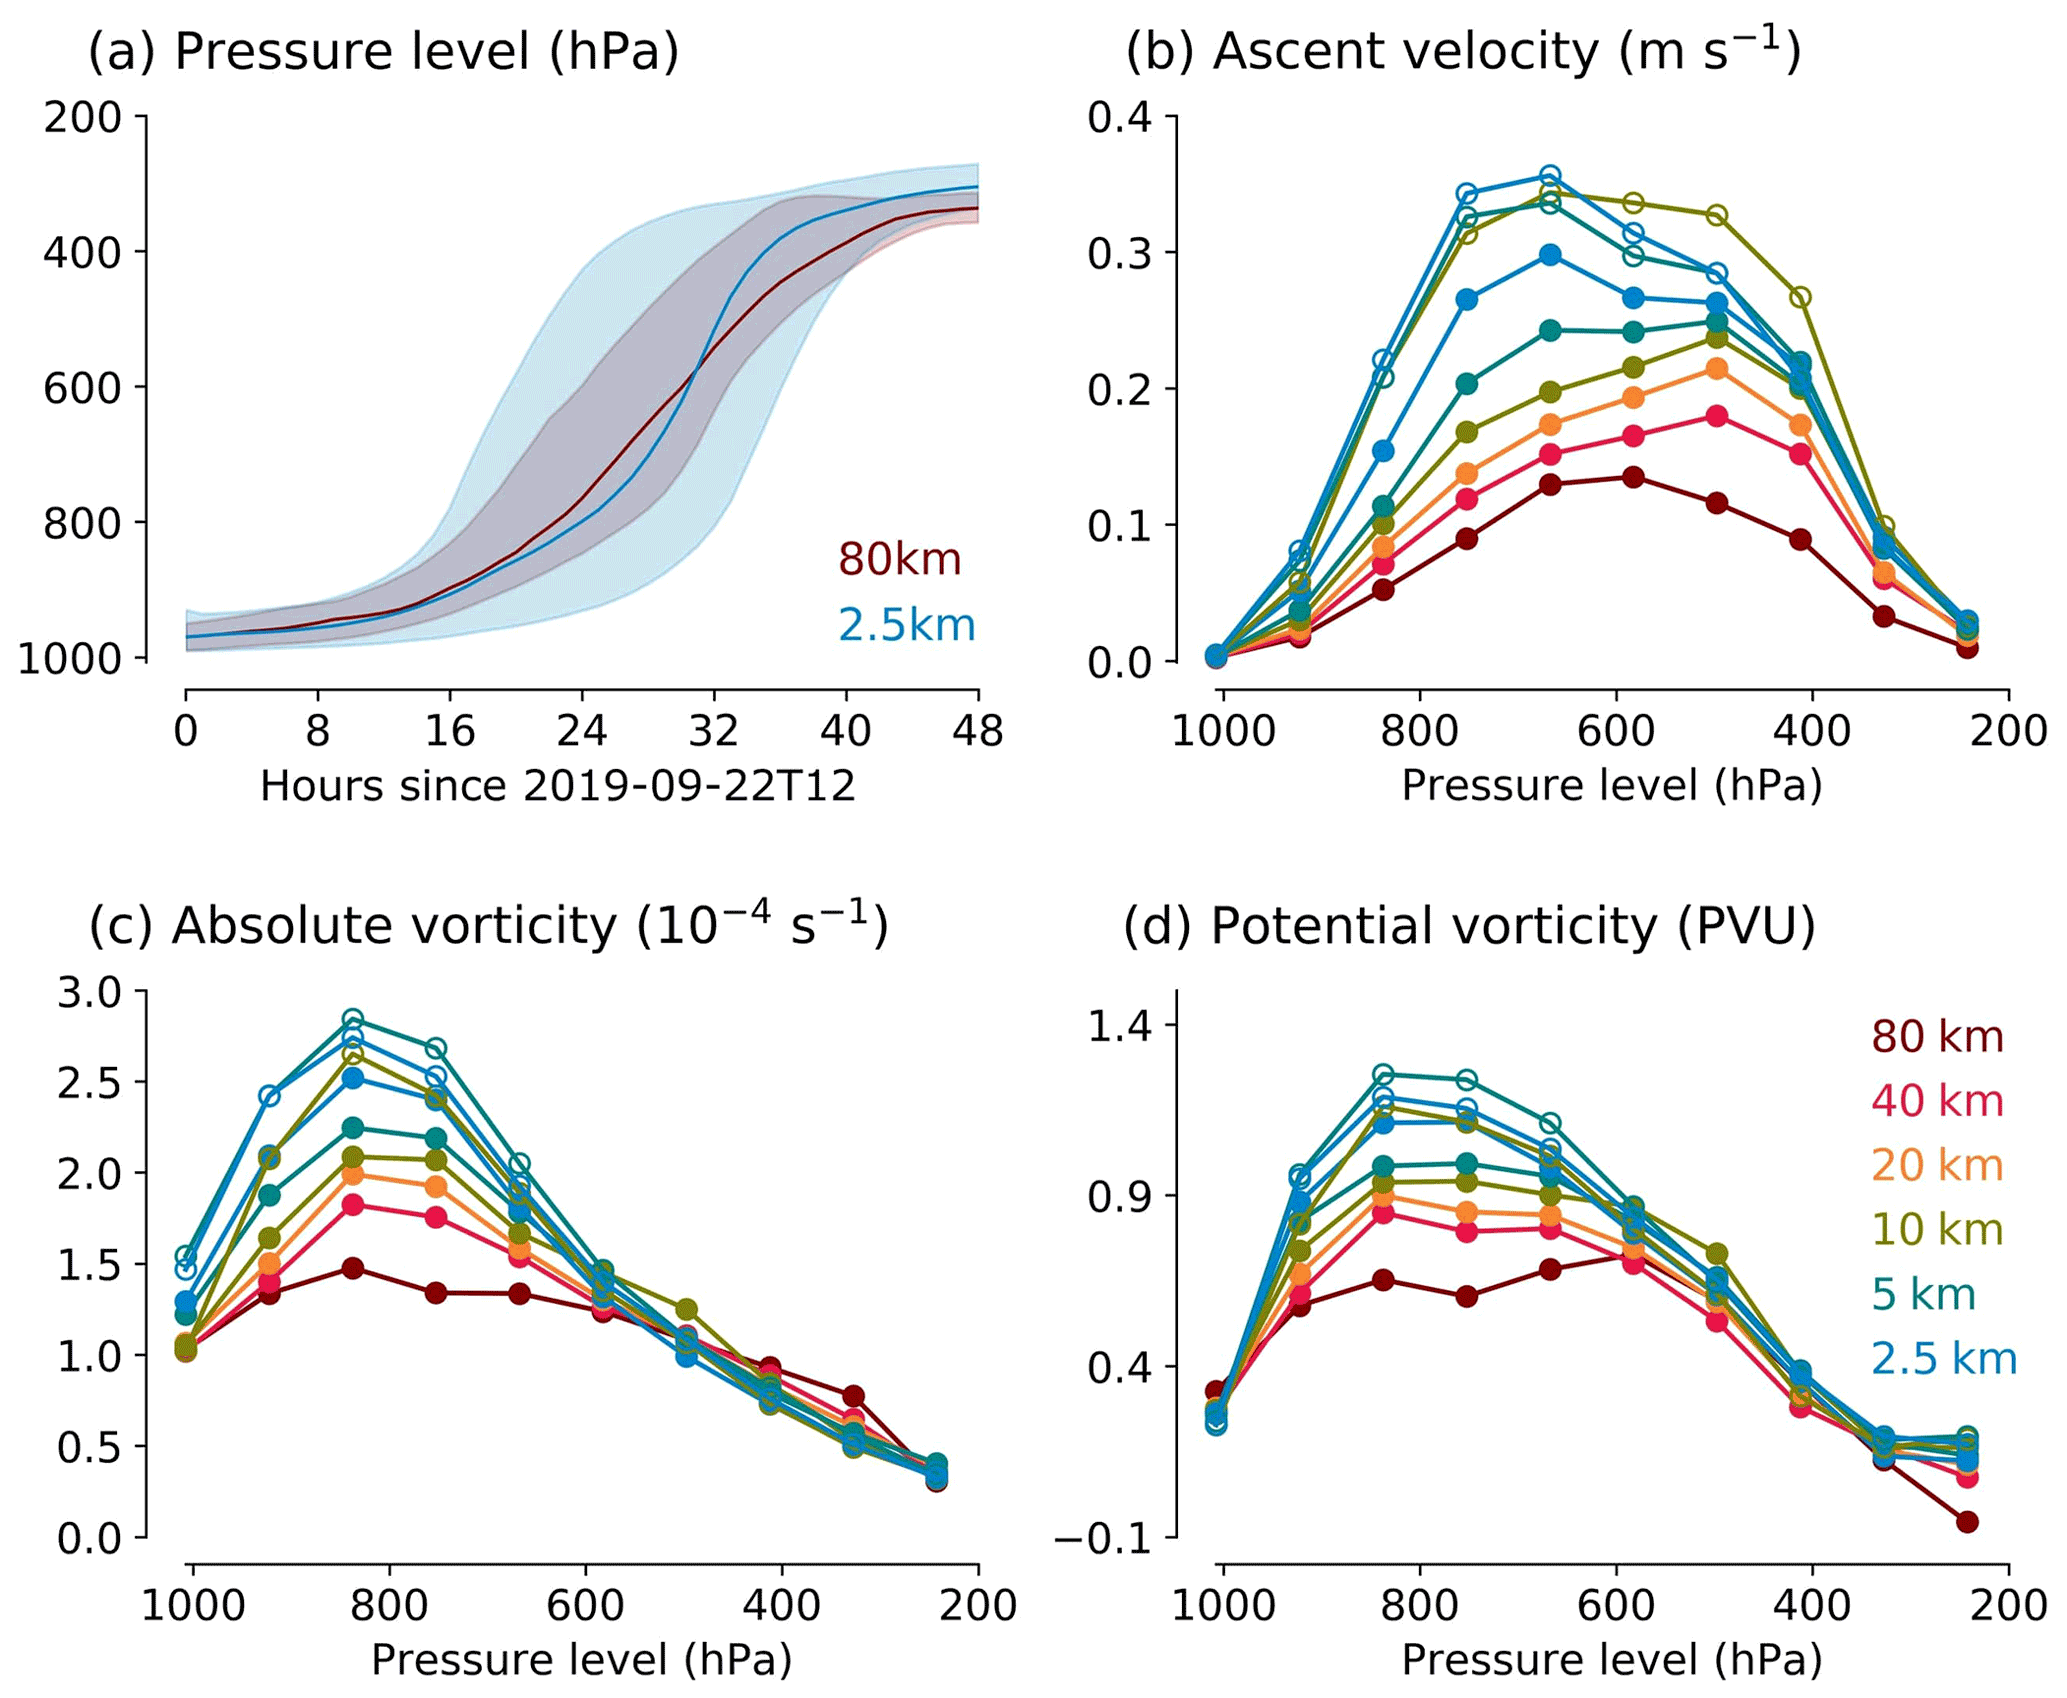
Figure 7(a) Vertical location of WCB air parcels (measured by their pressure level) as a function of time for simulations with 80 and 2.5 km grid spacings, parameterized convection and one-moment cloud microphysics. The shading illustrates the spread between trajectories and is given by the 25th and 75th percentiles. (b) Ascent velocity, (c) absolute vorticity and (d) potential vorticity as a function of grid spacing and pressure level averaged over all trajectories. Lines with filled and empty markers represent simulations with parameterized and explicit convection, respectively. All simulations shown here use one-moment cloud microphysics.
3.2 Dynamics of parcel ascent and diabatic heating within the WCB
In this section, we study the dynamics of the WCB air parcels and the diabatic heating that they experience as a function of their vertical position. Figure 7a depicts the parcels' pressure level as a function of time for the 80 and 2.5 km grid spacings. While both grid spacings exhibit a broadly similar evolution of air parcels, the spread between the trajectories is distinctively larger at 2.5 km. The increased spread results from the fact that as the grid spacing is reduced, the WCB trajectories become more diverse. This effect is illustrated in Figs. S1 and S2, which also show that treating convection explicitly further increases the diversity between WCB trajectories and that the ascent occurs in two main time periods on 23 September 2016 at around 00:00 (the intensification phase of cyclone Vladiana) and 23 September 2016 at 18:00 (the cyclone's mature phase). The latter is consistent with the results of Oertel et al. (2019).
Figure 7b–d illustrate the parcel dynamics as a function of their vertical location in terms of ascent velocity, as well as absolute and potential vorticity. Consistent with the mean ascent rate shown in Fig. 6, the parcel ascent systematically strengthens as the grid spacing is reduced, with the maximum ascent velocity shifting to lower levels (Fig. 7b). Absolute and potential vorticity displays the expected vertical profile within a WCB with maximum values in the lower troposphere (cf. Fig. 4 of Joos and Wernli, 2012, and Fig. 7 of Madonna et al., 2014). Similar to ascent velocity, decreasing the grid spacing leads to a systematic increase in absolute and potential vorticity. For all three quantities, the simulations with explicit convection display the strongest ascent and vorticity. As a result, the maximum values for ascent and vorticity are about 3 times higher for the 2.5 km resolution with explicit convection than for the 80 km resolution with parameterized convection. Consistent with our results in Sect. 3.1, the treatment of microphysics has a minor impact.
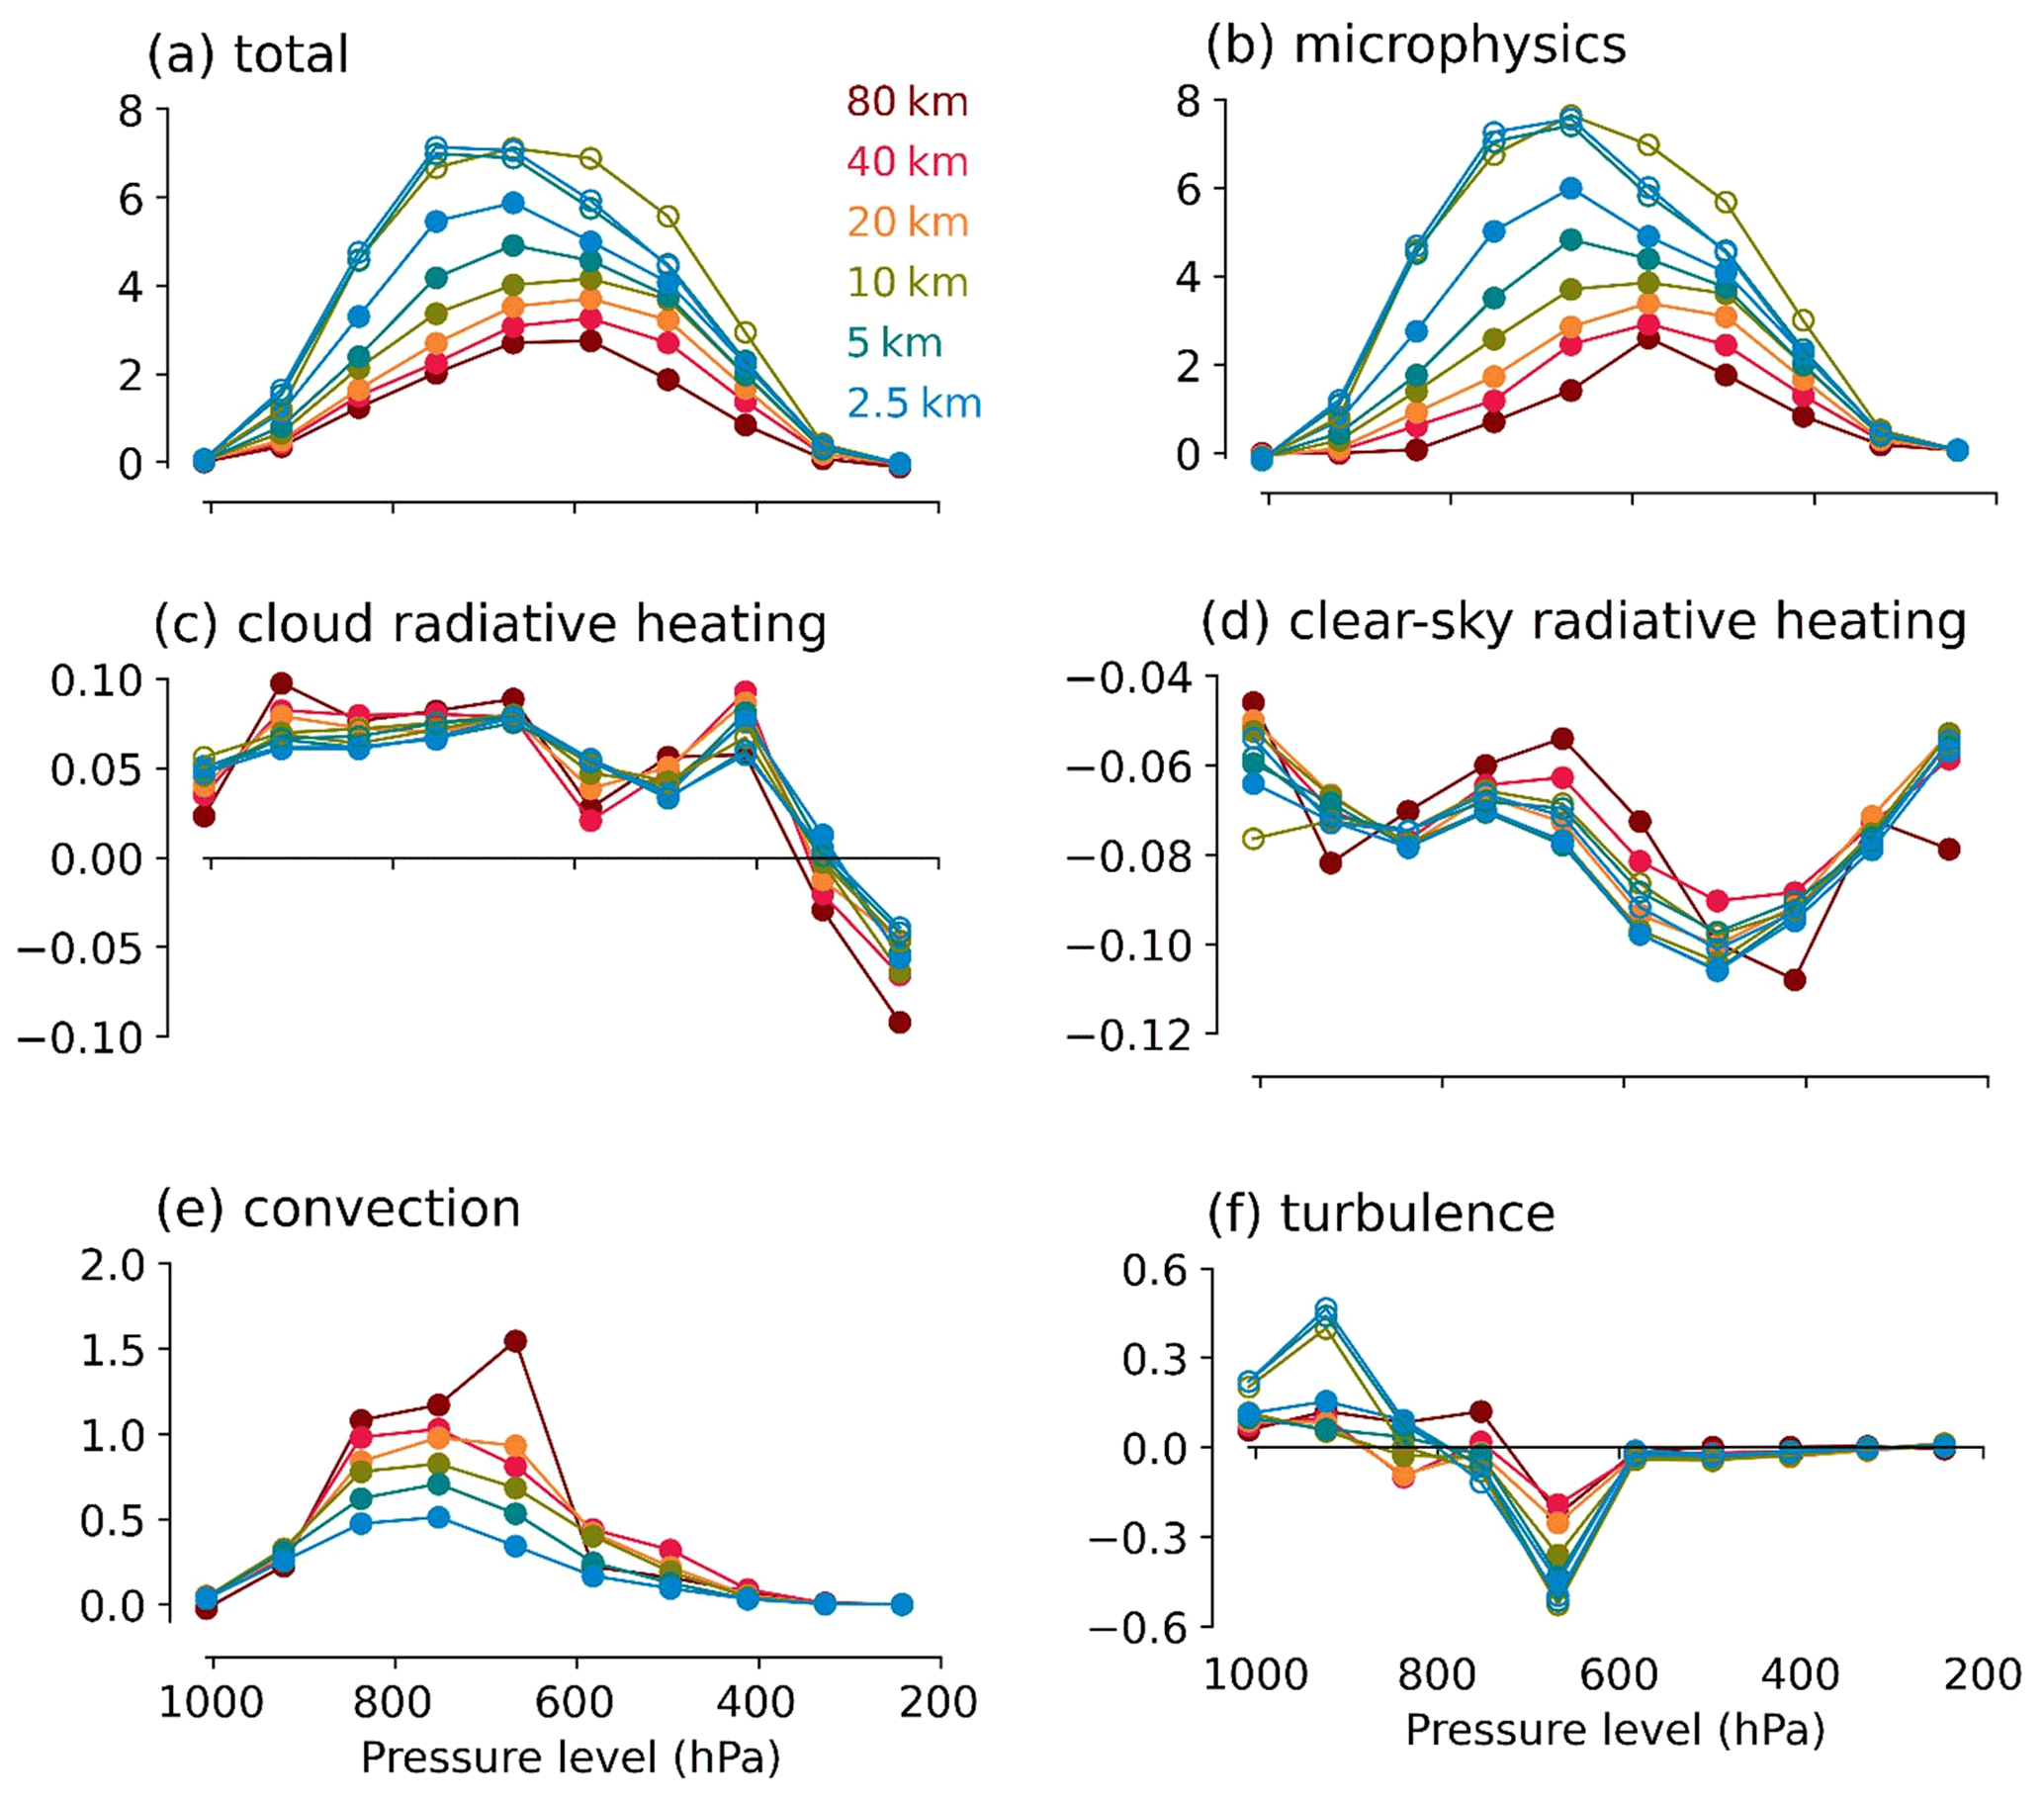
Figure 8(a) Total diabatic heating rate (in units of K h−1) along pressure levels for different grid spacings calculated as the mean over all WCB trajectories. The lines with filled and empty markers represent simulations with parameterized and explicit convection, respectively. All simulations shown here use one-moment cloud microphysics. (b–f) Same as (a) but for heating from individual processes.
Figure 8a characterizes the diabatic heating along WCB trajectories. Total diabatic heating systematically increases as the grid is refined. In fact, between the 80 and the 2.5 km grids the peak diabatic heating increases by almost a factor of 3. To quantify to what extent the increase in diabatic heating results from small-scale ascent and its correlation with diabatic heating or reflects changes in the large-scale flow, we recalculated the trajectories with all simulations remapped conservatively onto the same 40 km grid by means of the Climate Data Operators (see Sect. 2). Although the impact of the grid spacing is reduced to a factor of 2 between the 80 and 2.5 km simulations, the systematic increase in DHR for smaller grid spacings remains (Fig. S3). This shows that changes in parcel dynamics at smaller scales due to the decreased grid spacing indeed propagate to larger scales.
Total diabatic heating is dominated by microphysical processes, which exhibit almost the same vertical pattern as total diabatic heating (Fig. 8b). The increase in microphysical heating likely reflects the stronger ascent and thus larger condensation when the grid spacing is reduced. Convection contributes in the lower troposphere, where it in fact dominates total diabatic heating for the coarse-resolution simulations (Fig. 8e). The contribution of convection decreases as resolution gets finer, as is expected because an increasing fraction of vertical transport can be achieved by the resolved grid-scale circulation. The contribution by turbulence is relatively small and limited to the lower and middle troposphere (Fig. 8f). The contribution by cloud-radiative and clear-sky radiative heating is negligible (Fig. 8c and d). This is because within the WCB the air parcels are typically within clouds and not at the boundary between clear-sky and cloudy regions.
Overall, we find that the diabatic heating strongly intensifies for finer grids. The increase in diabatic heating occurs in a gradual manner, with no indication of significant structural changes. Diabatic heating and its dependence on grid spacing are dominated by heating from cloud microphysics.
Previous work has shown that the diabatic processes occurring within WCBs can have a strong influence on the distribution of potential vorticity in the lower and upper troposphere and hence on the evolution of midlatitude cyclones (e.g., Wernli and Davies, 1997; Grams et al., 2011; Madonna et al., 2014; Binder et al., 2016; Joos and Forbes, 2016). In this section, we study to what extent the sensitivity of the WCB diabatic heating found in Sect. 3 imprints on the pressure evolution of cyclone Vladiana across the different model setups.

Figure 9Central pressure of cyclone Vladiana from 22 September 2016 at 12:00 for (a) one- and (b) two-moment cloud microphysics. Filled and empty markers distinguish simulations with parameterized and explicit convection. In panel (a), the blue line with crossed markers shows the 2.5 km simulation regridded to 80 km. The central pressure derived from ERA5 is shown as the thin black line.
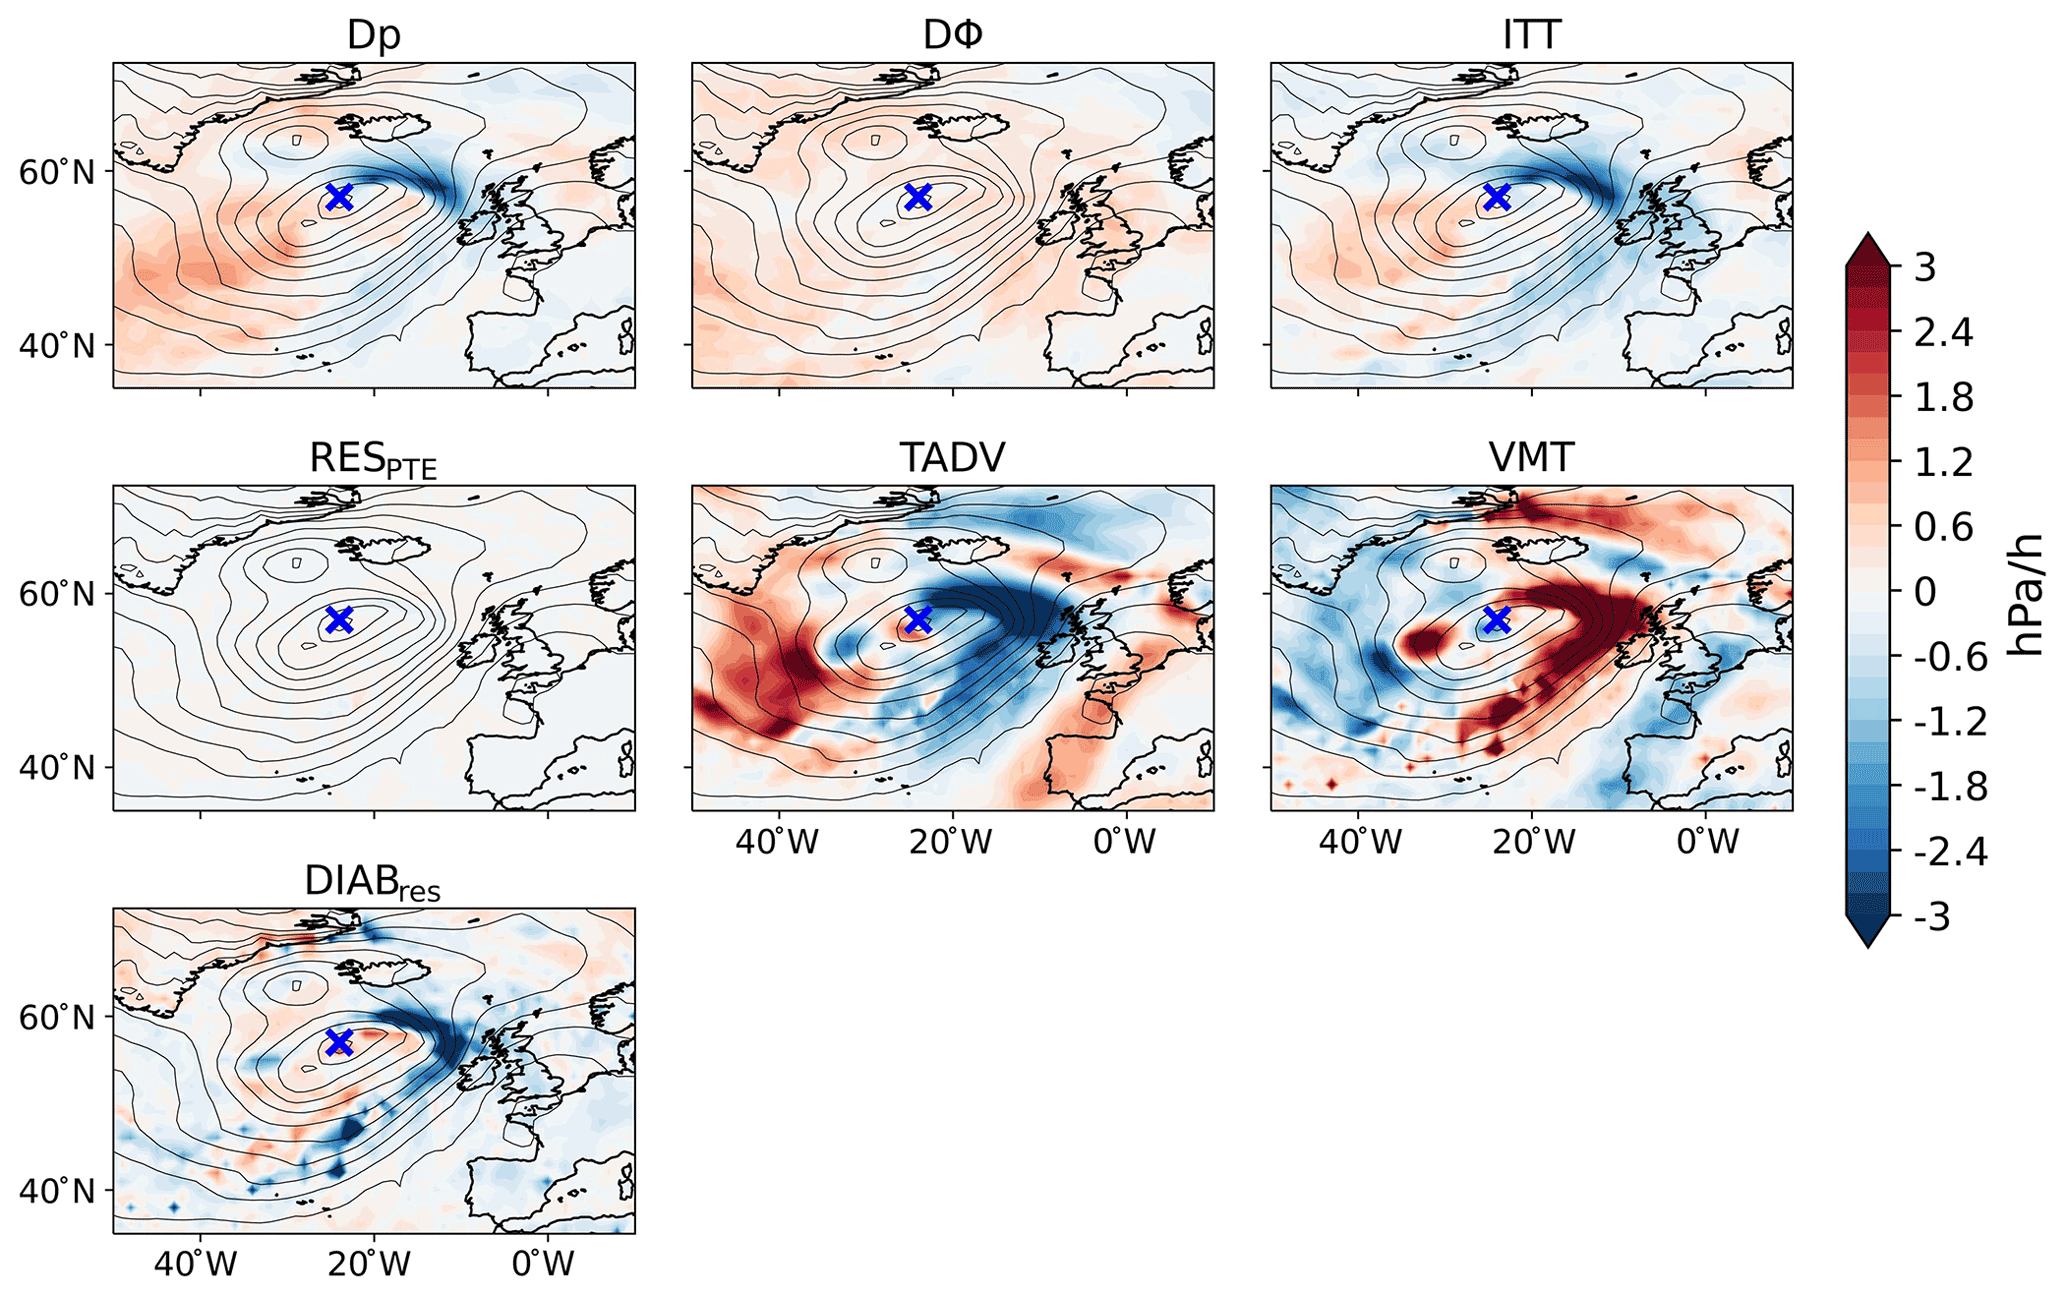
Figure 10Illustration of the PTE terms in the 2.5 km EC simulation with one-moment cloud microphysics. The figure is for 23 September 2016 at 12:00. The cyclone position as given by the minimum mean sea level pressure is marked by the blue cross.
We characterize the evolution of cyclone Vladiana by means of its central pressure at mean sea level, which is shown in Fig. 9. To remove possible spin-up effects, the first 12 h are not considered, and the time series starts on 22 September 2016 at 12:00. The cyclone deepens and reaches its minimum central pressure on 23 September 2016 at around 12:00. Although the deepening for the 80 km grid is less pronounced than for the finer grids, overall there is no systematic impact of the grid spacing and the treatment of convection on the pressure evolution.
Because the cyclone does not systematically strengthen as the grid spacing is reduced, the cyclone strength and the magnitude of WCB diabatic heating are not linked to each other. For example, although the WCB diabatic heating is strongest for the 10, 5 and 2.5 km simulations with explicit convection, the cyclone is not strongest in these simulations. This indicates that cyclone Vladiana is not strongly impacted by the diabatic processes occurring in its associated WCB. We investigate this further in the next subsection by means of the surface pressure tendency equation.
4.1 Surface pressure tendency equation (PTE)
The surface pressure tendency equation (PTE) quantifies the impact of advection and diabatic heating on the surface pressure evolution (Knippertz and Fink, 2008; Knippertz et al., 2009). The PTE approach can be applied to understand the processes driving the deepening of midlatitude cyclones. Following the work of Fink et al. (2012), we here use it to understand to what extent the strengthening of cyclone Vladiana results from diabatic heating. For a detailed description of PTE analysis and its implementation, please refer to Fink et al. (2012) and Papavasileiou et al. (2020).
The PTE approach is based on the equation for the local derivative of surface pressure,
where psfc and p are surface pressure and atmospheric pressure, respectively, ρsfc is surface air density, Rd is the dry air gas constant, ϕ100 hPa is the geopotential at 100 hPa, and Tv is the virtual temperature. g is the constant of gravitational acceleration. E and P are surface evaporation and precipitation. RESPTE represents any residual in the analysis that can arise, for example, due to the spatiotemporal discretization.
Equation (2) decomposes the surface pressure tendency (Dp) into stratospheric changes that manifest in the geopotential at the upper boundary of the vertical integral (chosen here as 100 hPa; Dϕ), changes in the tropospheric virtual temperature (ITT), and changes in column mass due to evaporation and precipitation (E-P). Because the E-P term is very small, we do not calculate it explicitly but absorb it into the residual term RESPTE.
Tropospheric heating leads to a drop in surface pressure. We are mostly interested in tropospheric heating and therefore decompose the ITT term further:
T is the temperature, v and ω are the horizontal and vertical wind components, cp is the specific heat capacity at constant pressure, and Q is the diabatic heating rate. On the right-hand side of Eq. (3), the first two terms represent the impact of horizontal temperature advection (TADV) and vertical motions (VMTs). DIAB represents the influence of diabatic heating. The term RESITT represent errors caused by temporal and spatial discretizations, similar to RESPTE. Following Fink et al. (2012) and Pohle (2010) we measure the impact of diabatic heating as the residuum of ITT and the horizontal and advective terms:
Fink et al. (2012) and Pohle (2010) showed that the DIABres provides a good approximation to DIAB.
We calculate Eqs. (2)–(4) using hourly model output interpolated from the 75 model levels onto pressure levels with a vertical spacing of 10 hPa. For illustration, Fig. 10 shows maps of the PTE terms for the 2.5 km EC simulation on 23 September 2016 at 12:00. The overall pattern is similar across the model setups. Near the cyclone center, a dipole pattern of negative and positive Dp is visible, which mainly results from the ITT term. The ITT term itself is characterized by large and opposing impacts from horizontal advection (TADV) and vertical motion (VMT), as well as negative surface pressure tendencies from diabatic heating (DIABres) in the region of the WCB. However, near the cyclone center the impact of diabatic heating is weak and in fact leads to a small surface pressure increase.
To assess the role of dynamic and diabatic processes for the pressure evolution of cyclone Vladiana, Fig. 11 depicts the time series of the PTE terms averaged over a 3∘ × 3∘ latitude–longitude box centered around the cyclone location. The evolution of the cyclone central pressure is most strongly affected by tropospheric heating (ITT; Fig. 11a), which itself is dominated by horizontal temperature advection (TADV; Fig. 11b). Diabatic heating plays a smaller role and does not contribute to the cyclone deepening but works against it.
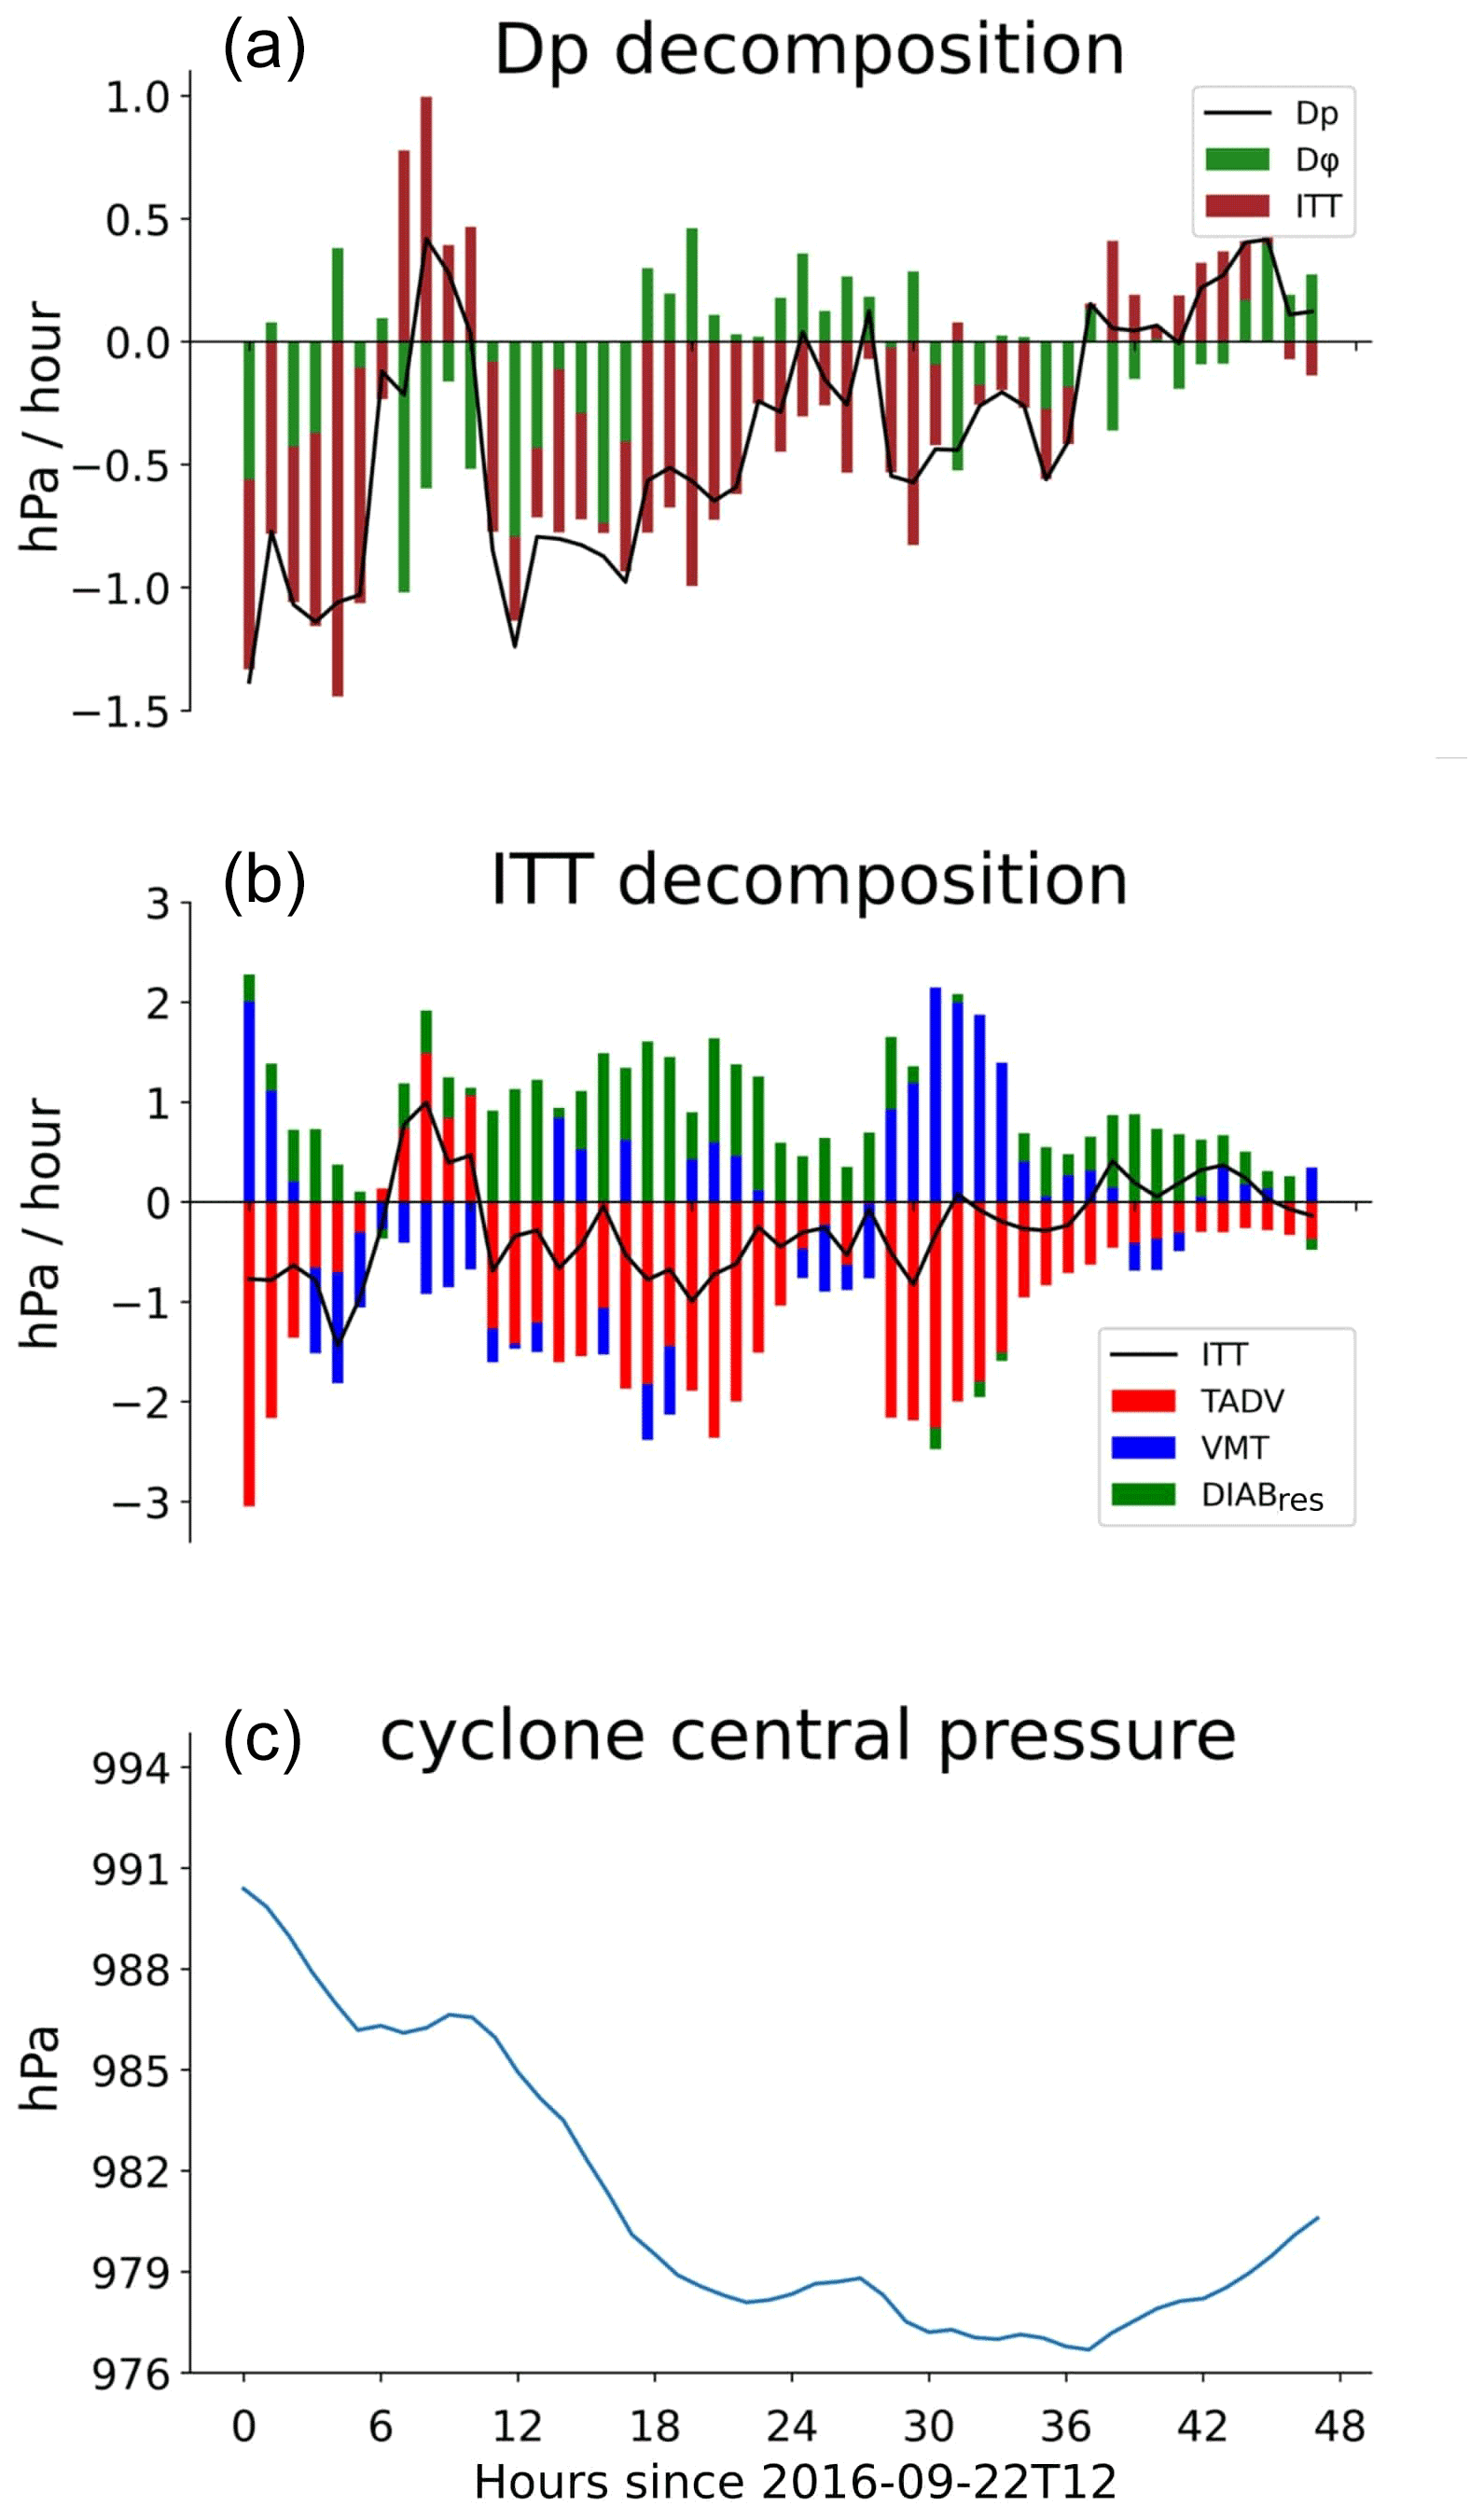
Figure 11Time series of the PTE analysis during the cyclone development from 22 September 2016 at 12:00 for the 2.5 km EC simulation with one-moment cloud microphysics. The PTE terms are averaged over a 3∘ × 3∘ latitude–longitude box centered around the cyclone location. (a) Surface pressure tendency and its decomposition. (b) Decomposition of the ITT term. (c) Central pressure of the cyclone.
The dominant role of horizontal advection and the minor impact of diabatic heating is robust across model setups. To show this, Fig. 12 depicts the PTE terms averaged over the main deepening period of the cyclone. The somewhat less intense cyclone for the 80 and 40 km grids arises from a smaller contribution of temperature advection. In contrast, diabatic heating works against the cyclone deepening for all grid spacings. Thus, unlike in earlier studies (e.g., Willison et al., 2013; Trzeciak et al., 2016), decreasing the grid spacing does not enhance the relative contribution of diabatic heating to the cyclone's primary deepening. This is consistent with the fact that the WCB of cyclone Vladiana is strong but far away from the cyclone center (Binder et al., 2016).

Figure 12PTE terms as a function of grid spacing for simulations with one-moment cloud microphysics. The terms are averaged over the intensification period of cyclone Vladiana from 22 September 2016 at 22:00 to 23 September 2016 at 09:00 (between 10 and 21 h after 22 September 2016 at 12:00). Filled and empty markers represent simulations with parameterized and explicit convection, respectively.
In summary, the PTE analysis shows that the deepening of cyclone Vladiana is not due to diabatic processes. This explains why the systematic enhancement of diabatic processes in the warm conveyor belt that we have documented in Sect. 3 is not reflected in the evolution of the cyclone's central pressure.
We have characterized how the simulation of a warm conveyor belt (WCB) of a midlatitude cyclone is affected by horizontal grid spacing and the treatment of convection and microphysics. Our study is motivated by the development of global and regional storm-resolving models that aim to represent the atmosphere with grid spacings of a few kilometers and with the deep convection scheme switched off. It is further motivated by previous results that midlatitude cyclones intensify as the grid spacing is decreased.
We have analyzed a set of 18 simulations with the ICON model in limited-area setup over the North Atlantic and with the atmospheric physics package developed for numerical weather prediction. The simulations were run for grid spacings ranging from 80 to 2.5 km, with and without a convection scheme, and with one-moment and two-moment cloud microphysics. The simulations were a case study of the North Atlantic cyclone Vladiana, which occurred in September 2016 and exhibited a well-developed WCB. Our analysis has used offline trajectories and the surface pressure tendency equation (PTE).
Based on the analysis we answer three research questions given in the introduction as follows:
-
How do the grid spacing, the treatment of convection and the treatment of cloud microphysics affect the WCB associated with cyclone Vladiana?
As the grid spacing is decreased, the number of WCB trajectories increases by up to a factor of 10. When convection is represented explicitly, the number of WCB trajectories increases further. For the 10, 5 and 2.5 km grids and with explicit convection, the number of WCB trajectories becomes independent of the grid spacing, signaling convergence. We find analogous impacts of the grid spacing and the treatment of convection on the WCB ascent and vorticity, which strengthen both as the grid is refined and as convection is made explicit. Cloud microphysics have a minor impact.
-
How sensitive is diabatic heating within the WCB to these modeling choices?
As the grid is refined, diabatic heating systematically increases. The increase arises from stronger diabatic heating by cloud microphysics and is consistent with stronger WCB ascent and hence stronger latent heating. For parameterized convection, each halving of the grid spacing leads to an increase in diabatic heating. When convection is treated explicitly in the 10, 5 and 2.5 km simulations, diabatic heating is largely insensitive to the grid spacing. The impact of the treatment of cloud microphysics is again minor.
-
Do the sensitivities of the WCB diabatic processes affect the deepening of cyclone Vladiana?
We do not find a clear and systematic impact of the grid spacing and the treatment of convection on the evolution of the central pressure of cyclone Vladiana. This is in contrast to the above sensitivities of the diabatic heating. The difference is explained by the PTE analysis, which shows that the deepening of cyclone Vladiana is driven by temperature advection and not by diabatic processes.
A limitation of our study is that we have not compared the simulations to observational data. This prevents us from quantifying a possible added value that might be obtained from refining the grid and disabling the convection scheme. Nevertheless, a few points can be made. For the coarse grids with grid spacings of 80 and 40 km, the WCB is much weaker and much less pronounced compared to the finer grids. In fact, for the 80 km grid only three of the four trajectory subclasses are simulated, hinting at a possible systematic shortcoming of coarse-resolution models in simulating WCBs that might further impact the jet stream and the downstream flow evolution (Oertel et al., 2020; Blanchard et al., 2020, 2021). In this context, it is also worth noting that while we have found a minor impact of the cloud microphysics scheme on the WCB, Mazoyer et al. (2021) found that ice cloud microphysics within the WCB can play an important role in upper-level dynamics.
Our results further indicate that when the convection scheme is switched off, a grid spacing of 5 km or maybe even 10 km is sufficient. The results from these resolutions are in close agreement with the results from the 2.5 km simulation with explicit convection in terms of the WCB characteristics, the WCB diabatic heating and the deepening of the cyclone. This finding is broadly consistent with Vergara-Temprado et al. (2020), who reported that at a resolution of 20 km and finer the representation of deep convection plays a larger role than a further refinement in resolution. It is also consistent with Jung et al. (2006), Champion et al. (2011), and Jung et al. (2012), who argued that a resolution of 20 km is sufficient to capture the synoptic evolution of midlatitude cyclones.
For future work we would find it interesting to investigate simulations in a Transpose-AMIP (Atmosphere Model Intercomparison Project) framework in which climate models are used to predict weather over the course of around 10 d (Williams et al., 2013). Because Transpose-AMIP simulations start from a known state of the atmosphere, the impact of modeling choices on midlatitude cyclones could be studied across a large number of cyclones, and the results could be evaluated by means of reanalysis and observational data. Flack et al. (2021) recently performed a Transpose-AMIP analysis for an explosive deepening cyclone during the NAWDEX campaign with climate models run at 150 and 50 km grid spacings, and more such analyses are warranted in our view.
The data that support the findings of this study are openly available. The analysis scripts are provided in the GitLab repository https://gitlab.phaidra.org/climate/choudhary-vladiana-wcd-2022 (Choudhary, 2022a) hosted by the University of Vienna. A copy of these scripts is also made available in the data repository published on Zenodo. The WCB trajectory output from LAGRANTO and the other processed data from simulations used in the work are published at Zenodo with DOI https://doi.org/10.5281/zenodo.5921126 (Choudhary, 2022b). The Zenodo data set includes a copy of the analysis scripts.
The supplement related to this article is available online at: https://doi.org/10.5194/wcd-3-1199-2022-supplement.
The ICON simulations were carried out by AV. AC and AV designed the study. AC did the analysis with inputs from AV. Both authors discussed and interpreted the results and wrote the paper.
The contact author has declared that none of the authors has any competing interests.
Publisher's note: Copernicus Publications remains neutral with regard to jurisdictional claims in published maps and institutional affiliations.
Anubhav Choudhary and Aiko Voigt acknowledge financial support by the German Ministry of Education and Research (BMBF) and FONA: Research for Sustainable Development (http://www.fona.de, last access: 31 January 2022). The primary data of the ICON simulations (run scripts, namelists, scripts for lateral boundary data) are published at KITopen of the Karlsruhe Institute of Technology, https://doi.org/10.5445/IR/1000123695. Note that the KITopen data set includes all simulations of Senf et al. (2020), from which a subset is analyzed here. This work used resources of the Deutsches Klimarechenzentrum (DKRZ) granted by its Scientific Steering Committee (WLA) under project ID bb1018. The ICON simulations were carried out by Aiko Voigt at the Mistral High Performance Computing system of DKRZ. This work contributes to the WCRP's Grand Challenge on Clouds, Circulation, and Climate Sensitivity and the BMBF-funded project “HD(CP)2: High Definition Clouds and Precipitation for Advancing Climate Prediction”. We are very thankful to Georgios Papavasileiou of the National Observatory of Athens, Greece, for his help with the PTE analysis. We thank Annika Oertel of IMK-TRO, KIT, Germany, and Gwendal Rivière of LMD, France, for feedback and discussions and the two reviewers whose comments have helped improve the manuscript.
This research has been supported by the Bundesministerium für Bildung und Forschung (grant no. 01LK1509A).
This paper was edited by Juerg Schmidli and reviewed by Ambrogio Volonté and one anonymous referee.
Baldauf, M., Seifert, A., Förstner, J., Majewski, D., Raschendorfer, M., and Reinhardt, T.: Operational convective-scale numerical weather prediction with the COSMO model: Description and sensitivities, Mon. Weather Rev., 139, 3887–3905, https://doi.org/10.1175/MWR-D-10-05013.1, 2011. a
Bechtold, P., Koehler, M., Jung, T., Doblas-Reyes, F., Leutbecher, M., Rodwell, M., Vitart, F., and Balsamo, G.: Advances in simulating atmospheric variability with the ECMWF model: From synoptic to decadal time-scales, Q. J. Roy. Meteor. Soc., 134, 1337–1351, https://doi.org/10.1002/qj.289, 2008. a
Binder, H., Boettcher, M., Joos, H., and Wernli, H.: The role of warm conveyor belts for the intensification of extratropical cyclones in Northern Hemisphere winter, J. Atmos. Sci., 73, 3997–4020, https://doi.org/10.1175/JAS-D-15-0302.1, 2016. a, b, c, d
Blanchard, N., Pantillon, F., Chaboureau, J.-P., and Delanoë, J.: Organization of convective ascents in a warm conveyor belt, Weather Clim. Dynam., 1, 617–634, https://doi.org/10.5194/wcd-1-617-2020, 2020. a, b
Blanchard, N., Pantillon, F., Chaboureau, J.-P., and Delanoë, J.: Mid-level convection in a warm conveyor belt accelerates the jet stream, Weather Clim. Dynam., 2, 37–53, https://doi.org/10.5194/wcd-2-37-2021, 2021. a, b
Browning, K. A.: Organization of clouds and precipitation in extratropical cyclones, in: Extratropical cyclones, edited by: Newton, C. W., Holopainen, E. O., American Meteorological Society, Boston, MA, 129–153, https://doi.org/10.1007/978-1-944970-33-8_8, 1990. a
Carlson, T. N.: Airflow through midlatitude cyclones and the comma cloud pattern, Mon. Weather Rev., 108, 1270–1282, https://doi.org/10.1175/1520-0493(1980)108<1498:ATMCAT>2.0.CO;2, 1980. a
Champion, A. J., Hodges, K. I., Bengtsson, L. O., Keenlyside, N. S., and Esch, M.: Impact of increasing resolution and a warmer climate on extreme weather from Northern Hemisphere extratropical cyclones, Tellus A, 63, 893–906, https://doi.org/10.1111/j.1600-0870.2011.00538.x, 2011. a, b
Chang, E. K. and Fu, Y.: Using mean flow change as a proxy to infer interdecadal storm track variability, J. Climate, 16, 2178–2196, https://doi.org/10.1175/2773.1, 2003. a
Choudhary, A.: Analysis scripts for “Impact of grid spacing, convective parameterization and cloud microphysics in ICON simulations of a warm conveyor belt”, Gitlab [code], https://gitlab.phaidra.org/climate/choudhary-vladiana-wcd-2022, last access: 24 October 2022a. a
Choudhary, A.: Data and analysis scripts for “Impact of grid spacing, convective parameterization and cloud microphysics in ICON simulations of a warm conveyor belt”, Zenodo [data set], https://doi.org/10.5281/zenodo.5921126, 2022b. a
Colle, B. A., Zhang, Z., Lombardo, K. A., Chang, E., Liu, P., and Zhang, M.: Historical evaluation and future prediction of eastern North American and western Atlantic extratropical cyclones in the CMIP5 models during the cool season, J. Climate, 26, 6882–6903, https://doi.org/10.1175/JCLI-D-12-00498.1, 2013. a
Doms, G., Förstner, J., Heise, E., Herzog, H., Mironov, D., Raschendorfer, M., and Vogel, G.: A description of the nonhydrostatic regional model LM Part II: Physical parameterization, Scientific documentation, Deutscher Wetterdienst, Offenbach, Germany, 2005. a
Eichler, T. P., Natalie, G., and Zaitao, P.: Impacts of global warming on Northern Hemisphere winter storm tracks in the CMIP5 model suite, J. Geophys. Res.-Atmos., 118, 3919–3932, https://doi.org/10.1002/jgrd.50286, 2013. a
Fink, A. H., Pohle, S., Pinto, J. G., and Knippertz, P.: Diagnosing the influence of diabatic processes on the explosive deepening of extratropical cyclones, Geophys. Res. Lett., 39, L07803, https://doi.org/10.1029/2012GL051025, 2012. a, b, c, d
Flack, D. L. A., Rivière, G., Musat, I., Roehrig, R., Bony, S., Delanoë, J., Cazenave, Q., and Pelon, J.: Representation by two climate models of the dynamical and diabatic processes involved in the development of an explosively deepening cyclone during NAWDEX, Weather Clim. Dynam., 2, 233–253, https://doi.org/10.5194/wcd-2-233-2021, 2021. a, b, c
Grams, C. M., Wernli, H., Böttcher, M., Čampa, J., Corsmeier, U., Jones, S. C., and Wiegand, L.: The key role of diabatic processes in modifying the upper-tropospheric wave guide: a North Atlantic case-study, Q. J. Roy. Meteor. Soc., 137, 2174–2193, https://doi.org/10.1002/qj.891, 2011. a, b
Jakob, C.: Accelerating progress in global atmospheric model development through improved parameterizations: Challenges, opportunities, and strategies, B. Am. Meteorol. Soc., 91, 869–876, https://doi.org/10.1175/2009BAMS2898.1, 2010. a
Joos, H.: Warm conveyor belts and their role for cloud radiative forcing in the extratropical storm tracks, J. Climate, 32, 5325–5343, https://doi.org/10.1175/JCLI-D-18-0802.1, 2019. a
Joos, H. and Forbes, R. M.: Impact of different IFS microphysics on a warm conveyor belt and the downstream flow evolution, Q. J. Roy. Meteor. Soc., 142, 2727–2739, https://doi.org/10.1002/qj.2863, 2016. a, b
Joos, H. and Wernli, H.: Influence of microphysical processes on the potential vorticity development in a warm conveyor belt: a case-study with the limited-area model COSMO, Q. J. Roy. Meteor. Soc., 138, 407–418, https://doi.org/10.1002/qj.934, 2012. a, b, c
Jung, T., Gulev, S. K., Rudeva, I., and Soloviov, V.: Sensitivity of extratropical cyclone characteristics to horizontal resolution in the ECMWF model, Q. J. Roy. Meteor. Soc., 132, 1839–1857, https://doi.org/10.1256/qj.05.212, 2006. a, b, c
Jung, T., Miller, M. J., Palmer, T. N., Towers, P., Wedi, N., Achuthavarier, D., Adams, J. M., Altshuler, E. L., Cash, B. A., Kinter III, J. L., Marx, L., Stan, C., and Hodges, K. I.: High-resolution global climate simulations with the ECMWF model in Project Athena: Experimental design, model climate, and seasonal forecast skill, J. Climate, 25, 3155–3172, https://doi.org/10.1175/JCLI-D-11-00265.1, 2012. a
Knippertz, P. and Fink, A. H.: Dry-season precipitation in tropical West Africa and its relation to forcing from the extratropics, Mon. Weather Rev., 136, 3579–3596, https://doi.org/10.1175/2008MWR2295.1, 2008. a
Knippertz, P., Fink, A. H., and Pohle, S.: Comments on “Dry-Season Precipitation in Tropical West Africa and Its Relation to Forcing from the Extratropics” – Reply, Mon. Weather Rev., 137, 3151–3157, https://doi.org/10.1175/2009MWR3006.1, 2009. a
Madonna, E., Wernli, H., Joos, H., and Martius, O.: Warm conveyor belts in the ERA-Interim dataset (1979–2010). Part I: Climatology and potential vorticity evolution, J. Climate, 27, 3–26, https://doi.org/10.1175/JCLI-D-12-00720.1, 2014. a, b, c
Martinez-Alvarado, O., Joos, H., Chagnon, J., Boettcher, M., Gray, S., Plant, R., and Wernli, H.: The dichotomous structure of the warm conveyor belt, Q. J. Roy. Meteor. Soc., 140, 1809–1824, https://doi.org/10.1002/qj.2276, 2014. a, b
Mazoyer, M., Ricard, D., Rivière, G., Delanoë, J., Arbogast, P., Vié, B., Lac, C., Cazenave, Q., and Pelon, J.: Microphysics impacts on the warm conveyor belt and ridge building of the NAWDEX IOP6 cyclone, Mon. Weather Rev., 149, 3961–3980, https://doi.org/10.1175/MWR-D-21-0061.1, 2021. a, b, c
Oertel, A., Boettcher, M., Joos, H., Sprenger, M., Konow, H., Hagen, M., and Wernli, H.: Convective activity in an extratropical cyclone and its warm conveyor belt–a case-study combining observations and a convection-permitting model simulation, Q. J. Roy. Meteor. Soc., 145, 1406–1426, https://doi.org/10.1002/qj.3500, 2019. a, b, c, d, e, f, g, h, i, j, k, l, m, n, o
Oertel, A., Boettcher, M., Joos, H., Sprenger, M., and Wernli, H.: Potential vorticity structure of embedded convection in a warm conveyor belt and its relevance for large-scale dynamics, Weather Clim. Dynam., 1, 127–153, https://doi.org/10.5194/wcd-1-127-2020, 2020. a, b, c, d, e, f
Palmer, T. and Stevens, B.: The scientific challenge of understanding and estimating climate change, P. Natl. Acad. Sci. USA, 116, 24390–24395, https://doi.org/10.1073/pnas.1906691116, 2019. a
Papavasileiou, G., Voigt, A., and Knippertz, P.: The role of observed cloud-radiative anomalies for the dynamics of the North Atlantic Oscillation on synoptic time-scales, Q. J. Roy. Meteor. Soc., 146, 1822–1841, https://doi.org/10.1002/qj.3768, 2020. a
Pfahl, S., Madonna, E., Boettcher, M., Joos, H., and Wernli, H.: Warm conveyor belts in the ERA-Interim dataset (1979–2010): Part II: Moisture origin and relevance for precipitation, J. Climate, 27, 27–40, https://doi.org/10.1175/JCLI-D-13-00223.1, 2014. a
Pfahl, S., Schwierz, C., Croci-Maspoli, M., Grams, C. M., and Wernli, H.: Importance of latent heat release in ascending air streams for atmospheric blocking, Nat. Geosci., 8, 610–614, https://doi.org/10.1038/ngeo2487, 2015. a
Pohle, S.: Synoptische und dynamische Aspekte tropisch-extratropischer Wechselwirkungen: Drei Fallstudien von Hitzetiefentwicklungen über Westafrika während des AMMA-Experiments 2006, PhD thesis, University of Cologne, Cologne, Germany, https://kups.ub.uni-koeln.de/3157/1/DissertationSusanPohle2010.pdf (last access: 24 October 2022), 2010. a, b
Prill, F., Reinert, D., Rieger, D., and Zaengl, G. (Eds.): Working with the ICON Model, Tech. rep., DWD German Weather Service, Offenbach, Germany, https://doi.org/10.5676/dwd_pub/nwv/icon_tutorial2020, 2020. a, b, c
Randall, D., Khairoutdinov, M., Arakawa, A., and Grabowski, W.: Breaking the cloud parameterization deadlock, B. Am. Meteorol. Soc., 84, 1547–1564, https://doi.org/10.1175/BAMS-84-11-1547, 2003. a
Rasp, S., Selz, T., and Craig, G. C.: Convective and slantwise trajectory ascent in convection-permitting simulations of midlatitude cyclones, Mon. Weather Rev., 144, 3961–3976, https://doi.org/10.1175/MWR-D-16-0112.1, 2016. a
Rivière, G., Wimmer, M., Arbogast, P., Piriou, J.-M., Delanoë, J., Labadie, C., Cazenave, Q., and Pelon, J.: The impact of deep convection representation in a global atmospheric model on the warm conveyor belt and jet stream during NAWDEX IOP6, Weather Clim. Dynam., 2, 1011–1031, https://doi.org/10.5194/wcd-2-1011-2021, 2021. a, b, c
Satoh, M., Stevens, B., Judt, F., Khairoutdinov, M., Lin, S.-J., Putman, W. M., and Düben, P.: Global cloud-resolving models, Current Climate Change Reports, 5, 172–184, https://doi.org/10.1007/s40641-019-00131-0, 2019. a
Schäfer, S. and Voigt, A.: Radiation weakens idealized mid-latitude cyclones, Geophys. Res. Lett., 45, 2833–2841, https://doi.org/10.1002/2017GL076726, 2018. a
Schäfler, A., Craig, G., Wernli, H., Arbogast, P., Doyle, J., McTaggart-Cowan, R., and Bramberger, M.: The North Atlantic waveguide and downstream impact experiment, B. Am. Meteorol. Soc., 99, 1607–1637, https://doi.org/10.1175/BAMS-D-17-0003.1, 2018. a, b
Schulzweida, U.: CDO User Guide, Version 1.9.8, Zenodo, https://doi.org/10.5281/zenodo.3539275, 2019. a
Seifert, A. and Beheng, K. D.: A two-moment cloud microphysics parameterization for mixed-phase clouds. Part 1: Model description, Meteorol. Atmos. Phys., 92, 45–66, https://doi.org/10.1007/s00703-005-0112-4, 2006. a
Senf, F., Voigt, A., Clerbaux, N., Hünerbein, A., and Deneke, H.: Increasing resolution and resolving convection improves the simulation of cloud-radiative effects over the North Atlantic, J. Geophys. Res.-Atmos., 125, e2020JD032667, https://doi.org/10.1029/2020JD032667, 2020. a, b, c, d, e
Sprenger, M. and Wernli, H.: The LAGRANTO Lagrangian analysis tool – version 2.0, Geosci. Model Dev., 8, 2569–2586, https://doi.org/10.5194/gmd-8-2569-2015, 2015. a
Stevens, B., Satoh, M., Auger, L., Biercamp, J., Bretherton, C. S., Chen, X., and Kodama, C.: DYAMOND: the DYnamics of the Atmospheric general circulation Modeled On Non-hydrostatic Domains, Progress in Earth and Planetary Science, 6, 61, https://doi.org/10.1186/s40645-019-0304-z, 2019. a
Stevens, B., Acquistapace, C., Hansen, A., Heinze, R., Klinger, C., Klocke, D., Rybka, H., Schubotz, W., Windmiller, J., Adamidis, P., Arka, I., Barlakas, V., Biercamp, J., Brueck, M., Brune, S., Buehler, S. A., Burkhardt, U., Cioni, G., Costa-Suros, M., Crewell, S., Crüger, T., Deneke, H., Friedrichs, P., Henken, C. C., Hohenegger, C., Jacob, M., Jakub, F., Kalthoff, N., Köhler, M., Laar, T. W. v., Li, P., Löhnert, U., Macke, A., Madenach, N., Mayer, B., Nam, C., Naumann, A. K., Peters, K., Poll, S., Quaas, J., Röber, N., Rochetin, N., Scheck, L., Schemann, V., Schnitt, S., Seifert, A., Senf, F., Shapkalijevski, M., Simmer, C., Singh, S., Sourdeval, O., Spickermann, D., Strandgren, J., Tessiot, O., Vercauteren, N., Vial, J., Voigt, A., and Zängl, G.: The Added Value of Large-Eddy and Storm-Resolving Models for Simulating Clouds and Precipitation, J. Meteorol. Soc. Jpn. Ser. II, 98, 395–435, https://doi.org/10.2151/jmsj.2020-021, 2020. a, b
Stohl, A.: A 1-year Lagrangian “climatology” of airstreams in the Northern Hemisphere troposphere and lowermost stratosphere, J. Geophys. Res.-Atmos., 106, 7263–7279, https://doi.org/10.1029/2000JD900570, 2001. a
Tiedtke, M.: A Comprehensive Mass Flux Scheme for Cumulus Parameterization in Large-Scale Models, Mon. Weather Rev., 117, 1779–1800, https://doi.org/10.1175/1520-0493(1989)117<1779:ACMFSF>2.0.CO;2, 1989. a
Trzeciak, T. M., Knippertz, P., Pirret, J. S., and Williams, K. D.: Can we trust climate models to realistically represent severe European windstorms?, Clim. Dynam., 46, 3431–3451, https://doi.org/10.1007/s00382-015-2777-9, 2016. a
Ulbrich, U., Pinto, J. G., Kupfer, H., Leckebusch, G., Spangehl, T., and Reyers, M.: Changing Northern Hemisphere storm tracks in an ensemble of IPCC climate change simulations, J. Climate, 21, 1669–1679, https://doi.org/10.1175/2007JCLI1992.1, 2008. a
Ulbrich, U., Leckebusch, G. C., and Pinto, J. G.: Extra-tropical cyclones in the present and future climate: a review, Theor. Appl. Climatol., 96, 117–131, https://doi.org/10.1007/s00704-008-0083-8, 2009. a
Vergara-Temprado, J., Ban, N., Panosetti, D., Schlemmer, L., and Schär, C.: Climate Models Permit Convection at Much Coarser Resolutions Than Previously Considered, J. Climate, 33, 1915–1933, https://doi.org/10.1175/JCLI-D-19-0286.1, 2020. a, b
Wernli, H. and Davies, H. C.: A Lagrangian-based analysis of extratropical cyclones. I: The method and some applications, Q. J. Roy. Meteor. Soc., 123, 467–489, https://doi.org/10.1002/qj.49712353811, 1997. a, b, c
Williams, K., Bodas-Salcedo, A., Déqué, M., Fermepin, S., Medeiros, B., Watanabe, M., and Williamson, D.: The Transpose-AMIP II experiment and its application to the understanding of Southern Ocean cloud biases in climate models, J. Climate, 26, 3258–3274, https://doi.org/10.1175/JCLI-D-12-00429.1, 2013. a
Willison, J., Robinson, W. A., and Lackmann, G. M.: The importance of resolving mesoscale latent heating in the North Atlantic storm track, J. Atmos. Sci., 70, 2234–2250, https://doi.org/10.1175/JAS-D-12-0226.1, 2013. a, b
Willison, J., Robinson, W. A., and Lackmann, G. M.: North Atlantic storm-track sensitivity to warming increases with model resolution, J. Climate, 28, 4513–4524, https://doi.org/10.1175/JCLI-D-14-00715.1, 2015. a
Wimmer, M., Rivière, G., Arbogast, P., Piriou, J.-M., Delanoë, J., Labadie, C., Cazenave, Q., and Pelon, J.: Diabatic processes modulating the vertical structure of the jet stream above the cold front of an extratropical cyclone: sensitivity to deep convection schemes, Weather Clim. Dynam., 3, 863–882, https://doi.org/10.5194/wcd-3-863-2022, 2022. a
Zängl, G., Reinert, D., Rípodas, P., and Baldauf, M.: The ICON (ICOsahedral Non-hydrostatic) modelling framework of DWD and MPI-M: Description of the non-hydrostatic dynamical core, Q. J. Roy. Meteor. Soc., 141, 563–579, https://doi.org/10.1002/qj.2378, 2015. a, b