the Creative Commons Attribution 4.0 License.
the Creative Commons Attribution 4.0 License.
 | 12 Jul 2022
The role of cyclones and potential vorticity cutoffs for the occurrence of unusually long wet spells in Europe
Matthias Röthlisberger
Barbara Scherrer
Andries Jan de Vries
Raphael Portmann
The synoptic dynamics leading to the longest wet spells in Europe are so far poorly investigated despite these events' potentially large societal impacts. Here we examine the role of cyclones and potential vorticity (PV) cutoffs for unusually long wet spells in Europe, defined as the 20 longest uninterrupted periods with at least 5 mm daily accumulated precipitation at each ERA-Interim grid point in Europe (this set of spells is hereafter referred to as S20). The S20 occur predominantly in summer over the eastern continent, in winter over the North Atlantic, in winter or fall over the Atlantic coast, and in fall over the Mediterranean and European inland seas. Four case studies reveal distinct archetypal synoptic storylines for long wet spells: (a) a 7 d wet spell near Moscow, Russia, is associated with a single slow-moving cutoff–cyclone couple; (b) a 15 d wet spell in Norway features a total of nine rapidly passing extratropical cyclones and illustrates serial cyclone clustering as a second storyline; (c) a 12 d wet spell in Tuscany, Italy, is associated with a single but very large cutoff complex, which is replenished multiple times by a sequence of recurrent anticyclonic wave breaking events over the North Atlantic and western Europe; and (d) a 17 d wet spell in the Balkans features intermittent periods of diurnal convection in an environment of weak synoptic forcing and recurrent passages of cutoffs and thus also highlights the role of diurnal convection for long wet spells over land. A systematic analysis of cyclone and cutoff occurrences during the S20 across Europe reveals considerable spatial variability in their respective role for the S20. For instance, cyclones are present anywhere between 10 % and 90 % and cutoffs between 20 % and 70 % of the S20 time steps, depending on the geographical region. However, overall both cyclones and cutoffs appear in a larger number and at a higher rate during the S20 compared to climatology. Furthermore, in the Mediterranean, cutoffs and cyclones are significantly more persistent during the S20 compared to climatology. Our study thus documents for the first time the palette of synoptic storylines accompanying unusually long wet spells across Europe, which is a prerequisite for developing an understanding of how these events might change in a warming climate and for evaluating the ability of climate models to realistically simulate the synoptic processes relevant to these events.
- Article
(19259 KB) - Full-text XML
-
Supplement
(4396 KB) - BibTeX
- EndNote


The nature of precipitation is episodic. In Europe, precipitation episodes vary strongly regarding peak and mean precipitation rates, as well as duration. Unusually large peak precipitation rates, often termed precipitation extremes, have received much attention in the atmospheric dynamics community, and the synoptic-scale dynamical processes leading to precipitation extremes have been studied in detail for precipitation extremes on a wide range of timescales, from minutes (e.g. Lenderink and Van Meijgaard, 2010) to seasons (e.g. Flaounas et al., 2021). Research on extreme precipitation is often motivated by these events' relevance for a wide range of natural hazards such as landslides and flooding (e.g. Moore et al., 2012; Rössler et al., 2014; de Vries, 2021). However, studies on individual high-impact events often report an extended duration of the event, for instance 4 consecutive days of heavy rain leading to the record floods in Germany in early summer 2013 (Grams et al., 2014), a sequence of multi-day precipitation episodes causing the devastating Pakistan flood in summer 2010 (Martius et al., 2013), and a temporal clustering of wet periods leading to an emergency spill-over of California's Oroville Dam in February 2017 and mass evacuation of the population living downstream (White et al., 2019; Moore et al., 2020). Clearly, in addition to peak intensities, the temporal characteristics of precipitation episodes are thus highly relevant too.
Previous studies have assessed these characteristics often by focusing on continuous or quasi-continuous episodes of precipitation, so called wet spells (e.g. Berger and Goossens, 1983; Schmidli and Frei, 2005; Tolika and Maheras, 2005; Zolina et al., 2010, 2013). For example, Zolina et al. (2013) found that the mean duration of wet spells in Europe over the last 60 years is between 1.5 d over the Ukraine and southern Russia and 5 d over the Scandinavian Atlantic coast. They reported that the longest wet spells last between 3 (eastern Europe) and 12 d (Scandinavia). It should be noted that these durations depend on the specific definition of wet spells. Furthermore, they found an increasing duration of wet spells during the last 60 years, especially over northern and central Europe, and a slightly decreasing duration over southern Europe during the cold seasons. In Scandinavia and eastern Europe, the duration of wet spells decreased significantly during the warmer seasons. Schmidli and Frei (2005) focused on observational data from Switzerland and identified seasonally and regionally varying trends in the duration of the longest wet spells per year. However, despite a considerable body of literature on statistical characteristics of wet spells, the synoptic-scale dynamical mechanisms leading to precipitation episodes with an unusually long duration – typically 1 to 2 weeks – have so far not been investigated in detail.
For midlatitude extreme precipitation events on timescales from a few hours to a few days it is well known that a range of weather systems, which often occur jointly, can serve as dynamical precursors. These are extratropical cyclones (Ulbrich et al., 2003; Field and Wood, 2007; Pfahl and Wernli, 2012), fronts (Catto and Pfahl, 2013; Rüdisühli et al., 2020), so-called “warm conveyor belts” (WCBs; Pfahl et al., 2014), long-range horizontal moisture transport (Winschall et al., 2014), often in the form of so-called “atmospheric rivers” (Zhu and Newell, 1998; Ralph et al., 2004; Lavers and Villarini, 2013), upper-level shortwave troughs and cutoffs (Massacand et al., 1998; Martius et al., 2006), and even atmospheric blocks (Sousa et al., 2017; Lenggenhager and Martius, 2019). Given their dynamical relationship and interactions, it is often the combination of these weather systems that leads to an extreme precipitation event (de Vries, 2021). For instance, a narrow upper-level trough is often linked to an elongated surface cold front and intense poleward moisture transport, along which frontal wave cyclogenesis and the subsequent formation of a WCB can occur. All of these weather systems act in concert to produce the heavy precipitation.
The mechanisms and weather systems contributing to the occurrence of unusually long-lasting wet spells are far less clear. Few studies have investigated the causes of long-lasting precipitation episodes, and they mostly focused on multi-day heavy precipitation events rather than (potentially even much longer) wet spells. Moore et al. (2021) investigated multi-day (i.e. longer than 3 d) episodes of heavy precipitation along the North American west coast and argued that, on a general level, multi-day heavy precipitation events occur either when individual rain producing weather systems stall or when multiple such weather systems occur in a serially clustered manner.
In particular in the North Atlantic region, serial clustering of extratropical cyclones is well documented (Mailier et al., 2006; Pinto et al., 2014; Priestley et al., 2017a, b; Dacre and Pinto, 2020). This phenomenon occurs predominantly at the downstream end of the North Atlantic storm track (Mailier et al., 2006; Dacre and Pinto, 2020) and arises over western Europe preferentially when the North Atlantic jet is extended towards Europe, remains at a similar latitude for a prolonged period (typically more than a week), and thereby steers entire cyclone families (i.e. primary cyclones and frontal wave cyclones forming on trailing cold fronts of the primary cyclones) into the same region (Pinto et al., 2014; Priestley et al., 2017a; Dacre and Pinto, 2020). During such clustering periods, the jet is kept in place by momentum fluxes arising from cyclonic and anticyclonic Rossby wave breaking on the poleward and equatorward side of the jet, respectively. The process of serial cyclone clustering is clearly relevant for long precipitation episodes as both the extremely wet winter 2013/14 in the United Kingdom (UK) and a large set of multi-day heavy precipitation episodes in California have been related to serial cyclone clustering (Priestley et al., 2017b; Moore et al., 2021).
The stalling of individual cyclones and upper-level flow features as the cause of long-lasting heavy precipitation events has also been documented in multiple cases, e.g. for an event in Spain (Doswell et al., 1998) when a single slow-moving cyclone associated with an upper-level cutoff caused a 7 d heavy precipitation event. Such cutoffs typically form from synoptic-scale Rossby wave breaking, during which upper-level troughs meridionally amplify to an extent in which their evolution is no longer governed by linear wave dynamics and their isentropic potential vorticity (PV) contours start to overturn (McIntyre and Palmer, 1983). Thereby, narrow and meridionally elongated filaments of stratospheric air (i.e. air with PV > 2 PVU), so-called PV streamers (Appenzeller and Davies, 1992), form. As the wave breaking process continues, these PV streamers tend to break up into one or several PV cutoffs, which consist of stratospheric air that is cutoff from the main stratospheric air mass on lower isentropes but remains connected to the stratosphere on higher isentropes (Portmann et al., 2021). Upper-level PV streamers and cutoffs are accompanied by a cyclonic wind field with a far-field effect down to the lower troposphere (Hoskins et al., 1985). Below such PV features the static stability is reduced, which can contribute to the occurrence of deep convection and heavy precipitation (Massacand et al., 1998; Romero et al., 1999; Martius et al., 2006; Portmann et al., 2018; Moore et al., 2019). Moreover, cutoffs in a baroclinic zone are associated with quasi-geostrophic forcing for ascent on their downstream side, cloud formation, and precipitation even if they remain stationary. Since some cutoffs are relatively long-lived and stationary, they can play an essential role in the formation of multi-day precipitation extremes (e.g. Grams et al., 2014). Thus, individual unusually stationary PV streamers and cutoffs also need to be considered as potential dynamical precursors of unusually long-lasting wet spells.
Furthermore, some recent studies have highlighted the role of recurrent upper-level dynamics for long-lasting wet periods. For example Lenggenhager et al. (2019) documented a case where recurrent PV streamer formation in association with an atmospheric block induced a prolonged wet period and flooding on the Alpine south side. Along a similar line of arguments Ali et al. (2021) showed that recurrent synoptic-scale Rossby wave packets (i.e. a succession of wave packets that are each in phase such that multiple troughs form repeatedly in the same region; see Röthlisberger et al., 2019, for details) significantly increase the duration of summer wet spells in parts of central Europe and Iberia.
In summary, previous research focused on the statistics of wet spells or on the dynamics of short-term to multi-day heavy precipitation events but rarely on the dynamical mechanisms responsible for unusually long-lasting wet spells. However, considering the potentially high societal impact of unusually long wet spells and the reported trend of increasing wet spell duration, it is crucial to improve our understanding of the dynamical processes that lead to these events. Previous studies clearly identified serial clustering of extratropical cyclones and stalling individual or recurrent upper-level cyclonic flow features (e.g. PV cutoffs) as being key for multi-day heavy precipitation events. Here we hypothesize that extratropical cyclones and PV cutoffs also play an important role for the quasi-continuous precipitation during unusually long wet spells. Therefore, we pragmatically choose these two weather systems and examine their role for the formation of unusually long wet spells in Europe. Specifically, the purpose of this study is to identify unusually long wet spells in Europe using ERA-Interim reanalysis data (Dee et al., 2011) and to quantify the occurrence of cyclones and cutoffs during these spells. Hereby, we focus on the 20 longest wet spells (as per our definition of wet spells, see below) at each ERA-Interim grid point in Europe and address the following research questions:
-
How do the duration, accumulated precipitation, average precipitation rate, and seasonality of the longest wet spells vary across Europe?
-
What synoptic storylines accompany these unusually long wet spells and how are cyclones and cutoffs involved in the generation of these wet spells?
-
How do the roles of cyclones and cutoffs in these synoptic storylines vary across Europe?
-
Where and how do the characteristics of cyclones and cutoffs during the longest wet spells differ significantly from climatology?
The structure of the paper is as follows. In Sect. 2 we introduce the data used in this study and elaborate on the statistical analyses performed here. The results of this study are presented in Sect. 3. We first discuss climatological characteristics of the longest wet spells in Europe (Sect. 3.1), then present four case studies of unusually long wet spells at different locations, which each feature a distinct archetypal synoptic storyline (Sect. 3.2), and finally address research questions (3) and (4) by systematically analysing the occurrence of cyclones and PV cutoffs during the 20 longest spells at each grid point (Sect. 3.3). The paper ends with a discussion of these results (Sect. 4), as well as a summary and the conclusions of this study (Sect. 5).
2.1 ERA-Interim
We use data from the European Centre for Medium-Range Weather Forecasts (ECMWF) ERA-Interim re-analysis from 1 January 1979 to 31 December 2018 for identifying wet spells and for the additional weather system investigations. ERA-Interim data have originally been produced with a T255 resolution and are interpolated here to a regular 1∘ latitude by 1∘ longitude grid. In ERA-Interim, precipitation is not an assimilated variable but rather stems from short-range model forecasts, with lead times of 6–18 h, and is thus subject to model limitations and forecast errors. Pfahl and Wernli (2012) showed that indeed the intensity of sub-daily ERA-Interim precipitation extremes is often underestimated compared to satellite-observation-based estimates, in particular in the tropics. However, the timing and location of intense precipitation is well represented in ERA-Interim in comparison with satellite observations (Pfahl and Wernli, 2012).
2.2 Definition of the longest wet spells
Here we focus on episodes with uninterrupted and significant but not necessarily extreme precipitation. We therefore define a wet spell S as a sequence of consecutive days, each with at least 5 mm accumulated precipitation (which is the sum of large-scale and convective precipitation). At each grid point with latitude and longitude coordinates (y,x) the 20 longest wet spells are considered, and this set of spells is referred to as S20(y,x), in which the nth longest spell (i.e. an individual event with a duration, starting date, accumulated precipitation value, etc.) is denoted as Sn(y,x). The coordinate specification (y,x) is omitted wherever possible without loss of clarity. Note that alternative definitions of wet spells, for example based on a different daily precipitation threshold or by allowing short gaps between precipitation episodes, would yield distinct sets of events for the top 20 longest wet spells per grid point. Thus, the identification of “the longest wet spells” is to some degree subjective, but the S20 as defined here certainly classify as unusually long wet spells, which, due to the relatively high threshold for daily precipitation, also have the potential to lead to societal impacts. Furthermore, we tested the sensitivity of our results to different sample sizes (top 5 and 10 longest wet spells) and found no qualitative differences, but for these smaller samples the results were statistically less robust.
2.3 Identification of cyclones and PV cutoffs
To identify cyclones the identification scheme of Wernli and Schwierz (2006) is employed, which first identifies local sea level pressure (SLP) minima and then finds for each local SLP minimum the outermost SLP contour that encloses only the respective minimum. This procedure yields a binary cyclone field with individual cyclone objects. The algorithm furthermore tracks these individual objects in time based on the location of the cyclone centre (i.e. SLP minimum) (see Sprenger et al., 2017, for details of the tracking), and only cyclones with a lifetime of at least 24 h are considered in this study.
PV cutoffs are identified and tracked according to the method of Portmann et al. (2021). This method first identifies PV cutoffs on individual isentropic surfaces between 275 and 360 K with 5 K intervals as isolated regions with PV values above 2 PVU following Wernli and Sprenger (2007). Then, PV cutoffs are defined as 3-dimensional objects that are vertically connected to the stratosphere. This largely removes high-PV features of tropospheric origin that arise due to, for example, surface friction or diabatic heating. PV cutoffs are tracked in time based on Lagrangian air parcel trajectories, and only cutoffs with a lifetime of at least 24 h are retained (for details of the identification and tracking see Portmann et al., 2021). A key advantage of this approach compared to earlier PV cutoff identification and tracking routines is that it is independent of the selection of single vertical levels. For subsequent analyses we use the projection of the 3-dimensional cutoff objects onto the Earth's surface, which, as for cyclones, yields binary cutoff fields with individual cutoff objects.
2.4 Additional synoptic variables
In the synoptic discussion of example cases we furthermore consider the integrated vapour transport vector (IVT) and its magnitude (IVT, in units of kg m−1 s−1) which are defined as (e.g. Newell et al., 1992; de Vries, 2021)
and , respectively. Here, g is the gravitational acceleration, q is specific humidity, and v is the horizontal wind vector. Moreover, to quantify the effect of upper-level flow features (e.g. cutoffs) on vertical motion we examine the quasi-geostrophic ω forcing (in hPa h−1), computed as in Graf et al. (2017) and Besson et al. (2021). Specifically, we use exactly the same data as Besson et al. (2021) and examine the quasi-geostrophic ω at 500 hPa, forced from the atmospheric layers above 550 hPa, which is hereafter referred to simply as QGω (see Besson et al., 2021, and references therein for further details on the QGω data and their computation).
2.5 Quantifying the characteristics of cyclones and PV cutoffs during the S20
To quantify the characteristics of cyclones and cutoffs occurring during the S20(y,x), we consider for each grid point (y,x) cyclones and cutoffs whose masks overlapped with a circle of radius r around (y,x) during at least one 6-hourly time step of the S20(y,x). For such cyclones and cutoffs we use the terminology “occurring at (y,x)” hereafter for simplicity.
We compute four quantities for these cyclones and cutoffs:
-
the “cyclone/cutoff fraction”, which corresponds to the fraction of all S20 time steps with cyclones/cutoffs occurring at (y,x). This quantity is hereafter referred to as Ff(y,x), whereby f corresponds to the respective feature (cyclones or cutoffs);
-
the “number of distinct cyclones/cutoffs” per spell, Nf(y,x);
-
the “cyclone/cutoff period”, Pf(y,x), which is the average duration between the arrival of distinct cyclones/cutoffs within the radius r around (y,x), computed as the summed duration of the S20(y,x) divided by Nf(y,x);
-
the “cyclone/cutoff residence time”, Rf(y,x), which is the average duration during which distinct cyclones/cutoffs overlap with the radius r around (y,x).
We tested values of r of 200, 400, and 600 km and found little qualitative differences for any of these r values. For brevity, only the results for r=400 km are discussed in this paper, while those for r=200 km and r=600 km are shown in Figs. S6–S9 in the Supplement. Note that in the computation of these metrics we consider cyclones and cutoffs also if they overlap with the respective circle only during a short period, e.g. a single time step. Thus, in particular the residence time should be interpreted with such situations in mind. Furthermore, metrics P and R allow for distinguishing between recurrent features and stalling features in the following way: recurrent cyclones or cutoffs manifest themselves with a short cyclone/cutoff period (P), while long cyclone/cutoff residence times (R) are expected for stalling cyclones or cutoffs.
To identify locally anomalous behaviour of cyclones and cutoffs during the respective S20 we perform a Monte Carlo simulation in which we test the null hypothesis that the four quantities and the occurrence of the S20 are unrelated, and thus the observed F, N, P, and R correspond to respective climatological values plus some random noise. The Monte Carlo approach is analogous to that in Röthlisberger et al. (2016) and detailed here exemplarily for the cyclone fraction, Fcyclone(y,x), but is applied in exactly the same fashion for all four metrics and both weather systems. First, the occurrence of the spells is randomized by shuffling the years of the S20(y,x) while retaining the actual calendar days of these spells. Second, using these randomized spell dates, a randomized cyclone fraction, , is computed exactly as the true cyclone fraction, Fcyclone(y,x). Third, this process is repeated 1000 times, and the resulting distribution of values is the distribution of Fcyclone(y,x) under the null hypothesis in which Fcyclone(y,x) and the occurrence of the S20(y,x) are unrelated. Fourth, a two-sided p value is then computed at each grid point by comparing Fcyclone(y,x) with the distribution of the values. Hereby, a p value of zero is assigned if Fcyclone(y,x) lies outside the range of the values. Fifth, we reject the above null hypothesis for Fcyclone(y,x) values at a grid-point-wise significance level of 0.01. Note that the randomization through the shuffling of the years of the S20(y,x) conveniently circumvents issues arising from the spatially varying seasonality of the S20(y,x).
Furthermore, in Sect. 3.3 we present anomalies of the four quantities for both weather systems. These are computed relative to climatological F, N, P, and R derived as the mean over the respective 1000 randomized values (e.g. the climatological Fcyclone(y,x) is the mean of the 1000 ). Note that due to the spatially varying seasonality and duration of the S20 the exact calendar days, as well as the number of days contributing to the climatological values of F, N, P, and R, vary in space.
3.1 Climatological characteristics of the longest wet spells
We begin by discussing basic characteristics of the S20 and their geographical variations. In many regions of Europe, the median duration of the S20 is on the order of 4 to 7 d (Fig. 1a). The S20 are longest predominantly along the Atlantic coastal regions, as well as in areas of elevated topography (see also Fig. S1f), and shortest over the Barents, Black, and Baltic seas. Median durations range from fewer than 4 d over parts of northern Scandinavia, Crimea, Germany, and Poland to more than 2 weeks in western Norway (Fig. 1a). The overall longest European ERA-Interim wet spell occurred at 62∘ N, 6∘ E, about 300 km north of Bergen, Norway (not shown). It started on 9 September 2018, lasted for 28 d, and finally ended on 6 October 2018. The accumulated precipitation during the S20 co-varies with their median duration (Fig. 1a, b), and largest accumulations are found in Norway, north-western Iberia, and Scotland (> 200 mm in the median). The largest precipitation accumulation during a single wet spell again occurred in western Norway, at 61∘ N, 6∘ E, in January 1989 (not shown). The spell lasted for 24 d, and the accumulated ERA-Interim precipitation amounted to 471 mm. Note that at each grid point the variability in the duration and accumulated precipitation of the S20 is large, and both the duration and accumulated precipitation can differ by more than a factor of 2 between the longest (S1) and 20th longest spell (S20) at each grid point (Fig. S1a–d). This is an expected result as the S20 constitute the top few percent of all wet spells with regard to duration at each grid point (Fig. S1e).
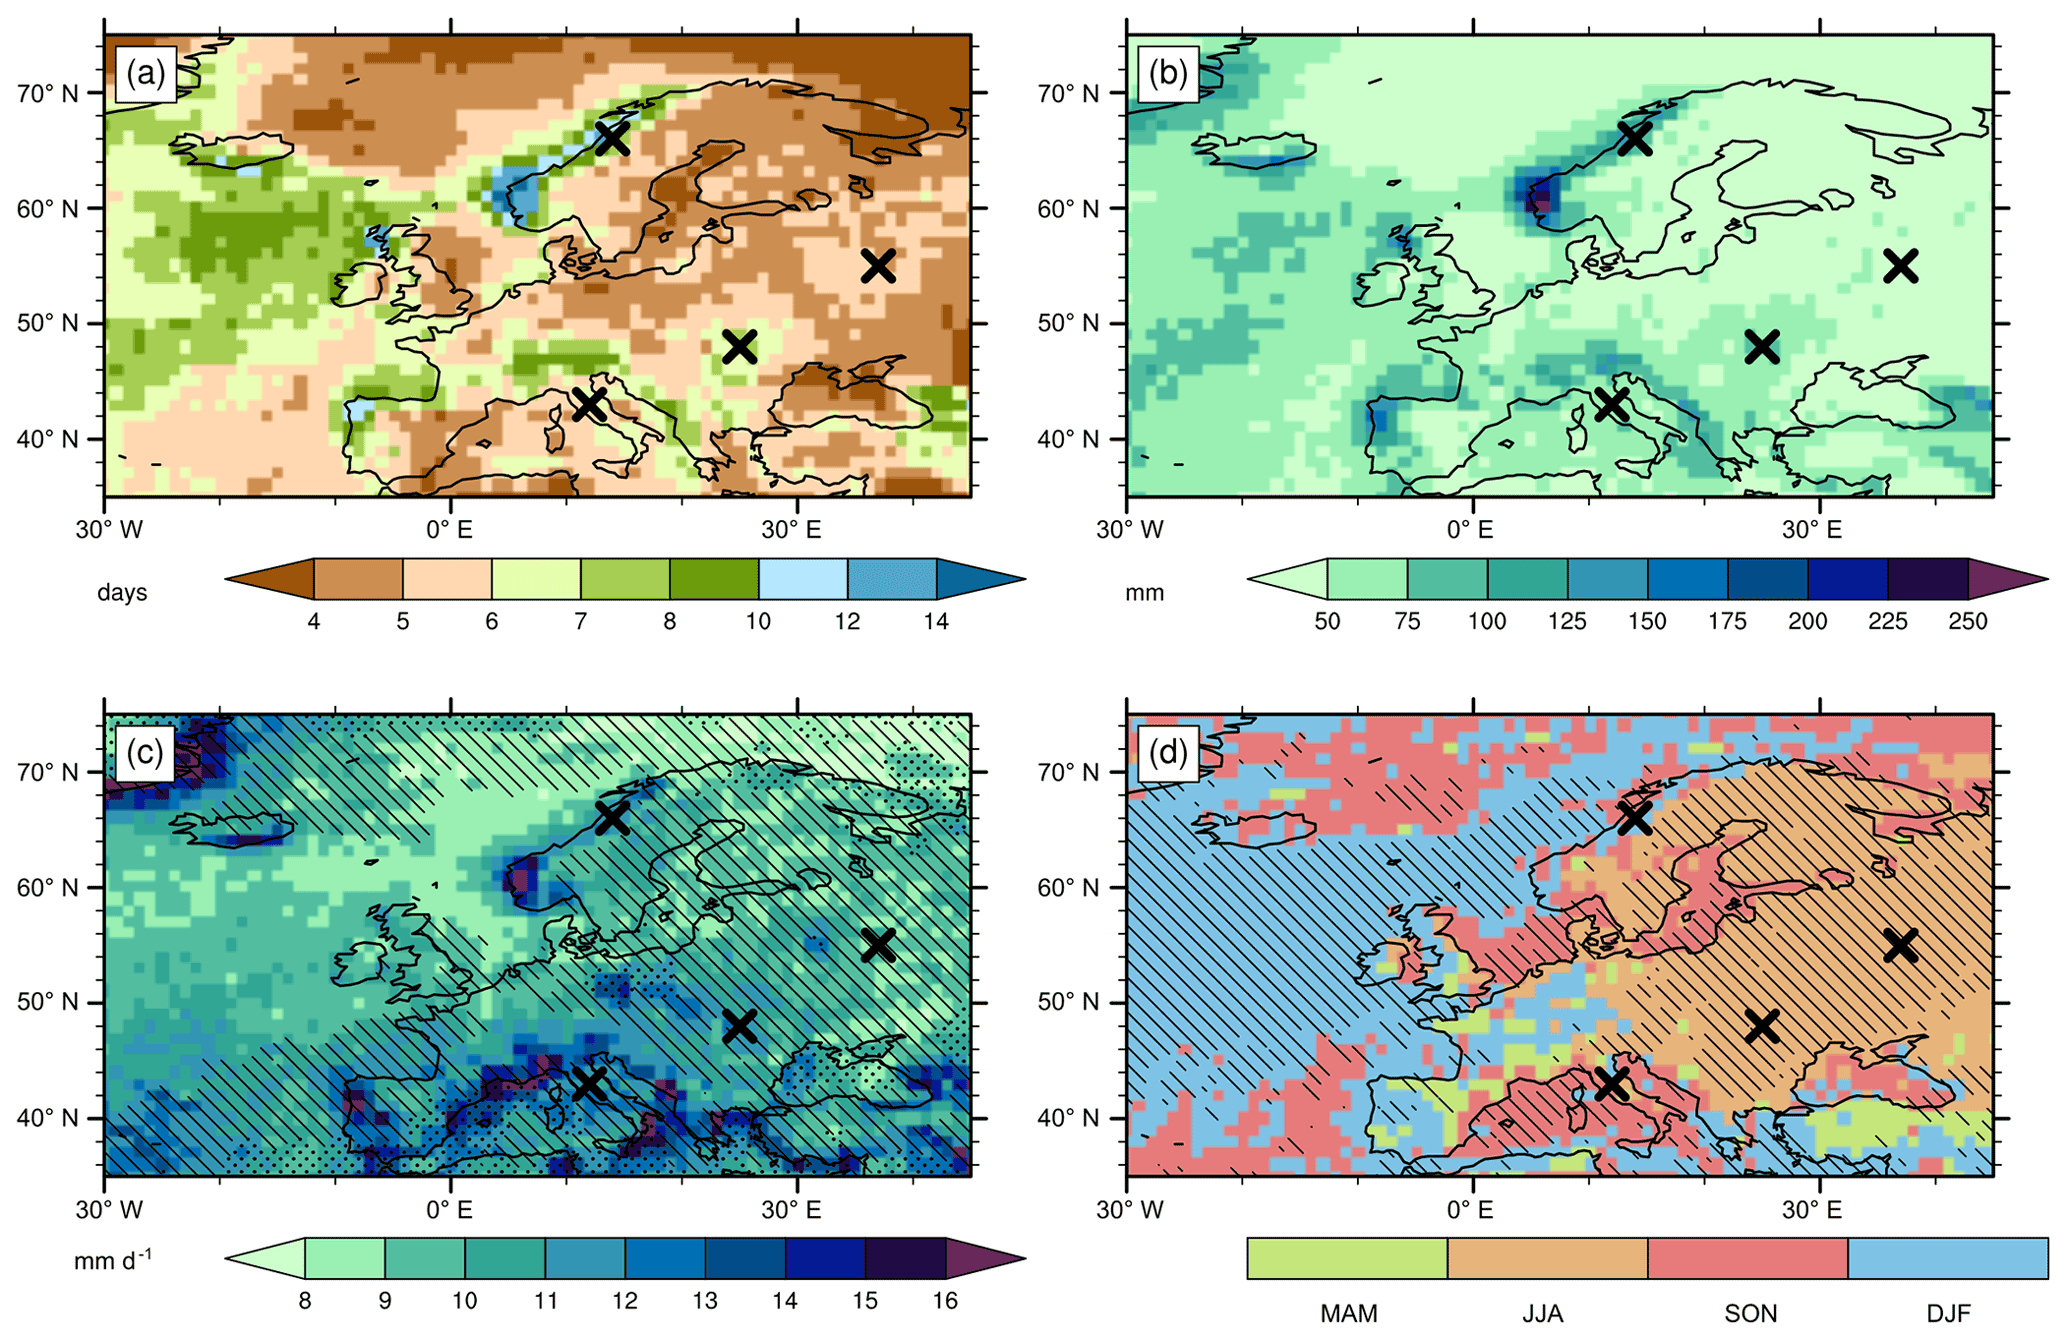
Figure 1Characteristics of the 20 longest wet spells at every ERA-Interim grid point (S20). (a) Median duration, (b) median accumulated precipitation, and (c) average daily precipitation rate; (d) the season in which the largest fraction of the S20 start. Hatching and stippling in (c) depict regions where the average precipitation rate during the S20 exceeds the 95th and 97.5th percentiles, respectively, of all ERA-Interim wet days, defined as days with > 0.1 mm precipitation. Hatching in (d) shows regions where at least 12 of the S20 start in the same season. Crosses identify grid points for which the S20 are further examined in Figs. 2–7.
The average daily precipitation rate during the S20 exceeds 5 mm d−1 by definition (Fig. 1c), and its spatial variability differs somewhat from those of the median S20 duration and accumulated precipitation. The largest daily precipitation rates during the S20 are again found along the Iberian Atlantic coast and western Norway, with values in excess of 15 mm d−1, but also in Mediterranean coastal regions. Average daily precipitation rates during the S20 are locally anomalous, although not overly extreme. In most regions of Europe, they exceed the 95th percentile of the accumulated daily precipitation during all wet days (defined here as all days of the year with > 0.1 mm accumulated precipitation) but are below percentile 97.5 (Fig. 1c), implying that between 1 out of 20 and 1 out of 40 wet days feature comparable precipitation accumulations as the ones observed on average during the S20. This result underlines that the S20 constitute a set of potentially high-impact precipitation episodes that are different from heavy precipitation events commonly identified based on very high (≥ 99th) percentiles of (sub-)daily precipitation in previous studies (e.g. Pfahl and Wernli, 2012; Lenggenhager and Martius, 2019; Moore et al., 2021; de Vries, 2021).
The seasonality of the S20 exhibits a clear spatial pattern. Over the North Atlantic and the eastern Mediterranean, most of the S20 occur in winter (December–February, DJF) and likewise in southern Iberia and south-western France. Over several coastal seas (the north-western Mediterranean, the North Sea, the Gulf of Bothnia, and the Atlantic coastal seas near Iberia), the S20 occur predominantly in fall (September–November, SON), while over continental eastern Europe (including Sweden, Finland, and western Russia), the vast majority of the S20 happen during summer (June–August, JJA). At most grid points in central Europe, though, no season dominates the occurrence of the S20. In a spatially aggregated sense, spring (March–May, MAM) has by far the lowest number of spells as only 12.8 % of the S20 over land and ocean occurred in MAM, followed by 22.2 % in JJA, 29.1 % in SON, and 35.9 % in DJF. When only considering land grid points, these contributions change markedly, with 17.6 % of land S20 occurring in MAM, 46.4 % in JJA, 19.0 % in SON, and 17.0 % in DJF. Next, we illustrate the palette of synoptic storylines of unusually long wet spells with four case studies of selected wet spells in different regions and seasons. These cases have been selected from a large number of cases we analysed due to their archetypal and illustrative nature.
3.2 Case studies of selected unusually long wet spells
3.2.1 Long wet spell in western Russia – quasi-stationary cutoff–cyclone couple
At 55∘ N, 37∘ E, close to Moscow, Russia, the longest wet spell (S1(55∘ N, 37∘ E)) occurred in July 2013 and lasted for 7 d (Fig. 2a). An examination of the large-scale flow pattern reveals a very persistent upper-level PV cutoff with a surface cyclone underneath during the entire spell (Fig. 3). At 12:00 UTC on 20 July, the first day of the spell, the cutoff C1 was located west of Moscow, reaching from 75∘ N southward to the Black Sea, with a weak surface cyclone L1 to its east (Fig. 3a). Precipitation occurred at the south-eastern flank of the cutoff. Closer analysis shows that precipitation was primarily convective at 55∘ N, 37∘ E (visible, for example, from the diurnal pattern in precipitation at 55∘ N, 37∘ E; Fig. 2a), supported by QGω ascent (Fig. S2a) and the decreased tropospheric static stability induced by the upper-level cutoff. Within the next 4 d, little changed in this synoptic configuration over western Russia, although from 21 July onwards, a second cutoff–cyclone pair (L2, C2) formed over the British Isles, resulting in a large-scale omega-type blocking pattern (Fig. 3b–e). The surface cyclone L1 weakened considerably between 23 and 25 July, when its local sea level pressure minimum was no longer identified as a cyclone by the cyclone identification scheme (Fig. 3f). However, it re-appeared as an identified cyclone at 12:00 UTC on 26 July (labelled L1* in Fig. 3g, h) and propagated eastward between 26 and 27 July, in tandem with the persisting cutoff C1 (Fig. 3f–h), which ultimately terminated the wet spell at 55∘ N, 37∘ E on 27 July (Fig. 3h). Throughout the entire period, precipitation during daytime (06:00–18:00 UTC) strongly exceeded precipitation during nighttime (Fig. 2a), suggesting primarily diurnal convective precipitation throughout the entire period. However, upper-level forcing too contributed to precipitation at 55∘ N, 37∘ E during the first days of the spell (Fig. S2). This case illustrates a first synoptic storyline of unusually long-lasting wet spells, in which a single quasi-stationary upper-level cutoff–surface cyclone couple repeatedly produces substantial precipitation in the same regions by providing quasi-geostrophic forcing for ascent and destabilization of the troposphere underneath, and it thereby fosters diurnal convection (Hoskins et al., 1985; Portmann et al., 2018).
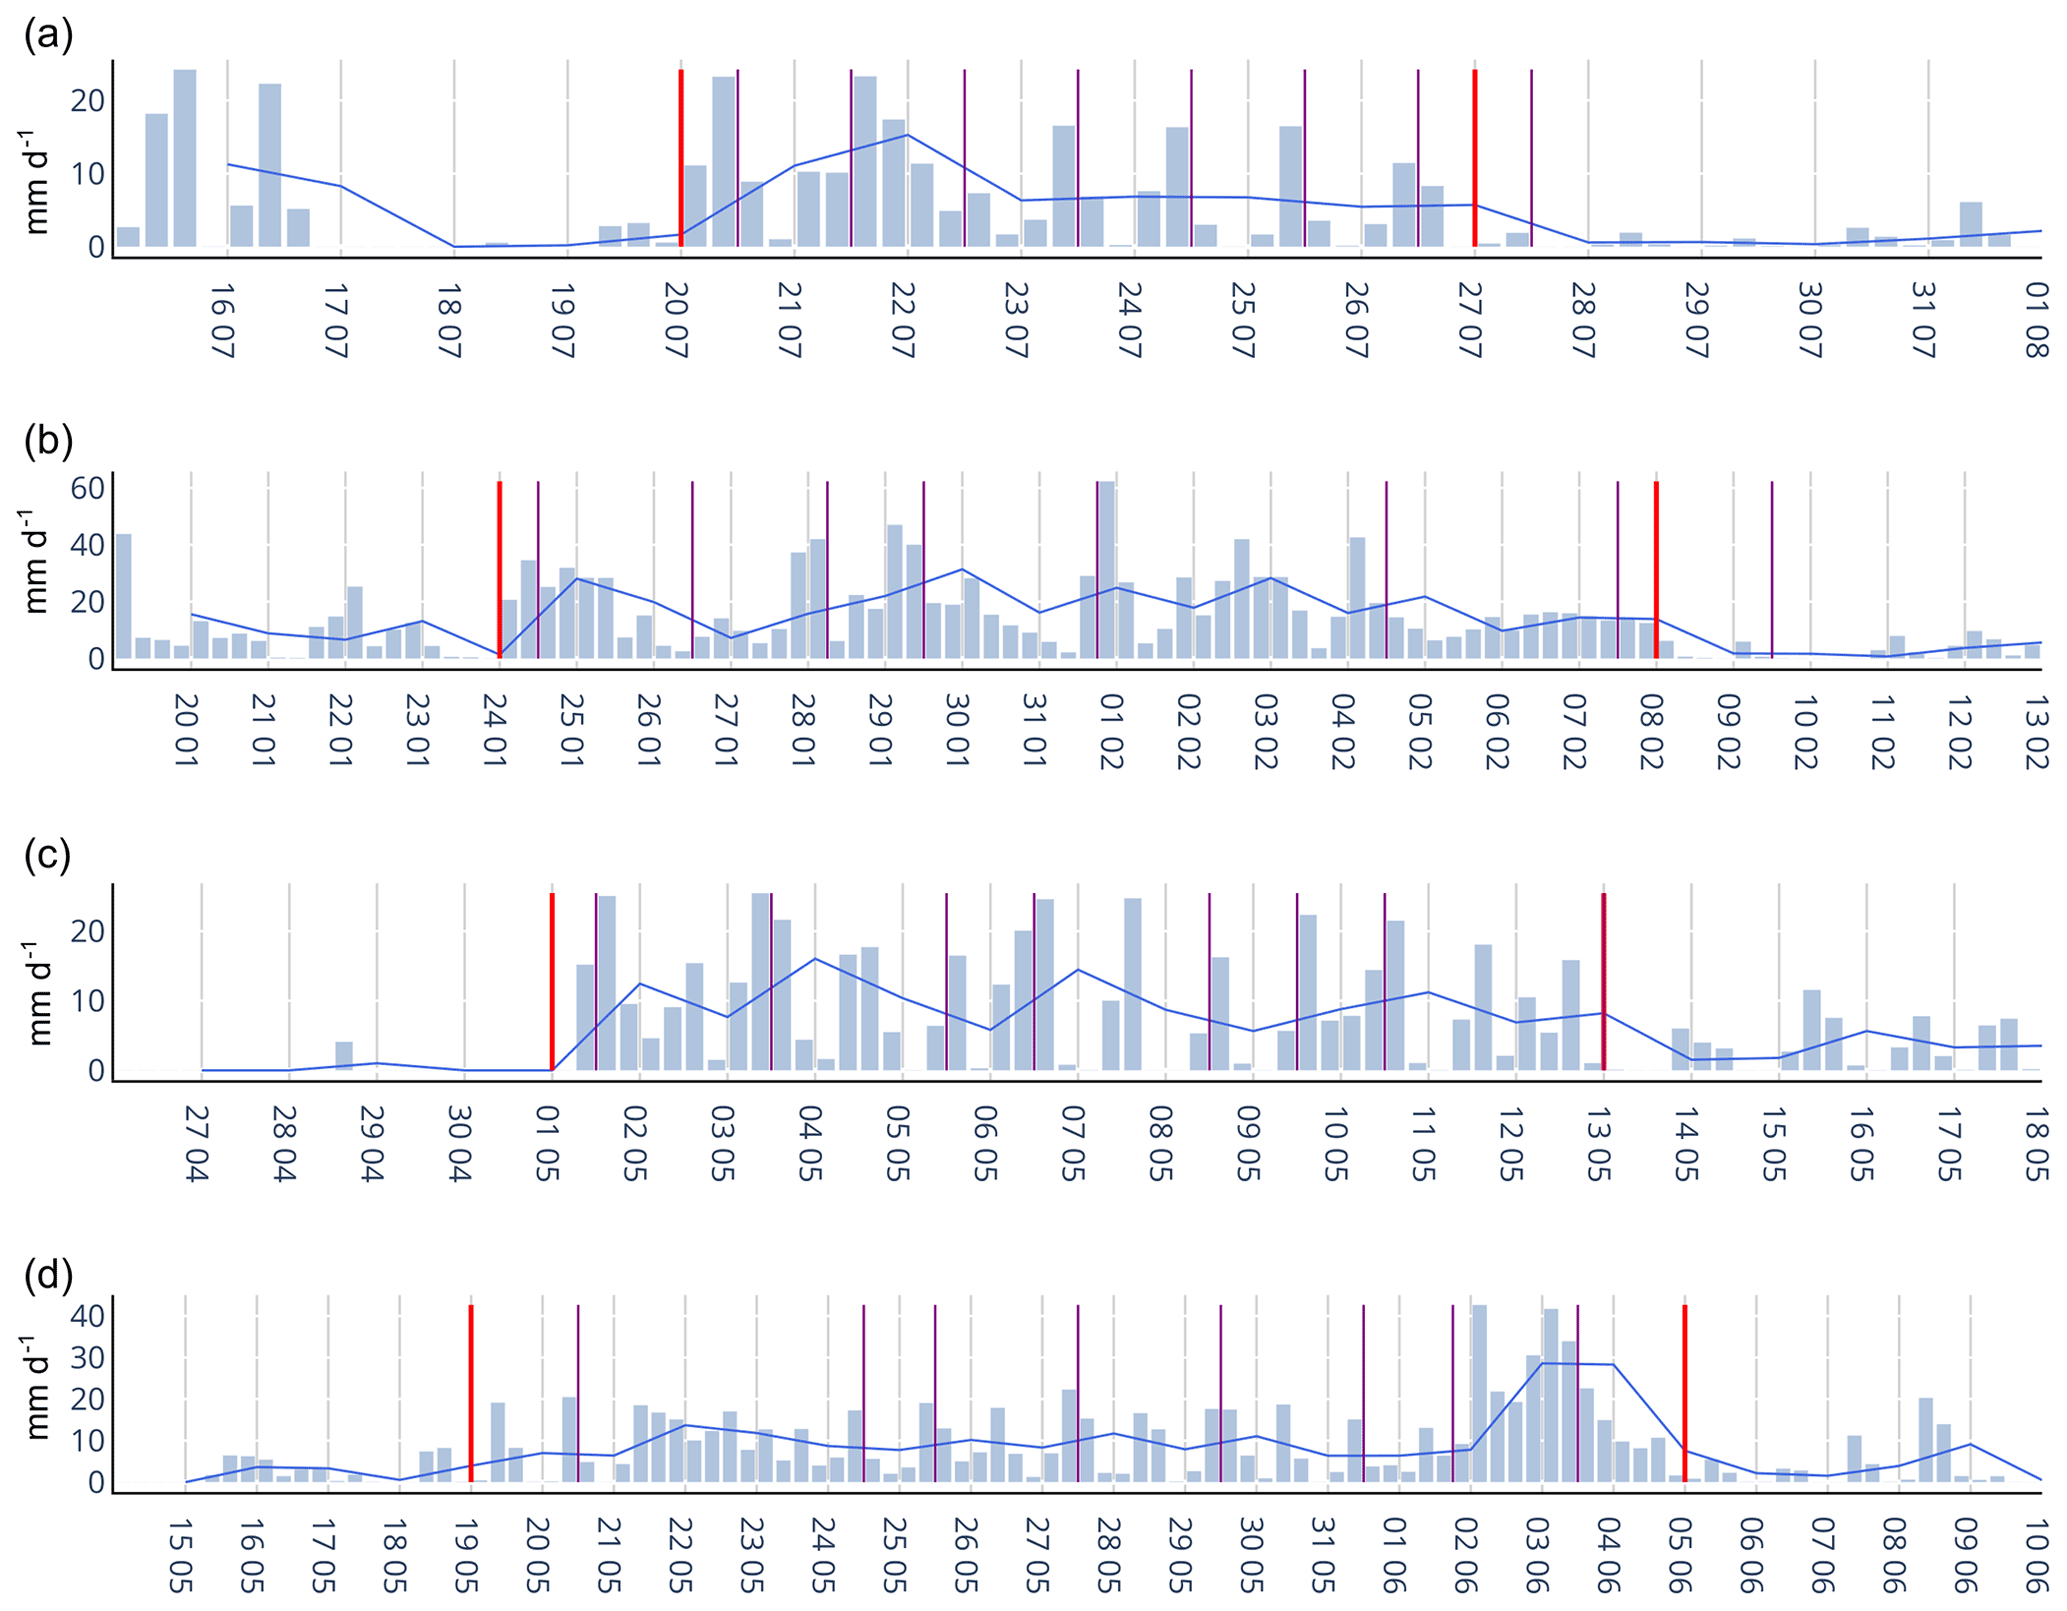
Figure 2Time evolution of the wet spells illustrated in Figs. 3–6. The panels show the precipitation evolution during the longest wet spell at (a) 57∘ N, 37∘ E near Moscow, Russia, in 2013, (b) at 66∘ N, 14∘ E in Norway in 1989, (c) at 43∘ N, 12∘ E in Tuscany, Italy, in 2018, and (d) at 48∘ N, 25∘ E in Romania in 1988. Bars depict 6-hourly precipitation (multiplied by 4), while the bold blue line depicts daily precipitation accumulations. Daily precipitation is depicted for each day at 00:00 UTC and refers to the precipitation accumulation over the preceding 24 h. Red bars mark the onset and termination of each spell, while purple lines indicate the times for which fields are shown in Figs. 3–6. Light vertical lines locate 00:00 UTC of each day.
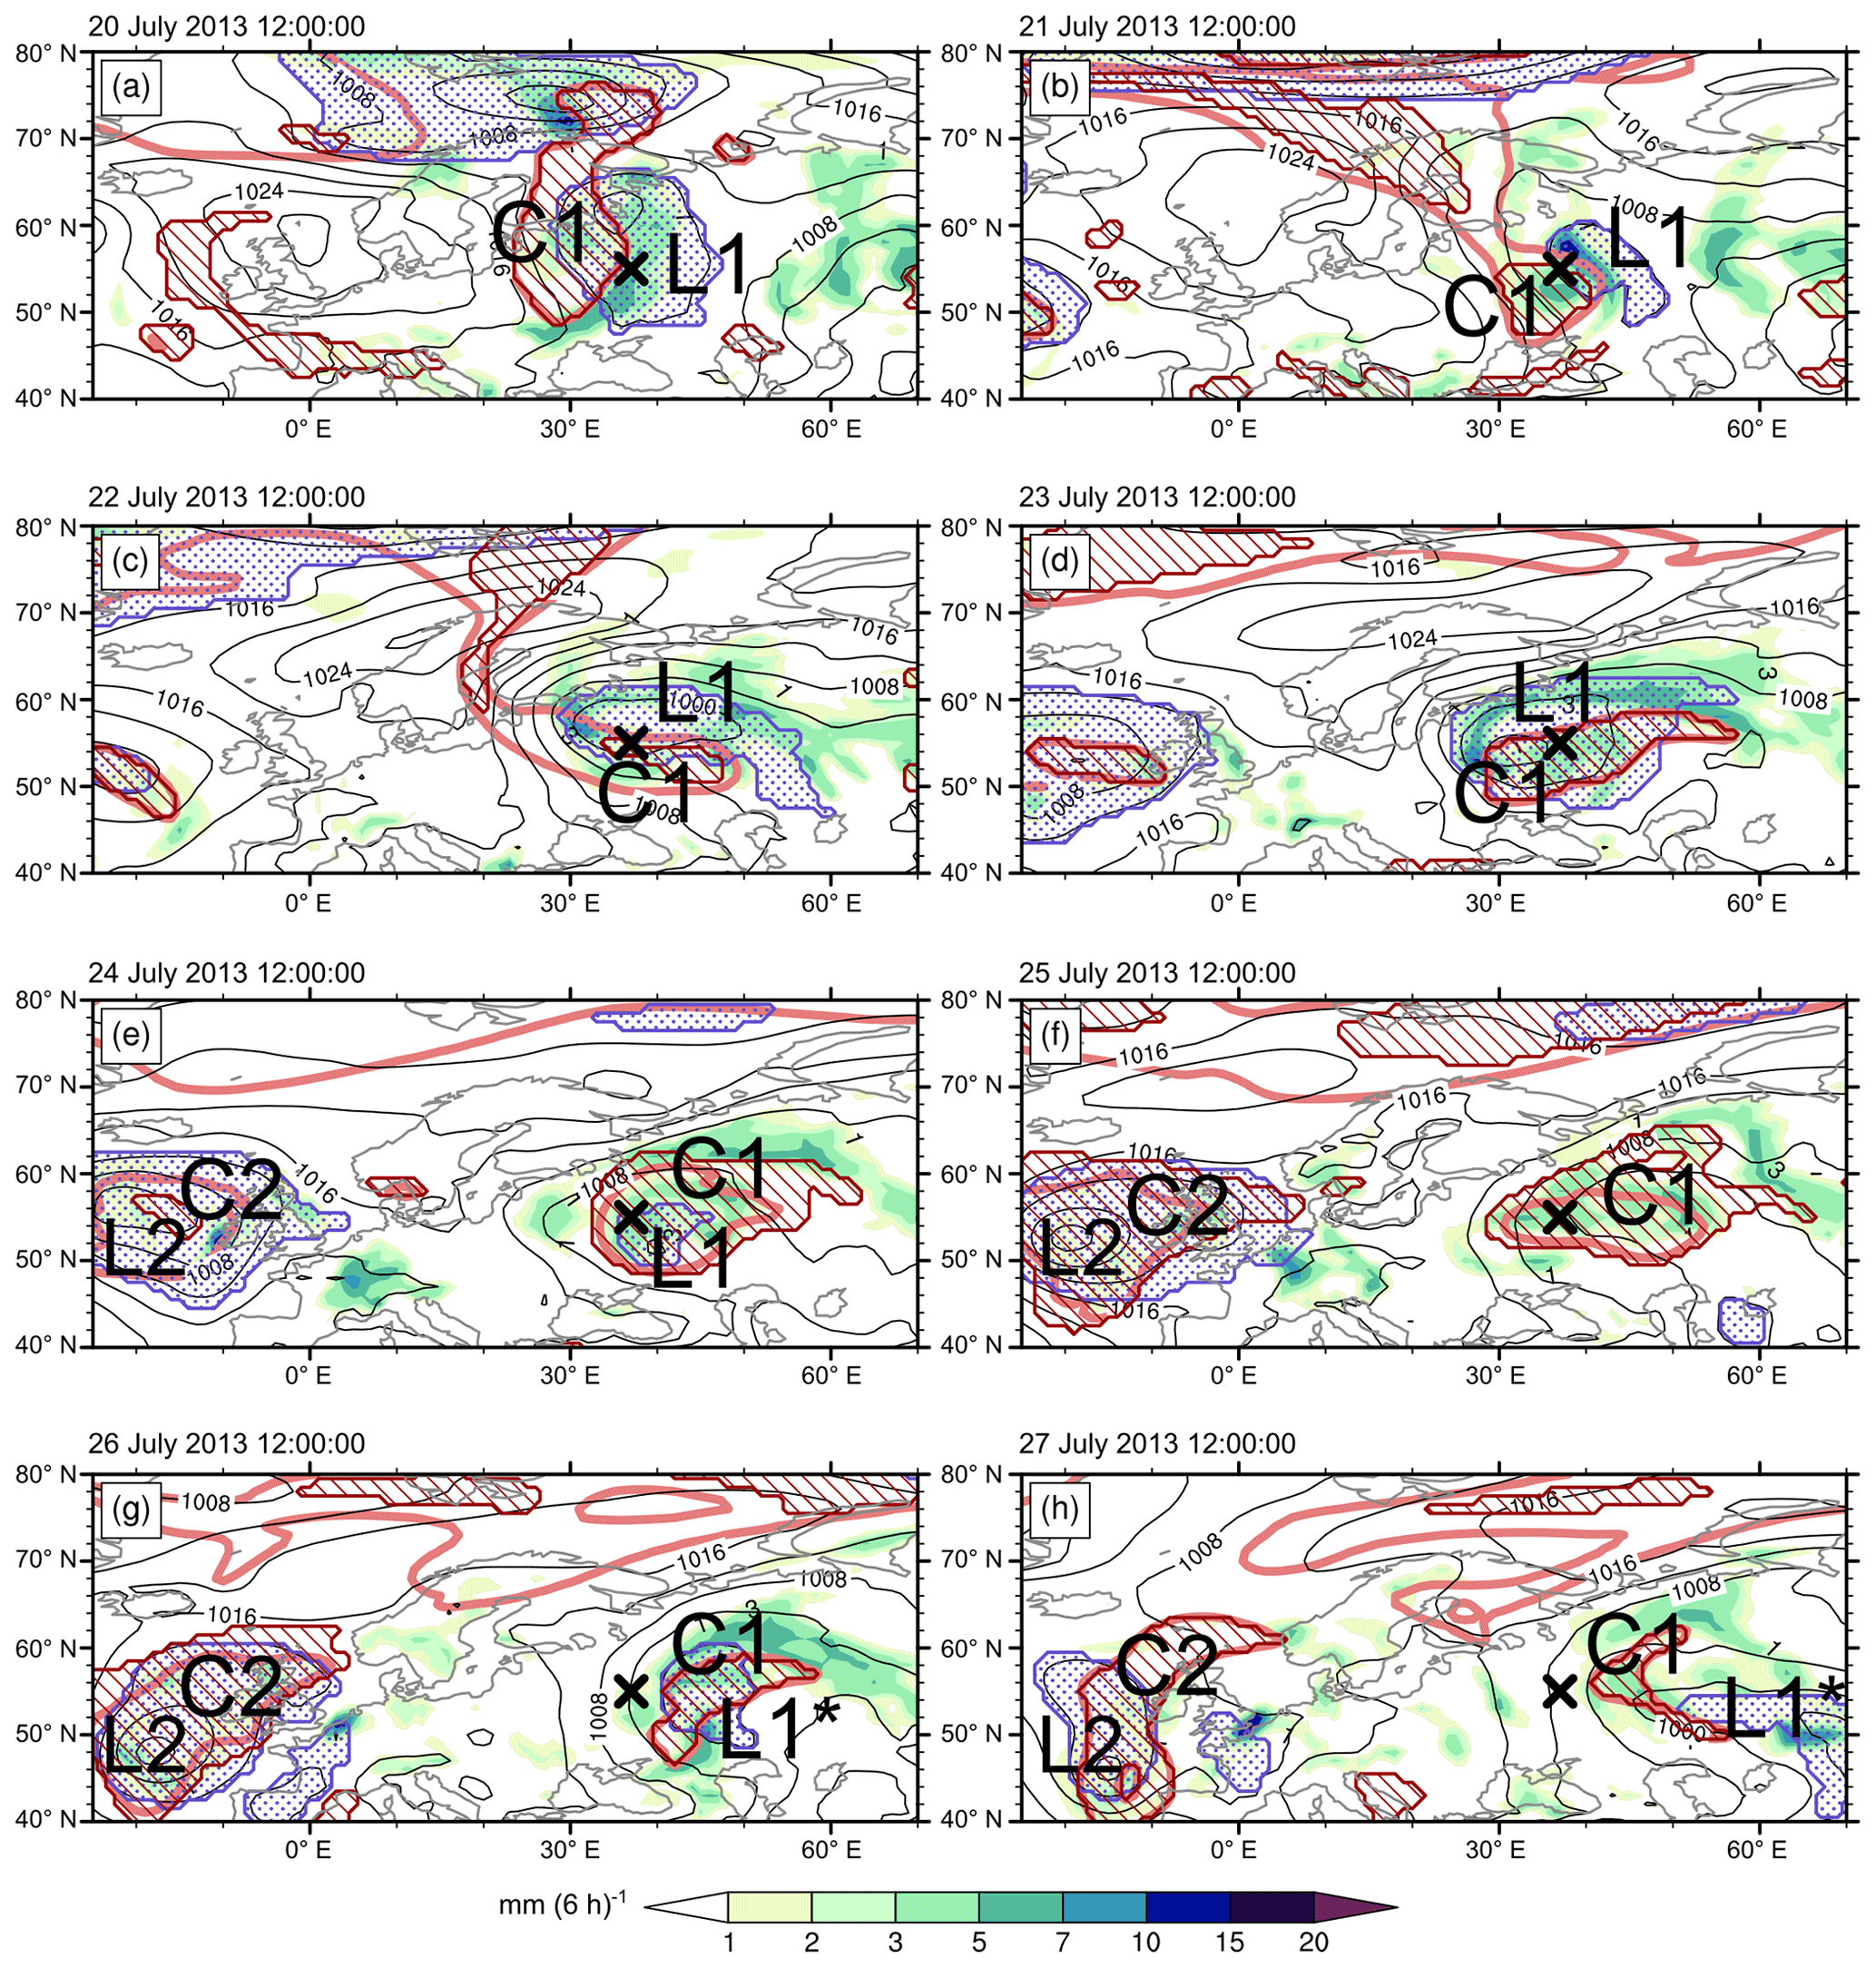
Figure 3Synoptic evolution of the longest wet spell near Moscow, Russia (S1(55∘ N, 37∘ E)). Shading depicts total precipitation accumulated over the preceding 6 h. Light red contours show the 2 PVU dynamical tropopause at 320 K, while black contours show SLP (contour interval of 4 hPa). Cyclones are depicted by blue stippling, and the red hatching depicts the projection of cutoff objects (see “Data and methods” for details), whose outline therefore does not need to be co-located with the 2 PVU contour at 320 K. The black cross in all panels marks the grid point at 55∘ N, 37∘ E. Labels help to identify the features discussed in the main text. Panels are shown daily at 12:00 UTC from 20 to 27 July 2013.
Extending the synoptic analysis to the 20 longest wet spells at the same grid point (S20(55∘ N, 37∘ E)) reveals considerable similarities in the large-scale flow across these events. The PV composite at 310 K for all S20(55∘ N, 37∘ E) time steps shows a cyclonically breaking wave (e.g. Thorncroft et al., 1993) west of 55∘ N, 37∘ E, which is associated with a weak negative SLP anomaly, a negative QGω anomaly covering 55∘ N, 37∘ E, and a north-eastward-directed IVT anomaly extending from the Black Sea towards 55∘ N, 37∘ E (Fig. 7a). During 17 of the S20(55∘ N, 37∘ E) at least one cutoff occurred (one spell featured even four distinct cutoffs), with an Ncutoff(55∘ N, 37∘ E) of 1.65 and Fcutoff(55∘ N, 37∘ E) equal to 0.38. Similarly, for cyclones we also find between zero and four distinct cyclones per spell, with Ncyclone(55∘ N, 37∘ E) equaling 1.9 and Fcyclone(55∘ N, 37∘ E) 0.64. Furthermore, the residence times of cyclones and cutoffs during the S20 (Rcyclone and Rcutoff) at 55∘ N, 37∘ E are 1.59 and 1.1 d, respectively.
3.2.2 Long wet spell in central Norway – sequence of cyclones
A contrasting synoptic storyline is evident for the longest wet spell at 66∘ N, 14∘ E (S1(66∘ N, 14∘ E)), in Norway (Figs. 2b, 4 and S3). This wet spell occurred between 24 January and 7 February 1989 and thus featured 15 continuous days with more than 5 mm accumulated ERA-Interim precipitation (Fig. 2b). At 12:00 UTC on 24 January 1989 (Fig. 4a), the large-scale flow over the North Atlantic was dominated by a broad trough, with a large surface cyclone, L1, with two centres (local SLP minima) north of Iceland and east of the southern tip of Greenland. Over Europe, an amplified ridge, R1, was present, but at its northern fringe a first pulse of onshore moisture transport (Fig. S3a) led to precipitation around 66∘ N, 14∘ E (Fig. 4a) and started the wet spell there. Within the next 2 d (25–26 January), cyclone L1 moved eastwards, and three new SLP minima developed over the North Atlantic (contained in L2 and L3; Fig. 4b). The grid point at 66∘ N, 14∘ E was located continuously in westerly flow associated with onshore moisture transport, and precipitation fell in association with two shortwave troughs propagating across Scandinavia in rapid succession (the latter of the two is visible in Fig. 4b as an upper-level PV filament between the British Isles and Scandinavia), which in addition provided upper-level forcing for ascent (Figs. 4b, S3b). Within the next 5 d (Fig. 4b–e) cyclones L3–L5 formed over the western North Atlantic, rapidly propagated into the Norwegian Sea, and produced significant precipitation at 66∘ N, 14∘ E. From 4 February onwards, the upper-level flow was remarkably zonal for 3 d, leading to continuous onshore moisture transport in particular south of 66∘ N, 14∘ E, at the southern fringe of cyclones L6–L8, which passed to the north of the considered grid point (Fig. 4f, g). Finally, on 7 February, cyclone L9 developed south of Greenland and followed a more meridional track (Fig. 4g, h). L9 rapidly deepened until 9 February in association with upper-level cyclonic wave breaking (Fig. 4h). Rapid upper-level ridge-formation (R3) occurred downstream, presumably aided by diabatic processes occurring in L9's strong warm conveyor belt (not shown). The formation of R3 interrupted the predominantly zonal flow and moisture transport over the eastern North Atlantic (Figs. 4h, S3h) and thereby terminated the wet spell. The few PV cutoffs were mostly small and filamentous and their influence on the wet spell thus seems less obvious.
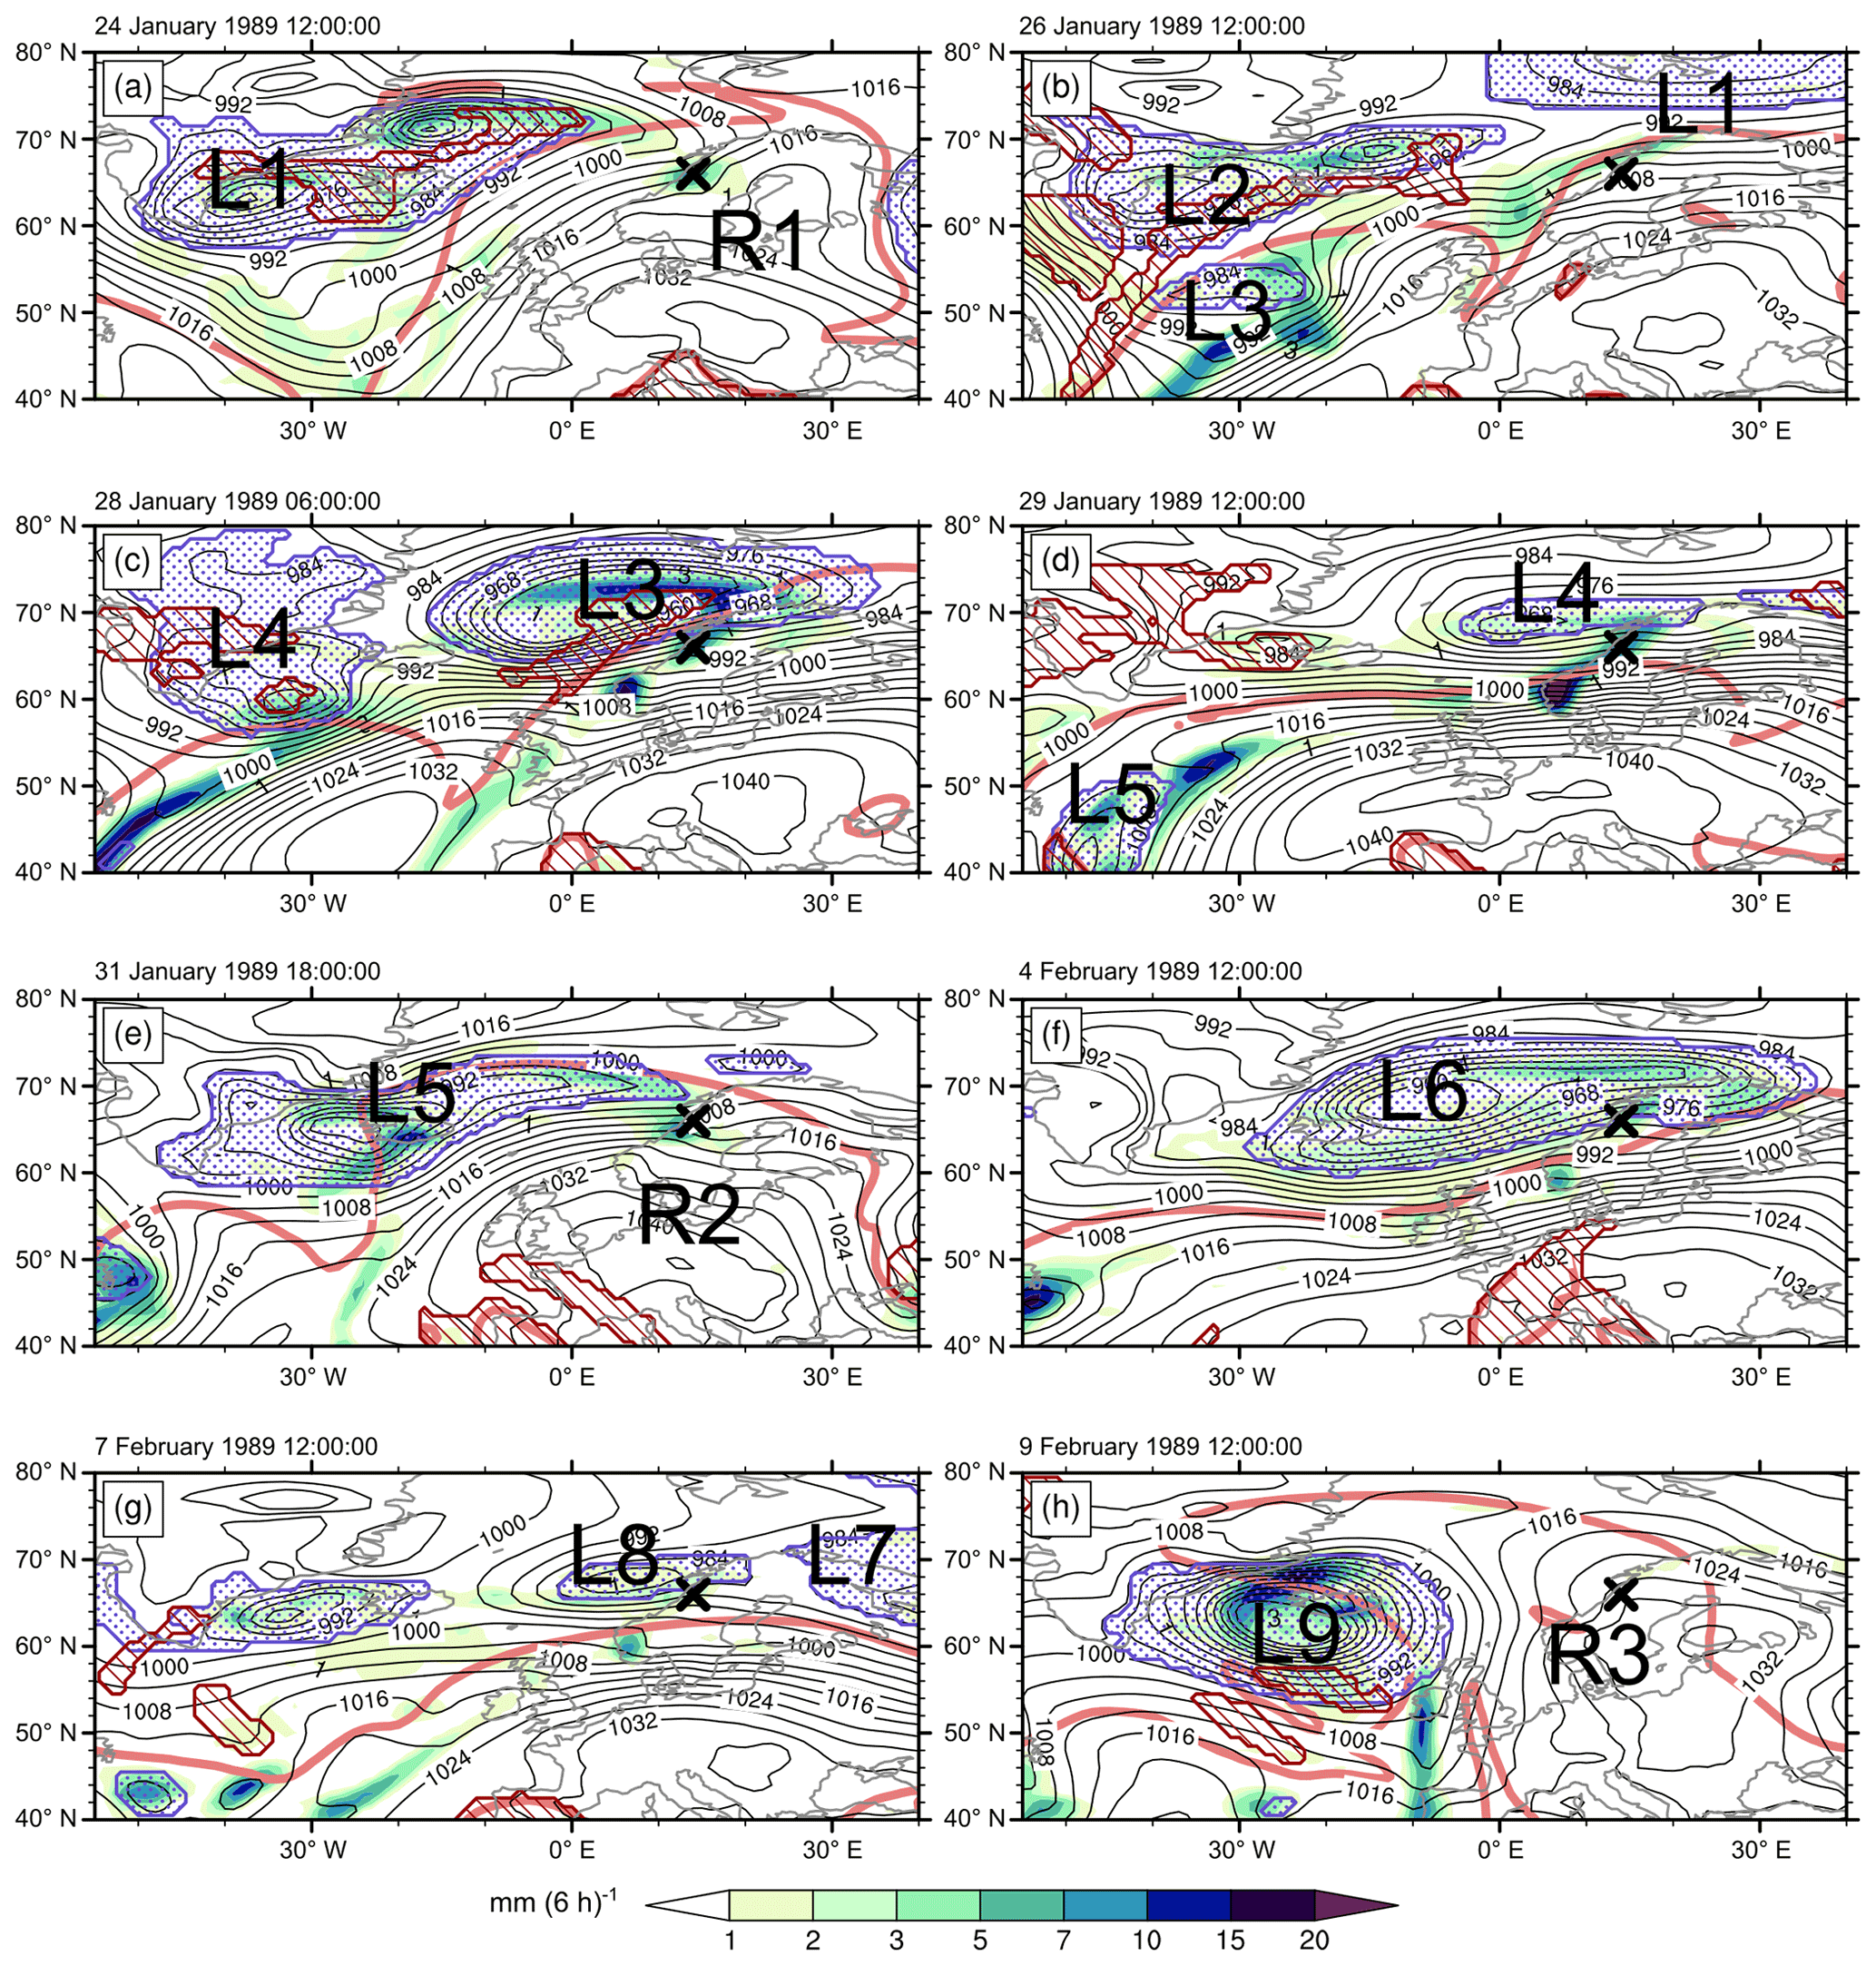
Figure 4As Fig. 3 but for the longest wet spell at 66∘ N, 14∘ E in Norway (S1(66∘ N, 14∘ E)). The light red lines depict 2 PVU at 310 K. The valid time of each panel is shown in the top left.
In summary, the example of S1(66∘ N, 14∘ E) illustrates a second archetypal synoptic storyline for unusually long wet spells, in which a sequence of cyclones cross the same region in rapid succession. Hereby the moist North Atlantic air masses impinging on the western Norwegian mountains conceivably generated orographic precipitation and thereby ensured the uninterrupted formation of precipitation, in particular during transition periods between individual cyclones. Moreover, the synoptic configuration of this spell is reminiscent of the North Pacific “zonal jet configuration” of Moore et al. (2021), within which numerous long-lasting heavy precipitation events in northern California occurred. These authors emphasized the pivotal role of landfalling atmospheric rivers for long-lasting heavy precipitation events occurring in such a flow configuration. In this study we focus on cyclones and PV cutoffs and thus leave exploring the role of atmospheric rivers for the longest European wet spells to future work. Furthermore, it is noteworthy that a total of nine distinct cyclones identified by the Wernli and Schwierz (2006) algorithm were involved in the initiation, continuation, and termination of S1(66∘ N, 14∘ E), which is in stark contrast to the synoptic evolution of the previously discussed case near Moscow (S1(55∘ N, 37∘ E)), in which only two objectively identified cyclones and a single cutoff appeared to be relevant.
We next examine the composite structure of the entire set of S20(66∘ N, 14∘ E) (Fig. 7b). During these events, the composite large-scale upper-level flow was predominantly zonal over the North Atlantic (Fig. 7b), with a negative SLP anomaly north of 66∘ N but a positive IVT anomaly (with peak values of roughly 120 kg m−1 s−1) extending across the western North Atlantic and directed towards 66∘ N, 14∘ E. A total of 13 of the S20(66∘ N, 14∘ E) featured five or more distinct cyclones, while the remaining spells featured between two and four distinct cyclones. For the S20(66∘ N, 14∘ E) we find an Ncyclone(14∘ E, 66∘ N) of 5.15, a Fcyclone(66∘ N, 14∘ E) value of 0.51, and Rcyclone(66∘ N, 14∘ E) equal to 1.04 d, which underline the contrasting characteristics of cyclones affecting the S20 at 66∘ N, 14∘ E (numerous, recurrent, fast moving) and at 55∘ N, 37∘ E (few and stationary) despite comparable cyclone fractions at these two grid points (0.51 vs. 0.64). Based on synoptic analyses of several of the S20(66∘ N, 14∘ E), PV cutoffs seemed to be less relevant to the S20(66∘ N, 14∘ E) than cyclones and are not discussed here.
3.2.3 Long wet spell in Tuscany – recurrent wave breaking and cutoff replenishment
A third archetypal synoptic storyline occurred during the longest wet spell at 43∘ N, 12∘ E in Tuscany, Italy (S1(43∘ N, 12∘ E); Figs. 2c, 5, and S4). This 12 d wet spell occurred in association with a large cutoff complex over the Mediterranean that first formed after an anticyclonic wave breaking event over the North Atlantic and Europe (S1 in Fig. 5a) and was then replenished multiple times by a sequence of further wave breaking events occurring in a similar location (Fig. 5a–e). At 12:00 UTC on 1 May 2018 (Fig. 5a), the PV streamer S1 was located over western Europe, and substantial precipitation fell to its east, where QG ascent and enhanced north-eastward moisture transport took place. At its southern fringe, cyclone L1 started tracking north-eastward. At the same time, the incipient streamer S2 was already apparent west of the UK (Fig. 5a). Within the next 2 d streamer S1 formed cutoff C1, while S2 also developed into an elongated PV filament that, at 320 K, reached all the way to Morocco (Fig. 5b). The cutoff C1 and cyclone L1 aligned vertically in an equivalent barotropic manner, and precipitation fell underneath this cutoff–cyclone couple (Fig. 5b). Within the next 2 d, parts of the high-PV air of streamer S2 were absorbed into cutoff C1, which was thereby substantially enlarged (Fig. 5c). At the same time, a strong anticyclone formed over northern Europe, and the next wave breaking event (S3) occurred at its downstream flank on 5 and 6 May (Fig. 5c, d). The resulting PV streamer S3 also produced two small cutoffs (the more southerly one is labelled C2 in Fig. 5d), which tracked westward (Fig. 5d, e) and ultimately merged with C1 on 9 May (Fig. 5f). Between 5 and 9 May, a Rex-type blocking pattern (Rex, 1950) was present over Europe and the Mediterranean. The cutoff complex C1 hereby acted as the positive PV anomaly on the equatorward side of the blocking pattern, covered large parts of the Mediterranean, destabilized the air underneath, and led to (primarily daytime; e.g. Fig. 2c) precipitation from Iberia all the way to Turkey (Fig. 5c–f). Thereby, both IVT and QGω were small around 43∘ N, 12∘ E between 9 and 12 May (Fig. S4e–g), as the cutoff complex C1 weakened. Nevertheless, sufficient (convective) precipitation fell at 43∘ N, 12∘ E to prolong the wet spell there for another 3 d until it finally ended on 12 May. By 12:00 UTC on 13 May, C1 had decayed entirely, although the next cutoff (C3) already approached from the west. Interestingly, only one surface cyclone (L1) was involved in the 12 d spell, S1(43∘ N, 12∘ E), and was only present during roughly the first half of the spell. Thus, the destabilizing effect of the cutoff complex C1, its formation, quasi-stationarity, and replenishment due to recurrent wave breaking events are key to this spell.
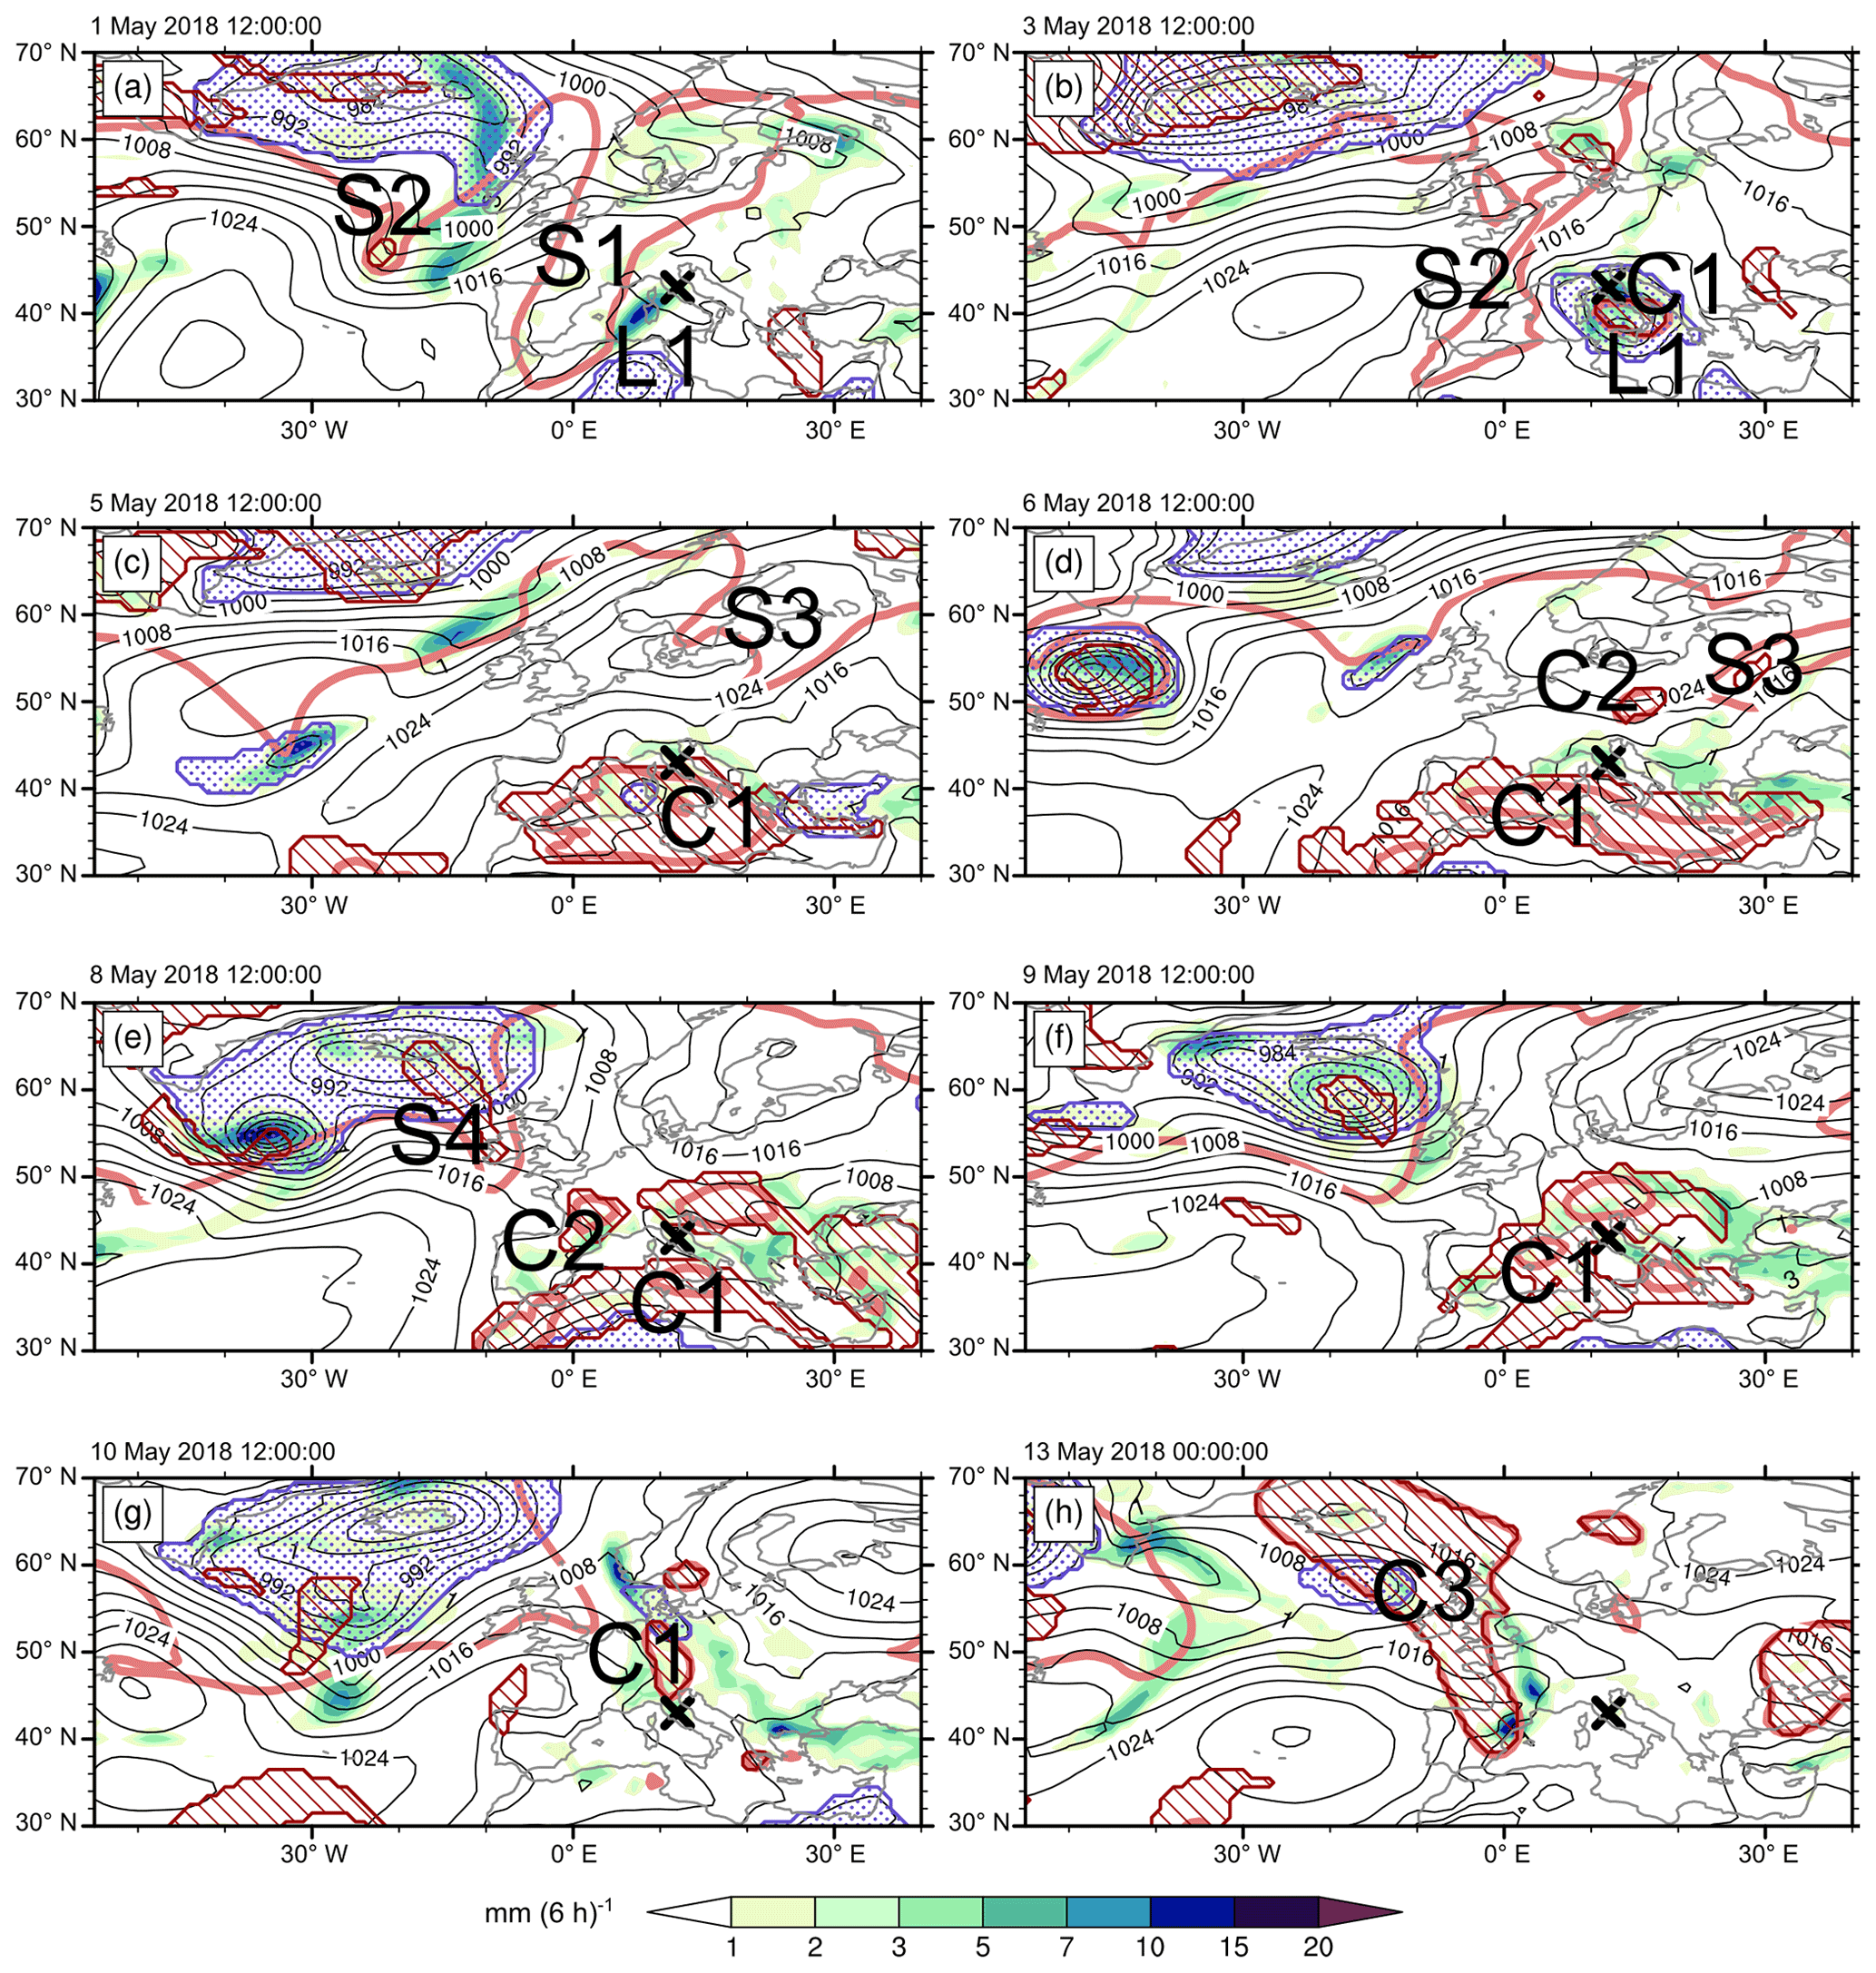
Figure 5As Fig. 3 but for the longest wet spell at 43∘ N, 12∘ E in Tuscany, Italy (S1(43∘ N, 12∘ E)). The light red lines depict 2 PVU at 320 K. The valid time of each panel is shown in the top left.
The 12 d spell S1(43∘ N, 12∘ E) is perhaps surprising in that it featured only one cyclone despite its relatively long duration. However, a small number of cyclones is a common characteristic of the S20(43∘ N, 12∘ E) as 11 of them featured two or fewer cyclones. The synoptic analysis of this case suggests that the cutoff complex C1 can be regarded as an individual, long-lived system, but two cutoffs that merged with the cutoff complex (visible, for example, in Fig. 5d) increased the cutoff count of this spell to three (according to the Portmann et al., 2021, cutoff data). The composite fields of 320 K PV, SLP, IVT, and QGω during the S20(43∘ N, 12∘ E) are consistent with the synoptic evolution of S1(43∘ N, 12∘ E) (Fig. 7c), with an amplified trough upstream of 43∘ N, 12∘ E that is associated with anomalous IVT on its southern and eastern fringes, negative QGω centred on 43∘ N, 12∘ E, and a negative SLP anomaly across the western Mediterranean. However, the S20(43∘ N, 12∘ E) also contain at least one spell with a strongly differing synoptic storyline: contrary to S1(43∘ N, 12∘ E), the spell S5(43∘ N, 12∘ E) occurred in winter and featured five distinct cyclones and five distinct cutoffs that were steered towards 43∘ N, 12∘ E by a southward-displaced jet over the eastern North Atlantic (not shown).
3.2.4 Long wet spell in eastern Europe – intermittent periods of diurnal convection and recurrent cutoff formation
A fourth synoptic storyline is illustrated based on the longest wet spell at 48∘ N, 25∘ E in the Carpathian Mountains at the border between Romania and Ukraine (Figs. 2d, 6, and S5). This wet spell lasted for an impressive 17 d, from 19 May to 4 June 1988, and featured several days with substantial precipitation without the presence of any cutoff or cyclone near 48∘ N, 25∘ E. During intermitted periods of this spell a total of three cutoffs appeared in the vicinity of 48∘ N, 25∘ E, which, however, did not induce substantial QGω but conceivably contributed to the persistence of the spell by reducing the static stability underneath. At 12:00 UTC on 20 May 1988 a breaking wave (S1 in Fig. 6) was present over western Europe, while a surface anticyclone was located over western Russia. In between, an area of weak SLP gradients extended across much of the Balkans and eastern Europe, and precipitation occurred over widespread areas in this region (Fig. 6a) without any considerable QGω or IVT (Fig. S5a). At 48∘ N, 25∘ E the ERA-Interim precipitation on the first 2 d of the spell (19 and 20 May) fell exclusively between 06:00 and 18:00 UTC (Fig. 2d), consistent with primarily convective precipitation. Over the course of the next 4 d, a weak cyclonic upper-level PV feature (S1) propagated slowly eastward (not shown) and eventually broke up into several remnants by 12:00 UTC on 24 May, including a cutoff C1 which covered 48∘ N, 25∘ E at that time step (Fig. 6b). Between 21 and 24 May, precipitation at 48∘ N, 25∘ E exhibited less of a diurnal cycle (Fig. 2d) likely due to the influence of the upper-level PV feature which continuously destabilized the troposphere and provided quasi-geostrophic forcing for ascent (not shown). From 24 to 26 May the cutoff C1 remained in the vicinity of 48∘ N, 25∘ E but gradually weakened until its dissipation on 27 May (Fig. 6b–d). At 12:00 UTC on 27 May a flow situation very much reminiscent of that at 12:00 UTC on 20 May had been established, with a PV streamer S2 approaching 48∘ N, 25∘ E and widespread precipitation around 48∘ N, 25∘ E, but again without the apparent influence of a cyclone or cutoff (Figs. 6d, S5d). The streamer S2 again formed a cutoff (C2) which approached 48∘ N, 25∘ E by 12:00 UTC on 29 May (Fig. 6e) and dissipated thereafter by 12:00 UTC on 30 May (not shown). It is noteworthy that during the first 13 d of the spell (19–31 May 1988) no surface cyclone is apparent in the immediate vicinity of 48∘ N, 25∘ E. The large-scale flow situation changed considerably between 29 May and 1 June (Fig. 6e, f): the next PV streamer (S3) approached 48∘ N, 25∘ E and induced upper-level forcing for ascent, as well as a pulse of poleward moisture transport on its downstream side (Fig. S5f), and a surface cyclone L1 developed to its east (Fig. 6f). The cyclone L1 deepened from 12:00 UTC on 1 July to 18:00 UTC on 2 June (Fig. 6g) and passed over 48∘ N, 25∘ E, which led to the largest daily precipitation accumulations during the entire spell (Fig. 2d). By 12:00 UTC on 4 June, the streamer S3 had formed yet another cutoff (C3 in Fig. 6h), which slowly propagated eastward, together with L1, and the spell finally ended on 5 June.

Figure 6As Fig. 3 but for the longest wet spell at 48∘ N, 25∘ E in Romania (S1(48∘ N, 25∘ E)). The light red lines depict 2 PVU at 320 K. The valid time of each panel is shown in the top left.
The synoptic storyline of this spell is interesting in two regards: firstly, during its first part precipitation fell due to diurnal convection, and the influence of surface cyclones or PV cutoffs appeared to be modest at best. Secondly, during the remainder of the spell it involved multiple cutoffs and PV streamers. Based on this case study, the intermittent occurrence of days with daytime convection in absence of direct upper-level forcing, alternated by days with recurrent wave breaking and cutoff formation, thus emerges as a further archetypal storyline for unusually long wet spells. It should be noted that a similar synoptic storyline has recently been reported for a multi-week period of recurrent convective events in central Europe (Mohr et al., 2020).
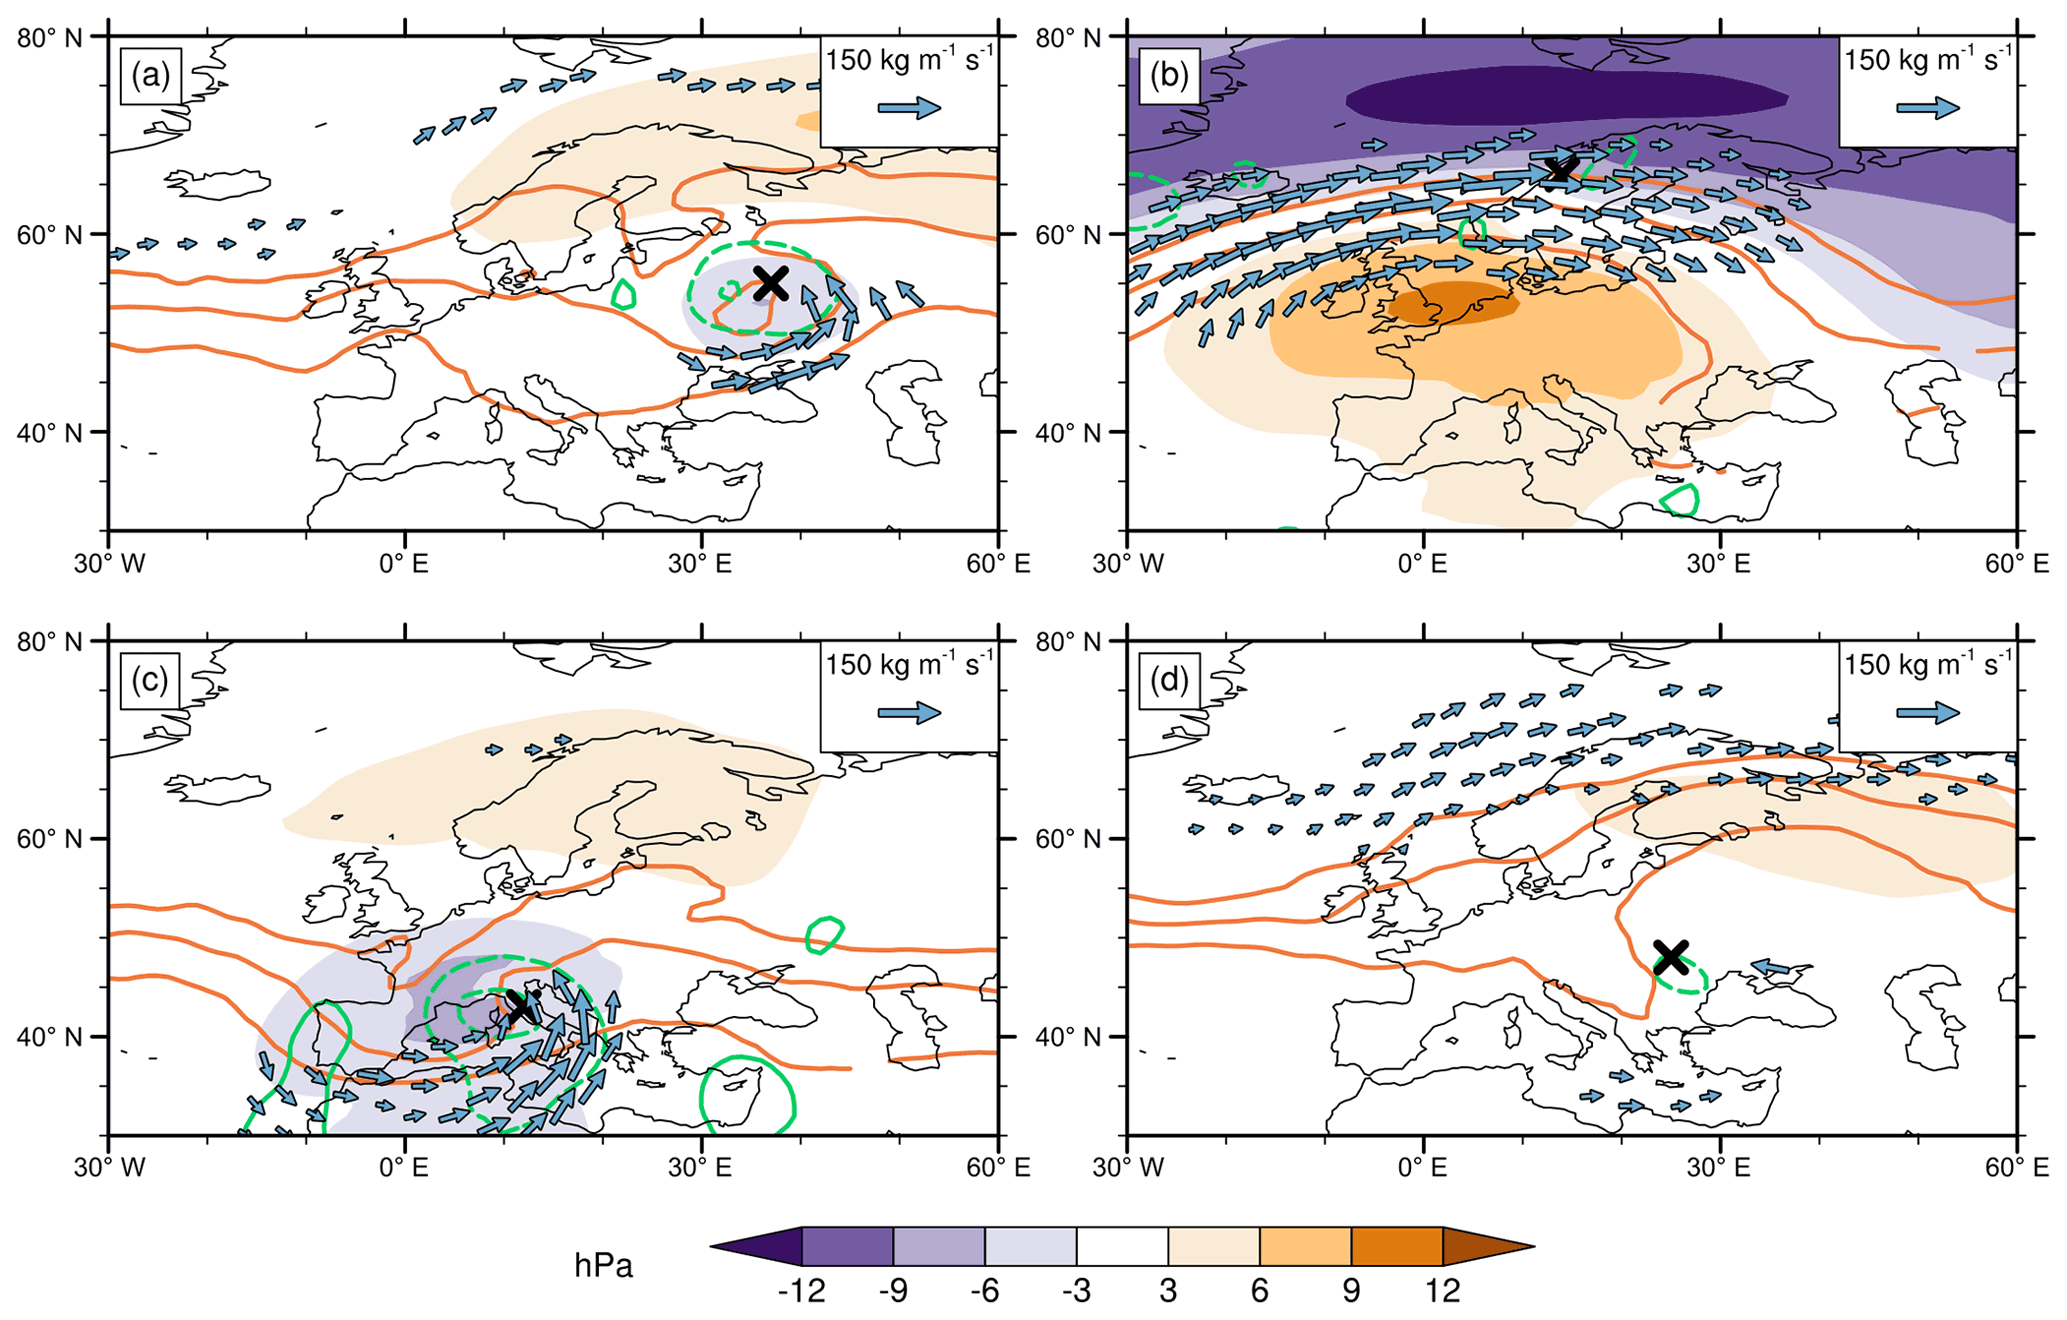
Figure 7Composites of various fields for the (a) S20(55∘ N, 37∘ E) (Moscow), (b) S20(66∘ N, 14∘ E) (Norway), (c) S20(43∘ N, 12∘ E) (Tuscany), and (d) S20(48∘ N, 25∘ E) (Balkans). Shown are isentropic PV contours of 1, 1.5, and 2 PVU (orange contours are masked where the respective isentrope intersects the orography on at least one time step of the respective S20) at (a, c, d) 320 K and (b) 310 K, as well as SLP anomalies (shading) and QGω anomalies of −1.5, −1, and −0.5 hPa h−1 (dashed green contours) and of +0.5, +1, and +1.5 hPa h−1 (solid green contours). Furthermore, vectors depict IVT anomalies whose magnitude exceeds 30 kg m−1 s−1. All anomalies are computed relative to a climatology containing data from all calendar days on which at least one of the S20 at the respective grid point occurred for the 1979–2018 period, i.e. the climatologies vary between the four panels depending on the seasonality and duration of the respective S20 spells.
The composite fields of 320 K PV, SLP, IVT, and QGω for all S20(48∘ N, 25∘ E) reveal a similar pattern as, for example, in Fig. 6a, c, d, e, and h and underline the limited relevance of the large-scale forcing for the S20(48∘ N, 25∘ E): contrary to the other three case study locations, SLP and IVT anomalies are remarkably weak around 48∘ N, 25∘ E, and only a weak upper-level PV feature (discernible only from the composite 1 PVU contour) is associated with modest negative QGω anomalies (just below −0.5 hPa h−1). The cyclone fraction, Fcyclone, is 0.21, which further underlines that the role of cyclones is much more subtle for the S20 at 48∘ N, 25∘ E than, for example, at 66∘ N, 14∘ E (Norway case; Figs. 2b, 4, 7b), where Fcyclone is 0.51. As for 43∘ N, 12∘ E (Tuscany) the variability in the cyclone and cutoff characteristics across the S20 is large, with between zero and five (one and six) distinct cyclones (cutoffs) during individual S20(48∘ N, 25∘ E).
3.3 A systematic analysis of cyclone and PV cutoff characteristics during the S20
We next examine the occurrences of cyclones and cutoffs during the S20 across Europe more systematically to elucidate geographical differences in their role for generating unusually long-lasting wet spells (the left columns in Figs. 8 and 9). Furthermore, we assess whether or not the behaviour of cyclones and cutoffs during the S20 is locally anomalous (right columns in Figs. 8 and 9). We begin by discussing the cyclone fractions, Fcyclone, and their anomalies (Fig. 8a, b). Cyclones occur during more than 60 % of the S20 time steps over vast parts of the North Atlantic, Scandinavia, and the northern and eastern Mediterranean (Fig. 8a). Moreover, Fcyclone is generally larger over the ocean than over land, with exceptions over large parts of Scandinavia and the UK. In the Balkans, the Caucasus, and parts of the Alps, however, cyclones occur during only roughly 10 %–30 % of the S20 time steps, suggesting that they do not play a major role in the longest wet spells there. The Fcyclone anomalies (Fig. 8b) are positive and statistically significant almost everywhere, with the largest anomalies in the Mediterranean and the subtropical North Atlantic. Insignificant Fcyclone anomalies are found in the aforementioned areas of particularly low Fcyclone (which is consistent with the Balkan case study; Sect. 3.2.4) and, interestingly, also along the west coast of Norway.
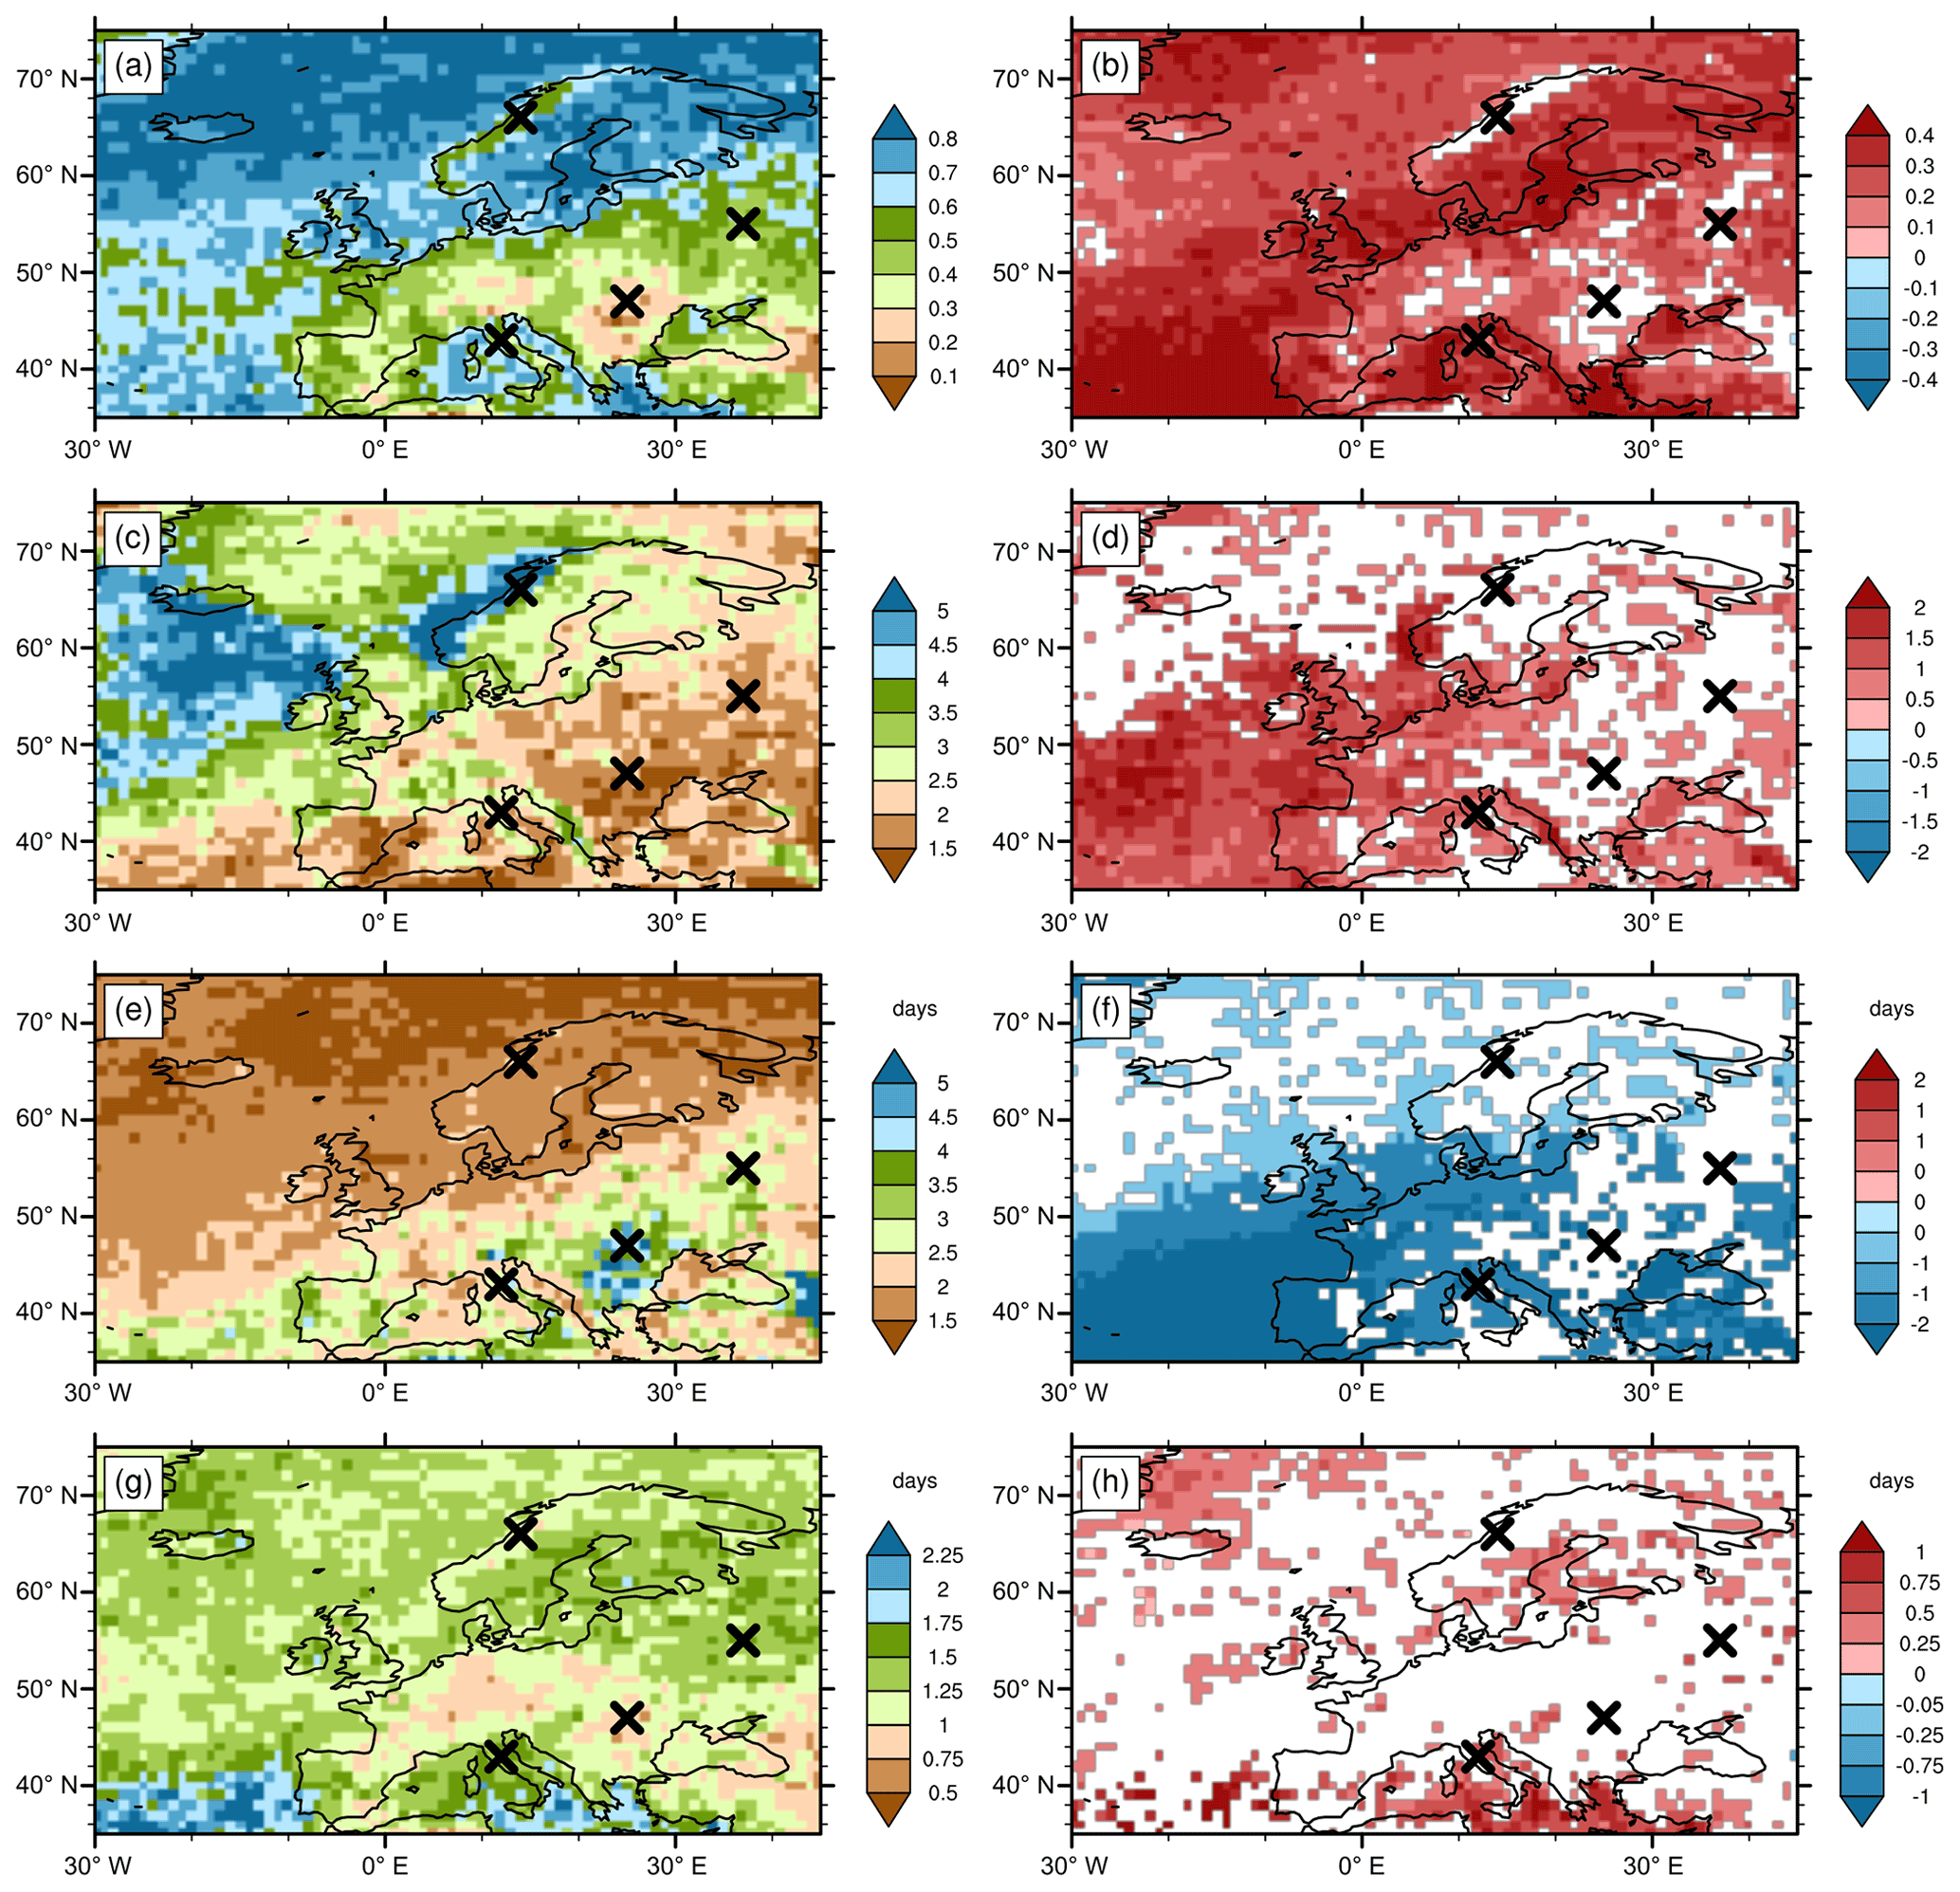
Figure 8Cyclone characteristics during the S20 (left column) and their respective anomalies (right column; see Sect. 2.5 for the technical definition of the four quantities and their climatological values). (a, b) The cyclone fraction, Fcyclone, i.e. fraction of total S20 time steps with a cyclone, (c, d) number of distinct cyclones per S20, Ncyclone, (e, f) the cyclone period, Pcyclone, i.e. summed S20 duration divided by number of distinct cyclones, and (g, h) the residence time, Rcyclone, i.e. the average time each distinct cyclone affects one of the S20. Statistically not significant values in panels (b), (d), (f), and (h) are masked out in white (see Sect. 2.5 for details).
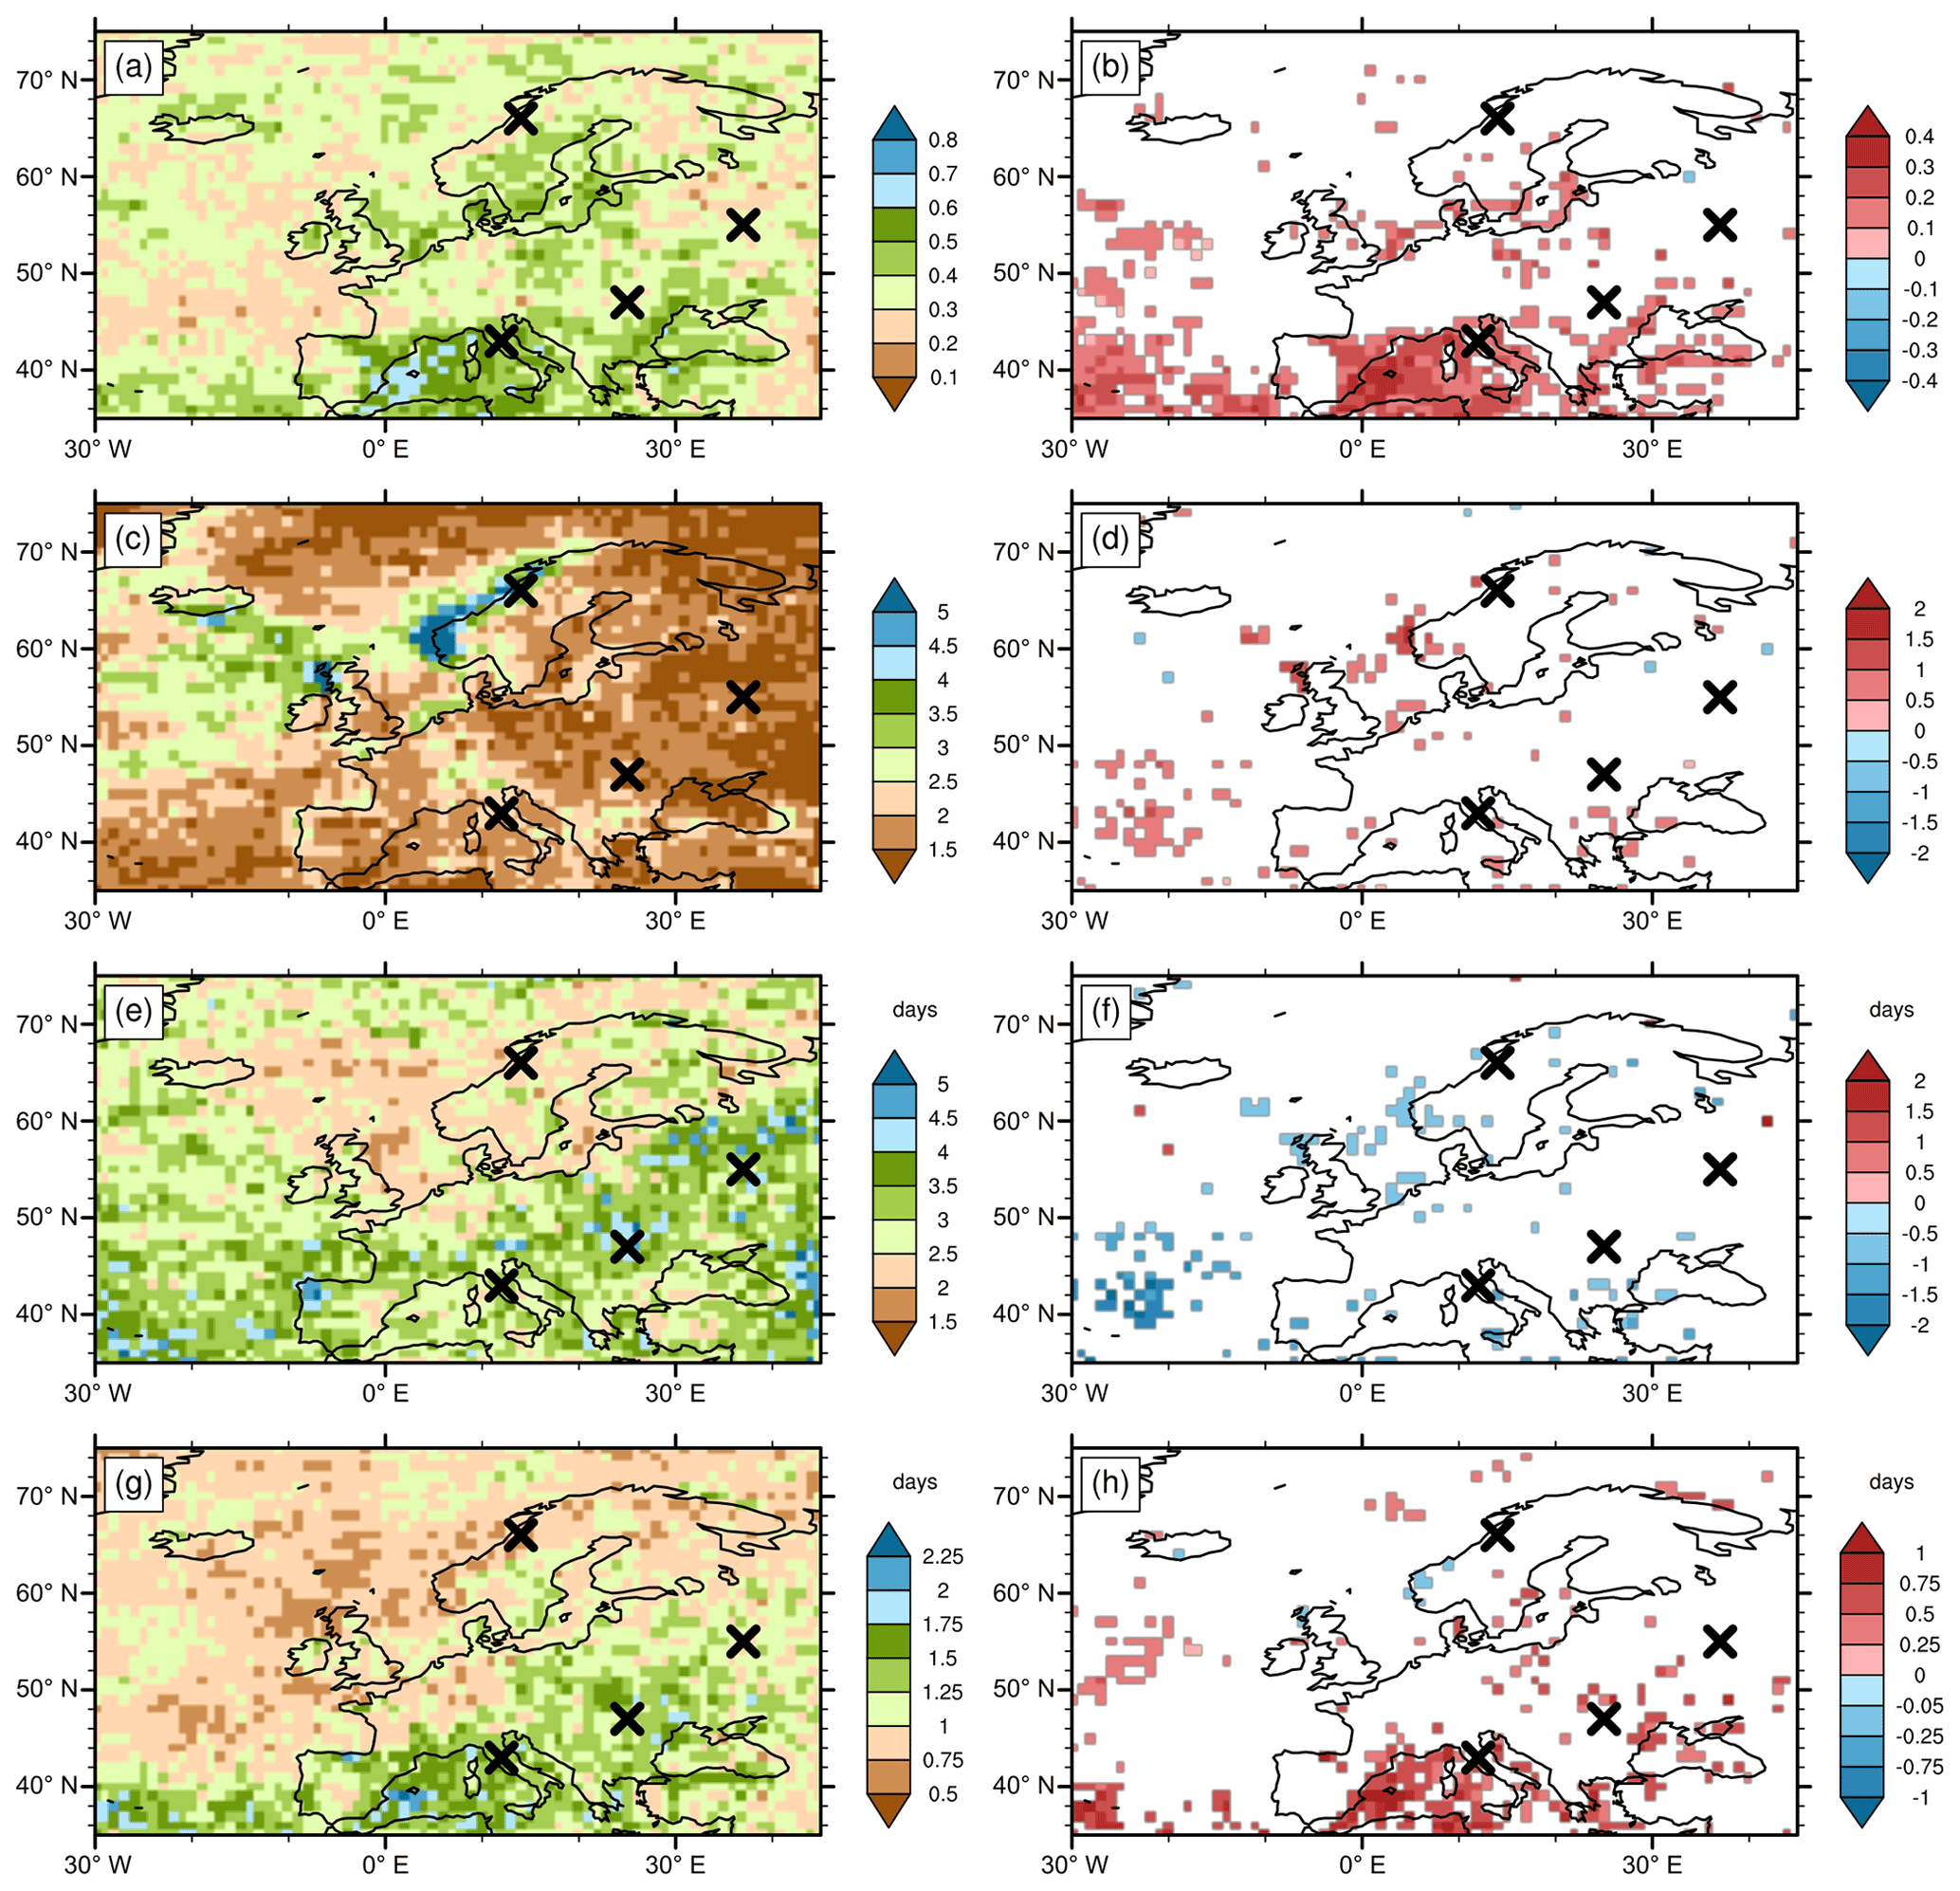
Figure 9As Fig. 8 but for cutoffs.
The Norway case study (Sect. 3.2.2) revealed a large number of cyclones contributing to the longest spell at 66∘ N, 14∘ E, suggesting that serial clustering of extratropical cyclones (Pinto et al., 2014; Priestley et al., 2017a; Dacre and Pinto, 2020) might be crucial for the occurrence of unusually long wet spells in this region. Figure 8e now reveals that in this region the cyclone period, Pcyclone, is indeed shorter than anywhere else in Europe, with values between 1.5 and 2 d. Also, anomalously large Ncyclone and anomalously short Pcyclone at some grid points around 66∘ N, 14∘ E somewhat support the hypothesis of anomalous serial cyclone clustering as a cause of long wet spells there. However, for numerous grid points along the west coast of Norway, none of the four quantities' anomalies are statistically significant, a result that will be further discussed in Sect. 4. A much clearer indication for anomalous serial cyclone clustering as a cause of the longest wet spells is found, for example, across central Europe, in south-western Scandinavia, and parts of the UK, where Fcyclone is increased due to significantly more distinct cyclones (positive Ncyclone anomalies) occurring at a higher rate (reduced Pcyclone), with Rcyclone not significantly different from climatology.
A further region with particularly noteworthy cyclone characteristics (and their anomalies) during the S20 is found in the seas south of Italy. This region features some of the largest cyclone residence times (Rcyclone in excess of 2 d; Fig. 8g) and the largest significant anomalies in Rcyclone (up to 1 d; Fig. 8h) anywhere in the study region. Notably in the seas south of Italy, Ncyclone and Pcyclone do not differ significantly from climatology (Fig. 8d, f) despite Fcyclone anomalies of up to 40 %, which corresponds to roughly a doubling of Fcyclone during the S20 compared to climatology (compare Fig. 8a and b). These large Fcyclone anomalies thus come about primarily due to increased Rcyclone, i.e. anomalously persistent, slower-moving, or longer-lived cyclones compared to climatology.
Next, we discuss the four quantities and their anomalies for cutoffs (Fig. 9) and contrast them with results for cyclones (Fig. 8). The cutoff fraction, Fcutoff, and the number of distinct cutoffs per S20, Ncutoff, are considerably smaller than Fcyclone and Ncyclone (compare Fig. 9a, c with Fig. 8a, c). Significantly fewer of the Fcutoff and Ncutoff anomalies are statistically significant compared to Fcyclone and Ncyclone anomalies, but wherever Fcutoff and Ncutoff anomalies are significant, they are also positive, showing that increased PV cutoff fractions and numbers are associated with the wet spells (Fig. 9a, c). The largest values of Fcutoff are found in the western Mediterranean, where they exceed the respective climatological values by roughly a factor of 2 (Fig. 9a, b). The cutoff period Pcutoff reveals considerable geographical variations (Fig. 9e), with the shortest cutoff periods around 2 d in the Norwegian Sea, but as for Ncutoff, the Pcutoff anomalies are significant only in a few separate regions. The most striking result for cutoffs, though, is the significantly increased residence time Rcutoff in the Mediterranean. There, Rcutoff values in excess of 2 d are observed, which is more than 1 d more than the climatological value. Thus, the anomalously large Fcutoff during the S20 in this region predominantly results from increased residence times of cutoffs, i.e. persistent cutoffs that are either slower-moving, longer-lived, or both. A similar behaviour of cutoffs during the S20 is found in the south-western corner of our study domain, over the subtropical North Atlantic.
Over land, comparatively long absolute Rcutoff values (up to 1.75 d) are found in the Balkans and in north-eastern Europe (Figs. 9g), suggesting that in these regions, the cutoffs involved in the S20 are more persistent than, for example, those involved in the S20 along the Norwegian coast or in western Europe (note, however, that the Rcutoff anomalies are insignificant at most grid points in these regions). Nevertheless, throughout Europe's land area Fcutoff is below 50 % almost everywhere (Fig. 9a), indicating that during at least half of the total S20 time no cutoff is present within a 400 km radius.
In summary, this section reveals geographically varying and, in some regions, locally anomalous behaviour of cyclones and cutoffs during the S20. Fcyclone is anomalously large during the S20 almost everywhere; however, the causes of these positive cyclone frequency anomalies differ in space. Increased numbers of cyclones during the S20 explain the positive Fcyclone values along the north-western Atlantic coast, as well as in central Europe, while over the Mediterranean anomalously large residence times of cyclones are the primary reason for positive Fcyclone anomalies. The Mediterranean is also the region where Fcutoff deviates most from its climatological value, which is caused by anomalously persistent cutoffs during the S20. Elsewhere, the characteristics of cutoffs during the S20 vary in space but rarely differ significantly from climatological cutoff characteristics.
The synoptic storylines for unusually long wet spells presented in Sect. 3.2 feature individual stalling cyclones and cutoffs, as well as such weather systems recurring multiple times (as anticipated by Moore et al., 2021), although some storylines are more complex and also involve daytime convection over complex topography without apparent upper-level forcing. The four case studies were selected due to their archetypal nature; however, manual analyses of a large number of further long wet spells revealed numerous storylines that combined various features of the four archetypal storylines (multiple stationary cutoff–cyclone couples or multiple recurrent cyclones preceding a particularly stationary cutoff, etc.). Furthermore, this manual analysis revealed that distinct wet spells at a single location often do not follow the same synoptic storyline. This diversity raises the question of whether or not these synoptic storylines stratify according to geographical regions at all, which motivated our climatological analysis of cutoff and cyclone characteristics during the S20 presented in Figs. 8 and 9.
The two columns in Figs. 8 and 9 address distinct research questions. The left column assesses how cyclone and cutoff characteristics during the S20 vary in space and thus addresses research question (3) in the “Introduction”. This information is valuable since the general relevance of cyclones and cutoffs for precipitation is well established (e.g. Hawcroft et al., 2012; Portmann, 2020), and thus, for example, spatial variations in Fcyclone point to a spatially varying relevance of cyclones for the S20. Nevertheless, the spatial variations in these cyclone and cutoff characteristics during the S20 are governed in part by climatological characteristics of cyclones and cutoffs. Therefore, the right column in Figs. 8 and 9 also compares the cyclone and cutoff characteristics during the S20 to climatological values in order to identify anomalous weather system characteristics during the S20 (and thus address research question 4).
The left columns in Figs. 8 and 9 reveal that the relevance of cyclones and cutoffs for the S20 indeed varies greatly across space. For example, the range of Fcyclone values with the lowest values below 0.2 and largest values above 0.9 implies that in some regions, cyclones are present during almost the entire period of the S20, e.g. in Scandinavia, the UK, and the Mediterranean, while cyclones appear to be largely irrelevant to the S20 in other regions such as the Balkans. Furthermore, Fcutoff varies from around 0.2 (e.g. over Finland) to 0.7 (over the western Mediterranean), indicating that a major fraction of the total S20 duration occurs without a cutoff within a 400 km radius, even in the regions with the largest Fcutoff.
The right columns in Figs. 8 and 9 show single-signed or insignificant anomalies of F, N, P, and R almost throughout the study region for both weather systems, with positive anomalies in F, N, and R and negative anomalies in P. Thus, wherever the F, N, P, and R anomalies are significant, the respective weather systems are more prevalent (positive F anomalies), occur in larger number (positive N anomalies), occur at a higher rate (negative P anomalies), and tend to be more persistent (positive R anomalies) during the S20 than in climatology. However, not all grid points feature significant anomalies, in particular not for cutoffs. The lack of statistically significant anomalies in any of the four quantities may results from three causes: (a) at some grid points, there is simply no preferred synoptic storyline of the S20 with a clear signature in the four cyclone and cutoff characteristics, F, N, P, and R, which may be the case, for example, in regions where the S20 occur in different seasons; (b) the sample size (20) is relatively small for a statistical hypothesis test, and consequently our Monte Carlo test has only limited power to detect significant departures from climatology (e.g. Wilks, 2011); and (c) in certain regions, for example, the west coast of Norway, the climatological precipitation variability is itself characterized by long wet spells (Zolina et al., 2013). In such regions, unusually long wet spells do not need to be associated with anomalous cyclone and cutoff characteristics but rather with characteristics close to climatology over a prolonged period.
Nevertheless, for cyclones the anomalies of F, N, and P are significant in vast areas of the study region. Comparing the right columns in Figs. 8 and 9 we find overall weaker and much fewer significant anomalies in F, N, P, and R for cutoffs than for cyclones, which suggests a generally weaker link between anomalous cutoff characteristics and the occurrence of the S20 than for cyclones. In part this could be a consequence of the cutoff definition of Portmann et al. (2021), who defined cutoffs as 3-dimensional objects which can persist as vertically shallow objects on relatively high isentropes, where their influence on lower and mid-tropospheric static stability, as well as ascent, is limited (see Portmann et al., 2018, for an example of such a case).
In the Mediterranean, however, Fcutoff and Rcutoff anomalies are of similar magnitude as the Fcyclone and Rcyclone anomalies, and they underline the importance of persistent cutoffs and cyclones for the S20 there. This result is consistent with several previous studies, in particular Doswell et al. (1998), who documented a 7 d heavy precipitation event in Valencia, Spain, and Portmann (2020), who showed that the Mediterranean is the region where cutoffs contribute the most to annual precipitation anywhere on the globe. Furthermore, de Vries (2021) identified the Mediterranean as a region where the odds of extreme precipitation events are significantly increased when upper-level high-PV features are present. A novel finding of this study is that cutoffs can be key dynamical precursors to even much longer precipitation episodes, in particular if such cutoffs are replenished by multiple wave breaking events (Sect. 3.2.3) or when multiple recurrent cutoffs are involved (Sect. 3.2.4). In either case, the longevity of the wet spells appears to be linked to recurrent synoptic-scale Rossby wave dynamics (the formation, amplification, and breaking of upper-level troughs). Subsequent research could therefore investigate whether or not these spells have statistically significant Rossby wave precursors, possibly in the form of recurrent Rossby wave packets (Ali et al., 2021; Röthlisberger et al., 2019).
The finding that long wet spells along the west coast of Europe are associated with multiple recurrent cyclones (e.g. Sect. 3.2.2) is not surprising, in particular given the clear evidence for serial cyclone clustering in the eastern North Atlantic (Mailier et al., 2006; Pinto et al., 2014; Priestley et al., 2017a; Dacre and Pinto, 2020). Indeed, the Norway case study (Sect. 3.2.2) features several aspects of the archetypal pathway to cyclone clustering outlined in Priestley et al. (2017a), with recurrent anticyclonic wave breaking over the North Atlantic on the equatorward side of the jet (e.g. Fig. 4b, c), a zonally extended and northward-displaced jet (not shown) that leads to strong and persistent westerly flow impinging on Scandinavia and steers cyclones towards northern Scandinavia (Fig. 4). Furthermore, as in Priestley et al. (2017a), the cyclone clustering period is terminated when a cyclonic wave breaking event displaces the North Atlantic jet southward (Fig. 4h). Perhaps more surprising is the lack of significantly positive cyclone frequency anomalies along the northern Norwegian coast (Fig. 8b), which likely points to the relevance of a stagnant westerly moist air flow that supports orographic precipitation during the S20 there. Furthermore, the insignificant anomalies of Ncyclone and Pcyclone in Norway (close to 66∘ N, 14∘ E) are consistent with our explanation (c) above; i.e. serial clustering of cyclones is a climatological characteristic of cyclones in the eastern North Atlantic (Mailier et al., 2006). Thus, it is certainly relevant to the generation of long wet spells there but not an anomalous behaviour of cyclones there.
The results of and conclusions from this study are limited in a number of ways. Firstly, we use precipitation from ERA-Interim as opposed to observed precipitation (remotely sensed or in situ measured). Consequently, the identification of the S20 is affected by precipitation biases in ERA-Interim (see also Sect. 2.1). However, using ERA-Interim precipitation for the spell identification is convenient as it is spatially and temporally complete and, furthermore, ensures that the precipitation is physically consistent with the synoptic-scale dynamics accompanying the long wet spells studied here. Secondly, the criteria for defining “wet spells” are to a certain degree subjective, and, consequently, our definition of wet spells as consecutive days with at least 5 mm daily accumulated ERA-Interim precipitation strongly affects which events ultimately end up in the S20. Nevertheless, choosing a higher precipitation threshold than previous studies (e.g. Ali et al., 2021; Zolina et al., 2010, 2013) ensures that our S20 are unusually long-lasting periods of sustained relatively intense precipitation and are thus potentially high-impact events. Thirdly, our analyses focus primarily on only two types of synoptic systems: cutoffs and cyclones. The choice of these two systems is motivated by previous studies, which documented the particular relevance of these two types for long-lasting heavy precipitation episodes (Doswell et al., 1998; Raveh-Rubin and Wernli, 2015; Moore et al., 2021), and our case studies further underline this pivotal role of cutoffs and cyclones for long wet spells. Subsequent research should nevertheless explore to what extent other weather systems such as stagnating atmospheric rivers (e.g. Moore et al., 2021) or blocking (e.g. Mohr et al., 2020) foster the occurrence of unusually long wet spells in their vicinity.
This study investigates the role of cyclones and PV cutoffs in the formation of unusually long wet spells in Europe, which are identified at each ERA-Interim grid point as the 20 longest uninterrupted periods with at least 5 mm daily accumulated ERA-Interim precipitation (S20). The S20 are longest along the Norwegian coast and northern Scotland, where the median duration of the S20 reaches up to two weeks. The S20 are shortest, for example, in Poland and north-eastern Scandinavia, where their median duration is only 3–5 d. There is a clear seasonality associated with the occurrence of the S20: over eastern continental Europe they occur predominantly in summer, while over the North Atlantic most of the S20 occur in winter, and the majority of the S20 along European coastal seas and the Mediterranean occur in winter or fall. In central and western Europe, no season clearly dominates.
Four case studies reveal distinct synoptic storylines of selected long wet spells that each involve cyclones and PV cutoffs in distinct ways. The longest wet spell in Moscow occurred in association with just one cutoff–cyclone couple that formed from a single wave breaking event, subsequently stalled over western Russia, and thus produced > 5 mm d−1 precipitation at this grid point for 7 consecutive days. An even longer spell (12 d) associated with a single cutoff complex occurred in Tuscany, Italy. Initially, this cutoff complex also formed from a wave breaking event but, in contrast to the Moscow case, was then replenished multiple times by multiple further wave breaking events over the North Atlantic and Europe. The Tuscany case thus illustrates recurrent wave breaking and subsequent cutoff replenishment as a further, hitherto not documented synoptic storyline for unusually long wet spells. In contrast, a substantial body of literature already documents the tendency for extratropical cyclones to serially cluster in the North Atlantic region (Dacre and Pinto, 2020, and references therein). Here we document such behaviour of extratropical cyclones during a 15 d wet spell in Norway, which also involved orographic precipitation in westerly onshore flow. Finally, a 17 d wet spell in the Balkans reveals the importance of diurnal convection for this long summer-time wet spell over continental Europe, and it also featured recurrent cutoffs that occur intermittently with periods of diurnal convection in the absence of evident upper-level forcing.
To compare cyclone and cutoff characteristics during the S20 in space, as well as climatological cyclone and cutoff characteristics, we compute four quantities for both types of weather features and for each grid point (y,x), which each consider cyclones and cutoffs that overlap with a radius of 400 km around (y,x) during the S20(y,x): the cyclone/cutoff fraction F, the number of distinct cyclones/cutoffs per spell N, the cyclone/cutoff period P, and the cyclone/cutoff residence time R. This analysis reveals regionally strongly varying roles of cutoffs and cyclones for the S20. For instance, the absolute values of Fcyclone vary from less than 0.2 in the Balkans (i.e. cyclones almost never present during the S20) to more than 0.8 over the North Atlantic (i.e. the S20 occur under quasi-continuous influence of cyclones). For both weather features, the anomalies of F, N, P, and R are single-signed (or statistically not significant) throughout Europe and imply that, during the S20, cyclones and cutoffs are more prevalent (positive F anomalies), occur in larger number (positive N anomalies), occur at a higher rate (negative P anomalies), and are more persistent (positive R anomalies) compared to climatology. Hereby larger anomalies of these quantities, with higher statistical significance, are found for cyclones than for cutoffs in most regions, which suggests a tighter association between anomalous weather system characteristics and longer wet spells for cyclones than for cutoffs. An exception to this rule is found in the western Mediterranean, where cutoffs have strongly and statistically significantly increased residence times during the S20.
We conclude that the synoptic storylines accompanying unusually long wet spells are highly diverse across Europe. Cutoffs and cyclones were involved in all cases we analysed, either as individual and unusually persistent systems or in a recurring manner. A novel finding of this study is that recurrent Rossby wave breaking may act as an indirect precursor to unusually long wet spells by replenishing an existing cutoff which subsequently fosters the occurrence of an unusually long wet spell. Subsequent research should therefore investigate how the unusual recurrence and unusual longevity of synoptic systems come about and how the two are intertwined. Furthermore, given the potential impacts of unusually long wet spells, as well as their potential changes in a warming climate (e.g. Pfleiderer et al., 2019), it is important to investigate whether or not climate models are able to realistically reproduce the synoptic characteristics of such events in order to assess the reliability of projected changes in wet spell characteristics. This study documents for the first time the palette of synoptic storylines accompanying unusually long wet spells across Europe and thus forms a basis for such climate model evaluations.
ERA-Interim data can be downloaded from the ECMWF web page (https://apps.ecmwf.int/datasets/data/interim-full-daily/levtype=sfc/, European Centre for Medium-Range Weather Forecasts, 2022).
The supplement related to this article is available online at: https://doi.org/10.5194/wcd-3-733-2022-supplement.
BS and MR performed the analyses, and BS produced earlier versions of the Figs. 1, 3, 4, and 7–9 as part of her MSc thesis research. MR conceived the study, produced the final figures, and wrote the manuscript, and RP and AJdV discussed intermediate results and commented on earlier versions of the manuscript.
The contact author has declared that none of the authors has any competing interests.
Publisher’s note: Copernicus Publications remains neutral with regard to jurisdictional claims in published maps and institutional affiliations.
All authors would like to thank Heini Wernli (ETH Zürich) for helpful discussions, feedback on an earlier version of the manuscript, and his general support for this study. Moreover, we are indebted to Michael Sprenger (ETH Zürich) for providing the QGω data. The authors thank Benjamin Moore as well as an anonymous reviewer for their thoughtful and encouraging reviews.
This research has been supported by the European Research Council, H2020 European Research Council (INTEXseas (grant no. 787652)), the Swiss National Science Foundation (grant no. 177996), and ETH Zurich (grant no. ETH-0716-2).
This paper was edited by Shira Raveh-Rubin and reviewed by Benjamin Moore and one anonymous referee.
Ali, S. M., Martius, O., and Röthlisberger, M.: Recurrent Rossby wave packets modulate the persistence of dry and wet spells across the globe, Geophys. Res. Lett., 48, e2020GL091452, https://doi.org/10.1029/2020GL091452, 2021.
Appenzeller, C. and Davies, H. C.: Structure of stratospheric intrusions into the troposphere, Nature, 358, 570–572, https://doi.org/10.1038/358570a0, 1992.
Berger, A. and Goossens, C.: Persistence of wet and dry spells at Uccle (Belgium), J. Climatol., 3, 21–34, https://doi.org/10.1002/joc.3370030103, 1983.
Besson, P., Fischer, L. J., Schemm, S., and Sprenger, M.: A global analysis of the dry-dynamic forcing during cyclone growth and propagation, Weather Clim. Dynam., 2, 991–1009, https://doi.org/10.5194/wcd-2-991-2021, 2021.
Catto, J. L. and Pfahl, S.: The importance of fronts for extreme precipitation, J. Geophys. Res.-Atmos., 118, 10791–10801, https://doi.org/10.1002/jgrd.50852, 2013.
Dacre, H. F. and Pinto, J. G.: Serial clustering of extratropical cyclones: A review of where, when and why it occurs, npj Clim. Atmos. Sci., 3, 1–10, https://doi.org/10.1038/s41612-020-00152-9, 2020.
Dee, D. P., Uppala, S. M., Simmons, A. J., Berrisford, P., Poli, P., Kobayashi, S., Andrae, U., Balmaseda, M. A., Balsamo, G., Bauer, P., Bechtold, P., Beljaars, A. C. M., van de Berg, L., Bidlot, J., Bormann, N., Delsol, C., Dragani, R., Fuentes, M., Geer, A. J., Haimberger, L., Healy, S. B., Hersbach, H., Hólm, E. V., Isaksen, L., Kållberg, P., Köhler, M., Matricardi, M., Mcnally, A. P., Monge-Sanz, B. M., Morcrette, J.-J., Park, B.-K., Peubey, C., de Rosnay, P., Tavolato, C., Thépaut, J. N., and Vitart, F.: The ERA-Interim reanalysis: Configuration and performance of the data assimilation system, Q. J. Roy. Meteor. Soc., 137, 553–597, https://doi.org/10.1002/qj.828, 2011.
de Vries, A. J.: A global climatological perspective on the importance of Rossby wave breaking and intense moisture transport for extreme precipitation events, Weather Clim. Dynam., 2, 129–161, https://doi.org/10.5194/wcd-2-129-2021, 2021.
Doswell, C. A., Ramis, C., Romero, R., and Alonso, S.: A diagnostic study of three heavy precipitation episodes in the western Mediterranean region, Weather Forecast., 13, 102–124, https://doi.org/10.1175/1520-0434(1998)013<0102:ADSOTH>2.0.CO;2, 1998.
European Centre for Medium-Range Weather Forecasts: ERA-Interim re-analysis data, ECMWF [data set], https://apps.ecmwf.int/datasets/data/interim-full-daily/levtype=sfc/, last access: 6 July 2022.
Field, P. R. and Wood, R.: Precipitation and cloud structure in midlatitude cyclones, J. Climate, 20, 233–254, https://doi.org/10.1175/JCLI3998.1, 2007.
Flaounas, E., Röthlisberger, M., Boettcher, M., Sprenger, M., and Wernli, H.: Extreme wet seasons – their definition and relationship with synoptic-scale weather systems, Weather Clim. Dynam., 2, 71–88, https://doi.org/10.5194/wcd-2-71-2021, 2021.
Graf, M. A., Wernli, H., and Sprenger, M.: Objective classification of extratropical cyclogenesis, Q. J. Roy. Meteor. Soc., 143, 1047–1061, https://doi.org/10.1002/qj.2989, 2017.
Grams, C. M., Binder, H., Pfahl, S., Piaget, N., and Wernli, H.: Atmospheric processes triggering the central European floods in June 2013, Nat. Hazards Earth Syst. Sci., 14, 1691–1702, https://doi.org/10.5194/nhess-14-1691-2014, 2014.
Hawcroft, M. K., Shaffrey, L. C., Hodges, K. I., and Dacre, H. F.: How much Northern Hemisphere precipitation is associated with extratropical cyclones?, Geophys. Res. Lett., 39, L24809, https://doi.org/10.1029/2012GL053866, 2012.
Hoskins, B. J., McIntyre, M. E., and Robertson, A. W.: On the use and significance of isentropic potential vorticity maps, Q. J. Roy. Meteor. Soc., 111, 877–946, https://doi.org/10.1002/qj.49711147002, 1985.
Lavers, D. A. and Villarini, G.: The nexus between atmospheric rivers and extreme precipitation across Europe, Geophys. Res. Lett., 40, 3259–3264, https://doi.org/10.1002/GRL.50636, 2013.
Lenderink, G. and Van Meijgaard, E.: Linking increases in hourly precipitation extremes to atmospheric temperature and moisture changes, Environ. Res. Lett., 5, 025208, https://doi.org/10.1088/1748-9326/5/2/025208, 2010.
Lenggenhager, S. and Martius, O.: Atmospheric blocks modulate the odds of heavy precipitation events in Europe, Clim. Dynam., 53, 4155–4171, https://doi.org/10.1007/s00382-019-04779-0, 2019.
Lenggenhager, S., Croci-Maspoli, M., Brönnimann, S., and Martius, O.: On the dynamical coupling between atmospheric blocks and heavy precipitation events: A discussion of the southern Alpine flood in October 2000, Q. J. Roy. Meteor. Soc., 145, 530–545, https://doi.org/10.1002/qj.3449, 2019.
Mailier, P. J., Stephenson, D. B., Ferro, C. A. T., and Hodges, K. I.: Serial clustering of extratropical cyclones, Mon. Weather Rev., 134, 2224–2240, https://doi.org/10.1175/MWR3160.1, 2006.
Martius, O., Zenklusen, E., Schwierz, C., and Davies, H. C.: Episodes of Alpine heavy precipitation with an overlying elongated stratospheric intrusion: A climatology, Int. J. Climatol., 26, 1149–1164, https://doi.org/10.1002/joc.1295, 2006.
Martius, O., Sodemann, H., Joos, H., Pfahl, S., Winschall, A., Croci-Maspoli, M., Graf, M., Madonna, E., Mueller, B., Schemm, S., Sedláček, J., Sprenger, M., and Wernli, H.: The role of upper-level dynamics and surface processes for the Pakistan flood of July 2010, Q. J. Roy. Meteor. Soc., 139, 1780–1797, https://doi.org/10.1002/qj.2082, 2013.
Massacand, A. C., Wernli, H., and Davies, H. C.: Heavy precipitation on the alpine southside: An upper-level precursor, Geophys. Res. Lett., 25, 1435–1438, https://doi.org/10.1029/98GL50869, 1998.
McIntyre, M. E. and Palmer, T. N.: Breaking planetary waves in the stratosphere, Nature, 305, 593–600, https://doi.org/10.1038/305593a0, 1983.
Mohr, S., Wilhelm, J., Wandel, J., Kunz, M., Portmann, R., Punge, H. J., Schmidberger, M., Quinting, J. F., and Grams, C. M.: The role of large-scale dynamics in an exceptional sequence of severe thunderstorms in Europe May–June 2018, Weather Clim. Dynam., 1, 325–348, https://doi.org/10.5194/wcd-1-325-2020, 2020.
Moore, B. J., Neiman, P. J., Ralph, F. M., and Barthold, F. E.: Physical processes associated with heavy flooding rainfall in Nashville, Tennessee, and vicinity during 1–2 May 2010: The role of an atmospheric river and mesoscale convective systems, Mon. Weather Rev., 140, 358–378, https://doi.org/10.1175/MWR-D-11-00126.1, 2012.
Moore, B. J., Keyser, D., and Bosart, L. F.: Linkages between Extreme Precipitation Events in the Central and Eastern United States and Rossby Wave Breaking, Mon. Weather Rev., 147, 3327–3349, https://doi.org/10.1175/MWR-D-19-0047.1, 2019.
Moore, B. J., White, A. B., Gottas, D. J., and Neiman, P. J.: Extreme precipitation events in Northern California during winter 2016–17: Multiscale analysis and climatological perspective, Mon. Weather Rev., 148, 1049–1074, https://doi.org/10.1175/MWR-D-19-0242.1, 2020.
Moore, B. J., White, A. B., and Gottas, D. J.: Characteristics of long-duration heavy precipitation events along the West Coast of the United States, Mon. Weather Rev., 149, 2255–2277, https://doi.org/10.1175/MWR-D-20-0336.1, 2021.
Newell, R. E., Newell, N. E., Zhu, Y., and Scott, C.: Tropospheric rivers? – A pilot study, Geophys. Res. Lett., 19, 2401–2404, https://doi.org/10.1029/92GL02916, 1992.
Pfahl, S. and Wernli, H.: Quantifying the relevance of cyclones for precipitation extremes, J. Climate, 25, 6770–6780, https://doi.org/10.1175/JCLI-D-11-00705.1, 2012.
Pfahl, S., Madonna, E., Boettcher, M., Joos, H., and Wernli, H.: Warm conveyor belts in the ERA-Interim Dataset (1979–2010). Part II: Moisture origin and relevance for precipitation, J. Climate, 27, 27–40, https://doi.org/10.1175/JCLI-D-13-00223.1, 2014.
Pfleiderer, P., Schleussner, C. F., Kornhuber, K., and Coumou, D.: Summer weather becomes more persistent in a 2 ∘C world, Nat. Clim. Chang., 9, 666–671, https://doi.org/10.1038/s41558-019-0555-0, 2019.
Pinto, J. G., Gómara, I., Masato, G., Dacre, H. F., Woollings, T., and Caballero, R.: Large-scale dynamics associated with clustering of extratropical cyclones affecting Western Europe, J. Geophys. Res., 119, 13704–13719, https://doi.org/10.1002/2014JD022305, 2014.
Portmann, R.: The life cycles of potential vorticity cutoffs: Climatology, predictability and high impact weather, ETH Zürich, 232 pp., https://doi.org/10.3929/ethz-b-000466735, 2020.
Portmann, R., Crezee, B., Quinting, J., and Wernli, H.: The complex life-cycles of two long-lived potential vorticity cutoffs over Europe, Q. J. Roy. Meteor. Soc., 144, 701–719, https://doi.org/10.1002/qj.3239, 2018.
Portmann, R., Sprenger, M., and Wernli, H.: The three-dimensional life cycles of potential vorticity cutoffs: a global and selected regional climatologies in ERA-Interim (1979–2018), Weather Clim. Dynam., 2, 507–534, https://doi.org/10.5194/wcd-2-507-2021, 2021.
Priestley, M. D. K., Pinto, J. G., Dacre, H. F., and Shaffrey, L. C.: Rossby wave breaking, the upper level jet, and serial clustering of extratropical cyclones in western Europe, Geophys. Res. Lett., 44, 514–521, https://doi.org/10.1002/2016GL071277, 2017a.
Priestley, M. D. K., Pinto, J. G., Dacre, H. F., and Shaffrey, L. C.: The role of cyclone clustering during the stormy winter of 2013/2014, Weather, 72, 187–192, https://doi.org/10.1002/WEA.3025, 2017b.
Ralph, F. M., Neiman, P. J., and Wick, G. A.: Satellite and CALJET aircraft observations of atmospheric rivers over the Eastern North Pacific Ocean during the winter of 1997/98, Mon. Weather Rev., 132, 1721–1745, https://doi.org/10.1175/1520-0493(2004)132<1721:SACAOO>2.0.CO;2, 2004.
Raveh-Rubin, S. and Wernli, H.: Large-scale wind and precipitation extremes in the Mediterranean: A climatological analysis for 1979–2012, Q. J. Roy. Meteor. Soc., 141, 2404–2417, https://doi.org/10.1002/qj.2531, 2015.
Rex, D. F.: Blocking action in the middle troposphere and its effect upon regional climate, Tellus A, 2, 196–211, https://doi.org/10.1111/j.2153-3490.1950.tb00331.x, 1950.
Romero, R., Sumner, G., Ramis, C., and Genovés, A.: A classification of the atmospheric circulation patterns producing significant daily rainfall in the Spanish Mediterranean area, Int. J. Climatol., 19, 765–785, https://doi.org/10.1002/(SICI)1097-0088(19990615)19:7<765::AID-JOC388>3.0.CO;2-T, 1999.
Rössler, O., Froidevaux, P., Börst, U., Rickli, R., Martius, O., and Weingartner, R.: Retrospective analysis of a nonforecasted rain-on-snow flood in the Alps – a matter of model limitations or unpredictable nature?, Hydrol. Earth Syst. Sci., 18, 2265–2285, https://doi.org/10.5194/hess-18-2265-2014, 2014.
Röthlisberger, M., Pfahl, S., and Martius, O.: Regional-scale jet waviness modulates the occurrence of midlatitude weather extremes, Geophys. Res. Lett., 43, 989–997, https://doi.org/10.1002/2016GL070944, 2016.
Röthlisberger, M., Frossard, L., Bosart, L. F., Keyser, D., and Martius, O.: Recurrent synoptic-scale Rossby wave patterns and their effect on the persistence of cold and hot spells, J. Climate, 32, 3207–3226, https://doi.org/10.1175/JCLI-D-18-0664.1, 2019.
Rüdisühli, S., Sprenger, M., Leutwyler, D., Schär, C., and Wernli, H.: Attribution of precipitation to cyclones and fronts over Europe in a kilometer-scale regional climate simulation, Weather Clim. Dynam., 1, 675–699, https://doi.org/10.5194/wcd-1-675-2020, 2020.
Schmidli, J. and Frei, C.: Trends of heavy precipitation and wet and dry spells in Switzerland during the 20th century, Int. J. Climatol., 25, 753–771, https://doi.org/10.1002/joc.1179, 2005.
Sousa, P. M., Trigo, R. M., Barriopedro, D., Soares, P. M. M., Ramos, A. M., and Liberato, M. L. R.: Responses of European precipitation distributions and regimes to different blocking locations, Clim. Dynam., 48, 1141–1160, https://doi.org/10.1007/s00382-016-3132-5, 2017.
Sprenger, M., Fragkoulidis, G., Binder, H., Croci-Maspoli, M., Graf, P., Grams, C. M., Knippertz, P., Madonna, E., Schemm, S., Škerlak, B., and Wernli, H.: Global climatologies of Eulerian and Lagrangian flow features based on ERA-Interim, B. Am. Meteorol. Soc., 98, 1739–1748, https://doi.org/10.1175/BAMS-D-15-00299.1, 2017.
Thorncroft, C. D., Hoskins, B. J., and McIntyre, M. E.: Two paradigms of baroclinic-wave life-cycle behaviour, Q. J. Roy. Meteor. Soc., 119, 17–55, https://doi.org/10.1002/qj.49711950903, 1993.
Tolika, K. and Maheras, P.: Spatial and temporal characteristics of wet spells in Greece, Theor. Appl. Climatol., 81, 71–85, https://doi.org/10.1007/s00704-004-0089-9, 2005.
Ulbrich, U., Brücher, T., Fink, A. H., Leckebusch, G. C., Krüger, A., and Pinto, J. G.: The central European floods of August 2002: Part 2 – Synoptic causes and considerations with respect to climatic change, Weather, 58, 434–442, https://doi.org/10.1256/wea.61.03B, 2003.
Wernli, H. and Schwierz, C.: Surface cyclones in the ERA40 data set (1958–2001). Part I: Novel identification method and global climatology, J. Atmos. Sci., 63, 2486–2507, https://doi.org/10.1175/JAS3766.1, 2006.
Wernli, H. and Sprenger, M.: Identification and ERA-15 climatology of potential vorticity streamers and cutoffs near the extratropical tropopause, J. Atmos. Sci., 64, 1569–1586, https://doi.org/10.1175/JAS3912.1, 2007.
White, A. B., Moore, B. J., Gottas, D. J., and Neiman, P. J.: Winter storm conditions leading to excessive runoff above California's Oroville Dam during January and February 2017, B. Am. Meteorol. Soc., 100, 55–70, https://doi.org/10.1175/BAMS-D-18-0091.1, 2019.
Wilks, D. S.: Statistical methods in the atmospheric sciences, 3rd edn., Elsevier Inc., 663 pp., https://doi.org/10.1016/B978-0-12-385022-5.00001-4, 2011.
Winschall, A., Pfahl, S., Sodemann, H., and Wernli, H.: Comparison of Eulerian and Lagrangian moisture source diagnostics – the flood event in eastern Europe in May 2010, Atmos. Chem. Phys., 14, 6605–6619, https://doi.org/10.5194/acp-14-6605-2014, 2014.
Zhu, Y. and Newell, R. E.: A proposed algorithm for moisture fluxes from atmospheric rivers, Mon. Weather Rev., 126, 725–735, https://doi.org/10.1175/1520-0493(1998)126<0725:APAFMF>2.0.CO;2, 1998.
Zolina, O., Simmer, C., Gulev, S. K., and Kollet, S.: Changing structure of European precipitation: Longer wet periods leading to more abundant rainfalls, Geophys. Res. Lett., 37, L06704, https://doi.org/10.1029/2010GL042468, 2010.
Zolina, O., Simmer, C., Belyaev, K., Gulev, S. K., and Koltermann, P.: Changes in the duration of European wet and dry spells during the last 60 years, J. Climate, 26, 2022–2047, https://doi.org/10.1175/JCLI-D-11-00498.1, 2013.