the Creative Commons Attribution 4.0 License.
the Creative Commons Attribution 4.0 License.
 | 25 Jan 2023
Origin of low-tropospheric potential vorticity in Mediterranean cyclones
Alexander Scherrmann
Heini Wernli
Emmanouil Flaounas
Mediterranean cyclones are extratropical cyclones, typically of smaller size and weaker intensity than other cyclones that develop over the main open ocean storm tracks. Nevertheless, Mediterranean cyclones can attain high intensities, even comparable to the ones of tropical cyclones, and thus cause large socioeconomic impacts in the densely populated coasts of the region. After cyclogenesis takes place, a large variety of processes are involved in the cyclone’s development, contributing with positive and negative potential vorticity (PV) changes to the lower-tropospheric PV anomalies in the cyclone center. Although the diabatic processes that produce these PV anomalies in Mediterranean cyclones are known, it is still an open question whether they occur locally within the cyclone itself or remotely in the environment (e.g., near high orography) with a subsequent transport of high-PV air into the cyclone center. This study introduces a Lagrangian method to determine the origin of the lower-tropospheric PV anomaly, which is applied climatologically to ERA5 reanalysis and to 12 monthly simulations, performed with the integrated forecasting system (IFS) model. We define and quantify so-called “cyclonic” and “environmental” PV and find that the main part of the lower-tropospheric PV anomaly (60 %) is produced within the cyclone, shortly prior (−12 h) to the cyclones' mature stage. Nevertheless, in 19.5 % of the cyclones the environmental PV production near the mountains surrounding the Mediterranean Basin plays a significant role in forming the low-tropospheric PV anomaly and therefore in determining the intensity of these cyclones. The analysis of PV tendencies from the IFS simulations reveals that the major PV production inside the cyclone is typically due to convection and microphysics, whereas convection and turbulent momentum tendencies cause most of the positive PV changes in the environment.
- Article
(7434 KB) - Full-text XML
- BibTeX
- EndNote


The Mediterranean is one of the most cyclogenetic regions in the world (Trigo et al., 1999; Ulbrich et al., 2009; Neu et al., 2013). Mediterranean cyclones are prominent high-impact weather systems that have been increasingly analyzed in the last years, and thus, the driving processes of genesis and intensification of Mediterranean cyclones are fairly well known (Flaounas et al., 2022). They typically form in response to upper-tropospheric systems, such as potential vorticity (PV) cutoffs or narrow, meridionally extended troughs that correspond to PV streamers (Appenzeller and Davies, 1992). These systems trigger baroclinic instability, which can provoke cyclogenesis (Massacand et al., 1998; Emanuel, 2005; Fita et al., 2006; Chaboureau et al., 2012; Flaounas et al., 2015; Raveh-Rubin and Flaounas, 2017).
Apart from the upper-level influence of the PV streamer, which corresponds to a southward deviation of the polar jet (Raveh-Rubin and Flaounas, 2017), diabatic processes in the lower troposphere usually contribute to the development and intensification of the cyclone (e.g., Campins et al., 2000; Horvath et al., 2006; McTaggart-Cowan et al., 2010) by generating a positive PV anomaly, e.g., due to latent heating by condensation in ascending air (Davis et al., 1993; Rossa et al., 2000; Čampa and Wernli, 2012). Thereby, the typically (very) strong cyclonic circulation in the lower troposphere in the mature stage (e.g., stage of minimum sea level pressure) of extratropical and Mediterranean cyclones can be attributed to the synergy and vertical alignment of a diabatically produced positive PV anomaly at low levels and advected PV anomalies through the upper-level PV streamer or cutoff. This alignment is a so-called PV tower (Rossa et al., 2000; Čampa and Wernli, 2012), which has also been observed in intense Mediterranean cyclones (e.g., Miglietta et al., 2017). In a recent study, Flaounas et al. (2021) found that both PV anomalies are contributing to the cyclonic circulation. However, their relative contribution might strongly vary from case to case.
PV was first introduced by Rossby (1939) and then defined by Ertel (1942) as
with air density ρ, the absolute vorticity vector η, and potential temperature θ. It is materially conserved under adiabatic conditions such that only diabatic processes, e.g., latent heating and turbulence, can modify it (Ertel, 1942; Hoskins et al., 1985). PV can be inverted, given balanced conditions, to recover the whole atmospheric state (e.g., Davis, 1992). Thereby, a positive PV anomaly induces a cyclonic circulation and thus makes PV an adequate variable to study cyclone dynamics. The origin of the diabatically produced PV is often attributed to convection. Using lightning observations, it was recently shown that in about one-third of intense Mediterranean cyclones the lower-tropospheric PV originates from deep convection located close to the cyclone center and the associated latent heating by condensation (Galanaki et al., 2016; Flaounas et al., 2018). However, a systematic assessment of the processes that produce PV in Mediterranean cyclones, also by other processes, such as turbulence, is currently missing. The recent study by Attinger et al. (2021) showed that, in North Atlantic cyclones, turbulent and radiative processes can also contribute to the PV production in the center and along the fronts of the cyclone. In fact, they presented a case study of a cyclone in which the lower-tropospheric PV anomaly within the cyclone center could be almost entirely attributed to frictional forces.
In some case studies of Mediterranean cyclones near the Alps, turbulence, particularly in the boundary layer, was found to produce the lower-tropospheric PV (Flaounas et al., 2021). This PV originates from positive PV filaments, so-called PV banners (Aebischer and Schär, 1998; Rotunno et al., 1999; Epifanio and Durran, 2002; Schär et al., 2003; Flamant et al., 2004), horizontally extending from the mountains to the Mediterranean Sea. Indeed it has been shown by many studies that the complex topography surrounding the Mediterranean can lead to, for example, Alpine lee cyclogenesis (Buzzi and Tibaldi, 1978; Buzzi et al., 2020). The lee side of the mountains is a favorable region for cyclogenesis, but it is unknown how many Mediterranean cyclones are directly affected by PV banners formed along the Alps or other mountain ranges (Flaounas et al., 2022), and how much the PV, formed along the orography and then advected to the cyclone center, contributes to the PV budget in the mature stage of the cyclones.
To analyze the origin of PV production in the lower troposphere during the mature stage of Mediterranean cyclones (i.e., when their center reaches its minimum sea level pressure – SLP), this study introduces a new method that identifies whether low-tropospheric PV is produced “within” or “outside” the cyclone, hereafter referred to as “cyclonic” and “environmental” PV, respectively. With this approach we quantify the relative contribution of processes in the environment and within the cyclone. More specifically, our objectives are to identify the following.
-
Where and when, relative to the cyclone center and the mature stage of the cyclone, is the PV in the lower-tropospheric PV anomaly produced and what is the contribution of environmental PV production, particularly by topography?
-
Which diabatic processes predominantly produce PV within the cyclone and which in the environment, and what is their relative contribution to the PV in the lower troposphere at the mature stage of the cyclone?
The study is structured as follows: in Sect. 2 we provide an overview of the data and algorithms used before introducing the concept of cyclonic and environmental PV in Sect. 3. The results for a large cyclone sample in ERA5 reanalyses are presented in Sects. 4 and 5. Finally, Sect. 6 provides results from a smaller set of cyclones in monthly IFS simulations, for which we quantify the PV modification by different diabatic processes. In the last section we summarize and discuss our results and give an outlook for future studies.
2.1 Datasets
In this study, we use two datasets, which are output from simulations with a special version of the ECMWF's integrated forecasting system (IFS) and ERA5 reanalysis data from 1979 to 2020 (Hersbach et al., 2020). From ERA5, we use wind and PV fields (PV calculated on model levels), regridded to a 0.5∘ × 0.5∘ grid on 98 vertical model levels. We also use output from 12 monthly IFS simulations, which were obtained using cycle 43R1 of the hydrostatic IFS model (Roberts et al., 2018), as described in Attinger et al. (2021). Each simulation covers 35 d and is initialized at the beginning of each month from December 2017 to November 2018. Note that only the initial conditions of the simulations are forced into the model, and thus after 3–6 d, the simulations deviate from the real atmospheric state. Nevertheless, the model still reproduces realistic atmospheric processes and physical systems and thus provides valuable diabatic process-related insights into cyclone dynamics. The available data cover the Northern Hemisphere on a 0.4∘ × 0.4∘ grid on 83 vertical model levels. The special IFS version provides detailed output of temperature and momentum tendencies from all parameterizations, from which we can calculate the corresponding PV tendencies, enabling a process-based investigation of the formation of PV anomalies along trajectories. Here we follow the approach by Joos and Wernli (2012), which was later used, for example, by Attinger et al. (2019, 2021) and Spreitzer et al. (2019). Table 1 summarizes the processes and corresponding PV tendencies considered in our study. Details about the parameterizations, as well as the calculation of the PV tendencies, can be found in Attinger et al. (2019).
Table 1Physical processes and associated PV rates (PVRs) we consider in the IFS simulations. For the convection and turbulence scheme, there are PV rates due to temperature and momentum tendencies, which are denoted by subscripts T and M, respectively.

2.2 Cyclone tracking and physical characteristics
For cyclones in ERA5, we applied the cyclone tracking method of Wernli and Schwierz (2006) with the modifications described in Sprenger et al. (2017), which focuses on local minima in the SLP field. For the IFS, the tracks were identified with the approach by Attinger (2020), who adapted the method of Wernli and Schwierz (2006) by further including fields of relative vorticity and equivalent potential temperature to improve the identification of cyclones and their frontal structures. We define a cyclone as a Mediterranean cyclone if it reaches its mature stage in the region indicated by the black box in Fig. 1. The mature stage is defined as the time of maximum relative vorticity at 850 hPa along the IFS tracks and as the time of minimum SLP along the ERA5 tracks. For ERA5, in order to focus on the most intense cyclones, we only retain cyclones with an SLP minimum below 1010 hPa and at least a 5 hPa difference between its minimum and maximum SLP value along the track. Finally, we select cyclones where the low-level PV anomaly reaches both a certain spatial size and amplitude such that we can initialize at least 200 backward trajectories at grid points with PV ≥0.75 PVU (1 PVU m2 s−1 K kg−1) from their mature stage. Applying all these criteria resulted in 55 cyclone tracks in the 12 monthly IFS simulations (red dots in Fig. 1) and 2969 tracks in ERA5 (blue contours in Fig. 1). An average of 590 backward trajectories has been initialized for each cyclone. Similar to previous studies on the climatology of Mediterranean cyclones (Campins et al., 2011), we find the main cyclone hot spots in the Gulf of Genoa, the Adriatic Sea, close to Cyprus, and near the Atlas Mountains (bold blue contours in Fig. 1).
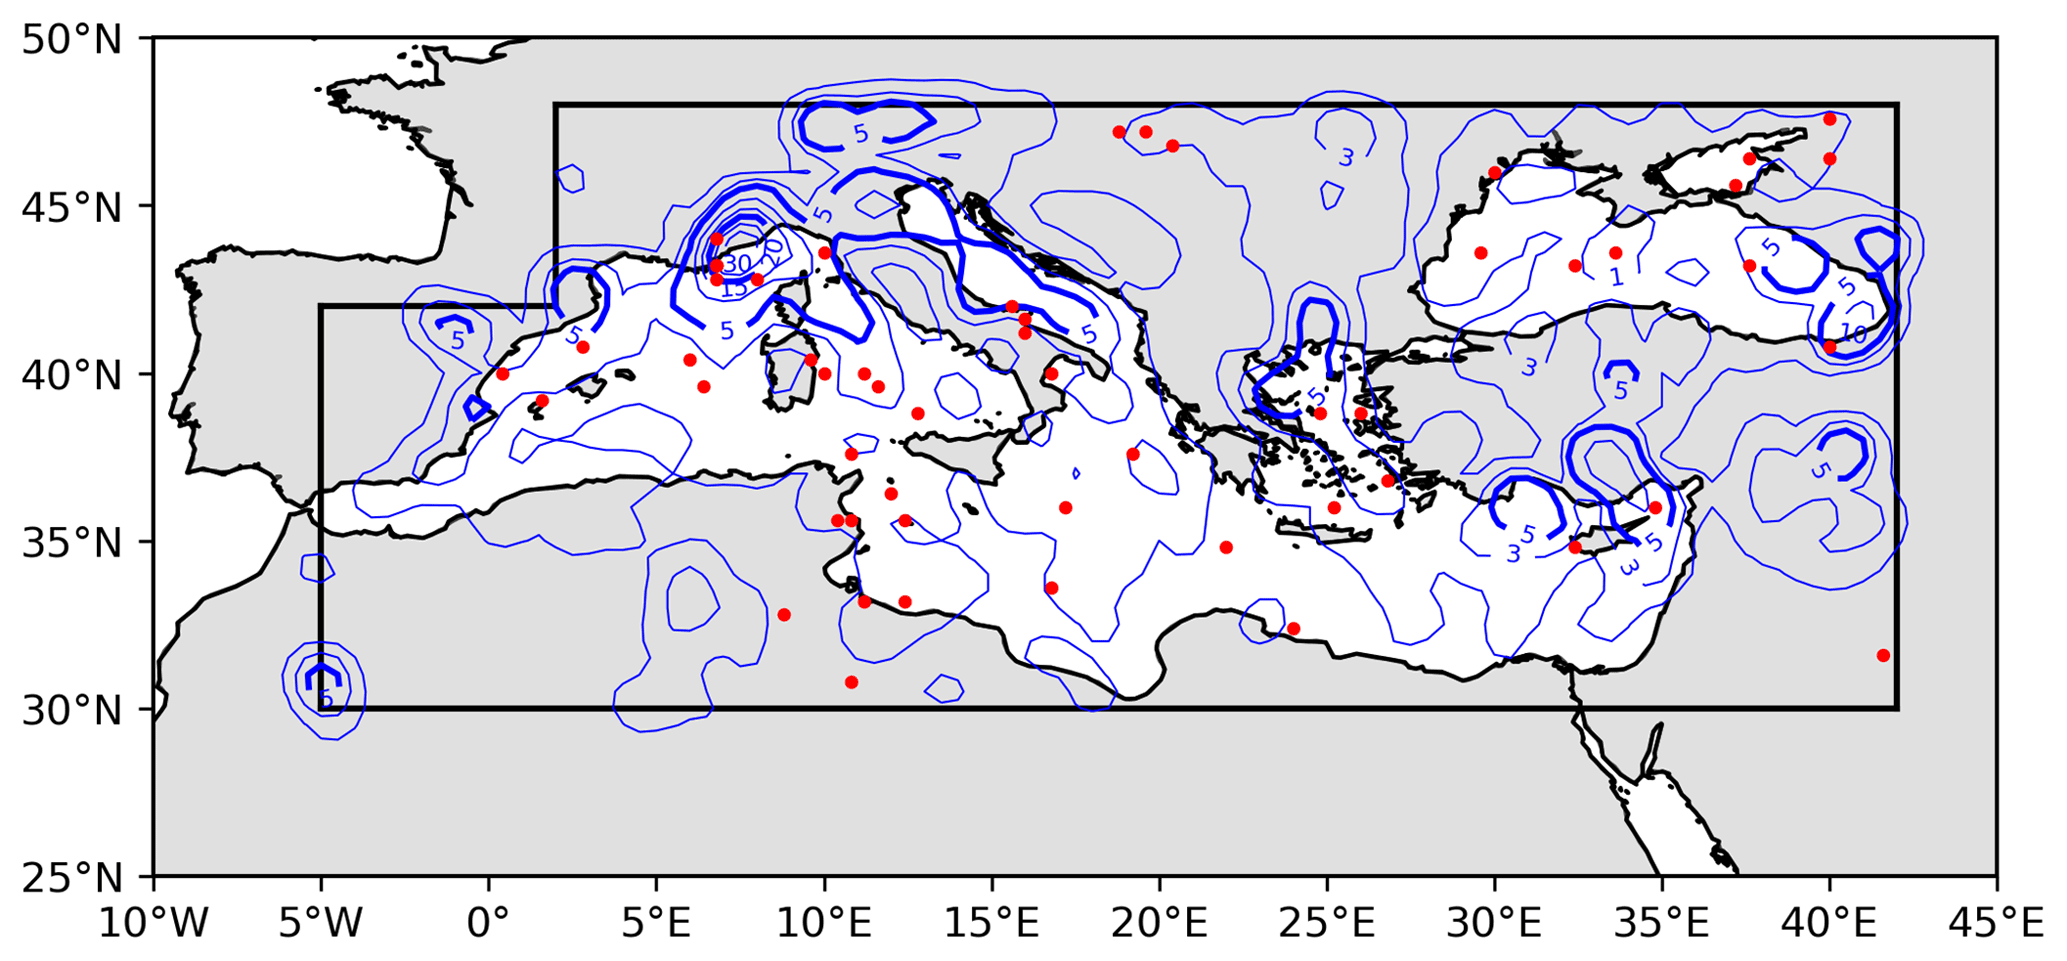
Figure 1Location of all considered Mediterranean cyclones at their mature stage in ERA5 (blue contours) and in the IFS simulations (red dots). The blue contours show the number of cyclones at the specific location (averaged in a 1.5∘ × 1.5∘ box around the grid points) with contour levels of 1, 3, 5, 10, 15, 20, 25, and 30 (level 5 and 20 contours are bold).

Figure 2SLP statistics for almost 3000 Mediterranean cyclones in ERA5. (a) Time evolution of minimum SLP along cyclone tracks; the black line shows the mean and grey shading the range between the 10th and 90th percentiles; vertical lines indicate the average time of cyclogenesis and cyclolysis. (b) Histogram of minimum SLP along each cyclone track (bin width of 1.25 hPa) and cumulative number of cyclones (black line).
Figure 2a shows the average time evolution of SLP along the ERA5 cyclone tracks, centered at the time of the mature stage (0 h). The average lifetime of these cyclones is about 36 h, indicated in Fig. 2a by the black vertical lines. The first track point is identified on average about 13 h before the mature stage ( h) and the last track point about 24 h after the mature stage (t=24 h). The mean SLP gradually decreases during the 2 d prior to the mature stage from about 1009 to 1002 hPa, and then it almost symmetrically increases in the next 2 d. The grey shading in Fig. 2 shows that the SLP evolution of individual cyclones is more variable. The SLP evolution of IFS cyclones is similar with a slightly lower average of 998 hPa at t=0 h compared to 1002 hPa in ERA5 and a slightly shorter average lifetime of 33 h (not shown). The distribution of minimum SLP along ERA5 cyclone tracks is shown in Fig. 2b. The majority of cyclones (66 %) have a minimum SLP larger than 998.75 hPa, indicated by the cumulative number of cyclones (black line). The largest number of cyclones is found with an SLP minimum of about 1002.5 hPa. The distribution is strongly skewed with the deepest cyclones reaching minimum SLP values slightly lower than 980 hPa. Due to the significantly lower number of cyclones in the IFS simulations, the corresponding histogram does not provide statistically significant insights into the SLP distribution in the IFS simulations. The values in Fig. 2 are in accordance with a recent study by Aragão and Porcù (2022), who quantified the cyclone activity in the Mediterranean using ERA5. Considering seasonality, we find the largest number of cyclones in winter (DJF) and about half that number during summer (JJA), representing a seasonal cycle similar to the one presented in Flaounas et al. (2015).
2.3 Lagrangian perspective on diabatic PV modification
In order to investigate the processes that contributed to the formation of the lower-tropospheric PV anomalies in the identified IFS cyclones, we first calculate backward trajectories from the lower-tropospheric PV anomaly in each cyclone and then accumulate local PV tendencies along trajectories. In addition, we keep track of where the anomalies formed that eventually are located in the cyclone center. It is important to note that such an analysis requires the availability of 3-dimensional diabatic tendency fields due to individual processes, which are not routinely available (e.g., in ERA5). Therefore, this Lagrangian analysis could only be applied to the much smaller set of IFS cyclones and not to cyclones in ERA5.
The PV tendency PVRi, due to a diabatic process i, is quantified by the PV tendency equation (Ertel, 1942):
with the potential temperature and momentum tendencies (Fi) due to the diabatic process i (see Table 1). To quantify the contribution of each process to the lower-tropospheric PV, we follow the approach of Crezee et al. (2017), Spreitzer et al. (2019), and Attinger et al. (2019), in which the integration of PVRi along the trajectory r(t) from time tn to t0 (tn<t0) yields the accumulated PV (APVi) of the particular process between times tn and t0. Here, tn indicates the end time of the backward trajectory calculation initialized at t0, and the accumulated PV tendency APVi is approximated by the summation of the hourly PV tendencies along the trajectory:
Here, we use the average PV tendency of two consecutive trajectory points in time to account for temporal variations in the processes between hourly output times. However, this approach does not yield a perfectly closed PV budget, and hence the time integration results in a residual, whose potential sources are explained in detail in Attinger et al. (2019). For the Mediterranean IFS cyclones, we find an average residual of −0.2 PVU, which is expected to have a negligible effect on cyclone dynamics.
Similar to the PV modifications due to explicitly accumulated PV tendencies, APVi (Eq. 3), we define the total PV change as follows:
Flaounas et al. (2021) showed that most of the diabatic processes that are relevant for Mediterranean cyclone dynamics occur close to the cyclone center, and the low-level PV anomaly extends to about 150 km from the cyclone center. Therefore, we initialize trajectories within a distance of 200 km around the SLP minimum (dashed ring in Fig. 3a). We restrict the initialization to the lower troposphere between 975–700 hPa to focus on the lower-tropospheric PV anomaly that is typically largest in this layer in extratropical cyclones (Čampa and Wernli, 2012). Trajectories are initialized from grid points located within the dashed circle and if their PV value exceeds 0.75 PVU. These criteria are consistent with the composite averages shown in Flaounas et al. (2021) where PV near the cyclone center at 850 hPa is of the order of 0.7 to 0.8 PVU and concentrated within a radius of 200 km from the cyclone center (their Fig. 5d). Furthermore, this is about twice the climatological PV value over the Mediterranean Sea between 975–700 hPa, and thus, we consider it as a good threshold for the lower-tropospheric positive PV anomaly.
We compute backward trajectories using LAGRANTO (Wernli and Davies, 1997; Sprenger and Wernli, 2015) until 48 h prior to the mature stage of the cyclone ( h), which is an adequate time period considering the short life span of Mediterranean cyclones (Trigo et al., 1999; Aragão and Porcù, 2022). Along these, we trace surface pressure, PV, and in the IFS simulations the available PV rates due to different diabatic processes. This allows us to define “cyclonic” and “environmental” PV as explained in the next section.
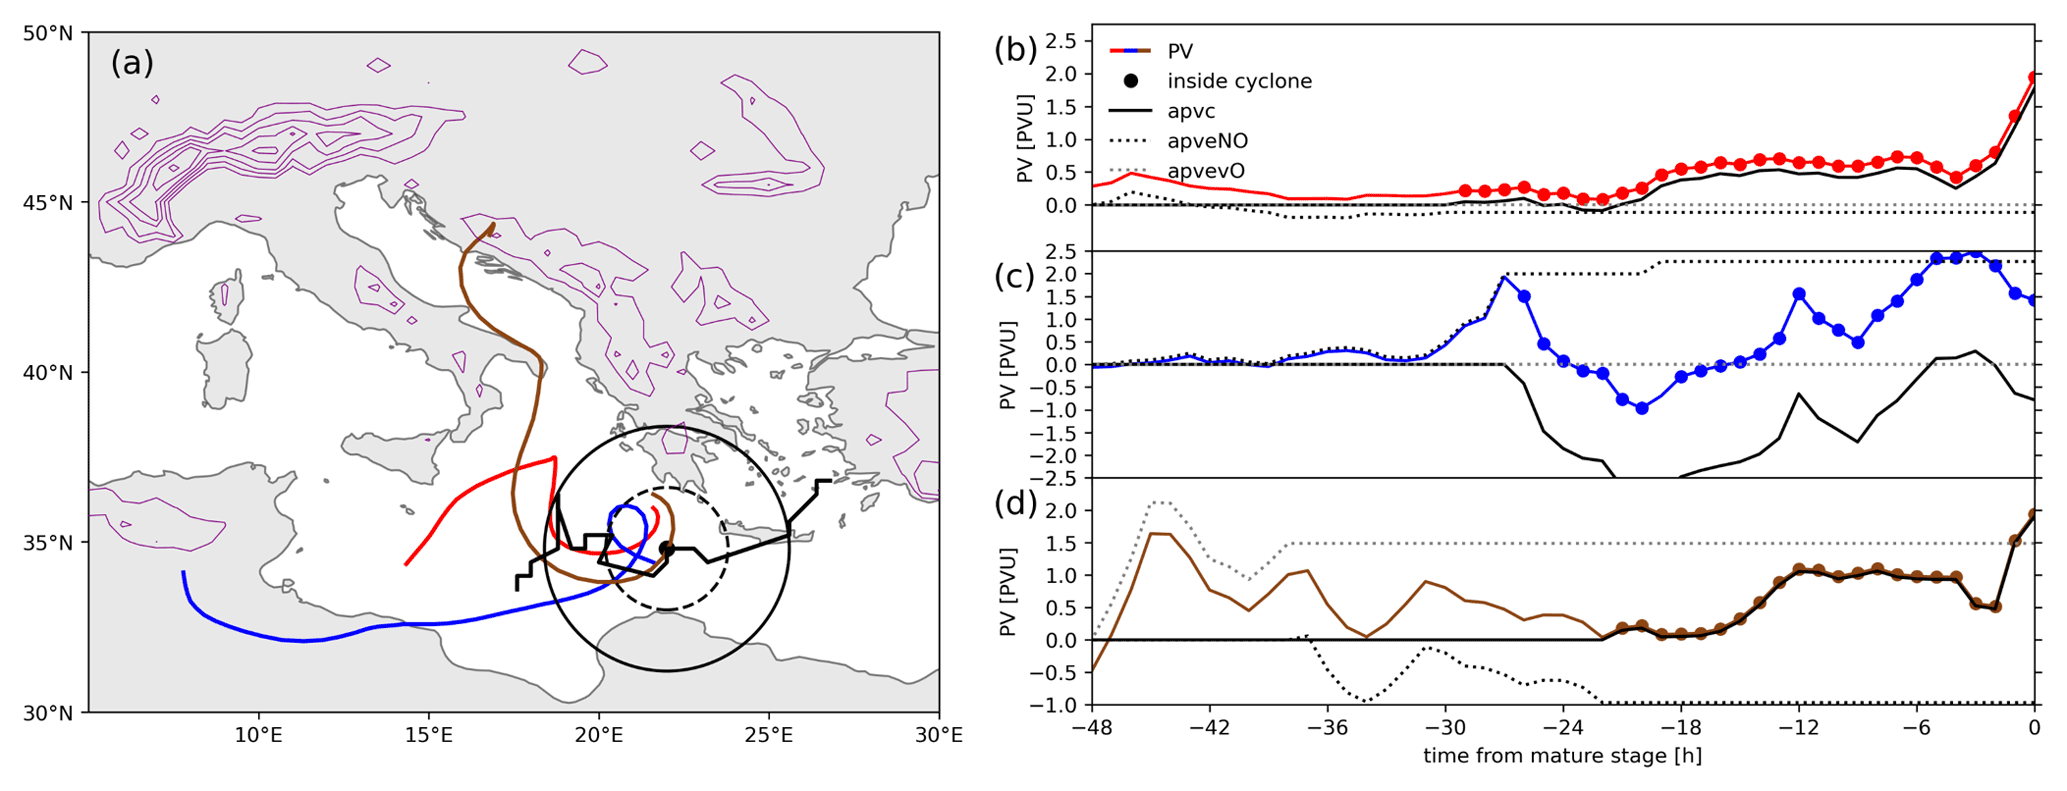
Figure 3Application of the method to quantify cyclonic vs. environmental PV production illustrated for three example trajectories. (a) Path of the 48 h backward trajectories (colors), the cyclone track (black), and the location of the mature stage (black dot). The region of trajectory initialization and the cyclone effective radius are highlighted by the dashed and solid black circles, respectively. The purple contours show topography, starting at 800 m with 400 m steps. (b–d) PV evolution (color) along the different trajectories and the diagnosed cyclonic (solid black line), environmental (dotted black line), and orographic PV (dotted grey line).
3.1 Methodology
To motivate the concept of distinguishing between cyclonic and environmental PV and to illustrate our approach, Fig. 3a shows three exemplary trajectories for one of the IFS cyclones. For the trajectory that is located always over the sea (red), we find a strong increase in PV within 6 h before the mature stage (Fig. 3b), whereas the trajectories from northern Africa (blue) and the Dinaric Alps (brown) experience both strong increases and decreases in PV at earlier times. However, it is a priori not known whether these PV modifications occurred close to the propagating cyclone or remotely, i.e., in the environment of the cyclone. Our method identifies PV changes as either “cyclonic” (PV produced inside the cyclone) or “environmental” (PV produced outside the cyclone, which we refer to as “in the environment”). To investigate the relative importance of cyclonic and environmental PV on the cyclone, we compare their strength to the total PV observed at the time of the mature stage. Hereafter, we refer to this PV value as PVM.
To distinguish between cyclonic and environmental PV we rely on (i) backward trajectories from the high-PV regions in the cyclone center of the mature stage and (ii) the cyclone track at times prior to the mature stage. In addition, we also pragmatically define (iii) a “cyclone effective area” as a circle with a radius yet to be determined around the cyclone center to define whether the air parcels are inside the cyclone or outside. All PV modifications taking place within this circle are considered to be related to the cyclone dynamics (i.e., “inside the cyclone”), while those outside the circle are considered “environmental”. We note here already that environmental PV will be further separated in two parts, depending on whether the environmental PV production occurred near high orography or not.
To gain insights into the sensitivity of our results to the size of the cyclone effective area, we used different radii of the circle to quantify the PV production inside the cyclone.
Figure 4 shows the average cyclonic PV modification along the backward trajectories that occur within the circle around the cyclone center for all ERA5 cyclones. The cyclonic PV modification strongly increases to about 0.68 PVU when increasing the radius up to 400 km. For larger radii, there is a comparatively small increase in cyclonic PV, reaching about 0.8 PVU for a radius of 1000 km. With a radius of 400 km, the cyclonic PV gain of 0.68 PVU plus the climatological PV value (see below) yields about 1 PVU, which we would expect to find in the lower-tropospheric PV anomaly in Mediterranean cyclones. Thus, and further considering also the typical size of Mediterranean cyclones (e.g., Trigo et al., 1999; Campins et al., 2011), we consider a radius of 400 km to be a reasonable radius for the cyclone effective radius.
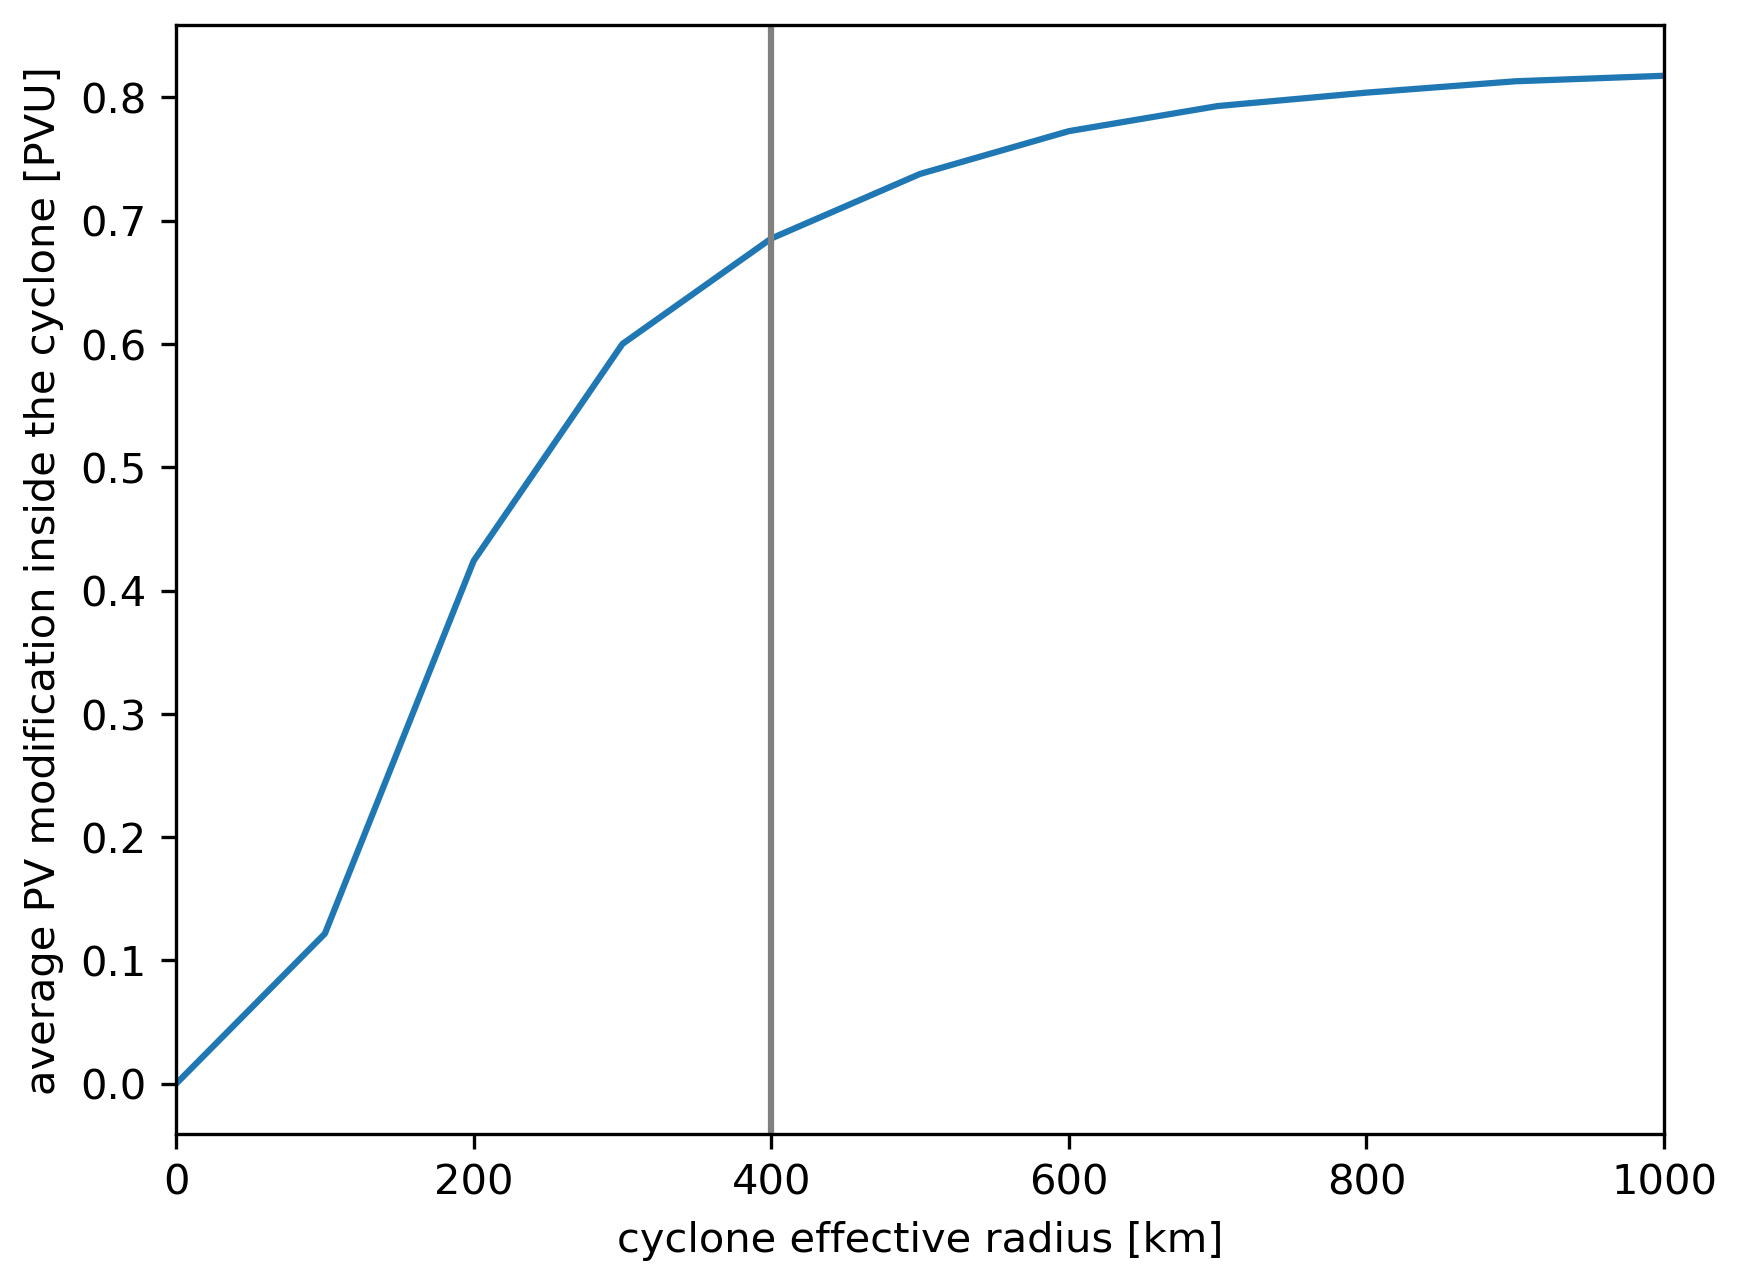
Figure 4Average cyclonic PV at the time of the mature stage for different values of cyclone effective radius, along all ERA5 trajectories.
We therefore define segments of trajectories as “inside the cyclone” if the distance between the air parcel's position at time t, r(t), and the current position of the cyclone center, C(t), are smaller than 400 km (solid black circle in Fig. 3a) and otherwise as “in the environment”. Note that this criterion is dynamic: the cyclone effective area (with fixed radius) is moving along the cyclone track and is compared with the backward trajectories at the same times. Thus, by design, at t=0 h all PV changes are cyclonic since trajectories are always initialized within 200 km from the cyclone center. In contrast, at times prior to cyclogenesis, i.e., prior to the first cyclone track point, all PV modifications are considered environmental. The net cyclonic PV change (apvc; solid black lines in Fig. 3b–d) and the environmental PV change (apve) can be quantified similar to Eq. (4) by summing the PV modifications at times when the air parcel is inside the cyclone (colored dots in Fig. 3b–d) and in the environment, respectively. Note that both apvc and apve are initialized to zero at h and then integrated forward in time. The sum of apvc and apve yields the total PV change apv. Our study further aims to quantify the role of PV production near mountains. Thus, we split the environmental PV modification into a “non-orographic environmental PV change” (apveNO; dotted black line in Fig. 3b–d) and an “orographic environmental PV modification” (apveO; dotted grey line in Fig. 3b–d). The latter concerns PV modifications that take place in air parcels when they pass over orography higher than 800 m within a near-surface layer with a thickness of 100 hPa; i.e., the pressure of the trajectory at the time of PV modification is not more than 100 hPa lower than the surface pressure. We acknowledge that both thresholds (orography ≥ 800 m and pressure difference < 100 hPa) are subjective, but they allow PV modifications that are likely influenced by orographic processes to be objectively identified.
For the trajectory in Fig. 3b, our analysis reveals that the steep increase in diagnosed PV (red line) in the last 6 h occurs within the cyclone. Therefore, the cyclonic PV (solid black) almost matches the total PVM with an accumulated value of +1.8 PVU. In contrast the environment provides a negative PV contribution of −0.15 PVU, which is completely related to non-orographic environmental PV (dotted black line). Indeed, no interaction with the mountains is identified (dotted grey line at 0 PVU). The net total PV change accounts for +1.65 PVU and, together with an initial value of 0.35 PVU at h (hereafter PVS), yields the 2 PVU value of PVM. For the second example shown in Fig. 3c, non-orographic environmental PV modifications (dotted black line) are taking place up to h (increase in diagnosed PV; blue line). After this time, the trajectory is considered to be within the cyclone, and PV is both produced and destroyed. Cyclonic PV changes are indicated in Fig. 3c by the solid black line after h and yield a net destruction of PV. In contrast, non-orographic environmental processes produce and contribute to PVM by +1.5 PVU.
To give an example of orographically influenced PV modifications, the air parcel in Fig. 3d experiences a steep early increase in diagnosed PV (brown line) when it is located over the Dinaric Alps (purple contours in Fig. 3a). In this case, the early PV increase (after h) is related to orographic environmental PV modification (dotted grey line). Afterwards, there are no further PV changes related to orography, and thus, the grey line in Fig. 3d remains horizontal. The environmental PV is still modified though but through non-orographic environmental PV changes (dotted black line). At the time of the mature stage t=0 h, the air parcel has experienced a net environmental PV modification of 0.5 PVU (the sum of apveNO and apveO). As the production of orographic environmental PV exceeds the destruction due to non-orographic environmental PV, we refer to the final value of apve of 0.5 PVU as orographic environmental PV. It is important to note that with this approach the “orographic environmental PV” refers to the PV modification near mountains without identifying or specifying the underlying physical process. This PV modification can be due to frictional effects and/or cloud-related diabatic processes.
3.2 Exemplary application to cyclone Zorbas
To provide an example, we quantify environmental and cyclonic PV modifications of medicane Zorbas (Portmann et al., 2020). Zorbas reached its minimum SLP of 992 hPa at 04:00 UTC on 28 September 2018 (black dot in Fig. 5a). Figure 5a also shows the track of Zorbas (black line), together with the 48 h backward trajectories initialized from the lower-tropospheric PV anomaly of Zorbas at the time of minimum SLP. The hourly trajectory segments are colored according to the PV modification within this hour. There is one major airstream from the Black Sea across the Aegean Sea towards Zorbas. Most trajectories show a strong PV increase close to the location of Zorbas and sporadic PV changes in both signs further upstream. Similar to Fig. 3b–d but now averaged over all trajectories shown in Fig. 5a, Fig. 5b shows the evolution of average diagnosed PV (grey) and of the diagnosed cyclonic (apvc(t)) and environmental PV (apve(t)). Air parcels have an average PVS of 0.4 PVU at h and an average PVM of 1.5 PVU at t=0 h. This leads to an average PV gain of 1.1 PVU along the trajectories. At early times ( h), i.e., before the genesis of Zorbas, averaged PV decreased by a little less than 0.1 PVU due to environmental PV destruction (negative apve; dotted line). After cyclogenesis until h, cyclonic PV remains close to zero, indicating that no PV modification occurred in the vicinity of the track of Zorbas (at a distance smaller than 400 km from the center). In this period, apve becomes even more negative (about −0.25 PVU). After h almost all trajectories enter the effective cyclone area. Therefore, apve(t) remains constant after h, and the very strong PV increase up to 1.5 PVU is entirely due to cyclonic PV production. This is what we would expect for a tropical-like cyclone that is predominantly driven by (deep) convection and intense low-level PV production close to its core. In essence, Fig. 5b shows that the PV gain of 1.1 PVU results from a cyclonic PV production of 1.35 PVU and an environmental PV destruction of −0.25 PVU. Note that, due to the low and negative contribution of the environmental PV, we do not split it into the non-orographic and orographic parts.
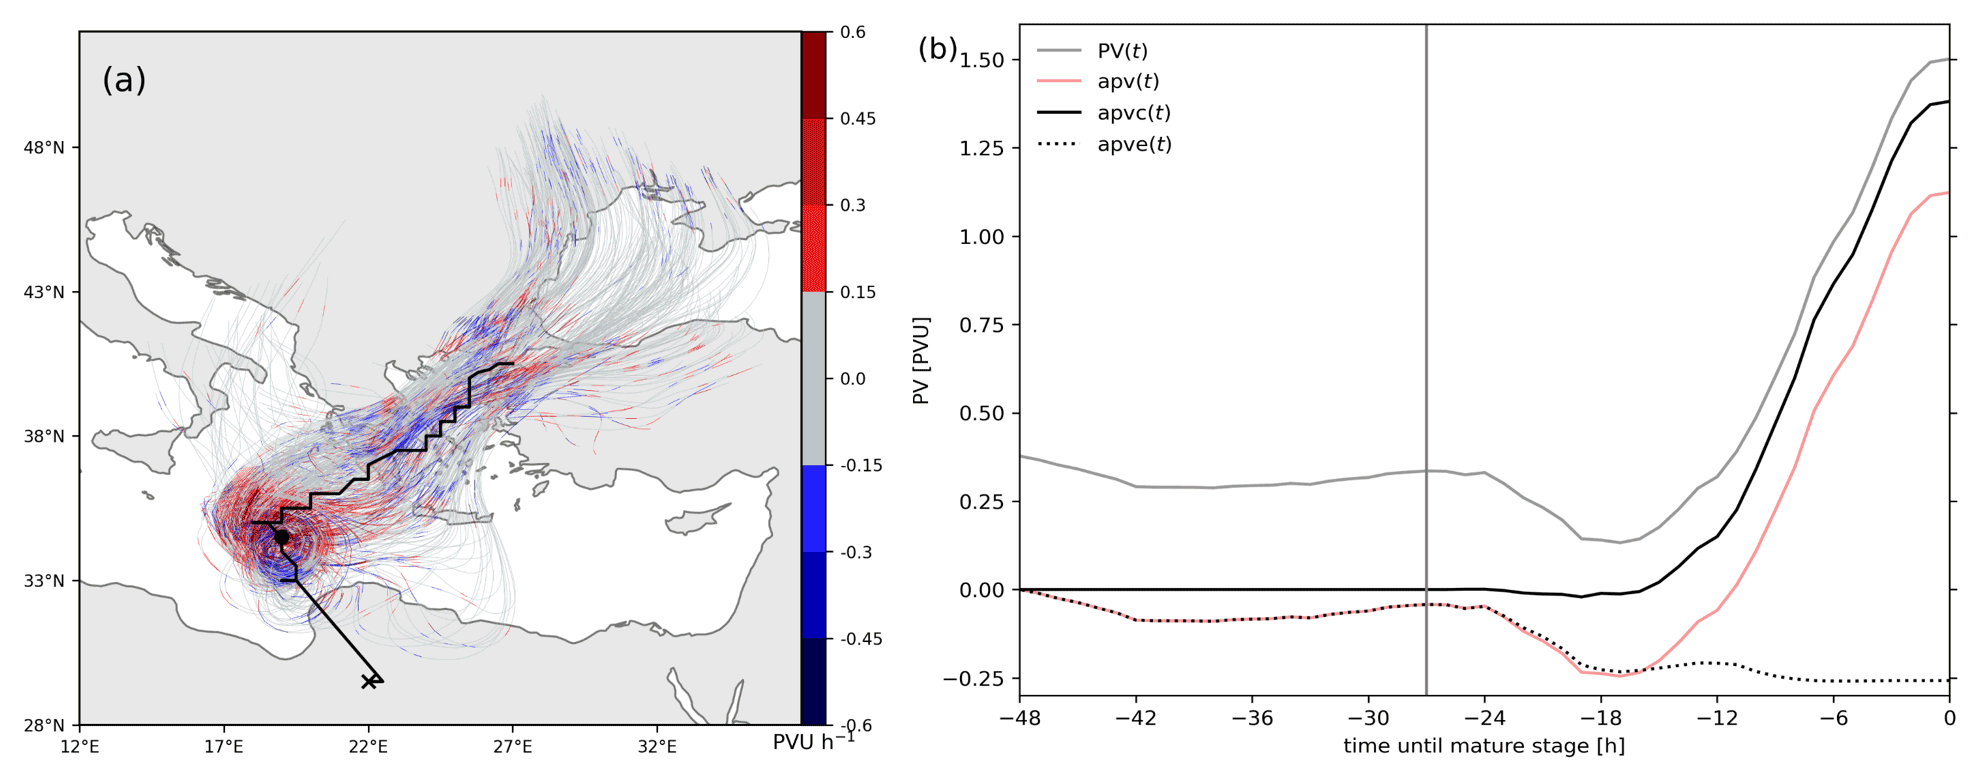
Figure 5Case study for cyclone Zorbas in the mature stage at 05:00 UTC on 28 September 2018 (t=0 h). (a) Backward trajectories from the low-tropospheric PV anomaly within Zorbas, colored with hourly PV changes (colors, in PVU h−1); the black dot indicates the location of the cyclone center, and the black line is the cyclone track from genesis over Libya marked with a black cross. (b) Time evolution of the average PV along the trajectories shown in (a) (grey), of the accumulated PV change, apv, starting at h (red), and of the accumulated cyclonic (solid black) and environmental (dotted black) PV modification. The time of cyclogenesis at h is shown by the vertical grey line.
In this section we apply our methodology to all Mediterranean cyclones identified in ERA5. Figure 6a shows the time evolution of PV averaged along all trajectories from all ERA5 cyclones, where t=0 h corresponds to the mature stage of the cyclones. The grey shaded area indicates the range between the 10th and 90th percentiles. From h until h, PV is on average fairly well conserved. In the last 12 h before the mature stage, PV increases to 1.5 PVU; i.e., there is a PV gain of 1 PVU. Therefore, the PV anomaly that defines the cyclone in the lower troposphere mainly forms within 12 h prior to the mature stage. It is noteworthy that some trajectories already start with PV ≥1 PVU. These high PVS values originate from PV production processes prior to h. In most cases, they were produced earlier than cyclogenesis and are therefore environmental. Figure 6b shows the time evolution of the cyclonic (apvc; red) and environmental (apve; blue) PV modifications. It reveals that most of the PV modification occurs inside the cyclone (mean value of 0.68 PVU) during the 12 h prior to the mature stage. Cyclonic PV starts increasing around h, matching the average time of cyclogenesis (Fig. 2a). In contrast, the contribution of environmental PV is about half as strong with a mean of 0.38 PVU. Interestingly, until about h, the mean environmental PV modification is close to zero, indicating that positive and negative contributions tend to cancel each other out. Nevertheless, the spread of environmental PV values in Fig. 6b (blue shading) shows also a particularly large case-by-case variability. For instance, total apve at t=0 h ranges from −0.55 to 1.5 PVU (10th and 90th percentiles) compared to apvc with a range from −0.2 to 1.6 PVU.
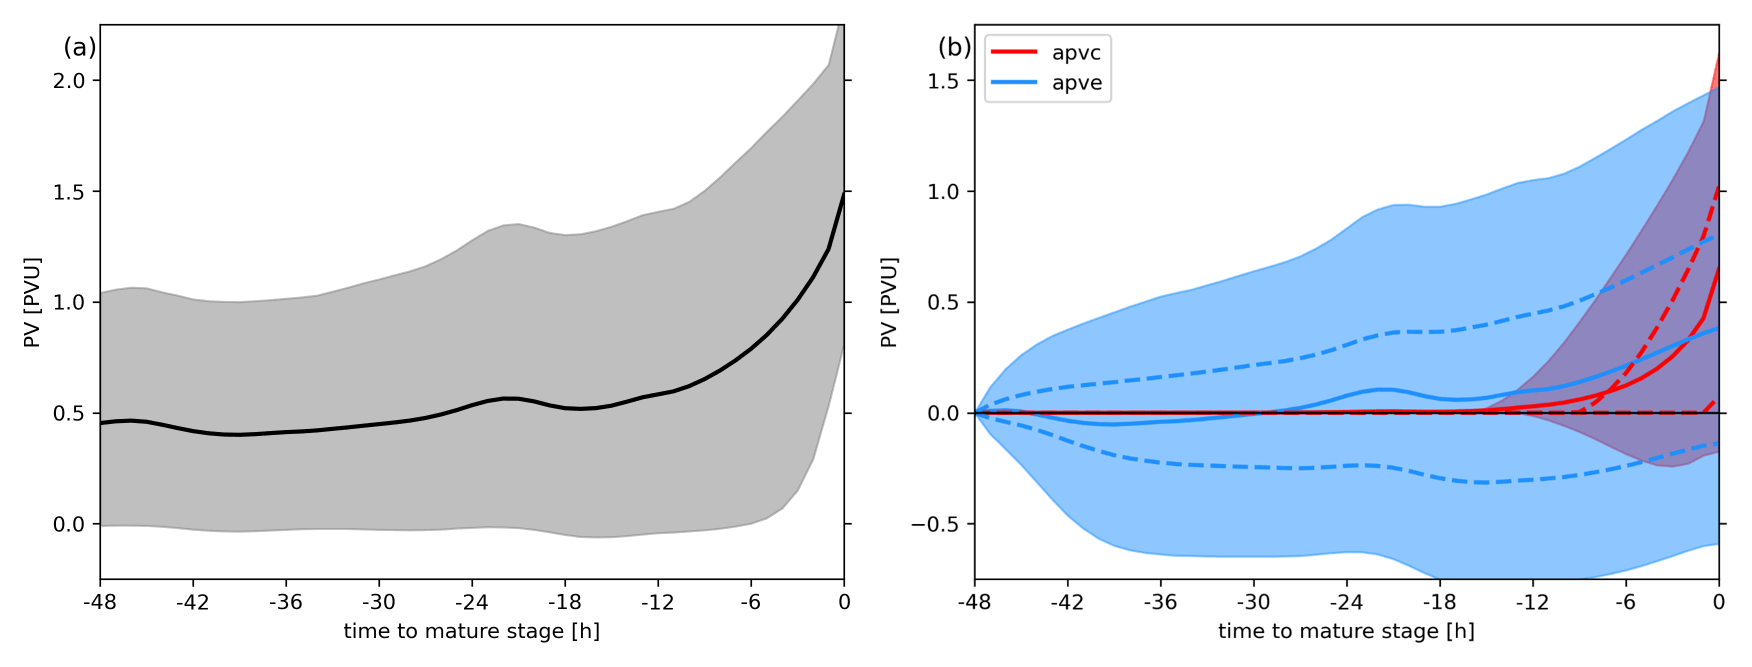
Figure 6Time evolution of PV along backward trajectories initialized from all considered ERA5 cyclones: (a) average PV (black line) and the 10th and 90th percentiles (grey shading); (b) cyclonic (red) and environmental (blue) PV modification (solid lines show the mean, dashed lines the 25th and 75th, and the shading the 10th and 90th percentiles.
The environmental PV contribution of 0.38 PVU consists of almost equal contributions from non-orographic (apveNO=0.2 PVU) and orographic environmental PV modifications (apveO=0.18 PVU). However, apveO results from fewer trajectories with stronger PV modifications (not shown). We reconsider the splitting of environmental PV in more detail for so-called orographic cyclones in Sect. 5.
Next, we calculate for each cyclone the percentage of PVM that is produced inside the cyclone (apvc(0 h)/PVM) and in the environment (apve(0 h)/PVM), as well as how much is due to PVS (PVS/PVM). On average, the contributions from the cyclone and PVS are the largest with 40 % and 37 %, respectively, whereas the environment provides a contribution of 23 % to PVM. Throughout the year these percentages remain fairly constant (not shown). These findings suggest that the lower-tropospheric PV is mainly produced by processes in the vicinity of the cyclone center; however, contributions from environmental PV are non-negligible and can even dominate for individual cyclones.
From a climatological perspective, PVM includes the seasonal background value of PV. To quantify the strength of the lower-tropospheric PV anomaly (PV*), we thus subtract the climatological PV (PVc) from PVM and PVS, i.e., and . Table 2 lists the climatological PV values for each month and the entire year. These values correspond to the average PV in ERA5 during 1979–2020 and between 975–700 hPa over ocean grid points within the region we regard as the Mediterranean (Fig. 1). The values show only a weak seasonal cycle with a minor peak in summer (July, August).
Table 2Climatological PV values in the lower troposphere (975–700 hPa) over the Mediterranean Sea, calculated from ERA5 from 1979–2020, excluding cyclone masks; see text for details.

Focusing now on the PV anomaly (PV*), PVS and cyclonic and environmental PV contribute 12 %, 56 %, and 32 %, respectively. Considering these values for individual cyclones, we find that in 1758 cyclones cyclonic PV accounts for at least 50 % of PV*, in 1100 cyclones environmental PV produces at least 50 % of PV*, and 200 cyclones have an anomalously high PVS* that accounts for more than 50 % of PV*. It is important to note that a cyclone can, for example, have at the same time 50 % of PV* produced inside the cyclone and 50 % of PV* produced in the environment if PVS* is negative, i.e., initial PV values are smaller than the climatological ones. In the next section we systematically identify regions where large PV changes occur that eventually end up in the center of Mediterranean cyclones and further quantify the role of the mountains in environmental PV production.
5.1 Climatological analysis
The previous section showed that most of the PV changes occur inside the cyclone, but yet a significant amount of PV is produced in the environment and particularly in interactions with orography. Here, we use the trajectory data from all cyclones in ERA5 to identify distinct regions in the Mediterranean that systematically modify PV in Mediterranean cyclones. Therefore, Fig. 7 shows the absolute frequency of large PV changes greater than or equal to 0.15 PVU h−1 (positive changes in Fig. 7a,b; negative changes in Fig. 7c, d) within the cyclone (Fig. 7a, c) and in the environment (Fig. 7b, d). The figure indicates that large PV changes (positive and negative) are less frequent in cyclones than in the environment. However, especially over the Mediterranean Sea, large PV production predominantly occurs within the cyclones (Fig. 7a). Furthermore, positive PV modifications inside the cyclone are significantly more frequent than negative ones (Fig. 7a, c). Thus, they account for an overall strong PV gain inside the cyclone, as shown in Fig. 6b. In contrast, for trajectories in the environment there are only a few areas over land where PV is significantly more frequently produced than destroyed. Hence, in the environment, PV is almost evenly frequently produced and destroyed. However, in absolute values, PV production is slightly higher, and thus, the averaged apve(t) shows a modest increase with time (Fig. 6b). It is important to note that near the Atlas Mountains large PV changes in the cyclone are relatively as frequent as over the western Alps; i.e., when air parcels pass over the western Alps or the Atlas Mountains they are evenly likely to gain ≥0.15 PVU (not shown). However, there are fewer cyclones over Morocco and Algeria, and thus, the absolute PV production frequencies are relatively low (Fig. 7a).
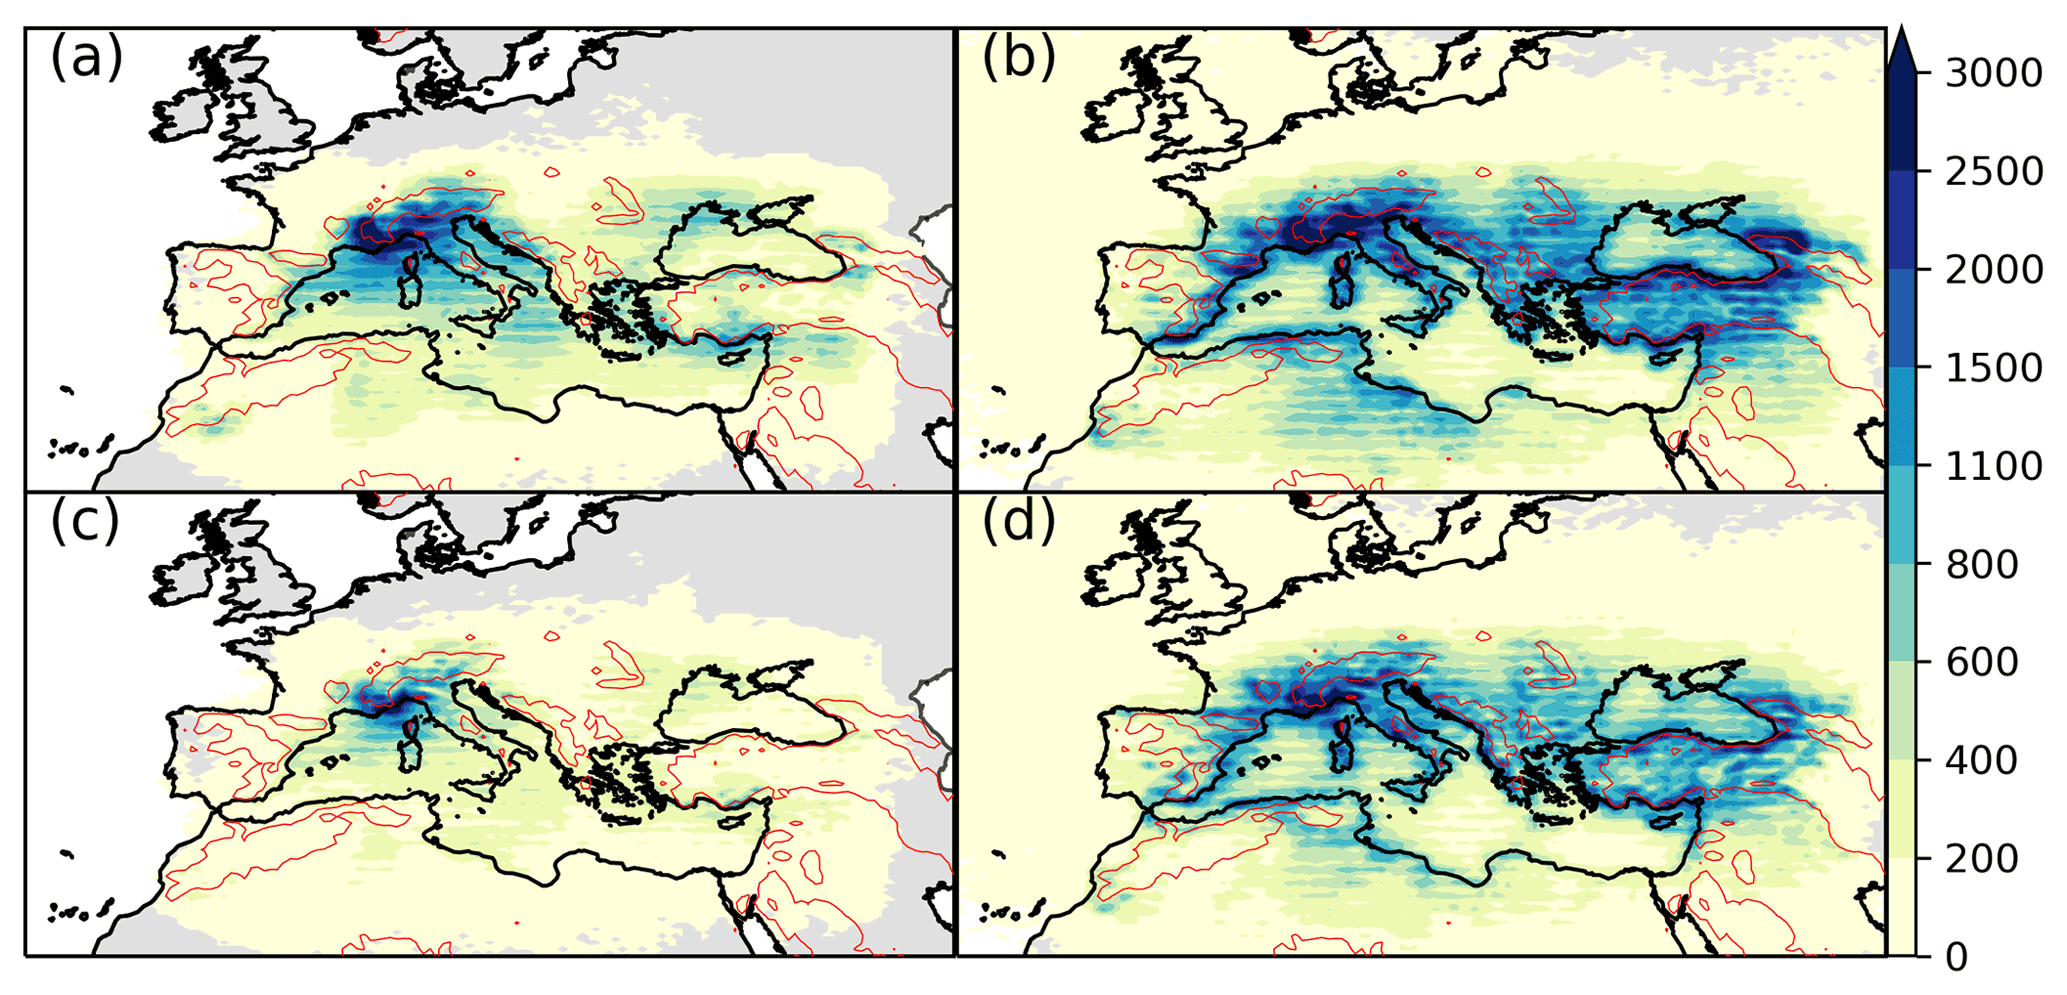
Figure 7Absolute frequencies of hourly PV modifications ≥0.15 PVU h−1 within the cyclone (a) and in the environment (b) and of hourly PV modifications PVU h−1 within the cyclone (c) and in the environment (d). The red contour shows orography above 800 m.
As large PV changes are frequent in the vicinity of the mountains, we quantify the contribution of orographic environmental PV (Sect. 3.1) to the lower-tropospheric PV anomaly. To specify the role of the mountains, we thus focus on all “strongly orographic” cyclones, defined as cyclones dominated by environmental PV for which the orographic contribution provides at least 25 % of the PV anomaly. This definition yields 580 (19.5 %) strongly orographic cyclones, i.e., about one-fifth of all investigated cyclones. Figure 8 shows that the mature stage of these cyclones occurs mostly close to the Alps in the Gulf of Genoa, the central Alps, the Atlas Mountains, the Pyrenees, the northern Adriatic Sea, and the eastern region of the Black Sea (blue contours in Fig. 8). In the Gulf of Genoa, PV banners from the western Alps and the mistral wind might provide high PV to intensifying cyclones, whereas in the eastern Black Sea the cyclones are surrounded by the Caucasus and Taurus mountains. The location of most of the strongly orographic cyclones close to the mountains suggests that it is rather unlikely that mountains also strongly impact lower-tropospheric PV in cyclones that reach their mature stage over the central Mediterranean Sea. To provide deeper insights into the dynamics of strongly orographic cyclones, the next section provides two case studies.
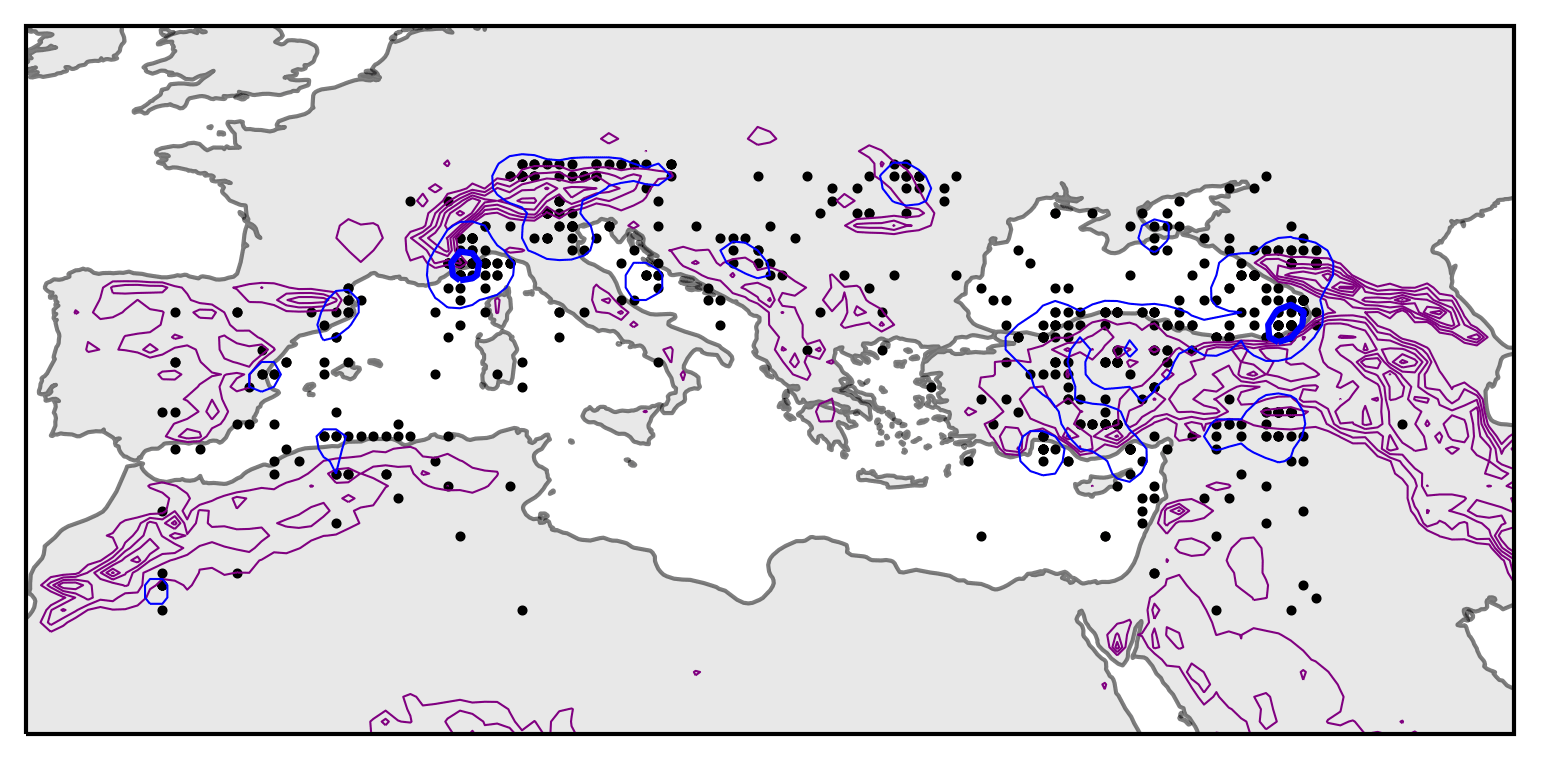
Figure 8Location of the mature stage of so-called orographic cyclones (black dots). Contours mark the hotspots with one and five cyclones (averaged in a 1.5∘ × 1.5∘ box around the grid points). Purple contours show orography higher than 800 m with 400 m intervals.
5.2 Two case studies of cyclones with large orographic PV contributions
We consider a cyclone that formed near Marseilles at 13:00 UTC on 12 December 1988, with a central SLP of 1013.4 hPa, which moved south (black line in Fig. 9a) to the Mediterranean Sea, where it reached its mature stage at 04:00 UTC on 13 December 1988 with a minimum SLP of 1008.7 hPa. It gained most of its lower-tropospheric PV due to interactions with orography. Figure 9a shows the backward trajectories from the cyclone center in the mature stage, colored according to hourly PV changes. There is one major airstream moving from western Europe along the western Alps into the cyclone center. While trajectories pass through the Rhone valley and the western edge of the Alps, PV increases can be as large as 0.6 PVU h−1 (red segments in Fig. 9a). Figure 9b shows the decomposition of the total time evolution of the average PV (grey) and the accumulated PV modification (red). PV on average doubles within 48 h reaching a PVM of 1.25 PVU with an initial PVS of approximately 0.6 PVU. Figure 9b shows the decomposition of the total accumulated PV (apv) into its cyclonic (solid black line), non-orographic environmental (dotted black line), and orographic environmental (dotted grey line) components. Orographic environmental PV production dominates from to h. After cyclogenesis (vertical grey line), PV remains fairly constant. Therefore, the PV increase of 0.65 PVU almost entirely originates from the orographic environmental PV changes (75 % of PV*), whereas the remaining 25 % of the anomaly is provided by an anomalously high PVS. For this cyclone the environmental PV provides 0.65 PVU, which results from +0.75 PVU apveO, which was mainly produced near the Alps, and a small negative signal of about −0.125 PVU apveNO.
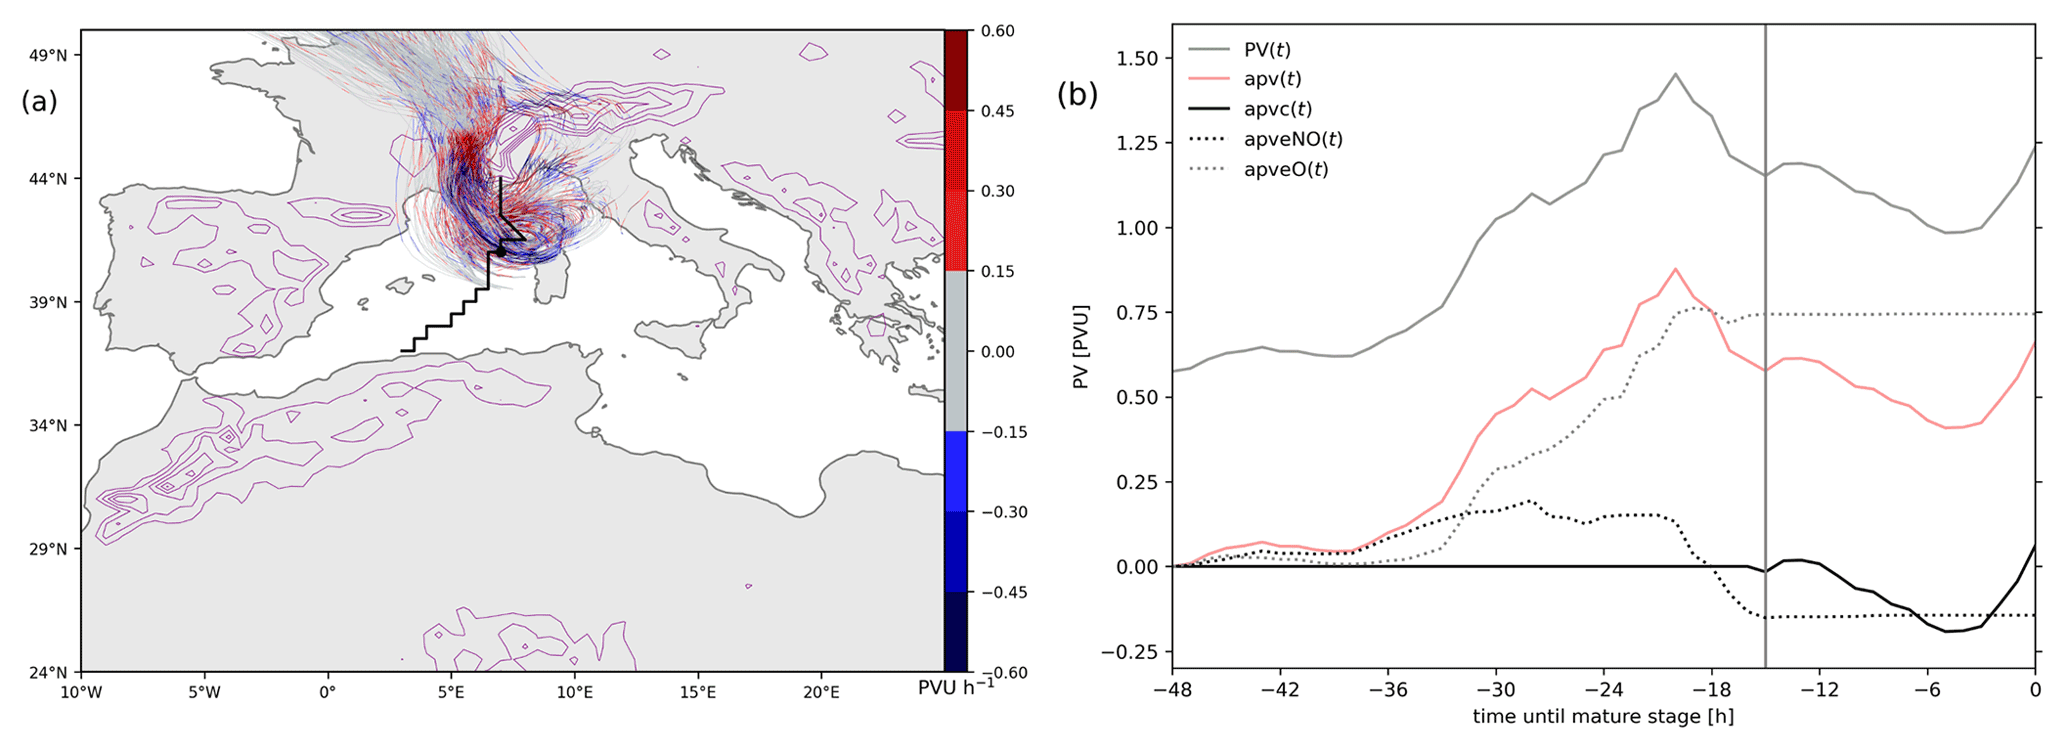
Figure 9Same as Fig. 5 but for a cyclone with its mature stage at 04:00 UTC on 13 December 1988. Orographic environmental PV modification is shown by the dotted grey line.
In our second example, a cyclone formed in the northern Aegean Sea at 00:00 UTC on 31 January 1988 and then crossed northwestern Turkey to enter the Black Sea (Fig. 10a). At 14:00 UTC on 31 January 1988, the cyclone reached its mature stage with a central SLP of 980.9 hPa (black dot in Fig. 10a). Three major airstreams were related to the cyclone: one from North Africa, one from the Mediterranean Sea, and one from the eastern parts of the Black Sea. All of them had strong PV increases when they crossed the underlying orography (Fig. 10a). Figure 10b shows the time evolution of average PV (grey) and of accumulated PV (red). PV on average quintuples within 48 h reaching a PVM of 1.5 PVU with an initial PVS of 0.3 PVU. The overall increase in PV originates from environmental PV modifications (dotted lines in Fig. 10), whereas the diabatic processes inside the cyclone destroy PV (solid black line in Fig. 10). For this cyclone the environmental PV modification produced almost the entire PV anomaly (+1.25 PVU; sum of dotted lines), of which the majority (60 %) was produced by interactions with the mountains in all three airstreams, as indicated by the strong contribution of apveO of 0.75 PVU (dotted grey line in Fig. 10).
These two case studies provide new insights into the role of PV production near orography in cyclone intensification. In the following section we analyze cyclone dynamics using IFS simulations, and thus, we provide more insights into the underlying diabatic processes leading to cyclonic and environmental PV in the IFS.
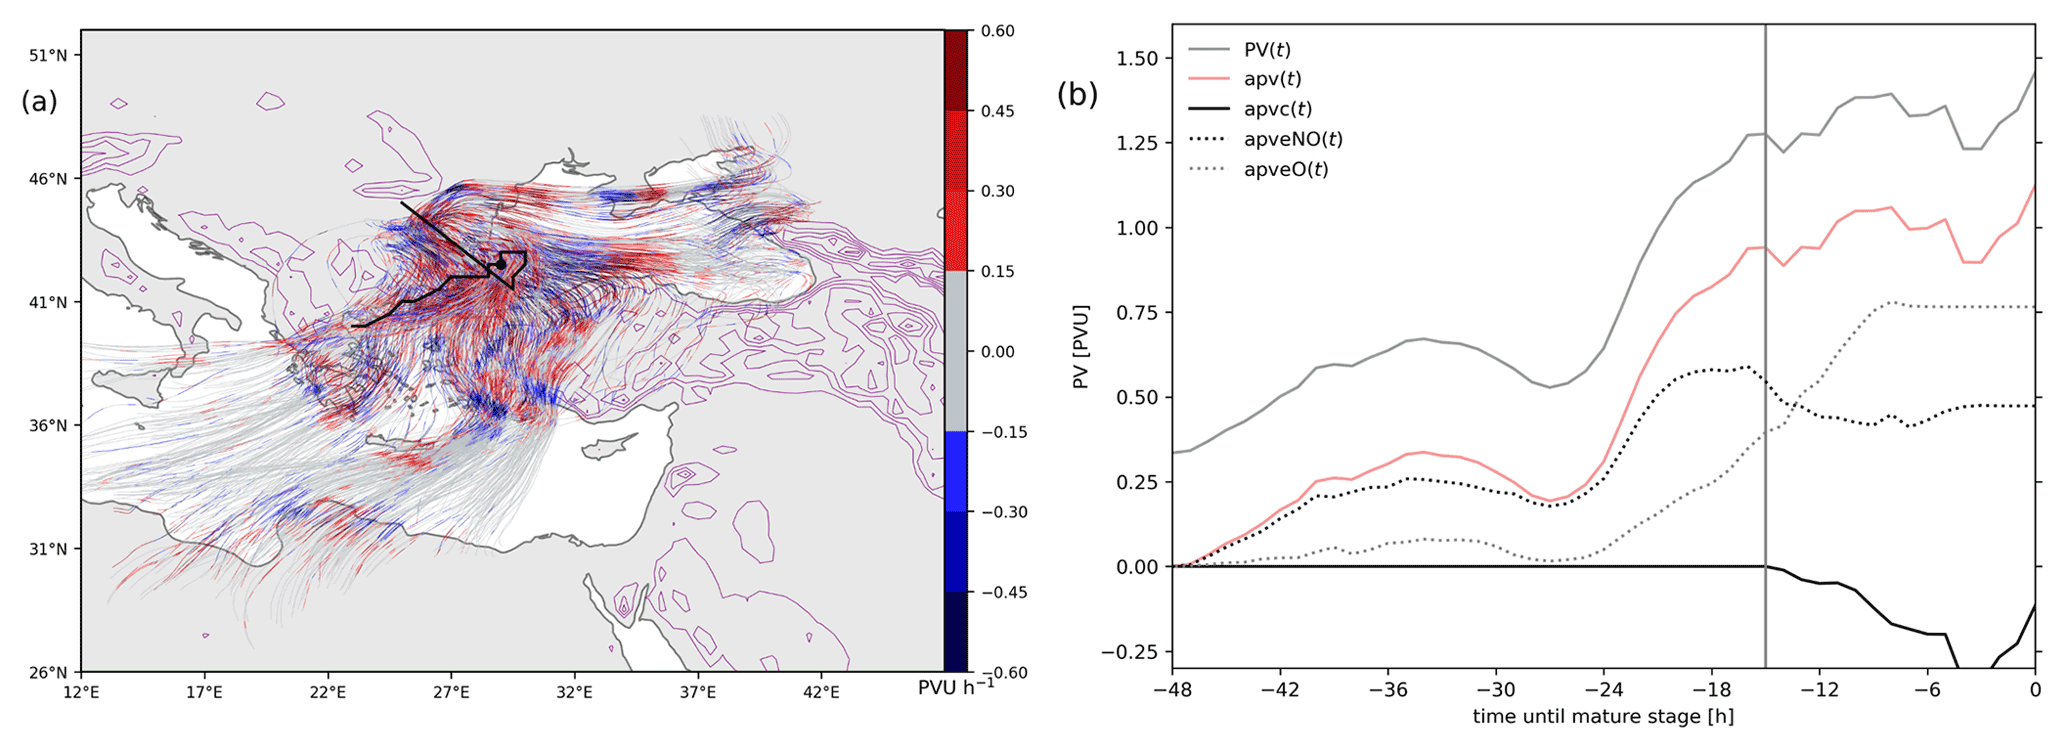
Figure 10Same as Fig. 9 but for a cyclone that had its mature stage at 14:00 UTC on 31 January 1988.
Considering the 55 cyclones in the IFS simulations, we find comparable values of the average PV gain and the relative time interval of major PV production to ERA5 cyclones. Furthermore, the average accumulated cyclonic and environmental PV modifications are approximately the same as in ERA5, and hence, although the set of cyclones in the IFS simulations is much smaller, it represents a realistic sample of Mediterranean cyclones.
6.1 The contribution of diabatic processes to the lower-tropospheric PV
We present two contrasting cases of cyclones in the IFS simulations. Cyclone 1 (C1) had cyclogenesis over the central Mediterranean and reached its mature stage at 02:00 UTC on 14 December 2017 near the south coast of Greece (black dot in Fig. 11a). It has three major trajectory groups: (i) starting over central Europe and bending around the Alps before passing over Italy, (ii) starting over north Africa, and (iii) starting over the Mediterranean Sea. On average, PV is mainly produced within the cyclone, and the cyclonic PV (solid black line in Fig. 11c) accounts for 90 % of the PV anomaly (PV*), whereas the environment predominantly destroys PV (dotted black line in Fig. 11c). Furthermore, Fig. 11c shows the accumulated cyclonic (solid colored lines) and environmental (dotted colored lines) PV modifications due to individual diabatic processes. The main driving process of cyclonic PV production is convection (APVCONVT; solid orange line in Fig. 11c), which produces 1.85 PVU. The strong cyclonic PV production by convection is reduced by 1.05 PVU due to radiative processes in the cyclone (APVRAD; solid dark blue line in Fig. 11c). The sum of all cyclonic PV modifications (solid colored lines) yields a total PV gain inside the cyclone of 1 PVU (APVC; solid black line in Fig. 11c). Radiative processes in the environment (dotted dark blue line in Fig. 11c) are the main source of environmental PV destruction. Overall, the three distinct airstreams of C1 have similar contributions of diabatic PV modification but enter C1 at different times.

Figure 11Hourly diabatic PV changes (colors) along trajectories initialized at the time of the cyclones's mature stage (black dot) at (a) 02:00 UTC on 14 December 2017 and (b) 03:00 UTC on 19 June 2018 in the IFS simulations. (c, d) Time evolution of accumulated total PV (black) and accumulated PV of different processes (see legend) for the cyclones shown in (a) and (b). APV is further split into cyclonic and environmental components, represented by solid and dotted lines, respectively.
In cyclone 2 (C2), the trajectories start over Egypt and in general in proximity to the mature stage of C2 at 03:00 UTC on 19 June 2018 (black dot in Fig. 11b). In contrast to C1, the lower-tropospheric PV in the cyclone center at the mature stage of C2 is mainly composed of environmental PV, which accounts for approximately 60 % of PV*. This can be explained by the short time between cyclogenesis (vertical grey line in Fig. 11d) and the mature stage.
In addition to the difference in cyclonic and environmental PV modifications, C2 also has two completely different main driving processes. Figure 11d shows that the large environmental PV changes (dotted black line) are entirely due to turbulence, i.e., turbulent momentum forcing (dotted light blue) and turbulent thermal forcing (dotted brown), with positive PV modifications of 1.8 and 1.7 PVU, respectively. Similar to C1, radiation destroys PV in the environment (dotted blue line in Fig. 11d), with a negative contribution of −2.75 PVU, resulting in a net PV change in the environment of APVE=0.85 PVU (dotted black line).
When analyzing all 55 IFS cyclones, we find a large variability in the contribution of diabatic processes to the lower-tropospheric PV anomaly. Figure 12a shows the distribution of apv (i.e., PV( h)−PV(t=0 h); Eq. 4), the total and process-related APVs (Eq. 3), and the residuals (RES) of the 55 cyclones in the IFS dataset. The integrated PV modification, APV (APVC in Fig. 12b and APVE in Fig. 12c), reproduces the diagnosed PV modification (apv), with some minor deviations in the form of mainly negative residuals (RES). Therefore, the hourly PV tendencies provide a good representation of the diabatic processes occurring. On average, the largest PV production is due to the convective temperature tendencies (CONVT), turbulent momentum tendencies (TURBM), and microphysics (MP). In contrast, PV destruction is mainly due to turbulent temperature tendencies (TURBT) and radiation (RAD). Nevertheless, the boxes and whiskers suggest that there is a large case-by-case variability. These distributions are comparable in sign and amplitude to the PV modifications in extratropical cyclones in the main storm track region recently analyzed by Attinger et al. (2021). Furthermore, the overall strong positive contribution by latent heat release by both convection and microphysics in the lower troposphere and the overall positive contribution by turbulent momentum forcing with some individual negative cases are in accordance with the findings of Flaounas et al. (2021).
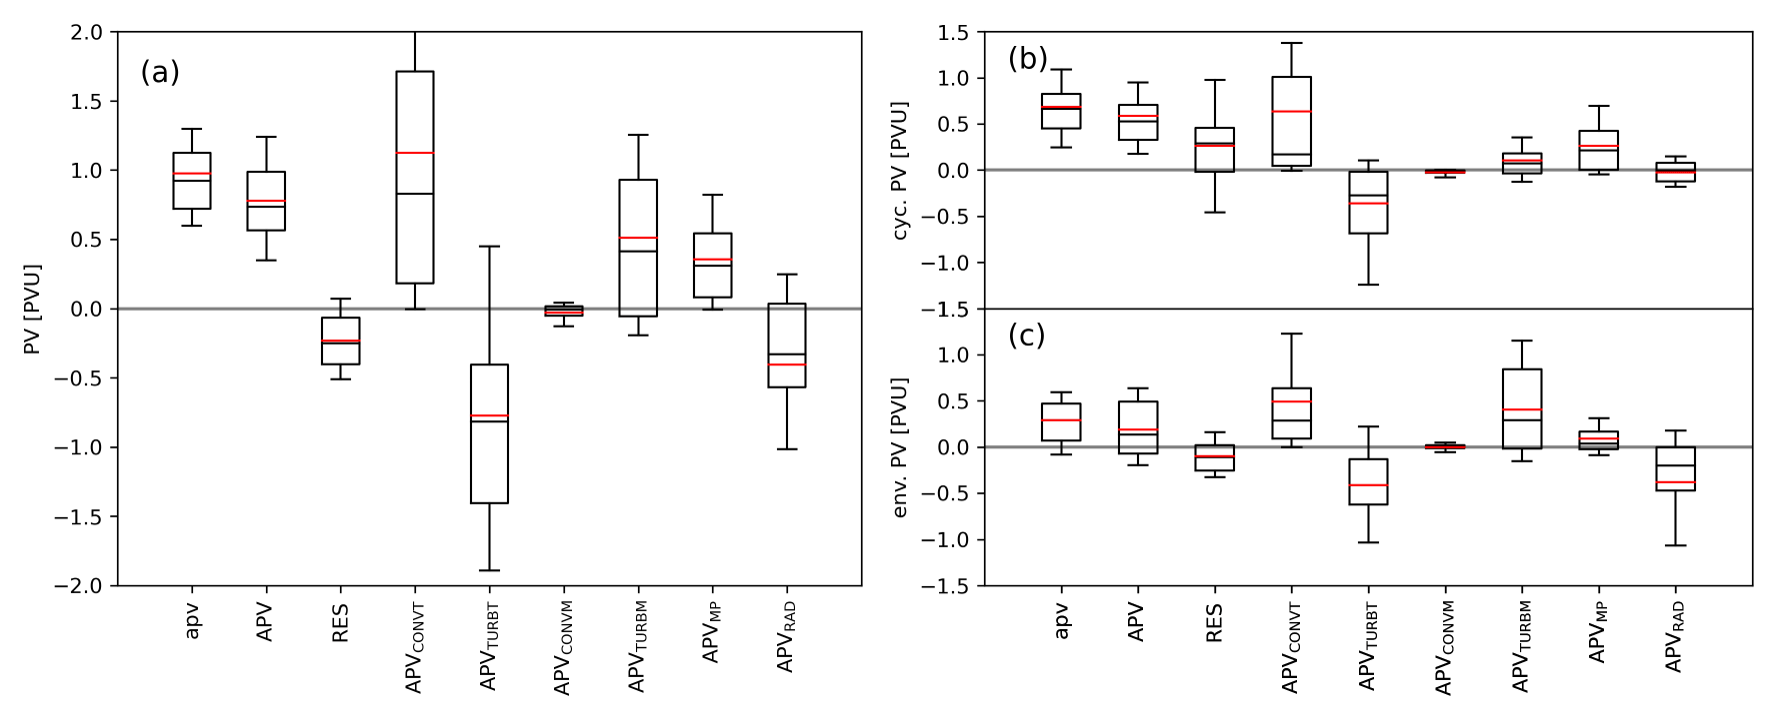
Figure 12(a) Distribution of apv, residual, and different APVs for the cyclones of the IFS simulations. (b, c) The distribution of (a) is split into its cyclonic (b) and environmental (c) parts. The boxes mark the 25th and 75th and the whiskers the 10th and 90th percentiles, and the black and red lines inside the boxes depict the median and the mean, respectively.
Decomposing the overall contributions to their cyclonic and environmental components (Fig. 12b, c) reveals that cyclonic PV (Fig. 12b) is mainly produced by convective temperature tendencies and microphysics, whereas the environmental PV (Fig. 12c) is produced by convective temperature and turbulent momentum tendencies.
Due to the limited duration of the IFS simulations, we cannot perform a climatological analysis like in Fig. 7. However, the IFS simulations offer additional information about the tendencies of physical parameterizations. Therefore, we use the IFS simulations as a complementary dataset to gain further insights into the areas that favor the non-conserved PV processes. Figure 13 shows the location of frequent large PV modifications (≥ 0.15 or PVU h−1) due to different diabatic processes. Large PV modification due to latent heat release by convection and microphysics parameterization (Fig. 13a, b) predominantly occurs in the Tyrrhenian, Adriatic, Ionian, and Aegean seas, as well as in the Black Sea, which are mainly positive changes. In addition, the microphysics parameterization led to large PV production to the east of the Alps and over the Tatra Mountains in Slovakia (Fig. 13b). Additionally, at the latter location and near the mountains over Tunisia and Libya, turbulence results in large PV changes (Fig. 13c, d). For turbulent processes, the regions of frequent PV production and destruction tend to overlap, indicating that whether PV is produced or destroyed highly depends on the current local conditions. Systematic large hourly PV modifications by radiation are not frequent in our data of 55 IFS cyclones. However, over North Africa and the Caucasus Mountains long-wave heating systematically destroys PV (not shown).
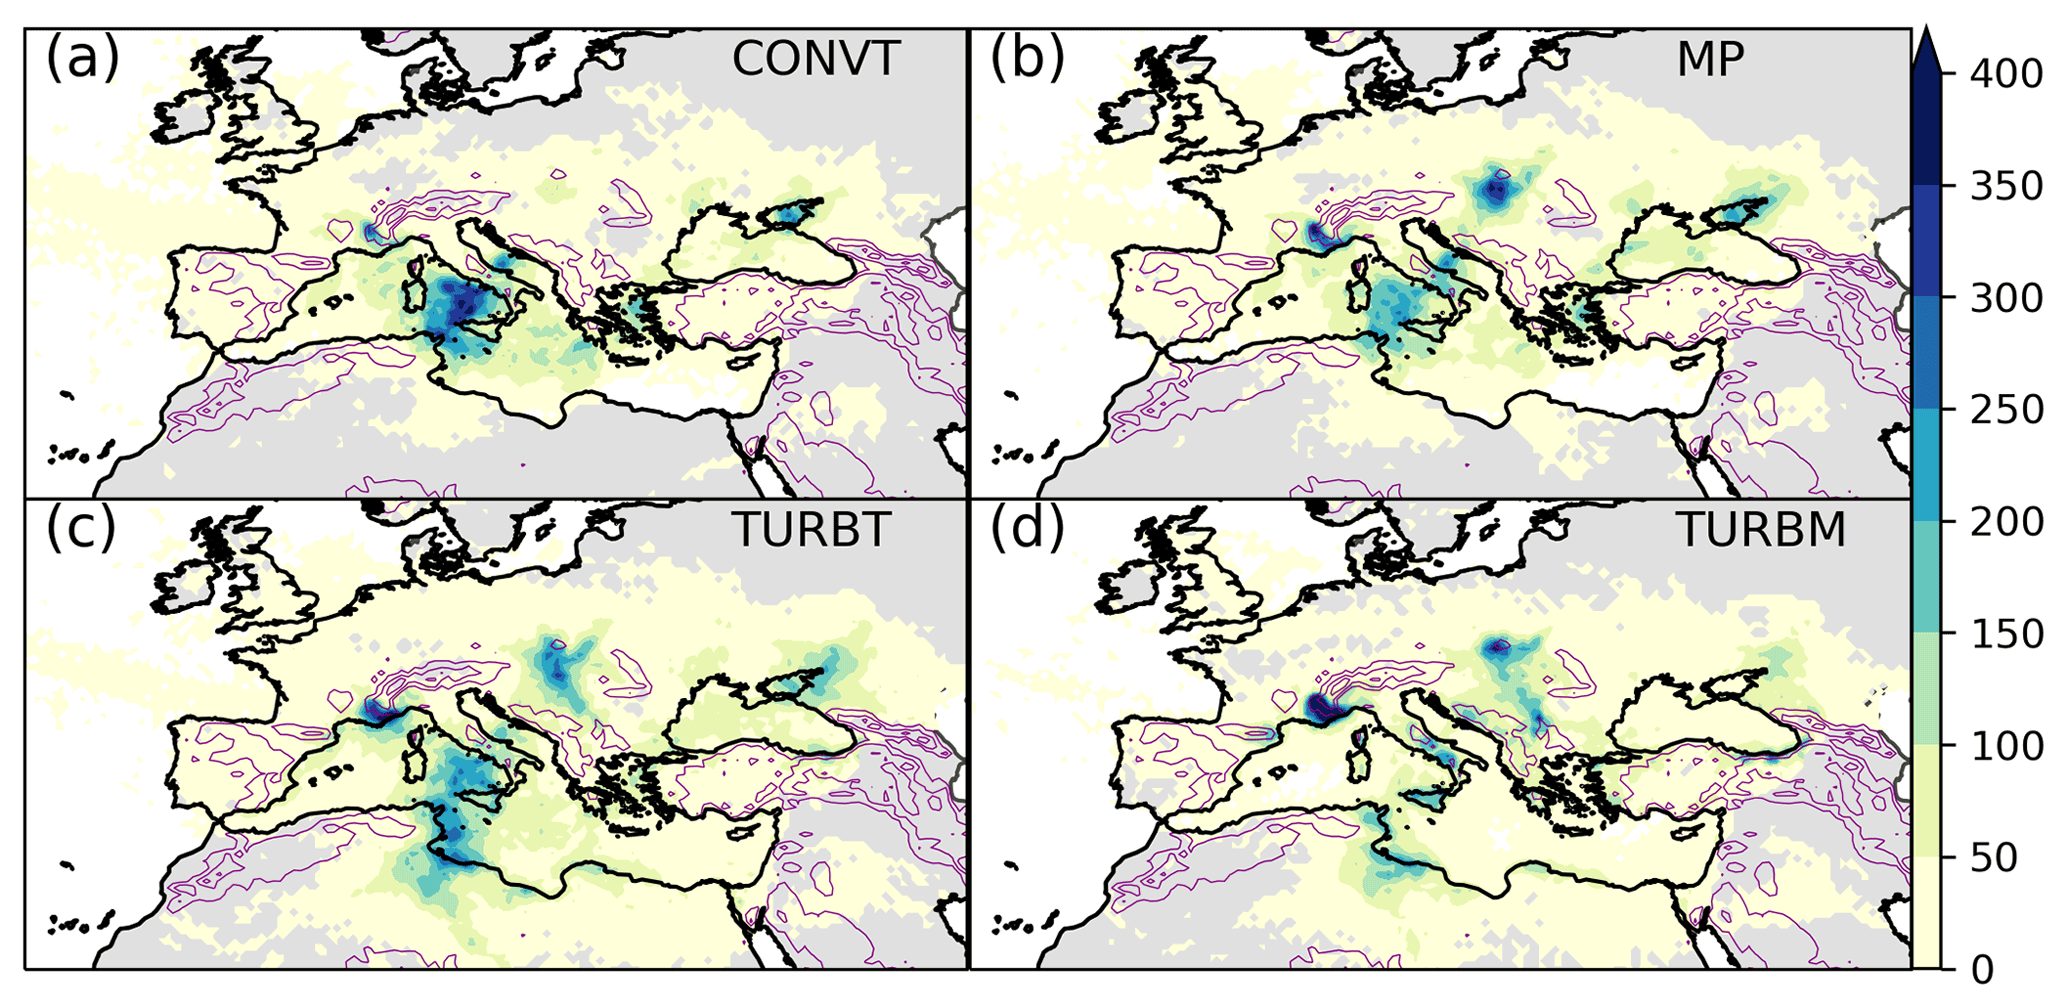
Figure 13Absolute frequency of hourly diabatic PV changes that are either ≥0.15 or PVU h−1 along trajectories of IFS Mediterranean cyclones. Purple contours show elevation starting at 800 m with 800 m intervals.
Based on the concept that cyclone dynamics can be understood as the interaction of PV anomalies in the upper and lower troposphere, this study investigated the formation of the lower-tropospheric PV anomalies in terms of processes, location, and time relative to the mature stage of the cyclones. Therefore, we initialized 48 h backward trajectories from the lower-tropospheric PV anomaly in the cyclone center of 2969 mature cyclones in ERA5 and traced PV along them. Combining the cyclone tracks and backward trajectories, we introduced a new method to quantify, for the first time, cyclonic and environmental PV modifications.
We found that the lower-tropospheric PV anomaly is mainly produced by diabatic processes close to the cyclone center within 12 h before the mature stage. For most cyclones (59.2 %) the majority of the PV anomaly is produced inside the cyclone, which stresses the importance of diabatic processes, e.g., latent heat release by condensation, as highlighted by previous studies (e.g., Davis et al., 1993; Rossa et al., 2000; Čampa and Wernli, 2012). Nevertheless, we found a significant number of cyclones (37.3 %) for which the environment produces more than 50 % of the PV anomaly in the cyclone center, stressing the importance of the processes in the environment for cyclone development. Finally, for 580 cyclones (19.5 %) the majority of the PV anomaly was traced back to environmental PV production near orography higher than 800 m. For these cyclones, we analyzed in detail two case studies where PV production took place almost entirely close to mountains. Our results suggest that the resolution of diabatic processes near mountains is crucial for correctly predicting the intensity of cyclones.
The PV modifications near mountains can be related to the so-called PV banners (Aebischer and Schär, 1998; Rotunno et al., 1999; Epifanio and Durran, 2002; Schär et al., 2003; Flamant et al., 2004). PV inside the PV-banners is produced by turbulence and diabatic processes within the boundary layer (Aebischer and Schär, 1998; Flamant et al., 2004) and can contribute to cyclogenesis close to the Alps. For one-fifth of the cyclones (580 out of 2969), we found that orographically produced PV contributed to the lower-tropospheric PV anomalies in the cyclone center by at least 25 %. It is interesting to note that many of these cyclones reached their mature stage shortly after cyclogenesis, which might indicate that these are rather weakly developing and/or short-lived systems.
Further analysis focused on the quantification of the contribution of individual diabatic processes to the PV production inside the cyclone and in the environment. For this reason, we analyzed 55 cyclones in 12 monthly IFS simulations. Our analysis shows that latent heat release by convection and microphysics produces most of the lower-tropospheric cyclonic PV, whereas turbulent momentum and convective temperature tendencies are the major sources of environmental PV. However, the contribution of each process shows a large case-by-case variability. Comparing with North Atlantic cyclones (Attinger et al., 2021), Mediterranean cyclones show a similar contribution of diabatic processes to their lower-tropospheric PV anomaly. From the perspective of atmospheric processes, this suggests that Mediterranean cyclones do not form a unique category of extratropical cyclones except for cases forming close to mountains.
There are some limitations concerning our study. First, our Lagrangian method of defining cyclonic and environmental PV heavily relies on the tracking of the cyclone. In the case of rapidly developing systems, for which cyclogenesis might not be resolved accurately, our assignment might be biased, attributing a larger amount of PV modifications to the environment rather than to the cyclone. Second, our cyclone sample in the IFS simulations is relatively small, and thus, the results have to be evaluated with caution. In addition, the hourly output of the IFS simulations might not be fully adequate for all cyclones, as diabatic processes, in particular turbulence, can have a very high temporal fluctuation and thus might not be captured accurately in the hourly outputs. Still though, our study provides for the first time insights into favorable locations of sources and sinks of PV due to diabatic processes, and future studies will address this question with a larger sample of cyclones.
The IFS simulations performed for this study can be provided by the authors upon request.
AS prepared all analyses and the manuscript. EF and HW provided scientific advice throughout the project and provided valuable suggestions for improving the manuscript.
At least one of the (co-)authors is a member of the editorial board of Weather and Climate Dynamics. The peer-review process was guided by an independent editor, and the authors also have no other competing interests to declare.
Publisher’s note: Copernicus Publications remains neutral with regard to jurisdictional claims in published maps and institutional affiliations.
We thank both reviewers for their constructive feedback, which helped to further improve the manuscript. Furthermore, we thank Roman Attinger for help with the IFS data. This work is a contribution to the COST Action CA19109 “MedCyclones: European Network for Mediterranean Cyclones in weather and climate”.
This research has been supported by the Schweizerischer Nationalfonds zur Förderung der Wissenschaftlichen Forschung (grant no. 188660).
This paper was edited by Juliane Schwendike and reviewed by two anonymous referees.
Aebischer, U. and Schär, C.: Low-level potential vorticity and cyclogenesis to the lee of the Alps, J. Atmos. Sci., 55, 186–207, https://doi.org/10.1175/1520-0469(1998)055<0186:LLPVAC>2.0.CO;2, 1998. a, b, c
Appenzeller, C. and Davies, H. C.: Structure of stratospheric intrusions into the troposphere, Nature, 358, 570–572, https://doi.org/10.1038/358570a0, 1992. a
Aragão, L. and Porcù, F.: Cyclonic activity in the Mediterranean region from a high-resolution perspective using ECMWF ERA5 dataset, Clim. Dynam., 58, 1293–1310, https://doi.org/10.1007/s00382-021-05963-x, 2022. a, b
Attinger, R.: Quantifying the diabatic modification of potential vorticity in extratropical cyclones, PhD thesis, ETH Zurich, https://doi.org/10.3929/ethz-b-000432253, 2020. a
Attinger, R., Spreitzer, E., Boettcher, M., Forbes, R., Wernli, H., and Joos, H.: Quantifying the role of individual diabatic processes for the formation of PV anomalies in a North Pacific cyclone, Q. J. Roy. Meteor. Soc., 145, 2454–2476, https://doi.org/10.1002/qj.3573, 2019. a, b, c, d
Attinger, R., Spreitzer, E., Boettcher, M., Wernli, H., and Joos, H.: Systematic assessment of the diabatic processes that modify low-level potential vorticity in extratropical cyclones, Weather Clim. Dynam., 2, 1073–1091, https://doi.org/10.5194/wcd-2-1073-2021, 2021. a, b, c, d, e
Buzzi, A. and Tibaldi, S.: Cyclogenesis in the lee of the Alps: A case study, Q. J. Roy. Meteor. Soc., 104, 271–287, https://doi.org/10.1002/qj.49710444004, 1978. a
Buzzi, A., Davolio, S., and Fantini, M.: Cyclogenesis in the lee of the Alps: a review of theories, Bull. Atmos. Sci. Technol., 1, 433–457, https://doi.org/10.1007/s42865-020-00021-6, 2020. a
Čampa, J. and Wernli, H.: A PV perspective on the vertical structure of mature midlatitude cyclones in the Northern Hemisphere, J. Atmos. Sci., 69, 725–740, https://doi.org/10.1175/JAS-D-11-050.1, 2012. a, b, c, d
Campins, J., Genovés, A., Jansa, A., Guijarro, J. A., and Ramis, C.: A catalogue and a classification of surface cyclones for the western Mediterranean, Int. J. Climatol., 20, 969–984, https://doi.org/10.1002/1097-0088(200007)20:9<969::AID-JOC519>3.0.CO;2-4, 2000. a
Campins, J., Genovés, A., Picornell, M., and Jansà, A.: Climatology of Mediterranean cyclones using the ERA-40 dataset, Int. J. Climatol., 31, 1596–1614, https://doi.org/10.1002/joc.2183, 2011. a, b
Chaboureau, J.-P., Pantillon, F., Lambert, D., Richard, E., and Claud, C.: Tropical transition of a Mediterranean storm by jet crossing, Q. J. Roy. Meterol. Soc., 138, 596–611, https://doi.org/10.1002/qj.960, 2012. a
Crezee, B., Joos, H., and Wernli, H.: The microphysical building blocks of low-level potential vorticity anomalies in an idealized extratropical cyclone, J. Atmos. Sci., 74, 1403–1416, https://doi.org/10.1175/JAS-D-16-0260.1, 2017. a
Davis, C. A.: A potential-vorticity diagnosis of the importance of initial structure and condensational heating in observed extratropical cyclogenesis, Mon. Weather Rev., 120, 2409–2428, https://doi.org/10.1175/1520-0493(1992)120<2409:APVDOT>2.0.CO;2, 1992. a
Davis, C. A., Stoelinga, M. T., and Kuo, Y.-H.: The integrated effect of condensation in numerical simulations of extratropical cyclogenesis, Mon. Weather Rev., 121, 2309–2330, https://doi.org/10.1175/1520-0493(1993)121<2309:TIEOCI>2.0.CO;2, 1993. a, b
Emanuel, K.: Genesis and maintenance of “Mediterranean hurricanes”, Adv. Geosci., 2, 217–220, https://doi.org/10.5194/adgeo-2-217-2005, 2005. a
Epifanio, C. and Durran, D.: Lee-vortex formation in free-slip stratified flow over ridges. Part II: Mechanisms of vorticity and PV production in nonlinear viscous wakes, J. Atmos. Sci., 59, 1166–1181, https://doi.org/10.1175/1520-0469(2002)059<1166:LVFIFS>2.0.CO;2, 2002. a, b
Ertel, H.: Ein neuer hydrodynamischer Wirbelsatz, Metorol. Z., 59, 277–281, 1942. a, b, c
Fita, Ll., Romero, R., and Ramis, C.: Intercomparison of intense cyclogenesis events over the Mediterranean basin based on baroclinic and diabatic influences, Adv. Geosci., 7, 333–342, https://doi.org/10.5194/adgeo-7-333-2006, 2006. a
Flamant, C., Richard, E., Schär, C., Rotunno, R., Nance, L., Sprenger, M., and Benoit, R.: The wake south of the Alps: Dynamics and structure of the lee-side flow and secondary potential vorticity banners, Q. J. Roy. Meteor. Soc., 130, 1275–1303, https://doi.org/10.1256/qj.03.17, 2004. a, b, c
Flaounas, E., Raveh-Rubin, S., Wernli, H., Drobinski, P., and Bastin, S.: The dynamical structure of intense Mediterranean cyclones, Clim. Dynam., 44, 2411–2427, https://doi.org/10.1007/s00382-014-2330-2, 2015. a, b
Flaounas, E., Kotroni, V., Lagouvardos, K., Gray, S. L., Rysman, J.-F., and Claud, C.: Heavy rainfall in Mediterranean cyclones. Part I: contribution of deep convection and warm conveyor belt, Clim. Dynam., 50, 2935–2949, https://doi.org/10.1007/s00382-017-3783-x, 2018. a
Flaounas, E., Gray, S. L., and Teubler, F.: A process-based anatomy of Mediterranean cyclones: from baroclinic lows to tropical-like systems, Weather Clim. Dynam., 2, 255–279, https://doi.org/10.5194/wcd-2-255-2021, 2021. a, b, c, d, e
Flaounas, E., Davolio, S., Raveh-Rubin, S., Pantillon, F., Miglietta, M. M., Gaertner, M. A., Hatzaki, M., Homar, V., Khodayar, S., Korres, G., Kotroni, V., Kushta, J., Reale, M., and Ricard, D.: Mediterranean cyclones: current knowledge and open questions on dynamics, prediction, climatology and impacts, Weather Clim. Dynam., 3, 173–208, https://doi.org/10.5194/wcd-3-173-2022, 2022. a, b
Galanaki, E., Flaounas, E., Kotroni, V., Lagouvardos, K., and Argiriou, A.: Lightning activity in the Mediterranean: quantification of cyclones contribution and relation to their intensity, Atmos. Sci. Lett., 17, 510–516, https://doi.org/10.1002/asl.685, 2016. a
Hersbach, H., Bell, B., Berrisford, P., Hirahara, S., Horányi, A., Muñoz-Sabater, J., Nicolas, J., Peubey, C., Radu, R., Schepers, D., Simmons, A., Soci, C., Abdalla, S., Abellan, X., Balsamo, G., Bechtold, P., Biavati, G., Bidlot, J., Bonavita, M., De Chiara, G., Dahlgren, P., Dee, D., Diamantakis, M., Dragani, R., Flemming, J., Forbes, R., Fuentes, M., Geer, A., Haimberger, L., Healy, S., Hogan, R. J., Hólm, E., Janisková, M., Keeley, S., Laloyaux, P., Lopez, P., Lupu, C., Radnoti, G., de Rosnay, P., Rozum, I., Vamborg, F., Villaume, S., and Thépaut, J.-N.: The ERA5 global reanalysis, Q. J. Roy. Meteor. Soc., 146, 1999–2049, https://doi.org/10.1002/qj.3803, 2020. a
Horvath, K., Fita, L., Romero, R., and Ivancan-Picek, B.: A numerical study of the first phase of a deep Mediterranean cyclone: Cyclogenesis in the lee of the Atlas Mountains, Meteor. Z., 15, 133–146, https://doi.org/10.1127/0941-2948/2006/0113, 2006. a
Hoskins, B. J., McIntyre, M. E., and Robertson, A. W.: On the use and significance of isentropic potential vorticity maps, Q. J. Roy. Meteor. Soc., 111, 877–946, https://doi.org/10.1002/qj.49711147002, 1985. a
Joos, H. and Wernli, H.: Influence of microphysical processes on the potential vorticity development in a warm conveyor belt: a case-study with the limited-area model COSMO, Q. J. Roy. Meteor. Soc., 138, 407–418, https://doi.org/10.1002/qj.934, 2012. a
Massacand, A. C., Wernli, H., and Davies, H. C.: Heavy precipitation on the Alpine southside: An upper-level precursor, Geophys. Res. Lett., 25, 1435–1438, https://doi.org/10.1029/98GL50869, 1998. a
McTaggart-Cowan, R., Galarneau Jr, T. J., Bosart, L. F., and Milbrandt, J. A.: Development and tropical transition of an Alpine lee cyclone. Part I: Case analysis and evaluation of numerical guidance, Mon. Weather Rev., 138, 2281–2307, https://doi.org/10.1175/2009MWR3147.1, 2010. a
Miglietta, M., Cerrai, D., Laviola, S., Cattani, E., and Levizzani, V.: Potential vorticity patterns in Mediterranean “hurricanes”, Geophys. Res. Lett., 44, 2537–2545, https://doi.org/10.1002/2017GL072670, 2017. a
Neu, U., Akperov, M. G., Bellenbaum, N., Benestad, R., Blender, R., Caballero, R., Cocozza, A., Dacre, H. F., Feng, Y., Fraedrich, K., Grieger, J., Gulev, S., Hanley, J., Hewson, T., Inatsu, M., Keay, K., Kew, S. F., Kindem, I., Leckebusch, G. C., Liberato, M. L. R., Lionello, P., Mokhov, I. I., Pinto, J. G., Raible, C. C., Reale, M., Rudeva, I., Schuster, M., Simmonds, I., Sinclair, M., Sprenger, M., Tilinina, N. D., Trigo, I. F., Ulbrich, S., Ulbrich, U., Wang, X. L., and Wernli, H.: IMILAST: A community effort to intercompare extratropical cyclone detection and tracking algorithms, B. Am. Meteorol. Soc., 94, 529–547, https://doi.org/10.1175/BAMS-D-11-00154.1, 2013. a
Portmann, R., González-Alemán, J. J., Sprenger, M., and Wernli, H.: How an uncertain short-wave perturbation on the North Atlantic wave guide affects the forecast of an intense Mediterranean cyclone (Medicane Zorbas), Weather Clim. Dynam., 1, 597–615, https://doi.org/10.5194/wcd-1-597-2020, 2020. a
Raveh-Rubin, S. and Flaounas, E.: A dynamical link between deep Atlantic extratropical cyclones and intense Mediterranean cyclones, Atmos. Sci. Lett., 18, 215–221, https://doi.org/10.1002/asl.745, 2017. a, b
Roberts, C. D., Senan, R., Molteni, F., Boussetta, S., Mayer, M., and Keeley, S. P. E.: Climate model configurations of the ECMWF Integrated Forecasting System (ECMWF-IFS cycle 43r1) for HighResMIP, Geosci. Model Dev., 11, 3681–3712, https://doi.org/10.5194/gmd-11-3681-2018, 2018. a
Rossa, A., Wernli, H., and Davies, H.: Growth and decay of an extra-tropical cyclone’s PV-tower, Meteorol. Atmos. Phys., 73, 139–156, https://doi.org/10.1007/s007030050070, 2000. a, b, c
Rossby, C.-G.: Relation between variations in the intensity of the zonal circulation of the atmosphere and the displacements of the semi-permanent centers of action, J. Mar. Res., 2, 38–55, 1939. a
Rotunno, R., Grubišić, V., and Smolarkiewicz, P.: Vorticity and potential vorticity in mountain wakes, J. Atmos. Sci., 56, 2796–2810, https://doi.org/10.1175/1520-0469(1999)056<2796:VAPVIM>2.0.CO;2, 1999. a, b
Schär, C., Sprenger, M., Lüthi, D., Jiang, Q., Smith, R. B., and Benoit, R.: Structure and dynamics of an Alpine potential-vorticity banner, Q. J. Roy. Meteor. Soc., 129, 825–855, https://doi.org/10.1256/qj.02.47, 2003. a, b
Spreitzer, E., Attinger, R., Boettcher, M., Forbes, R., Wernli, H., and Joos, H.: Modification of potential vorticity near the tropopause by nonconservative processes in the ECMWF model, J. Atmos. Sci., 76, 1709–1726, https://doi.org/10.1175/JAS-D-18-0295.1, 2019. a, b
Sprenger, M. and Wernli, H.: The LAGRANTO Lagrangian analysis tool – version 2.0, Geosci. Model Dev., 8, 2569–2586, https://doi.org/10.5194/gmd-8-2569-2015, 2015. a
Sprenger, M., Fragkoulidis, G., Binder, H., Croci-Maspoli, M., Graf, P., Grams, C. M., Knippertz, P., Madonna, E., Schemm, S., Škerlak, B., and Wernli, H.: Global climatologies of Eulerian and Lagrangian flow features based on ERA-Interim, B. Am. Meteorol. Soc., 98, 1739–1748, https://doi.org/10.1175/BAMS-D-15-00299.1, 2017. a
Trigo, I. F., Davies, T. D., and Bigg, G. R.: Objective climatology of cyclones in the Mediterranean region, J. Climate, 12, 1685–1696, https://doi.org/10.1175/1520-0442(1999)012<1685:OCOCIT>2.0.CO;2, 1999. a, b, c
Ulbrich, U., Leckebusch, G., and Pinto, J. G.: Extra-tropical cyclones in the present and future climate: a review, Theor. Appl. Climatol., 96, 117–131, https://doi.org/10.1007/s00704-008-0083-8, 2009. a
Wernli, H. and Davies, H. C.: A Lagrangian-based analysis of extratropical cyclones. I: The method and some applications, Q. J. Roy. Meteor. Soc., 123, 467–489, https://doi.org/10.1002/qj.49712353811, 1997. a
Wernli, H. and Schwierz, C.: Surface cyclones in the ERA-40 dataset (1958–2001). Part I: Novel identification method and global climatology, J. Atmos. Sci., 63, 2486–2507, https://doi.org/10.1175/JAS3766.1, 2006. a, b
- Abstract
- Introduction
- Data and methods
- Concept of cyclonic and environmental PV
- Cyclonic and environmental PV in ERA5
- Regions of large PV changes and orographic influences
- Diabatic processes in cyclonic and environmental PV in the IFS
- Discussion and conclusions
- Data availability
- Author contributions
- Competing interests
- Disclaimer
- Acknowledgements
- Financial support
- Review statement
- References