the Creative Commons Attribution 4.0 License.
the Creative Commons Attribution 4.0 License.
 | 15 Sep 2023
Atmospheric response to cold wintertime Tibetan Plateau conditions over eastern Asia in climate models
Fabio D'Andrea
Paolo Davini
Mostafa E. Hamouda
Claudia Pasquero
Central Asian orography (namely the Tibetan and Mongolian plateaux) sets important features of the winter climate over eastern Asia and the Pacific. By deflecting the mid-latitude jet polewards it contributes to the formation of the Siberian high and, on the lee side, to the advection of dry cold continental air over the eastern Asian coast and the Pacific Ocean, where atmospheric instability and cyclogenesis thrive. While the mechanic forcing by the orography is assessed in a number of modelling studies, it is still not clear how near-surface temperature over the two most prominent orographic barriers of the central Asian continent – the Tibetan and Mongolian plateaux – influences the winter climate. The problem is particularly relevant in view of a well-known cold bias in state-of-the-art climate models in proximity to the Tibetan Plateau, likely related to the modelling of land processes and land–atmosphere interaction over complex orography. Here we take advantage of the large spread in near-surface temperature over the central Asian plateaux within the Coupled Model Intercomparison Project Phase 6 (CMIP6) to study how colder-than-average Asian plateau temperatures impact the atmospheric circulation. Based on composites of the CMIP6 models' climatologies showing the coldest Tibetan Plateau conditions, we find that such negative temperature anomalies appear to amplify the atmospheric response to orography, with an intensification of the eastern Asian winter monsoon and of the equatorward flank of the Pacific jet. The results of the CMIP6 composite analysis are supported by experiments run with an intermediate-complexity atmospheric model, forced by a similar pattern of cold surface temperatures over the central Asian plateaux. Within this setting, the relative influence of the Tibetan and the Mongolian Plateau surface conditions is analysed. Based on the results reported in this work we project that advances in the modelling of the land energy budget over the elevated regions of central Asia could improve the simulation of the climate in the Asian–Pacific sector climate, together with the reliability of climate projections and the performance of shorter-term forecasts.
- Article
(9309 KB) - Full-text XML
- BibTeX
- EndNote


The impact of orography on the extratropical circulation was proposed by the analytical studies of Charney and Eliassen (1949) and Bolin (1950), while Smagorinsky (1953) first discussed the matching of orographic and thermal forcing by land–sea contrast in order to explain the longitudinal variations in the mid-latitude westerlies. Manabe and Terpstra (1974) and Hahn and Manabe (1975) analysed the impact of the Tibetan Plateau on the Asian climate by running an atmospheric general circulation model (AGCM) with and without mountains. They proved that the elevation of central Asia is essential to reproduce the position and strength of the low-level winter anticyclone known as the Siberian high and for the maintenance of the south-eastern Asian summer monsoon, which, thanks to the intense uplift from orography, extends from the Indian sector as far as eastern Asia. The regional dryness and humidity of the aforementioned winter and summer circulation patterns and their association with orography were examined by Broccoli and Manabe (1992).
More recently, starting with Sato (2009), the influence of lower-elevation mountain chains on the Asian and Pacific climate has been considered separately from that of the Tibetan Plateau. This applies in particular to the mountain chains extending north-east of Tibet. Similarly to White et al. (2017), we denote the orography between approximately 20–40∘ N and 62–120∘ E as the Tibetan Plateau or TP region (green box in Fig. 2) and that between approximately 38–60∘ N and 65–140∘ E as the Mongolian Plateau or MP region (orange box in Fig. 2).
In the cold season the eastern Asian–Pacific circulation is dominated by the eastern Asian winter monsoon, which consists in north-westerly advection of cold dry continental air from Siberia off the Asian coast (Zhang et al., 1997; Chan and Li, 2004). The winter thermal emission of the TP land and of the air column above generate a tropospheric heat sink over the plateau (Yanai et al., 1992; Yanai and Wu, 2006; Duan and Wu, 2008) that reinforces the Eurasian surface thermal high (Shi et al., 2015). Moreover, the presence of TP and MP orography reduces the westerlies upstream and enhances the north-westerly winds over eastern Asia and the Pacific (Shi et al., 2015; Sha et al., 2015). On the lee side of the plateaux, the cold continental advection modulates the thermal contrast with the Pacific Ocean and the local baroclinicity, which fuel the Pacific jet stream downstream (Shi et al., 2015; White et al., 2017). Notwithstanding the lower elevation and extension of the MP compared to the TP, the MP is more relevant for the winter circulation because of its ideal position – in terms of impinging low-level winds and meridional potential vorticity gradients – for acting as a source of Rossby waves (Held and Ting, 1990; White et al., 2017).
Conversely, the warm-season circulation is driven by the eastern Asian summer monsoon, modulating rainfall over land and ocean (Yihui and Chan, 2005). This is sustained in strength and extension by the atmospheric uplift produced by Asian orography, which constitutes a tropospheric heat source in summer (Yanai et al., 1992; Hahn and Manabe, 1975; Ye and Wu, 1998). The orographic control over the summer monsoon is mostly accomplished by the TP, with the MP playing only a marginal role; this, among other things, reinforces the monsoonal circulation and the associated precipitation along the eastern coast of Asia (see Figs. 6, 9, 10 in Sha et al., 2015).
Considering the importance of the central Asian orography for the climate of the Asian–Pacific sector, it is not surprising to find examples in literature where orographic surface and near-surface thermal conditions (acting as tropospheric heat sources or sinks; Yanai et al., 1992) have an impact on the circulation downstream. Indeed, evidence is found for the relevance of spring and summer temperatures over Asian orography for the atmospheric conditions far downstream (see Wu et al., 2015, for a review and Xue et al., 2021, 2022, for recent work on the impact of spring TP land initialisation in subseasonal-to-seasonal predictions). In the extended winter season (October–March) the presence of anomalous snow cover changes the tropospheric energy budget through an increase in the surface albedo, enhancing the reflection of shortwave radiation and the cooling of the land surface and the atmosphere (Yeh et al., 1983). Analyses on the dynamical influence of Tibetan Plateau snow cover indicate that it is relevant for the atmospheric circulation at intraseasonal timescales (Li et al., 2018) and that, when anomalies are persistent, it may modulate interannual variability (Chen et al., 2021; Clark and Serreze, 2000; Henderson et al., 2013) and long-term projections (Liu et al., 2021). In a more idealised context, winter positive thermal forcing over mid-latitude land – as in a climate with a reduced winter land–sea thermal contrast caused by the faster warming of continents with respect to oceans – was analysed by Portal et al. (2022). It was shown there that the atmospheric response to idealised warming over eastern Asia (including the orography) dominated over a pattern of similar intensity imposed over the North American continent. The work by Henderson et al. (2013), comparing snow-induced temperature forcing over the two continents, reaches similar conclusions regarding the relevance of eastern Asian surface conditions for the Pacific sector. A possible explanation for this is that the elevated Asian forcing, releasing heat directly in the mid-troposphere, is more effective in producing a large hemispheric response than an equivalent lower-level forcing over North America (Hoskins and Karoly, 1981; Trenberth, 1983; Ting, 1991). Notwithstanding the potentially high impact of anomalous surface conditions over the Tibetan and Mongolian plateaux on the eastern Asian climate, their dynamical role has been poorly investigated.
An additional motivation to approach the topic of thermal forcing over the Asian plateaux is the presence of a significant multi-model mean (MMM) temperature bias in the region of eastern Asia, which is evident over successive phases of the Coupled Model Intercomparison Project (CMIP) and over multiple seasons. Priestley et al. (2022) detect a strong deviation from the reanalysis temperature in the summer season and, based on the modified thermal gradients in the lower troposphere, hypothesise a role of the TP land temperature on the baroclinicity and cyclogenesis downstream. Along the same lines, eastern Asian winter conditions are anomalously cold among several climate models (Wei et al., 2014; Gong et al., 2014), although improvements, associated with a closer representation of the winter monsoon, have been detected in the transition from CMIP Phase 3 to Phase 5 (Wei et al., 2014). The winter bias is specially strong over the TP region (Fig. 1; Peng et al., 2022; Fan et al., 2020), where limited progress was obtained in the transition from CMIP5 to CMIP6 (Lun et al., 2021; Hu et al., 2022). These studies also highlight the presence of a wide inter-model spread in year-round eastern Asian and TP temperatures in the CMIP climate models, which appears to be related to the difficulties in representing surface energy fluxes (Wei et al., 2014), in particular over regions characterised by complex orography and seasonal variations in snow cover (e.g. Su et al., 2013; Chen et al., 2017; Li et al., 2021).
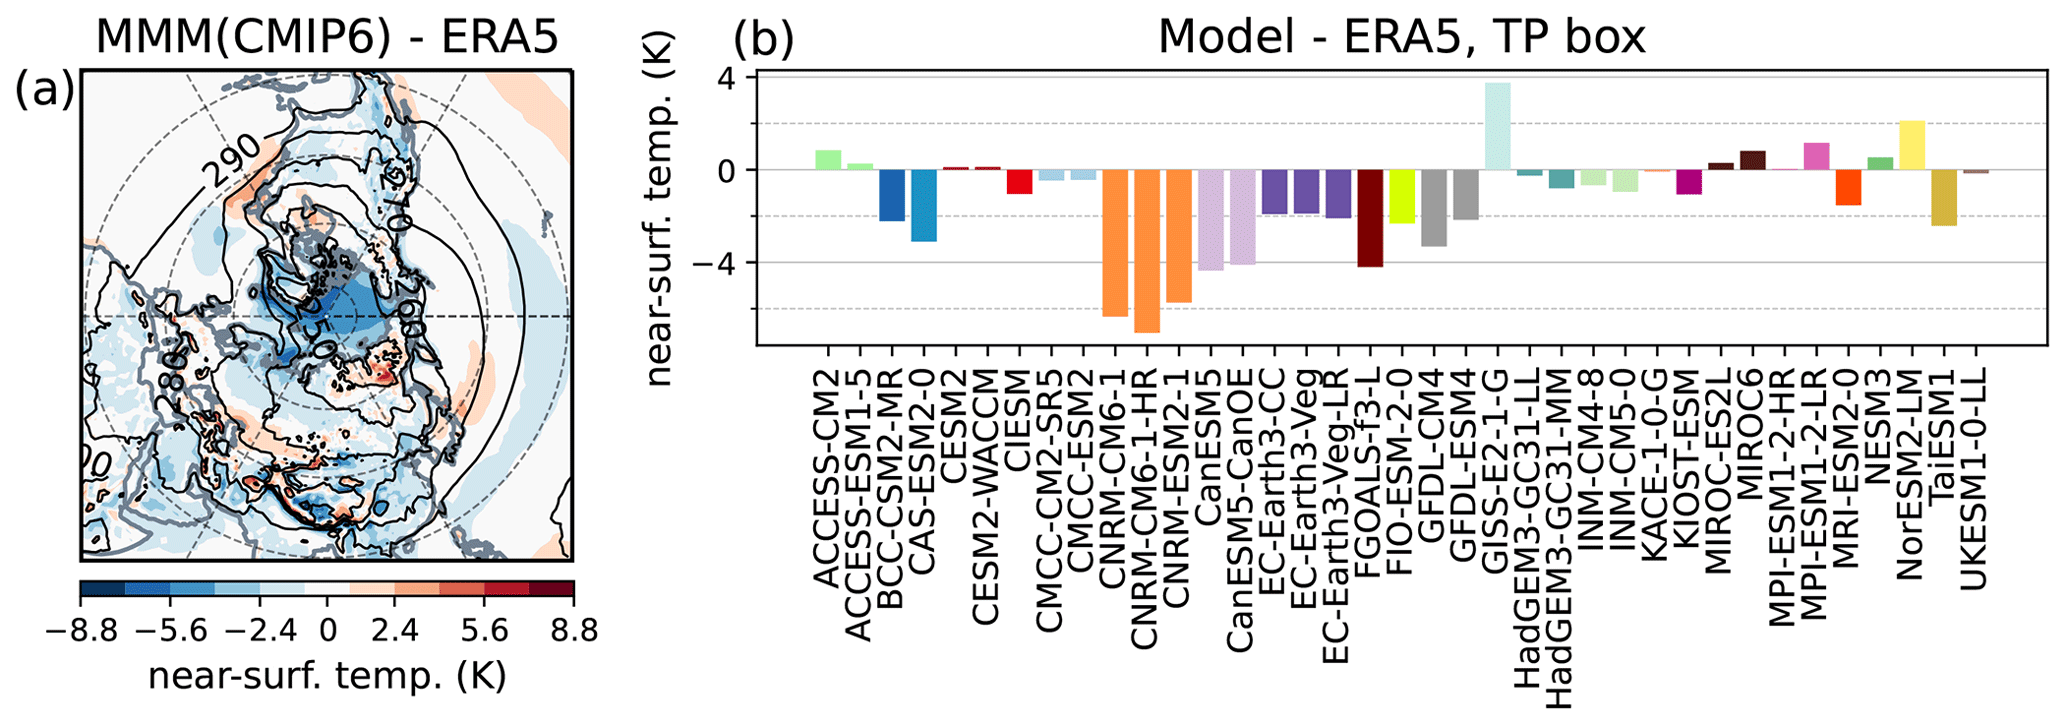
Figure 1(a) The multi-model mean bias with respect to ERA5 in the January–February near-surface temperature climatology 1979–2008, with the ERA5 climatology in contours, and (b) the individual model biases over the TP box [25–40∘ N, 70–105∘ E] (see black box in of Fig. 2b).
The cold Tibetan Plateau temperature bias has been examined in some detail by Chen et al. (2017). Among the climate models taking part in CMIP5 they identify a strong bias in the western region of the plateau (consistent with Fig. 1a) and show that it is more evident in terms of near-surface than surface (skin) temperature. The reason for the emergence of the strong near-surface bias is investigated by decomposing the different contributions to the low-level energy budget. Anomalous snow cover corresponds to an increase in the surface albedo, hence in the reflection of shortwave radiation, and this is anticorrelated with upward turbulent heat fluxes. While the surface temperature is weakly affected by these terms, due to compensation between incoming shortwave radiative and outgoing turbulent fluxes, a reduction in the turbulent heat flux into the atmosphere, leading to a decrease in the low-level water vapour content and thermal radiation, cools the boundary layer. By identifying physically interlinked low-level and surface processes modifying the energy budget, Chen et al. (2017) are able to explain why several CMIP5 models present a low-level cold bias over the Tibetan Plateau. These findings are likely applicable to the CMIP6 models affected by similar TP temperature biases (Lun et al., 2021; Hu et al., 2022).
In the present paper, by analysing the implications of cold central Asian orography winter conditions for the large-scale circulation on the lee side of the mountains, the possible dynamical consequences of the recurrent Tibetan Plateau cold bias in climate models are explored. To do this we take advantage of the large temperature spread detected over the TP and MP among CMIP6 models to construct a multi-model realisation of a cold anomaly. The atmospheric circulation in such a “cold TP composite” is analysed in the Asian–Pacific sector, taking into account the eastern Asian winter monsoon. The results obtained from the multi-model study are further tested with an intermediate-complexity atmospheric general circulation model (AGCM) forced by land-surface temperature patterns taken from the anomalies in the CMIP6 cold TP composite. Finally, to isolate the individual role of the Mongolian and Tibetan plateaux in the atmospheric response to cold central Asian orography, we consider two separate AGCM experiments where MP or TP forcing are compared against a widespread TP and MP forcing. The two approaches (CMIP6 compositing and AGCM idealised simulations) are described in Sect. 2, the outcomes and their mutual consistency are examined and discussed in Sect. 3, and a final summary is provided in Sect. 4.
2.1 CMIP6 simulations
We use CMIP6 coupled historical simulations over years 1979–2008, and we compute the January–February climatology over the 30-year period, taken as representative of the recent climate. The results for January–February – referred to as winter throughout the paper – are equivalent to those considering December–January–February, while, as in Clark and Serreze (2000), results for an extended October–March winter are weaker in intensity (not shown). We select one member per climate model from the CMIP6 dataset, as specified in Table 1, to obtain a sample of 37 historical simulations. Based on an index of Tibetan Plateau temperature (i.e. the climatological weighted-area average of near-surface temperature in the black box of Fig. 2b, comprising latitudes 25 to 40∘ N and longitudes 70 to 105∘ E over the period 1979–2008), the six simulations with temperature index below −1.0 SD (standard deviation) from the CMIP6 multi-model mean (MMM) form the cold TP composite (see models highlighted in bold in Table 1). The composite fields are shown in terms of the anomalies from the climatology of the MMM, with stippling where the anomalies exceed the 95th percentile of a random distribution, computed from 1000 samples of six-model composites extracted randomly and without repetition from the 37 model realisations (Wilks, 2011). Stippled anomalies (as defined above) are referred to as significant within the text. As a caveat, it is important to note that the cold TP composite is composed of multiple models from the Centre National de Recherches Météorologiques (CNRM) and Canadian Centre for Climate Modelling and Analysis (CCCma) (see Table 1 for institutions and models). However, a similar selection method (simulations with TP temperature below a threshold of −1.0 to −0.75 SD from the MMM) but based on a single model per institution produces consistent results, extending to the cases when additional modelling systems are included in the composite (BCC-CSM2-MR and FIO-ESM-2-0 for the −0.75 SD threshold selection).
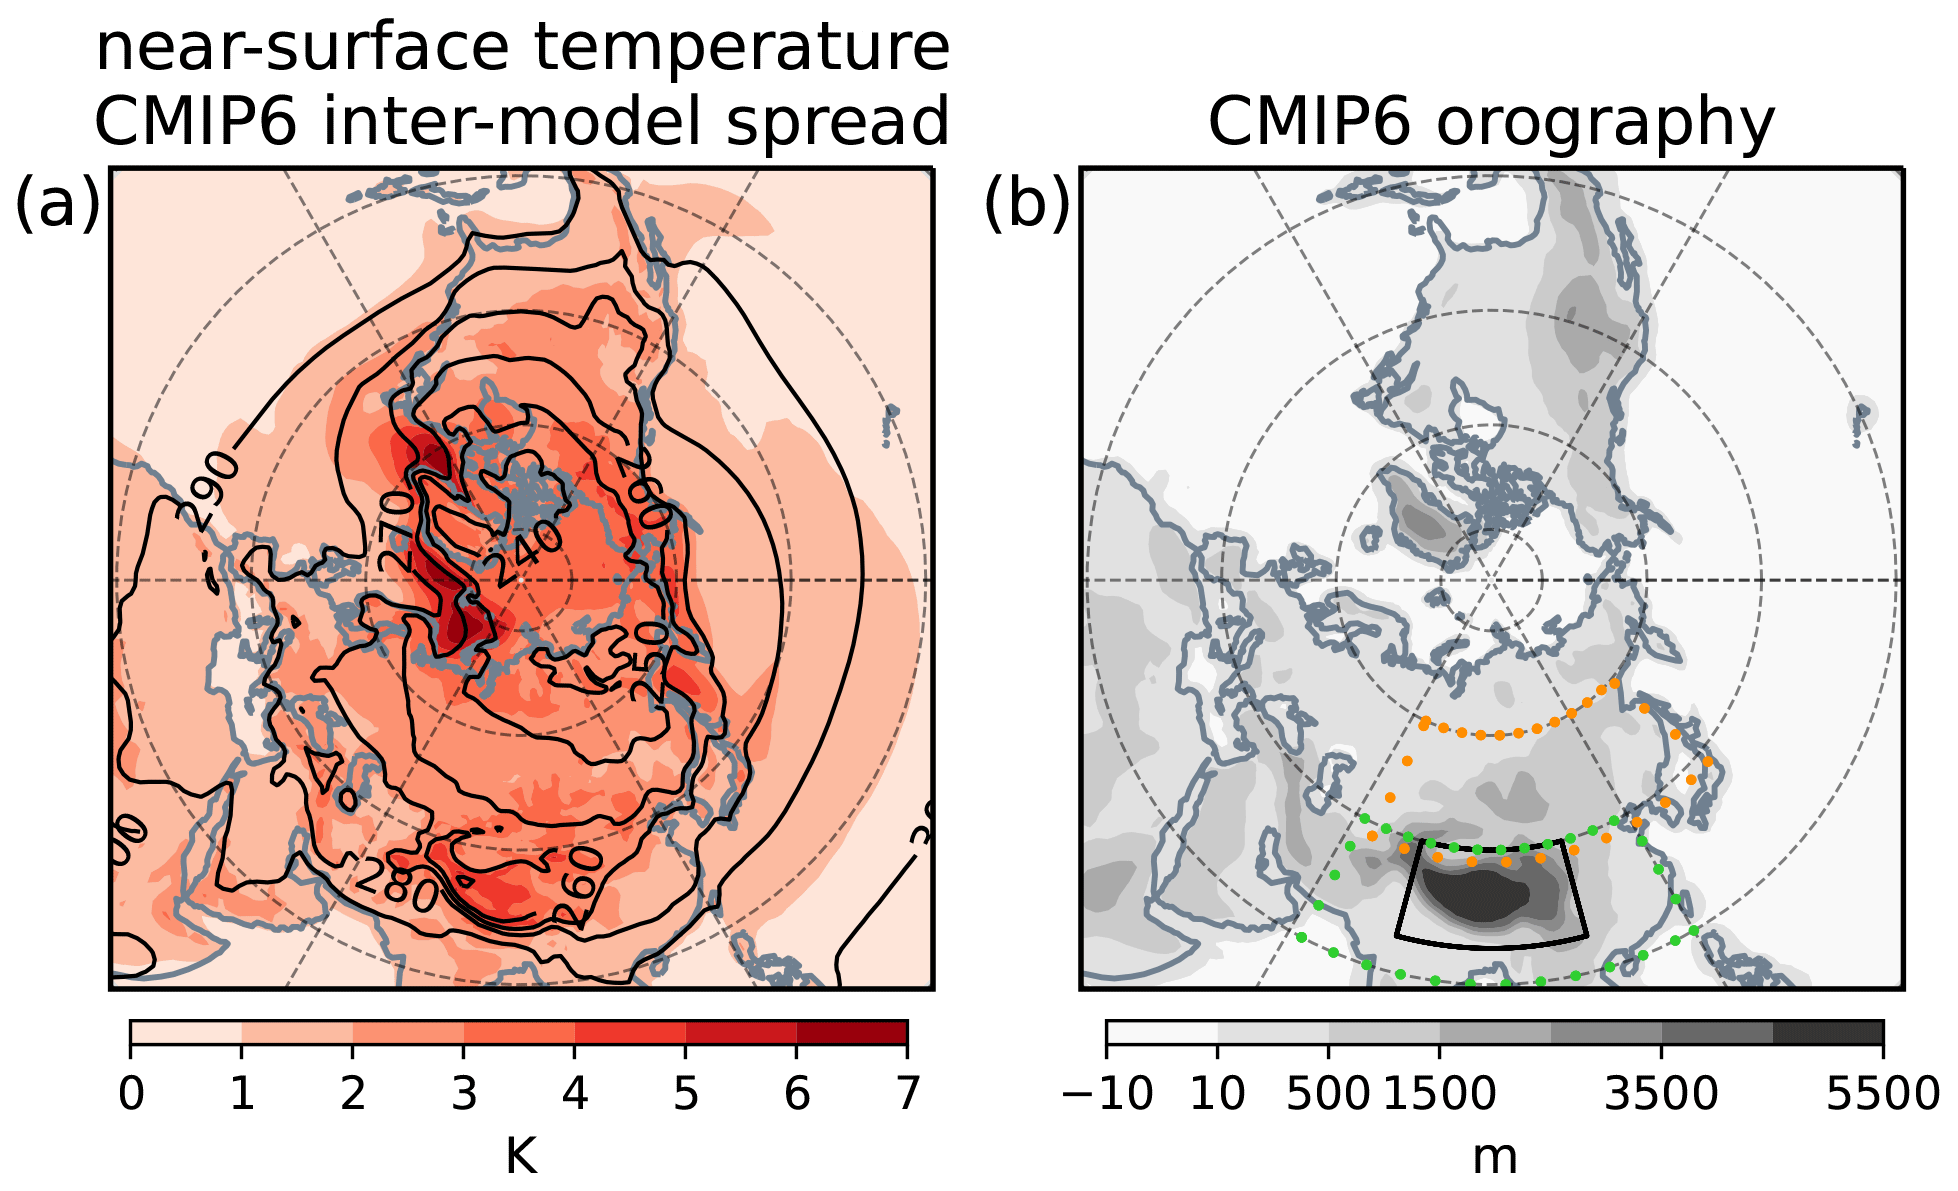
Figure 2(a) The inter-model spread (standard deviation) in the January–February near-surface temperature climatology for CMIP6 1979–2008 historical simulations, with the MMM field in contours, and (b) the MMM orographic elevation. The black longitude–latitude contour in panel (b), with the range of [25–40∘ N, 70–105∘ E], is the TP box used to compute the Tibetan Plateau index for near-surface temperature; the model biases in Fig. 1b and the cold TP composite presented in Figs. 3–6 are based on such an index. The dotted boxes in panel (b) indicate the mountainous regions here named Tibetan Plateau or TP region (green) and Mongolian Plateau or MP region (orange).
Table 1List of CMIP6 climate models.
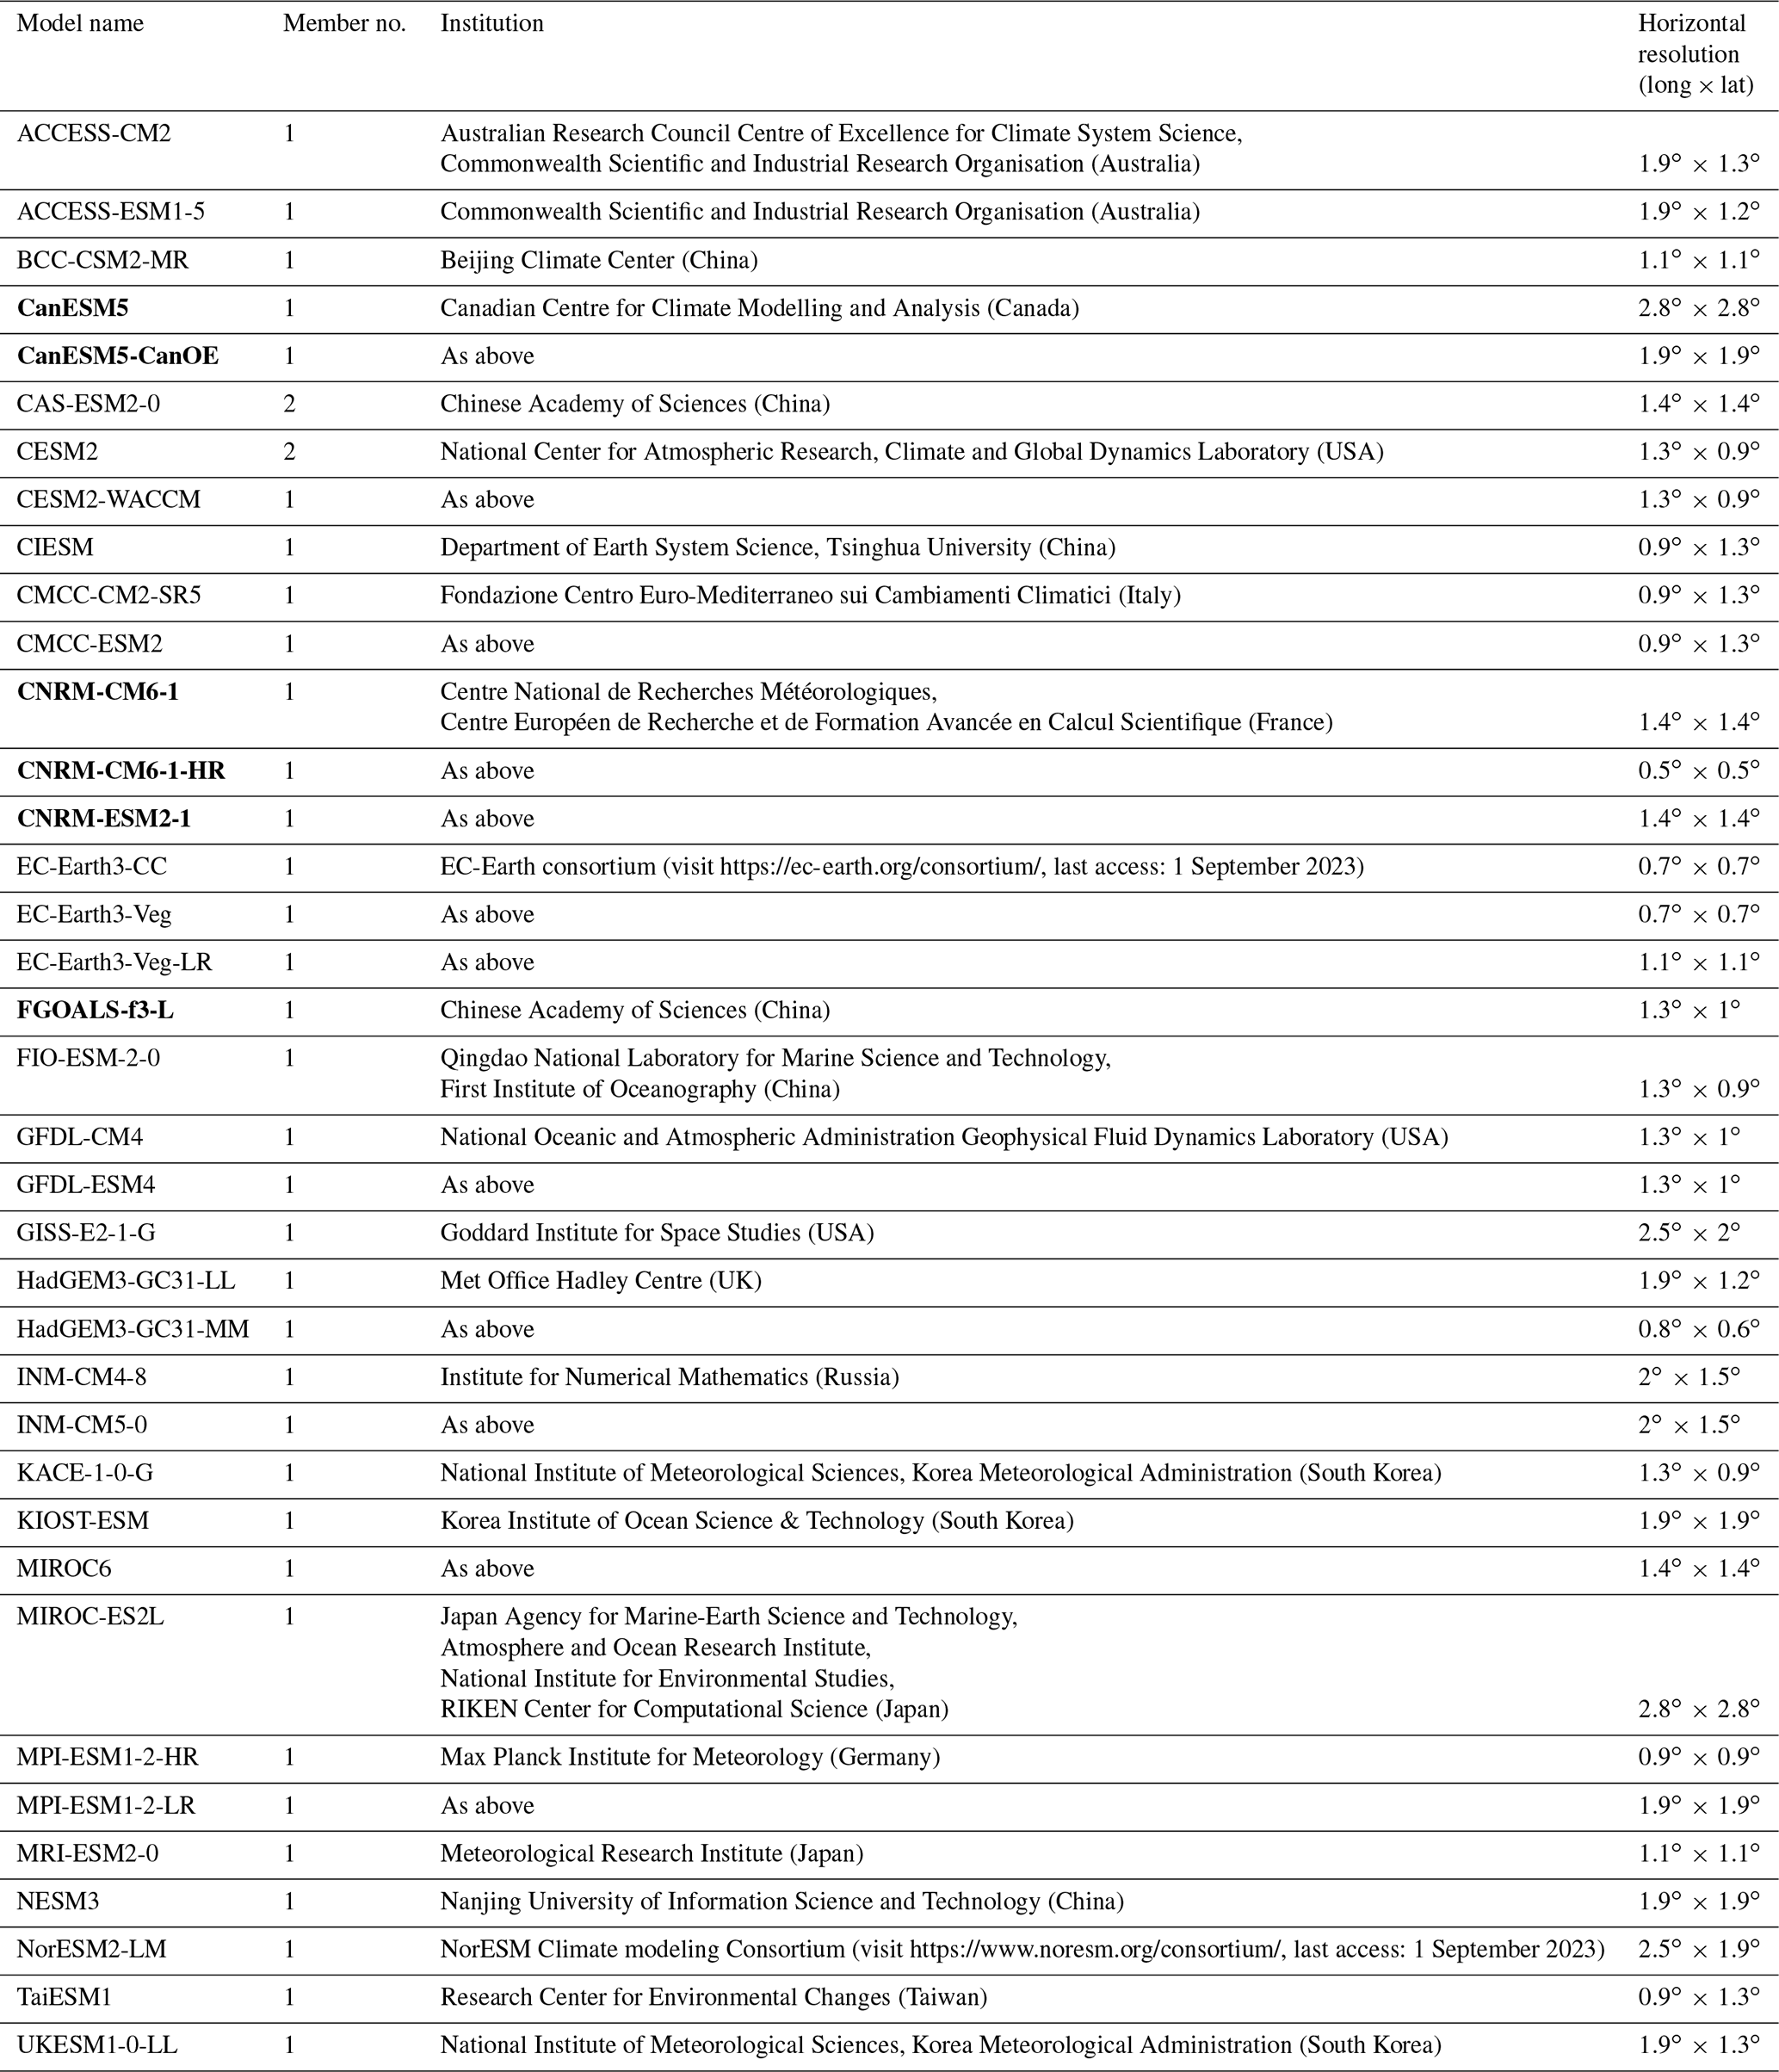
Models in bold were selected for the cold TP composite.
Wind components and air temperature at levels between 1000 and 700 hPa and at 300 hPa are extracted from the CMIP6 archive and used in the analysis. Turbulent surface heat fluxes, surface temperature (skin temperature or sea-surface temperature, SST, for the open ocean) and near-surface temperature (usually 2 m air temperature) are also used. Due to the lack of availability of daily fields for a large subset of the CMIP6 models, the analyses on the cold TP composite are based on monthly mean variables averaged in model climatologies. Moreover, we report that surface latent heat flux in KIOST-ESM; meridional wind and temperature advection in CAS-ESM2-0; and zonal wind, temperature advection and the Eady growth rate in FGOALS-f3-L are excluded from the composite analysis because of the inaccessibility of the datasets in the servers providing the CMIP6 archive.
2.2 Idealised experiments
To confirm the link between surface temperature and circulation anomalies in the CMIP6 compositing exercise, we run idealised experiments using an eight-level AGCM developed at the International Centre for Theoretical Physics (ICTP) and known as SPEEDY for Simplified Parametrization, primitivE-Equation DYnamics. The model is spectral on the sphere, with triangular truncation at total wavenumber 30 (T30) and a Gaussian grid of 96 × 48 points, and includes a simple parametrisation of moist processes (Molteni, 2003). Despite the low horizontal and vertical resolution, SPEEDY shows adequate performance for the analysis of large-scale features of the climate system (Kucharski et al., 2006, 2013). SPEEDY is run in perpetual-winter mode (200 January months and 200 February months) with prescribed sea-surface temperatures (SSTs), sea-ice cover (SIC) and land-surface temperatures (LSTs). The following two types of simulations are considered.
-
One control integration. This is where SST and SIC are equal to the 1979–2008 HadISST (Hadley Centre Global Sea Ice and Sea Surface Temperature) climatologies (Rayner et al., 2003). The LST corresponds to the January and February climatology from a separate SPEEDY 10-member ensemble, which is run with a freely evolving LST scheme and with prescribed climatological SIC and evolving SSTs for 1979–2008 from HadISST. Details on SPEEDY's LST scheme are available in Appendix B of Portal et al. (2022).
-
Three cold integrations. These include SST and SIC as in the control, with LST forcing corresponding to the significant anomalies of surface temperature from the cold TP composite within 60–140∘ E and 20–60∘ N (“TP + MP experiment”), 60–140∘ E and 38–60∘ N (“MP experiment”), or 60–140∘ E and 20–38∘ N (“TP experiment”, smoothed by , where latitude ϕ is greater than 38∘ N). The patterns have been interpolated onto SPEEDY's grid (see Fig. 4a, e, i).
The responses to TP + MP, MP and TP forcing experiments visualised in Sect. 3 correspond to the climatological difference “cold − control”, averaged over January and February. The stippling indicates anomalies exceeding the 95th percentile of a reference distribution obtained for each experiment by repeating 1000 permutations of a pool of daily fields composed by the “cold” and “control” integrations together. The fields are distinguished by month but not by forcing, in order to obtain 1000 samples of the average January–February “(cold − control)perm” anomaly (Wilks, 2011). Stippled anomalies (as defined above) are referred to as significant within the text.
2.3 Diagnostics
We introduce here the diagnostics used in the analysis of the results.
-
Temperature advection is
where is the horizontal wind composed of the zonal u and meridional v components and T is the temperature.
-
The Eady growth rate corresponds to
where f is the Coriolis parameter, Z is the geopotential height, is the Brunt–Väisälä frequency with θ potential temperature and g is Earth's gravitational acceleration.
Both quantities are computed using mean climatological variables, giving the temperature advection by the mean flow and the Eady growth rate of the mean state.
The following diagnostics are computed on SPEEDY integrations only.
-
Meridional eddy momentum flux (MEMF) is the product of the 2–6 d Fourier filtered wind components uHFvHF. Its meridional convergence represents the dominant term of eddy momentum deposition in the zonal flow (Hoskins et al., 1983).
-
Eddy total energy flux (TEF; Drouard et al., 2015) is used to estimate the downstream propagation of eddy total energy and is defined as
The contributions come from the advective flux of (eddy kinetic energy) and of (eddy available potential energy)1 and from the ageostrophic geopotential flux. The latter is defined in terms of Z (geopotential height) and ua (ageostrophic horizontal wind).
The climatological MEMF and TEF are computed on high-pass filtered daily fields (represented with superscript HF), averaged over the total time duration of the SPEEDY integrations.
The representation of the winter (January–February) near-surface temperature climatology by CMIP6 models in the historical period 1979–2008 shows a cold bias over the Arctic and over many inland regions of the Northern Hemisphere, including most of eastern Asia, with a peak in the mid-west of the Tibetan Plateau (Fig. 1a). Figure 1b shows the average bias in the TP box (black box in Fig. 2b) for each of the CMIP6 models: apart from a few exceptions, models are colder than the reanalysis, and those belonging to the same institutions show consistent values. Otherwise, warm biases are detected in the entrance regions of the storm tracks, over north-eastern Siberia, in some areas of the Middle East, and in the far-west (Hindu Kush) and far south-east (Hengduan Mountains) of the Tibetan Plateau.
The amplitude of the inter-model spread in near-surface temperature (computed in terms of standard deviation) is displayed in Fig. 2a. The spread is generally larger over land than over ocean and grows with latitude, with the largest amplitude attained around and poleward of the 60∘ N latitude circle and with a maximum over the Atlantic and Pacific oceans which is likely due to the inter-model variability in the position of the winter sea-ice cover boundary. An additional mid-latitude hotspot can be easily identified in the Tibetan Plateau, extending north over the Mongolian Plateau (cf. temperature spread and green and orange boxes over orography in Fig. 2a, b). The high orographic elevation of this region implies that near-surface turbulent fluxes are released deeper in the mid-latitude atmosphere, where heat sources and sinks are known to result in stronger circulation responses (Trenberth, 1983). Motivated by this and by results confirming the sensitivity of the winter mid-latitude circulation to eastern Asian surface conditions (e.g. Portal et al., 2022; Henderson et al., 2013; Cohen et al., 2001), we analyse in the following the dynamical features of a cold TP composite. The composite corresponds to the average of a model selection based on a TP temperature index, i.e. the area-weighted spatial and temporal mean of near-surface temperature over the black box in Fig. 2b. The specified region is characterised by a large temperature spread and high elevation within the Tibetan Plateau domain; the biases in the TP temperature index with respect to reanalysis are displayed in Fig. 1b.
A selection of surface variables from the cold TP composite is presented in Fig. 3. The near-surface temperature map features an intense cold anomaly over the orography of central Asia, peaking over the TP and extending north-eastward to the MP. We note that significant surface anomalies are found also elsewhere in the North American–North Atlantic sector; however, since our focus is on Asian orography and its downstream impacts, regional signals that are unlikely to interact with the Asian–Pacific sector are neither presented nor discussed. By comparing the surface and near-surface temperature patterns over the TP (cf. Figs. 4a and 3a), we notice that the surface temperature anomaly is stronger in intensity than the near-surface anomaly and conclude that in the cold TP composite land has a cooling effect on the atmosphere above. This is corroborated by negative anomalies of surface sensible and latent heat flux, which correspond to reduced latent and sensible warming of the atmosphere in regions where the MMM fluxes are weakly positive or to enhanced atmospheric cooling by the surface where the MMM fluxes are negative (Fig. 3b, c). The significant signal in sensible heat flux is strong over the centre of the TP, while the term of latent heat flux is significant elsewhere over the TP and MP regions.
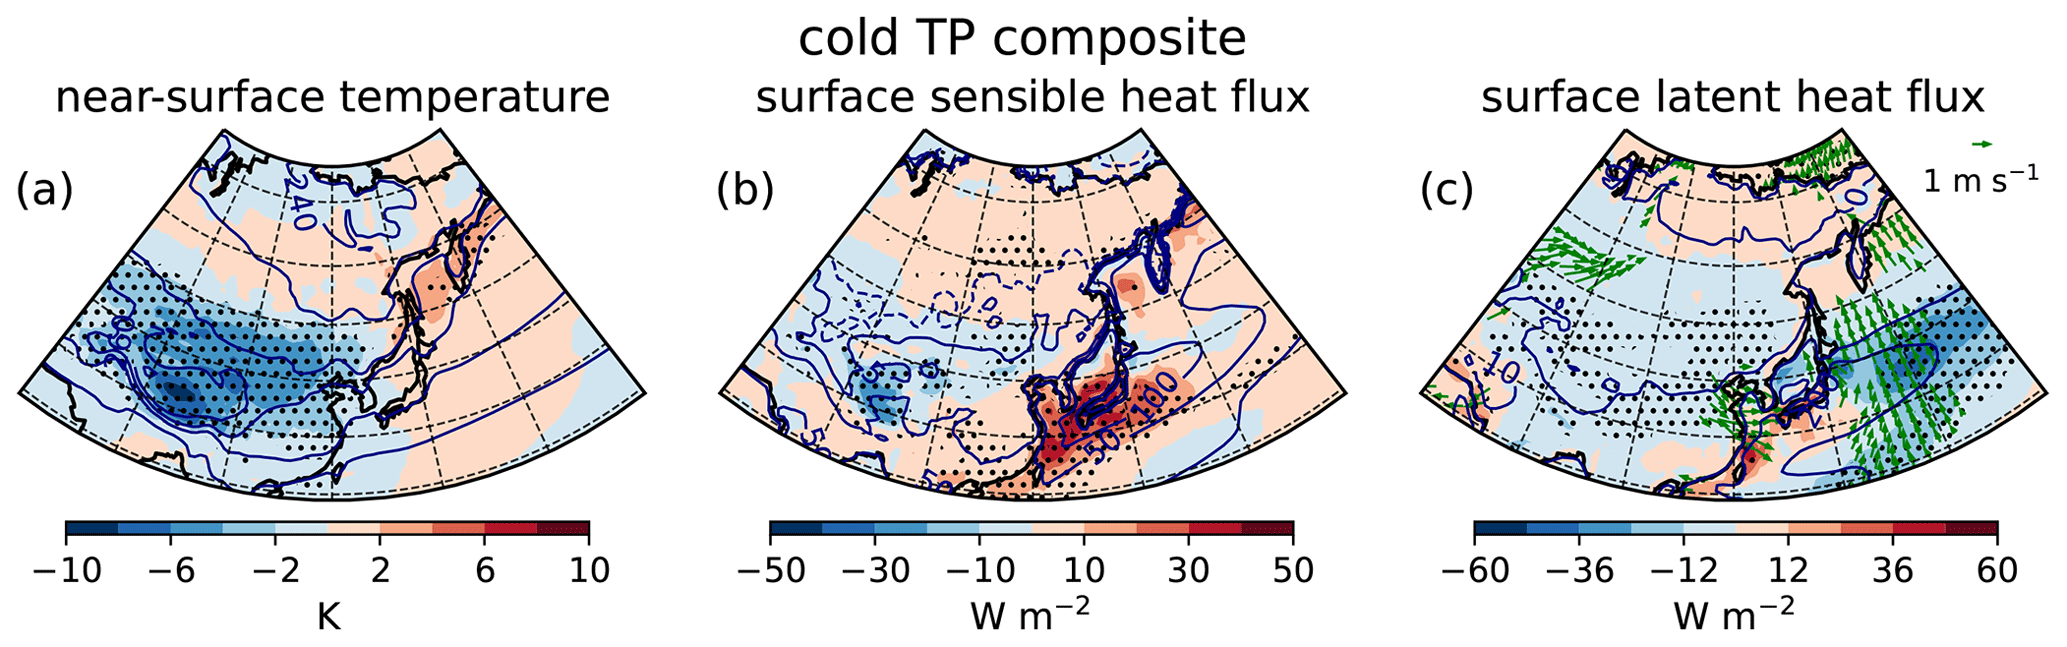
Figure 3Anomalies of the cold TP composite of (a) near-surface temperature and (b) sensible and (c) latent surface heat flux (upward) and the 1000 hPa horizontal wind vector (green arrows). Stippling and arrows indicate where anomalies exceed the 95th percentile in a randomly extracted six-model composite distribution (see Sect. 2). The respective MMM climatologies are displayed in contours (climatology of cl = [±5, +25, +50, +100, +200] W m−2 for sensible heat flux, cl = [0, +10, +100, +200, +400] W m−2 for latent heat flux).
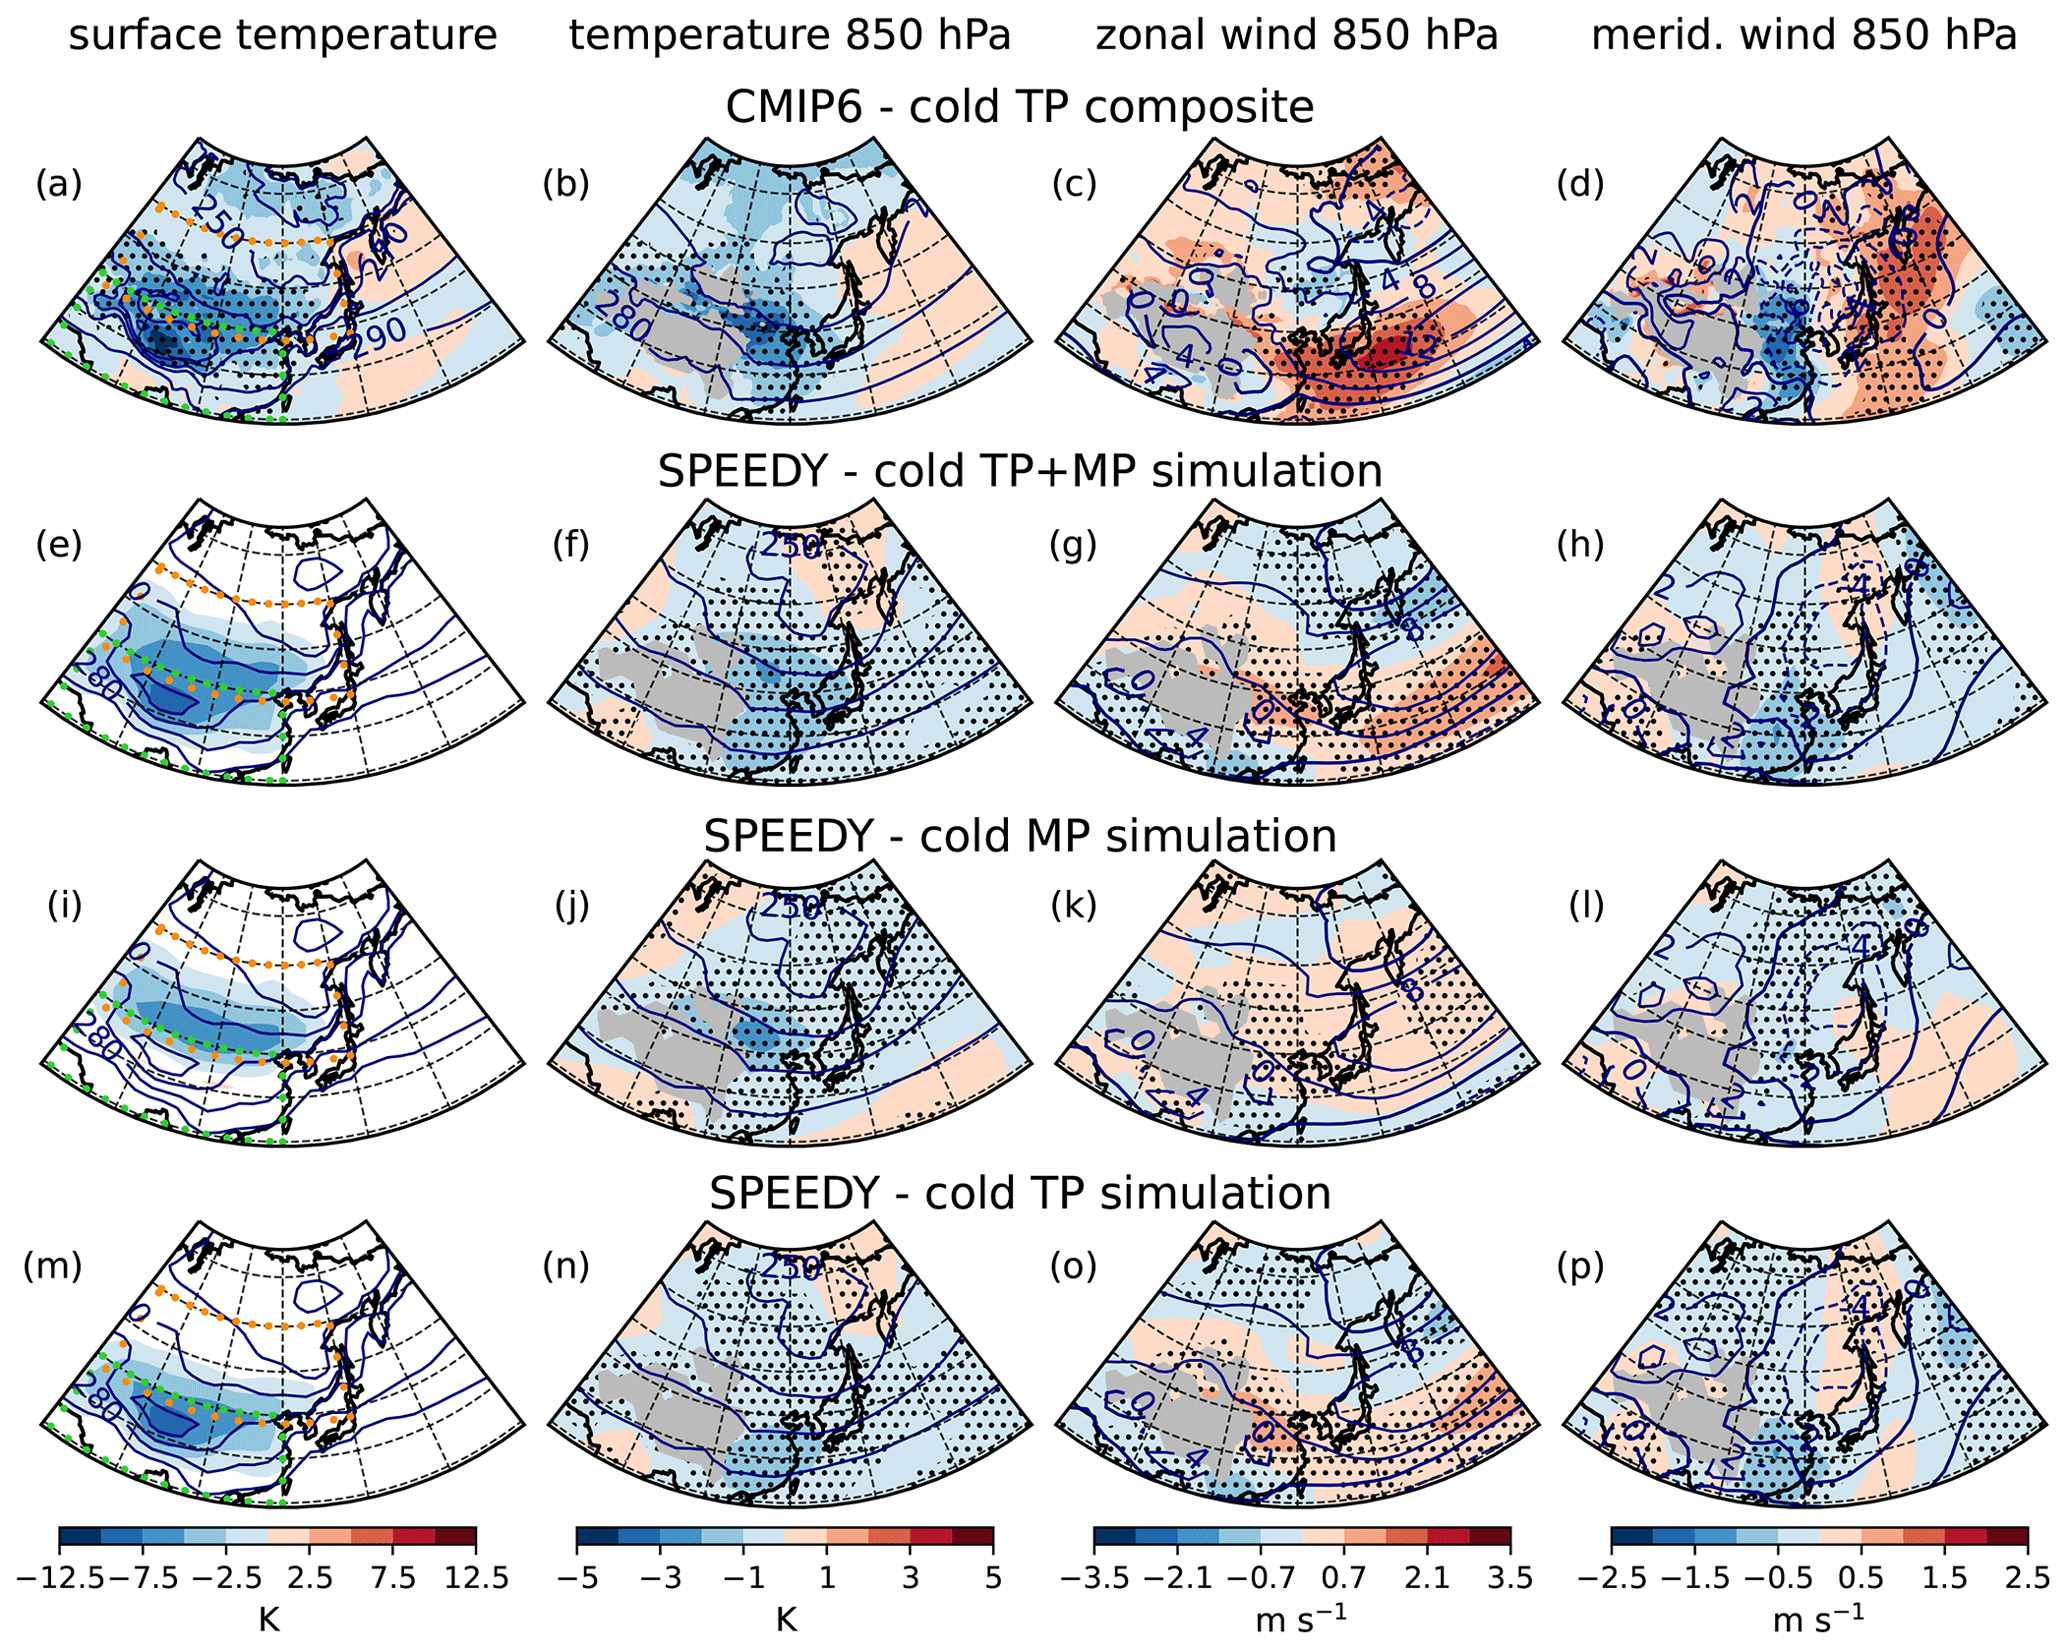
Figure 4Anomalies of the cold TP composite of (a) surface temperature and 850 hPa (b) air temperature, (c) zonal wind and (d) meridional wind; the respective MMM climatologies are in contours. The response of the model SPEEDY to TP + MP, MP and TP (e, i, m) surface temperature forcing in terms of 850 hPa (f, j, n) temperature, (g, k, o) zonal wind and (h, l, p) meridional wind; the control run is in contours. Stippling shows the anomalies exceeding the 95th percentile of a randomly extracted distribution (see Sect. 2). Dotted green and orange boxes in (a), (e), (i) and (m) indicate the mountainous areas named TP region and MP region, respectively. Grey shading masks orography exceeding 1400 m.
In the cold TP composite, anomalous snow amount is detected in correspondence with the strongest sensible heat flux anomalies but is not reported because data are available only for a limited subgroup of models. Although here we cannot verify the role of snow in the low-level energy budget, the anomalies in the surface variables are coherent with each other and with the results in Chen et al. (2017). They show that over the TP the processes causing cold biases may involve anomalous snow enhancing the surface albedo with negative effects on the low-level water vapour content and the downward longwave radiation, which ultimately result in a cooling of the boundary layer. The existence in CMIP6 models of a variety of schemes for land, snow and the atmospheric boundary layer and of the mutual interaction between these over complex orography is likely at the origin of the wide inter-model spread over the TP. In support of this view, the surface temperature anomalies do not appear to be driven by the circulation upstream of the TP (Figs. 4 and 5).
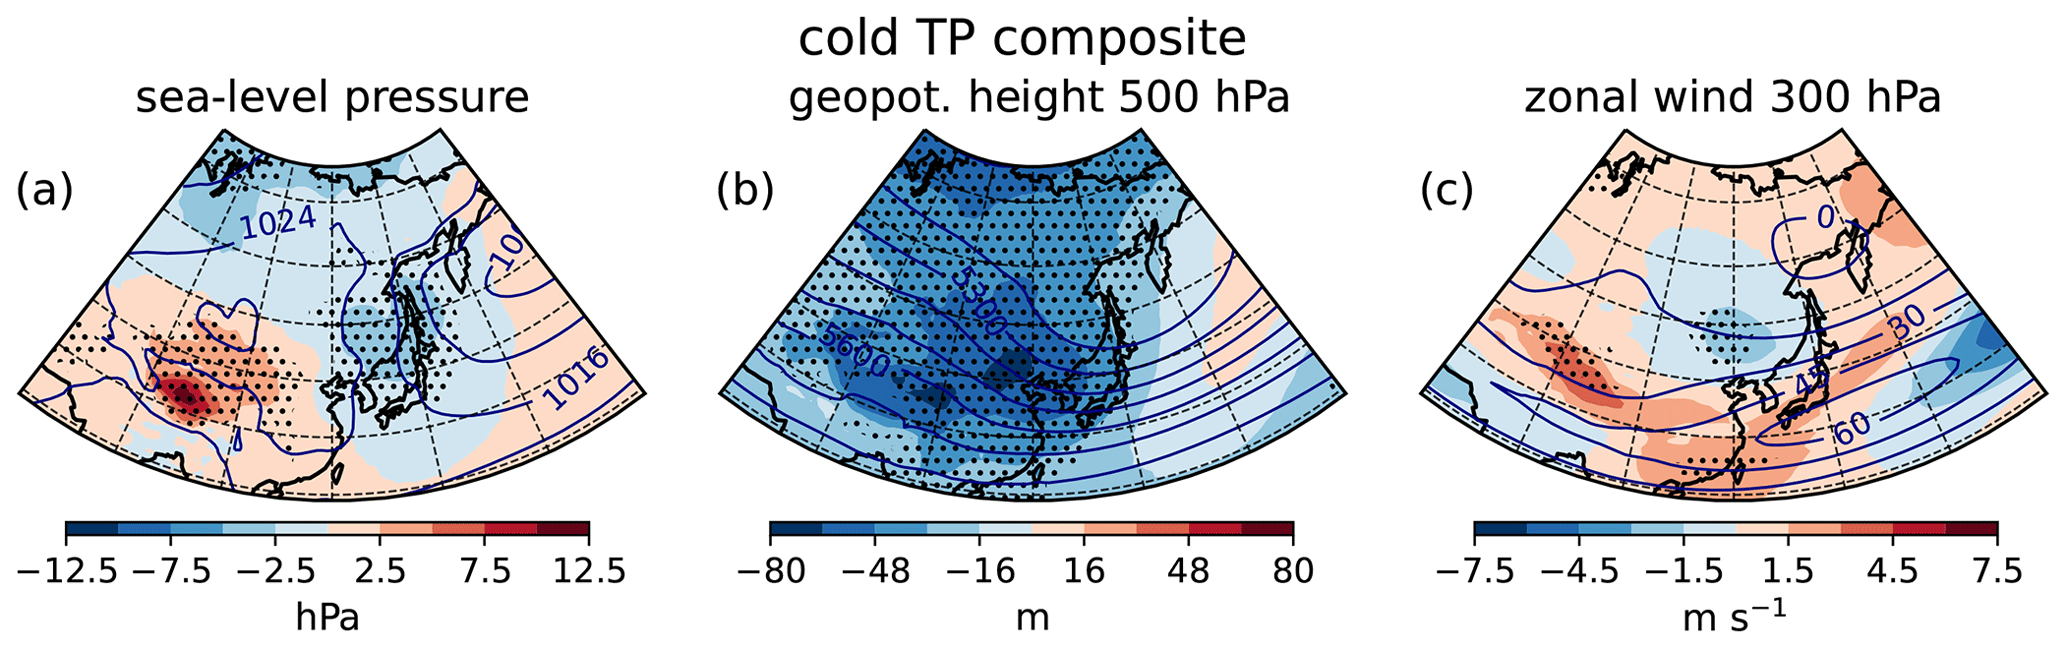
Figure 5Anomalies of the cold TP composite of (a) sea-level pressure, (b) 500 hPa geopotential height and (c) 300 hPa zonal wind; the respective MMM climatologies are in contours. Stippling shows the anomalies exceeding the 95th percentile in a randomly extracted six-model composite distribution (see Sect. 2).
The low-level temperature and wind conditions of the CMIP6 cold TP composite are shown in Fig. 4a–d. We note that at 850 hPa the negative thermal anomaly extends north-eastward of the most elevated area of the Tibetan Plateau – represented by grey patching – and reinforces the thermal cooling induced by the uplift of MP orography (cf. Fig. 11 in Sha et al., 2015). East of this region the westerly zonal winds of the Pacific eddy-driven jet are reinforced (Fig. 4c). At the same time, the southward wind anomaly over eastern China and the northward wind anomaly over the Pacific Ocean (Fig. 4d) intensify the cyclonic circulation over the Asian coast and consequently also the eastern Asian winter monsoon. Typical features related to a strong eastern Asian winter monsoon are captured by the sea-level pressure and mid-tropospheric geopotential height fields in Fig. 5 (cf. strong and weak monsoon conditions in Fig. 6 of Jhun and Lee, 2004). A deeper zonal pressure contrast to the east of the Siberian high (Fig. 5a) and a lower 500 hPa isobaric surface over the Asian coast (Fig. 5b) reinforce the 300 hPa jet over land and south of Japan (Fig. 5c) and adhere to maps describing the atmospheric state associated with an intense monsoon.
A comparison of the results in Fig. 5 with the maps in Sha et al. (2015) and Shi et al. (2015) shows that the cooling over central Asian orography amplifies the atmospheric response to orography itself. The positive interference between orographic forcing and superposed cooling corresponds closely to the outcome of a set of idealised experiments by Ringler and Cook (1999), featuring combinations of mechanic orographic and thermal forcing under varying mean-flow conditions.
The advection of cold air downstream of the TP (Fig. 6a) is supported by the negative temperature anomaly on the orography and, to the east, by the reinforcement of the north-westerly wind (Fig. 4b, d). These conditions are responsible for intensified meridional temperature gradients east of the TP and along the Pacific coast which enhance the baroclinicity (see positive anomalies in the Eady growth rate west and east of the Chinese coastline at latitudes 20–40∘ N, Fig. 6b). Given that the Eady growth rate measures the environmental conditions favourable to atmospheric baroclinic instability (see definition in Sect. 2), we expect the strengthening of the jet at the entrance of the Pacific basin (Fig. 4c) to be induced by increased eddy momentum deposition east of the TP and over the East China Sea, regions where cyclogenesis is climatologically high in mid-winter (Priestley et al., 2020; Schemm et al., 2021). An analysis of the eddy feedback on the zonal flow for the idealised TP + MP experiment – generally coherent with the results of the CMIP6 composite analysis – supports the hypothesis that the jet strengthening is induced by an intensification (weakening) of the synoptic activity upstream and to the south (north) of the jet maximum. This will be described in more detail in the paragraphs dedicated to the idealised experiments.
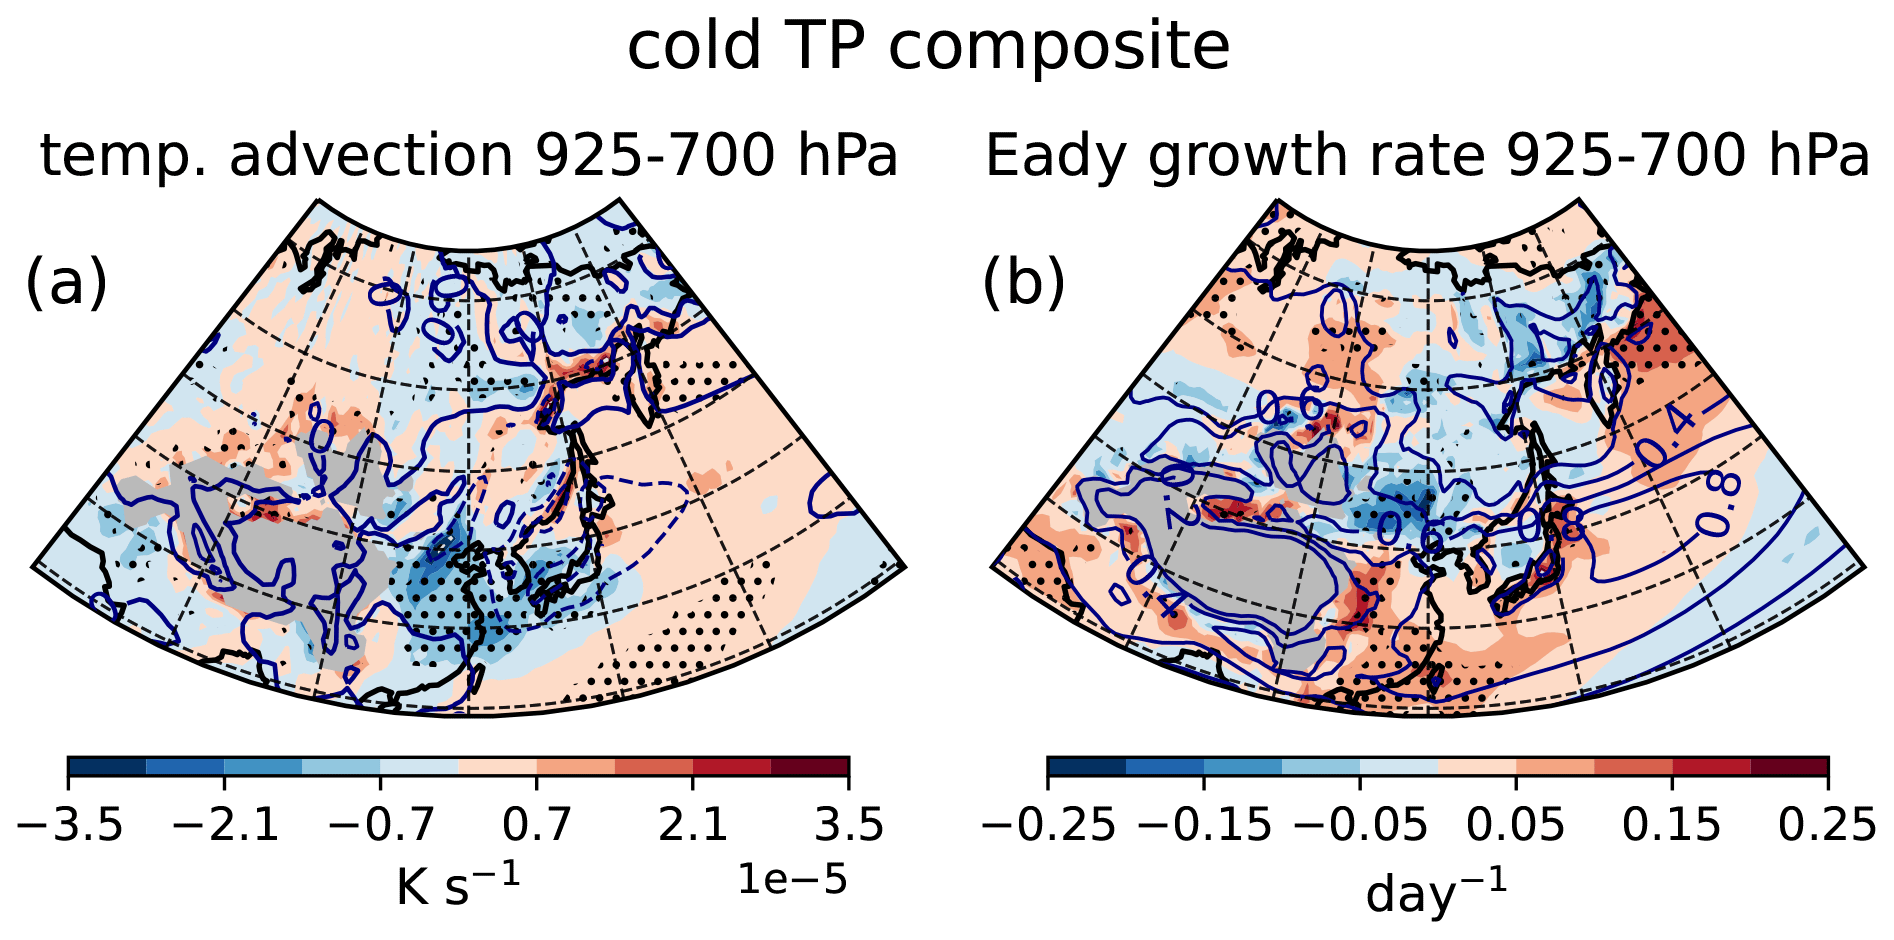
Figure 6Anomalies of the cold TP composite of (a) temperature advection by the mean flow (u⋅∇T) averaged over the pressure levels 925 to 700 hPa and (b) the Eady growth rate between 925 and 700 hPa, with the respective MMM climatologies in contours (colour internal of ci = 4 × 10⁻⁵ K s−1 for temperature advection, stippling for anomalies exceeding the 95th percentile in a randomly extracted six-model composite distribution; see Sect. 2). Grey shading masks orography exceeding 1400 m.
The strong surface heat flux anomalies present over the Pacific basin in the cold TP composite (Fig. 3b, c) are related to the strengthening of the Pacific jet over and downstream of the East China Sea (Fig. 4c), which extend down to the near-surface level (green arrows in Fig. 3c) and intensify the advection of cold air masses over the ocean (Fig. 6a). Indeed, cold air temperatures and strong winds in the boundary layer reinforce the surface turbulent heat fluxes by the sea surface. We note that the relation between (i) cold TP temperatures, (ii) strong low-level winds entering the Pacific basin south of Japan and (iii) strong sensible heat fluxes from the ocean surface over the South China Sea shows a linear tendency across the CMIP6 models (e.g. the correlation coefficient between (i) and (iii) is −0.85, where (i) is the near-surface temperature in the TP box (black box in Fig. 3b) and (iii) is the surface sensible heat flux in a [25–40∘ N, 120–135∘ E] box). This confirms that the impact of the TP thermal conditions in the western North Pacific region is not just a peculiarity of the cold TP composite but rather extends to the whole CMIP6 ensemble. In the composite we also observe a significant decrease in the latent heat flux east of 135∘ E (Fig. 3c) associated with a downstream weakening of the jet (outside the maps' boundaries). The origin of the negative anomaly of the latent heat flux may be related to a subtropical or tropical Pacific signal emerging from the selection of CMIP6 models (Figs. 3a–c, 4b–d).
To argue for the existence of a causal relation linking the cold Asian orography and the enhancement of the eastern Asian winter monsoon, we run an idealised experiment using the model SPEEDY (a perpetual-winter simulation with prescribed surface temperatures; for details see Sect. 2). The response of SPEEDY to TP + MP forcing – a surface cooling over central Asian orography (Fig. 4e) resembling the pattern of the cold TP composite (Fig. 4a) – in terms of air temperature, zonal wind and meridional wind at 850 hPa is shown in Fig. 4f–h. As in the CMIP6 composite, we find a cold anomaly to the north-east of the TP, with enhanced north-westerly winds downstream of the mountain barrier advecting cold air onto eastern Asia and over the Pacific (Fig. 7a). While in the CMIP6 composite the significant strengthening of the jet terminates at about 160∘ E, in the TP + MP experiment the strengthening is zonally coherent over the Pacific basin. The positive meridional wind signal over the North Pacific is also different, with a weak positive anomaly limited to the high latitudes in the SPEEDY experiment (Fig. 4h), contrasting with a strong positive anomaly extending from 20 to 70∘ N in the CMIP6 composite (Fig. 4d). These discrepancies might be related to the presence of additional signals emerging from the selection of CMIP6 models, such as Pacific tropical forcing and cold North American land temperatures, or from the difference between the MMM and the SPEEDY climatology. Nonetheless, they do not undermine the striking similarity between the cold TP composite and the response of the TP + MP experiment (cf. Fig. 4b–d and f–h). As previously noted for the CMIP6 composite, the response to TP + MP cooling also corresponds to an intensification of the eastern Asian winter monsoon (cf. Jhun and Lee, 2004) and to a positive interference with the atmospheric response to mountain uplift (cf. Shi et al., 2015).
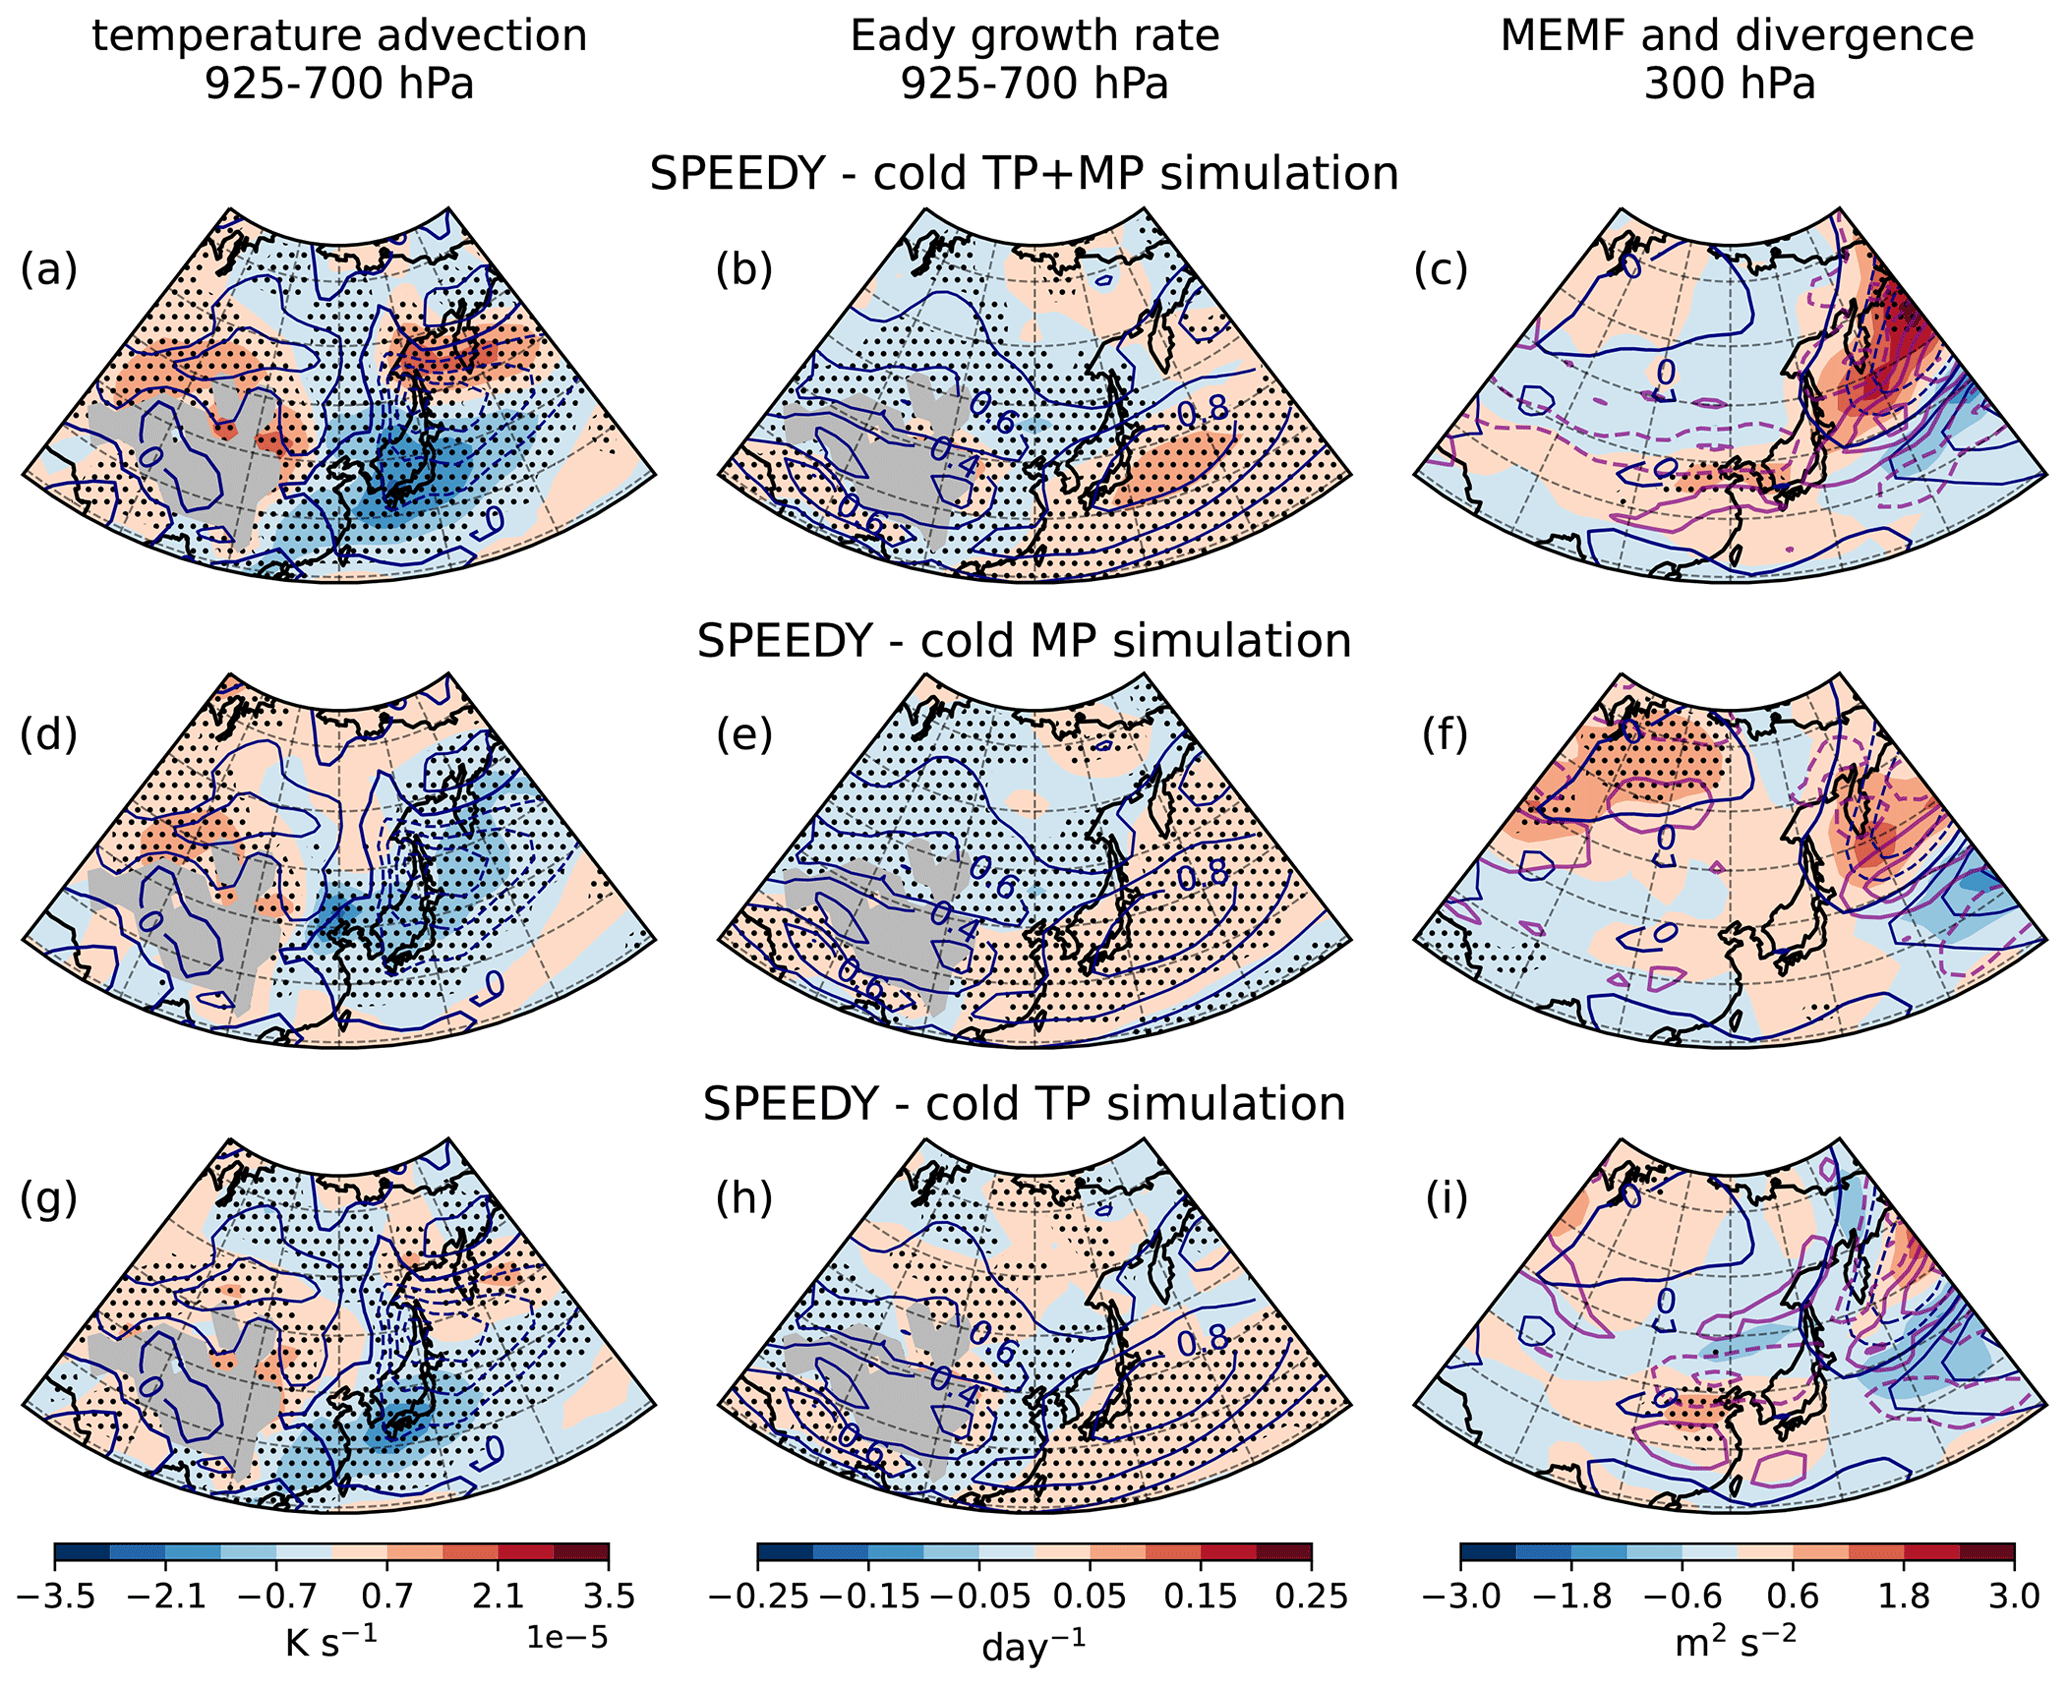
Figure 7The response of the model SPEEDY to TP + MP, MP and TP surface temperature forcing in terms of (a, d, g) temperature advection by the mean flow (u⋅∇T) averaged over the pressure levels 925 to 700 hPa, (b, e, h) the Eady growth rate between 925 and 700 hPa, and (c, f, i) the meridional eddy momentum flux (MEMF) at 300 hPa and its divergence (in purple contours for cl = [±5, ±15, +25] × 10−7 m s−2). The control run is shown in contours (ci = 4 × 10⁻⁵ K s−1 for temperature advection, ci = 5 m2 s−2 for MEMF), and stippling indicates where the anomalies exceed the 95th percentile of a randomly extracted distribution (see Sect. 2). Grey shading masks orography exceeding 1400 m.
In the TP + MP experiment the increase in the low-level baroclinicity north-east of the TP and over the Pacific Ocean at latitudes lower than 40∘ N (Fig. 7b) affects the upper-level synoptic activity. The pattern of meridional eddy momentum flux (MEMF; Fig. 7c), which is climatologically negative to the north of the storm track and positive to its south (see e.g. Hoskins et al., 1983), shifts equatorwards. The zonal convergence of meridional eddy momentum is also displaced to the south and increases inland to the north-east of the TP (negative purple contours in Fig. 7c), where it reinforces the jet across the tropospheric column (cf. green contours in Fig. 8b and shading in Fig. 4c). Contrarily, the wind in the northern flank of the jet, experiencing reduced momentum convergence from the synoptic disturbances, weakens. The flux of eddy total energy (TEF; Fig. 8b), representing the propagation of eddy energy along the storm track, confirms the increase (decrease) in the synoptic activity in correspondence with the region of jet intensification (slowdown).
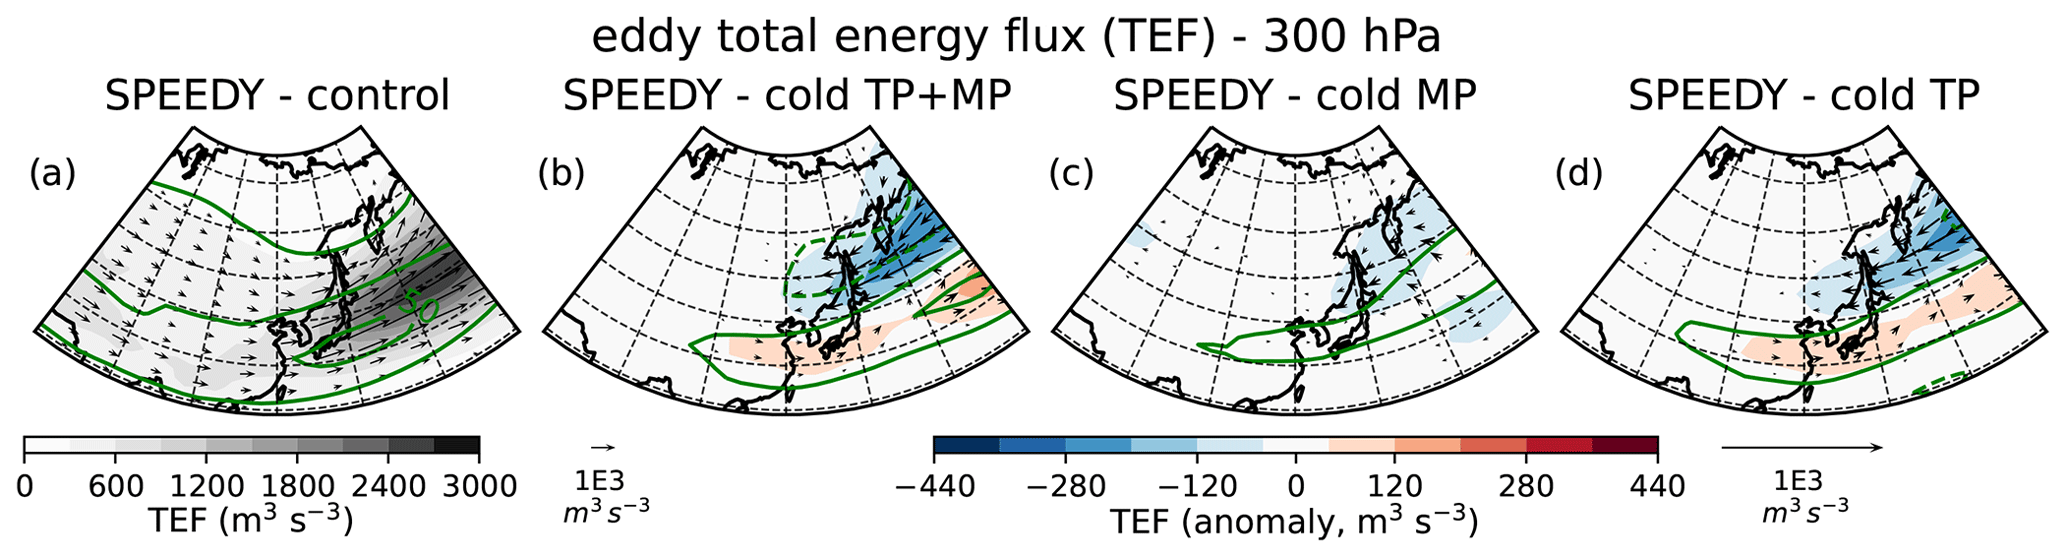
Figure 8(a) The 300 hPa eddy total energy flux (TEF) climatology in the SPEEDY control integration and the TEF response to (b) TP + MP, (c) MP and (d) TP surface temperature forcing. The zonal wind is shown in green contours (ci = 20 m s−1 for the control climatology in panel a, cl = [±1, ±3] m s−1 for the response in panels b–d).
In the papers by White et al. (2017) and Sha et al. (2015) the winter NH circulation is shown to be more impacted by the presence of the MP than by the TP because of the former's latitudinal position and of its interaction with the Pacific low-level jet (Held and Ting, 1990). We briefly consider the role of thermal anomalies over the two regions by showing the results of two experiments. In the MP experiment the cold anomalies from the TP + MP experiment north of 38∘ N are selected (Fig. 4i). In the TP experiment the anomalies south of 38∘ N are selected, by applying the function exp, where latitude ϕ is greater than 38∘ N (Fig. 4m); the smoothing function, although causing some superposition of the MP and TP forcing patterns (Fig. 4i, m), is necessary to avoid numerical divergences generated by steep meridional temperature gradients.
The low-level response to MP forcing shows cold anomalies limited to high mid-latitudes (Fig. 4j) and cold advection centred over Japan (Fig. 7d). The baroclinicity is enhanced at higher latitudes with respect to the TP + MP experiment (cf. Fig. 7b and e). Coherently with the changes in the meridional temperature gradients (baroclinicity) and notwithstanding a weak decline in the upper-level eddy energy over the Pacific Ocean north of 40∘ N (Fig. 8c), MP cooling strengthens the Pacific jet around its maximum intensity (green contours in Fig. 8c and shading in Fig. 4k). Although the results show that thermal forcing on the MP is relevant for the climate of the Pacific sector, the position of the response is inconsistent with that of the TP + MP experiment, hence with the anomalies emerging in the cold TP composite.
On the other hand, the TP experiment shows a close similarity to the MP + TP experiment. It features strong advection of cold temperatures to the south of Japan (Figs. 7g and 4n) which produces baroclinic conditions south of 40∘ N (Fig. 7h). In correspondence of the low-level Eady growth rate increase, the upper-troposphere synoptic activity is intensified (see TEF in Fig. 8d) and is associated, as in TP + MP, with a southward shift and upstream intensification of the meridional eddy momentum convergence (purple contours in Fig. 7i). This explains the strengthening and equatorward shift in the Pacific jet (green contours in Fig. 8d and shading in Fig. 4o). Hence, although the response to TP cooling is weaker in intensity compared to TP + MP cooling, surface forcing over the TP region is fundamental to obtain the environmental conditions that produce the atmospheric patterns in the TP + MP experiment. The inclusion of MP cooling then reinforces the circulation anomalies in the western Pacific (see e.g. TEF and zonal-wind anomalies in Fig. 8b–d).
By comparing a selection of CMIP6 historical simulations – the cold Tibetan Plateau (TP) composite – with an idealised AGCM simulation, we show how cold temperatures over central Asian orography influence the winter atmospheric circulation over eastern Asia and the North Pacific. Colder-than-average Asian high plateaux strengthen the tropospheric heat sink and the eastern Asian winter monsoon, corresponding to an intensification of the north-westerly winds and of the downstream cold temperature advection. Over the East China Sea, the enhancement of the advection of cold northerly air from the continent and of the surface heat flux from the ocean contribute to the intensification of the low-level baroclinicity. The results of the idealised experiment show that low-level baroclinic conditions over the East China Sea favour the development of transient atmospheric perturbations which deposit additional eddy momentum on the mean zonal flow, reinforcing the jet stream mainly upstream of the Pacific basin and on its equatorward flank (Hoskins et al., 1983; Hoskins and Valdes, 1990).
We note that the cooling of central Asian orography interestingly corresponds to an overall amplification of the response to the uplift of the orography itself, presented in the works by Shi et al. (2015), Sha et al. (2015) and White et al. (2017). This is in line with the results of the highly idealised study by Ringler and Cook (1999), which shows how the atmospheric response to simple patterns of orographic forcing is amplified (nonlinearly) by superposed cooling.
Building on previous literature that investigates the relative role of the Tibetan and Mongolian plateaux on the downstream winter climate by removing or adding regional orography (Shi et al., 2015; Sha et al., 2015; White et al., 2017), we apply a similar approach to surface temperature forcing. In an additional set of idealised simulations, cold anomalies are confined to the regions of the Mongolian Plateau or of the Tibetan Plateau. The response to Tibetan Plateau cooling only shows a strong resemblance to the response to the total cooling pattern, supporting the fact that the TP region is fundamental for setting atmospheric conditions ideal for the intensification of the eastern Asian winter monsoon and of the Pacific jet, as in the CMIP6 models contributing to the cold TP composite. The response to Mongolian Plateau cooling still consists in a strengthening of the zonal winds over the Pacific and reinforces the atmospheric response to Tibetan Plateau cooling. However, due to weakened advection of cold air to the east of the Tibetan Plateau, the jet intensification is shifted northward with respect to experiments with TP or total surface cooling. We note that a limited superposition of the two regional forcing patterns is present, due to a latitudinal smoothing of the anomalies in the TP forcing experiment.
The influence of eastern Asian surface temperature anomalies on the climate downstream is particularly relevant in the context of climate modelling, since state-of-the-art models are often affected by a cold surface and near-surface temperature bias over eastern Asia (Wei et al., 2014; Gong et al., 2014), which is accentuated over the Tibetan Plateau region (Peng et al., 2022; Fig. 1 in Fan et al., 2020). Limited improvements have been detected, despite the model developments of the recent years (e.g. across CMIP phases; Bock et al., 2020; Lun et al., 2021; Hu et al., 2022). The issue is analysed in considerable detail by Chen et al. (2017), who decompose the surface energy budget over the TP and show that the processes causing surface and low-level cold biases are physically interlinked and involve snow cover (and surface albedo), low-level water vapour content, and downward longwave and shortwave radiation. The anomalies in the low-level heat fluxes ultimately result in a cooling of the boundary layer.
The results of this work suggest that thermal conditions over high central Asian plateaux foster significant changes in the large-scale circulation on the lee side of the orography. Relating this to the cold Tibetan Plateau temperature bias measured across many climate models, it is possible to assert that such a surface anomaly potentially produces atmospheric biases over eastern Asia and the western North Pacific. Specifically, models characterised by colder-than-average temperatures over central Asian plateaux present a strengthening of the eastern Asian winter monsoon, affecting the atmospheric conditions of the highly inhabited eastern coast of China and the Pacific jet. Although not considered in this work, the results also provide a new perspective on elevation-dependent warming (EDW), implying that a stronger warming of Asian orography with respect to other land regions may be important not only for the local climate but also for the mean atmospheric conditions downstream. Further work is needed to assess such an impact of EDW.
Finally, based on the findings here presented, we project that advances in the representation of surface processes over complex orography will improve the modelling of the mean climate downstream of the Asian high plateaux and the inter-model spread in this region, with possible impacts on the confidence of regional multi-model climate projections. Furthermore, within the state-of-the-art of model ensembles (e.g. CMIP6), the “emergent constraints” approach (Hall et al., 2019), applied to the feedback between surface temperatures over orography and the local energy budget, can become a useful means of reducing present uncertainty in eastern Asian climate projections. On a different timescale, works analysing subseasonal-to-seasonal forecasts over eastern Asia find a significant influence by surface anomalies over the Tibetan Plateau (e.g. Li et al., 2018; Xue et al., 2021), implying that shorter-term operational forecasting could also benefit from advances in the modelling of land–atmosphere interaction over central Asian plateaux.
The CMIP6 dataset is publicly available at https://esgf-node.llnl.gov/projects/cmip6/ (WCRP, 2023). Information regarding the downloading of the AGCM SPEEDY can be found at http://users.ictp.it/~kucharsk/speedy-net.html (Molteni, 2003, https://doi.org/10.1007/s00382-002-0268-2).
All authors conceived the study and contributed to the interpretation and discussion of the results. AP performed the analyses and wrote the paper.
The contact author has declared that none of the authors has any competing interests.
Publisher’s note: Copernicus Publications remains neutral with regard to jurisdictional claims in published maps and institutional affiliations.
Alice Portal expresses her gratitude to Gwendal Rivière for insightful discussion and advice. The authors are also thankful to three anonymous reviewers, whose comments and suggestions have contributed to improving the quality of the paper.
This research has been supported by the University of Milano-Bicocca (project no. FAQC 2020-ATESP-0003).
This paper was edited by Yang Zhang and reviewed by three anonymous referees.
Bock, L., Lauer, A., Schlund, M., Barreiro, M., Bellouin, N., Jones, C., Meehl, G., Predoi, V., Roberts, M., and Eyring, V.: Quantifying progress across different CMIP phases with the ESMValTool, J. Geophys. Res.-Atmos., 125, e2019JD032321, https://doi.org/10.1029/2019JD032321, 2020. a
Bolin, B.: On the influence of the earth's orography on the general character of the westerlies, Tellus, 2, 184–195, 1950. a
Broccoli, A. J. and Manabe, S.: The effects of orography on midlatitude Northern Hemisphere dry climates, J. Climate, 5, 1181–1201, 1992. a
Chan, J. C. and Li, C.: The east Asia winter monsoon, in: East Asian Monsoon, 54–106, World Scientific, https://doi.org/10.1142/9789812701411_0002, 2004. a
Charney, J. G. and Eliassen, A.: A numerical method for predicting the perturbations of the middle latitude westerlies, Tellus, 1, 38–54, 1949. a
Chen, X., Liu, Y., and Wu, G.: Understanding the surface temperature cold bias in CMIP5 AGCMs over the Tibetan Plateau, Adv. Atmos. Sci., 34, 1447–1460, 2017. a, b, c, d, e
Chen, Z., Wu, R., and Wang, Z.: Impact of Autumn-Winter Tibetan Plateau Snow Cover Anomalies on the East Asian Winter Monsoon and Its Interdecadal Change, Front. Earth Sci., 9, 569, https://doi.org/10.3389/feart.2021.699358, 2021. a
Clark, M. P. and Serreze, M. C.: Effects of variations in East Asian snow cover on modulating atmospheric circulation over the North Pacific Ocean, J. Climate, 13, 3700–3710, 2000. a, b
Cohen, J., Saito, K., and Entekhabi, D.: The role of the Siberian high in Northern Hemisphere climate variability, Geophys. Res. Lett., 28, 299–302, 2001. a
Drouard, M., Rivière, G., and Arbogast, P.: The link between the North Pacific climate variability and the North Atlantic Oscillation via downstream propagation of synoptic waves, J. Climate, 28, 3957–3976, 2015. a
Duan, A. and Wu, G.: Weakening trend in the atmospheric heat source over the Tibetan Plateau during recent decades. Part I: Observations, J. Climate, 21, 3149–3164, 2008. a
Fan, X., Miao, C., Duan, Q., Shen, C., and Wu, Y.: The performance of CMIP6 versus CMIP5 in simulating temperature extremes over the global land surface, J. Geophys. Res.-Atmos., 125, e2020JD033031, https://doi.org/10.1029/2020JD033031, 2020. a, b
Gong, H., Wang, L., Chen, W., Wu, R., Wei, K., and Cui, X.: The climatology and interannual variability of the East Asian winter monsoon in CMIP5 models, J. Climate, 27, 1659–1678, 2014. a, b
Hahn, D. G. and Manabe, S.: The role of mountains in the south Asian monsoon circulation, J. Atmos. Sci., 32, 1515–1541, 1975. a, b
Hall, A., Cox, P., Huntingford, C., and Klein, S.: Progressing emergent constraints on future climate change, Nat. Clim. Change, 9, 269–278, 2019. a
Held, I. M. and Ting, M.: Orographic versus thermal forcing of stationary waves: The importance of the mean low-level wind, J. Atmos. Sci., 47, 495–500, 1990. a, b
Henderson, G. R., Leathers, D. J., and Hanson, B.: Circulation response to Eurasian versus North American anomalous snow scenarios in the Northern Hemisphere with an AGCM coupled to a slab ocean model, J. Climate, 26, 1502–1515, 2013. a, b, c
Hoskins, B. J. and Karoly, D. J.: The steady linear response of a spherical atmosphere to thermal and orographic forcing, J. Atmos. Sci., 38, 1179–1196, 1981. a
Hoskins, B. J. and Valdes, P. J.: On the existence of storm-tracks, J. Atmos. Sci., 47, 1854–1864, 1990. a
Hoskins, B. J., James, I. N., and White, G. H.: The shape, propagation and mean-flow interaction of large-scale weather systems, J. Atmos. Sci., 40, 1595–1612, 1983. a, b, c
Hu, Q., Hua, W., Yang, K., Ming, J., Ma, P., Zhao, Y., and Fan, G.: An assessment of temperature simulations by CMIP6 climate models over the Tibetan Plateau and differences with CMIP5 climate models, Theor. Appl. Climatol., 148, 223–236, 2022. a, b, c
Jhun, J.-G. and Lee, E.-J.: A new East Asian winter monsoon index and associated characteristics of the winter monsoon, J. Climate, 17, 711–726, 2004. a, b
Kucharski, F., Molteni, F., and Bracco, A.: Decadal interactions between the western tropical Pacific and the North Atlantic Oscillation, Clim. Dynam., 26, 79–91, 2006. a
Kucharski, F., Molteni, F., King, M. P., Farneti, R., Kang, I.-S., and Feudale, L.: On the need of intermediate complexity general circulation models: A “SPEEDY” example, Bull. Am. Meteorol. Soc., 94, 25–30, 2013. a
Li, J., Miao, C., Wei, W., Zhang, G., Hua, L., Chen, Y., and Wang, X.: Evaluation of CMIP6 global climate models for simulating land surface energy and water fluxes during 1979–2014, J. Adv. Model. Earth Sy., 13, e2021MS002515, https://doi.org/10.1029/2021MS002515, 2021. a
Li, W., Guo, W., Qiu, B., Xue, Y., Hsu, P.-C., and Wei, J.: Influence of Tibetan Plateau snow cover on East Asian atmospheric circulation at medium-range time scales, Nat. Commun., 9, 1–9, 2018. a, b
Liu, L., Zhang, W., Lu, Q., and Wang, G.: Variations in the Sensible Heating of Tibetan Plateau and Related Effects on Atmospheric Circulation Over South Asia, Asia-Pac. J. Atmos. Sci., 57, 499–510, 2021. a
Lun, Y., Liu, L., Cheng, L., Li, X., Li, H., and Xu, Z.: Assessment of GCMs simulation performance for precipitation and temperature from CMIP5 to CMIP6 over the Tibetan Plateau, Int. J. Climatol., 41, 3994–4018, 2021. a, b, c
Manabe, S. and Terpstra, T. B.: The effects of mountains on the general circulation of the atmosphere as identified by numerical experiments, J. Atmos. Sci., 31, 3–42, 1974. a
Molteni, F.: Atmospheric simulations using a GCM with simplified physical parametrizations. I: Model climatology and variability in multi-decadal experiments, Clim. Dynam., 20, 175–191, https://doi.org/10.1007/s00382-002-0268-2, 2003 (code available at: http://users.ictp.it/~kucharsk/speedy-net.html). a
Peng, Y., Duan, A., Hu, W., Tang, B., Li, X., and Yang, X.: Observational constraint on the future projection of temperature in winter over the Tibetan Plateau in CMIP6 models, Environ. Res. Lett., 17, 034023, https://doi.org/10.1088/1748-9326/ac541c, 2022. a, b
Portal, A., Pasquero, C., D'Andrea, F., Davini, P., Hamouda, M. E., and Rivière, G.: Influence of Reduced Winter Land–Sea Contrast on the Midlatitude Atmospheric Circulation, J. Climate, 35, 2637–2651, 2022. a, b, c
Priestley, M. D., Ackerley, D., Catto, J. L., Hodges, K. I., McDonald, R. E., and Lee, R. W.: An overview of the extratropical storm tracks in CMIP6 historical simulations, J. Climate, 33, 6315–6343, 2020. a
Priestley, M. D., Ackerley, D., Catto, J. L., and Hodges, K. I.: Drivers of biases in the CMIP6 extratropical storm tracks. Part 1: Northern Hemisphere, J. Climate, 36, 1–37, 2022. a
Rayner, N., Parker, D. E., Horton, E., Folland, C. K., Alexander, L. V., Rowell, D., Kent, E. C., and Kaplan, A.: Global analyses of sea surface temperature, sea ice, and night marine air temperature since the late nineteenth century, J. Geophys. Res.-Atmos., 108, 4407, https://doi.org/10.1029/2002JD002670, 2003. a
Ringler, T. D. and Cook, K. H.: Understanding the seasonality of orographically forced stationary waves: Interaction between mechanical and thermal forcing, J. Atmos. Sci., 56, 1154–1174, 1999. a, b
Sato, T.: Influences of subtropical jet and Tibetan Plateau on precipitation pattern in Asia: Insights from regional climate modeling, Quatern. Int., 194, 148–158, 2009. a
Schemm, S., Wernli, H., and Binder, H.: The storm-track suppression over the western North Pacific from a cyclone life-cycle perspective, Weather Clim. Dynam., 2, 55–69, https://doi.org/10.5194/wcd-2-55-2021, 2021. a
Sha, Y., Shi, Z., Liu, X., and An, Z.: Distinct impacts of the Mongolian and Tibetan Plateaus on the evolution of the East Asian monsoon, J. Geophys. Res.-Atmos., 120, 4764–4782, 2015. a, b, c, d, e, f, g
Shi, Z., Liu, X., Liu, Y., Sha, Y., and Xu, T.: Impact of Mongolian Plateau versus Tibetan Plateau on the westerly jet over North Pacific Ocean, Clim. Dynam., 44, 3067–3076, 2015. a, b, c, d, e, f, g
Smagorinsky, J.: The dynamical influence of large-scale heat sources and sinks on the quasi-stationary mean motions of the atmosphere, Q. J. Roy. Meteor. Soc., 79, 342–366, 1953. a
Su, F., Duan, X., Chen, D., Hao, Z., and Cuo, L.: Evaluation of the global climate models in the CMIP5 over the Tibetan Plateau, J. Climate, 26, 3187–3208, 2013. a
Ting, M.: The stationary wave response to a midlatitude SST anomaly in an idealized GCM, J. Atmos. Sci., 48, 1249–1275, 1991. a
Trenberth, K. E.: Interactions between orographically and thermally forced planetary waves, J. Atmos. Sci., 40, 1126–1153, 1983. a, b
Wei, K., Xu, T., Du, Z., Gong, H., and Xie, B.: How well do the current state-of-the-art CMIP5 models characterise the climatology of the East Asian winter monsoon?, Clim. Dynam., 43, 1241–1255, 2014. a, b, c, d
White, R., Battisti, D., and Roe, G.: Mongolian mountains matter most: Impacts of the latitude and height of Asian orography on Pacific wintertime atmospheric circulation, J. Climate, 30, 4065–4082, 2017. a, b, c, d, e, f
Wilks, D. S.: Statistical methods in the atmospheric sciences, Vol. 100, Academic Press, ISBN 0127519661, 2011. a, b
Wu, G., Duan, A., Liu, Y., Mao, J., Ren, R., Bao, Q., He, B., Liu, B., and Hu, W.: Tibetan Plateau climate dynamics: recent research progress and outlook, Natl. Sci. Rev., 2, 100–116, 2015. a
WCRP: WCRP Coupled Model Intercomparison Project (Phase 6), WCRP [data set], https://esgf-node.llnl.gov/projects/cmip6/, last access: 1 September 2023.
Xue, Y., Yao, T., Boone, A. A., Diallo, I., Liu, Y., Zeng, X., Lau, W. K. M., Sugimoto, S., Tang, Q., Pan, X., van Oevelen, P. J., Klocke, D., Koo, M.-S., Sato, T., Lin, Z., Takaya, Y., Ardilouze, C., Materia, S., Saha, S. K., Senan, R., Nakamura, T., Wang, H., Yang, J., Zhang, H., Zhao, M., Liang, X.-Z., Neelin, J. D., Vitart, F., Li, X., Zhao, P., Shi, C., Guo, W., Tang, J., Yu, M., Qian, Y., Shen, S. S. P., Zhang, Y., Yang, K., Leung, R., Qiu, Y., Peano, D., Qi, X., Zhan, Y., Brunke, M. A., Chou, S. C., Ek, M., Fan, T., Guan, H., Lin, H., Liang, S., Wei, H., Xie, S., Xu, H., Li, W., Shi, X., Nobre, P., Pan, Y., Qin, Y., Dozier, J., Ferguson, C. R., Balsamo, G., Bao, Q., Feng, J., Hong, J., Hong, S., Huang, H., Ji, D., Ji, Z., Kang, S., Lin, Y., Liu, W., Muncaster, R., de Rosnay, P., Takahashi, H. G., Wang, G., Wang, S., Wang, W., Zhou, X., and Zhu, Y.: Impact of Initialized Land Surface Temperature and Snowpack on Subseasonal to Seasonal Prediction Project, Phase I (LS4P-I): organization and experimental design, Geosci. Model Dev., 14, 4465–4494, https://doi.org/10.5194/gmd-14-4465-2021, 2021. a, b
Xue, Y., Diallo, I., Boone, A. A., Yao, T., Zhang, Y., Zeng, X., Neelin, J. D., Lau, W. K., Pan, Y., Liu, Y., and Pan, X.: Spring Land Temperature in Tibetan Plateau and Global-Scale Summer Precipitation–Initialization and Improved Prediction, Bull. Am. Meteorol. Soc., 103, E2756–E2767, https://doi.org/10.1175/BAMS-D-21-0270.1, 2022. a
Yanai, M. and Wu, G.-X.: Effects of the Tibetan plateau, in: The Asian Monsoon, Springer, 513–549, ISBN 3540406107, 2006. a
Yanai, M., Li, C., and Song, Z.: Seasonal heating of the Tibetan Plateau and its effects on the evolution of the Asian summer monsoon, J. Meteorol. Soc. Jpn., 70, 319–351, 1992. a, b, c
Ye, D.-Z. and Wu, G.-X.: The role of the heat source of the Tibetan Plateau in the general circulation, Meteorol. Atmos. Phys., 67, 181–198, 1998. a
Yeh, T., Wetherald, R., and Manabe, S.: A model study of the short-term climatic and hydrologic effects of sudden snow-cover removal, Mon. Weather Rev., 111, 1013–1024, 1983. a
Yihui, D. and Chan, J. C.: The East Asian summer monsoon: an overview, Meteorol. Atmos. Phys., 89, 117–142, 2005. a
Zhang, Y., Sperber, K. R., and Boyle, J. S.: Climatology and interannual variation of the East Asian winter monsoon: Results from the 1979–95 NCEP/NCAR reanalysis, Mon. Weather Rev., 125, 2605–2619, 1997. a
The EAPE parameters and depend on pressure (R is the gas constant, ps is 1000 hPa, Cp is the specific heat of the air at constant pressure) and on the potential temperature climatology θcl.