the Creative Commons Attribution 4.0 License.
the Creative Commons Attribution 4.0 License.
 | 03 Nov 2023
Exploring hail and lightning diagnostics over the Alpine-Adriatic region in a km-scale climate model
Nikolina Ban
Marie-Estelle Demory
Raffael Aellig
Oliver Fuhrer
Jonas Jucker
Xavier Lapillonne
Christoph Schär
The north and south of the Alps, as well as the eastern shores of the Adriatic Sea, are hot spots of severe convective storms, including hail and lightning associated with deep convection. With advancements in computing power, it has become feasible to simulate deep convection explicitly in climate models by decreasing the horizontal grid spacing to less than 4 km. These kilometer-scale models improve the representation of orography and reduce uncertainties associated with the use of deep convection parameterizations.
In this study, we perform km-scale simulations for eight observed cases of severe convective storms (seven with and one without observed hail) over the Alpine-Adriatic region. The simulations are performed with the climate version of the regional model Consortium for Small-scale Modeling (COSMO) that runs on graphics processing units (GPUs) at a horizontal grid spacing of 2.2 km. To analyze hail and lightning we have explored the hail growth model (HAILCAST) and lightning potential index (LPI) diagnostics integrated with the COSMO-crCLIM model.
Comparison with available high-resolution observations reveals good performance of the model in simulating total precipitation, hail, and lightning. By performing a detailed analysis of three of the case studies, we identified the importance of significant meteorological factors for heavy thunderstorms that were reproduced by the model. Among these are the moist unstable boundary layer and dry mid-level air, the topographic barrier, as well as an approaching upper-level trough and cold front. Although COSMO HAILCAST tends to underestimate the hail size on the ground, the results indicate that both HAILCAST and LPI are promising candidates for future climate research.
- Article
(14288 KB) - Full-text XML
- BibTeX
- EndNote


Deep convective storms are ubiquitous worldwide, and severe convective events may be accompanied by hailstorms, lightning, wind gusts, and flash floods that lead to significant damage. For example, small hailstones can damage crops and vineyards, while larger hailstones can damage roofs and buildings, resulting in considerable economic and (re-)insured losses (e.g., Punge and Kunz, 2016). The damage from individual hailstorms in Europe and the United States can exceed USD 1 billion (Púčik et al., 2019). Therefore, it is essential to understand the spatial and temporal characteristics and associated mechanisms of such severe convective storms and their potential change with the further warming of the atmosphere.
The Alpine-Adriatic region encompasses the Alps, including their southeastern extension along the Adriatic Sea. It is recognized as one of the regions at high risk of experiencing thunderstorms in Europe due to its notable topography and proximity to the Mediterranean Sea (Punge and Kunz, 2016). Using 15 years of radar-based observations between 2002 and 2016, Nisi et al. (2016, 2018) identified enhanced frequency of hail days along the foothills of the Alps in the northern and southern pre-Alpine region, the Jura mountains, southern Germany, and the Bavarian Alps. In contrast, over the highest part of the Alps, severe hailstorms rarely occur (Punge and Kunz, 2016). Situated over the eastern shore of the Adriatic Sea, Croatia is also exposed to frequent hail events. Using 11 000 reports from hail stations in the period of 1981–2006, Počakal et al. (2009) identified the highest average number of hail days over the northern region in the continental part of Croatia, which is located between several mountains. Also, longer hail fall duration and larger hail diameters were found in the areas around the mountains compared to the flat eastern part of Croatia. However, owing to difficulties in observing and modeling such events, it remains a challenge to understand the characteristics and mechanisms of such severe convective storms.
Due to the rarity, the local-scale of hail events and the sparseness of stations, hailstorms are not well captured by ground-based observations. Hailpad networks are one of the options that provide information about hail size, mass, and kinetic energy, but they are only available in limited hail-prone areas (Schmid et al., 1992; Počakal et al., 2009; Jelić et al., 2020). Another option to retrieve information on hailstones is the use of weather radars. Algorithms based on radar reflectivity have successfully quantified precipitation amounts and the occurrence and properties of hail (Germann et al., 2022). Radar provides continuous information about the spatial and temporal distributions of hail on a national scale, for example, over the contiguous United States (Cintineo et al., 2012) and the Alpine region (Nisi et al., 2016, 2018; Barras et al., 2021). These studies indicate that the combination of ground-based hailpads and radar-based products can provide valuable information for hail analysis on weather and climate time scales and support the evaluation of models.
Although severe convective storms can cause catastrophic damage, important processes, such as hail growth (Adams-Selin, 2023) and lightning processes (Fierro et al., 2013), for predicting hail and lightning are insufficiently represented in weather and climate models. The key ingredients of severe thunderstorms are conditional instability often associated with high convective available potential energy (CAPE), sufficient low-level moisture, lifting mechanisms that trigger the development of storms, and wind shear that can promote the storm organization and intensification of updrafts (e.g., Markowski and Richardson, 2010). The combination of CAPE with other parameters, such as precipitation rate (Romps et al., 2014) or a 0–6 km deep wind shear (e.g., Seeley and Romps, 2015), has been used to identify atmospheric conditions prone to severe convective storms. Furthermore, over complex topography, additional thermodynamic and kinematic mechanisms may also affect the initiation and development of convection. For example, Kalthoff et al. (2009) used sodar, lidar, and aircraft data to investigate the 15 July 2007 storm that occurred east of the Black Forest in Germany and identified several triggering mechanisms. High insolation during the day contributed to large latent heat fluxes, resulting in moisture accumulation within the valley. This moisture was subsequently transported to the mountain crest via upvalley winds. Strong updraughts nearly reached the level of free convection when a mesoscale convergence zone arrived and superposed with the stationary thermally induced convergence. Trefalt et al. (2018) found that the convection initiation on 6 June 2015 in the northern Swiss Prealps was associated with strong convergence at mountain tops that propagated via cold air outflow downslope to the valley. Convergence areas commonly have a width of about 1–2 km (Baldauf et al., 2011), so a fine and adequate representation of the convergence strength and updrafts is required to simulate a severe convective storm and investigate the driving mechanisms. At the same time, convection can be influenced and modulated by fronts, upper-level troughs, cold pools, and terrain effects. Therefore, the processes involved in each convective storm that occurs in different regions and under different synoptic situations can be very different and require specific case studies (Luo et al., 2020).
In the past decade, climate simulations at the kilometer-scale grid spacing started to emerge. The main advantages of running a model at such a high resolution are a better representation of orography and that there is no need for a deep convection parameterization, which is often associated with large uncertainties in climate simulations (Prein et al., 2015; Leutwyler et al., 2016; Ban et al., 2021). Such km-scale simulations lead to improved representation of the diurnal cycle of precipitation, heavy precipitation, clouds, snow, and local winds (Ban et al., 2021; Pichelli et al., 2021; Hentgen et al., 2019; Lüthi et al., 2019; Belušić et al., 2018). Still, hail and lightning are commonly not resolved or diagnosed in such models because of the complicated hail growth processes and electrification mechanisms that would make the models too expensive for climate simulations. The need to understand, predict, and project hail and lightning have led to the development of diagnostic tools such as the hail growth model HAILCAST (Adams-Selin and Ziegler, 2016) and the lightning potential index (LPI) (Lynn and Yair, 2010). Such diagnostics implemented in km-scale models take advantage of a more realistic representation of convection and micro-physical processes and provide information on hail and lighting without a significant increase in the computational cost of simulations. Comparison with observations shows that the HAILCAST diagnostic is a good indicator of the hailstone sizes at the ground (Adams-Selin et al., 2019; Malečić et al., 2022), and LPI is highly correlated with the observed lightning flashes (Yair et al., 2010) when the convection is well simulated. There are some models that include a more sophisticated treatment of hail and lightning processes. For instance, Meso-NH supports an explicit treatment of lightning, which represents the life cycle of the electric charges from generation to neutralization via lightning flashes, and a two-moment aerosol-could-microphysics scheme (Lac et al., 2018). Such simulations are far more expensive and currently not yet suited for simulations over climate time scales in large computational domains.
In this study, we use the Consortium for Small-scale Modeling (COSMO) model with HAILCAST and LPI diagnostics and available observations to explore severe convective storms over the Alpine Adriatic region. The specific objectives of the study are:
-
Evaluate the performance of the COSMO model at km-scale grid spacing in simulating hail and lightning.
-
Explore how the COSMO model represents storm environments through case studies.
To address the above objectives, we simulate eight cases of severe convective storms (including moderate to severe hailstorms and one no-hail storm) over the Alpine-Adriatic region that occurred in the period from 2009 to 2018 under different synoptic conditions.
The paper is structured as follows. Section 2 describes the model configurations and diagnostics together with the available observations and validation methods. Section 3.1 presents the eight selected cases with observed severe weather over the Alpine-Adriatic region. Section 3.2 evaluates the performance of HAILCAST and LPI. Section 3.4 analyzes the results for three selected cases to understand the drivers of such events and how they are represented in the model. Finally, Sect. 4 presents a summary of the results with a discussion of the potential use of HAILCAST and LPI diagnostics in future climate simulations.
2.1 Model description
The simulations are performed with the climate version of the non-hydrostatic COSMO model (Baldauf et al., 2011). More specifically, we use COSMO-crCLIM, a version of COSMO that is able to run on hybrid CPU-GPU architectures (Leutwyler et al., 2017; Schär et al., 2020). Hereafter, we refer to COSMO-crCLIM as COSMO for simplicity. The simulations are conducted following a two-step, one-way nesting approach with a horizontal grid spacing of 12 km for the first nest and 2.2 km for the second nest (Fig. 1a). The simulations are driven by the ERA5 reanalysis (Hersbach et al., 2020) with a boundary updating interval of 1 h. Both domains are discretized with 60 terrain-following hybrid vertical levels, where vertical spacing ranges from 20 m near the surface to about 1.2 km at the model top are located at around 23.5 km above mean sea level.
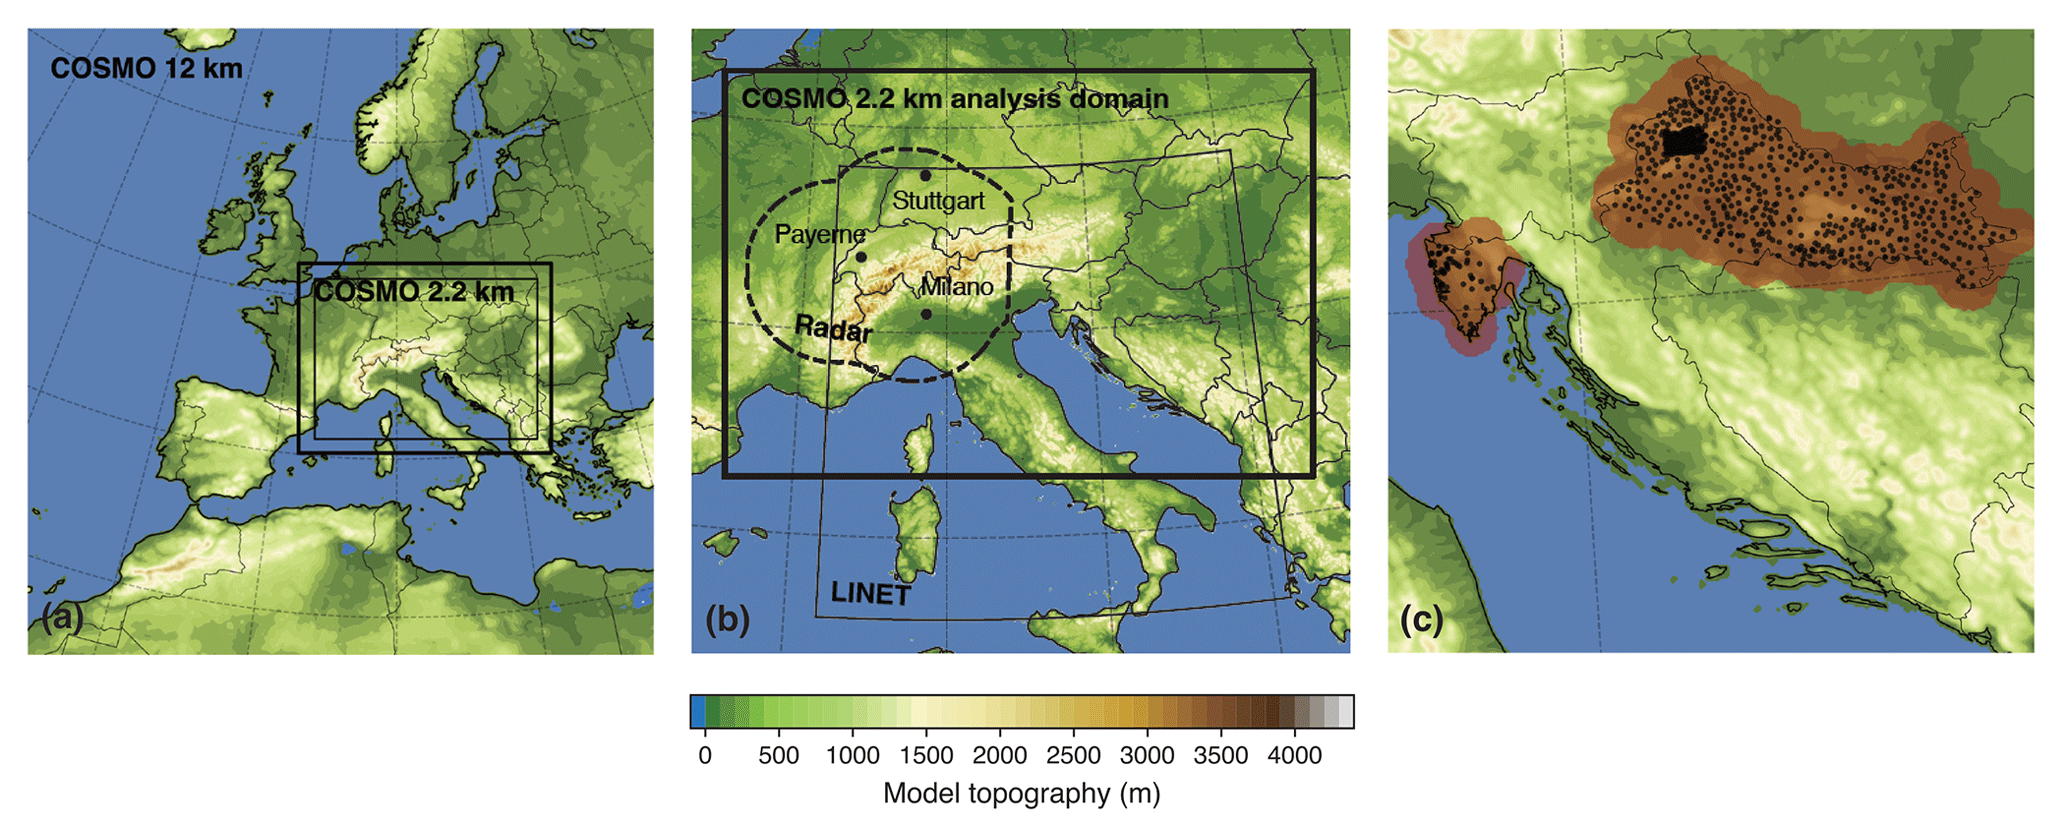
Figure 1COSMO model topography, analysis domains, and observational coverage. (a) Computational domains for the simulations with 12 and 2.2 km grid spacing. The innermost box denotes the analysis domain. (b) COSMO 2.2 km analysis domain (thick solid line), LINET lightning observations (thin line), radar-based hail observations (dashed line). Black dots represent the three sounding stations used in this study: Payerne, Milan, and Stuttgart. (c) Available hailpad measurements over Croatia (black dots). A dense hailpad polygon (150 hailpads aligned with a distance of around 2 km between hailpads) is located in the northwestern part of Croatia. The red-shaded area indicates the region used to evaluate hail simulated by COSMO HAILCAST.
From the parameterization packages, we apply a single-moment bulk microphysics scheme with prognostic cloud water, cloud ice, graupel, rain, and snow (Reinhardt and Seifert, 2006), and a radiation scheme with a δ-two-stream approach (Ritter and Geleyn, 1992). For the outer 12 km domain, the Tiedtke (1989) convection scheme is turned on for shallow convection and switched off for deep and mid-level convection following Vergara-Temprado et al. (2020). For the inner 2.2 km domain, the convection parameterization scheme is switched off entirely to resolve the convection processes explicitly as far as feasible.
2.2 HAILCAST – hail growth model
The COSMO model is run with the HAILCAST module, a diagnostic hail growth model that predicts the size of hailstones falling to the ground. It was originally a 1D coupled cloud and hail model developed by Poolman (1992) and further improved by Brimelow et al. (2002) and Adams-Selin and Ziegler (2016). The HAILCAST version used in this study is adopted from WRF-HAILCAST (Adams-Selin and Ziegler, 2016). If the grid column or any adjacent grid columns has a maximum updraft exceeding 10 m s−1 between the previous and current model time steps, the updraft duration field is incremented by one model time step. This field is used to track the convective cells and limit the maximum updraft time in the hail model. HAILCAST activates when the updraft velocity is larger than 10 m s−1 and the updraft duration is more than 15 min. At that point, the vertical profile at the given model time step is passed to HAILCAST, which then calculates the evolution of five hail embryos selected based on microphysical considerations. Two embryos of 5 and 7.5 mm in diameter are initialized at −8 ∘C level, and three embryos of 5, 7.5, and 10 mm in diameter are initialized at −13 ∘C. HAILCAST is activated every 5 min in the inner COSMO 2.2 km domain. The hourly maximum hailstone diameter among the five prescribed hail embryos is stored at hourly output intervals, providing information on hail swaths and the maximum expected hail size over an hour.
2.3 LPI – lightning potential index
The lightning potential index (LPI, J kg−1) is a measure of the potential for charge generation and separation that leads to lightning flashes in thunderstorms (Lynn and Yair, 2010; Yair et al., 2010). It considers the separation region of clouds within the main charging zone (0 to −20 ∘C), where the contribution of non-inductive mechanisms is the most efficient. Non-inductive mechanisms refer to the rebounding collisions between cloud ice crystals and graupel particles under the presence of supercooled liquid water (Takahashi, 1978). We use the updated LPI version after Brisson et al. (2021):
with
and
where qc, qr, qi, qs, and qg are the mixing ratios of cloud water, rain water, cloud ice, snow, and graupel, respectively. g(w) is a boolean function equal to 1 when vertical velocity w≥ 0.5 m s−1, and 0 otherwise. ε is a dimensionless number that has a value between 0 and 1, and it scales the cloud updrafts and reaches the maximum when the vertically averaged mixing ratios of liquid (qL) and combined ice (qF) species are equal. Thus, the LPI is non-zero when liquid water and ice species co-exist in the grid boxes with updraft velocity above 0.5 m s−1, a threshold that identifies the growth phase of the thunderstorm. However, this chosen threshold generates many LPI signals. To overcome this issue two Boolean functions f1 and f2 are included to filter out weak and noisy LPI signals caused by isolated single-grid-column updrafts (f1) and to filter out false LPI signals in strong orographic gravity wave clouds (f2) following Brisson et al. (2021). f1 is TRUE if more than 50 % of grid boxes in a surrounding area of 10 × 10 km2 have an updraft larger than (or equal to) a threshold wmax. The threshold wmax is somehow arbitrary (see Brisson et al., 2021) and depends on the grid spacing used. In our application, we have set it to 2 m s−1, which showed a reasonable distribution of LPI. However, this threshold is slightly different from 1.1 m s−1 used by Brisson et al. (2021) with a grid spacing of 2.8 km. Note that these values are much lower than what is observed in the real world due to the simulated wider convective clouds and weaker updrafts, given that the 2.2 km grid spacing is high but not to a level that matches reality. f2 is TRUE if a column integrated buoyancy (see Eq. 16 in Brisson et al., 2021) in a surrounding area of 20 × 20 km2 is larger than (or equal to) −1500 J kg−2. As for wmax, this threshold is also arbitrary, but in this case, we did not do any additional test and simply used the one recommended by Brisson et al. (2021). Thus, for more detail on these functions and choices, please see Brisson et al. (2021). LPI is calculated every 15 min in the COSMO 2.2 km simulations, and it is saved as an hourly maximum.
2.4 Observational datasets
2.4.1 Precipitation observations
The Integrated Multi-satellitE Retrievals for Global Precipitation Measurement (IMERG, Huffman et al., 2019) dataset is used to validate the simulated total precipitation. It has a grid spacing of 0.1∘ (≈ 10 km) and is available at half hourly time frequency. The IMERG data covers our entire analysis domain, including oceans that lack in-situ precipitation measuring instruments.
In addition to IMERG, we use a gridded precipitation dataset, RhiresD, available over Switzerland only (Wüest et al., 2010). It provides daily accumulated precipitation based on a high-density rain gauge network – including 430 gauges in Switzerland. The data is available at a horizontal grid spacing of 2 km. The dataset suffers from a general tendency to overestimate light precipitation and underestimate intense precipitation due to interpolation uncertainty. The uncertainty is higher in data-sparse areas and in cases of high spatial variations (e.g., convective precipitation).
2.4.2 Hail observations
Simulated hail is evaluated against in-situ and remote radar-based observations. In-situ observations include crowd-sourced hail reports collected from the MeteoSwiss weather app (2015 to present, Barras et al., 2019) and hailpad observations retrieved from three networks located in Croatia (Fig. 1c; Počakal et al., 2009; Malečić et al., 2022). MeteoSwiss crowd-sourced data provides information on the time, location, and size of the observed hail collected by the users of the MeteoSwiss App. The user can choose the hail size from predefined hailstone size categories: “coffee bean (0–15 mm)”, “1 Swiss Franc (CHF) coin (15–27 mm)”, “5 CHF coin (27–32 mm)”, and “> 5 CHF coin (> 32 mm)”. The size category was updated in September 2017 to include a “< coffee bean (0–5 mm)” category (to differentiate between graupel and hail), updated “coffee bean (5–15 mm)”, and “5 CHF coin (27–37 mm)”, and added two new categories “golf ball (37–55 mm)” and “tennis ball (> 55 mm)”. More details can be found in Table 1 of Barras et al. (2019).
Hailpads provide information about the number and diameters of hailstones that hit the measuring plate. The hailpad networks in Croatia include (i) stations in the continental part of Croatia (590 hail stations with a mean distance of about 5.5 km between hailpads), (ii) the hailpad polygon in the western part of Zagorje (150 hailpads with an equidistant spacing of 2 km), and (iii) the hailpad network installed in Istria (67 hailpads) (Fig. 1c). It should be noted that hailpad observations do not report hail sizes smaller than 5 mm.
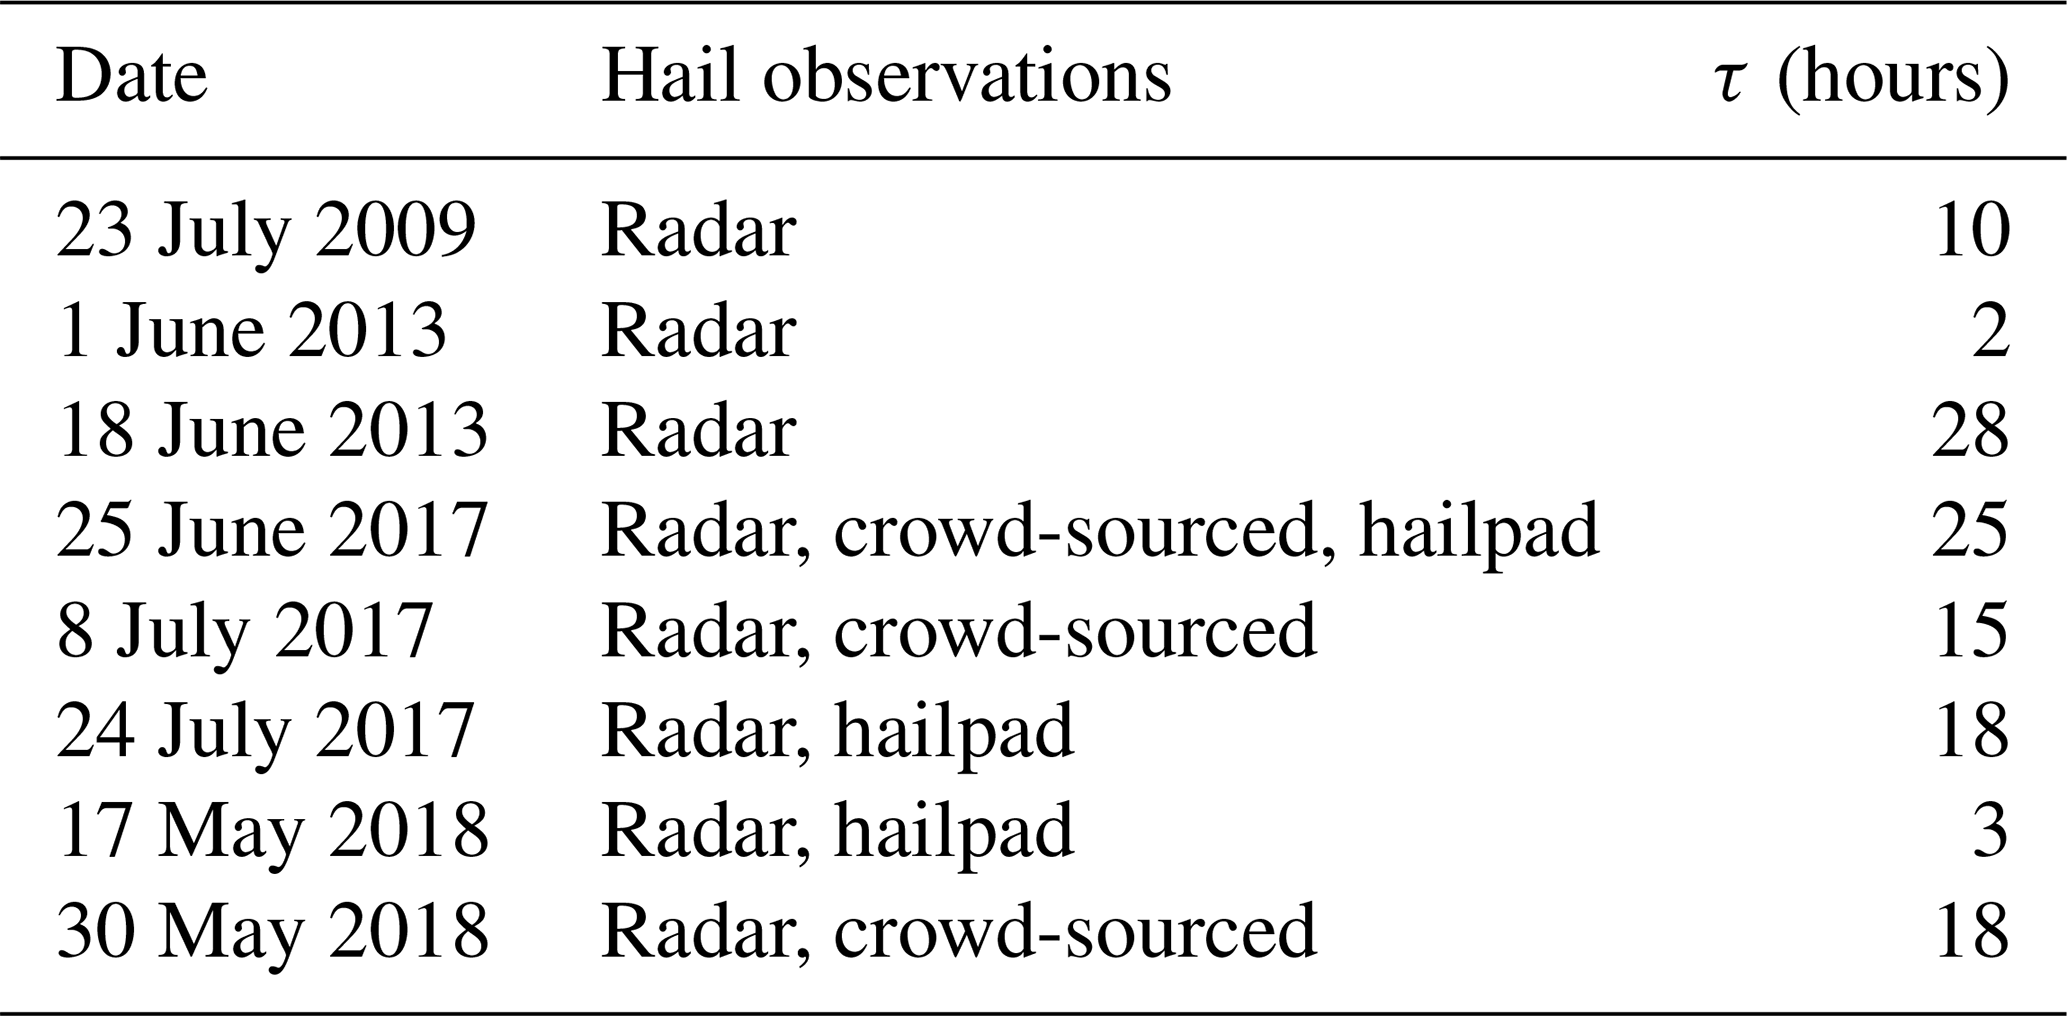
Two radar-based hail products are used to analyze hail swaths over the complex topography of the Alpine region (Fig. 1b): probability of hail (POH) and maximum expected severe hail size (MESHS) (Nisi et al., 2016). POH is a measure of the likelihood of hail occurrence and ranges from 0 % to 100 %. Using insurance loss reports, Nisi et al. (2016) found that when POH equals or exceeds 80 %, a day can be considered as hail day. The same threshold is used by Meteoswiss Swiss Hail Climatology Project and in the current study. MESHS estimates the largest expected hail diameter starting at 20 mm (Nisi et al., 2016). Both products are available on a spatial grid of 1 × 1 km2 and every 5 min and cover the area of Switzerland and the surrounding area. They rely on the third-generation C-band radars in operation since 2002 and were later replaced with dual-polarization radars between 2011 and 2012 (Nisi et al., 2018). The algorithms require information on the freezing-level height () provided by the MeteoSwiss weather forecasts using COSMO. POH considers the vertical distance between the highest radar reflectivity of at least 45 dBZ and (Waldvogel et al., 1979; Foote et al., 2005), while MESHS considers the vertical distance between 50 dBZ and (Treloar, 1998; Joe et al., 2004). The availability of the hail data differs between the analyzed cases, so we list which hail observations are considered for each of the cases in Table 1.
2.4.3 Lightning flashes
Simulated LPI is validated against a lightning detection network (LINET) that covers large parts of Europe (Fig. 1b; Betz et al., 2009). It has the capability to detect the total number and location of lightning strikes, where cloud-to-ground strokes, in-cloud, and cloud-to-cloud discharges are included. LINET has an average location accuracy of approximately 150 m (Betz et al., 2009). The LINET data used here is taken from Jelić et al. (2021), in which the total lightning is gridded at 3 km grid spacing with a temporal resolution of 2 min. Higher temporal resolution and spatial resolutions are possible, but due to high computational and storage demands, we use this 2D database. Nonetheless, it still provides sufficient information to discern local characteristics. Later, we aggregated the LINET lightning flashes every hour to compare against the simulated hourly maximum LPI.
2.4.4 Diagnostic radar reflectivity
The COSMO model provides a diagnostic forward operator to derive an estimate of radar reflectivity. This tool will be used in some diagrams to visualize the thunderstorm development. However, it should be noted that this tool does not account for all aspects that contribute to radar reflectivity; for instance, it does not generate the bright band near the melting level. For these reasons, we have not used it as a validation product.
2.4.5 Atmospheric soundings
To further explore the atmospheric environments, we use data from three sounding stations (Fig. 1b) located at Payerne (Switzerland), Milan (Italy), and Stuttgart (Germany). Data is obtained from the University of Wyoming's online archive (https://weather.uwyo.edu/upperair/sounding.html, last access: 20 October 2023). The soundings are available at 00:00 and 12:00 UTC.
2.5 Analysis methods
We evaluate daily accumulated total precipitation against IMERG using an object-based verification method. For a fair comparison, both observations and model outputs are interpolated to the same grid spacing of 12 km (Fig. 1b). We use the SAL (structure-amplitude-location) method proposed by Wernli et al. (2008) to evaluate the model performance. The A component is calculated as the normalized difference between the domain-averaged observed and simulated fields. A positive (negative) A component indicates an overestimation (underestimation) by the model. The L component considers the displacement of the center of mass between the observed and simulated fields, as well as the weighted average distance between individual objects and the mass center of the total field. Lower L values indicate a more accurate placement of the simulated field. The S component accounts for the size and shape of the objects. Positive (negative) S values suggest a more widespread (peaked) simulated field. The computation requires the identification of precipitation objects within the analysis domain, separately for the observed and simulated fields. An object is defined as the grid points above the threshold of of the maximum value of precipitation within the domain as suggested in Wernli et al. (2008). As a result, the influence of interpolation on the result is rather small.
For each case, we have estimated whether the atmospheric instability was generated by local conditions or synoptic atmospheric processes. This classification depends on the convection adjustment scale τ, which is derived using the precipitation rate P (kg m−2 s−1) and CAPE according to the following equation (Keil et al., 2013):
where the change of CAPE due to the release of latent heat dCAPE dt is estimated from precipitation rate P. Reference values of density (ρ= 1.292 kg m−3), temperature (T0= 273.15 K), specific heat of air at constant pressure (cp), latent heat of vaporization (Lv), and acceleration due to gravity (g) are taken. τ considers the timescale within which CAPE is removed by convection. For the calculation of τ, we use the hourly domain-averaged CAPE and total precipitation from ERA5 (same domain as in Fig. 2) and calculate the daily maximum τ for each case, as it must be calculated over a region large enough to smooth the variability from individual clouds. Keil et al. (2013) suggests that if τ is shorter than 12 h, the atmospheric instability is governed by the synoptic conditions, and the event is then classified as strong synoptic forcing. A larger τ (> 12 h), however, indicates that the convection is driven by high local CAPE values, in which case the event is classified as weak synoptic forcing. We should note that the threshold between weak and strong synoptic forcing varies in the literature (see, e.g., Zimmer et al., 2011), and should thus not be taken strictly, especially for the cases close to it. Here, we just use it as an indication of prevailing conditions.
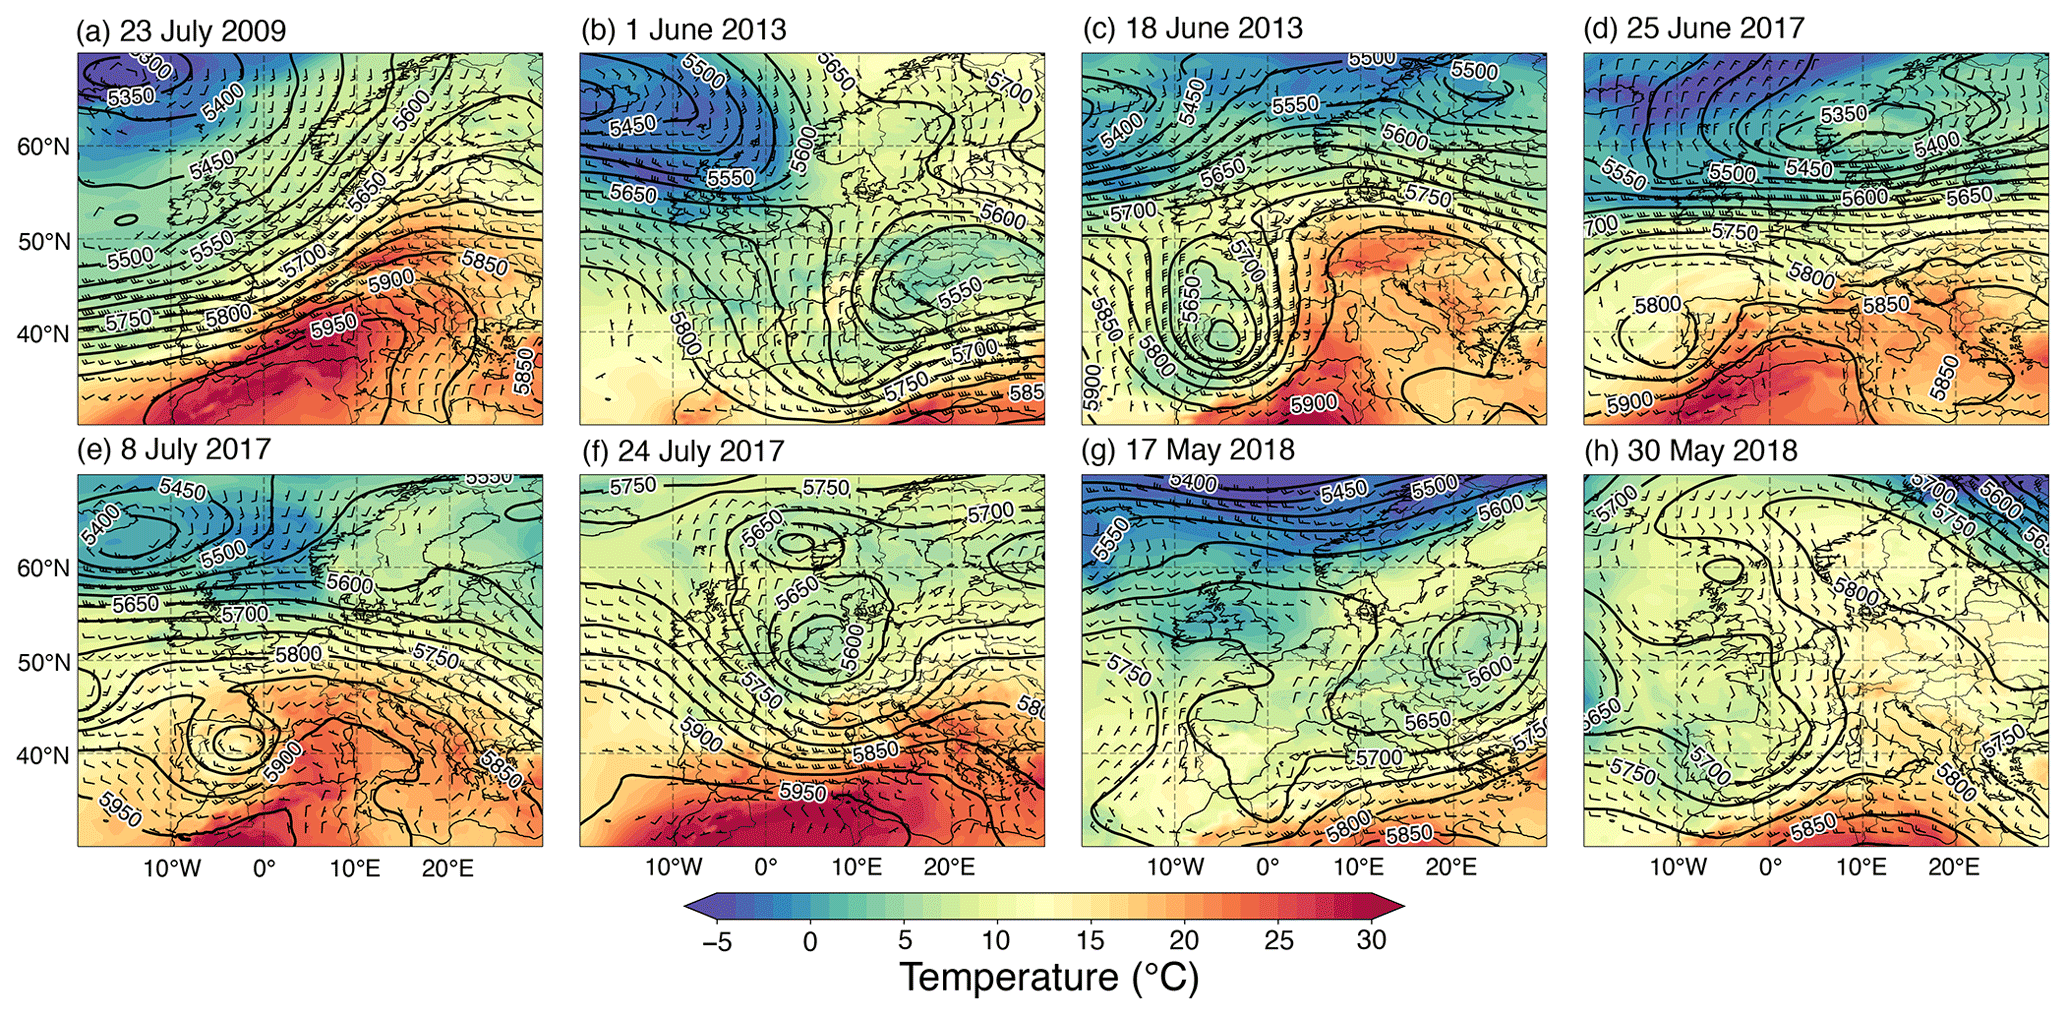
Figure 2Synoptic overview of the eight cases considered in this paper. Panels show geopotential height at 500 hPa (m, black contours), temperature at 850 hPa (∘C, shaded), and wind barbs at 500 hPa obtained from ERA5 reanalysis at 12:00 UTC on the day when the respective case was observed.
3.1 Synoptic overview of selected cases
In this study, we simulate and analyze eight cases of observed severe convective storms covering different synoptic situations (Fig. 2). The following cases are selected according to the severity of their impacts (e.g., the size of hailstones, number of lightning strikes, and cost of damages):
-
23 July 2009. Severe hailstorms occurred over eastern and central Switzerland and caused damage to buildings amounting to around CHF 261 million in Switzerland (NCCS, 2021). The weather over Central Europe was dominated by a southwesterly flow and large temperature contrasts (Fig. 2a). Strong lifting associated with a cold front resulted in severe thunderstorms, leading to several long hail swaths that can be seen in radar observations (Fig. 5a).
-
1 June 2013. Warm and humid air transported from the northeast towards the Alps encountered cool air from the west (Fig. 2b). The event produced heavy rain (without hail) in a very narrow band near the foothills of the Alps and caused water discharges with return periods of 10 to 30 years reported from several weather stations in central and eastern Switzerland (FEON, 2013; Grams et al., 2014). We selected this event to evaluate the ability of the model to simulate heavy rain without hail.
-
18 June 2013. A low-pressure system was situated over the Bay of Biscay (Fig. 2c) and brought warm and moist unstable air masses to central Europe with very large CAPE (not shown). Several localized and short-lived thunderstorm cells developed in the afternoon to the east of this system. Hailstones observed near Zurich caused massive localized damage estimated at CHF 15 million according to the building insurance of the Canton of Zürich (Gebäudeversicherung Kanton Zürich, GVZ, 2013).
-
25 June 2017. This event is characterized by heavy precipitation which occurred south of the Alps. A thunderstorm that hit the city of Lugano in the early morning produced 81.5 mm of rainfall within an hour, which is expected over a long period of time less frequently than every 100 years (MeteoSwiss, 2017). It was the second hottest June since measurements began in 1864 (MeteoSwiss, 2017). Prior to this event, the high temperatures above 30 ∘C recorded in the Po Valley lasted for more than 3 d. A surface front was not present, but a short-wave upper-level trough moving over Switzerland can be seen from the geopotential field at 500 hPa (Fig. 2d).
-
8 July 2017. This event was embedded into the strong westerlies with high surface temperature ahead of a pronounced upper-level cut-off low in Spain (Fig. 2e). Several convective cells developed to the east of the Black Forest and moved towards Lake Constance. Later in the afternoon, multiple convective cells were triggered successively near the southern edge of the Jura mountains and north of the Alps.
-
24 July 2017. A slow-moving cut-off low passed over the northern side of the Alps. On the western side of the low, upper-level cold air advection occurred and led to an unstable environment (Fig. 2f). With the deepening of the system, low-level convergence and ascending motion initiated several thunderstorm cells to the south of the Alps, which later shifted northeastward with the prevailing flow.
-
17 May 2018. Under the influence of the upper-level low over Poland (Fig. 2g), several isolated and local thunderstorms developed in the afternoon over the eastern shores of the Adriatic Sea. Hail was observed over the northern part of Istria (Croatia) according to hailpad observations. Affected by the Bise (a northeasterly wind that blows across the Swiss plateau to the north of the Alps), local rain showers developed over Switzerland without hail and lightning.
-
30 May 2018. Scattered and widespread thunderstorms were initiated near eastern France and the southern flank of the Alps. The slow-moving storms caused significant damage across a large area. The surface pressure distribution was relatively flat (not shown), characterized by a “fair-weather” situation with weak temperature gradients over the eastern Alps. The Alpine region was affected by the southerly upper-level flow (Fig. 2h), where a trough extended over the Mediterranean and an anticyclonic curvature north of the trough axis. During the day, the southerly flow started to affect the weather in the Alpine region. A similar situation continued the next day.
3.2 Evaluation of total precipitation, hail, and lightning
In this section, we assess how COSMO, with a 2.2 km grid spacing, performs in simulating total precipitation, hail, and lightning. To do so we look into the model performance with SAL diagrams (explained in Sect. 2.5) shown in Fig. 3, and spatial distribution of total precipitation, hail, and lightning obtained from the model and observations for all eight cases shown in Figs. 4–8.
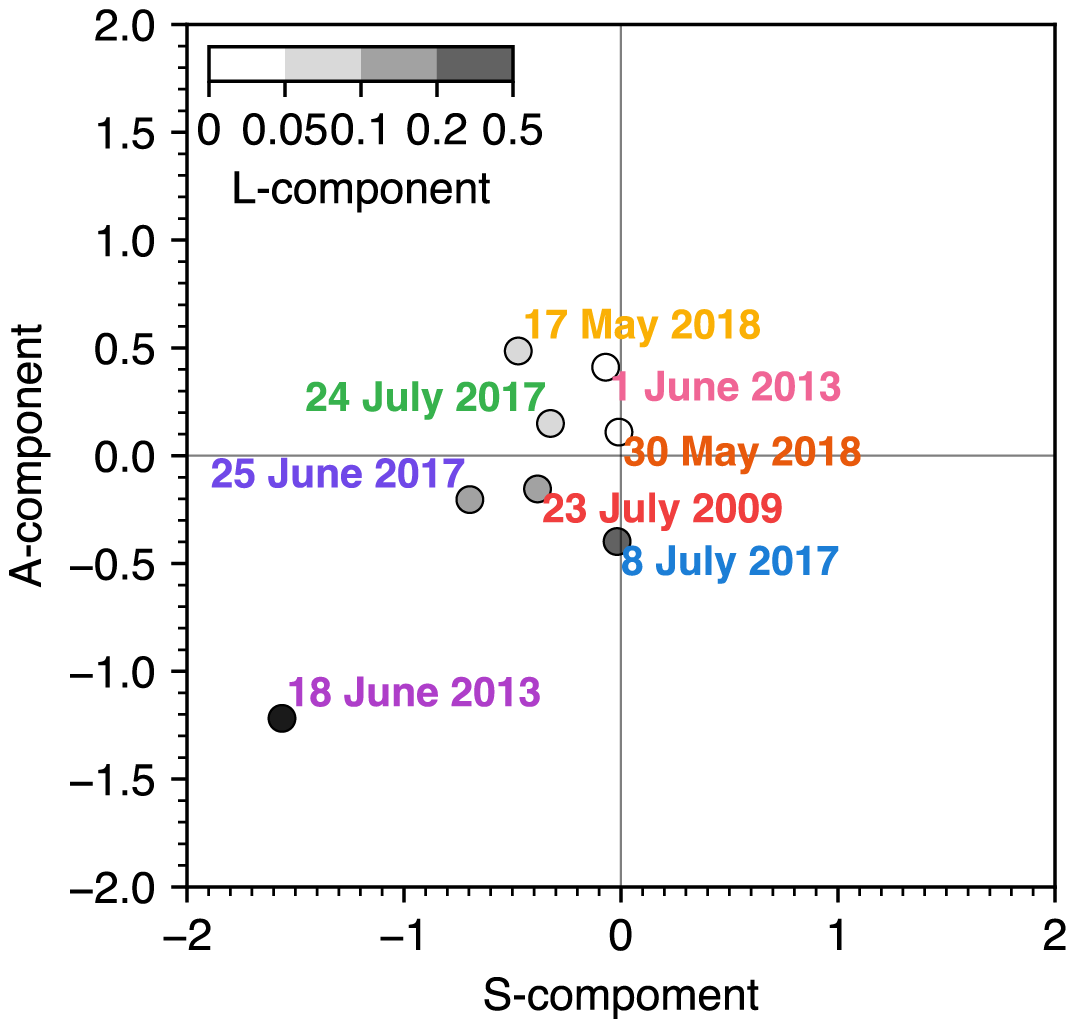
Figure 3SAL diagram of daily accumulated total precipitation in COSMO simulations compared to IMERG observations over the analysis domain for all eight analyzed cases. The S, A, L components evaluate the differences in structure, amplitude, and location of the events, respectively. Values near zero signal a perfect match with observations.
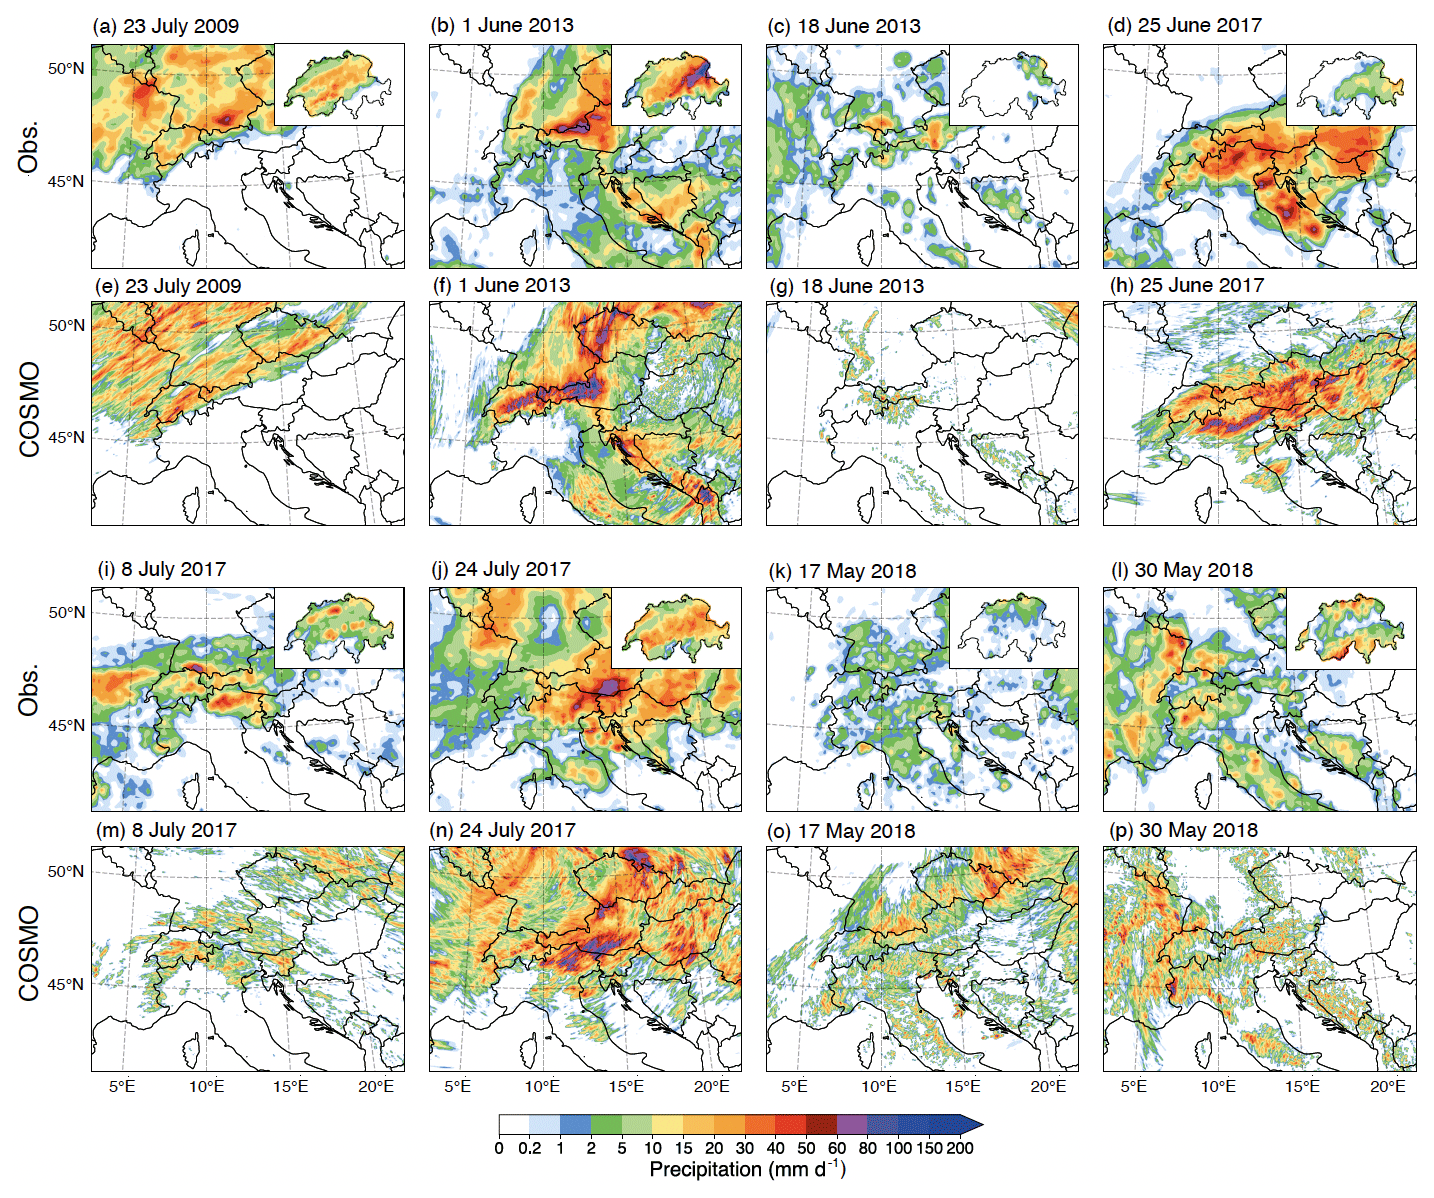
Figure 4Daily accumulated total precipitation (mm d−1) for all eight cases obtained from observations (first and third rows) and COSMO simulations (second and fourth rows). The IMERG observations cover the entire analysis domain, while high-resolution RhiresD gridded rain gauge observations (shown in the upper right corners) cover Switzerland only.
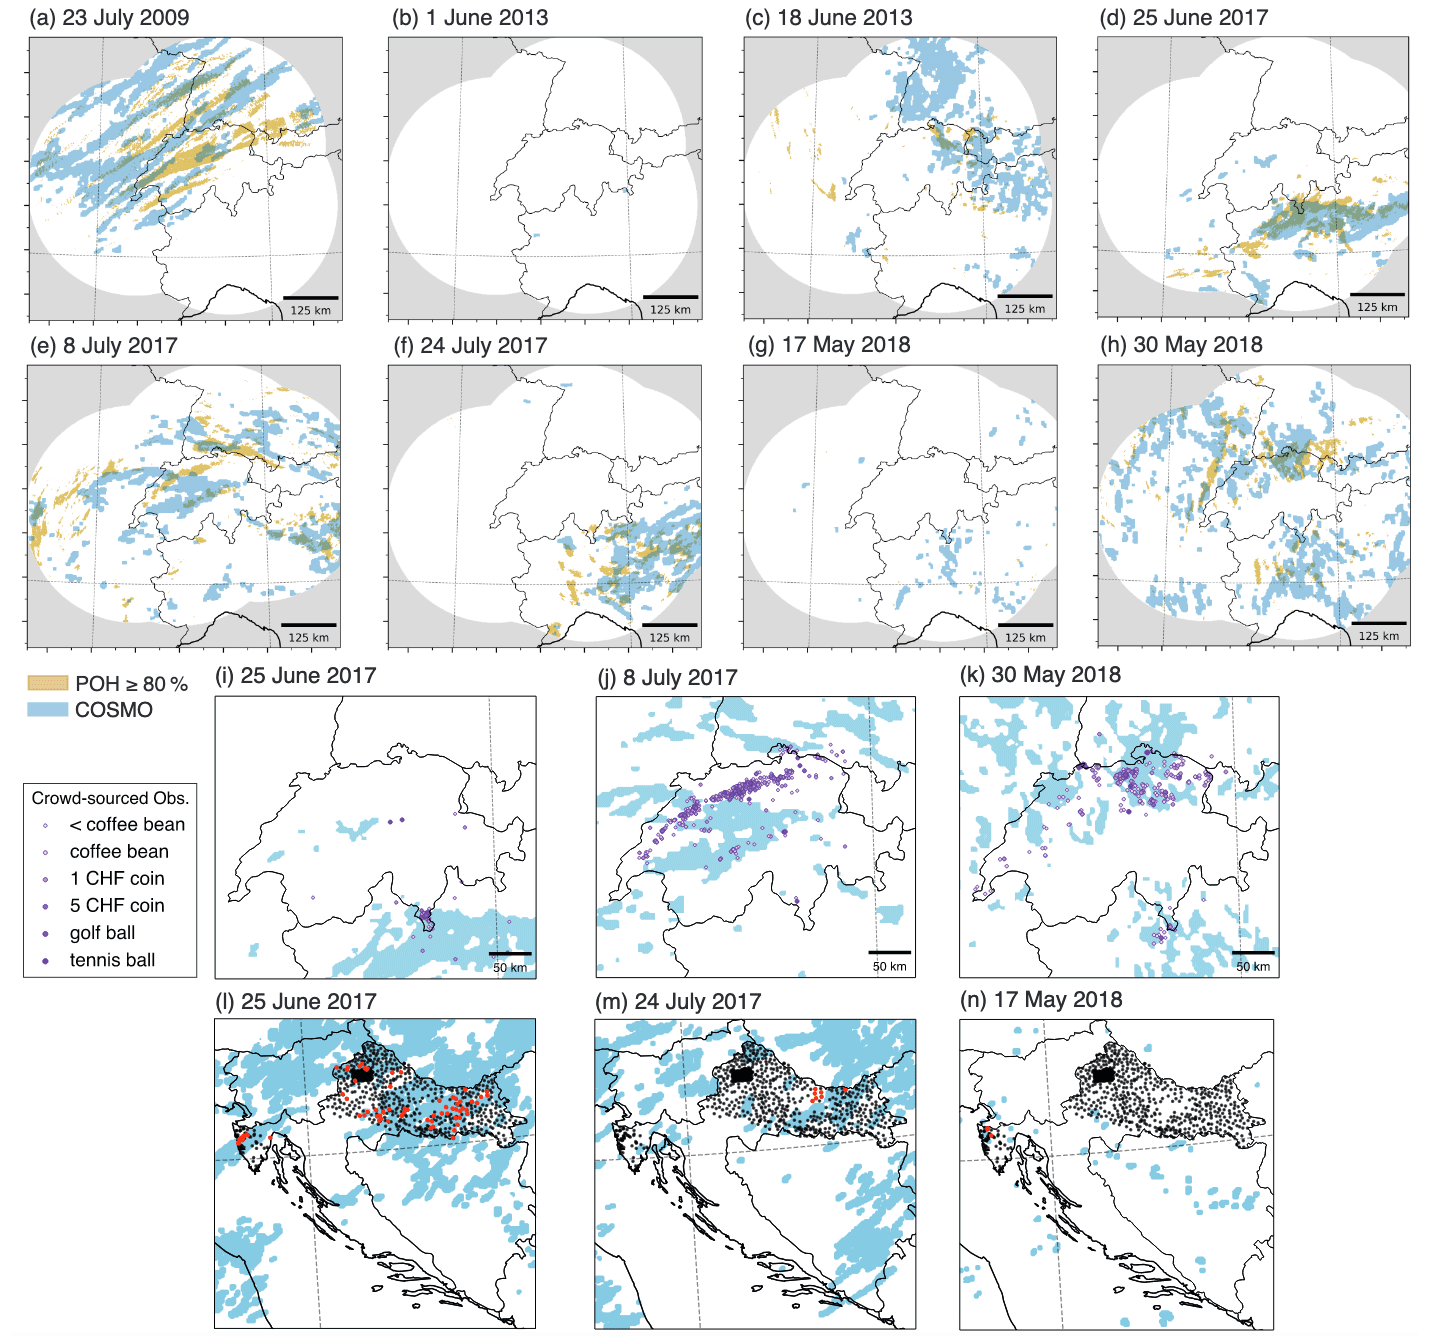
Figure 5Observed and simulated daily hail footprints for all eight cases analyzed in this study. COSMO hail footprint is shown in blue shading and compared against different observations over different regions. (a–h) COSMO against radar-based POH observations, shown in orange shading for the radar-covered area. A grid point with POH larger than 80 % is considered a grid point with hail. (i–k) COSMO against crowd-sourced reports collected within Switzerland, indicated with purple dots and classified according to various categories of hail sizes. Note that after 2018, there was a change in the definition of hail sizes. (l–n) COSMO against hailpad measurements. Available hailpads are indicated with black dots, and hailpads recording hail during the events are indicated in red for the three cases where hail occurred in Croatia.
The SAL diagram of daily accumulated total precipitation is shown in Fig. 3. The amplitude (i.e., intensity) of precipitation is overestimated for 1 June 2013 and 17 May 2018 and underestimated for 18 June 2013 and 8 July 2017. The structure component is captured relatively well for most of the cases except for 2 cases – 18 June 2013 and 25 June 2017 – for which the precipitation objects are too small and peaked compared to observations. For the case of 17 May 2018, the simulated precipitation is more scattered (Fig. 4k, o). Finally, the location component is particularly large in two cases – 8 July 2017 and 18 June 2013. The bias shown for the 8 July 2017 case is partially due to the southerly shift of the convective system (Fig. 4i, m). On 18 June 2013, COSMO fails to simulate precipitation over eastern France and overestimates peak precipitation over the Black Forest (Fig. 4c, g), which results in a large location error together with the largest negative bias for amplitude and structure components.
Comparison against IMERG and high-resolution RhiresD observations reveals that COSMO can capture the main spatial distribution of daily accumulated total precipitation (Fig. 4). The best performance is seen for the case of 23 July 2009 (Figs. 3 and 4a, e), characterized by stronger synoptic forcing and convection ahead of the cold front. The worst performance is seen in Figs. 3 and 4c and g for the case of 18 June 2013. The inability of the model to simulate this event properly is attributed to the local processes involved. The event is associated with weak synoptic forcing, with the largest convective timescale of all cases (Table 1). Thus, due to its more chaotic nature, this event has small predictability. We should note, however, that the SAL components of precipitation are computed against IMERG, which has a much coarser resolution than the model. Therefore, some of the biases can be attributed to the rather smooth precipitation distribution (larger precipitation objects of lower intensity) shown by the observations (Fig. 4). It is also interesting to note that none of the precipitation observations used, neither IMERG nor RhiresD, captured the record-breaking hourly precipitation amount of 82 mm as observed at the rain gauge station in Lugano (southern Switzerland) on 25 June 2017. However, such a high precipitation intensity is simulated by the model, even though it is slightly misplaced.
Table 1List of eight selected cases and their characteristics. The convection adjustment time τ is calculated according to the Eq. (5) and indicates cases with stronger (small τ) or weaker (large τ) synoptic forcing.
To evaluate the hail produced by COSMO HAILCAST, we first compare the model output against radar-based observations available over Switzerland and its surrounding areas (Fig. 5a–h). We first show the simulation against the POH data in terms of the hail footprint and coverage, but the comparison against MESHS data looks qualitatively similar. In general, the occurrence of hail is simulated well, but the placement and coverage are not captured very well in some cases (e.g., 8 July 2017). The case of 1 June 2013 with heavy rain but no hail over Switzerland is well reproduced, even though a very small number of grid cells produced small hail (Fig. 6b). Among the best-simulated cases, the same as for total precipitation, we can again consider the case of 23 July 2009 characterized by stronger synoptic forcing and elongated hail swaths reproduced by the model (Fig. 5a). The record-breaking rainfall event of 25 June 2017 also produced hail south of the Alps, as observed by radar and crowd-sourced reports and over the Adriatic region, including the continental part of Croatia as observed by hailpads (Fig. 5d, i, l). The widespread occurrence of hail in this case is reproduced by the model, even though the spatial extent is overestimated. The case of 17 May 2018 is characterized by hail recorded on the Istrian peninsula in Croatia and was well reproduced by the model. However, the model produced very light and scattered hail over both Adriatic and Alpine regions where it was not observed (Fig. 5g, n). Another case with poorer model performance is 18 June 2013, when the model overestimates the spatial extent of hail swaths, especially over the Black Forest (Fig. 5c). Overall, we can see that the performance in the simulation of hail aligns with the performance in the simulation of total precipitation. However, we should note many difficulties in comparing model output with available hail observations. As described earlier, MESHS data provides information on hailstone diameters above 20 mm only, which can potentially lead to underestimating the hail frequency and spatial coverage. POH only provides the probability of hail but does not indicate whether or not hail has occurred. Furthermore, both MESHS and POH detect hail at higher altitudes and not on the ground, and melting may influence hailstones (Nisi et al., 2016). Last but not least, even though the hailpad network consists of many hailpad stations, many areas are not well covered and, thus, are prone to miss recording very localized events such as thunderstorms and hail associated with them.
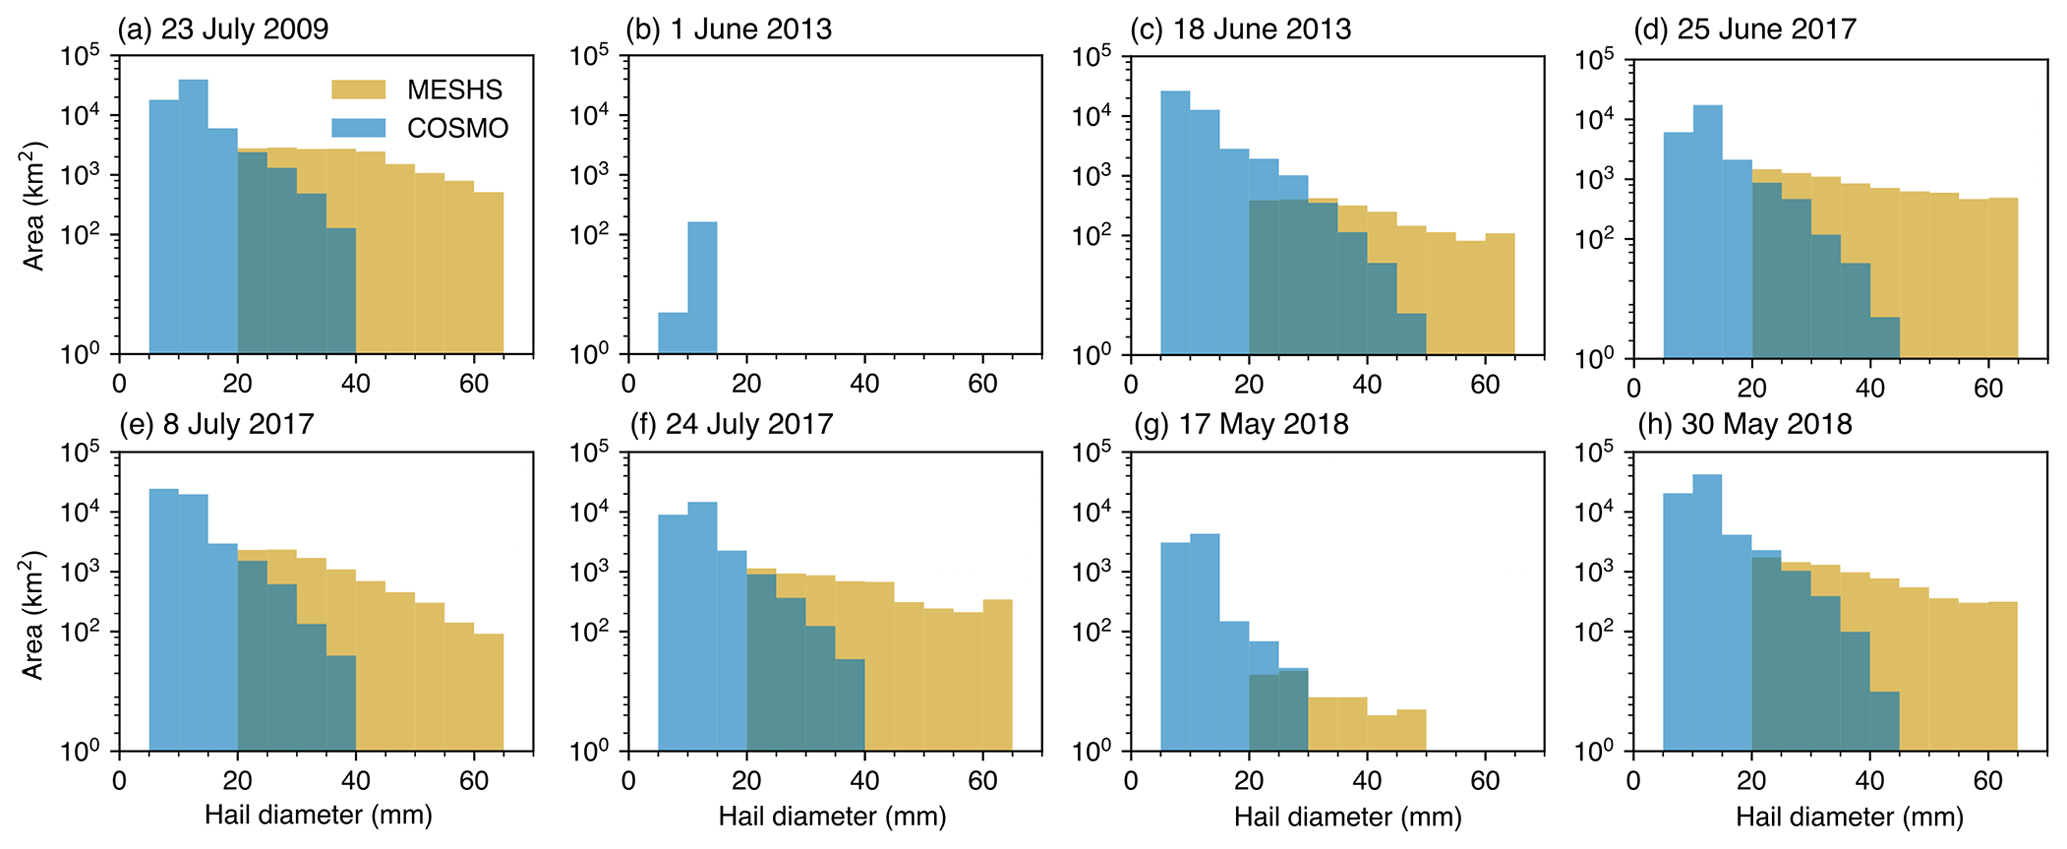
Figure 6Area affected by hail obtained in radar-based MESHS observations (orange) and COSMO HAILCAST (blue) for all eight cases analyzed over the radar domain (Fig. 1). Note that MESHS estimates are only available for diameters >20 mm.
To further explore the performance of the COSMO HAILCAST, we compare the simulated hail against available observations for different cases as listed in Table 1. We compared the area affected by hail using COSMO HAILCAST against MESHS over the radar-covered area (Fig. 6), frequency of simulated hail diameter against crowd-sourced data over Switzerland (hailstones larger than coffee beans – 5 mm – are shown; Fig. 7a–c), and hailpad observations over the hailpad-covered area (Fig. 7d–f). When compared to MESHS, the results show a large difference between the observed and simulated area. We see that, while MESHS observation only estimates hail diameter above 20 mm, the model produces hail diameter below 20 mm.
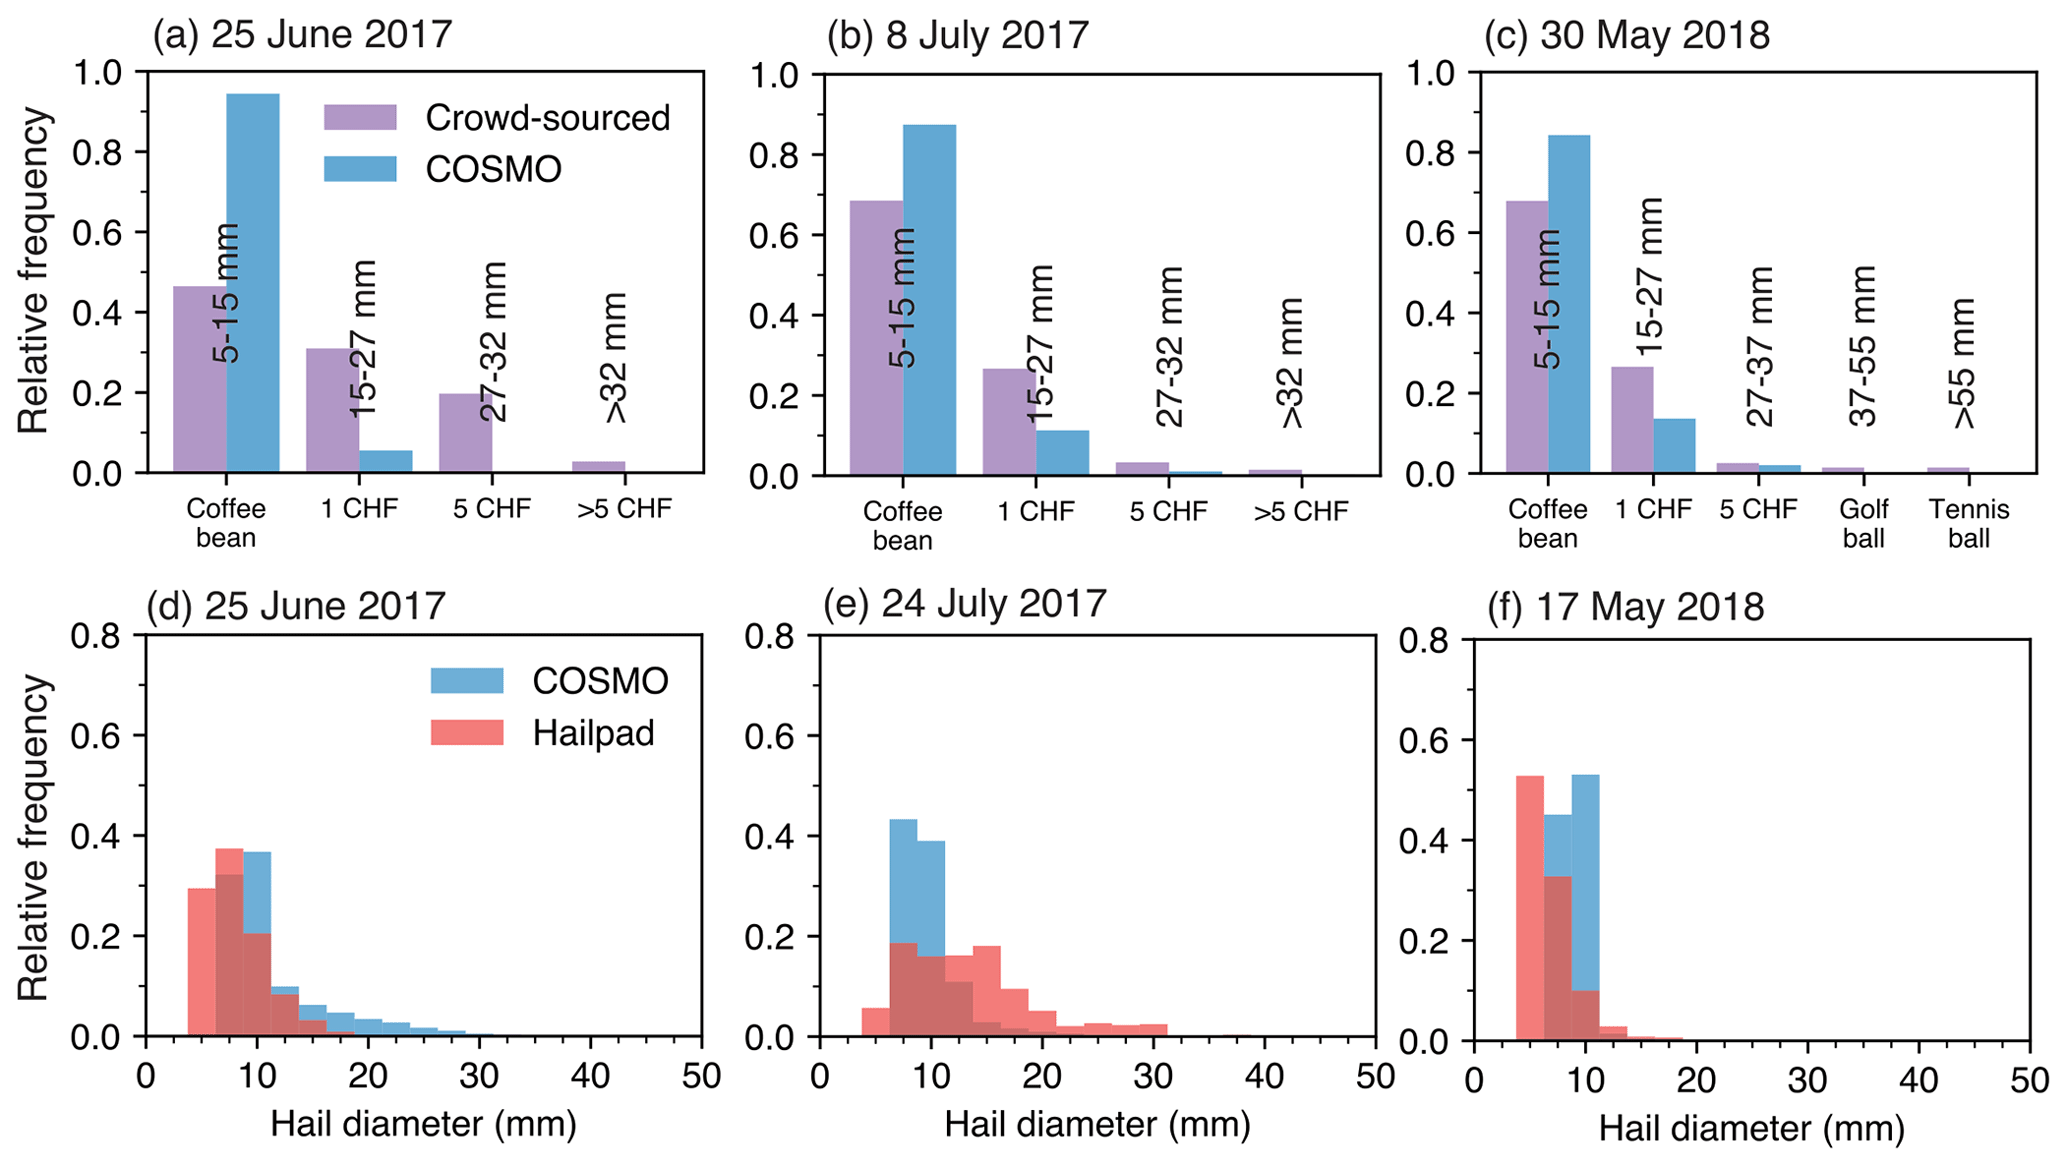
Figure 7Relative frequency of hail diameter obtained from (a–c) crowd-sourced observations (purple) and COSMO HAILCAST (blue) in Switzerland, and (d–f) hailpad observations (red) and COSMO HAILCAST (blue) over hailpad-covered areas in Croatia (Fig. 1c). The histograms show the frequency of hail size for each bin relative to the number of observed or modeled hail events.
According to Barras et al. (2019), considering the 23 and 32 mm reports, MESHS tends to exceed the crowd-sourced reported hailstone size by 10–15 mm on average. Yet, compared to crowd-sourced data over Switzerland (Fig. 7a–c), the model shows a reasonable hail size distribution, although it still tends to overestimate small hailstones and underestimate large hailstones. Moreover, when compared to hailpad observations over Croatia (Fig. 7d–f), the model exhibits a distribution that closely aligns with the observed data, particularly for the two cases of 25 June 2017 and 17 May 2018. For the case of 24 July 2017, an event relatively well captured by the model, the simulated hailstones above 15 mm are underestimated. Therefore, the comparisons against radar-based MESHS should be considered with caution. They show that there is a need to improve radar-based hail algorithms, although comparisons with other observations show that COSMO in general tends to overestimate small hailstones and underestimate large ones.
It is clear that HAILCAST underestimates the frequency of larger hail sizes, i.e., does not produce many hailstones larger than 30 mm. As noted by Adams-Selin and Ziegler (2016); Adams-Selin et al. (2019), the hail size strongly depends on the initial hail size embryo – the larger the initial embryo, the larger the output hail size. However, the size also depends on the model micro-physics, the strength of the updrafts that hail has to overcome to fall to the surface, and the initial temperature level. For example, if updrafts are weaker, larger hail falls down faster and does not have enough time to grow further, while smaller hail has more time to grow but does not reach sizes above 20 mm. In a parallel study, in which the same eight cases are simulated with the WRF model (Malečić et al., 2023), larger hailstones are obtained with the WRF model than with COSMO. This result indicates that the simulated hail size strongly depends upon the model formulation.
Next, we turn our attention to the evaluation of lightning. A comparison of lightning patterns between the model and LINET observations for each of the cases is shown in Fig. 8. In addition, to overcome difficulties related to different variables represented by observations and model (lightning flashes versus lightning potential), we calculate and display a coverage bias in the figure (red number). It is defined as the ratio of the number of gridpoints with lightning in the model and observations, respectively. Note that the coverage bias does not provide any information on the overlap of simulated and modeled lightning, but this is qualitatively assessed from the spatial representation. Overall, the model using LPI diagnostics is able to capture the lightning patterns for each case, although it tends to slightly overestimate the spatial patterns of the signal (as for total precipitation and hail). The largest overestimation of spatial patterns, and, thus, the coverage bias, is found in the case of 1 June 2013, when very little lightning was observed over the Adriatic and no lightning over the Alpine region. However, the model diagnostics produced lightning over the eastern Alps, which coincides with the area of very intense precipitation. The case of 1 June 2013 is the case without hail over the Alpine region, which was successfully reproduced by the model. Differences in representing hail and lightning can be related to different updraft thresholds used by LPI and HAILCAST, which is lower for LPI: 0.5 m s−1 for LPI (Sect. 2.3) versus 10 m−1 for HAILCAST (Sect. 2.2). The smallest coverage bias is obtained for the case of 24 July 2017 and 30 May 2018, even though there is a slight shift between the observations and the model. We should also note that both of these cases are characterized by weaker synoptic forcing and more locally driven convection, which is well reproduced by the model. The largest underestimation of the spatial coverage of lightning is found in the case of 25 June 2017. A large part of this bias is visible over the Adriatic Sea – the area over which the model fails in reproducing total precipitation as well.
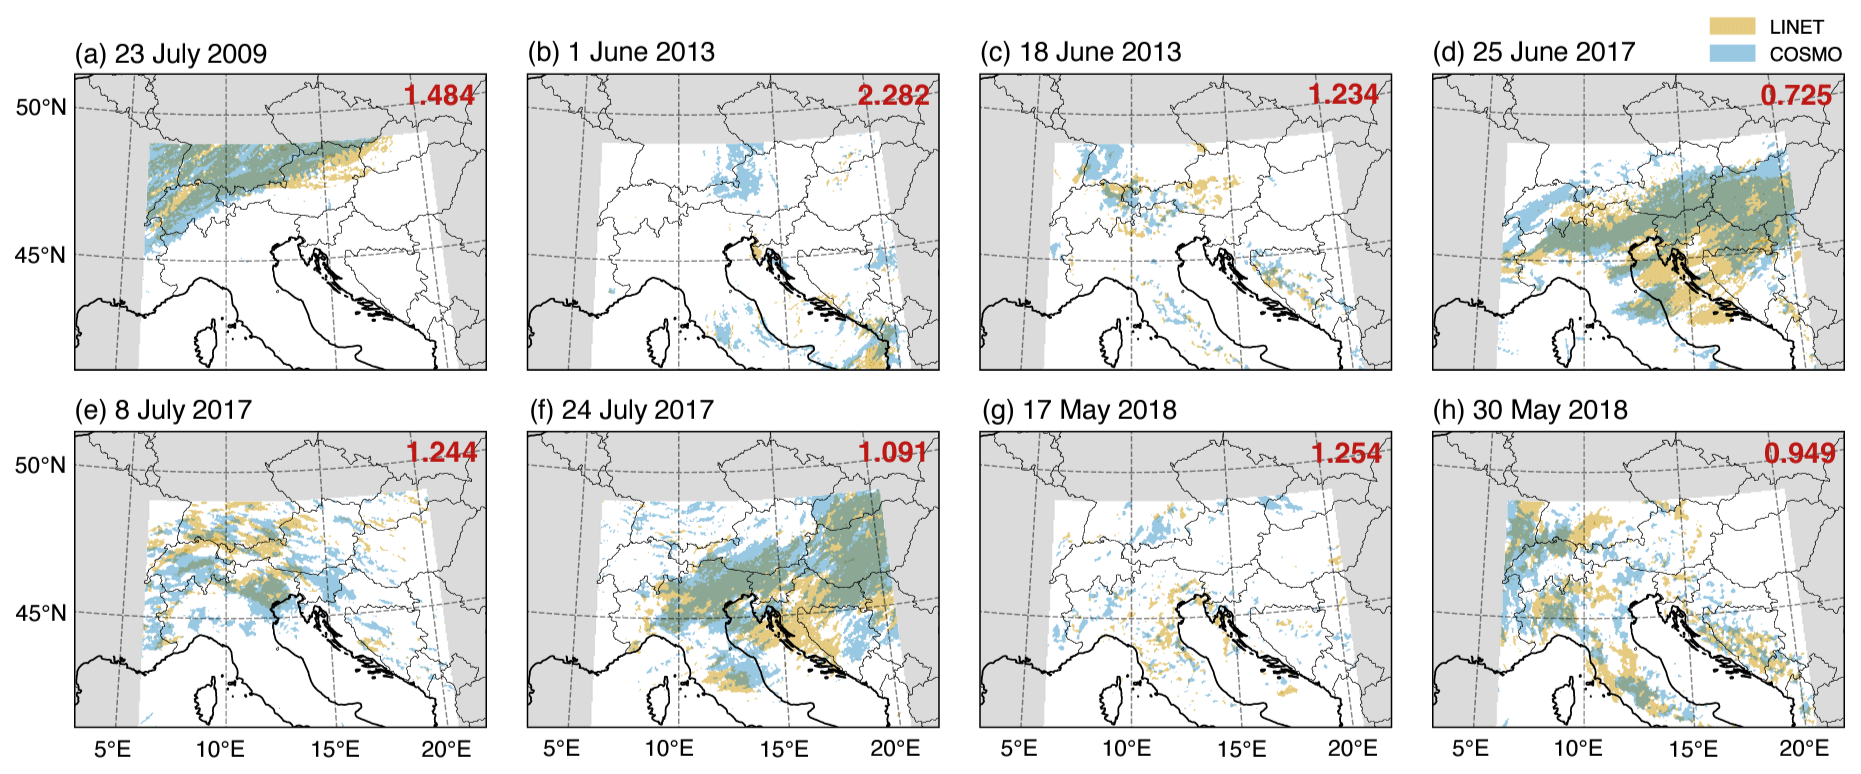
Figure 8Foot prints of daily LINET lightning flashes (> 0, orange) and COSMO LPI (> 0 J kg−1, blue) for all eight cases. The number in the upper-right corner of each panel displays a coverage bias, defined as the ratio of grid points with lightning in model and observations. Values larger and smaller than 1 indicate model overestimation and underestimation of spatial coverage, respectively.
Overall and not surprisingly, we can see that the performance of both hail and lightning diagnostics strongly depends on simulated total precipitation, since both hail and lightning diagnostics depend on the same ingredients as precipitation.
3.3 Assessment of model internal variability
A central element of the simulation strategy is the use of ERA5 lateral boundary conditions, with the initialization taking place at 12:00 UTC on the day before the event to account for the spin-up of the storms. The simulation is thus guided along the reanalysis, and the predictability in our simulations is much higher than in a numerical weather prediction (NWP) forecast. The strategy is ideal for testing diagnostic tools that require adequate synoptic forcing. Despite the enhanced predictability due to the use of ERA5 lateral boundaries, there is some remaining internal variability. To test the effect of model internal variability on our results, we conducted a small ensemble of simulations for three of the eight cases, by shifting the initialization by +6 and −6 h. The ensemble simulations are initialized at 06:00, 12:00, and 18:00 UTC on the day before the storms occurred. Consideration is given to the whole modeling chain with nested simulations at 12 and 2 km resolutions.
Results show that even for localized deep convective storms, the predictability of precipitation and hail is overall quite high (Fig. 9). However, there are significant differences in detail, due to the chaotic nature of the nonlinear flow evolution. For example, in the case of July 2009 (top two rows of Fig. 9), there are considerable differences in the length and location of the hail swaths. Likewise, in the case of 18 June 2013, precipitation is simulated over the Black Forest when initialized at 12:00 UTC but not when initialized at 06:00 and 18:00 UTC. Similarly, in the case of 30 May 2018, there are pronounced differences in the precipitation fields with concomitant differences in hail. Overall, however, the internal variability is rather small, and, hence, the simulations confirm the suitability of the selected modeling strategy for assessing the performance of the modeling approach for case studies of severe convection. A comparison of the cases shown in Fig. 9 suggests that synoptically driven convective storms have a higher predictability.
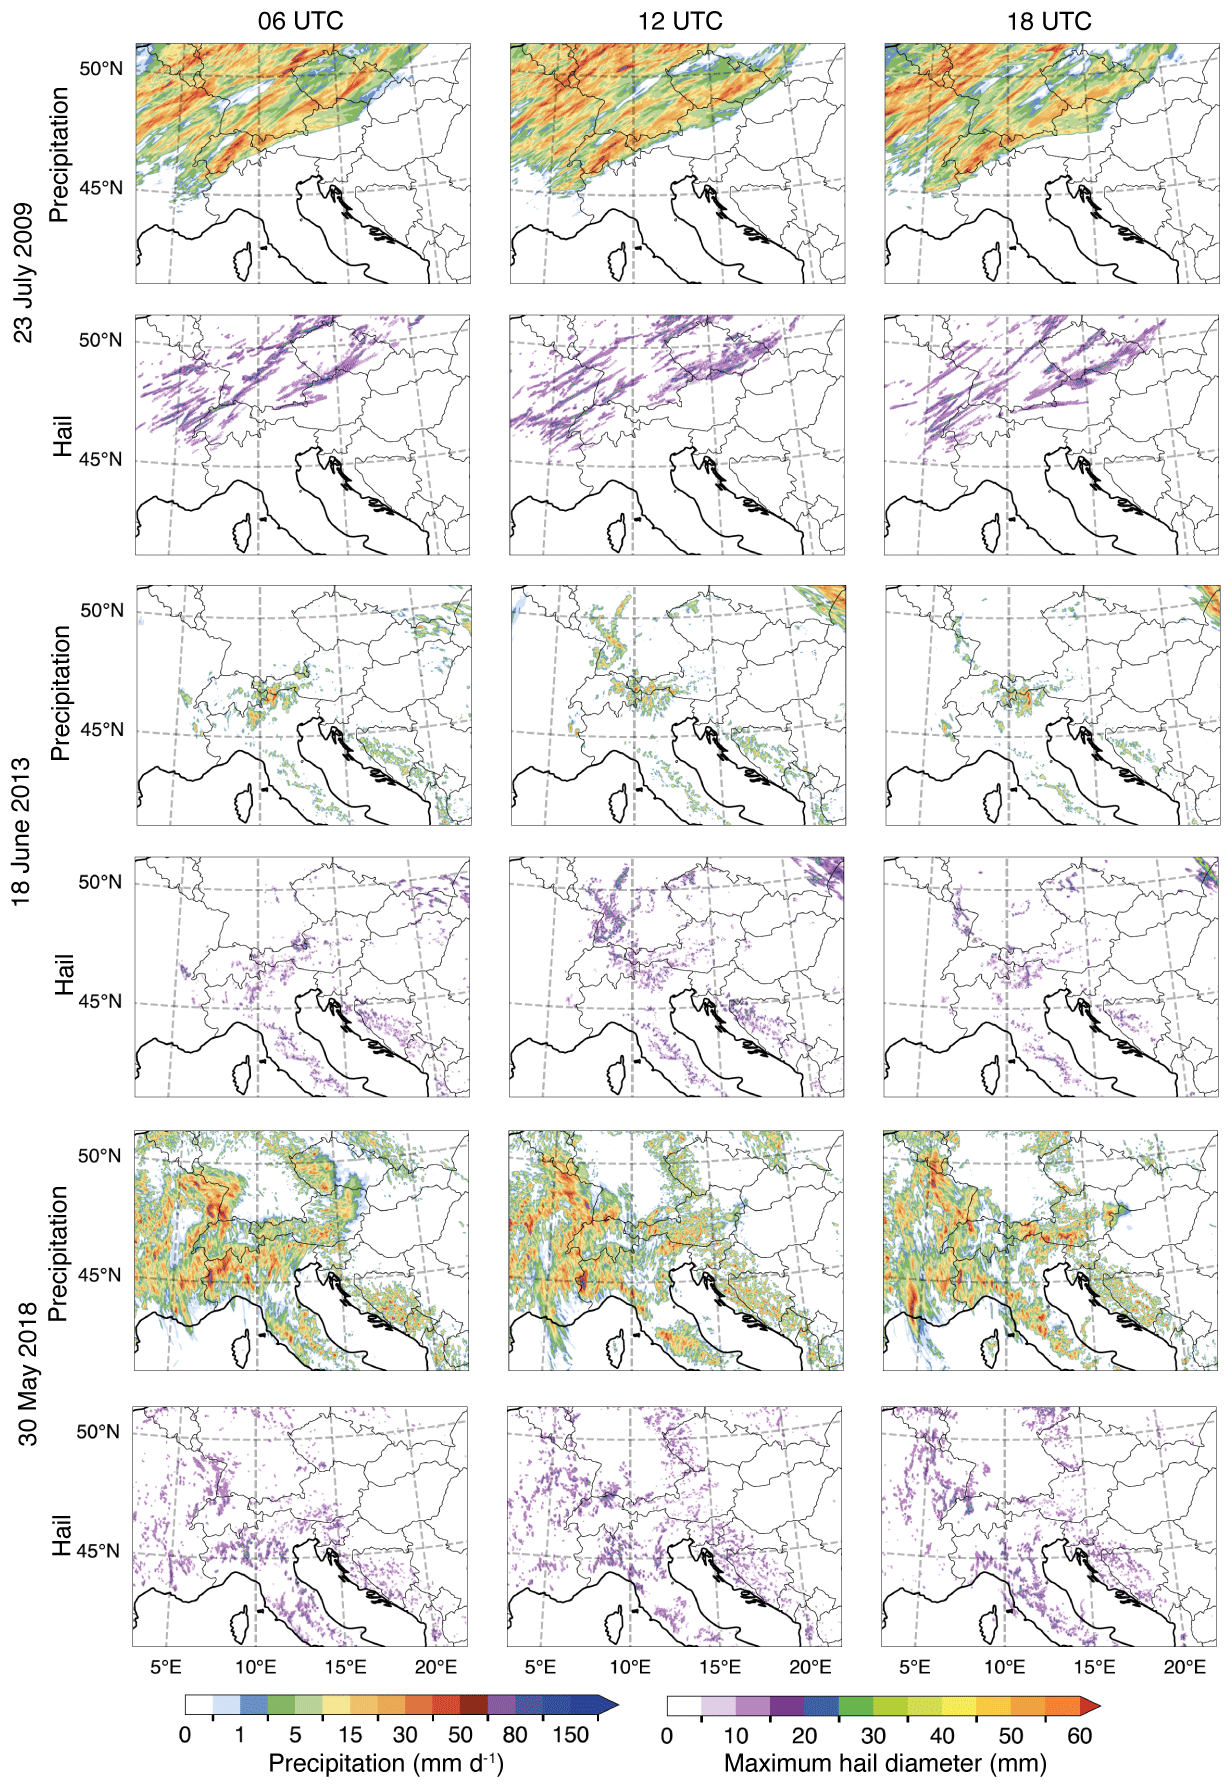
Figure 9Small ensemble of simulations to explore the internal variability of the simulation strategy. Daily accumulated total precipitation and maximum hail diameter in simulations initiated at 06:00 (left), 12:00 (middle), and 18:00 (right) UTC on the day before the event occurred. All ensemble members are driven by ERA5 at the lateral boundary of the 12 km domain using hourly resolution. The results are obtained for the case of 23 July 2009 (two upper rows), 18 June 2013 (two middle rows), and 30 May 2018 (two lower rows).
3.4 Analysis of three specific cases
To further investigate the environmental conditions and the mechanisms that are favorable for the development of thunderstorms over the Alpine-Adriatic region we present a more detailed analysis of three specific cases, which affected different areas under different synoptic situations.
3.4.1 The case of 23 July 2009 – Severe thunderstorms with elongated hail swaths over Switzerland
As shown above, the case of 23 July 2009 is one of the best-simulated cases with very good performance in simulating total precipitation, hail, and lightning despite overestimating the spatial extent of hail and lightning. The good performance is most likely due to the nature of this event, which was characterized by thunderstorms ahead of a cold front and is thus classified as an event under stronger synoptic forcing. On that day, central Europe was dominated by a large trough stretched from Scandinavia and its upper low-pressure system positioned north of Iceland. The associated cold front approached the Alps at around 12:00 UTC. The propagation of the front was slow due to the distortion of the flow field around the Alps (Schumann, 1987), while the convergence along the front resulted in a fast storm movement. According to Schemm et al. (2016), up to 45 % of detected hail events in northeastern and southern Switzerland form in this kind of pre-frontal zone.
Figure 10a and b shows the observed and modeled Skew-T log-p thermodynamic diagram from Payerne (see Fig. 1b) at 00:00 and 12:00 UTC on 23 July 2009, which provides information in Switzerland before and during the passage of the cold front. During the night, a moist and stable layer below 800 hPa was located underneath a warm and dry mid-level layer. This constellation with high observed convective inhibition (CIN) of −634 J kg−1 (Fig. 10a) acted to suppress convection. The dry capping layer trapped humidity in the boundary layer and accumulated energy prior to the triggering of the thunderstorms later in the afternoon. Around noon, this profile changed significantly below 600 hPa where temperature decreased due to the approaching cold front (Fig. 10e), while dew-point temperatures increased prominently at 800 hPa as the moisture in the warm air mass was lifted ahead of the cold front. The resulting convective cells moved northeastward (Fig. 10f) and weakened in the middle of the night. At 00:00 UTC on 24 July 2009, CIN was completely depleted (not shown). A comparison of the model simulation against observations at Payerne station reveals that COSMO reproduces this environment very well (Fig. 10b). This relatively good simulation of the storm environment leads to a good overall performance of the model in simulating total precipitation, hail, and lightning during that event.
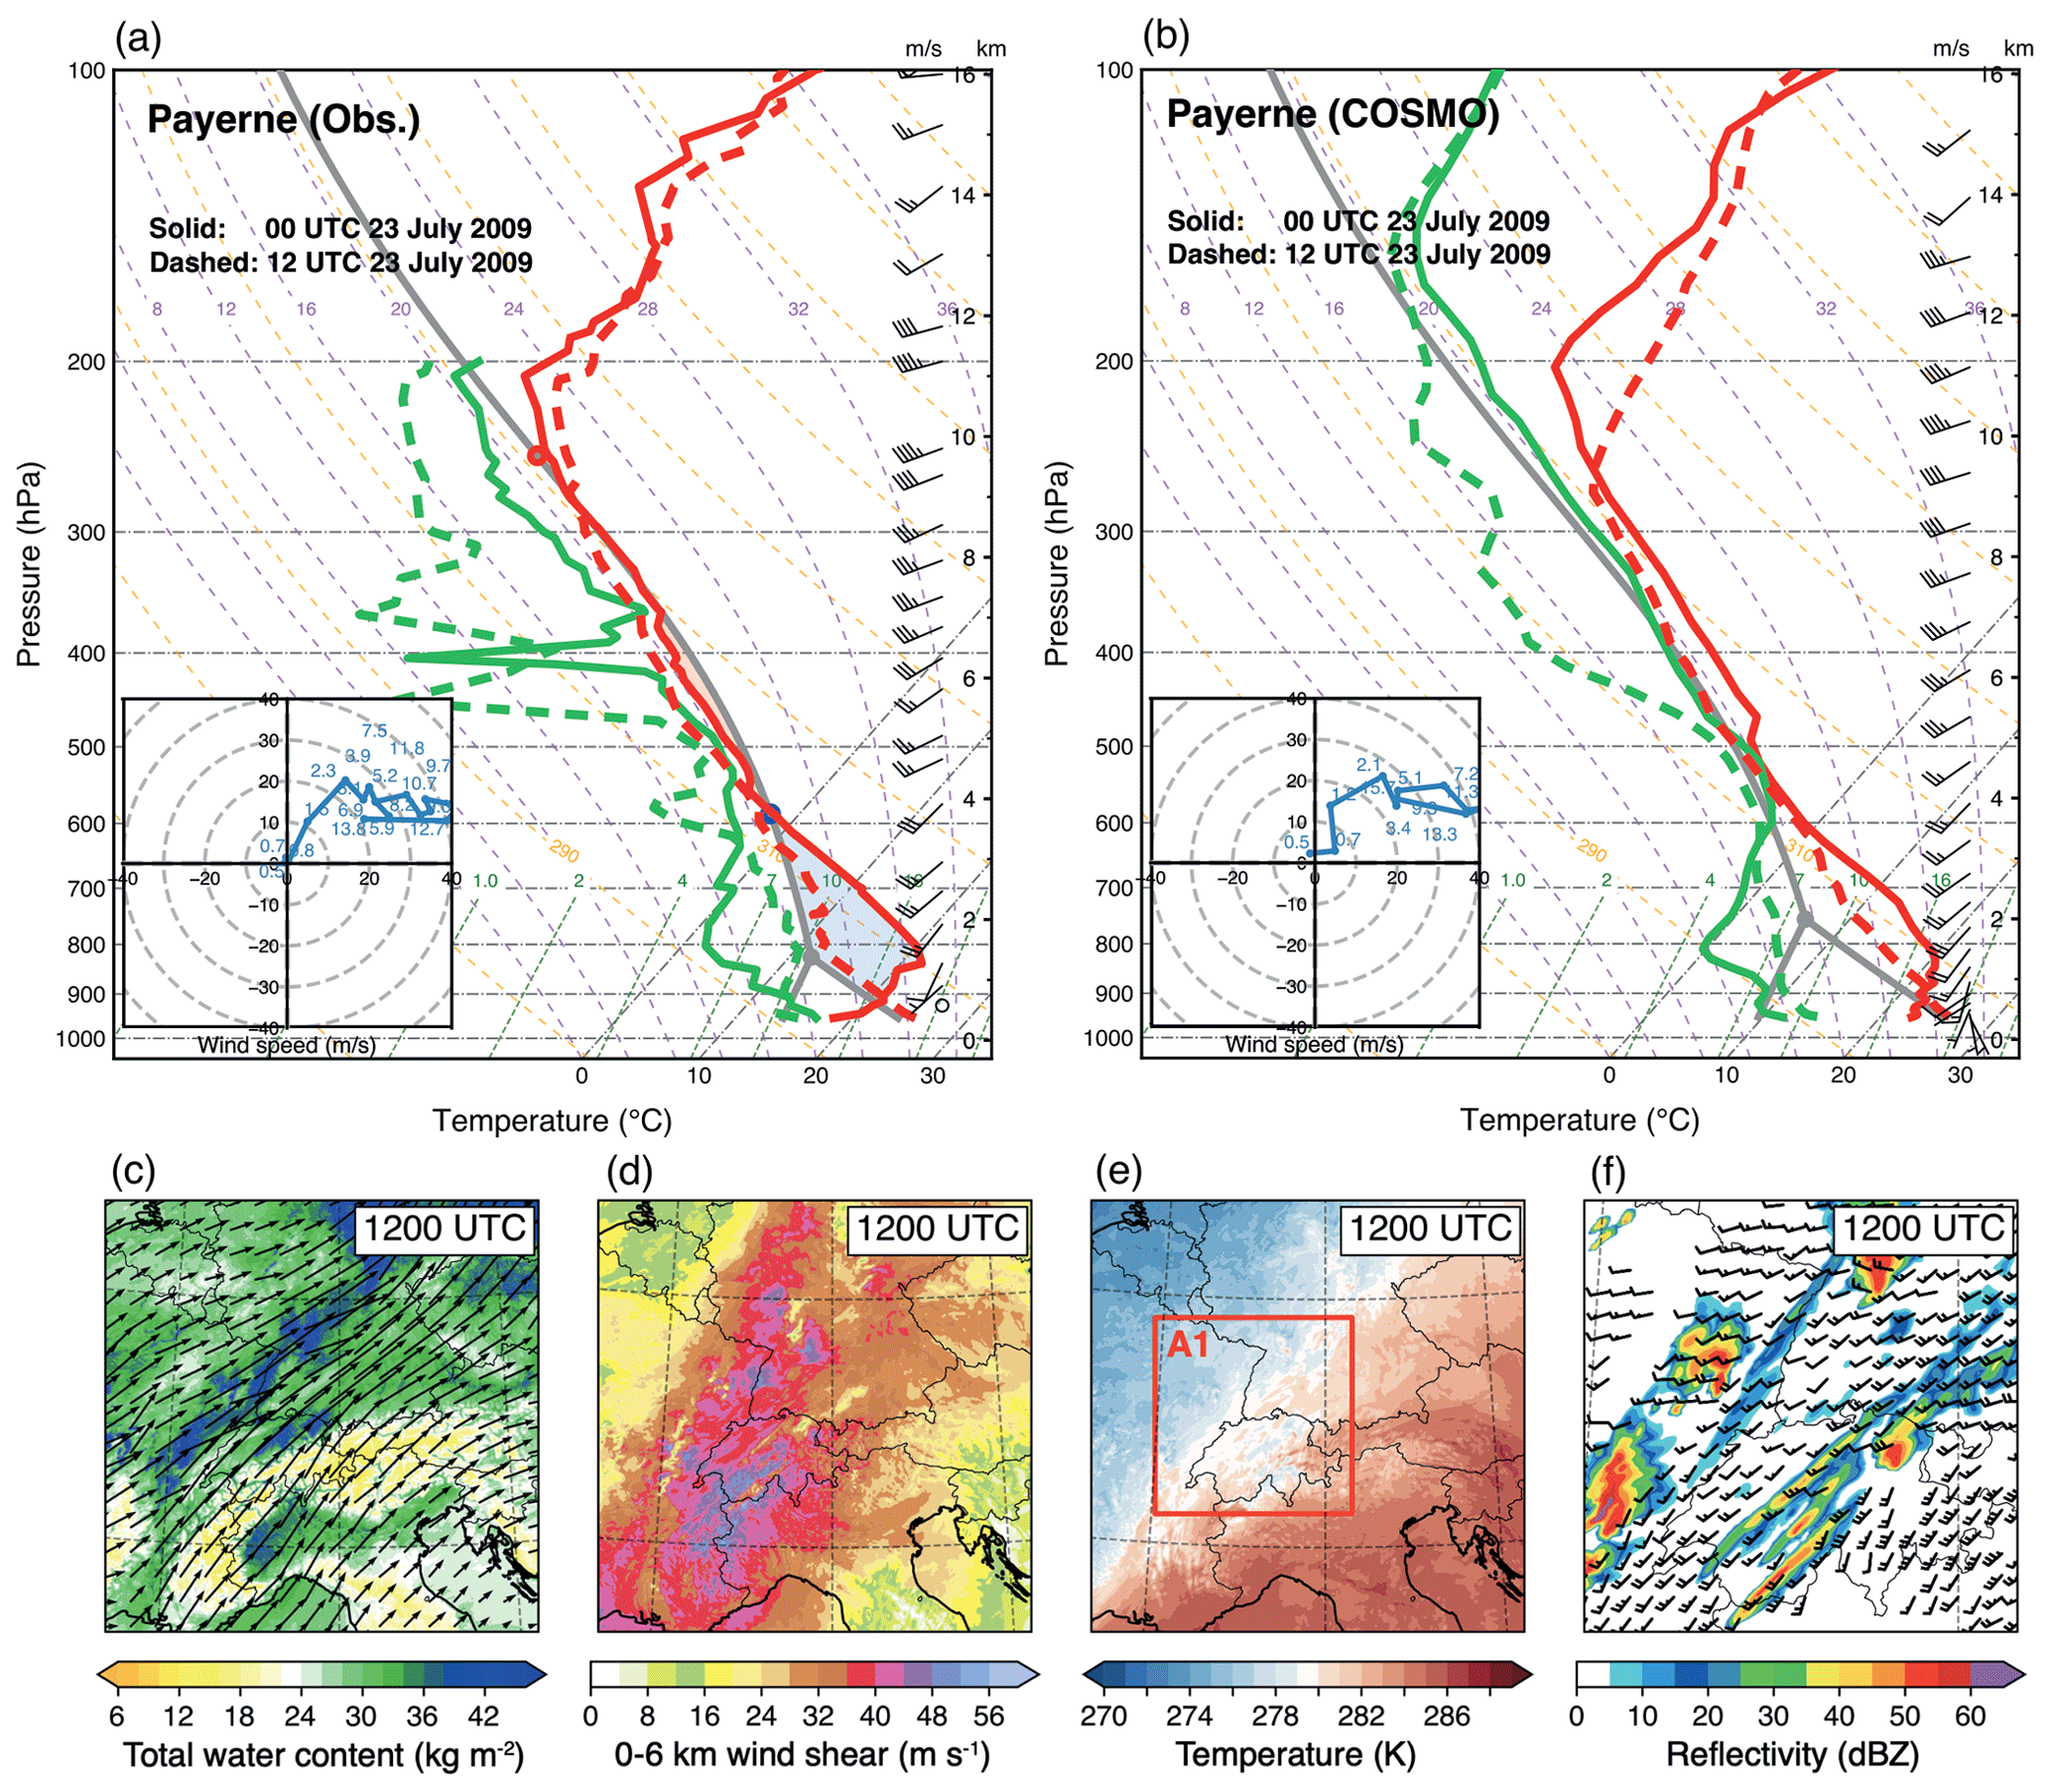
Figure 10Detailed characteristics of the case 23 July 2009. Thermodynamic skew-T log-p diagrams of (a) sounding observations and (b) COSMO extracted profiles at Payerne station at 00:00 (solid) and 12:00 UTC (dashed). Red and green lines represent the temperature and dew-point temperature profiles, respectively. Corresponding wind hodographs, shown in the bottom left corner, were obtained for 12:00 UTC on 23 July 2009. COSMO simulated (c) total water content and vertically integrated water flux vectors, (d) 0–6 km bulk wind shear, (e) temperature at 700 hPa, and (f) simulated reflectivity and wind barbs at 1 km above ground level at 12:00 UTC on 23 July 2009. The red box A1 indicates the zoomed subdomain shown in (f).
Further analysis of the case based on the model output reveals that the southwesterly flow transported warm and moist air from the Mediterranean with an abundant water content of 35 kg m−2 (Fig. 10c). This warm and moist air, together with extremely large 0–6 km bulk wind shear defined as the difference in horizontal velocity between 6 km and the surface (exceeding 40 m s−1 in some areas; Fig. 10d), created favorable conditions for strong rotating updrafts. At around 05:00 UTC, a line of convection developed in northeastern France and moved to the Black Forest (not shown). Hail was first observed in radar-based observations at around 09:00 UTC over northeastern France and the Jura mountains. Later in the afternoon, a supercell developed near Lyon (in France), moving northeastward and gradually splitting into several elongated convection cells accompanied by observed and simulated long hail swaths extending for hundreds of kilometers over Switzerland (Fig. 10f).
3.4.2 The case of 25 June 2017 – A record-breaking precipitation event in Lugano
The case of 25 June 2017 is associated with the record-breaking precipitation rate in Lugano during the measurement period (see Sect. 3.2 above). We chose this event for detailed analysis since interesting conditions triggered the event as explained below. The COSMO model shows a good performance in simulating total precipitation, hail, and lightning over the Alpine region. However, at the same time, it underestimates total precipitation and lightning over the Adriatic Sea. As for the previous case, we first look at the structure and evolution of the pre-storm environments using radiosonde profiles, but this time at the Milano station (since it is closer to the event) in the northwestern section of the Po Valley in Italy (Fig. 11a, b). At 12:00 UTC on 24 June 2017, a typical “loaded gun” structure can be identified with a temperature inversion at 850 hPa and dry air located above warm and moist air. Such a profile is known as an elevated mixed layer (EML, Carlson et al., 1983), and it can also be identified as the “capping” layer (Lanicci and Warner, 1991), which is an indication of a severe storm environment. The cap or lid prevents deep vertical mixing and inhibits the premature release of the convective instability with observed CIN of −144 J kg−1 and CAPE as high as 2723 J kg−1. The CIN gradually decreased in the following hours without much change in CAPE (not shown). At 00:00 UTC on 25 June 2017, the air below 900 hPa became cooler and the lid was higher, indicating that the capping inversion was penetrated by updrafts. Together with the potential instability ahead of an upper-level trough, the buoyant air was lifted and released the accumulated energy. This led to a burst of thunderstorms that hit this area in the early morning, where hail was first observed at around 00:30 UTC.
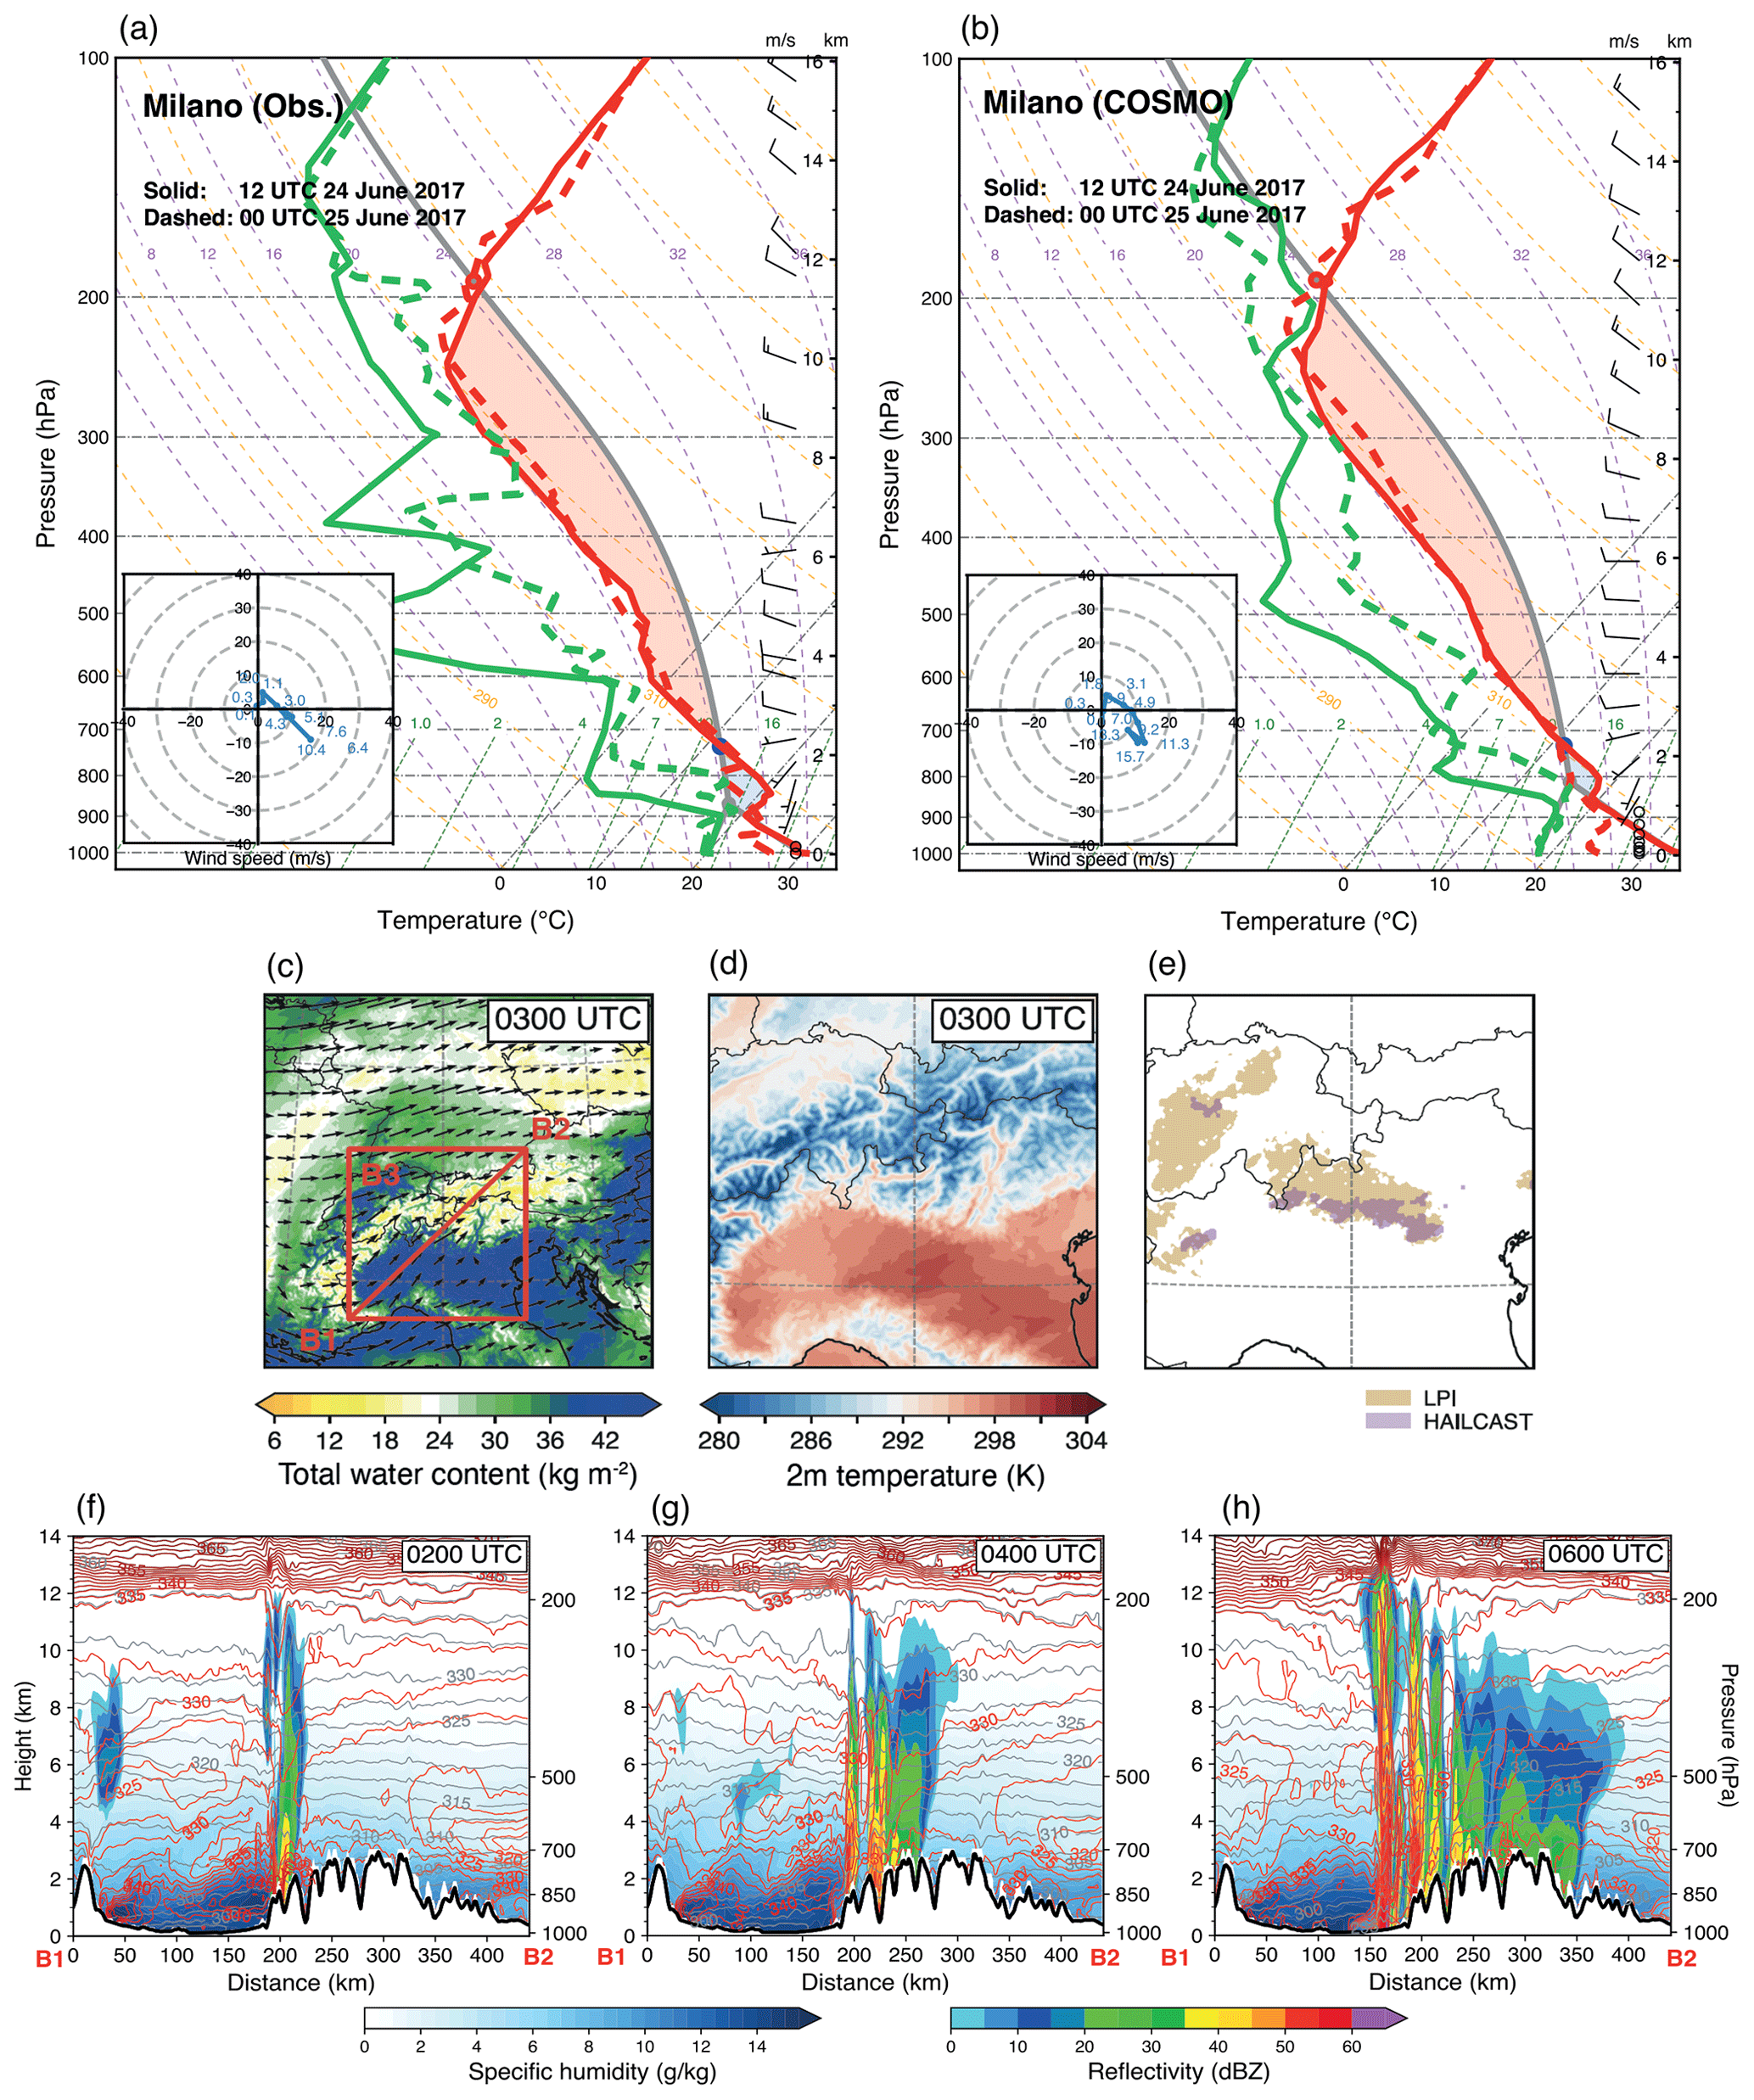
Figure 11As in Fig. 10, but for the case of 25 June 2017. (a) Sounding observations and (b) COSMO extracted profiles at Milano at 12:00 UTC on 24 June 2017 (solid lines) and 00:00 UTC on 25 June 2017 (dashed lines). (c) COSMO simulated total water content and vertically integrated water flux vectors, (d) 2 m temperature at 03:00 UTC on 25 June 2017, and (e) footprints of LPI and HAILCAST obtained between 03:00 and 04:00 UTC are shaded in yellow and purple, respectively. The red box B3 in (c) indicates the zoomed subdomain shown in (d, e). (f–h) Vertical cross sections of potential temperature (gray contours), equivalent potential temperature (red contours), specific humidity (blue shaded), and simulated reflectivity (color shaded) along the red transect B1–B2 at 02:00, 04:00, and 06:00 UTC on 25 June 2017.
A comparison of the simulated profile at the Milano station (Fig. 11b) with the observed and above-discussed profile (Fig. 11a) reveals a good performance of the model in capturing the vertical profile and thus the triggering mechanisms of the event. The model reproduced the “capping” layer on the day before the event occurred and the deepening of the moist and warm air several hours before the event occurred.
Analysis of the model output shows a warm and moist layer over the Po Valley with simulated total water content larger than 45 kg m−2 (Fig. 11c, d). As shown in Fig. 2b, due to the presence of an upper-level trough, the Po Valley was influenced by southwesterly flow. A line of organized convection gradually formed along the northwest–southeast oriented mountain edge at around 02:30 UTC (not shown). Subsequently, the convective cells continuously developed over the elevated terrain and propagated upwind. Heavy precipitation associated with hail, and lightning was localized and became most intense between 03:00 and 04:00 UTC (Fig. 11e). This back-building process (e.g., Lagasio et al., 2017) is shown with cross sections normal to the squall line (Fig. 11f–h), where the convection developed upwind over the foothills. The triggered cells remain nearly stationary and the intensity significantly weakened when it moved to the northeast due to the loss of low-level warm and humid air over the Po Valley. The topography of the Po Valley offers a favorable environment for the initiation of new cells, which consequently explains the hot spot of hail occurrence over this region.
3.4.3 The case of 8 July 2017 – thunderstorms near the Jura mountain
The case of 8 July 2017 is characterized by multiple thunderstorms over the Alps. Overall, the precipitation structure for this case is well reproduced, while the intensity is slightly underestimated with a large location error, which is most likely due to the southerly shift or the underestimation of the total precipitation. We again start with a look into the thermodynamic environment with the help of sounding observations at Stuttgart (Germany) near the location of hail occurrence (Fig. 12a, b). At 00:00 UTC, the profile shows a dry layer below 800 hPa and a moist layer probably associated with a cloud at around 850 hPa, and capped by a dry layer above 700 to 500 hPa (Fig. 12a). The observed CIN amounted to −130 J kg−1 and CAPE to only 70 J kg−1, which is not a favorable environment for thunderstorm development. In the morning hours, the stable layer was eroded due to the warming of the near-surface air in the morning hours, making the conditions more favorable for the development of convection. At 12:00 UTC, a deep and well-mixed boundary layer was observed up to 800 hPa, nearly following the dry adiabatic profile. Comparison with the model (Fig. 12b) reveals that the model captures the vertical profile, even though temperature and dew-point temperature do not come as close as in observations at around 800 hPa level. Figure 12d shows a band of very low relative humidity at the 500 hPa level, consistent with a stratospheric intrusion embedded in the strong upper-level westerly flow (Fig. 2e). This band is near the Stuttgart sounding, but slightly to the south of it.
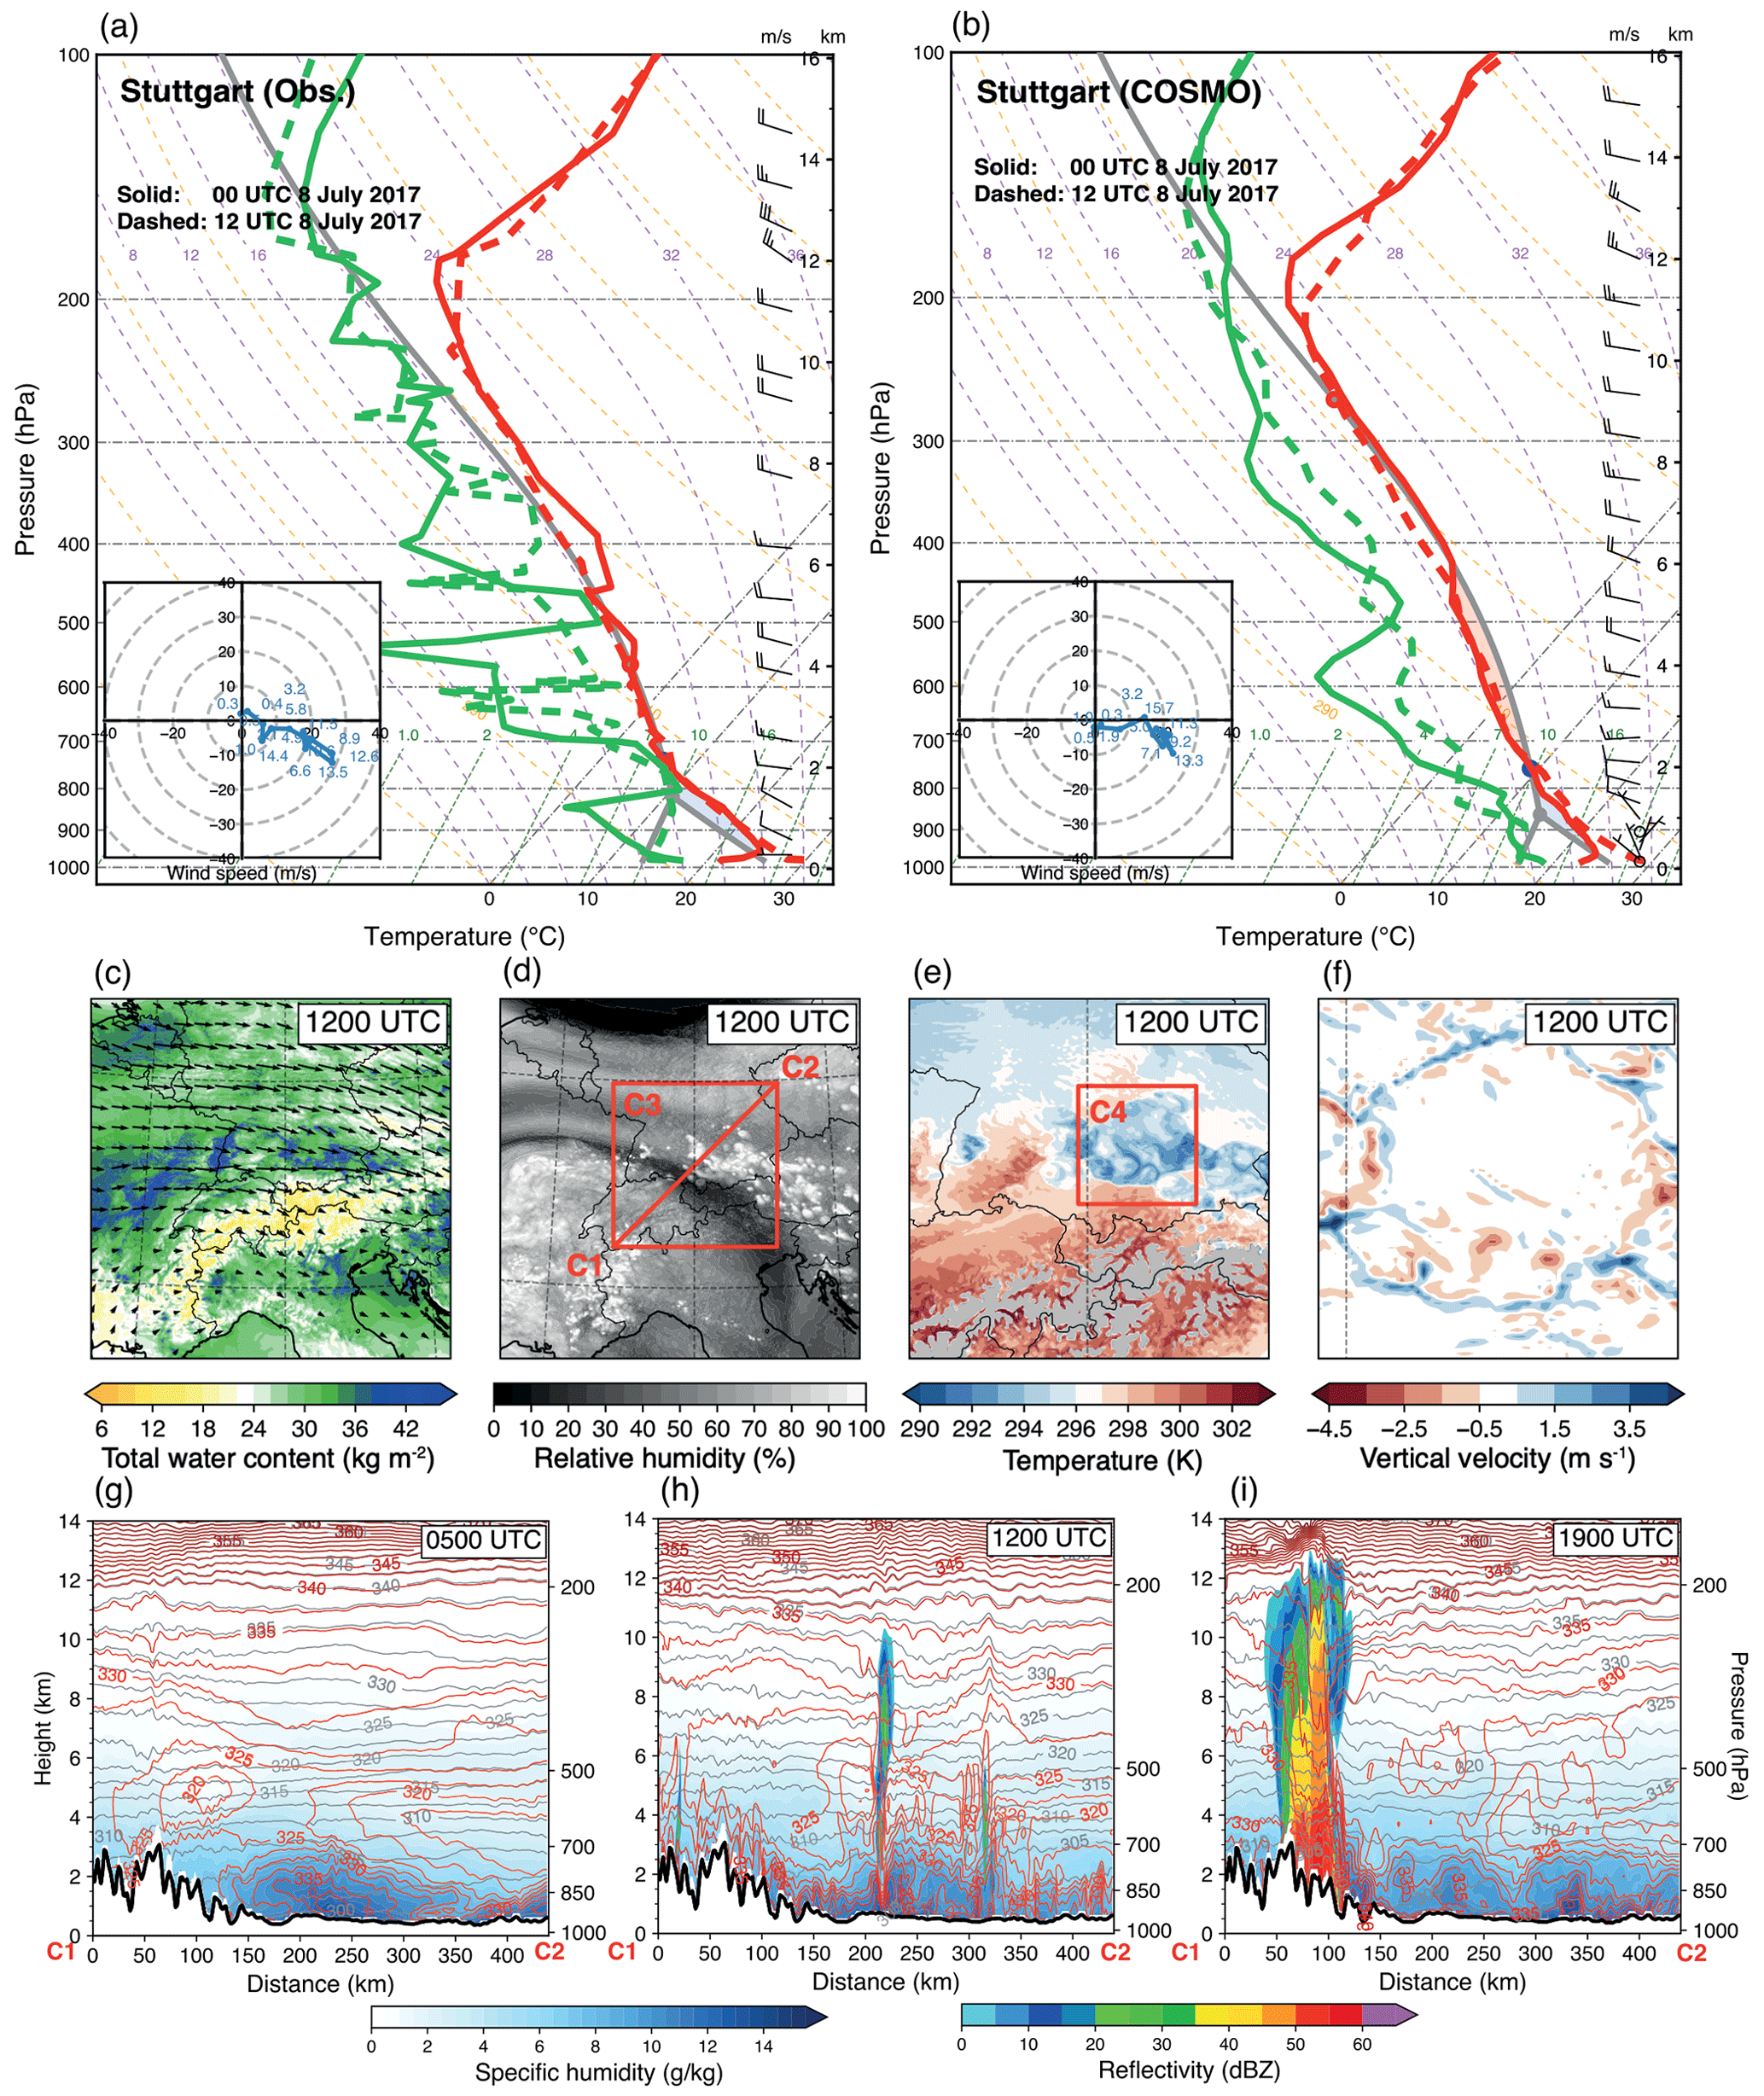
Figure 12As in Fig. 10, but for the case of 8 July 2017. (a) Sounding observations and (b) COSMO extracted profiles at Stuttgart at 00:00 (solid lines) and 12:00 UTC (dashed lines). (c) COSMO simulated total water content, (d) relative humidity at 500 hPa, (e) temperature at 925 hPa, and (f) vertical velocity at 850 hPa at 12:00 UTC on 8 July 2017. The red box C3 in (c) indicates the zoomed subdomain shown in (e), and the box C4 in (d) indicates the zoomed subdomain shown in (f). (g–i) Vertical cross sections of humidity, temperature (red isolines), and simulated radar reflectivity along the red transect C1–C2 in (d).
Further analysis based on the model output, reveals that the westerly flow affected the northern pre-Alpine region (Fig. 12c), eroded the stable layer near the surface, and brought moisture to the northern Alpine foreland. Vertical cross sections across this area at 05:00 UTC show that this dry and cold air was superimposed above the warm and moist layer near the surface (Fig. 12g). With significant instability, hail was initially observed at around 12:00 UTC to the east of the Black Forest when the cold upper-level was advected over the warm near-surface air (Fig. 12h). Subsequently, convective cells associated with hail moved towards Lake Constance. Due to the dry and cold air aloft, evaporative cooling and melting of hydrometeors could lead to stronger and colder downdrafts (Johns and Doswell, 1992). While updrafts also experience entrainment, the overall effect tends to be less evaporative cooling (James and Markowski, 2010). Several isolated cold pools that spread radially away with temperature depressions of 4 K can be identified from the subdomain C3 at 925 hPa level (Fig. 12e). The cold pool induced a large updraft velocity at the leading edge, which is favorable for convective intensification and new cell formation (Fig. 12f). Previous studies showed that the modeling framework is able to capture such developments (Leutwyler et al., 2016). Convective cells associated with observed hail and lightning formed on the southern flank of the Jura mountains at around 13:00 UTC, and later, on the northern flank of the Alps at around 15:00 UTC (Fig. 12i). Several wet downbursts were confirmed by reliable sources (http://www.sturmarchiv.ch/index.php/Hagel, last access: 20 October 2023) in central Switzerland (canton of Bern over Roggwil, around 14:00 UTC, and Wilderswil, around 15:00 UTC) with wind gusts above 90 km h−1.
In this study, we analyzed the simulations of eight observed cases of severe convection. The simulations were performed using a regional climate model, COSMO, at 2.2 km horizontal grid spacing, integrated with HAILCAST and LPI diagnostics over the Alpine-Adriatic region. The performance of the model in simulating total precipitation, hail, and lightning was evaluated against available observations. The main findings are summarized as follows.
Overall, the COSMO model together with HAILCAST and LPI diagnostics performed well in simulating total precipitation, hail, and lightning. In particular, the case-study simulations captured the main characteristics of the cases considered, such as the large-scale precipitation distributions, or the occurrence of elongated hail swaths versus localized hail events controlled by topography (Figs. 4–8). The best performance was obtained for the cases with strong synoptic forcing. This is to some extent associated with the chaotic nature of the underlying dynamics and the lower predictability of localized events. The two cases with the strongest synoptic forcing (1 June 2013 and 17 May 2018) are associated with heavy precipitation (especially 1 June 2013), but with no or very little hail and lightning. Even though the model overestimated the precipitation intensity for these two cases, it produced no or very little hail, which is in accordance with the observations. Overall, we see that the performance in the simulation of hail and lightning is consistent with the model performance for convection. Comparison of the model with radar-based hail estimates revealed that COSMO with HAILCAST tends to underestimate the frequency of large hailstones and fails to produce extra-large hailstones (larger than 40 mm). However, when compared to crowd-sourced and hailpad observations, COSMO shows a good hail size distribution. It is possible that some of the biases could be addressed by tuning the diagnostic computations of hail and lightning.
The ability of COSMO to simulate severe convective storms associated with hail and lightning enables further exploration of the mechanisms that drive such events. By investigating three cases that were selected according to their impacts in different synoptic situations over hot spots of the Alpine-Adriatic region, we identified several storm environments that contribute to the heavy precipitation associated with hail and lightning. These mechanisms include a capping layer that serves to accumulate humidity and energy below this layer (23 July 2009, 25 June 2017), a “back-building process” that contributes to convective cells that remain quasi-stationary near elevated terrain (25 June 2017), dry air above a warm and moist surface that leads to higher instability and stronger downdrafts (8 July 2017), and an upper-level trough that promotes ascent (25 June 2017). The results show that, although the simulations are not designed to simulate the detailed structure, amplitude and location of the events in terms of total precipitation, hail, and lightning, COSMO is generally able to credibly replicate key processes of severe thunderstorms and create the related favorable environments for storm development.
Our findings show that HAILCAST and LPI integrated with COSMO are promising tools to diagnose hail and lightning over the Alpine Adriatic region (as also shown by Malečić et al., 2023). However, a couple of shortcomings are revealed: (i) Comparison of the model to available hail observations reveals that COSMO HAILCAST fails to reproduce extra-large hailstones. The most likely cause for the lack of large hailstones is the underestimation of strong updrafts in COSMO. Such an underestimation is plausible, as with a computational resolution of 2 km, simulations of heavy convection exhibit signs of bulk converge, but not yet structural convergence (Panosetti et al., 2018). In other words, the horizontal scales of the thunderstorm are overestimated, and peak updrafts are underestimated. (ii) The spatial extent of large hailstones is underestimated in COSMO HAILCAST compared to the radar-based observations. We should note the fact that MESHS only provides the estimation of hailstones larger than 20 mm, while POH only provides the probability of hail. (iii) The output of HAILCAST is sensitive to the initial hail embryo size (e.g., the maximum hail diameter always comes from the largest hail embryo) as shown by Adams-Selin and Ziegler (2016); Adams-Selin et al. (2019). (iv) For the LPI, the threshold of vertical velocity should be resolution dependent (Brisson et al., 2021), and thus a comprehensive analysis against observations is required before application. The LPI provides the potential of lightning, not the exact number of lightning flashes, which makes it difficult to evaluate against observations. Thus our analysis was only focused on the coverage or footprints of the lightning.
The promising results of these case studies reveal that kilometer-scale atmospheric models are not only able to simulate thunderstorms and their associated heavy precipitation, but also critical impacts of severe convective storms such as hail and lightning. This gives us confidence in future applications of hail and lightning diagnostics for climate simulations and analyses of potential changes with further warming of the atmosphere, which is part of a parallel ongoing study.
The codes used to obtain the results and simulation outputs in this study are available from the authors upon request. The ERA5 reanalysis data is available from the Copernicus Climate Change Service (C3S) Climate Data Store (https://cds.climate.copernicus.eu/cdsapp#!/dataset/reanalysis-era5-pressure-levels?tab=overview, Hersbach et al., 2020). Hail measurements from the hailpad network in Croatia are available through inquiries from the Croatian Meteorological and Hydrological Service (https://meteo.hr/proizvodi_e.php?section=proizvodi_usluge¶m=services, Croatian Meteorological and Hydrological Service, 2023). Radar products are available through data inquiries from MeteoSwiss (https://www.meteoswiss.admin.ch/about-us/contact/contact-form.html, MeteoSwiss, 2023). Lightning data used in this study can be obtained from the LINET lightning detection network (https://www.nowcast.de/en/solutions/linet-data, Betz et al., 2009).
RC performed the simulations and analysed the model output and observations. RC, NB, MED and CS wrote the manuscript. NB, MED and CS provided scientific advice throughout the project. RA, OF, JJ, and XL ported the GPU version of HAILCAST and LPI in COSMO. All authors read and commented the paper.
The contact author has declared that none of the authors has any competing interests.
Publisher’s note: Copernicus Publications remains neutral with regard to jurisdictional claims made in the text, published maps, institutional affiliations, or any other geographical representation in this paper. While Copernicus Publications makes every effort to include appropriate place names, the final responsibility lies with the authors.
The authors acknowledge the Partnership for Advanced Computing in Europe (PRACE) for awarding us access to Piz Daint at ETH Zürich/Swiss National Supercomputing Centre (CSCS, Switzerland). We also acknowledge the Federal Office for Meteorology and Climatology (MeteoSwiss), CSCS, the Center for Climate Systems Modeling (C2SM) and ETH Zürich for their contributions to the development and maintenance of the GPU-accelerated version of COSMO. Lightning data is obtained from the LINET lightning detection network. The authors would also like to acknowledge MeteoSwiss for providing radar (POH, MESHS) and rain gauge (RhiresD) observations, NASA for providing the IMERG data, University of Wyoming for providing sounding observations, MeteoSwiss and the Mobiliar Lab for Natural Risks of the University of Bern for providing the crowd-sourced hail reports, and members from the department of Geophysics of the University of Zagreb for providing the hailpad observations. We acknowledge Copernicus Climate Change Service (C3S) for generating ERA5 dataset and the German Climate Computing Center (DKRZ) for providing post-processed COSMO-ready ERA5 reanalysis boundary conditions. The authors would like to thank Rebecca Adams-Selin for providing the HAILCAST code and for the advice to implement this component to the COSMO model, Barbara Malečić and Damjan Jelić for fruitful scientific discussions, the editor Johannes Dahl, as well as Olivia Martius and one anonymous referee for their very constructive and useful comments.
The work presented here has been conducted within the SWALDRIC (IZHRZ0-180587) project of the Croatian-Swiss Research Programme co-funded by the Swiss National Science Foundation and the Croatian Science Foundation.
This paper was edited by Johannes Dahl and reviewed by Olivia Martius and one anonymous referee.
Adams-Selin, R. D.: A Three-Dimensional Hail Trajectory Clustering Technique, Mon. Weather Rev., 151, 2361–2375, https://doi.org/10.1175/mwr-d-22-0345.1, 2023. a
Adams-Selin, R. D. and Ziegler, C. L.: Forecasting Hail Using a One-Dimensional Hail Growth Model within WRF, Mon. Weather Rev., 144, 4919–4939, https://doi.org/10.1175/MWR-D-16-0027.1, 2016. a, b, c, d, e
Adams-Selin, R. D., Clark, A. J., Melick, C. J., Dembek, S. R., Jirak, I. L., and Ziegler, C. L.: Evolution of WRF-HAILCAST during the 2014–16 NOAA/Hazardous Weather Testbed Spring Forecasting Experiments, Weather Forecast., 34, 61–79, https://doi.org/10.1175/waf-d-18-0024.1, 2019. a, b, c
Baldauf, M., Seifert, A., Förstner, J., Majewski, D., Raschendorfer, M., and Reinhardt, T.: Operational Convective-Scale Numerical Weather Prediction with the COSMO Model: Description and Sensitivities, Mon. Weather Rev., 139, 3887–3905, https://doi.org/10.1175/MWR-D-10-05013.1, 2011. a, b
Ban, N., Caillaud, C., Coppola, E., Pichelli, E., Sobolowski, S., Adinolfi, M., Ahrens, B., Alias, A., Anders, I., Bastin, S., Belušić, D., Berthou, S., Brisson, E., Cardoso, R. M., Chan, S. C., Christensen, O. B., Fernández, J., Fita, L., Frisius, T., Gašparac, G., Giorgi, F., Goergen, K., Haugen, J. E., Hodnebrog, Ø., Kartsios, S., Katragkou, E., Kendon, E. J., Keuler, K., Lavin-Gullon, A., Lenderink, G., Leutwyler, D., Lorenz, T., Maraun, D., Mercogliano, P., Milovac, J., Panitz, H.-J., Raffa, M., Remedio, A. R., Schär, C., Soares, P. M. M., Srnec, L., Steensen, B. M., Stocchi, P., Tölle, M. H., Truhetz, H., Vergara-Temprado, J., de Vries, H., Warrach-Sagi, K., Wulfmeyer, V., and Zander, M. J.: The first multi-model ensemble of regional climate simulations at kilometer-scale resolution, part I: evaluation of precipitation, Clim. Dynam., 57, 275–302, https://doi.org/10.1007/s00382-021-05708-w, 2021. a, b
Barras, H., Hering, A., Martynov, A., Noti, P. A., Germann, U., and Martius, O.: Experiences with > 50 000 crowdsourced hail reports in Switzerland, B. Am. Meteorol. Soc., 100, 1429–1440, https://doi.org/10.1175/BAMS-D-18-0090.1, 2019. a, b, c
Barras, H., Martius, O., Nisi, L., Schroeer, K., Hering, A., and Germann, U.: Multi-day hail clusters and isolated hail days in Switzerland – large-scale flow conditions and precursors, Weather Clim. Dynam., 2, 1167–1185, https://doi.org/10.5194/wcd-2-1167-2021, 2021. a
Belušić, A., Prtenjak, M. T., Güttler, I., Ban, N., Leutwyler, D., and Schär, C.: Near-surface wind variability over the broader Adriatic region: insights from an ensemble of regional climate models, Clim. Dynam., 50, 4455–4480, https://doi.org/10.1007/s00382-017-3885-5, 2018. a
Betz, H. D., Schmidt, K., Laroche, P., Blanchet, P., Oettinger, W. P., Defer, E., Dziewit, Z., and Konarski, J.: LINET-An international lightning detection network in Europe, Atmos. Res., 91, 564–573, https://doi.org/10.1016/j.atmosres.2008.06.012, 2009 (data available at: https://www.nowcast.de/en/solutions/linet-data) a, b, c
Brimelow, J. C., Reuter, G. W., and Poolman, E. R.: Modeling Maximum Hail Size in Alberta Thunderstorms, Weather Forecast., 17, 1048–1062, https://doi.org/10.1175/1520-0434(2002)017<1048:MMHSIA>2.0.CO;2, 2002. a
Brisson, E., Blahak, U., Lucas-Picher, P., Purr, C., and Ahrens, B.: Contrasting lightning projection using the lightning potential index adapted in a convection-permitting regional climate model, Clim. Dynam., 57, 2037–2051, https://doi.org/10.1007/s00382-021-05791-z, 2021. a, b, c, d, e, f, g, h
Carlson, T. N., Benjamin, S. G., Forbes, G. S., and Li, Y.-F.: Elevated Mixed Layers in the Regional Severe Storm Environment: Conceptual Model and Case Studies, Mon. Weather Rev., 111, 1453–1474, https://doi.org/10.1175/1520-0493(1983)111<1453:emlitr>2.0.co;2, 1983. a
Cintineo, J. L., Smith, T. M., Lakshmanan, V., Brooks, H. E., and Ortega, K. L.: An objective high-resolution hail climatology of the contiguous United States, Weather Forecast., 27, 1235–1248, https://doi.org/10.1175/WAF-D-11-00151.1, 2012. a
Croatian Meteorological and Hydrological Service: DHMZ, DHMZ [data set], https://meteo.hr/proizvodi_e.php?section=proizvodi_usluge¶m=services, last access: 20 October 2023.
FEON: Hydrological Yearbook of Switzerland 2013, https://www.bafu.admin.ch/dam/bafu/en/dokumente/hydrologie/uz-umwelt-zustand/hydrologisches_jahrbuchderschweiz2013.pdf (last access: 13 September 2023), 2013. a
Fierro, A. O., Mansell, E. R., MacGorman, D. R., and Ziegler, C. L.: The Implementation of an Explicit Charging and Discharge Lightning Scheme within the WRF-ARW Model: Benchmark Simulations of a Continental Squall Line, a Tropical Cyclone, and a Winter Storm, Mon. Weather Rev., 141, 2390–2415, https://doi.org/10.1175/mwr-d-12-00278.1, 2013. a
Foote, B., Krauss, T. W., and Makitov, V.: Hail matrics using convectional radar, in: Proceedings of 16th Conference on Planned and Inadvertent Weather Modification, American Meteorological Society, San Diego, CA, https://ams.confex.com/ams/pdfpapers/86773.pdf (last access: 20 October 2023), 2005. a
Germann, U., Boscacci, M., Clementi, L., Gabella, M., Hering, A., Sartori, M., Sideris, I. V., and Calpini, B.: Weather Radar in Complex Orography, Remote Sensing, 14, 503, https://doi.org/10.3390/rs14030503, 2022. a
Grams, C. M., Binder, H., Pfahl, S., Piaget, N., and Wernli, H.: Atmospheric processes triggering the central European floods in June 2013, Nat. Hazards Earth Syst. Sci., 14, 1691–1702, https://doi.org/10.5194/nhess-14-1691-2014, 2014. a
GVZ: Geschäftsbericht 2013, Gebäudeversicherung Kanton Zürich, https://www.gvz.ch/_file/146/gvz-geschaeftsbericht-2013.pdf, (last access: 13 September 2023), 2013. a
Hentgen, L., Ban, N., Kröner, N., Leutwyler, D., and Schär, C.: Clouds in Convection-Resolving Climate Simulations Over Europe, J. Geophys. Res.-Atmos., 124, 3849–3870, https://doi.org/10.1029/2018JD030150, 2019. a
Hersbach, H., Bell, B., Berrisford, P., Hirahara, S., Horányi, A., Muñoz-Sabater, J., Nicolas, J., Peubey, C., Radu, R., Schepers, D., Simmons, A., Soci, C., Abdalla, S., Abellan, X., Balsamo, G., Bechtold, P., Biavati, G., Bidlot, J., Bonavita, M., Chiara, G., Dahlgren, P., Dee, D., Diamantakis, M., Dragani, R., Flemming, J., Forbes, R., Fuentes, M., Geer, A., Haimberger, L., Healy, S., Hogan, R. J., Hólm, E., Janisková, M., Keeley, S., Laloyaux, P., Lopez, P., Lupu, C., Radnoti, G., Rosnay, P., Rozum, I., Vamborg, F., Villaume, S., and Thépaut, J.-N.: The ERA5 global reanalysis, Q. J. Roy. Meteor. Soc., 146, 1999–2049, https://doi.org/10.1002/qj.3803, 2020 (data available at: https://cds.climate.copernicus.eu/cdsapp#!/dataset/reanalysis-era5-pressure-levels?tab=overview). a, b
Huffman, G., Stocker, E., Bolvin, D., Nelkin, E., and Tan, J.: GPM IMERG Final Precipitation L3 Half Hourly 0.1 degree x 0.1 degree V06, GES DISC [data set], https://doi.org/10.5067/GPM/IMERG/3B-HH/06, 2019. a
James, R. P. and Markowski, P. M.: A Numerical Investigation of the Effects of Dry Air Aloft on Deep Convection, Mon. Weather Rev., 138, 140–161, https://doi.org/10.1175/2009mwr3018.1, 2010. a
Jelić, D., Megyeri, O. A., Malečić, B., Belušić Vozila, A., Strelec Mahović, N., and Telišman Prtenjak, M.: Hail Climatology Along the Northeastern Adriatic, J. Geophys. Res.-Atmos., 125, e2020JD032749, https://doi.org/10.1029/2020JD032749, 2020. a
Jelić, D., Prtenjak, M. T., Malečić, B., Vozila, A. B., Megyeri, O. A., and Renko, T.: A new approach for the analysis of deep convective events: Thunderstorm intensity index, Atmosphere, 12, 908, https://doi.org/10.3390/atmos12070908, 2021. a
Joe, P., Burgess, D., Potts, R., Keenan, T., Stumpf, G., and Treloar, A.: The S2K Severe Weather Detection Algorithms and Their Performance, Weather Forecast., 19, 43–63, https://doi.org/10.1175/1520-0434(2004)019<0043:tsswda>2.0.co;2, 2004. a
Johns, R. H. and Doswell, C. A.: Severe Local Storms Forecasting, Weather Forecast., 7, 588–612, https://doi.org/10.1175/1520-0434(1992)007<0588:SLSF>2.0.CO;2, 1992. a
Kalthoff, N., Adler, B., Barthlott, C., Corsmeier, U., Mobbs, S., Crewell, S., Träumner, K., Kottmeier, C., Wieser, A., Smith, V., and Di Girolamo, P.: The impact of convergence zones on the initiation of deep convection: A case study from COPS, Atmos. Res., 93, 680–694, https://doi.org/10.1016/j.atmosres.2009.02.010, 2009. a
Keil, C., Heinlein, F., and Craig, G. C.: The convective adjustment time-scale as indicator of predictability of convective precipitation, Q. J. Roy. Meteor. Soc., 140, 480–490, https://doi.org/10.1002/qj.2143, 2013. a, b
Lac, C., Chaboureau, J.-P., Masson, V., Pinty, J.-P., Tulet, P., Escobar, J., Leriche, M., Barthe, C., Aouizerats, B., Augros, C., Aumond, P., Auguste, F., Bechtold, P., Berthet, S., Bielli, S., Bosseur, F., Caumont, O., Cohard, J.-M., Colin, J., Couvreux, F., Cuxart, J., Delautier, G., Dauhut, T., Ducrocq, V., Filippi, J.-B., Gazen, D., Geoffroy, O., Gheusi, F., Honnert, R., Lafore, J.-P., Lebeaupin Brossier, C., Libois, Q., Lunet, T., Mari, C., Maric, T., Mascart, P., Mogé, M., Molinié, G., Nuissier, O., Pantillon, F., Peyrillé, P., Pergaud, J., Perraud, E., Pianezze, J., Redelsperger, J.-L., Ricard, D., Richard, E., Riette, S., Rodier, Q., Schoetter, R., Seyfried, L., Stein, J., Suhre, K., Taufour, M., Thouron, O., Turner, S., Verrelle, A., Vié, B., Visentin, F., Vionnet, V., and Wautelet, P.: Overview of the Meso-NH model version 5.4 and its applications, Geosci. Model Dev., 11, 1929–1969, https://doi.org/10.5194/gmd-11-1929-2018, 2018. a
Lagasio, M., Parodi, A., Procopio, R., Rachidi, F., and Fiori, E.: Lightning Potential Index performances in multimicrophysical cloud-resolving simulations of a back-building mesoscale convective system: The Genoa 2014 event, J. Geophys. Res.-Atmos., 122, 4238–4257, https://doi.org/10.1002/2016jd026115, 2017. a
Lanicci, J. M. and Warner, T. T.: A Synoptic Climatology of the Elevated Mixed-Layer Inversion over the Southern Great Plains in Spring. Part I: Structure, Dynamics, and Seasonal Evolution, Weather Forecast., 6, 181–197, https://doi.org/10.1175/1520-0434(1991)006<0181:ASCOTE>2.0.CO;2, 1991. a
Leutwyler, D., Fuhrer, O., Lapillonne, X., Lüthi, D., and Schär, C.: Towards European-scale convection-resolving climate simulations with GPUs: a study with COSMO 4.19, Geosci. Model Dev., 9, 3393–3412, https://doi.org/10.5194/gmd-9-3393-2016, 2016. a, b
Leutwyler, D., Lüthi, D., Ban, N., Fuhrer, O., and Schär, C.: Evaluation of the convection-resolving climate modeling approach on continental scales, J. Geophys. Res.-Atmos., 122, 5237–5258, https://doi.org/10.1002/2016JD026013, 2017. a
Luo, L., Xue, M., and Zhu, K.: The Initiation and Organization of a Severe Hail-Producing Mesoscale Convective System in East China: A Numerical Study, J. Geophys. Res.-Atmos., 125, 1–23, https://doi.org/10.1029/2020JD032606, 2020. a
Lüthi, S., Ban, N., Kotlarski, S., Steger, C. R., Jonas, T., and Schär, C.: Projections of Alpine Snow-Cover in a High-Resolution Climate Simulation, Atmosphere, 10, 463, https://doi.org/10.3390/atmos10080463, 2019. a
Lynn, B. and Yair, Y.: Prediction of lightning flash density with the WRF model, Adv. Geosci., 23, 11–16, https://doi.org/10.5194/adgeo-23-11-2010, 2010. a, b
Malečić, B., Prtenjak, M. T., Horvath, K., Jelić, D., Jurković, P. M., Ćorko, K., and Mahović, N. S.: Performance of HAILCAST and the Lightning Potential Index in simulating hailstorms in Croatia in a mesoscale model – Sensitivity to the PBL and microphysics parameterization schemes, Atmos. Res., 272, 106143, https://doi.org/10.1016/j.atmosres.2022.106143, 2022. a, b
Malečić, B., Cui, R., Demory, M. E., Horvath, K., Jelić, D., Schär, C., Prtenjak, M. T., Velasquez, P., and Ban, N.: Simulating Hail and Lightning Over the Alpine Adriatic Region – A Model Intercomparison Study, J. Geophys. Res.-Atmos., 128, e2022JD037989, https://doi.org/10.1029/2022jd037989, 2023. a, b
Markowski, P. and Richardson, Y.: Mesoscale Meteorology in Midlatitudes, Wiley, https://doi.org/10.1002/9780470682104, 2010. a
MeteoSwiss: Klimabulletin Juni 2017, https://www.meteoswiss.admin.ch/services-and-publications/publications/reports-and-bulletins/2017/klimabulletin-juni-2017.html (last access: 13 September 2023), 2017. a, b
MeteoSwiss: MeteoSwiss Contact Form, https://www.meteoswiss.admin.ch/about-us/contact/contact-form.html, last access: 20 October 2023.
NCCS: Hail Climate Switzerland – National hail hazard maps, https://www.nccs.admin.ch/nccs/en/home/the-nccs/priority-themes/hail-climate-switzerland/brochure-technical-report.html (last access: 13 September 2023), 2021. a
Nisi, L., Martius, O., Hering, A., Kunz, M., and Germann, U.: Spatial and temporal distribution of hailstorms in the Alpine region: A long-term, high resolution, radar-based analysis, Q. J. Roy. Meteor. Soc., 142, 1590–1604, https://doi.org/10.1002/qj.2771, 2016. a, b, c, d, e, f
Nisi, L., Hering, A., Germann, U., and Martius, O.: A 15-year hail streak climatology for the Alpine region, Q. J. Roy. Meteor. Soc., 144, 1429–1449, https://doi.org/10.1002/qj.3286, 2018. a, b, c
Panosetti, D., Schlemmer, L., and Schär, C.: Convergence behavior of idealized convection-resolving simulations of summertime deep moist convection over land, Clim. Dynam., 55, 215–234, https://doi.org/10.1007/s00382-018-4229-9, 2018. a
Pichelli, E., Coppola, E., Sobolowski, S., Ban, N., Giorgi, F., Stocchi, P., Alias, A., Belušić, D., Berthou, S., Caillaud, C., Cardoso, R. M., Chan, S., Christensen, O. B., Dobler, A., de Vries, H., Goergen, K., Kendon, E. J., Keuler, K., Lenderink, G., Lorenz, T., Mishra, A. N., Panitz, H.-J., Schär, C., Soares, P. M. M., Truhetz, H., and Vergara-Temprado, J.: The first multi-model ensemble of regional climate simulations at kilometer-scale resolution part 2: historical and future simulations of precipitation, Clim. Dynam., 56, 3581–3602, https://doi.org/10.1007/s00382-021-05657-4, 2021. a
Počakal, D., Večenaj, Ž., and Štalec, J.: Hail characteristics of different regions in continental part of Croatia based on influence of orography, Atmos. Res., 93, 516–525, https://doi.org/10.1016/j.atmosres.2008.10.017, 2009. a, b, c
Poolman, E.: Die voorspelling van haelkorrelgroei in Suid-Afrika (The forecasting of hail growth in South Africa), Master's thesis, University of Pretoria, 1992. a
Prein, A. F., Langhans, W., Fosser, G., Ferrone, A., Ban, N., Goergen, K., Keller, M., Tölle, M., Gutjahr, O., Feser, F., Brisson, E., Kollet, S., Schmidli, J., van Lipzig, N. P. M., and Leung, R.: A review on regional convection-permitting climate modeling: Demonstrations, prospects, and challenges, Rev. Geophys., 53, 323–361, https://doi.org/10.1002/2014RG000475, 2015. a
Púčik, T., Castellano, C., Groenemeijer, P., Kühne, T., Rädler, A. T., Antonescu, B., and Faust, E.: Large hail incidence and its economic and societal impacts across Europe, Mon. Weather Rev., 147, 3901–3916, https://doi.org/10.1175/mwr-d-19-0204.1, 2019. a
Punge, H. J. and Kunz, M.: Hail observations and hailstorm characteristics in Europe: A review, Atmos. Res., 176-177, 159–184, https://doi.org/10.1016/j.atmosres.2016.02.012, 2016. a, b, c
Reinhardt, T. and Seifert, A.: A three-category ice scheme for LMK, COMSO Newsletter, 6, 115–120, http://www.cosmo-model.org/content/model/documentation/newsLetters/newsLetter06/newsLetter_06.pdf (last access: 20 October 2023), 2006. a
Ritter, B. and Geleyn, J.-F.: A Comprehensive Radiation Scheme for Numerical Weather Prediction Models with Potential Applications in Climate Simulations, Mon. Weather Rev., 120, 303–325, https://doi.org/10.1175/1520-0493(1992)120<0303:acrsfn>2.0.co;2, 1992. a
Romps, D. M., Seeley, J. T., Vollaro, D., and Molinari, J.: Projected increase in lightning strikes in the united states due to global warming, Science, 346, 851–854, https://doi.org/10.1126/science.1259100, 2014. a
Schär, C., Fuhrer, O., Arteaga, A., Ban, N., Charpilloz, C., Di Girolamo, S., Hentgen, L., Hoefler, T., Lapillonne, X., Leutwyler, D., Osterried, K., Panosetti, D., Rüdisühli, S., Schlemmer, L., Schulthess, T. C., Sprenger, M., Ubbiali, S., and Wernli, H.: Kilometer-Scale Climate Models: Prospects and Challenges, B. Am. Meteorol. Soc., 101, E567–E587, https://doi.org/10.1175/BAMS-D-18-0167.1, 2020. a
Schemm, S., Nisi, L., Martinov, A., Leuenberger, D., and Martius, O.: On the link between cold fronts and hail in Switzerland, Atmos. Sci. Lett., 17, 315–325, https://doi.org/10.1002/asl.660, 2016. a
Schmid, W., Schiesser, H. H., and Waldvogel, A.: The Kinetic Energy of Hailfalls. Part IV: Patterns of Hailpad and Radar Data, J. Appl. Meteorol., 31, 1165–1178, https://doi.org/10.1175/1520-0450(1992)031<1165:tkeohp>2.0.co;2, 1992. a
Schumann, U.: Influence of Mesoscale Orography on Idealized Cold Fronts, J. Atmos. Sci., 44, 3423–3441, https://doi.org/10.1175/1520-0469(1987)044<3423:iomooi>2.0.co;2, 1987. a
Seeley, J. T. and Romps, D. M.: The Effect of Global Warming on Severe Thunderstorms in the United States, J. Climate, 28, 2443–2458, https://doi.org/10.1175/jcli-d-14-00382.1, 2015. a
Takahashi, T.: Riming Electrification as a Charge Generation Mechanism in Thunderstorms, J. Atmos. Sci., 35, 1536–1548, https://doi.org/10.1175/1520-0469(1978)035<1536:REAACG>2.0.CO;2, 1978. a
Tiedtke, M.: A Comprehensive Mass Flux Scheme for Cumulus Parameterization in Large-Scale Models, Mon. Weather Rev., 117, 1779–1800, https://doi.org/10.1175/1520-0493(1989)117<1779:ACMFSF>2.0.CO;2, 1989. a
Trefalt, S., Martynov, A., Barras, H., Besic, N., Hering, A. M., Lenggenhager, S., Noti, P., Röthlisberger, M., Schemm, S., Germann, U., and Martius, O.: A severe hail storm in complex topography in Switzerland – Observations and processes, Atmos. Res., 209, 76–94, https://doi.org/10.1016/j.atmosres.2018.03.007, 2018. a
Treloar, A.: Vertically integrated radar reflectivity as an indicator of hail size in the greater Sydney region of Australia, in: Proceedings of 19th Conference on Severe Local Storms, American Meteorological Society, Minneapolis, MN, 14–18 September 1998, 48–51, 1998. a
Vergara-Temprado, J., Ban, N., Panosetti, D., Schlemmer, L., and Schär, C.: Climate models permit convection at much coarser resolutions than previously considered, J. Climate, 33, 1915–1933, https://doi.org/10.1175/JCLI-D-19-0286.1, 2020. a
Waldvogel, A., Federer, B., and Grimm, P.: Criteria for the Detection of Hail Cells, J. Appl. Meteorol., 18, 1521–1525, https://doi.org/10.1175/1520-0450(1979)018<1521:cftdoh>2.0.co;2, 1979. a
Wernli, H., Paulat, M., Hagen, M., and Frei, C.: SAL – A novel quality measure for the verification of quantitative precipitation forecasts, Mon. Weather Rev., 136, 4470–4487, https://doi.org/10.1175/2008MWR2415.1, 2008. a, b
Wüest, M., Frei, C., Altenhoff, A., M.Hagen, Litschi, M., and Schär, C.: A gridded hourly precipitation dataset for Switzerland using rain-gauge analysis and radar-based disaggregation, Int. J. Climatol., 30, 1764–1775, 2010. a
Yair, Y., Lynn, B., Price, C., Kotroni, V., Lagouvardos, K., Morin, E., Mugnai, A., and del Carmen Llasat, M.: Predicting the potential for lightning activity in Mediterranean storms based on the Weather Research and Forecasting (WRF) model dynamic and microphysical fields, J. Geophys. Res., 115, D04205, https://doi.org/10.1029/2008jd010868, 2010. a, b
Zimmer, M., Craig, G. C., Keil, C., and Wernli, H.: Classification of precipitation events with a convective response timescale and their forecasting characteristics, Geophys. Res. Lett., 38, L05802, https://doi.org/10.1029/2010gl046199, 2011. a