the Creative Commons Attribution 4.0 License.
the Creative Commons Attribution 4.0 License.
 | 10 Sep 2024
The connection between North Atlantic storm track regimes and eastern Mediterranean cyclonic activity
Hadas Saaroni
Baruch Ziv
Talia Tamarin-Brodsky
Nili Harnik
A unique chain connects the flow over the North Atlantic and the development of cyclones within the Mediterranean basin. One typical mechanism includes several successive processes: upper-level flow perturbations upstream cause Rossby wave breaking (RWB) events along the jet stream, which in turn develop into potential vorticity streamers. These streamers reach the Mediterranean, and through increased baroclinicity they enhance cyclonic activity in the region. Using European Centre for Medium-Range Weather Forecasts (ECMWF) reanalysis v5 (ERA5) data and rain gauge measurements, we provide a systematic analysis connecting wintertime North Atlantic storm track regimes and eastern Mediterranean cyclones and rainfall. To do so, we use different detection algorithms for each element in the chain (RWBs, streamers and cyclones). A cluster analysis of upper-tropospheric eddy kinetic energy reveals a favorable configuration of the storm track where North Atlantic storms are able to propagate farther northeast. This results in upper-level potential vorticity streamers forming more eastward alongside above-average precipitation over the Levant. Meanwhile, other latitudinal positions of the storm track (southward or northward) were found to hinder cyclonic activity in the region and reduce rainfall there. The intense rainy winter of 1991–1992 is brought as a test case to exemplify this mechanism in its extreme. We show that the rain-enhancing storm track regime was prominent throughout most of this season, alongside frequent streamers in the eastern Mediterranean.
- Article
(9951 KB) - Full-text XML
- BibTeX
- EndNote


The Mediterranean basin is considered to be one of the most cyclogenetic regions on the globe. Cyclones have significant societal and environmental impacts on the basin, as they are responsible for the majority of wintertime precipitation (Saaroni et al., 2010; Flaounas et al., 2022) and can be associated with extreme weather phenomena (e.g., floods, strong winds). A combination of geographical and dynamical features of the region is favorable for the formation and development of lows: the temperature contrast between the warmer sea and adjacent land, strong baroclinicity in the presence of the jet stream, and the surrounding mountain ranges serving as orographic drivers of convergence and vertical air motion.
Aside from the inherent cyclogenetic drivers in the basin, the activity of lows is also modulated by large-scale flow surrounding the region. These supply the Mediterranean with moisture, heat and energy, which affect cyclone formation and development (Seager et al., 2020). This occurs mostly via changes to upper-level flows, which are known to play a major role throughout the life cycle of cyclones.
When northerly-flowing cold upper-tropospheric air reaches the Mediterranean, it increases atmospheric instability and downstream upper-level divergence, thus creating overall favorable conditions for baroclinic growth (Flaounas et al., 2015, 2021). In terms of potential vorticity (PV), these flows adiabatically advect strong positive PV anomalies (from either tropospheric or stratospheric origins) that induce cyclonic motion. In fact, Flaounas et al. (2015) describe Mediterranean cyclones as “PV towers”, a tilted positive anomaly spanning vertically from the surface to the tropopause. Dynamically, these upper-level structures are classified as troughs (synoptic-scale jet undulations) or PV streamers, which are narrower and more intense. In the case of Israel, for example, trough orientation and location were shown to be crucial to rainfall distribution (Zangvil and Druian, 1990; Ziv et al., 2006).
While extratropical cyclones have additional sources of PV (Čampa and Wernli, 2012), they are usually smaller by an order of magnitude (Flaounas et al., 2021). The authors examined the vertical PV profiles of a hundred intense Mediterranean cyclones and noted that while upper-level adiabatic advection was the most dominant process, most profiles also included low-level diabatic heating. The ratio between the two led the authors to classify cyclones as adiabatically driven, diabatically driven or mixed.
The upper-level flow over the Mediterranean connects Mediterranean cyclones to the large-scale circulation around the basin. Four major elements of extratropical circulation have been linked to either precipitation or cyclonic activity in the Mediterranean: undulations of the polar jet stream, the North Atlantic storm track, subseasonal Rossby wave packets and the subtropical jet entrance.
While the four components are interconnected (Watanabe, 2004; Novak et al., 2015; Raveh-Rubin and Wernli, 2015; Raveh-Rubin and Flaounas, 2017), they all broadly relate to the same dynamical chain. Figure 1 shows a generalized depiction of this process. First, a low-level forcing creates a perturbation of the upper-tropospheric flow upstream of the Mediterranean. This perturbation grows and propagates along the polar jet stream. After breaching southward towards the Mediterranean, the meridionally elongated anomaly can interact with Mediterranean cyclones, enhancing their cyclogenesis and development.
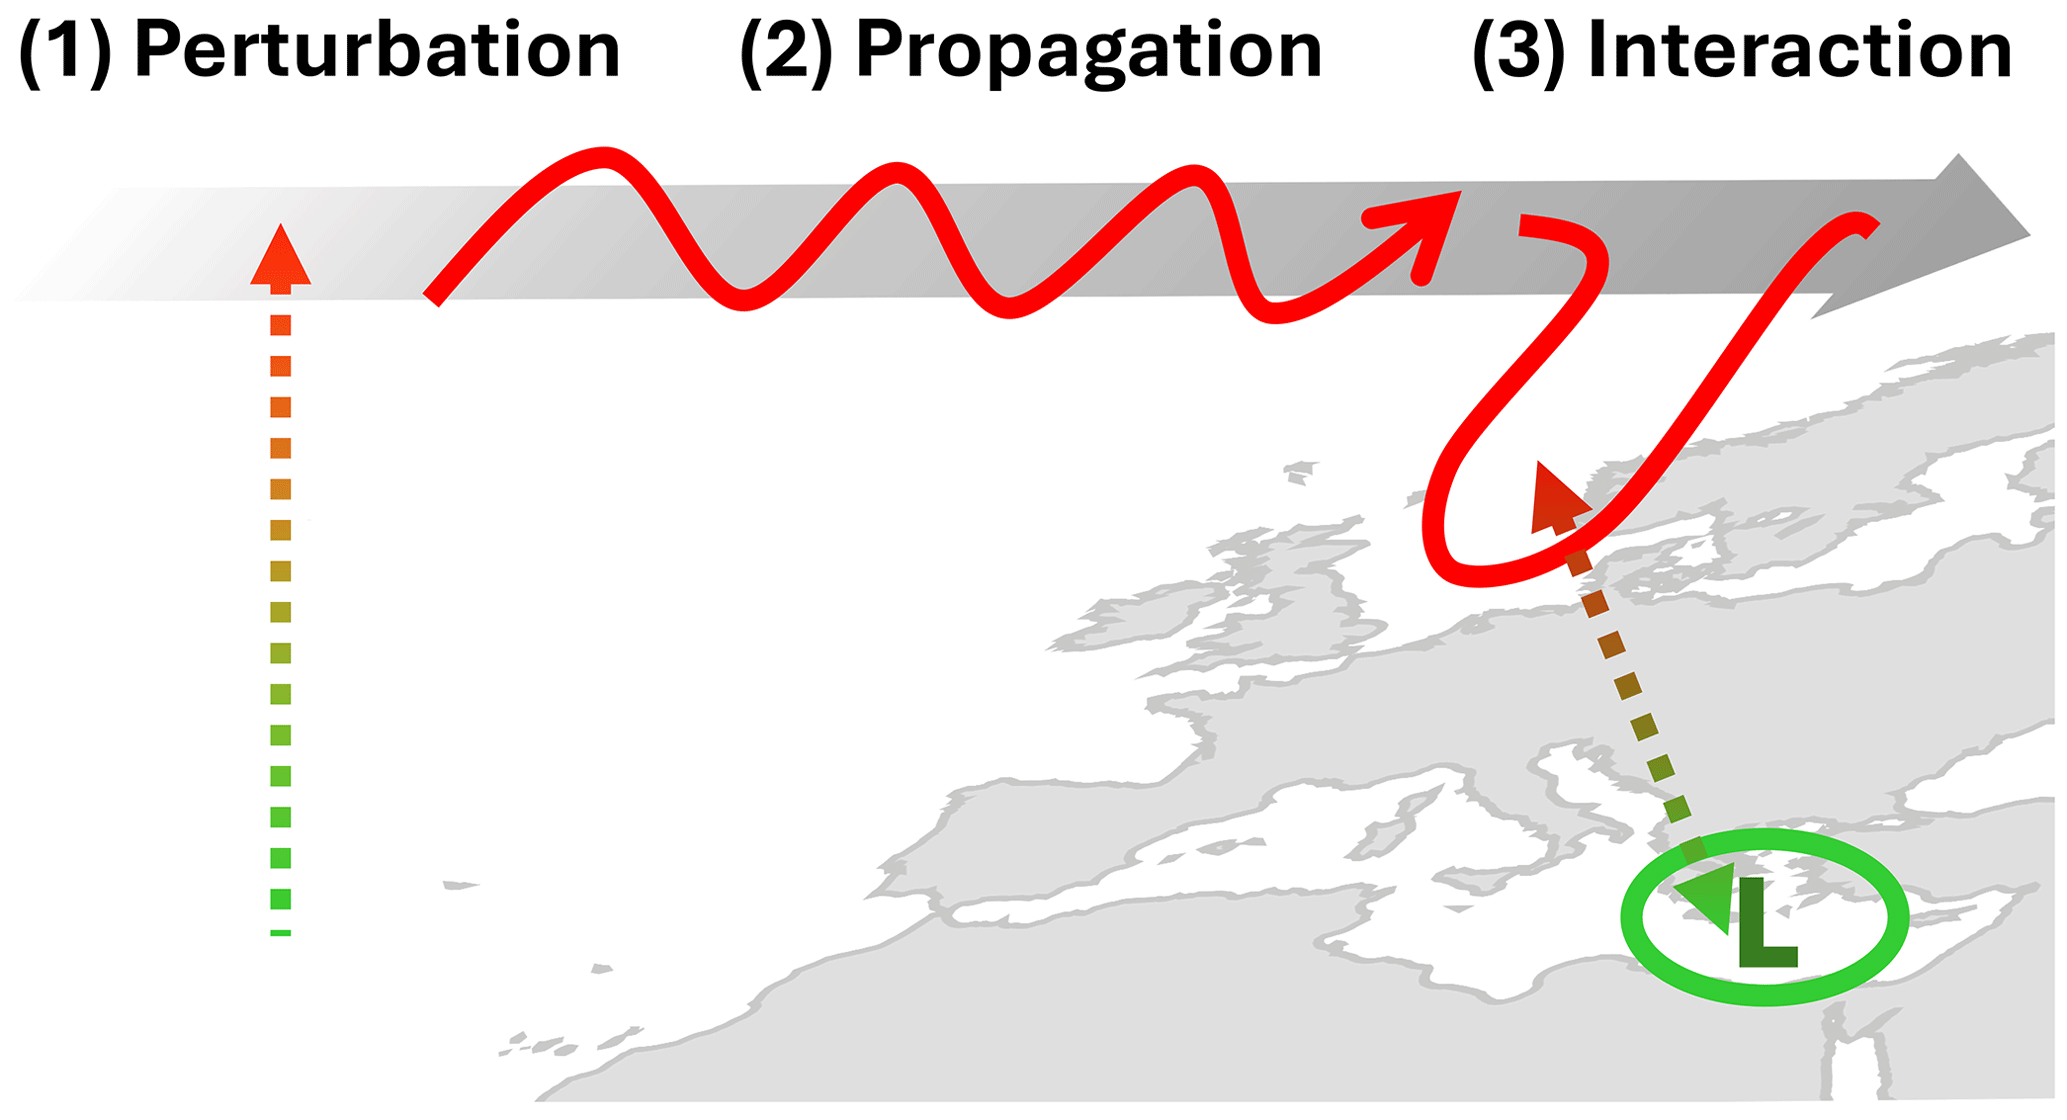
Figure 1A schematic description of the dynamical chain connecting North Atlantic circulation to Mediterranean cyclogenesis. The left dotted arrow denotes a low-level structure (green) with influence on upper-tropospheric flow (red). Examples of this include a North Atlantic cyclone with a warm conveyor belt or a surface high inducing upper-level convergence. The initial perturbation is advected eastward by the mean flow (grey arrow) and develops meridionally. Lastly, a baroclinic interaction occurs between the phase-shifted upper-level anomaly and a surface low (green circle).
The Atlantic jet stream is therefore the main vehicle of PV anomalies in the propagation phase, and its undulations form cyclone-enhancing upper-level troughs. Shifts in jet latitude and the zonal extent of the jet exit region have been linked to differences in cyclone track density and Mediterranean precipitation variability on different timescales. The latitudinal displacement of the jet is correlated to east–west seasonal precipitation anomalies in the basin (Gaetani et al., 2011; Beghin et al., 2016), sometimes known as the Mediterranean seesaw. A more zonal and southern jet results in increased precipitation over the western Mediterranean, while a northeasterly-tilted configuration corresponds to wetter conditions over the eastern Mediterranean. Additionally, during anticyclonic Rossby wave breaking events (RWBs), the meridional PV gradient on the jet is reversed, and the resulting streamers create favorable conditions for intense cyclones near the jet exit region (Raveh-Rubin and Flaounas, 2017; Priestley et al., 2020; Tamarin-Brodsky and Harnik, 2024).
While generally less explored in this context, the subtropical jet has been linked to Mediterranean cyclones. Brayshaw et al. (2010) defined the intensity and location of the jet entrance as a “key meteorological forcing” of the Mediterranean storm track (i.e., the perturbation step in Fig. 1). Wiegand and Knippertz (2014) stress the role of subtropical wave trains in predicting intense PV streamers and RWB events over the region.
North Atlantic storms (and their Eulerian representation, the North Atlantic storm track) can affect Mediterranean cyclonic activity from a distance through dynamical proxies. One such dynamical pathway for the formation of intense Mediterranean cyclones is described in Raveh-Rubin and Flaounas (2017), hereafter RRF17. This mechanism includes four steps: one or several North Atlantic cyclones produce a warm conveyor belt (WCB) flow (i.e., perturbation). The WCB contributes to an intensifying upper-level ridge over the North Atlantic (Pfahl et al., 2015). This results in anticyclonic Rossby wave breaking downstream (i.e., propagation), the southern flank of which extends into a cyclone-inducing PV streamer over the Mediterranean (i.e., interaction). This process was demonstrated for a set of 200 intense Mediterranean cyclones in reanalysis (Raveh-Rubin and Flaounas, 2017) as well as several semi-idealized simulations (Scherrmann et al., 2024). Additional works further highlighted specific links within this mechanism: North Atlantic cyclones and RWBs (Pantillon et al., 2015; Portmann et al., 2020), RWBs and Mediterranean cyclones (Tamarin-Brodsky and Harnik, 2024), and the role of WCBs throughout (Ziv et al., 2010; Madonna et al., 2014; Berkovic and Raveh-Rubin, 2022; Joos et al., 2023). Alternatively, some western Mediterranean cyclones are directly impacted by their North Atlantic counterparts via clustering. In this case, a secondary smaller low is formed near an existing storm (Ziv et al., 2015; Saaroni et al., 2017; Priestley et al., 2020).
The Atlantic–Mediterranean connection is also supported by subseasonal Rossby wave packets (RWPs). These intermediate-scale waves (k∼5) propagate mostly zonally over long distances along the jet stream. They do so with little to no phase speed, which means that they create persistent anomalous ridge–rough pairs which can inhabit the same region for several days (belonging to both propagation and interaction stages in Fig. 1). RWPs with meridional anomalies over the central-eastern Mediterranean are a prominent feature of extreme winters over Israel (Feldstein and Dayan, 2008), depending on their phase. Other studies have also found a similar wave configuration in relation to Mediterranean rainfall (Saaroni et al., 2015; Redolat et al., 2019; Ali et al., 2021; Berkovic and Raveh-Rubin, 2022).
The positive phase of the North Atlantic Oscillation (NAO) can sometimes trigger the propagation of one such wave packet (Watanabe, 2004). A surface high forms in the western Mediterranean, prompting upper-level convergence which excites a wave train along the jet. Watanabe (2004) dubbed this process “the NAO downstream extension”, and it can be classified under the perturbation step in Fig. 1. NAO phase variability has also been linked to cyclone track density anomalies in the western Mediterranean (Nissen et al., 2010) and, to a lesser extent, to rainfall in Israel (Black, 2012).
While considerable efforts have been made to understand the large-scale dynamical drivers of Mediterranean cyclonic activity, their relevance to the eastern part of the basin remains an open question. As it is further downstream, the eastern Mediterranean is generally weakly correlated to modes like the North Atlantic Oscillation (Nissen et al., 2010), and upper-level anomalies (e.g., RWBs, streamers) are more prominent closer to the Atlantic. Additionally, as eastern Mediterranean lows are shallower compared to the west, they are often mostly filtered out in studies examining intense storms.
Therefore, in this work we investigate the relation between the North Atlantic region and eastern Mediterranean cyclonic activity and rainfall. Our focus is on the North Atlantic storm track due to its relevant signal on multiple timescales (from single synoptic systems to seasonal flow regimes) and its interaction with various elements along the cyclogenesis dynamical chain (Brayshaw et al., 2010; Novak et al., 2015; Raveh-Rubin and Flaounas, 2017). Additionally, the North Atlantic storm track might serve as a potential proxy for climate predictability in an effort to reduce climate models' inherent uncertainties with respect to Mediterranean cyclones and their impacts (Hochman et al., 2020; Voskresenskaya et al., 2022; Reale et al., 2022).
More specifically, we examine how different regimes of the North Atlantic storm track relate to cyclone-inducing flow downstream on synoptic and seasonal timescales. We then inspect whether this connection can be interpreted via the perturbation–propagation–interaction framework (Fig. 1), using explicit analysis of relevant dynamical elements (namely, RWB events, PV streamers and cyclone tracks). Rossby wave packets will not be directly analyzed in this work. While relevant for eastern Mediterranean precipitation, their connection to the North Atlantic storm track is less apparent.
Data and methods are detailed in Sect. 2, and results are presented in Sect. 3, followed by their discussion in Sect. 4.
2.1 Datasets used
This work is based on data from the European Centre for Medium-Range Weather Forecasts (ECMWF) reanalysis v5 dataset (ERA5; Hersbach et al., 2023). The fields used are mean sea level pressure (SLP), upper-level geopotential height (z) and horizontal wind components (u, v) at 500 and 300 hPa. Additionally, the ERA5 isentropic potential vorticity (PV) field is taken from the 315 K potential temperature level. The North Atlantic domain used in the analysis is set between 25–70° N and 90° W–40° E. When relevant, cosine latitude weighting was applied to the data. All fields are analyzed for the mid-winter months (December–February, DJF) between 1979 and 2019 and have a spatial resolution of 1.25°×1.25°. The interpolation from the ERA5 default resolution (0.25°) to a coarser one was operated by the Copernicus Climate Change Service (C3S). This was done to reduce smaller-scale noise and to allow for better comparisons to global climate models in future works.
Rain values in the Mediterranean are taken from ERA5 at default resolution. For Israeli rainfall, we use measurements from 21 rain stations produced by the Israel Meteorological Service (IMS). Stations cover central and northern Israel and represent the diverse rain conditions in the region, from the elevated and rainier northern stations to the semi-arid southern coastal plane. Accumulated annual rainfall amounts can therefore range from 200 to 1000+ mm, depending on location.
Monthly NAO index values were calculated by NOAA-CPC via rotated principal component analysis (RPCA) and a linear interpolation from daily to monthly time series.
2.2 Cyclone tracking
Cyclone track data are taken from the Composite Track Dataset (Flaounas et al., 2023). The dataset is the combined result of 10 cyclone detection and tracking methods, where the degree of agreement between the methods defines the confidence level of each track. For the chosen confidence level (CL=5, meaning that at least half of the methods agree on each track), 1058 tracks were identified in the Mediterranean area (25–50° N, 10° W–40° E) for DJF months during the study period. Each cyclone track refers to the entire life cycle, including locations outside the domain.
2.3 North Atlantic storm track regimes
To determine the flow regimes of the North Atlantic storm track, k-means clustering is performed on daily upper-level eddy kinetic energy (EKE) maxima. First, EKE is calculated at 300 hPa as . u′ and v′ are the transient components of the zonal and meridional wind, respectively. A Lanczos low-pass filter is then applied to the data with a cutoff of 10 d. This represents the activity of high-frequency eddies within the track, as defined in Novak et al. (2015). We then further smooth the result with a 5 d running mean. Finally, local meridional EKE maxima are found for each longitude within a 5° window (see Fig. 2a). The maps of maxima locations are then processed by the clustering algorithm. The clusters therefore represent only the position of the storm track and not its amplitude. Other clustering studies for the Atlantic storm track and jet stream (Woollings et al., 2010; Novak et al., 2015) find similar results in terms of positions and timescale (roughly 10 d).
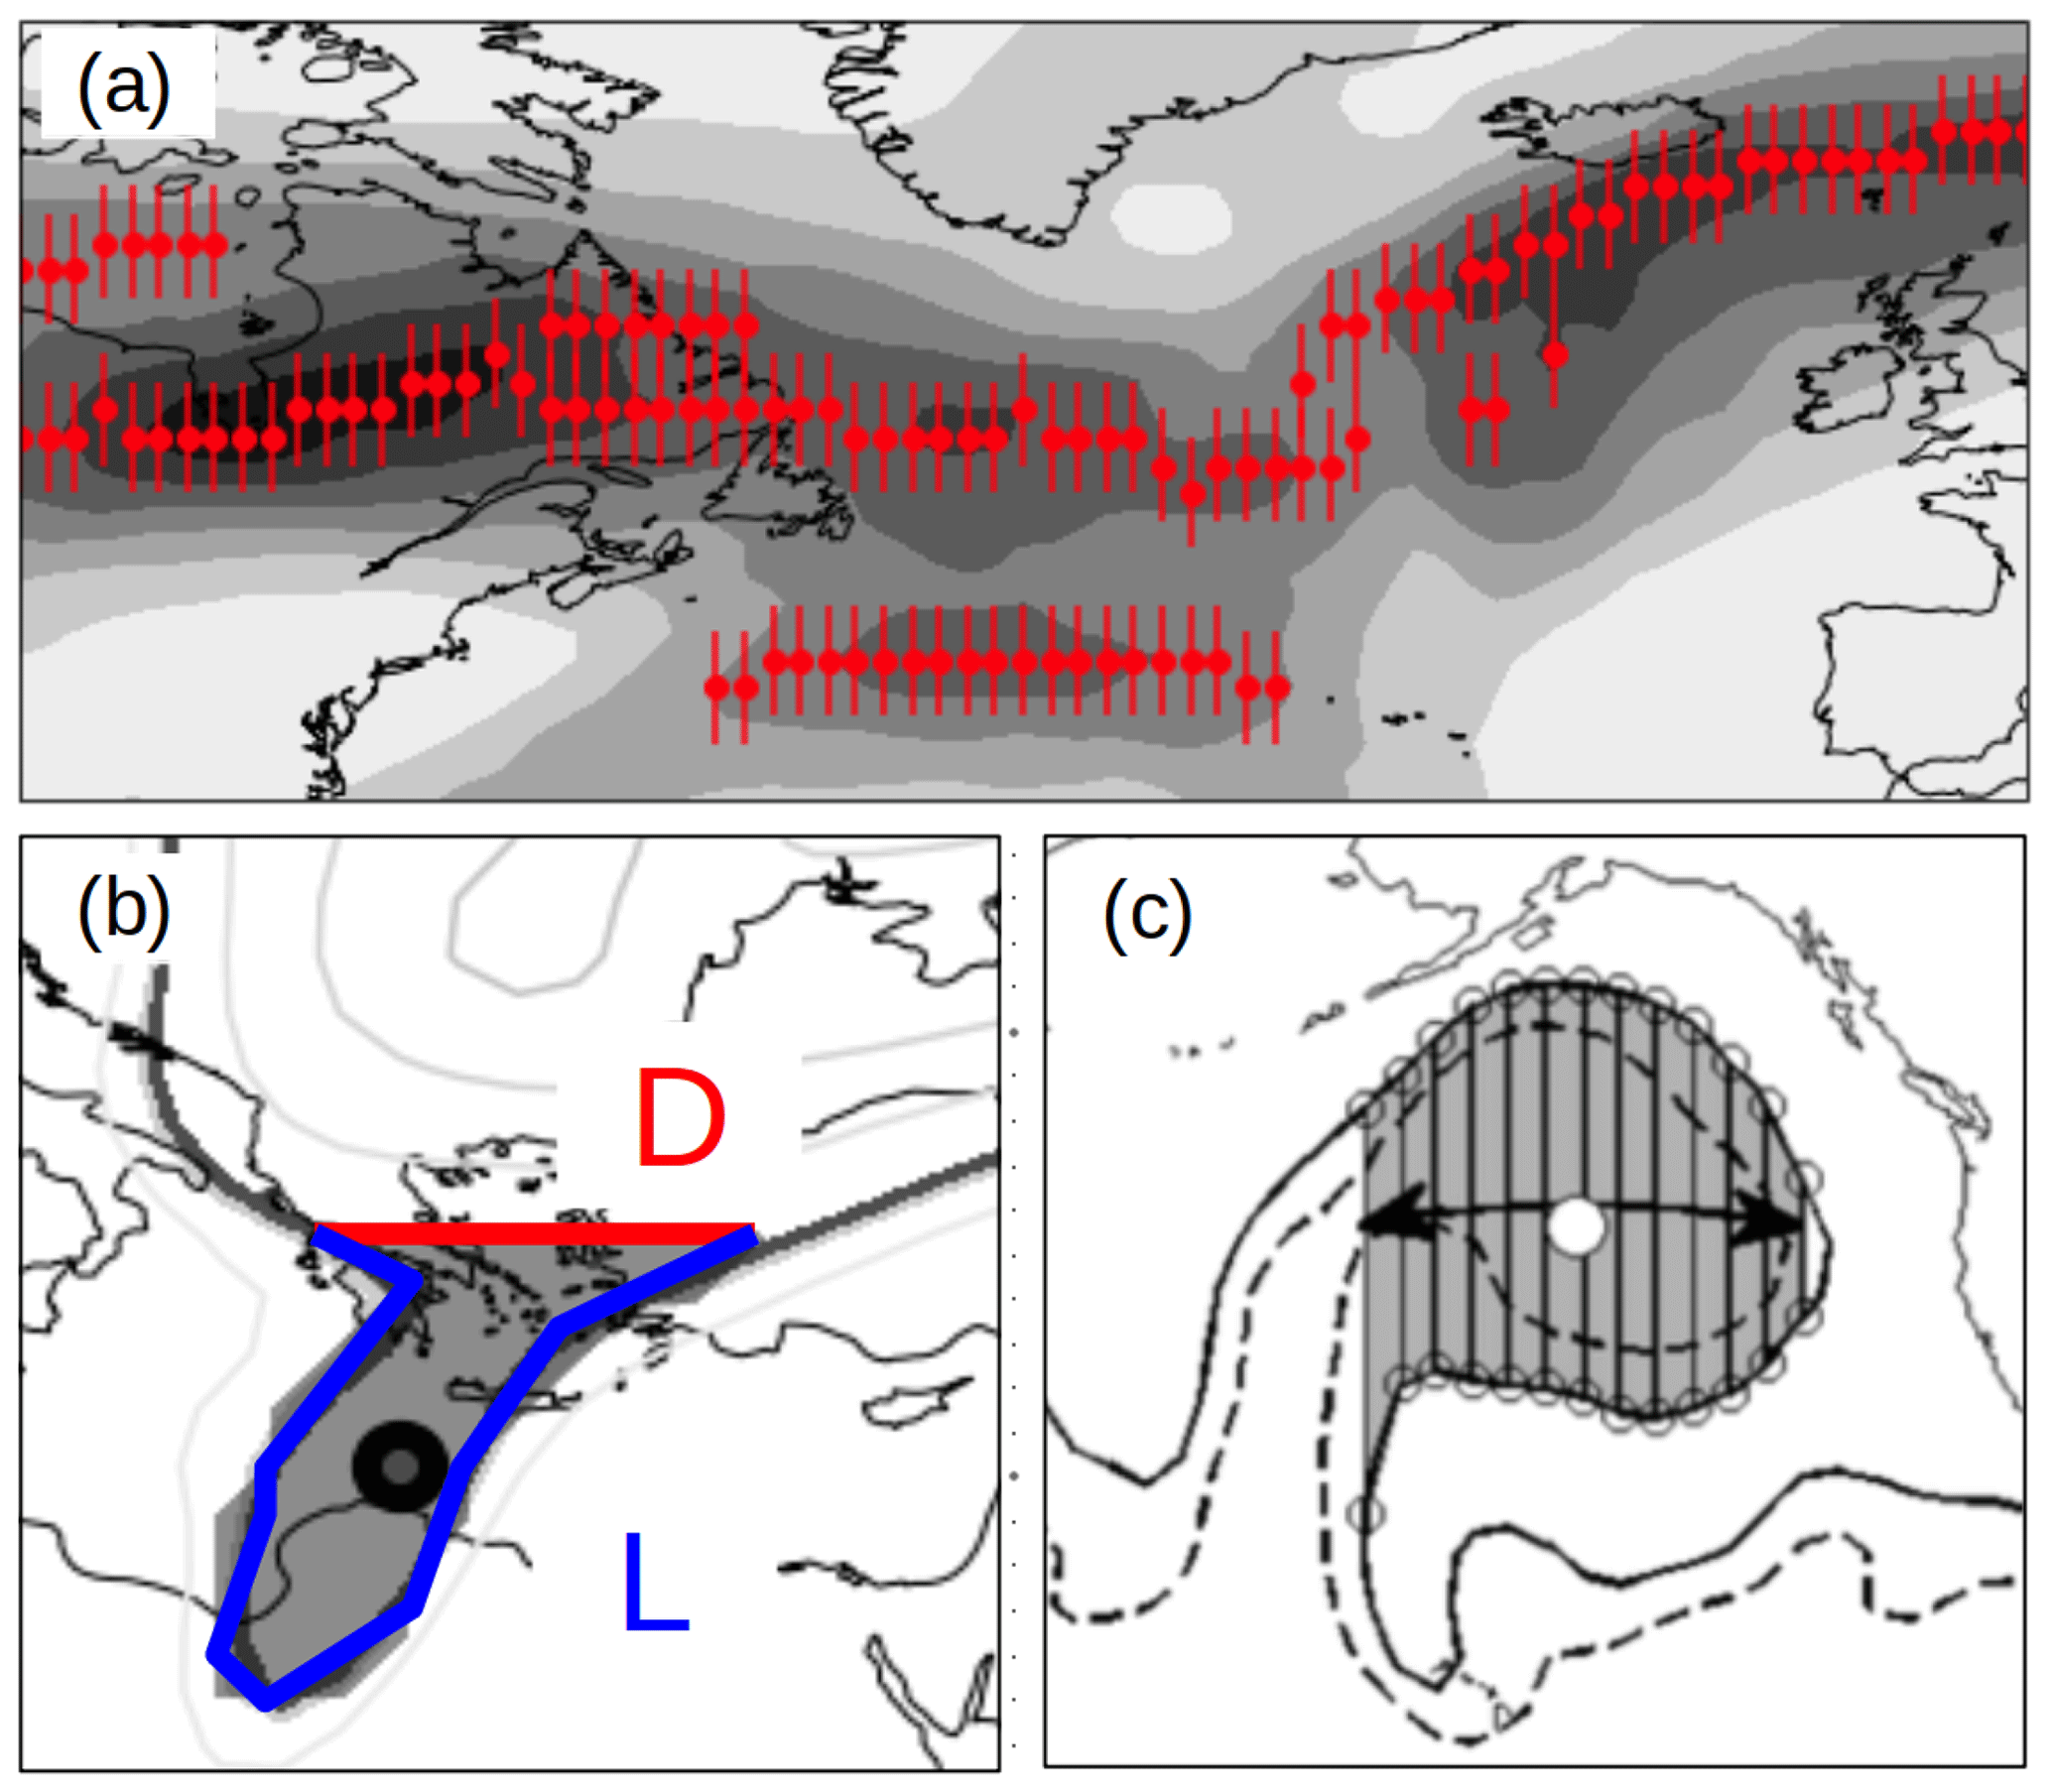
Figure 2Examples of objectively detected features used in the analysis. (a) A snapshot of the daily EKE field (shading) and the EKE maxima used in the clustering (markers) for an example date (2 February 1979). The red markers denote the local meridional maxima in a 5° range, marked by vertical lines. (b) A PV streamer detected using the WaveBreaking algorithm. The thick grey isentrope is the 2 PVU contour on a 315 K surface. Shading marks the area of the streamer, and the red and blue lines mark its scale parameters (geographical distance D and contour length L, respectively). The center of the streamer is denoted by a circle marker. (c) An anticyclonic wave breaking event identified by the Strong–Magnusdottir algorithm. The solid and dashed lines mark the 5 and 3 PVU isentropic PV contours on a 350 K surface. Arrows show the zonal extent of the breaking, and the white circle shows its centroid. Panel (c) is adapted from Fig. 1 in Strong and Magnusdottir (2008) with permission.
A different approach that combined EKE maxima location and amplitude was tested (not shown), but we found that it required a larger number of clusters with a small sample in each. Additionally, we tested several alternative fields to define the storm track, such as low-level meridional heat flux or 500 hPa v variance (Wettstein and Wallace, 2010). The clusters were similar overall (not shown) but were clearest when using the 300 hPa EKE.
The number of clusters (n) is a prescribed parameter in the k-means method. A minimum of n=3 clusters is often used to describe the three typical positions of the storm track or jet stream in the Atlantic (Woollings et al., 2010; Novak et al., 2015). In this study, n=4 was chosen, with the fourth and largest cluster mostly capturing days that did not fit the other three, allowing for more homogeneous groups. Variations with more clusters () were investigated (not shown), but they only split the three main clusters into smaller classes, without highlighting relevant new regimes.
For compositing purposes, we label months and day sequences as belonging to specific clusters. For some cluster C, a month is considered a C month if it has at least 14 d labeled C by the algorithm. A C sequence is defined as at least 6 consecutive days labeled C by the algorithm. In total, 79 months and 266 sequences are identified as associated with one of the four clusters.
2.4 Potential vorticity streamers
For PV streamer detection, we used the WaveBreaking Python algorithm (Kaderli, 2023). This package is based on a method developed by Wernli and Sprenger (2007). To detect a streamer, the algorithm finds elongated filaments on a PV contour by detecting points that are geographically close (distance D) and yet have a long portion of the contour connecting them (length L). For more details on the algorithm's design and subroutines, see Kaderli (2022). In this analysis we use the 2 PV unit ( m2 s−1 K kg−1) contour on the 315 K potential temperature surface. We set the algorithm thresholds at D=800 km and L=1200 km, meaning that the two base points of a streamer are at most 800 km apart and with a contour of at least 1200 km between them (Fig. 2b). These values are similar to the ones used in Wernli and Sprenger (2007), albeit with a shorter L to better capture smaller structures over the Mediterranean specifically.
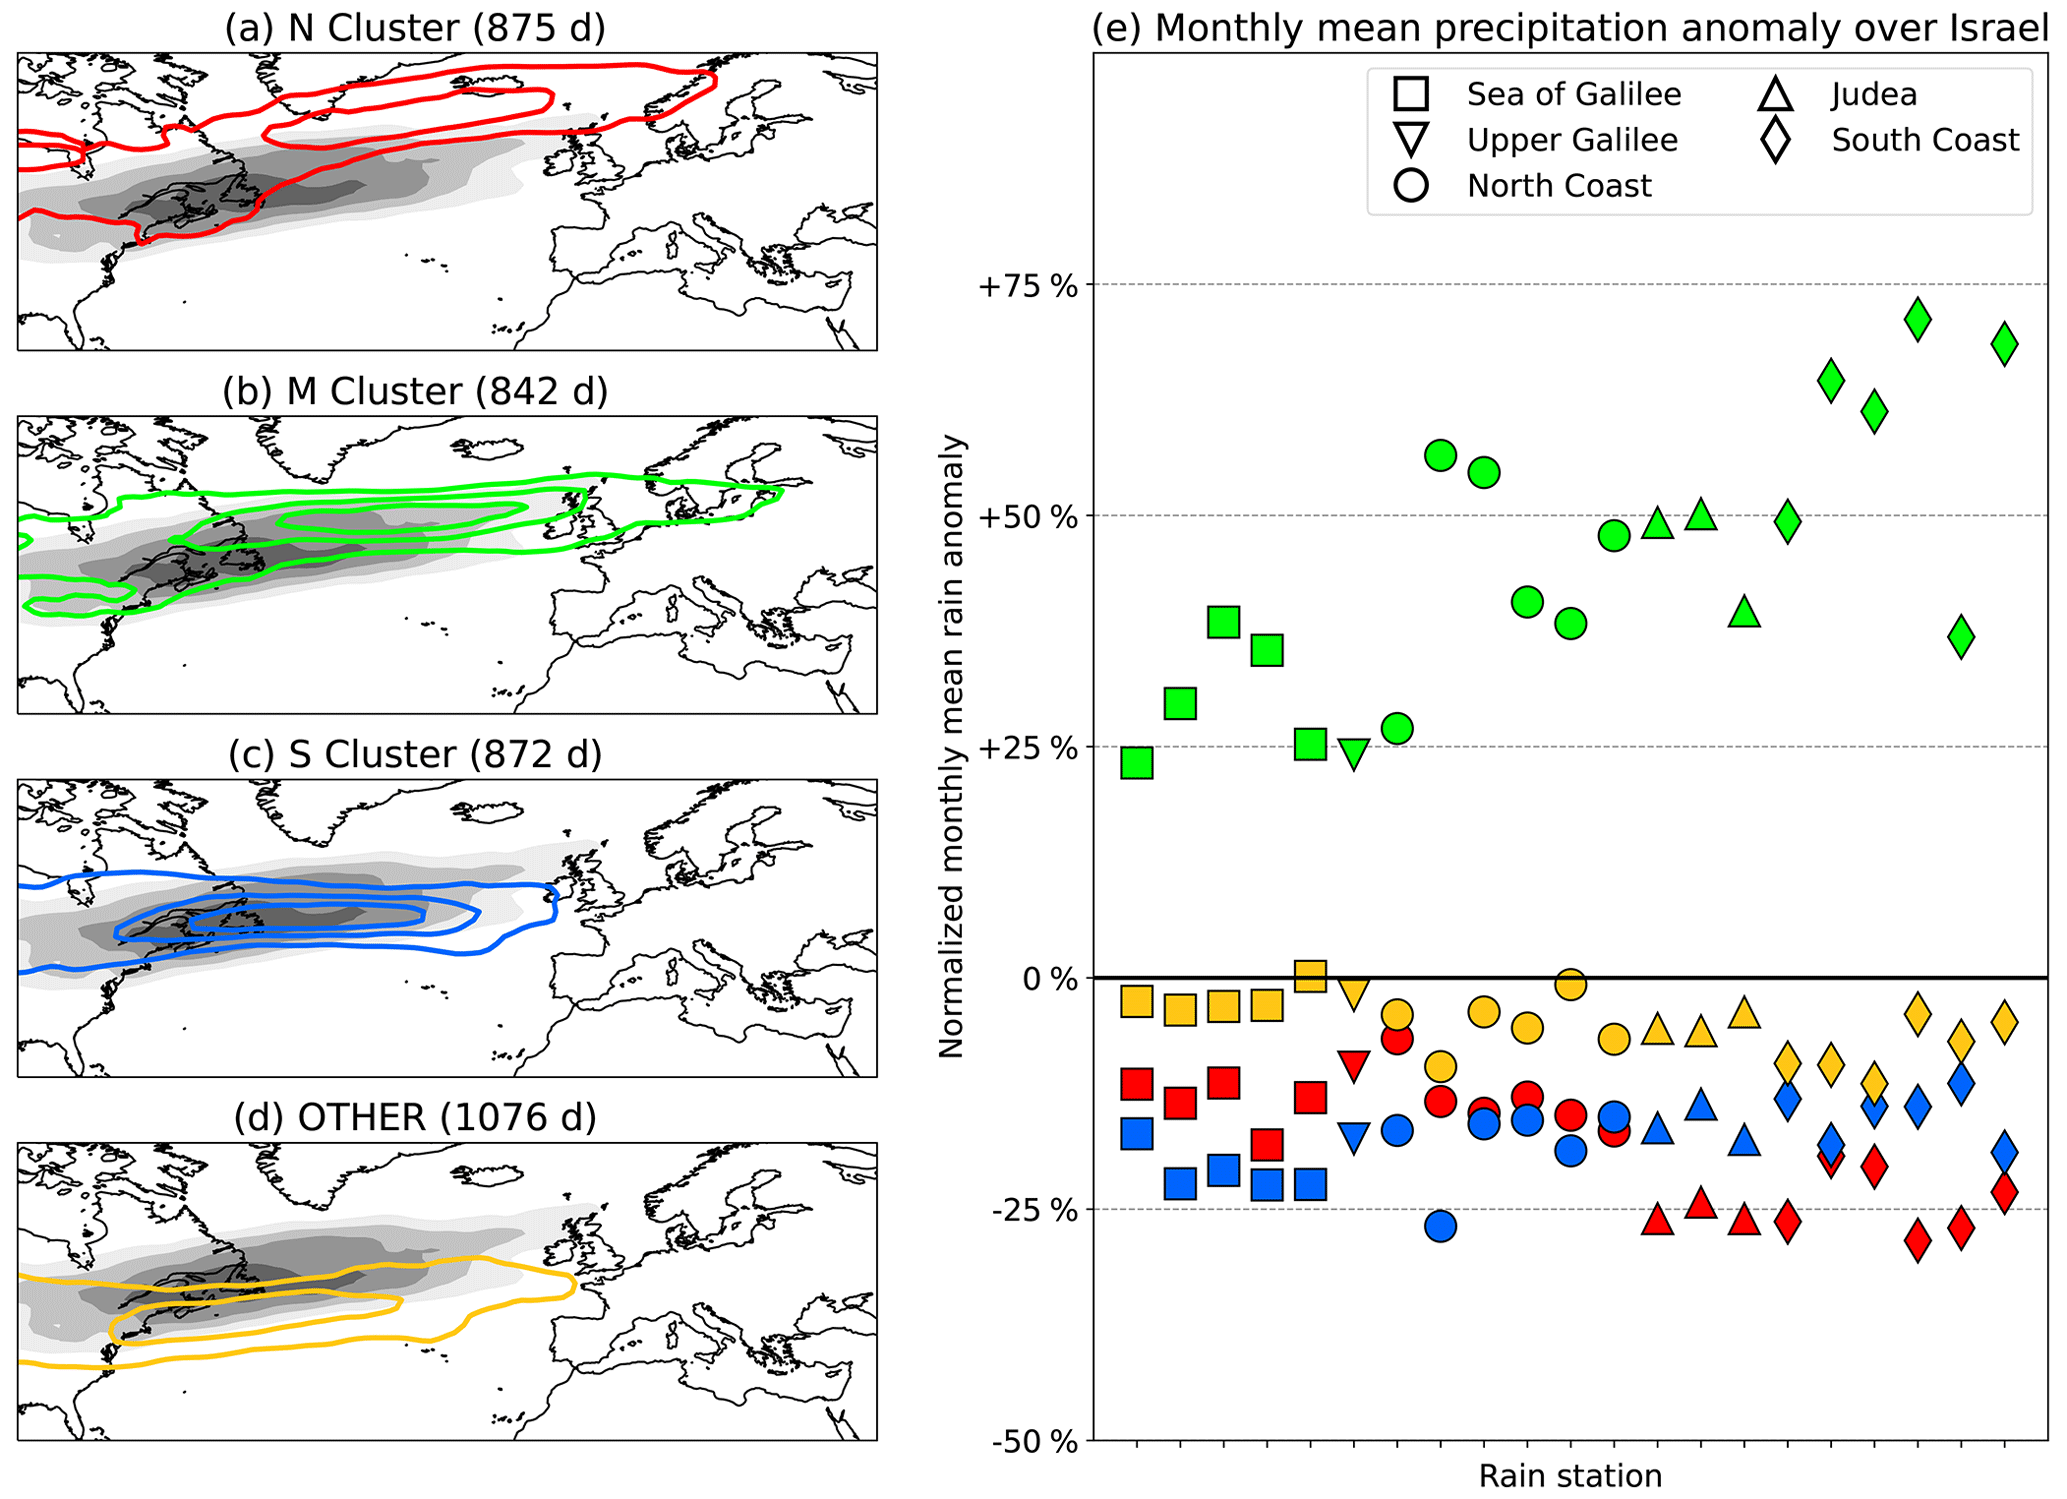
Figure 3(a–d) North Atlantic storm track regimes, using k-means clustering on normalized daily DJF EKE data at 300 hPa. The clusters are represented by contours, and the 1979–2019 climatology is in shading (contour interval is 0.05 for both). (e) The normalized mean monthly precipitation anomaly (%) for 21 rain stations in Israel for each cluster. Each anomaly is divided by the 1979–2019 DJF rain climatology of the corresponding station. The color of each marker denotes its cluster, and its shape denotes its geographical location.
2.5 Rossby wave breaking
Rossby wave breaking (RWB) events were identified and analyzed with an algorithm developed by Strong and Magnusdottir (2008) and modified by Tamarin-Brodsky and Harnik (2024). Similar to streamer detection, this method detects geometric features on isentropic PV contours. An RWB event is defined as a large-scale overturning of PV, manifesting as a contour crossing a particular meridian more than once (Fig. 2c). This is done for PV contours between 1.5–7.5 PVU on a 200 hPa isobaric level, with each event assigned to the contour with the largest overturning. By tracing the contour from west to east, it is determined whether a break is cyclonic or anticyclonic. Additional thresholds are set for the events (minimal area, longitudinal extent and depth) to filter smaller-scale noise. Under these parameters, the typical zonal extent of an RWB is ∼30° (note that the scale for Fig. 2c is roughly 3 times larger than Fig. 2b).
For this work, we take the algorithm threshold values used in Tamarin-Brodsky and Harnik (2024) (breaking width of at least 7° with a minimal depth of 1 PVU) and keep only anticyclonic breaking events. Cyclonic wave breaking events can lead to cyclogenesis, albeit not as robustly as in the anticyclonic case. When comparing cyclonic and anticyclonic RWBs, Tamarin-Brodsky and Harnik (2024) found a considerably larger number of Mediterranean cyclones to the southeast of the latter. Also, the influence of cyclonic RWBs is limited mostly to autumn months, according to a PV-based classification of Mediterranean cyclones (Givon et al., 2024).
Statistical significance of spatial anomalies is determined throughout with a bootstrap test with 500 samples and a confidence level of 95 %.
3.1 Atlantic storm track regimes and Mediterranean flow
The winter flow regimes of the North Atlantic storm track are produced by performing cluster analysis on eddy kinetic energy maxima (see Sect. 2). The clusters, shown in Fig. 3a–d, vary from the climatology in terms of track latitude (from 48 to 59° N) and zonal extent (whether storms reach northern Europe or not). It should be noted that the clustering is based only on EKE location and not magnitude; therefore it does not represent storm intensity.
Figure 3e shows the accumulated monthly mean precipitation over Israel for each cluster. Three of the four clusters relate to anomalous rainfall amounts – clusters 1 and 3 are generally drier, and cluster 2 is rainier, with respective mean anomalies of −21 %, −22 % and +54 % compared to climatology. Cluster 4, while the largest, shows almost no signal in terms of rainfall or cyclonic activity (not shown). Therefore, our results focus on clusters 1–3, denoted hereafter according to the average track latitude as north (N), middle (M) and south (S), respectively (see Fig. 3a–c).
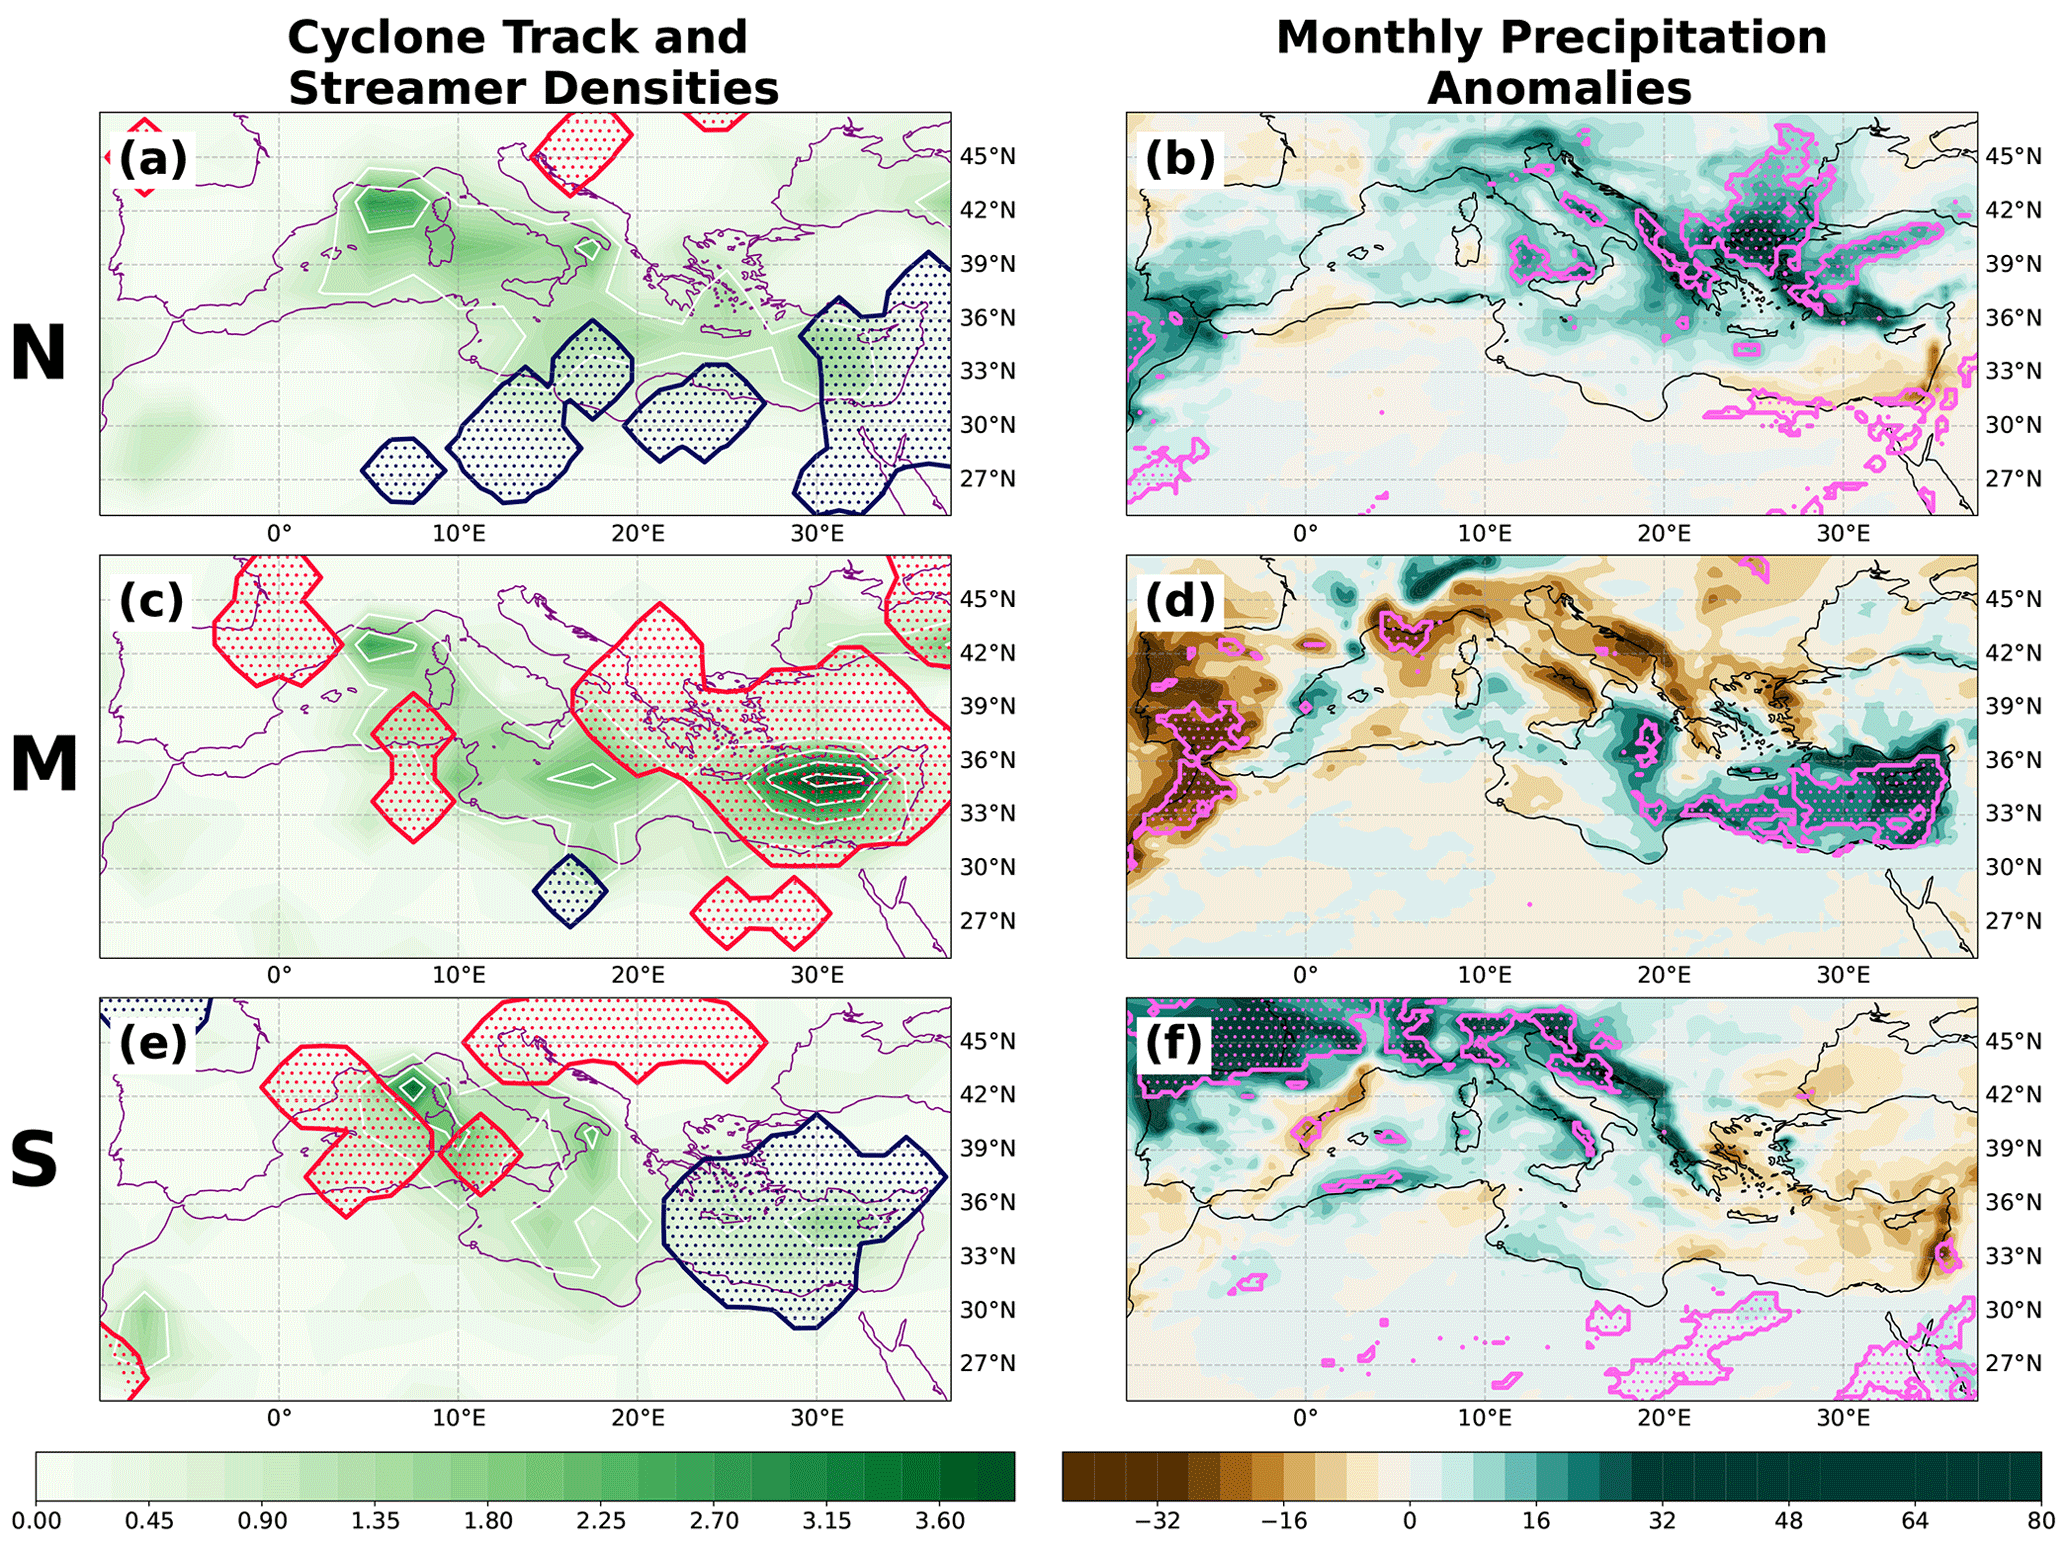
Figure 4Composite cyclonic activity and precipitation for clusters N, M and S (top, middle and bottom rows, respectively). (a, c, e) Monthly cyclone track density (shading, number of tracks per month) and PV streamer density anomaly (hatches). For streamers, only statistically significant anomalies are shown (95 % confidence on a 500-sample bootstrap test). Positive anomalies are shown in red and negative ones in blue. (b, d, f) Monthly precipitation anomalies (shading, mm). Areas with over 95 % statistical significance are highlighted in pink hatches.
The rainy M cluster is characterized by an eastward extension of the storm track, with the most active section located south of Greenland and storms reaching Scandinavia. The increase in precipitation is apparent throughout Israel, but the central region (south coast and Judea) has the largest anomaly, up to 75 % more than the climatological mean (black markers in Fig. 3e). The dry N cluster combines an eastward extension and a northern shift of the storm track. It displays similar local differences to the M cluster, with the same areas having the largest relative negative response. The S cluster is closest to the climatological state of the track, albeit slightly more zonally oriented towards western Europe. The dry clusters also have a statistically significant over-representation of extremely dry months, with 6 of the 10 driest months in the dataset belonging to either cluster N or cluster S (p<0.05 under a hypergeometric test).
The precipitation anomalies over Israel are part of a basin-wide response of cyclonic activity. The different configurations of the North Atlantic storm track correspond to changes in the distribution of PV streamers that breach into the Mediterranean from the north (hatches in Fig. 4a, c and e). In the presence of more streamers, baroclinicity increases and enhances cyclone formation and its deepening downstream. The three clusters hint at an optimal range of influence of Atlantic storm track latitudes for eastern Mediterranean rainfall (around the M configuration), in which PV extends more easily into the region. This is followed by a higher density of cyclone tracks, resulting in increased precipitation (Fig. 4d). When the Atlantic storm track is shifted even more poleward (N cluster), streamers are less likely to reach the eastern part of the basin, perhaps due to its more equatorward position compared to the rest of the Mediterranean. The aforementioned drying of central Israel is also apparent (Fig. 4b) within the overall drier conditions of the southeastern coast. The S cluster's drying effect is possibly due to its shorter zonal extent. It thus captures the known east–west gradient in cyclonic activity (Ziv et al., 2006; Feldstein and Dayan, 2008), with abundant stormy weather over Genoa, while cyclonic activity to the east is suppressed.
The large-scale flow over the North Atlantic displays some elements of known regional weather regimes (Fig. 5). Composite anomalies of 500 hPa geopotential height show a zonally oriented signal for the M cluster, corresponding to the positive phase of the NAO (this connection is further explored in Sect. 3.3). The jet stream (thick black curve in Fig. 5) is shifted poleward and more extended to the east (Fig. 5b). An upper-tropospheric trough can be seen over the eastern Mediterranean, enhancing cyclonic activity. Meanwhile, the high over the northwest Atlantic in cluster N is reminiscent of blocking regimes (an Atlantic ridge or a Greenland blocking). The S cluster does not have a clear weather regime analogue, but both dry clusters feature a statistically significant anticyclonic flow in the upper levels over the eastern Mediterranean.
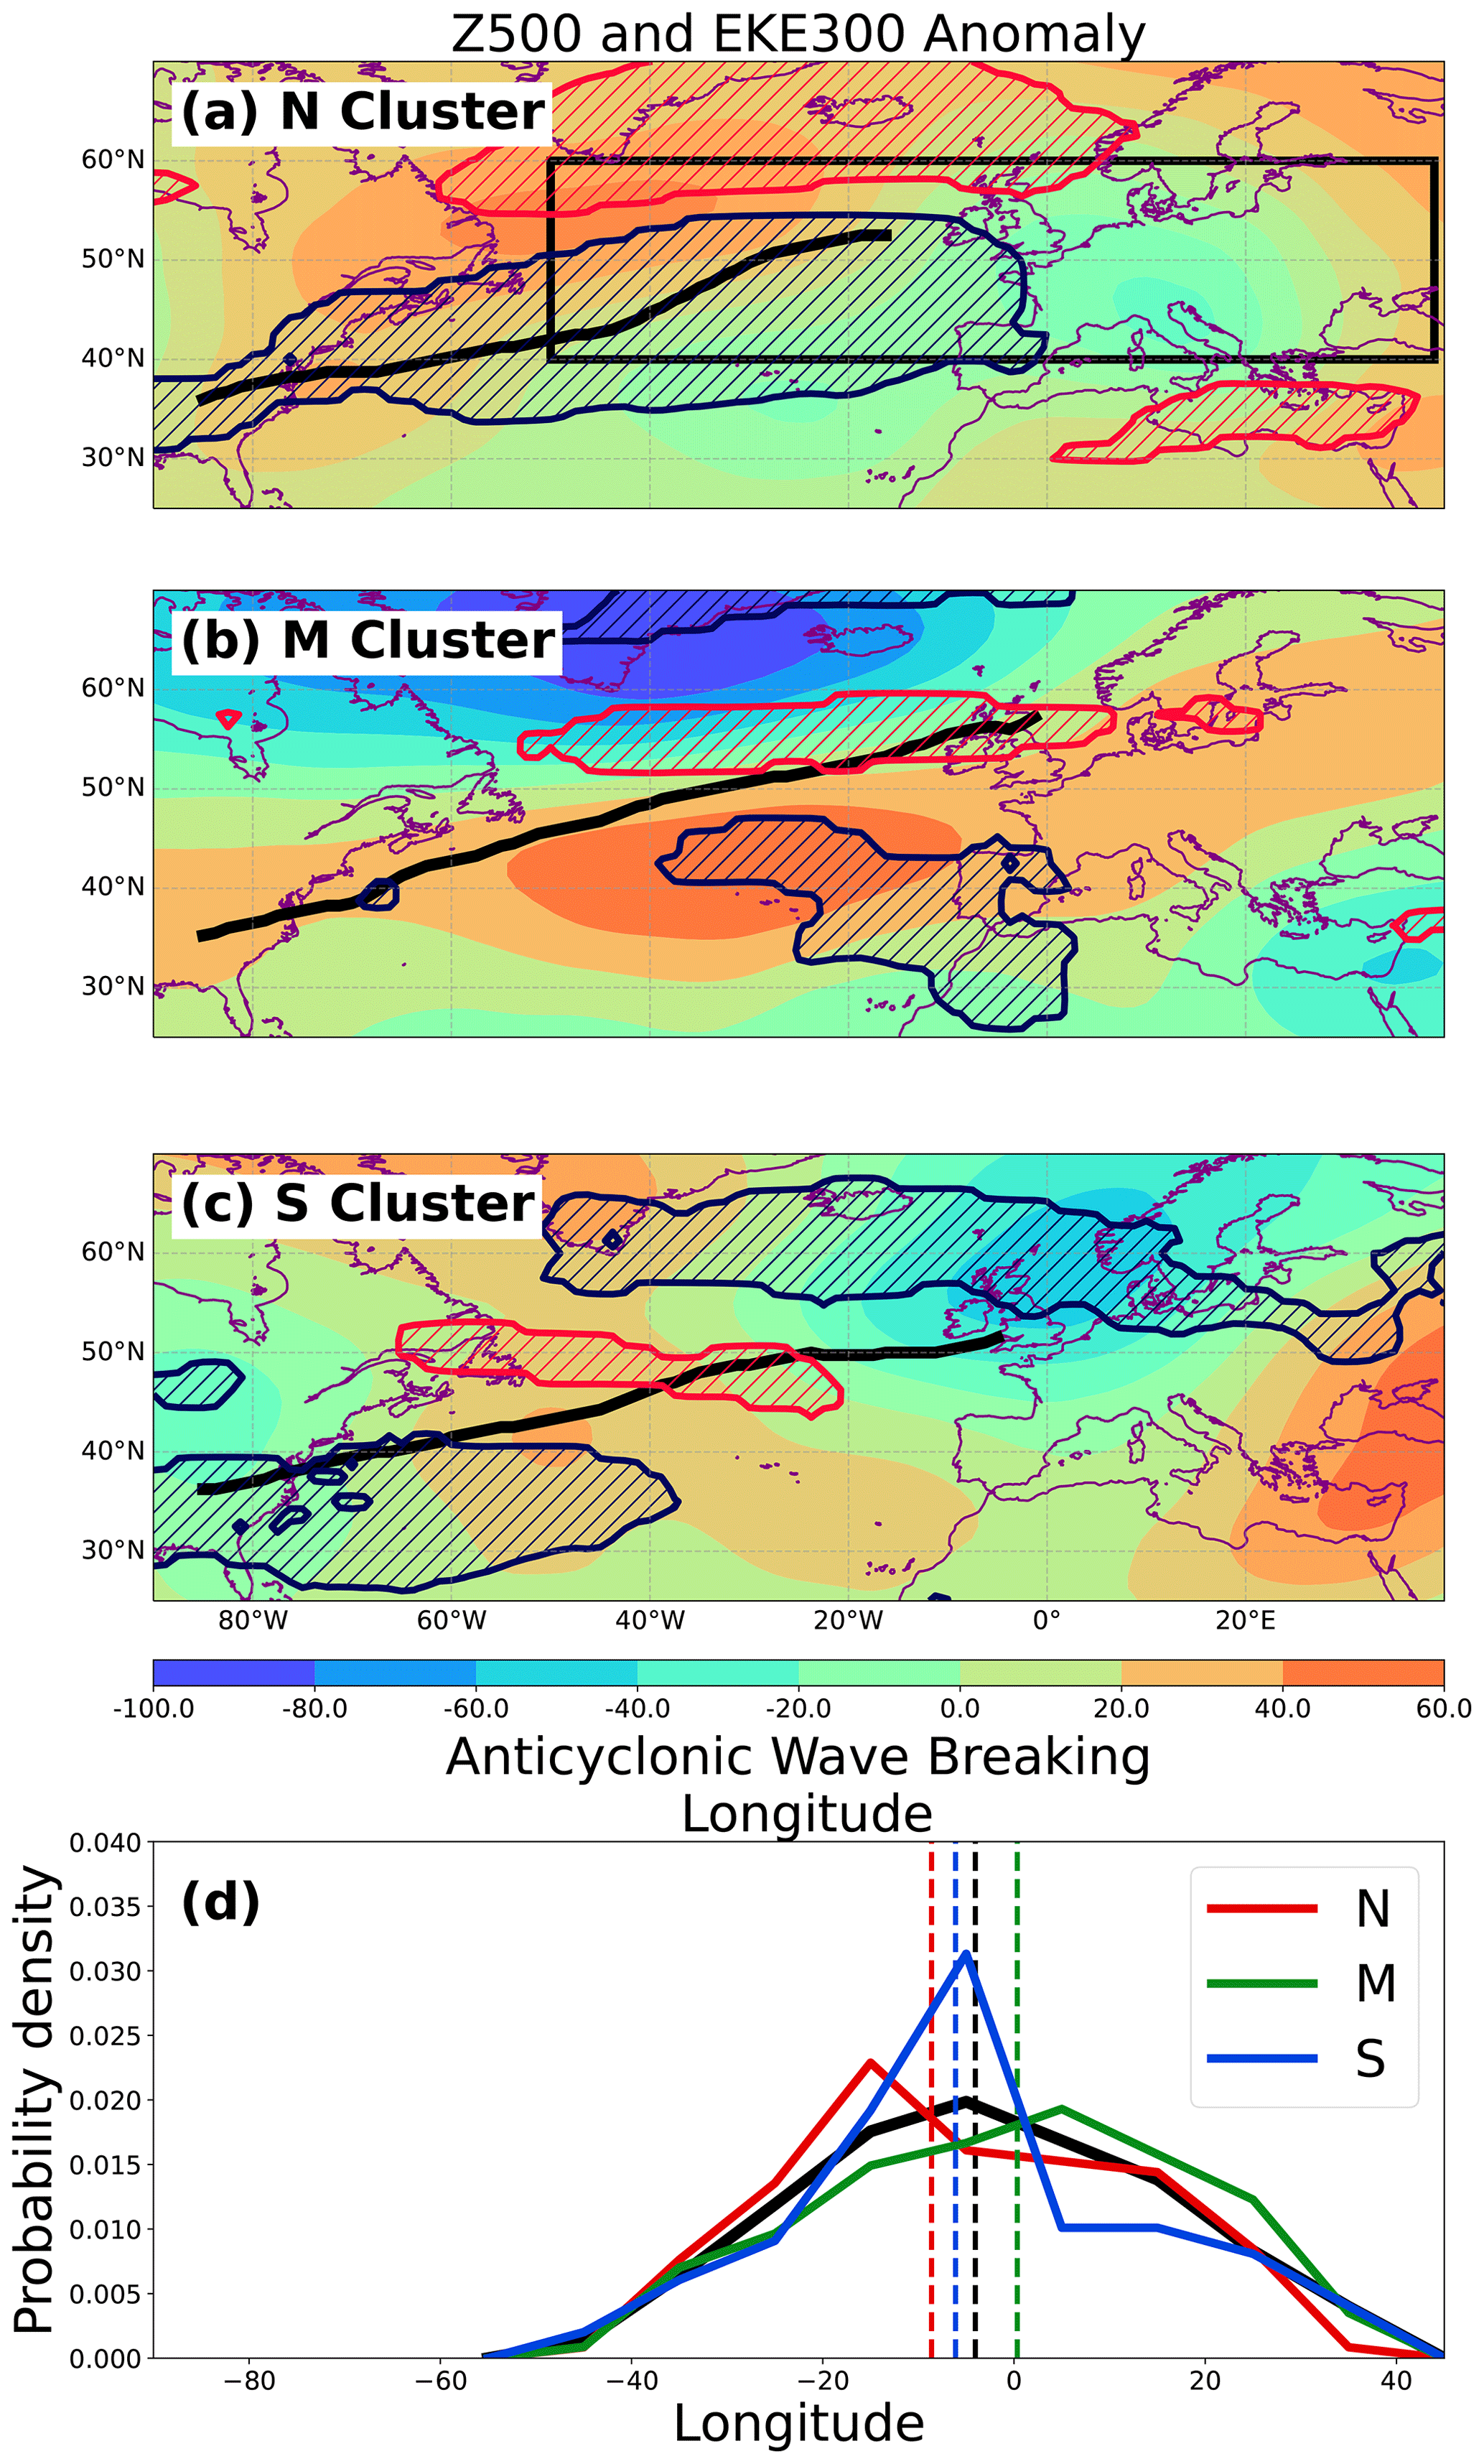
Figure 5(a–c) Composite monthly geopotential height anomalies at 500 hPa (shading, 15 m contour interval) and statistically significant EKE anomalies (defined the same as in Fig. 2). Positive EKE anomalies are marked by red hatches and negative in blue hatches. The thick curve denotes the average location of the Atlantic jet stream axis (300 hPa U maxima). (d) Longitude distribution of anticyclonic Rossby wave breaking events occurring at 200 hPa over the eastern Atlantic and northern Europe (black box in a). The climatological distribution is shown by the thick black histogram. Dashed vertical lines denote the median longitude of the climatology and every cluster.
As expected, EKE anomalies follow the latitudinal position of the clusters themselves. However, two particular signals are notable: energy being carried further downstream north of the Mediterranean in cluster M (Fig. 5b) and the positive EKE anomaly over the Mediterranean in cluster N (Fig. 5a). The latter is not related to the North Atlantic storm track but might be associated with stronger Mediterranean cyclones and intense rainfall over Greece and Turkey (see Fig. 4b).
Rossby wave breaking (RWB) events play a major role in the formation of PV streamers into the Mediterranean. Our results demonstrate a coherent relation between RWB events and streamers for each cluster. Figure 5d shows the longitudinal distribution of such events, averaged between 40–60° N (see box in Fig. 5a). Each cluster contains a similar number of events (99–120), but their median location varies considerably. The climatological median longitude is 4° W. The dry cluster medians are located more upstream (9 and 6° W for N and S, respectively). Cluster M has more RWBs in the central and eastern Mediterranean (the median longitude is the prime meridian, denoted by the vertical green line in Fig. 5d). Therefore, months with RWBs further downstream tend to have matching PV streamers further east over the Mediterranean.
3.2 A mechanism for eastern Mediterranean rainfall enhancement
In order to relate the M cluster to other rain-inducing patterns in the literature, we focus on its temporal evolution and connection to internal modes. Using the monthly NAO index (taken from NOAA-CPC; see Sect. 2), we find that all 10 cluster M months have positive NAO values (average index of +1.8 standard deviations). Rainy cluster M months are therefore a subset of the NAO+ phase.
A composite analysis of daily data is used to track the development of the signal. Each sequence is a continuous series of 6 or more days classified as M. Lag 0 of each sequence is defined as the time of maximum daily rainfall over Israel (average of the 21 rain stations shown in Fig. 3). This metric represents the final stages of the Atlantic–Mediterranean dynamical chain (the “interaction” step in Fig. 1).
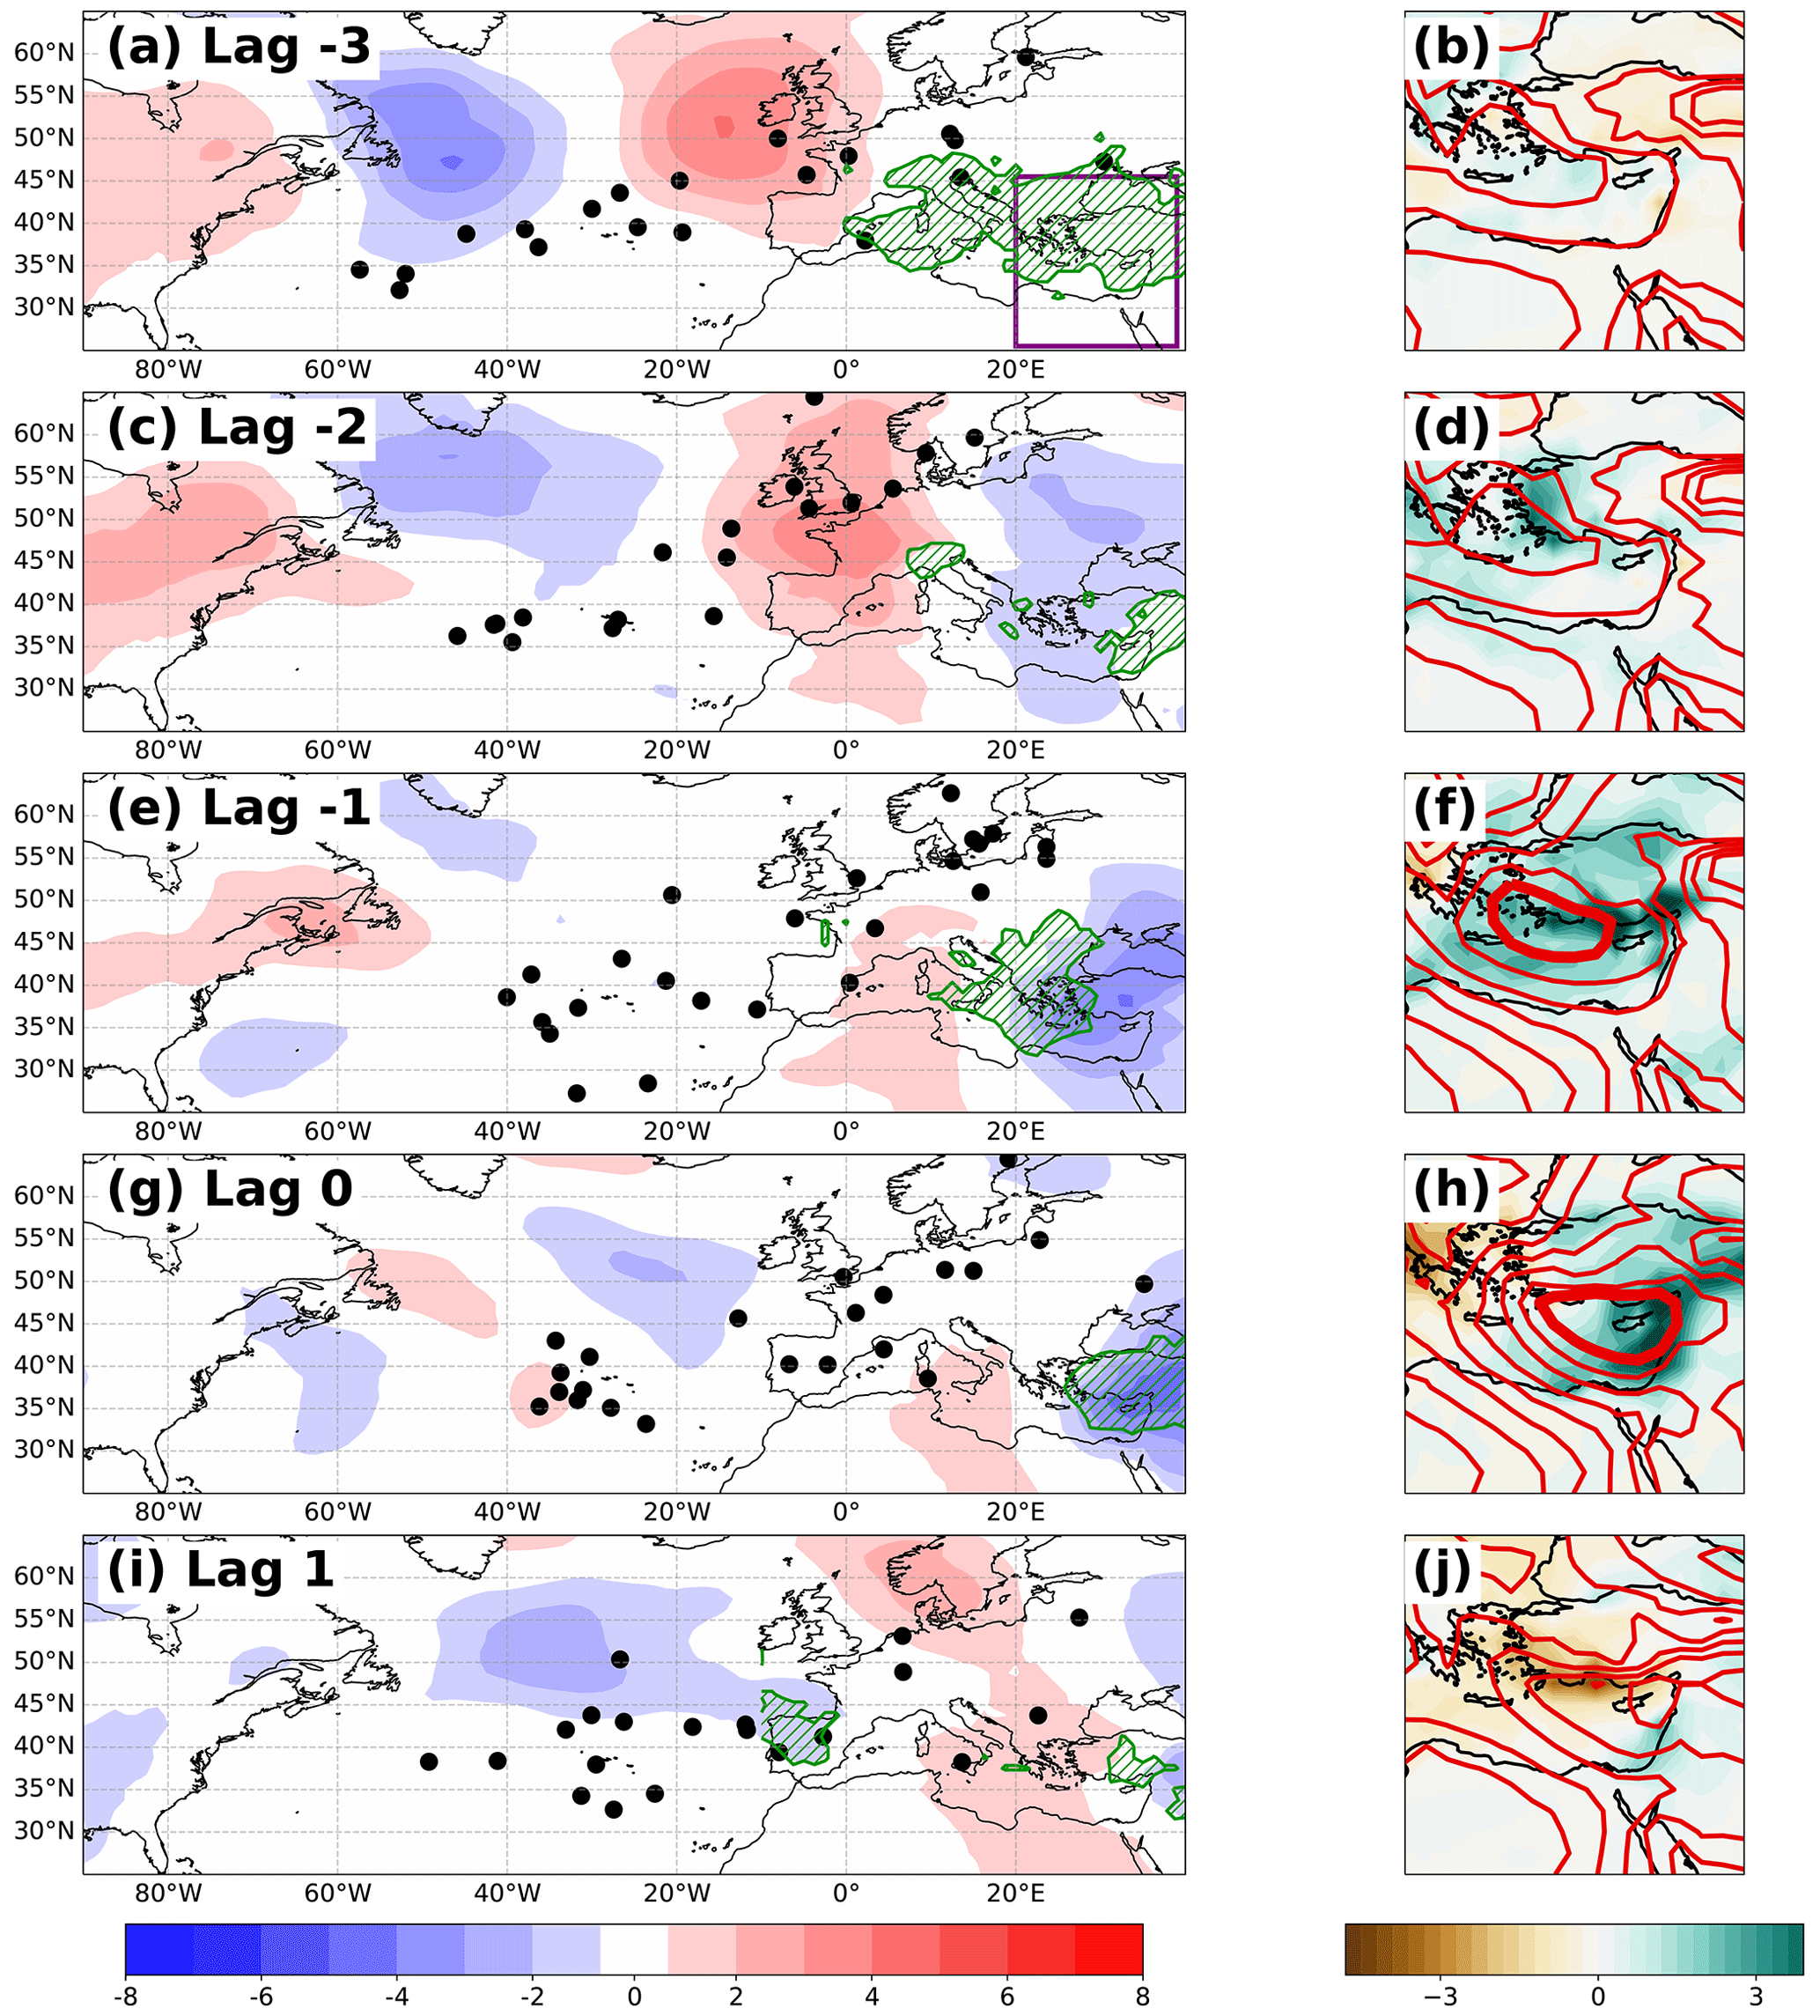
Figure 6Time lag composite for the development of M cluster events. Lag 0 is defined as the day with maximum daily rainfall in Israel (averaged over 21 stations, as listed in Fig. 3e). (a, c, e, g, i) Daily SLP anomalies (shading, hPa), RWB locations (full black circles) and statistically significant PV streamer positive density anomaly (green hatches). Anomalies are the deviation from the 1979–2019 climatology. Negative anomalies are omitted for clarity. (b, d, f, h, j) Time lag composite for the eastern Mediterranean (purple box in a). Daily precipitation anomaly is shown in shading (mm) and SLP in contours (contour interval is 1 hPa, and the lowest value is highlighted by a thick line).
Figure 6 shows the time lag composite development of 60 such sequences (on average, 1.5 samples per winter) leading up to the precipitation maximum. SLP anomalies organize as a quasi-stationary zonal wave (shading in the left column of Fig. 6) that precedes the western Mediterranean high. This pattern corresponds to the “NAO extension” defined by Watanabe (2004). This can also be observed in the upper levels, slightly shifted to the west, via the meridional wind field (not shown). RWB events, denoted by black dots, tend to form over the central Mediterranean (as demonstrated in Fig. 5). This is followed by increased density of PV streamers downstream of the RWB centers, reaching the northern coast of the eastern Mediterranean (Fig. 6c, e and g). Over the subsequent days, a composite low deepens and propagates eastwards near Cyprus (red contours in Fig. 6h and j), alongside positive precipitation anomalies over Israel and the Levant. This implies an increase in cyclone density in the region.
During these sequences, cyclone paths tend to cover shorter zonal distances (, where λ is the longitude) compared to the climatology, especially in the western Mediterranean (not shown). This is in agreement with the findings of Tamarin-Brodsky and Harnik (2024), which show that Mediterranean cyclones located south of an anticyclone are often more stationary.
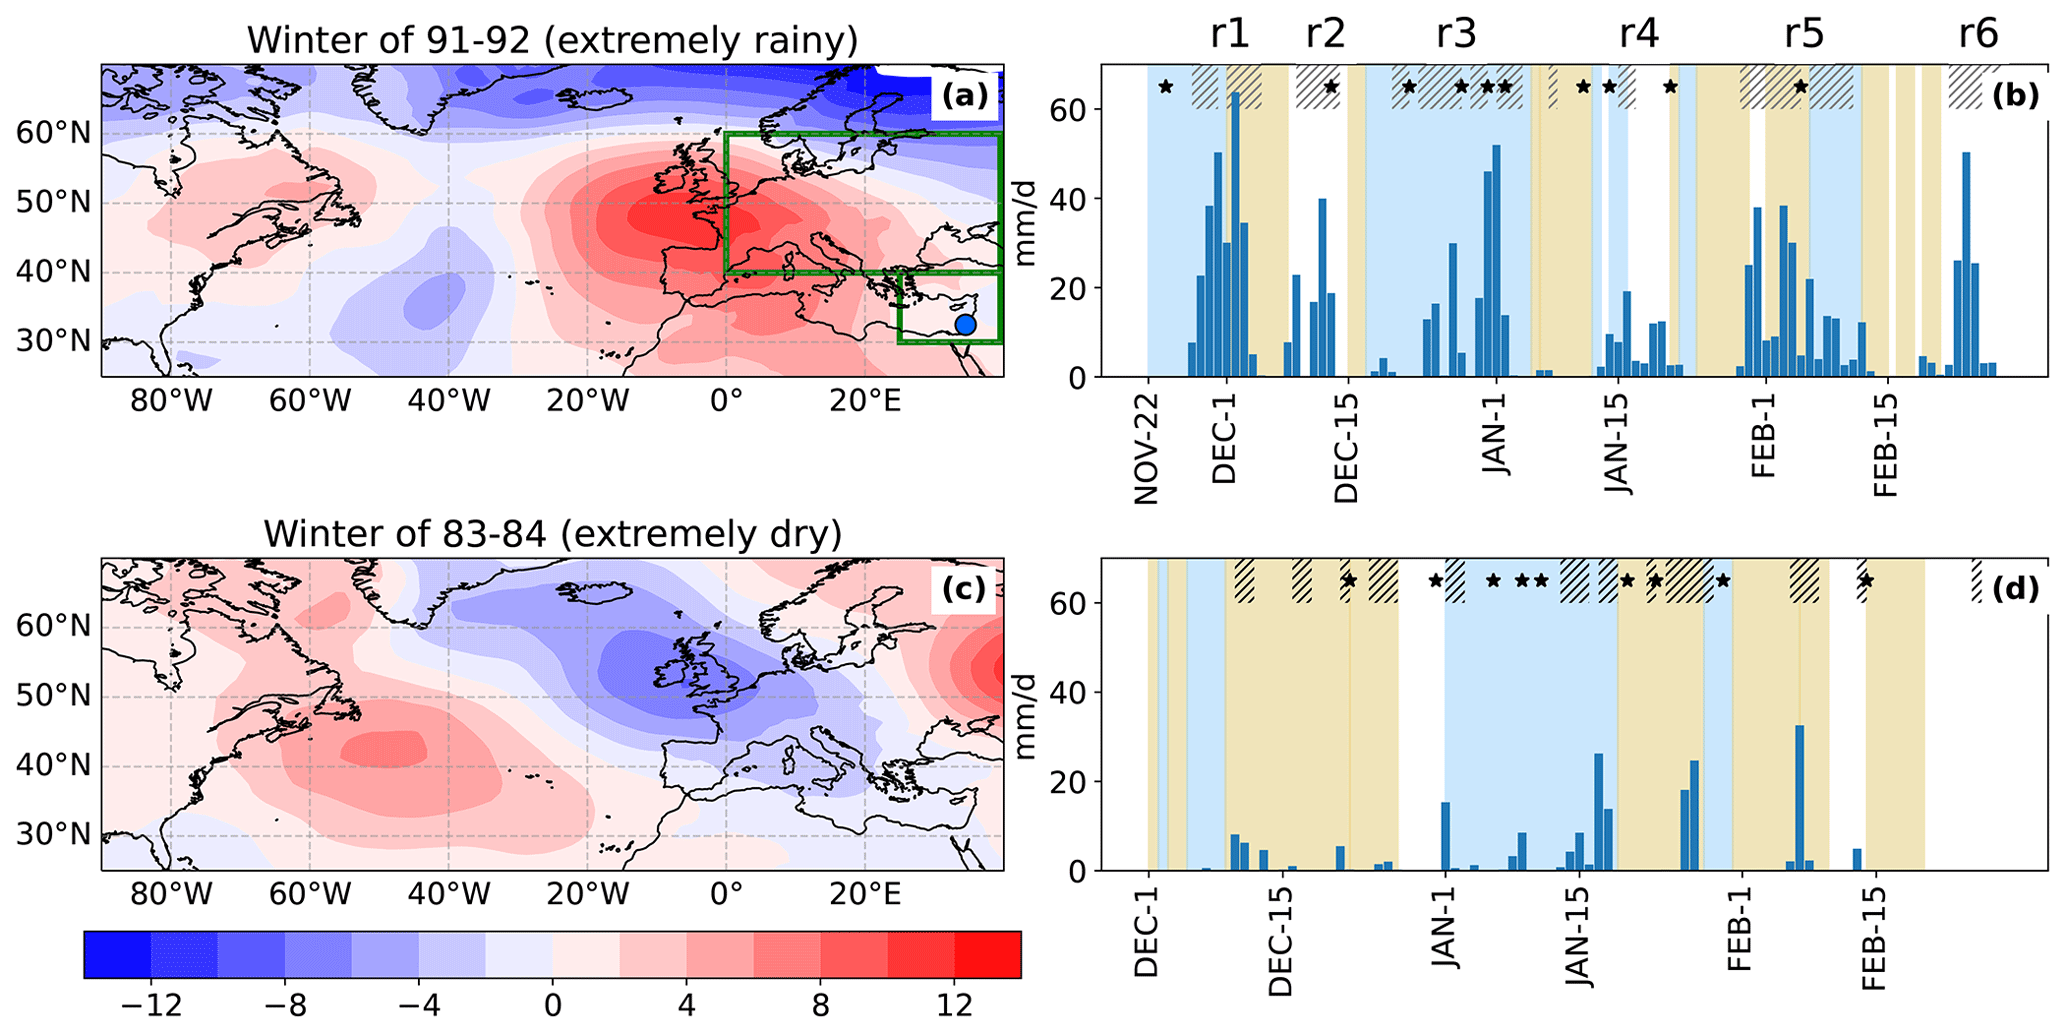
Figure 7The course of two extreme winters in the eastern Mediterranean. The top row shows the extremely rainy winter from December 1991 to February 1992, and the bottom row shows the December 1983–February 1984 dry winter. (a, c) SLP anomaly composites for all days belonging to the prominent cluster (cluster M for 1991–1992 and cluster S for 1983–1984). Blue and red shading denotes negative and positive values, with a contour interval of 2 hPa. The top and bottom green boxes in (a) bound the domains used for RWB and PV streamer subset detection seen in (b) and (d). (b, d) Daily time series showing labeled days for the M cluster (blue shading) and the N + S clusters (yellow shading). Also shown are RWB events (star markers), PV streamers in the eastern Mediterranean (hatches) and daily mean rainfall over Israel (blue bars; approximate rain gauge location marked by the blue circle in a). Both series show the entire season (DJF), with (b) extended back to 22 November. The six major rain events during the 1991–1992 winter are labeled r1–r6.
The overall process is reminiscent of the RRF17 mechanism (Raveh-Rubin and Flaounas, 2017), combined with a precursory Rossby wave packet crossing the Atlantic. The logic of this mechanism and its relation to patterns described in the literature are discussed in Sect. 4.
3.3 Two mid-winter test cases: DJF 1991–1992 and 1983–1984
Two mid-winter seasons were chosen to demonstrate the Atlantic–Mediterranean flow and its weather impacts during extended cluster regimes. The winter of 1991–1992 (1992 season hereafter) is the rainiest season in the study period (and for some locations in Israel, the rainiest ever recorded). It has several extreme spells in terms of length and precipitation rate (Rostkier-Edelstein et al., 2014). Conversely, the winter of 1983–1984 (1984 season hereafter) had multiple prolonged dry spells of little to no rain (Saaroni et al., 2015, 2019), making it the second driest season on record since 1979.
We study these winters through the string of features discussed previously: storm track regimes, RWB events, PV streamers and Mediterranean cyclones. Table 1 summarizes some of these statistics for each season. The 1992 season had 44 % of its days identified as the rain-enhancing M cluster. Meanwhile, the dry 1984 season had 27 N cluster days and 19 S cluster days, with just over half of the period classified into a dry regime. Additionally, 26 d belongs to the M cluster. Indeed, the composites of SLP anomalies for cluster-labeled days support the previously shown monthly-based cluster composites of upper-level flow patterns (Fig. 5a–c): a zonal wave culminating with a high over western Europe for cluster M and an east–west pressure dipole with a pronounced low over the British Isles for the dry clusters (similar to the pattern discussed in Ziv et al., 2006).
Table 1Rain and circulation statistics for two test case winters: 1991–1992 and 1983–1984 (December–February). Rain values refer to the station average of 21 rain gauges over Israel. The cluster with the most daily classifications is considered the main cluster. Rossby wave breaking events were tallied over the top green box in Fig. 6a. For PV streamers and cyclones, only cases in the bottom green box were counted.
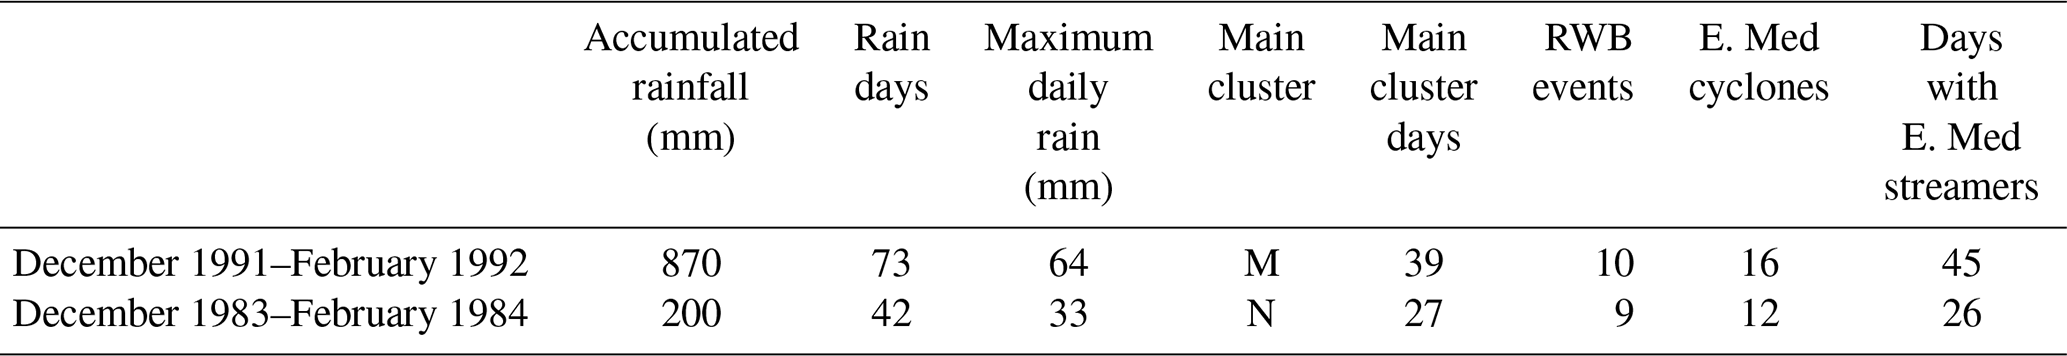
The two seasons have a similar number of RWB events and roughly as many eastern Mediterranean cyclones (Table 1). However, the extremely rainy winter has almost twice as many days with detected PV streamers reaching southward into the eastern domain (bottom green box in Fig. 7a).
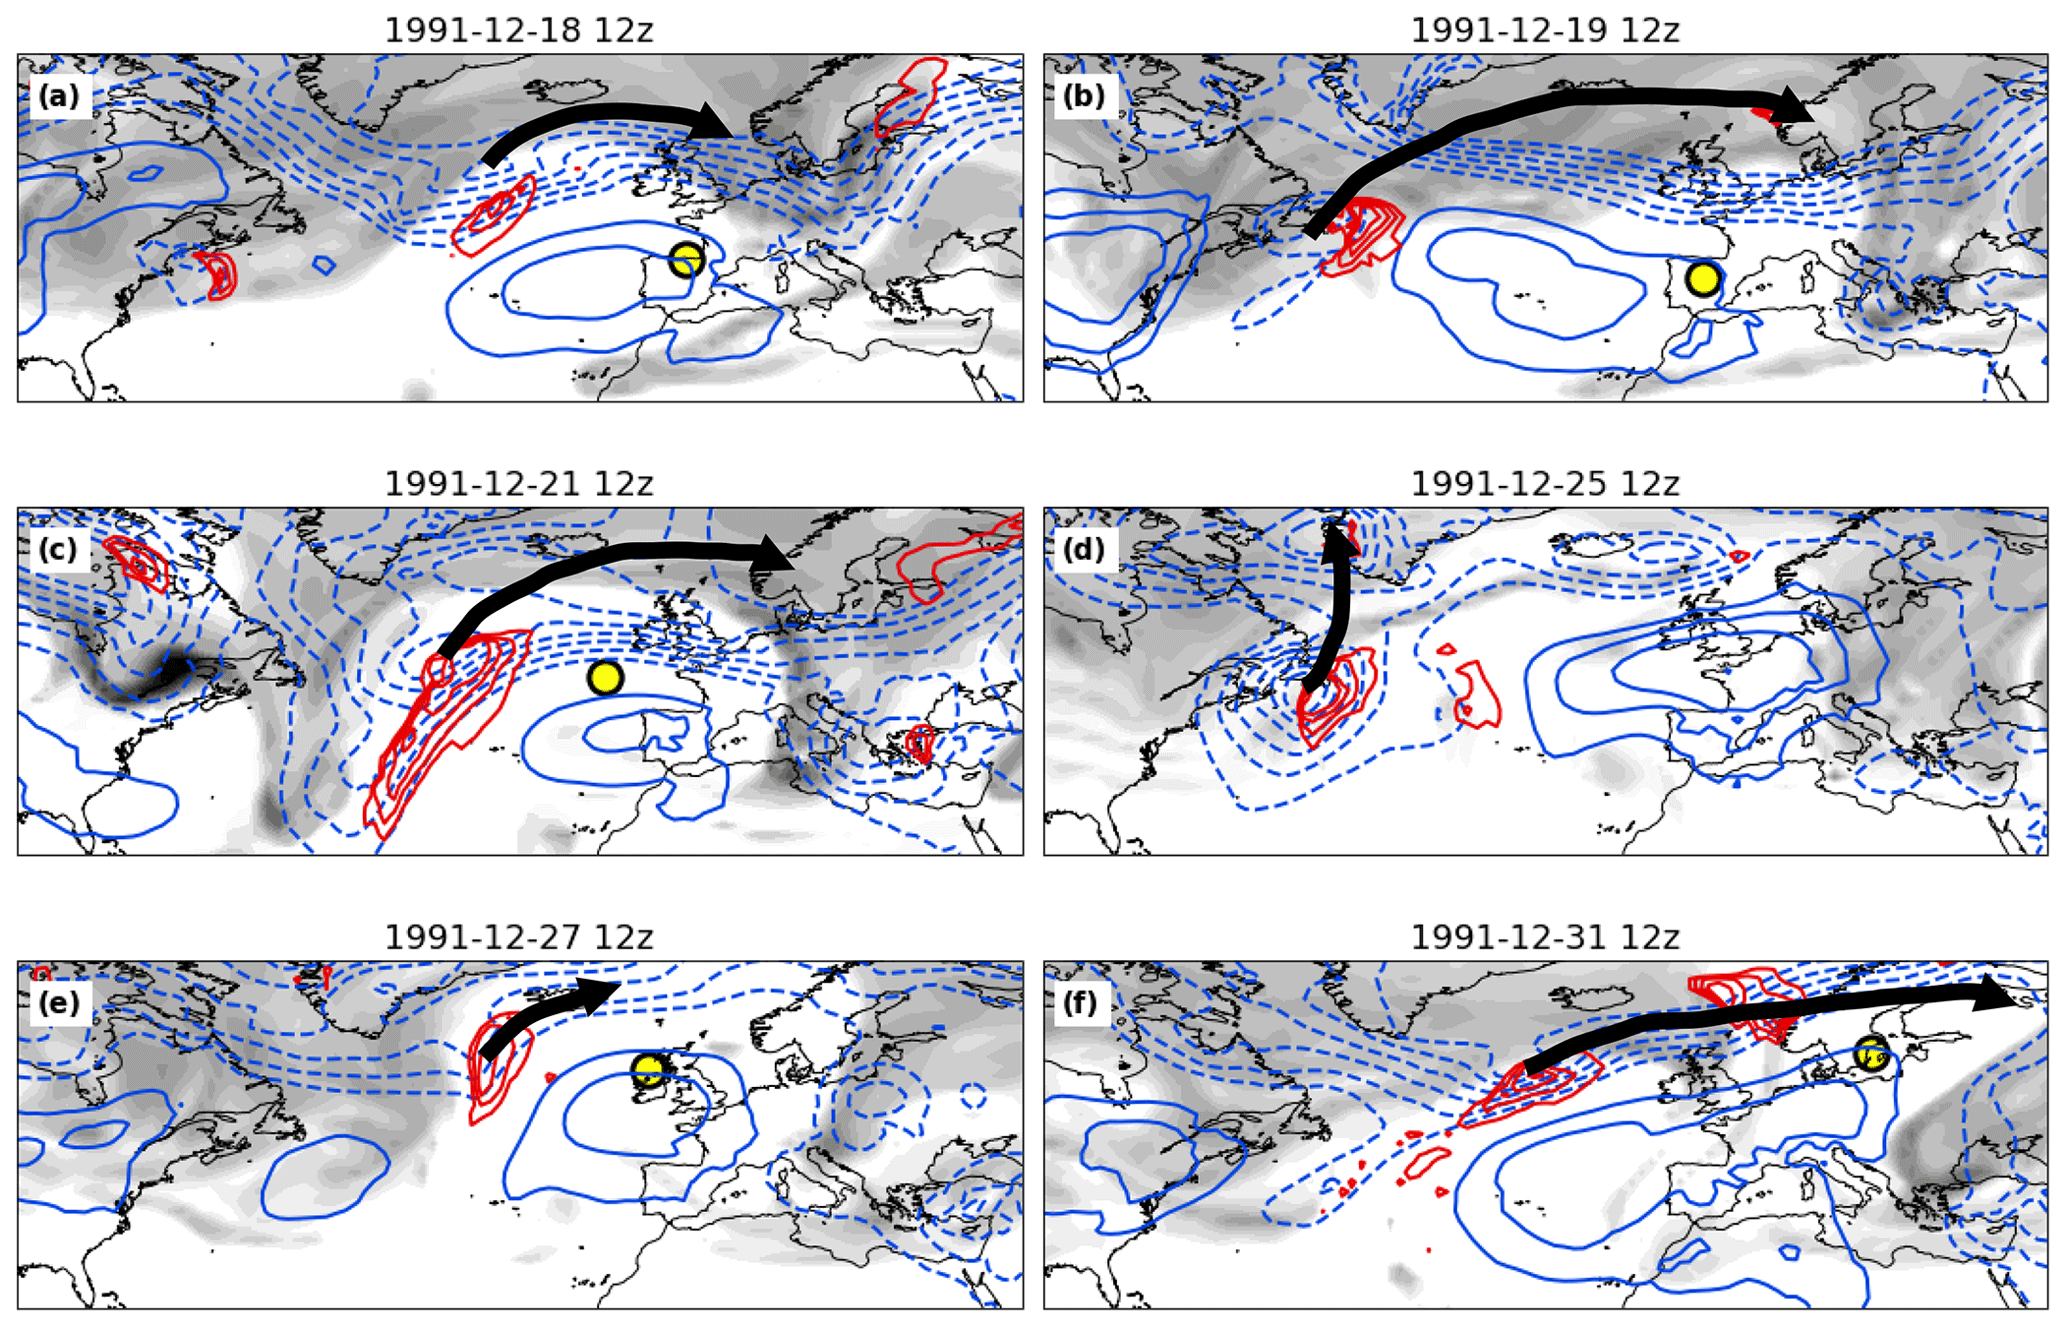
Figure 8The progression of large-scale flow during a 17 d rainy spell in Israel between 18 December 1991 and 3 January 1992 (r3 in Fig. 7b). PV on the 200 hPa isobaric surface is shown by shading (5 PVU minimal value, 0.5 PVU contour interval). SLP is denoted by blue contours with an interval of 5 hPa. For clarity, low values (≤1020 hPa) are dashed. Positive 850 hPa meridional heat flux (vT) is denoted by red contours (5×10³ mK s−1 minimal value, 1×10³ interval). The yellow circles mark anticyclonic wave breaking events, and the thick arrows show the approximate path of selected eddies. Selected days are shown to highlight the preceding conditions (a) and the following five PV streamers that crossed the region in succession (b–f).
An investigation of the temporal evolution of each season reveals evidence that corresponds to the rainfall enhancement mechanism discussed above. Out of the six major rainy spells in the 1992 season, three (r1, r3 and r4 in Fig. 7b) show a similar dynamical progression. First, a cluster M flow dominates the North Atlantic for several days. Then, at least one RWB event occurs east of the prime meridian (within the top green box in Fig. 7a), followed by 2–5 d where a PV streamer crosses the eastern Mediterranean, inducing cyclonic activity and rainfall (in terms of Fig. 7b, this translates to light blue shading, followed by a black marker, hatches and a peak in rainfall). This is of course not the only possible rain-producing progression. For example, r5 does not follow this order at all: rainfall starts after several days of a dry storm track configuration and is then amplified by recurring PV streamers independent of a breaking upstream. For the 1984 test case a common progression is less apparent. However, longer rain spells (as well as RWBs and streamers) mostly happen during or shortly after M cluster days. In fact, 42.5 % (84 mm) of the total seasonal rainfall amount were concentrated between 1 and 18 January, a period consistently classified as M cluster.
We now focus on the extreme r3 rainy spell (18 December 1991 to 3 January 992), as it serves as a clear recurring expression of eastern Mediterranean rain enhancement. An average of over 200 mm was recorded in Israel during this period, which is more than the annual total for some stations. Figure 8 shows the large-scale circulation prior to the rain event (Fig. 8a) and during it (Fig. 8b–f). The first several days include two major elements of an M cluster flow: a high-pressure center (solid blue contours) over the eastern Atlantic and Atlantic lows propagating northeast (low SLP with a high meridional heat flux, denoted by dashed blue and solid red contours, respectively). The eastern blocking high persists throughout the period for over 2 weeks while directing eddies poleward, most of them reaching Scandinavia (thick arrows in Fig. 8). On the northern edge of the high, RWB events form (yellow markers) and then develop downstream into PV streamers over the eastern Mediterranean. In total, four RWB events were detected during the rain spell (the markers in Fig. 8a and b refer to the same breaking), followed by five distinct PV streamers in fast succession.
This work explored the connection between North Atlantic circulation and eastern Mediterranean cyclonic activity and rainfall. This link has been discussed in previous literature (Trigo et al., 2000; Brayshaw et al., 2010; Ahmadi-Givi et al., 2014; Raveh-Rubin and Flaounas, 2017; Seager et al., 2020). However, the unique conditions of the eastern part of the basin are often overlooked in this context. When compared to the western part of the basin, the eastern Mediterranean has smaller and shallower cyclones, an overall higher mean SLP, and a downstream land–sea interaction over the eastern coast. Some studies also specifically investigated the large-scale drivers of eastern Mediterranean rainfall (Eshel and Farrell, 2000; Feldstein and Dayan, 2008; Black, 2012; Saaroni et al., 2015) but usually in the context of a specific mode (like the NAO or the EA/WR) or through the lens of statistical and climatological analysis. Black (2012) tied the NAO+ phase to enhanced precipitation in Israel but without addressing the dynamical link behind this connection.
We chose the North Atlantic storm track as the basis for this study, as it embodies a wide range of scales in space and time (from a single storm to large-scale Eulerian structures), and it is known to interact with many elements which affect Mediterranean cyclogenesis, such as the jet stream (Novak et al., 2015), subseasonal waves (Ahmadi-Givi et al., 2014) and individual Mediterranean cyclones (Ziv et al., 2015; Priestley et al., 2020).
By combining these North Atlantic storm track regimes with objective detection of important links in the cyclogenesis chain (RWBs, PV streamers, cyclones), we have demonstrated a configuration that enhances cyclonic activity, and thus rainfall, in the eastern Mediterranean. When North Atlantic storms are able to propagate far enough northeast, the resulting upper-level perturbations and PV streamers tend to form more eastward, specifically between 10–40° E. The upper-level PV injected into the region excites cyclogenesis and contributes to the intensification of Mediterranean lows. Our results show that this process has a subseasonal timescale (up to 10 d), from the initial North Atlantic perturbation to the enhanced precipitation over the eastern Mediterranean (see r1, r2 and r4 spells in Fig. 7). This scale is typical for weather regimes in the Atlantic (Novak et al., 2015).
However, this configuration exhibits a “Goldilocks”-type behavior, meaning that a relatively narrow set of values produce the effect. In this case, rain enhancement is only achieved for a specific storm track configuration. The eastern Mediterranean is generally drier and more stable when the Atlantic storms do not follow the preferable path, i.e., overshooting towards Greenland in the N cluster (Fig. 3a) or undershooting into western Europe in the S cluster (Fig. 3c). This is likely due to Mediterranean cyclones forming and reaching their peak more upstream, along the northern coast or near Genoa (shading in Fig. 4a and e).
The M cluster configuration is in fact an eastern Mediterranean variant of the RRF17 mechanism (Raveh-Rubin and Flaounas, 2017). Both are prompted over the North Atlantic by upper-level disturbances that develop into downstream jet undulations, which eventually drive PV into the Mediterranean region (via an RWB-based PV streamer).
However, while RRF17 hinges on the role of warm conveyor belts in the Atlantic, our results can be related to additional observed patterns, like a preceding Rossby wave train or a blocking high. This helps tie our results to other modes in the literature and explains why the cyclogenetic effect manifests further east. Specifically, the southern Levant pattern (Feldstein and Dayan, 2008) is linked to extreme precipitation in Israel, and it has a zonal wave reminiscent of the M cluster SLP pattern. Also, several studies on the NAO have pointed out that its positive phase (which has some overlap with our M cluster) can sometimes induce upper-level convergence that can result in perturbations downstream (Watanabe, 2004; Athanasiadis et al., 2010).
It is worth noting that our results highlight one aspect of Mediterranean cyclonic activity. Cyclones and their weather impacts in the region are highly variable. This is made apparent by the various counter examples that were found in our analysis (like rain spells during dry cluster days). It is well documented (Flaounas et al., 2022, and references therein) that Mediterranean storms are very sensitive to local conditions (diabatic heat fluxes, orography, mesoscale flows). They are certainly not driven exclusively by large-scale processes upstream. However, our findings accentuate the multi-scaled nature of Mediterranean cyclogenesis – from ocean-spanning structures to intermediate-scale waves and synoptic patterns interacting across all levels of the troposphere.
Finally, while this analysis focused on present-day climatology, it has further potential as a useful tool in studying future trends in the eastern Mediterranean and specifically its projected drying (Zappa et al., 2015). Mediterranean cyclones are a known pitfall for coarse-gridded climate models, as they are unable to simulate crucial local processes that affect the storm's life cycle and path. However, studying Mediterranean drying as it relates to better-captured large-scale Atlantic circulation might serve as a good proxy for this trend. A robust signal of anthropogenic climate change is the future poleward shift of the Atlantic jet stream and storm track (Tamarin-Brodsky and Kaspi, 2017; Stendel et al., 2021). However, its direct impact on the Mediterranean remains an open question, due to considerable model spread (Harvey et al., 2020) and uncertainty concerning future NAO trends (Deser et al., 2017; Cusinato et al., 2021). Future work will utilize the findings described in this paper to address this topic.
The ERA5 reanalysis dataset is available through the Copernicus Climate Change Service (C3S) Climate Data Store (CDS) at https://doi.org/10.24381/cds.bd0915c6 (Hersbach et al., 2023). Rain station data in Israel are produced by the Israel Meteorological Service (IMS) and can be obtained at https://ims.gov.il/en/data_gov (Israel Meteorological Service, 2021). The composite track dataset (Flaounas et al., 2023) is available at https://doi.org/10.5194/wcd-4-639-2023-supplement. The WaveBreaking code by Kaderli (2023) is available at https://doi.org/10.5281/zenodo.8123188. Additional data and code are available upon request.
DS: software, methodology, formal analysis, investigation, writing (original draft, review and editing). HS: conceptualization, methodology, investigation, supervision, writing (review and editing). BZ: conceptualization, methodology, investigation, writing (review and editing). TTB: software, formal analysis, investigation, writing (review and editing). NH: conceptualization, methodology, investigation, supervision, writing (review and editing).
At least one of the (co-)authors is a member of the editorial board of Weather and Climate Dynamics. The peer-review process was guided by an independent editor, and the authors also have no other competing interests to declare.
Publisher's note: Copernicus Publications remains neutral with regard to jurisdictional claims made in the text, published maps, institutional affiliations, or any other geographical representation in this paper. While Copernicus Publications makes every effort to include appropriate place names, the final responsibility lies with the authors.
This work is a contribution to the COST Action CA19109 “MedCyclones: European network for Mediterranean cyclones in weather and climate”. The authors wish to thank the Israel Science Foundation (ISF; 2253/20 and 2466/23) and the Water Authority of Israel (grant 4501683730) for funding this study. The authors also thank Gudrun Magnusdottir for providing the RWB detection algorithm and Severin Kaderli for the streamer detection algorithm.
This research has been supported by the Israel Science Foundation (grant nos. 2253/20 and 2466/23) and the Water Authority of Israel (grant no. 4501683730).
This paper was edited by Christian Grams and reviewed by Emmanouil Flaounas and one anonymous referee.
Ahmadi-Givi, F., Nasr-Esfahany, M., and Mohebalhojeh, A.: Interaction of North Atlantic baroclinic wave packets and the Mediterranean storm track, Q. J. Roy. Meteorol. Soc., 140, 754–765, 2014. a, b
Ali, S. M., Martius, O., and Röthlisberger, M.: Recurrent Rossby wave packets modulate the persistence of dry and wet spells across the globe, Geophysi. Res. Lett., 48, e2020GL091452, https://doi.org/10.1029/2020GL091452, 2021. a
Athanasiadis, P. J., Wallace, J. M., and Wettstein, J. J.: Patterns of wintertime jet stream variability and their relation to the storm tracks, J. Atmos. Sci., 67, 1361–1381, 2010. a
Beghin, P., Charbit, S., Kageyama, M., Combourieu-Nebout, N., Hatté, C., Dumas, C., and Peterschmitt, J.-Y.: What drives LGM precipitation over the western Mediterranean? A study focused on the Iberian Peninsula and northern Morocco, Clim. Dynam. 46, 2611–2631, 2016. a
Berkovic, S. and Raveh-Rubin, S.: Persistent warm and dry extremes over the eastern Mediterranean during winter: The role of North Atlantic blocking and central Mediterranean cyclones, Q. J. Roy. Meteorol. Soc., 148, 2384–2409, 2022. a, b
Black, E.: The influence of the North Atlantic Oscillation and European circulation regimes on the daily to interannual variability of winter precipitation in Israel, Int. J. Climatol., 32, 1654–1664, 2012. a, b, c
Brayshaw, D. J., Hoskins, B., and Black, E.: Some physical drivers of changes in the winter storm tracks over the North Atlantic and Mediterranean during the Holocene, Philos. T. Roy. Soc. A, 368, 5185–5223, 2010. a, b, c
Čampa, J. and Wernli, H.: A PV perspective on the vertical structure of mature midlatitude cyclones in the Northern Hemisphere, J. Atmos. Sci., 69, 725–740, 2012. a
Cusinato, E., Rubino, A., and Zanchettin, D.: Winter Euro-Atlantic climate modes: future scenarios from a CMIP6 multi-model ensemble, Geophys. Res. Lett., 48, e2021GL094532, https://doi.org/10.1029/2021GL094532, 2021. a
Deser, C., Hurrell, J. W., and Phillips, A. S.: The role of the North Atlantic Oscillation in European climate projections, Clim. Dynam., 49, 3141–3157, 2017. a
Eshel, G. and Farrell, B. F.: Mechanisms of eastern Mediterranean rainfall variability, J. Atmos. Sci., 57, 3219–3232, 2000. a
Feldstein, S. B. and Dayan, U.: Circumglobal teleconnections and wave packets associated with Israeli winter precipitation, Quarterly Journal of the Royal Meteorological Society: A journal of the atmospheric sciences, Appl. Meteorol. Phys. Oceanogr., 134, 455–467, 2008. a, b, c, d
Flaounas, E., Raveh-Rubin, S., Wernli, H., Drobinski, P., and Bastin, S.: The dynamical structure of intense Mediterranean cyclones, Clim. Dynam., 44, 2411–2427, 2015. a, b
Flaounas, E., Gray, S. L., and Teubler, F.: A process-based anatomy of Mediterranean cyclones: from baroclinic lows to tropical-like systems, Weather Clim. Dynam., 2, 255–279, https://doi.org/10.5194/wcd-2-255-2021, 2021. a, b
Flaounas, E., Davolio, S., Raveh-Rubin, S., Pantillon, F., Miglietta, M. M., Gaertner, M. A., Hatzaki, M., Homar, V., Khodayar, S., Korres, G., Kotroni, V., Kushta, J., Reale, M., and Ricard, D.: Mediterranean cyclones: current knowledge and open questions on dynamics, prediction, climatology and impacts, Weather Clim. Dynam., 3, 173–208, https://doi.org/10.5194/wcd-3-173-2022, 2022. a, b
Flaounas, E., Aragão, L., Bernini, L., Dafis, S., Doiteau, B., Flocas, H., Gray, S. L., Karwat, A., Kouroutzoglou, J., Lionello, P., Miglietta, M. M., Pantillon, F., Pasquero, C., Patlakas, P., Picornell, M. Á., Porcù, F., Priestley, M. D. K., Reale, M., Roberts, M. J., Saaroni, H., Sandler, D., Scoccimarro, E., Sprenger, M., and Ziv, B.: A composite approach to produce reference datasets for extratropical cyclone tracks: application to Mediterranean cyclones, Weather Clim. Dynam., 4, 639–661, https://doi.org/10.5194/wcd-4-639-2023, 2023 (data available at: https://doi.org/10.5194/wcd-4-639-2023-supplement). a, b
Gaetani, M., Baldi, M., Dalu, G. A., and Maracchi, G.: Jetstream and rainfall distribution in the Mediterranean region, Nat. Hazards Earth Syst. Sci., 11, 2469–2481, hhttps://doi.org/10.5194/nhess-11-2469-2011, 2011. a
Givon, Y., Hess, O., Flaounas, E., Catto, J. L., Sprenger, M., and Raveh-Rubin, S.: Process-based classification of Mediterranean cyclones using potential vorticity, Weather Clim. Dynam., 5, 133–162, https://doi.org/10.5194/wcd-5-133-2024, 2024. a
Harvey, B., Cook, P., Shaffrey, L., and Schiemann, R.: The response of the northern hemisphere storm tracks and jet streams to climate change in the CMIP3, CMIP5, and CMIP6 climate models, J. Geophys. Res.-Atmos., 125, e2020JD032701, https://doi.org/10.1029/2020JD032701, 2020. a
Hersbach, H., Bell, B., Berrisford, P., Biavati, G., Horányi, A., Muñoz Sabater, J., Nicolas, J., Peubey, C., Radu, R., Rozum, I., Schepers, D., Simmons, A., Soci, C., Dee, D., and Thépaut, J.-N.: ERA5 hourly data on pressure levels from 1940 to present, Copernicus Climate Change Service (C3S) Climate Data Store (CDS) [data set], https://doi.org/10.24381/cds.bd0915c6, 2023.
Hochman, A., Alpert, P., Kunin, P., Rostkier-Edelstein, D., Harpaz, T., Saaroni, H., and Messori, G.: The dynamics of cyclones in the twentyfirst century: the Eastern Mediterranean as an example, Clim. Dynam., 54, 561–574, 2020. a
Israel Meteorological Service: Meteorological Database | Israel Meteorological Service, ims.gov.il [data set], https://ims.gov.il/en/data_gov (last access: 15 June 2024), 2021.
Joos, H., Sprenger, M., Binder, H., Beyerle, U., and Wernli, H.: Warm conveyor belts in present-day and future climate simulations – Part 1: Climatology and impacts, Weather Clim. Dynam., 4, 133–155, https://doi.org/10.5194/wcd-4-133-2023, 2023. a
Kaderli, S.: Coding of a Rossby wave breaking detection algorithm in Python, MSc thesis, University of Bern, Bern, Switzerland, https://occrdata.unibe.ch/students/theses/msc/406.pdf (last access: 4 September 2024), 2022. a
Kaderli, S.: Skaderli/WaveBreaking: WaveBreaking V0.3.7, Zenodo [code], https://doi.org/10.5281/zenodo.8123188, 2023. a, b
Madonna, E., Wernli, H., Joos, H., and Martius, O.: Warm conveyor belts in the ERA-Interim dataset (1979–2010). Part I: Climatology and potential vorticity evolution, Jo. Climate, 27, 3–26, 2014. a
Nissen, K. M., Leckebusch, G. C., Pinto, J. G., Renggli, D., Ulbrich, S., and Ulbrich, U.: Cyclones causing wind storms in the Mediterranean: characteristics, trends and links to large-scale patterns, Nat. Hazards Earth Syst. Sci., 10, 1379–1391, https://doi.org/10.5194/nhess-10-1379-2010, 2010. a, b
Novak, L., Ambaum, M. H., and Tailleux, R.: The life cycle of the North Atlantic storm track, J. Atmos. Sci., 72, 821–833, 2015. a, b, c, d, e, f, g
Pantillon, F., Chaboureau, J.-P., and Richard, E.: Remote impact of North Atlantic hurricanes on the Mediterranean during episodes of intense rainfall in autumn 2012, Q. J. Roy. Meteorol. Soc., 141, 967–978, 2015. a
Pfahl, S., Schwierz, C., Croci-Maspoli, M., Grams, C. M., and Wernli, H.: Importance of latent heat release in ascending air streams for atmospheric blocking, Nat. Geosci., 8, 610–614, 2015. a
Portmann, R., González-Alemán, J. J., Sprenger, M., and Wernli, H.: How an uncertain short-wave perturbation on the North Atlantic wave guide affects the forecast of an intense Mediterranean cyclone (Medicane Zorbas), Weather Clim. Dynam., 1, 597–615, https://doi.org/10.5194/wcd-1-597-2020, 2020. a
Priestley, M. D., Dacre, H. F., Shaffrey, L. C., Schemm, S., and Pinto, J. G.: The role of secondary cyclones and cyclone families for the North Atlantic storm track and clustering over western Europe, Q. J. Roy. Meteorol. Soc., 146, 1184–1205, 2020. a, b, c
Raveh-Rubin, S. and Flaounas, E.: A dynamical link between deep Atlantic extratropical cyclones and intense Mediterranean cyclones, Atmos. Sci. Lett., 18, 215–221, 2017. a, b, c, d, e, f, g, h
Raveh-Rubin, S. and Wernli, H.: Large-scale wind and precipitation extremes in the Mediterranean: a climatological analysis for 1979–2012, Q. J. Roy. Meteorol. Soc., 141, 2404–2417, 2015. a
Reale, M., Cabos Narvaez, W. D., Cavicchia, L., Conte, D., Coppola, E., Flaounas, E., Giorgi, F., Gualdi, S., Hochman, A., Li, L., Lionello, P., Podrascanin, Z., Salon, S., Sanchez-Gomez, E., Scoccimarro, E., Sein, D. V., and Somot, S.: Future projections of Mediterranean cyclone characteristics using the Med-CORDEX ensemble of coupled regional climate system models, Clim. Dynam., 58, 2501–2524, 2022. a
Redolat, D., Monjo, R., Lopez-Bustins, J. A., and Martin-Vide, J.: Upper-Level Mediterranean Oscillation index and seasonal variability of rainfall and temperature, Theor. Appl. Climatol., 135, 1059–1077, 2019. a
Rostkier-Edelstein, D., Liu, Y., Wu, W., Kunin, P., Givati, A., and Ge, M.: Towards a high-resolution climatography of seasonal precipitation over Israel, Int. J. Climatol., 34, 1964–1979, 2014. a
Saaroni, H., Halfon, N., Ziv, B., Alpert, P., and Kutiel, H.: Links between the rainfall regime in Israel and location and intensity of Cyprus lows, Int. J. Climatol., 30, 1014–1025, 2010. a
Saaroni, H., Ziv, B., Lempert, J., Gazit, Y., and Morin, E.: Prolonged dry spells in the Levant region: climatologic-synoptic analysis, Int. J. Climatol., 35, 2223–2236, 2015. a, b, c
Saaroni, H., Harpaz, T., and Ziv, B.: A new classification algorithm for daughter cyclone formation with respect to the parent's frontal system–application for the Mediterranean Basin, Int. J. Climatol., 37, 1050–1065, 2017. a
Saaroni, H., Ziv, B., Harpaz, T., and Lempert, J.: Dry events in the winter in Israel and its linkage to synoptic and large-scale circulations, Int. J. Climatol., 39, 1054–1071, 2019. a
Scherrmann, A., Wernli, H., and Flaounas, E.: The upstream–downstream connection of North Atlantic and Mediterranean cyclones in semi-idealized simulations, Weather Clim. Dynam., 5, 419–438, https://doi.org/10.5194/wcd-5-419-2024, 2024. a
Seager, R., Liu, H., Kushnir, Y., Osborn, T. J., Simpson, I. R., Kelley, C. R., and Nakamura, J.: Mechanisms of Winter precipitation variability in the European–Mediterranean region associated with the North Atlantic oscillation, J. Climate, 33, 7179–7196, 2020. a, b
Stendel, M., Francis, J., White, R., Williams, P. D., and Woollings, T.: The jet stream and climate change, in: Climate change, Elsevier, 327–357, https://doi.org/10.1016/B978-0-12-821575-3.00015-3, 2021. a
Strong, C. and Magnusdottir, G.: Tropospheric Rossby wave breaking and the NAO/NAM, J. Atmosp. Sci., 65, 2861–2876, 2008. a, b
Tamarin-Brodsky, T. and Harnik, N.: The relation between Rossby wave-breaking events and low-level weather systems, Weather Clim. Dynam., 5, 87–108, https://doi.org/10.5194/wcd-5-87-2024, 2024. a, b, c, d, e, f
Tamarin-Brodsky, T. and Kaspi, Y.: Enhanced poleward propagation of storms under climate change, Nat. Geosci., 10, 908–913, 2017. a
Trigo, I. F., Davies, T. D., and Bigg, G. R.: Decline in Mediterranean rainfall caused by weakening of Mediterranean cyclones, Geophys. Res. Lett., 27, 2913–2916, 2000. a
Voskresenskaya, E. N., Maslova, V. N., Lubkov, A. S., and Zhuravskiy, V. Y.: Present and Future Changes in Winter Cyclonic Activity in the Mediterranean–Black Sea Region in the 21st Century Based on an Ensemble of CMIP6 Models, Atmosphere, 13, 1573, https://doi.org/10.3390/atmos13101573, 2022. a
Watanabe, M.: Asian jet waveguide and a downstream extension of the North Atlantic Oscillation, J. Climate, 17, 4674–4691, 2004. a, b, c, d, e
Wernli, H. and Sprenger, M.: Identification and ERA-15 climatology of potential vorticity streamers and cutoffs near the extratropical tropopause, J. Amos. Sci., 64, 1569–1586, 2007. a, b
Wettstein, J. J. and Wallace, J. M.: Observed patterns of month-to-month storm-track variability and their relationship to the background flow, J. Atmos. Sci., 67, 1420–1437, 2010. a
Wiegand, L. and Knippertz, P.: Equatorward breaking Rossby waves over the North Atlantic and Mediterranean region in the ECMWF operational Ensemble Prediction System, Q. J. Roy. Meteorol. Soc., 140, 58–71, 2014. a
Woollings, T., Hannachi, A., and Hoskins, B.: Variability of the North Atlantic eddy-driven jet stream, Q. J. Roy. Meteorol. Soc., 136, 856–868, 2010. a, b
Zangvil, A. and Druian, P.: Upper air trough axis orientation and the spatial distribution of rainfall over Israel, Int. J. Climatol., 10, 57–62, 1990. a
Zappa, G., Hawcroft, M. K., Shaffrey, L., Black, E., and Brayshaw, D. J.: Extratropical cyclones and the projected decline of winter Mediterranean precipitation in the CMIP5 models, Clim. Dynam., 45, 1727–1738, 2015. a
Ziv, B., Dayan, U., Kushnir, Y., Roth, C., and Enzel, Y.: Regional and global atmospheric patterns governing rainfall in the southern Levant, Int. J. Climatol., 26, 55–73, 2006. a, b, c
Ziv, B., Saaroni, H., Romem, M., Heifetz, E., Harnik, N., and Baharad, A.: Appl. Climatol., 99, 441–455, 2010. a
Ziv, B., Harpaz, T., Saaroni, H., and Blender, R.: A new methodology for identifying daughter cyclogenesis: application for the Mediterranean Basin, Int. J. Climatol., 35, 3847–3861, 2015. a, b