the Creative Commons Attribution 4.0 License.
the Creative Commons Attribution 4.0 License.
Concurrent Bering Sea and Labrador Sea ice melt extremes in March 2023: a confluence of meteorological events aligned with stratosphere–troposphere interactions
Thomas J. Ballinger
Kent Moore
Qinghua Ding
Amy H. Butler
James E. Overland
Richard L. Thoman
Ian Baxter
Zhe Li
Edward Hanna
Today's Arctic is characterized by a lengthening of the sea ice melt season, as well as by fast and at times unseasonal melt events. Such anomalous melt cases have been identified in Pacific and Atlantic Arctic sector sea ice studies. Through observational analyses, we document an unprecedented, concurrent marginal ice zone melt event in the Bering Sea and Labrador Sea in March of 2023. Taken independently, variability in the cold-season ice edge at synoptic timescales is common. However, such anomalous, short-term ice loss over either region during the climatological sea ice maxima is uncommon, and the tandem ice loss that occurred qualifies this as a rare event. The atmospheric setting that supported the unseasonal melt events was preceded by a sudden stratospheric warming event amidst background La Niña conditions that led to positive tropospheric height anomalies across much of the Arctic and the development of anomalous mid-troposphere ridges over the ice loss regions. These large-scale anticyclonic centers funneled extremely warm and moist airstreams onto the ice causing melt. Further analysis identified the presence of atmospheric rivers within these warm airstreams whose characteristics likely contributed to this bi-regional ice melt event. Whether such a confluence of anomalous wintertime events associated with troposphere–stratosphere coupling may occur more often in a warming Arctic remains a research area ripe for further exploration.
- Article
(8932 KB) - Full-text XML
-
Supplement
(1356 KB) - BibTeX
- EndNote
Observational analyses of the Arctic atmosphere have noted warmer air temperatures and increased moisture content during the last 2 decades relative to previous years (Ballinger et al., 2023; Boisvert et al., 2023). Periods of increased climate variability (Hanna et al., 2015) can coincide with these atmospheric changes in the Arctic to produce extreme meteorological phenomena, which may influence human and environmental systems both within and beyond the high northern latitudes. Moreover, terrestrial Arctic snow and sea ice extent, area, and depth/thickness control heat exchange between the land, ocean, and atmosphere (Serreze and Barry, 2011). With less snow and sea ice in a warming Arctic, instances of surface-to-atmosphere heating perturbations can magnify impacts of synoptic circulation patterns on local and/or remote surface weather extremes (Francis and Vavrus, 2015; Zhang et al., 2018; Tachibana et al., 2019; Bailey et al., 2021). Thus air–sea interactions resulting in extreme events in today's Arctic are structurally complex (Walsh et al., 2020) and shaped by the surface condition/type and prevailing weather pattern (Overland et al., 2021).
A key consideration of complex Arctic extreme events is their timing of occurrence within the annual cycle. As an example, the Arctic Ocean's ice cover tends to thin and decline (thicken and increase) through the boreal summer (winter) months up to the September minima (March maxima). However, analyses of satellite observations have shown a trend toward earlier melt onset across most of the Arctic marginal seas (e.g., Stroeve and Notz, 2018) with unusually timed and often isolated ice loss events during winter or early spring interspersed on these trends. The North Atlantic Arctic region that includes marginal seas around Greenland, Iceland, and northwestern Europe has experienced several of these cases in recent times. During mid-April of 2013, a persistent anticyclone over Greenland coincided with record-early melt onset in the Baffin Bay, Davis Strait, and Labrador Sea region that was ∼ 8 weeks earlier than the 1981–2010 average (Ballinger et al., 2018). Above-freezing air temperatures at the North Pole during late December of 2015 led to a substantial loss of sea ice over the Arctic Ocean (Moore, 2016). In late February and early March of 2018, a polynya unexpectedly opened off the northern Greenland coast that was driven by anomalously warm and strong southerly winds that were preceded by a sudden stratospheric warming (SSW) event (Moore et al., 2018). In one of the most notable examples, an Arctic cyclone that registered record-low central pressure traversed the Barents and Kara seas in late January of 2022 and caused record surface winds and attendant ice loss for the time of year (Blanchard-Wrigglesworth et al., 2022). Unlike the previous cases, dynamical and ocean processes rather than thermodynamics were attributed to this unseasonal ice loss event.
There is a large body of research into so-called compound extreme climate events such as the simultaneous occurrence in a particular region of a drought and heat wave or a storm surge and fluvial flooding (e.g., Zscheischler et al., 2018; AghaKouchak et al., 2020). Less well-studied are so-called concurrent climate extreme events where two or more spatially isolated regions are subject to simultaneous or near-simultaneous extremes (Zhou et al., 2023). Compound events may be associated with a single overarching phenomenon such as a hurricane, while concurrent events are typically associated with amplified Rossby waves (Kornhuber et al., 2020).
In this study, we have identified the first known observation of a concurrent climate extreme event in the Arctic as well as one that is associated with an SSW and La Niña background state. This concurrent event is marked by unusually timed sea ice melt in the Bering Sea and Labrador Sea during March of 2023. Our goals in this observationally based case study are to describe the respective regional sea ice conditions during March 2023, place them into a historical spatial and temporal context, and evaluate the synoptic atmospheric mechanisms responsible for the ensuing melt extremes. As part of our analyses, we evaluate the probability of such sea ice melt extremes amidst the period that encompassed the climatological Arctic sea ice maximum. We conclude with a discussion of our findings that considers seasonal and synoptic meteorological anomalies that occurred during and around the time of these melt events. Our conclusions also touch upon the implications of Arctic warming for analogous future melt events.
2.1 Sea ice and atmospheric datasets
Daily sea ice concentration (SIC in %) is derived from the NOAA/NSIDC Climate Data Record (CDR) of passive microwave SIC, version 4 (Meier et al., 2021, 2022). This dataset represents a blended product of the NASA team algorithm (Cavalieri et al., 1984) and NASA bootstrap algorithm (Comiso, 1986) and is available daily on a 25 km2 grid from 1979 onwards.
ECMWF fifth-generation global atmospheric reanalysis (ERA5) data at their 31 km native resolution for 1979–2023 (Hersbach et al., 2020) are used to evaluate atmospheric conditions across the Arctic region during and around the SSW event and ensuing sea ice melt extremes. ERA5 fields examined include 2 m air temperature (T2m in °C); total column water vapor (in mm); total precipitation, which is the sum of large-scale and convective precipitation including rain and snowfall, that reaches the surface (in mm d−1); net and downward longwave radiation (in W m−2); and geopotential heights (in m) over the atmospheric column from 1000 to 1 hPa. Unless otherwise stated, data are binned to daily means. Studies have shown ERA5 to be effective at capturing Arctic weather and climate variability. As an example, during a research expedition in Fram Strait, Graham et al. (2019) noted ERA5 air temperatures, humidity, and winds exhibited relatively strong correlations and low biases in comparison with radiosonde observations and performed better overall than other modern atmospheric reanalyses in the region. Numerous other studies have relied upon ERA5 data to understand the synoptic evolution and characteristics of airstreams within the Arctic (e.g., Nygård et al., 2020; Papritz et al., 2022; Kirbus et al., 2023).
In addition to reanalysis fields, daily averaged T2m data from regional weather stations are evaluated (Fig. 1). We deliberately selected near-coastal weather stations based on several criteria, including multidecadal records that are relatively complete (> 95 % of dates surveyed register a T2m value) for sites located north and south of both the early-March long-term mean and 2023 ice edge in the Bering Sea and Labrador Sea, respectively. Data from leap years are omitted as 2023 was not one. For the Bering Sea region, we obtained T2m data from the National Centers for Environmental Information Applied Climate Information System (NCEI ACIS) for Alaska terrestrial weather stations at St. Paul (57.16° N, 170.22° W) and Kotzebue (66.89° N, 162.58° W). The St. Paul historical record is surveyed from 1916–2023, while the Kotzebue record is assessed from 1923–2023. For the Labrador region two western Greenland weather station records, which are maintained by the Danish Meteorological Institute (DMI), are obtained for Nuuk (64.17° N, 51.75° W) and Aasiaat (68.70° N, 52.75° W). Both of these Greenland records span 1958 to 2023. We supplement NCEI ACIS and DMI observations with Programme for Monitoring of the Greenland Ice Sheet (PROMICE) automatic, on-ice weather station temperatures, measured from a nominal height of 2.7 m above the ice-sheet surface, for two sites: one is near Nuuk on a peripheral glacier (NUK_K; 64.16° N , 51.36° W; 710 m a.s.l.), and the other is found within the lower ablation area of the Greenland Ice Sheet (GrIS) in the Qassimiut region (QAS_L; 61.03° N, 46.85° W; 280 m a.s.l.) (Fausto et al., 2021). The PROMICE data records are relatively short, with NUK_K established in 2015 and QAS_L in 2008, though both are 99 % complete for the dates we surveyed and provide valuable information on GrIS in situ air temperatures on the rather observationally sparse Greenland Ice Sheet.
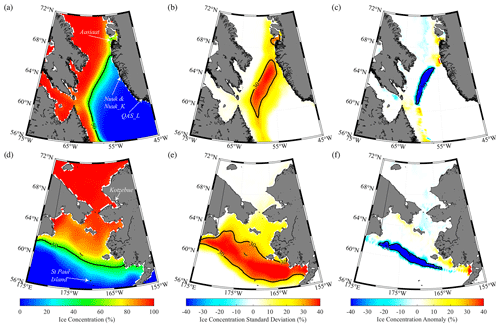
Figure 1Sea ice concentration (SIC in %) from the NOAA/NSIDC CDR dataset. Mean conditions for the period 1–15 March 2000–2023 for (a) the Labrador Sea and (d) the Bering Sea. The SIC standard deviation (%) for 1–15 March 2000–2023 is shown for (b) the Labrador Sea and (e) the Bering Sea. The sea ice concentration anomaly on 5 March 2023 relative to the 1–15 March 2000–2023 period is shown for (c) the Labrador Sea and (f) the Bering Sea. In (a) and (d) locations of the weather stations mentioned in the text are indicated by arrows.
Several atmospheric indices are analyzed and discussed in this work. The SSW compendium (Butler et al., 2017, updated), a long-term archive of indicator climate indices associated with SSW events, confirmed the onset of the late-winter 2023 SSW event (16 February). We examine one such metric of this archive that we term the Polar Vortex Index (PVI), which describes the daily mean zonal mean winds at 60° N and 10 hPa, where the timing of the shift from westerly to easterly stratospheric flow between November and April signifies the SSW onset (Charlton and Polvani, 2007). The PVI is analyzed from 1979–2023. SSW events are known to influence the mid- to high-latitude tropospheric circulation patterns and often precede a negative North Atlantic Oscillation (NAO) regime and high-latitude anticyclonic blocking (Baldwin et al., 2021). Therefore, we elect to analyze the daily NAO and region-specific Greenland Blocking Index (GBI) and Alaska Blocking Index (ABI). The NAO used here extends from 1950 to 2023 and is defined as the leading, rotated principal component of standardized 500 hPa geopotential height (z500) anomalies from 20–90° N (Barnston and Livezey, 1987). The GBI describes the mean z500 across 60–80° N, 20–80° W (Hanna et al., 2013), and the ABI depicts the averaged z500 from 55–75° N and 125–180° W (Ballinger et al., 2022). These blocking indices are analyzed over the 1948 to 2023 period.
2.2 Extreme event detection methods
We examine moisture transport into the Arctic during our case study by employing an atmospheric river (AR) detection algorithm developed by Guan and Waliser (2019). This algorithm is applied on 6-hourly ERA5 integrated water vapor transport (IVT in kg m−1 s−1) data, averaged from 1000 to 300 hPa on a 1.5° × 1.5° global grid. In this framework, ARs for each 6 h interval are defined when an IVT threshold exceeding the 85th percentile of climatological IVT is reached for a grid cell in the domain of interest. Additionally, these ARs must meet specific criteria related to the orientation, length, and length-to-width ratio of IVT, as outlined by Guan and Waliser (2019). Widely adopted in previous studies spanning the tropics to the high latitudes including the Arctic and Antarctic, this algorithm serves as a reliable scheme for AR analysis (Collow et al., 2022). We examine the duration of AR events passing through the Alaska and Greenland regional domains shown in Fig. 1 leading up to, coinciding with, and following the Bering and Labrador melt events, respectively. AR duration is defined as the percentage (%) of the day in which an AR resides within any portion of the respective domains. We also measure the intensity of AR events, defined here as the mean IVT of all grid cells that cross into either domain associated with an AR.
Daily atmospheric indices and maps of the reanalysis data are presented, and values are identified that meet or exceed an extreme value threshold (i.e., 95th or 99th percentile) relative to a specified number of days across the data records described in Sect. 2.1. For example, a 99th percentile St. Paul, Alaska, T2m value during the 90 d “winter” period from 1 January to 31 March for 1916–1923 (where 9576 d registered a daily mean T2m reading) is 3.3 °C. Use of the full historical period or select portions of the dataset's records along with extended time windows (e.g., 1 January–31 March) provided a larger sample size from which to calculate extreme values relative to the period specified or season (e.g., 90 d) versus a singular date of reference.
3.1 Extreme and unusually timed sea ice melt
The regional SIC means, variability, and anomalies around the peak of the melt events relative to 1–15 March 2000 to 2023 are shown in Fig. 1. This subset of years is selected as winter months since 2000 have seen a large decline in sea ice conditions (Stroeve and Notz, 2018). In the Labrador region, the 50 % climatological ice edge tilted northeast to southwest from the Davis Strait into the Labrador Sea and transitioned in the marginal ice zone to nearly 100 % SIC on the western flank of this boundary (Fig. 1a). In contrast, the Bering Sea ice edge exhibited a more zonal orientation and extended from ∼ 61° N in the western Bering Sea to ∼ 59° N in the eastern Bering Sea (Fig. 1d). From 2000 to 2023, interannual SIC variability for the first half of March in these marginal ice zone areas was ∼ 30 % (Fig. 1b, e), while early March 2023 saw SIC reductions along the ice edge on the order of ∼ −30 % (Fig. 1c, f).
The SIC conditions in these areas of > 30 % variability are examined more closely with respect to the winter of 2023. Winter is loosely defined here as January through March. From mid-January through February, the daily Labrador SIC exceeded the 2000–2023 mean and then abruptly plummeted to below-normal conditions in early March and remained below average through the end of the month (Fig. 2a). The Bering SIC showed more variability in the SIC day-of-year means with periods of slightly above-normal and below-normal ice cover into early March and through the rest of the month (Fig. 2b). While single-day SIC departures through winter in both areas did not breach the 5th or 95th percentiles for the day of year, the largest 4 d changes (< 20 % SIC losses) occurred roughly at the same time and culminated on 5 March in the Labrador Sea and 6 March in the Bering Sea (see vertical dashed red lines in Fig. 2). While day-to-day sea ice variability is not unusual throughout winter, the day-of-year mean curves (thick black lines in Fig. 2) suggest that ice growth tends to continue in both of these regions throughout most of March aligned with the typical pan-Arctic sea ice maximum (Meier et al., 2023).
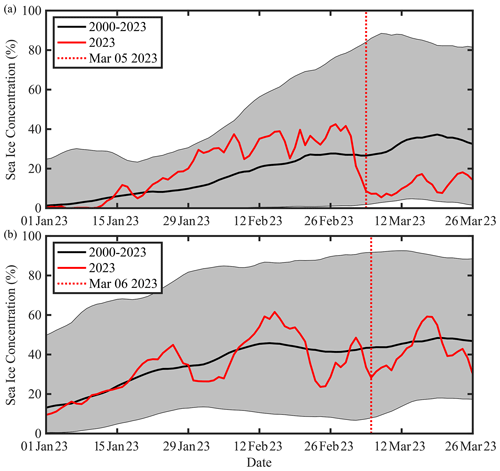
Figure 2Time series (red curves) of the daily SIC averaged over the regions (a) Labrador Sea and (b) Bering Sea, respectively, in Fig. 1b and e, where the standard deviation exceeds 30 % for the period 1 January to 26 March 2023. The black line represents the daily mean value for the period 2000–2023 with the shading incorporating daily values between the 5th and 95th percentile values. The ending dates for the 4 d window with the largest change in ice concentration are shown by the dotted red lines.
Histograms provide an additional probabilistic perspective on the likelihood of such 4 d ice loss events for the times of year they occurred in 2023 (Fig. 3). Since 2000, both the Labrador Sea (red curve) and Bering Sea (blue curve) have shown quasi-normal SIC distributions over the 1–15 March period. The 2023 4 d changes in both areas, characterized by a ∼ 20 % SIC reduction in the Bering Sea and a ∼ 27 % SIC decline in the Labrador Sea, represent extreme outliers found in the far-left tails of their respective data distributions. The magnitude of these short-term SIC loss events is uncommon for the time of year, which prompts further investigation into the synoptic processes that drive, and potentially link, these rare, concurrent events.
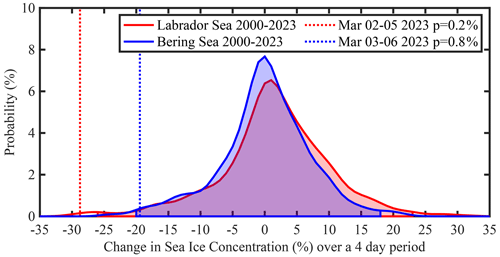
Figure 3Histograms of the change over a 4 d period during 1–15 March 2000–2023 for the Labrador Sea (red) and Bering Sea (blue) regions used in Fig. 2. The shading represents the regions bounded by the 1st and 99th percentile values. The largest changes during March 2023 are indicated by the dashed lines.
3.2 Synoptic mechanisms: part 1 – the 2023 SSW event and its stratosphere–troposphere signatures
On 16 February, an SSW occurred that appears to have strongly contributed to the synoptic environment in early March that led to the cross-Arctic melt events. Figure 4 shows the winter-long evolution of the height anomalies with respect to the SSW event. In mid-January 2023, positive tropospheric heights in the 1000–100 hPa layer preceded positive height anomalies aloft that developed toward late January and early February. The positive height anomalies indicate upward troposphere to stratosphere coupling that resulted in a minor stratospheric warming event at the end of January. Over the 2 weeks that followed, a second, stronger and positive (∼ 2σ) geopotential height anomaly developed aloft within the upper stratosphere and peaked on 16 February in conjunction with the day of the shift from westerly to easterly 10 hPa winds at 60° N found in the PVI (Fig. 5a), which marked the date of SSW onset (Butler et al., 2017, updated). The PVI dipped to roughly the first percentile following SSW onset on 28 February and 1 March, characterizing this as an anomalously strong event for this time of year. The PVI reached a minimum wind speed of −18 m s−1 on 28 February, which places it as the sixth strongest reversal (out of 28 such events) of the polar vortex winds during a stratospheric warming from 1979–2023 (Lee and Butler 2019). As is the tendency with SSW events, the influence of the above-average, upper-stratospheric air pressures and temperatures (latter not shown) descended during this time, yielding increased heights across the depth of the stratosphere through late February (Fig. 4). By early March, the SSW warming signal propagated toward the surface, and large positive height anomalies extended through the depth of the tropospheric column. The largest positive height anomalies within the lower troposphere and at the surface manifested predominantly over the Greenland and Labrador Sea area (Fig. S1), as is typical following SSW events (Baldwin et al., 2021), and the timing coincided with the Bering Sea and Labrador Sea melt events.
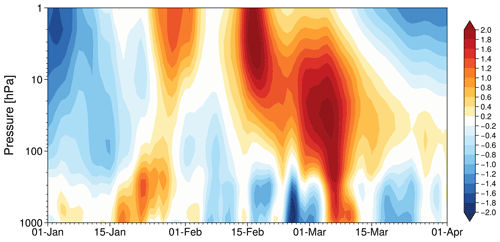
Figure 4Polar cap (60–90° N) standardized geopotential height anomalies (unitless) from the surface to the upper stratosphere during winter 2023. The standardized anomalies are calculated at each pressure level by removing the daily climatology and dividing it by the daily standard deviation. The standardized anomalies are shown relative to the day of year for the 1979–2023 period of the ERA5 reanalysis.
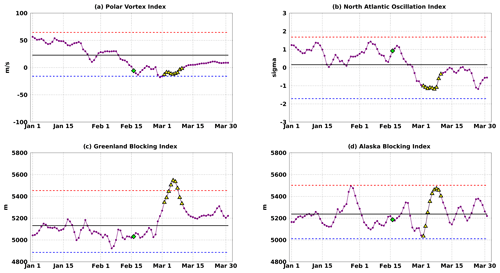
Figure 5Daily atmospheric indices for 1 January–31 March 2023 (purple lines) overlapping the multi-sectoral melt event for the (a) Polar Vortex Index (m s−1), (b) North Atlantic Oscillation Index (standardized), (c) Greenland Blocking Index (m), and (d) Alaska Blocking Index (m). Considering all days from 1 January to 31 March for the respective indices' full periods of record (see Sect. 2.1), the mean of each variable (black line), 1st percentile (dashed blue line), and 99th percentile (dashed red line) are shown in each graphic. The sudden stratospheric warming event on 16 February 2023 is labeled with a green diamond, and to draw attention to the dates around the Labrador Sea and Bering Sea melt events, the period from 2–10 March 2023 is identified by yellow triangles.
In the 2 weeks that led up to this strong SSW event, the large-scale mid-tropospheric circulation was characterized by a positive NAO fluctuation between 0 and 1.5σ, indicative of stronger than normal westerly winds across the midlatitudes to high latitudes (Fig. 5b). Negative height anomalies (lower than normal pressure) across most of the polar cap troposphere between 1–15 February (Fig. 4) support this assertion. After the SSW event on 16 February, the NAO slightly increased for 2 d and then plummeted, reversed sign, and became strongly negative (∼ −1σ) from 2–8 March around the melt events (Fig. 5b). Zooming in on the study regions of interest, strong, lagged ridging responses are noted in the respective mid-tropospheric height fields. The z500 pattern atop the Labrador Sea area of ice loss described by the GBI is > 100 m above average from 1–12 March, including record-high day-of-year departures (since 1948) from 4–7 March when the GBI values exceeded the 99th percentile (Fig. 5c). This period also corresponded with the strongest downward coupling of the SSW event to surface conditions (Fig. 4). While comparatively not as extreme as those of the GBI, ABI values are also considerably higher than average during most of the same period (4–12 March), punctuated by > 100 m anomalies from 5–11 March (Fig. 5d). These higher-than-average ABI values appear related to a persistent high-pressure system over the broader North Pacific region – a signature of the La Niña extratropical teleconnection – that moved into and out of the Alaskan region on synoptic timescales during the January to March period. As a possible precursor to the SSW event and subsequent pressure increase through much of the atmospheric column, initially there were ABI peaks with values > 150 m above normal from 27–30 January capped by the 28 January ABI value (5496.83 m), falling just shy of the 99th percentile (5501.82 m). The Alaska ridge (not shown) associated with these elevated ABI values appears well-timed with upward coupling of the troposphere to the stratosphere (Fig. 4). We revisit this discussion in Sect. 4.
The evolution of the day-to-day z500 spatial pattern in March provides perspective to the values of the large-scale circulation and regional blocking indices overlapping the melt events. The height pattern over Greenland, Baffin Bay, and Labrador Sea is above normal and successively strengthens during 2–4 March (Fig. 6a–c) before the peak in the short-term Labrador Sea melt observed on 5 March when western Greenland and Baffin Bay are engulfed in > 99th percentile height anomalies (Fig. 6d). Meanwhile, below-normal mid-tropospheric pressure over Alaska and poleward of the central Bering Sea from 2–4 March gave way to higher-than-average pressure by 5 March and preceded the 6 March peak in the Bering Sea ice loss (Fig. 6e). A large-scale dipole structure is evident from 6–10 March, as the North American (Eurasian) high latitudes spanning the International Date Line (i.e., 180° W) to ∼ 30° W (30–180° W) exhibited higher-than-normal (lower-than-normal) heights with extreme departures around Greenland (Fig. 6e–i) that are reflected in the magnitude of the daily GBI anomalies (Fig. 5c). Mid-tropospheric ridging over high-latitude North America with larger anomalies over Greenland than Alaska represents a common regional weather regime (Lee et al., 2023); however, the z500 anomalies observed during the latter portion of our case study are relatively higher in magnitude. In terms of setup, over the 9 d period, the blocking pattern developed initially over the Iceland region before retrograding westwards over Greenland towards the Labrador Sea and Baffin Bay. Such retrograde movements have been noted to occur in other cases of blocking development over the Greenland region (Hanna et al., 2018). While the z500 pattern orientation and development are not uncommon, the strength of the anticyclonic anomalies is notable in this case.
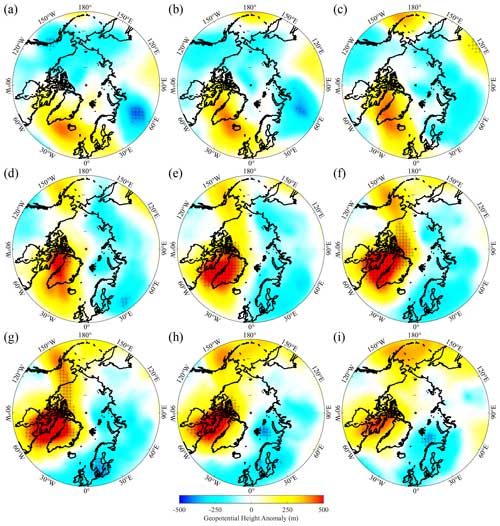
Figure 6The 500 hPa geopotential height (z500) anomaly (m) from ERA5 at 00:00 GMT on (a) 2 March, (b) 3 March, (c) 4 March, (d) 5 March, (e) 6 March, (f) 7 March, (g) 8 March, (h) 9 March, and (i) 10 March 2023. The anomalies are presented with respect to the period 16 February–15 March 1979–2023. Grid points where the anomalies are less than the 1st percentile (blue hues) or greater than the 99th percentile (red hues) based on the above period are indicated by the “+”.
3.3 Synoptic mechanisms: part 2 – thermodynamic effects
In the following, we examine the thermodynamic environment overlapping the aforementioned atmospheric circulation anomalies. Figure 7 shows the daily pan-Arctic T2m anomaly field (shading) around the melt events; the 0 °C isotherm (blue contour) is overlaid for reference. During 2–4 March, air temperature anomalies over south-central Greenland, Davis Strait, and northern Labrador waters overlapping the ice edge were above normal (Fig. 7a–c). In particular, from 2 to 3 March, the 0 °C isotherm abruptly migrated westward and encompassed much of the Labrador Sea including the ice edge (refer to Fig. 1a). During this time 99th percentile warm extremes were found across the northern Labrador Sea, the southern tip of Greenland, and the southwestern Irminger Sea. Warm extremes persisted in the vicinity of the ice edge on 5 March (Fig. 7d), and then the large temperature anomalies (∼ 15–16 °C) expanded to cover much of the area from the Labrador Sea through Baffin Bay on 6–7 March (Fig. 7e, f). While the warm air mass appeared to propagate westward into northeastern Canada in the days that followed, T2m anomalies remained above average in these areas until colder air moved into the region on 10 March (Fig. 7g–i).
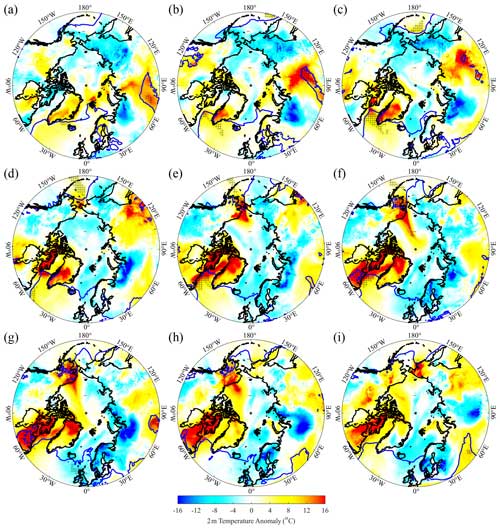
Figure 7The 2 m air temperature anomaly (°C) from ERA5 at 00:00 GMT on (a) 2 March, (b) 3 March, (c) 4 March, (d) 5 March, (e) 6 March, (f) 7 March, (g) 8 March, (h) 9 March, and (i) 10 March 2023. The anomalies are shown with respect to the period 16 February–15 March 1979–2023. Grid points where the anomalies are less than the 1st percentile or greater than the 99th percentile based on the above period are indicated by the “+”. The blue curves represent the 0 °C isotherm.
A warm air incursion into the Bering Sea was also apparent during the same time. From 3 to 4 March, the 0 °C isotherm migrated several degrees northward as anomalously warm air penetrated into the Bering region (Fig. 7b, c). The general southwest to northeast trajectory of the mild airstream was apparent in the days that followed. The 0 °C isotherm entered the northeastern Bering Sea and southwestern Alaska on 5 March as anomalous melt along the ice edge continued, while temperatures over the western Bering Sea and northeastern Siberia remained below normal (Fig. 7d, e). Air temperatures remained above average to extreme in western and northern Alaska during the days that followed as the air mass propagated into the high Arctic over 6–10 March (Fig. 7f–i).
Despite the 31 km resolution of the ERA5 fields, the array of synoptic maps makes it challenging to ascertain the extent of the temperature extremes, especially along coastal areas and along the approximate ice edges. The daily T2m fields are therefore supplemented by weather station time series to provide additional perspective on the air temperatures. During the Labrador Sea ice loss event, above-average air temperatures at Nuuk, Greenland, to the southeast of the ice edge were recorded with > 0 °C daily mean temperatures from 2–7 March with warm air temperature extremes observed on 3–4 March (Fig. 8a).
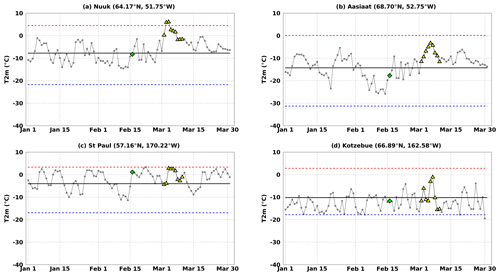
Figure 8Weather station 2 m air temperature (°C) 1 January–31 March 2023 daily time series (gray lines) overlapping the multi-sectoral melt event for (a) Nuuk, (b) Aasiaat, (c) St. Paul, and (d) Kotzebue. Considering all days from 1 January to 31 March for the respective stations' full periods of record (see Sect. 2.1), the mean T2m (black line), 1st percentile (dashed blue line), and 99th percentile (dashed red line) are shown in each graphic. The sudden stratospheric warming event on 16 February 2023 is labeled by a green diamond, and to draw attention to the dates around the Labrador Sea and Bering Sea melt events, the period from 2–10 March 2023 is identified by yellow triangles. For reference the weather stations are overlaid in Fig. 1.
Likewise, above-freezing, extreme air temperatures were observed in the GrIS lower ablation zone in the Qassimiut region (QAS_L) and on a glacier tangential to the Nuuk DMI station (NUK_K) during this period (Fig. S2a, b). Meanwhile, in Aasiaat, Greenland, roughly ∼ 500 km north of Nuuk, the air temperatures were above normal during this time but were not above freezing or considered extreme by the criteria used here (Fig. 8b). Over the Bering Sea, St. Paul Island observed a stint of above-freezing temperatures that ranked near the 99th percentile for 4–7 March (Fig. 8c), while Kotzebue on Alaska's northwest coast saw near-normal to slightly above normal air temperatures during the Bering ice loss period, but the airstream exceeded neither 0 °C nor the 99th percentile criteria (Fig. 8d).
Further analysis into the thermodynamic environment revealed that the anomalously warm airstreams advected over both the Labrador and Bering regions possessed extreme water vapor content around the time of their respective melt peaks (shown in time series in Figs. 9a–b and 10a–b and in maps presented in Fig. S3). During these peaks, both seas experienced anomalous net and downwelling radiation in excess of the 95th percentile (Figs. 9c–d and 10c–d) with that energy likely driving ice loss through melt. To further investigate the hydrometeorological nature of these airstreams, the Guan and Waliser (2019) atmospheric river (AR) detection algorithm was run separately for the Labrador Sea and Bering Sea domains shown in Fig. 1. Warm, moist conditions that overlapped these melt events were associated with AR activity (Fig. 11). An AR resided over the Labrador Sea for > 40 % of the day on 3–4 March, and its residence time was extreme on 5 March (∼ 60 % of the day; Fig. 11a). Moisture within this AR (Fig. 11c) and total precipitation from the AR (Fig. S4) were both above average but not extreme. Meanwhile, daily AR residence time within the Bering Sea exceeded 40 % on 4–7 March, with an AR duration extreme (> 60 % of the day) on 5 March preceding the short-term melt peak on 6 March when IVT was also extreme (Fig. 11b, d). Extreme ERA5 daily precipitation associated with the AR intrusion fell in the Bering region from 5–8 March (Fig. S4). These persistent and anomalously warm and wet air masses contributed to these tandem melt extremes. Further analysis is ongoing to examine the full surface energy budget, including the role of rainfall, toward shaping the observed melt.
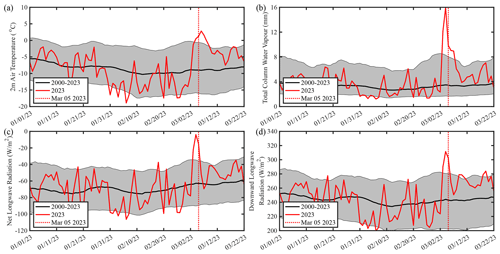
Figure 9Time series (red curves) of ERA5: (a) 2 m air temperature (°C), (b) total column water vapor (mm), (c) net longwave radiation (W m−2), and (d) downward longwave radiation (W m−2) averaged over the Labrador Sea region, indicated in Fig. 1b, for the period 1 January to 26 March 2023. The black line represents the climatological mean value for the period 2000–2023 with shading incorporating values between the 5th and 95th percentiles. The ending date for the 4 d window with the largest change in sea ice concentration is shown by the dotted red line.
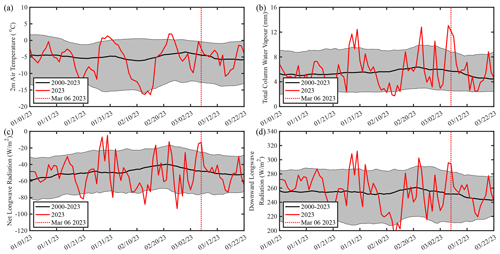
Figure 10Time series (red curves) of ERA5: (a) 2 m air temperature (°C), (b) total column water vapor (mm), (c) net longwave radiation (W m−2), and (d) downward longwave radiation (W m−2) averaged over the Bering Sea region, indicated in Fig. 1e, for the period 1 January to 26 March 2023. The black line represents the climatological mean value for the period 2000–2023 with shading incorporating values between the 5th and 95th percentiles. The ending date for the 4 d window with the largest change in sea ice concentration is shown by the dotted red line.
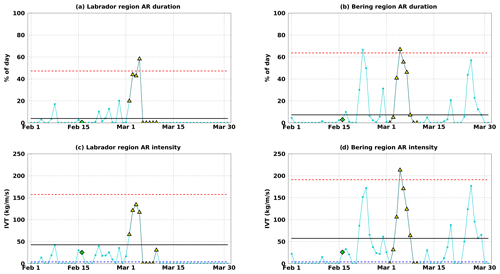
Figure 11March atmospheric river (AR) duration (% of day AR in domain) and intensity (kg m−1 s−1) for the Labrador region (a, c) and Bering region (b, d), respectively (teal lines). The AR data are calculated over the same domains as shown in Fig. 1. The thick black line in each panel represents the 1979–2023 mean. Considering all days from 1 February to 31 March for the respective regions for the 1979 to 2023 period, the 99th percentile (dashed red lines) are shown in all panels, while the 1st percentile represents AR non-occurrence and therefore is not marked in these plots. The sudden stratospheric warming event on 16 February 2023 is labeled by a green diamond, and to draw attention to the dates around the Labrador Sea and Bering Sea melt events, the period from 2–10 March 2023 is identified by yellow triangles.
Tandem, unusually timed sea ice melt extremes in the Bering Sea and Labrador Sea occurred in early March 2023. The retreat of the ice edge in both marginal seas was similarly driven by the confluence of anomalous meteorological phenomena. Mid-tropospheric heights increased, and intense ridging patterns developed over the Labrador Sea and Bering Sea during the time in which the respective regional ice loss events occurred. A longitude–pressure analysis (Fig. S1) revealed that an SSW in February 2023 was strongly linked to the mid-tropospheric height increases over the Labrador Sea region in early March, while the height increases over the Bering Sea were isolated to the troposphere and were likely linked to a fortuitous shift of the large-scale La Niña-related ridging over the North Pacific into the Alaskan region. Below we discuss the ice loss events and focus on the attendant atmospheric mechanisms that provided thermodynamic support for their occurrence.
4.1 Perspectives on ice losses during the maximum and supporting atmospheric processes
Amidst the decline of winter season ice coverage and thickness in the warming Arctic, the latitude of the ice edge can vary on daily timescales due to wind-driven and melt-driven processes. However, the probability curves shown in Fig. 3 suggest that such short-term March 2023 sea ice losses in either the Bering or Labrador regions, taken independently, qualify as extreme events. Both the magnitude of losses and the unusual timing of their anomalous occurrence aligned with the climatological Arctic sea ice maximum may further qualify these melt extremes collectively as a rare synoptic ice loss event. We do not assess ice edge changes in other marginal seas during the March historical record to establish whether other areas participated in this event.
The anatomy of the melt extremes can be described by a confluence of anomalous atmospheric phenomena that simultaneously occurred over the Bering Sea and Labrador Sea. The melt period was preceded by an SSW event that led to a shift in the large-scale mid-tropospheric circulation regime over the polar cap as evidenced by the rapid transition over 2 weeks from strong positive to negative NAO conditions and lower to higher mid-tropospheric air pressure over the high Arctic, in particular over Greenland. The noted shift to a negative NAO followed by the development of a Greenland block that supported southerly winds and warm advection across the Labrador Sea following an SSW has been documented in previous studies (e.g., Charlton-Perez et al., 2018; Domeisen, 2019; Domeisen and Butler, 2020). While the setup of the Greenland block is not unique to this event, its magnitude for the time of year is remarkable as shown by the extremes highlighted in the GBI time series (Fig. 5c) and z500 spatial plots (Fig. 6).
SSW events on average tend to elicit a weaker atmospheric dynamical response over the Bering region than the Labrador Sea. Smith et al. (2018) analyzed data from the Whole Atmosphere Community Climate Model of NCAR's Community Earth System Model and found that over the 40 d following SSW onset there were minimal sea level pressure (SLP) changes over the Bering Sea and greater Alaska, but there were large, positive SLP anomalies located northward and eastward of these areas including around Greenland. Across SSW winters (JFM), the authors also found similar SLP signatures over Greenland but negative SLP anomalies and northerly winds over Alaska and the Bering Sea. However, if we consider only SSW events that occur during La Niña winters, the large-scale circulation response following these events (Fig. S5b) looks very similar to the patterns seen in 2023 (Fig. S5a), with ridging over both Greenland and the Aleutians. The interpretation is that the SSW drives most of the tropospheric height changes over Greenland and the North Atlantic, while La Niña background conditions favor North Pacific ridging into the Gulf of Alaska. In addition to the SSW event and La Niña phase, factors such as internal variability of the climate system and air–sea interactions over the North Pacific Ocean may have played a role in inducing the anomalously strong mid-tropospheric ridge extending from Greenland to Alaska.
In both the Labrador Sea and Bering Sea, anomalous atmospheric circulation characteristics, namely the stationary, extreme blocking anticyclones, supported southerly advection of above normal to extremely warm and moist air that led to these thermodynamically driven melt events (e.g., Figs. 7, 9–11, and S2). Additional investigation of the airstreams revealed that anomalous ARs were present in both regions during this time and played a critical role in the simultaneous melt extremes. The extreme duration of the AR over the peak Labrador Sea melt and extreme duration and intensity immediately preceding the Bering Sea melt, both on 5 March, likely enhanced downwelling longwave energy transfer into the ice, causing its short-term, yet remarkable, decline. Past studies have likewise identified downward longwave radiative flux during AR passage as a key process that tends to decrease ice mass balance during summer (Mattingly et al., 2018; Wille et al., 2019; Francis et al., 2020) and slows wintertime ice growth (Hegyi and Taylor, 2018; Zhang et al., 2023). Here, we document the role of anomalous large-scale meteorological characteristics, including tandem AR events, that drove unprecedented and concurrent sea ice melt at a time of year characterized by maximum ice extent.
4.2 Additional considerations emanating from this case study
This rare ice loss event concurrently encompassing the Bering Sea and Labrador Sea was shaped by a confluence of synoptic extremes that aligned in time to induce thermodynamic melt of the sea ice edge. We look at this ice loss from a thermodynamic perspective, though we concede that, in addition to supporting melt, southerly winds could have induced some sea ice compaction in the marginal ice zones through convergence. If this event were examined through a sea ice budget lens, we acknowledge that producing estimates of ice dynamical processes, such as wind-driven convergence and divergence, would be important to gain a more complete understanding of the evolution of mechanisms responsible for these regional ice losses. Follow-on work will take a broader view of thermodynamic processes, which may provide additional insight into ice loss mechanisms elucidated in this case study. For example, resolution of the sea ice types and surface energy balance before, during, and after the melt event may provide perspectives on ice–air interactions that shaped it.
Related to the surface energy balance processes, further analyses will delve deeper into the roles of latent heat and humidity fluxes in shaping the ice melt event. Rainfall (< 1 mm) was observed during 2–3 March in the rain gauges at the Nuuk and Aasiaat DMI weather stations, and, if it were not for sporadic station outages from 2–10 March, rain on other days during this period may have been documented (Caroline Drost Jensen, personal communication, 2024). Nearby, separate near-coastal weather stations maintained by Asiaq Greenland Survey also documented small amounts (< 1 mm) of rainfall at Nuuk and Kobbefjord (Anders Ginnerup, personal communication, 2024). Meanwhile, terrestrial weather stations at Kotzebue and Nome, Alaska, ∼ 300 km to the southwest, saw > 25 mm of cumulative rainfall during 4–6 March, which are 3 d total precipitation records for both weather stations in March (Rick Thoman personal communication, 2023). Spatial patterns of ERA5 total precipitation over this period are consistent with these observations (Fig. S4). In addition to rain measurements near the coast, rain on cold snow was also detected in weather station observations found in the southwestern GrIS accumulation zone, which is rare for the time of year (Jason Box, personal communication, 2024). Further diagnostic evaluation is needed to determine the extent, frequency, amount, and impact of rainfall on the cold snow cover on the GrIS and sea ice during this period. Thus, follow-on studies of the surface energy exchange processes and precipitation characteristics may help to broaden our perspective of this complex extreme event.
It is clear from recent years that there are occurrences of a variety of extreme Arctic events that vary in location, season, and type that meet or exceed previous records (Walsh et al., 2020). Philosophically, it is difficult to project let alone interpret the future frequency of these events without detailed historical analogues. It has been proposed that the recent increase of Arctic extremes is due to an overlap of steadily increasing Arctic warming that is constructively superimposed on the natural range of atmospheric and oceanic dynamics, e.g., jet stream meanders, atmospheric blocking, storms, and upper-ocean heat content (Overland, 2022), which could themselves, at least in some cases, be influenced by anthropogenic global heating. This is certainly the case with the concurrent examples from the Labrador Sea and Bering Sea in March 2023. Whether this extreme event foreshadows a more frequent occurrence of similar events in the future is an open but intriguing question that merits careful future investigation.
Alaska weather station data are found under the Daily Data Listing at https://xmacis.rcc-acis.org (xmACIS2, 2023). Greenland coastal weather station records were obtained from Caroline Drost Jensen (DMI); data are available at https://www.dmi.dk (Drost Jensen, 2024). PROMICE observations are from https://dataverse.geus.dk/dataset.xhtml?persistentId=doi:10.22008/FK2/IW73UU (How et al., 2023). The NAO index was downloaded from https://www.cpc.ncep.noaa.gov/products/precip/CWlink/pna/nao.shtml (NOAA Climate Prediction Center, 2023). ERA5 reanalysis fields were obtained from the Copernicus Climate Data Store at https://doi.org/10.24381/cds.adbb2d47 (Hersbach et al., 2023). Sea ice data were downloaded from NSIDC at https://nsidc.org/data/g02202/versions/4 (Meier, 2021). The SSW compendium can be found at https://csl.noaa.gov/groups/csl8/sswcompendium/majorevents.html (Butler et al., 2017).
The supplement related to this article is available online at: https://doi.org/10.5194/wcd-5-1473-2024-supplement.
TJB and KM conceived the study with input from QD, AHB, JEO, RLT, IB, ZL, and EH as the study developed. RLT provided assistance with data acquisition. All authors provided feedback on draft iterations of the paper.
The contact author has declared that none of the authors has any competing interests.
Publisher’s note: Copernicus Publications remains neutral with regard to jurisdictional claims made in the text, published maps, institutional affiliations, or any other geographical representation in this paper. While Copernicus Publications makes every effort to include appropriate place names, the final responsibility lies with the authors.
The authors wish to thank Caroline Drost Jensen and Anders Ginnerup for assistance obtaining and interpreting the Greenland weather station records. We also thank numerous scientists for discussions on topics related to high-latitude precipitation and GrIS meteorology, including Jason Box, Jakob Abermann, Matthew Sturm, and Melinda Webster.
Thomas J. Ballinger and Qinghua Ding were funded by NSF Arctic System Science awards 2246600 and 2246601, respectively. James E. Overland is supported by NOAA's GOMO Arctic Research Program PMEL contribution no. 5703. Kent Moore was funded by the Natural Sciences and Engineering Research Council of Canada. Edward Hanna was supported by NERC NE/W005875/1.
This paper was edited by Irina Rudeva and reviewed by three anonymous referees.
AghaKouchak, A., Chiang, F., Huning, L. S., Love, C. A., Mallakpour, I., Mazdiyasni, O., Moftakhari, H., Papalexiou, S. M., Ragno, E., and Sadegh, M.: Climate Extremes and Compound Hazards in a Warming World, Ann. Rev. Earth Pl. Sc., 48, 519–548, https://doi.org/10.1146/annurev-earth-071719-055228, 2020.
Baldwin, M. P., Ayarzagüena, B. Birner, T., Butchart, N., Butler, A. H., Charlton-Perez, A. J., Domeisen, D. I. V., Garfinkel, C. I., Garny, H., Gerber, E. P., Hegglin, M. I., Langematz, U., and Pedatella, N. M.: Sudden Stratospheric Warmings, Rev. Geophys., 59, e2020RG000708, https://doi.org/10.1029/2020RG000708, 2021.
Bailey, H., Hubbard, A., Klein, E. S., Mustonen, K.-R., Akers, P. D., Marttila, H., and Welker, J. M.: Arctic sea-ice loss fuels extreme European snowfall, Nat. Geosci., 14, 283–288, https://doi.org/10.1038/s41561-021-00719-y, 2021.
Ballinger, T. J., Hanna, E., Hall, R. J., Cropper, T. E., Miller, J., Ribergaard, M. H., Overland, J. E., and Høyer, J. L.: Anomalous blocking over Greenland preceded the 2013 extreme early melt of local sea ice, Ann. Glaciol., 59, 181–190, https://https://doi.org/10.1017/aog.2017.30, 2018.
Ballinger, T. J., Walsh, J. E., Alexeev, V. A., Bieniek, P. A., and McLeod, J. T.: The Alaska Blocking Index, version 2: Analysis and covariability with statewide and large-scale climate from 1948–2020, Int. J. Climatol., 42, 9767–9787, https://https://doi.org/10.1002/joc.7864, 2022.
Ballinger, T. J., Overland, J. E., Wang, M., Bhatt, U. S., Brettschneider, B., Hanna, E., Hanssen-Bauer, I., Kim, S.-J., Thoman, R. L., and Walsh, J. E.: Surface air temperature [in “State of the Climate in 2022”], B. Am. Meteorol. Soc., 104, S279–S281, https://doi.org/10.1175/BAMS-D-23-0079.1, 2023.
Barnston, A. G. and Livezey, R. E.: Classification, seasonality, and persistence of low-frequency atmospheric circulation patterns, Mon. Weather Rev., 115, 1083–1126, https://doi.org/10.1175/1520-0493(1987)115<1083:CSAPOL>2.0.CO;2, 1987.
Blanchard-Wrigglesworth, E., Webster, M., Boisvert, L., Parker, C., and Horvat, C.: Record Arctic cyclone of January 2022: Characteristics, impacts, and predictability, J. Geophys. Res.-Atmos., 127, e2022JD037161, https://doi.org/10.1029/2022JD037161, 2022.
Boisvert, L., Parker, C., and Valkonen, E.: A warmer and wetter Arctic: Insights from a 20-years AIRS record, J. Geophys. Res.-Atmos., 128, e2023JD038793, https://doi.org/10.1029/2023JD038793, 2023.
Butler, A. H., Sjoberg, J. P., Seidel, D. J., and Rosenlof, K. H.: A sudden stratospheric warming compendium, Earth Syst. Sci. Data, 9, 63–76, https://doi.org/10.5194/essd-9-63-2017, 2017 (data available at: https://csl.noaa.gov/groups/csl8/sswcompendium/majorevents.html, last access: 31 October 2023).
Cavalieri, D., Gloersen, P., and Campbell, W. J.: Determination of sea ice parameters with the NIMBUS-7 SMMR, J. Geophys. Res., 89, 5355–5369, https://doi.org/10.1029/JD089iD04p05355, 1984.
Charlton, A. J. and Polvani, L. M.: A new look at Stratospheric Sudden Warmings: Part I: Climatology and modeling benchmarks, J. Climate, 20, 449–469, https://doi.org/10.1175/JCLI3996.1, 2007.
Charlton-Perez, A. J., Ferranti, L., and Lee, R. W.: The influence of the stratospheric state on North Atlantic weather regimes, Q. J. Roy. Meteor. Soc., 144, 1140–1151, https://doi.org/10.1002/qj.3280, 2018.
Collow, A. B. M., Shields, C. A., Guan, B., Kim, S., Lora, J. M., McClenny, E. E., Nardi, K., Payne, A., Reid, K., Shearer, E. J., Tomé, R., Wille, J. D., Ramos, A. M., Gorodetskaya, I. V., Leung, L. R., O'Brien, T. A., Ralph, F. M., Rutz, J., Ullrich, P. A., and Wehner, M.: An overview of ARTMIP's Tier 2 Reanalysis Intercomparison: Uncertainty in the detection of atmospheric rivers and their associated precipitation, J. Geophys. Res.-Atmos., 127, e2021JD036155, https://doi.org/10.1029/2021JD036155, 2022.
Comiso, J. C.: Characteristics of Arctic winter sea ice from satellite multispectral microwave observations, J. Geophys. Res.-Oceans, 91, 975–994, https://doi.org/10.1029/JC091iC01p00975, 1986.
Domeisen, D. I. V.: Estimating the frequency of sudden stratospheric warming events from surface observations of the North Atlantic Oscillation, J. Geophys. Res.-Atmos., 124, 3180–3194, https://doi.org/10.1029/2018JD030077, 2019.
Domeisen, D. I. V. and Butler, A. H.: Stratosphere drivers of extreme events at the Earth's surface, Comm. Earth Environ., 1, 59, https://doi.org/10.1038/s43247-020-00060-z, 2020.
Drost Jensen, C.: Weather observations from Greenland 1958–2023, https://www.dmi.dk/publikationer, DMI Report 24-08, last access: 15 March 2024.
Fausto, R. S., van As, D., Mankoff, K. D., Vandecrux, B., Citterio, M., Ahlstrøm, A. P., Andersen, S. B., Colgan, W., Karlsson, N. B., Kjeldsen, K. K., Korsgaard, N. J., Larsen, S. H., Nielsen, S., Pedersen, A. Ø., Shields, C. L., Solgaard, A. M., and Box, J. E.: Programme for Monitoring of the Greenland Ice Sheet (PROMICE) automatic weather station data, Earth Syst. Sci. Data, 13, 3819–3845, https://doi.org/10.5194/essd-13-3819-2021, 2021.
Francis, J. A. and Vavrus, S. J.: Evidence for a wavier jet stream in response to rapid Arctic warming, Environ. Res. Lett., 10, 014005, https://doi.org/10.1088/1748-9326/10/1/014005, 2015.
Francis, D., Mattingly, K. S., Temmi, M., Massom, R., and Heil, P.: On the crucial role of atmospheric rivers in the two major Weddell Polynya events in 1973 and 2017 in Antarctica, Sci. Adv., 6, eabc2695, https://doi.org/10.1126/sciadv.abc2695, 2020.
Graham, R. M., Hudson, S. R., and Matarilli, M.: Improved performance of ERA5 in Arctic gateway relative to four global atmospheric reanalyses, Geophys. Res. Lett., 46, 6138–6147, https://doi.org/10.1029/2019GL082781, 2019.
Guan, B. and Waliser, D. E.: Tracking atmospheric rivers globally: spatial distributions and temporal evolution of life cycle characteristics, J. Geophys. Res., 124, 12523–12552, https://doi.org/10.1029/2019JD031205, 2019.
Hanna, E., Jones, J. M., Cappelen, J., Mernild, S. H., Wood, L., Steffen, K., and Huybrechts, P.: The influence of North Atlantic atmospheric and oceanic forcing effects on 1900–2010 Greenland summer climate and ice melt/runoff, Int. J. Climatol., 33, 862–880, https://https://doi.org/10.1002/joc.3475, 2013.
Hanna, E., Cropper, T. E., Jones, P. D., Scaife, A. A., and Allan, R.: Recent seasonal asymmetric changes in the NAO (a marked summer decline and increased winter variability) and associated changes in the AO and Greenland Blocking Index, Int. J. Climatol., 35, 2540–2554, https://doi.org/10.1002/joc.4157, 2015.
Hanna, E., Hall, R. J., Cropper, T. E., Ballinger, T. J., Wake, L., Mote, T., and Cappelen, J.: Greenland blocking index daily series 1851–2015: Analysis of changes in extremes and links with North Atlantic and UK climate variability and change, Int. J. Climatol., 38, 3546–3564, https://doi.org/10.1002/joc.5516, 2018.
Hegyi, B. M. and Taylor, P. C.: The unprecedented 2016–2017 Arctic sea ice growth season: The critical role of atmospheric rivers and longwave fluxes, Geophys. Res. Lett., 45, 5204–5212, https://doi.org/10.1029/2017GL076717, 2018.
Hersbach, H., Bell, B., Berrisford, P., Hirahara, S., Horányi, A., Muñoz-Sabater, J., Nicolas, J., Peubey, C., Radum, R., Schepers, D., Simmons, A., Soci, C., Abdalla, S., Abellan, X., Balsamo, G., Bechtold, P., Biavati, G., Bidlot, J., Bonavita, M., De Chiara, G., Dahlgren, P., Dee, D., Diamantakis, M., Dragani, R., Flemming, J., Forbes, R., Fuentes, M., Geer, A., Haimberger, L., Healy, S., Hogan, R.J., Hólm, E., Janisková, M., Keeley, S., Laloyaux, P., Lopez, P., Lupu, C., Radnoti, G., de Rosnay, P., Rozum, I., Vamborg, F., Villaume, S., and Thépaut, J.-N.: The ERA5 Global Reanalysis, Q. J. Roy. Meteor. Soc., 146, 1999–2049, https://doi.org/10.1002/qj.3803, 2020.
Hersbach, H., Bell, B., Berrisford, P., Biavati, G., Horányi, A., Muñoz Sabater, J., Nicolas, J., Peubey, C., Radu, R., Rozum, I., Schepers,D., Simmons, A., Soci, C., Dee, D., and Thépaut, J-N.: ERA5 hourly data on single levels from 1940 to present, Copernicus Climate Change Service Climate Data Store, https://doi.org/10.24381/cds.adbb2d47, 2023.
How, P., Abermann, J., Ahlstrøm, A. P., Andersen, S. B., Box, J. E., Citterio, M., Colgan, W. T., Fausto, R. S., Karlsson, N. B., Jakobsen, J., Langley, K., Larsen, S. H., Mankoff, K. D., Pedersen, A. Ø., Rutishauser, A., Shield, C. L., Solgaard, A. M., van As, D., Vandecrux, B., and Wright, P. J.: PROMICE and GC-Net automated weather station data in Greenland, GEUS Dataverse, V11, https://doi.org/10.22008/FK2/IW73UU, 2022.
Kirbus, B., Tiedeck, S., Camplani, A., Chylik, J., Crewell, S., Dahlke, S., Ebell, K., Gorodetskaya, I., Griesche, H., Handorf, D., Höschel, I., Lauer, M., Neggers, R., Rückert, J., Shupe, M. D., Spreen, G., Walbröl, A., Wendisch, M., and Rinke, A.: Surface impacts and associated mechanisms of a moisture intrusion into the Arctic observed in mid-April 2020 during MOSAiC, Front. Earth Sci., 11, 1147848, https://doi.org/10.3389/feart.2023.1147848, 2023.
Kornhuber, K., Coumou, D., Vogel, E., Lesk, C., Donges, J. F., Lehmann, J., and Horton, R. M.: Amplified Rossby waves enhance risk of concurrent heatwaves in major breadbasket regions, Nat. Clim. Change, 10, 48–53, https://doi.org/10.1038/s41558-019-0637-z, 2020.
Lee, S. H. and Butler, A. H.: The 2018–2019 Arctic stratospheric polar vortex, Weather, 75, 52–57, https://doi.org/10.1002/wea.3643, 2019.
Lee, S. H., Tippett, M. K., and Polvani, L. M.: A new year-round weather regime classification for North America, J. Climate, 36, 7091–7108, https://doi.org/10.1175/JCLI-D-23-0214.1, 2023.
Mattingly, K. S., Mote, T. L., and Fettweis, X.: Atmospheric river impacts on the Greenland Ice Sheet surface mass balance, J. Geophys. Res.-Atmos., 123, 8538–8560, https://doi.org/10.1029/2018JD028714, 2018.
Meier, W. N., Fetterer, F., Windnagel, A. K., and Stewart, J. S.: NOAA/NSIDC Climate Data Record of Passive Microwave Sea Ice Concentration, (G02202, Version 4), Boulder, Colorado USA, National Snow and Ice Data Center, https://doi.org/10.7265/efmz-2t65, 2021.
Meier, W. N., Stewart, J. S., Windnagel, A., and Fetterer, F. M.: Comparison of hemispheric and regional sea ice extent and area trends from NOAA and NASA passive microwave-derived climate records, Remote Sens., 14, 619, https://doi.org/10.3390/rs14030619, 2022.
Meier, W. N., Petty, A., Hendricks, S., Kaleschke, L., Divine, D., Farrell, S., Gerland, S., Perovich, D., Ricker, R., Tian-Kunze, X., and Webster, M.: Sea Ice. NOAA Arctic Report Card 2023, edited by: Thoman, R. L., Moon, T. A., and Druckenmiller, M. L., https://doi.org/10.25923/f5t4-b865, 2023.
Moore, G. W. K.: The December 2015 North Pole warming event and the increasing occurrence of such events, Sci. Rep., 6, 39084, https://doi.org/10.1038/srep39084, 2016.
Moore, G. W. K., Schweiger, A., Zhang, J., and Steele, M.: What caused the remarkable February 2018 north Greenland polynya?, Geophys. Res. Lett., 45, 1342–13350, https://doi.org/10.1029/2018GL080902, 2018.
Nygård, T., Naakka, T., and Vihma, T.: Horizontal moisture transport dominates the regional moistening patterns in the Arctic, J. Climate, 33, 6793–6807, https://doi.org/10.1175/JCLI-D-19-0891.1, 2020.
NOAA Climate Prediction Center: Daily NAO index since January 1950, https://www.cpc.ncep.noaa.gov/products/precip/CWlink/pna/nao.shtml, last access: 31 October 2023.
Overland, J. E.: Arctic climate extremes, Atmosphere, 13, 1670, https://doi.org/10.3390/atmos13101670, 2022.
Overland, J. E., Ballinger, T. J., Cohen, J., Francis, J. A., Hanna, E., Jaiser, R., Kim, B.-K., Kim, S.-J., Ukita, J., Vihma, T., Wang, M., and Zhang, X.: How do intermittency and simultaneous processes obfuscate the Arctic influence on midlatitude winter extreme weather events?, Environ. Res. Lett., 16, 043002, https://doi.org/10.1088/1748-9326/abdb5d, 2021.
Papritz, L., Hauswirth, D., and Hartmuth, K.: Moisture origin, transport pathways, and driving processes of intense wintertime moisture transport into the Arctic, Weather Clim. Dynam., 3, 1–20, https://doi.org/10.5194/wcd-3-1-2022, 2022.
Serreze, M. C. and Barry, R. G.: Processes and impacts of Arctic amplification: A research synthesis, Global Planet. Change, 77, 85–96, 2011.
Smith, K. L., Polvani, L. M., and Tremblay, L. B.: The impact of stratospheric circulation extremes on minimum Arctic sea ice extent, J. Climate, 31, 7169–7183, https://doi.org/10.1175/JCLI-D-17-0495.1, 2018.
Stroeve, J. and Notz, D.: Changing state of Arctic sea ice across all seasons, Environ. Res. Lett., 13, 103001, https://doi.org/10.1088/1748-9326/aade56, 2018.
Tachibana, Y., Komatsu, K. K., Alexeev, V. A., and Ando, Y.: Warm hole in Pacific Arctic sea ice cover forced mid-latitude Northern Hemisphere cooling during winter 2017-18, Sci. Rep., 9, 5567, https://doi.org/10.1038/s41598-019-41682-4, 2019.
Walsh, J. E., Ballinger, T. J., Euskirchen, E. S., Hanna, E., Mård, J., Overland, J. E., Tangen, H., and Vihma, T.: Extreme weather and climate events in northern areas: A review, Earth-Sci. Rev., 209, 103324, https://doi.org/10.1016/j.earscirev.2020.103324, 2020.
Wille, J. D., Favier, V., Dufour, A., Gorodetskaya, I. V., Turner, J., Agosta, C., and Codron, F.: West Antarctic surface melt triggered by atmospheric rivers, Nat. Geosci., 12, 911–916, https:doi.org/10.1038/s41561-019-0460-1, 2019.
xmACIS2: Daily Data Listing, https://xmacis.rcc-acis.org, last access: 9 June 2023.
Zhang, P., Wu, Y., Simpson, I. R., Smith, K. L., Zhang, X., De, B., and Callaghan, P.: A stratospheric pathway linking a colder Siberia to Barents-Kara sea ice loss, Sci. Adv., 4, eaat6025, https://doi.org/10.1126/sciadv.aat6025, 2018.
Zhang, P., Chen, G., Ting, M., Leung, L.R., Guan, B., and Li, L.: More frequent atmospheric rivers slow the seasonal recovery of Arctic sea ice, Nat. Clim. Change, 13, 266–273, https://doi.org/10.1038/s41558-023-01599-3, 2023.
Zhou, S., Yu, B., and Zhang, Y.: Global concurrent climate extremes exacerbated by anthropogenic climate change, Sci. Adv., 9, eabo1638, https://doi.org/10.1126/sciadv.abo1638, 2023.
Zscheischler, J., Westra, S., van den Hurk, B. J. J. M., Seneviratne, S. I., Ward, P. J., Pitman, A., AghaKouchak, A., Bresch, D. N., Leonard, M., Wahl, T., and Zhang, X.: Future climate risk from compound events, Nat. Clim. Change, 8, 469–477, https://doi.org/10.1038/s41558-018-0156-3, 2018.


