the Creative Commons Attribution 4.0 License.
the Creative Commons Attribution 4.0 License.
The role of the Indian Ocean Dipole in modulating the austral spring ENSO teleconnection to the Southern Hemisphere
Luciano Gustavo Andrian
Marisol Osman
Carolina Susana Vera
The combined influence of the El Niño–Southern Oscillation (ENSO) and the Indian Ocean Dipole (IOD) on the extratropical circulation in the Southern Hemisphere (SH) during austral spring is examined. Reanalyses and the large ensemble of National Centers for Environmental Prediction (NCEP) Climate Forecast System version 2 (CFSv2) model outputs were used to compute composites and linear regressions for relevant variables. The results show that a positive IOD can reinforce the El Niño-induced circulation by merging the Indian Ocean wave train with the Pacific South American (PSA) pattern over the Pacific Ocean. In addition, the results obtained with the CFSv2 model output shows that strong positive IODs can contribute to enhancing the circulation signal of the El Niño anomalies and the Indian Ocean wave train. On the other hand, negative IODs in combination with La Niña do not have that combined circulation response. While there is a moderate intensification of the circulation anomalies associated with La Niña, accompanied by some changes in the location of their main action centers, results vary considerably between linear regression, the observed composites, and model composites. Regarding the influence of the IOD activity (independent of ENSO), reanalysis-based results show that the IOD positive phase has a significant impact over the entire SH, while the negative phase is associated with weaker anomalies and less consistent atmospheric response.
- Article
(14005 KB) - Full-text XML
-
Supplement
(4852 KB) - BibTeX
- EndNote
In recent decades, significant advancements have been made in the scientific community regarding our understanding of the effects of the El Niño–Southern Oscillation (ENSO), spanning large-scale circulation to effects in various parts of the world. Nevertheless, ENSO is not the exclusive mode of oceanic variability in the tropical region; each basin displays its own independent variability that can interact with the others. One of the most common combinations with ENSO is the Indian Ocean Dipole (IOD). The dynamics, feedbacks, and effects of ENSO–IOD interactions have been extensively studied in tropical regions, particularly those adjacent to the Indian Ocean (IO) (Vinayachandran et al., 2010; Zhao et al., 2019; Wang et al., 2019). Similarly, the inquiry into whether the IOD operates independently of ENSO has been significant since the discovery of the IOD, and it remains an open question (Sun et al., 2015; Fan et al., 2016; Stuecker et al., 2017). However, the modulation of teleconnections in extratropical latitudes of the Southern Hemisphere (SH) by ENSO and the IOD has received less attention.
ENSO exerts its influence on the middle and high latitudes of the SH through an equivalent barotropic Rossby wave train, which emerges in response to the anomalous convection in the tropical Pacific and propagates from there, veering towards South America. This wave train is typically referred to as the Pacific South American patterns (PSAs; Karoly, 1989; Mo, 2000) and is the second dominant mode of variability in the SH, after the Southern Annular Mode (SAM). The third mode of variability, commonly called PSA2, is linked to quasi-biennial variations in ENSO and is associated with sea surface temperature (SST) variations in the tropical IO (Mo, 2000).
The IOD (Saji et al., 1999) is a mode of variability characterized by a dipole of east–west SST anomalies in the IO. Its activity peaks during austral winter and spring, influencing climate on seasonal scales in the vicinity of the IO. In addition, this dipole of SST anomalies can alter the tropical convection, causing remote effects through teleconnections. Previous research has shown that the IOD can induce large-scale circulation anomalies in the SH through wave trains propagating from the IO through the middle and high latitudes of the Pacific Ocean, even reaching South America (Saji and Yamagata, 2003b; Saji et al., 2005; Chan et al., 2008; Cai et al., 2011; McIntosh and Hendon, 2018). Moreover, many of these works assumed a linear response between the IOD phases, where the response magnitude is equal but with opposite signs. This assumption has led to the generalization of IOD effects based solely on composites of positive events without showing those of negative events (Saji and Yamagata, 2003b; Saji et al., 2005). However, such symmetry in the magnitude of the response between the two IOD phases does not seem to hold true for climate impacts beyond the IO region. For instance, Chan et al. (2008) noted that the response of the negative phase of the IOD on precipitation in South America is less consistent than that of the positive phase. Similarly, Cai et al. (2011) initially concluded the existence of symmetry in the intensity response of both phases of the IOD based on partial linear regression, but subsequent analysis by Cai et al. (2012) using linear regression demonstrated asymmetry in the phases of the IOD and their associated teleconnections. In particular, they found a stronger signal in the circulation anomalies for positive IOD events than for negative ones.
Atmosphere–ocean dynamics make the anomalous SST pattern of positive IOD events more intense than that of negative events (Hong et al., 2008; Cai et al., 2013). In addition, other seasonally dependent dynamical processes may affect the propagation of wave trains associated with each IOD phase. Through model experiments, Gillett et al. (2022) showed for the austral winter how negative IOD events promote wave trains toward extratropical latitudes despite the barrier imposed by the negative meridional gradient of mean absolute vorticity associated with the polar flank of the subtropical jet. The authors also refuted the hypothesis proposed by McIntosh and Hendon (2018), which suggested that, poleward of this barrier to the meridional propagation, the transient eddy feedback in the high-level flow could act as a source of Rossby waves, creating an apparent propagation. Gillett et al. (2022) also found that the atmospheric response in the equatorial IO to negative IOD events is larger than the response to the positive ones. However, Sena and Magnusdottir (2021) through modeling studies also found quite similar wave trains over the South Pacific Ocean associated with both phases of the IOD in the austral spring.
Previous works have identified a relationship between ENSO and the IOD through a positive and significant correlation between the Dipole Mode Index and the Niño 3.4 index (r=0.72, Cai et al., 2011). Moreover, at extratropical latitudes, Cai et al. (2011) found that in the austral spring (defined as September–October–November, SON) both poles of the IOD (located on the eastern and western sides of the IO basin) seem to promote the development of two separated wave trains that converge south of Australia and subsequently merge with the PSA pattern induced by ENSO in the subtropical central Pacific. However, due to the high correlation observed between both indices and the methodology of partial linear regression, the authors conclude that it is not possible to completely isolate the effects of the IOD and ENSO in that particular season. Later, Cai et al. (2012) using linear regression demonstrated that the combination of El Niño and a positive IOD exhibits a stronger impact on the extratropical circulation compared to the combination of a negative IOD and La Niña, particularly over the IO. These studies reveal that different approaches to the subject can lead to varying results, hence giving rise to considerable uncertainty.
This study aims to increase our understanding of the influence of the IOD on the extratropical circulation of the SH, including the IOD modulation of the ENSO–extratropical teleconnection. Considering the low number of IOD events described in the observational period considered, a strategy is proposed to reduce the associated uncertainties. We apply methodologies already used in the literature with observations to a large ensemble of climate model seasonal forecasts. The latter allows us to address the impact of sampling uncertainty, detect nonlinearities in the response of ENSO and the IOD, and examine the difference in responses associated with their intensity. The focus of the study is on the extratropics, and we thus do not address the dynamics of the combined ENSO–IOD activity in the tropical region or discuss the dependence between both climate variability patterns. The paper is organized as follows: Sect. 2 describes the data and methodology used, Sect. 3 presents the main results, and Sect. 4 discusses the main conclusions.
2.1 Observational data
We focused on the 1940–2020 period and austral spring, defined as the SON quarter when the IOD peaks (Saji et al., 1999), which has a stronger influence over the SH (Saji et al., 2005) and shows a stronger correlation with ENSO (Cai et al., 2011). The NOAA Extended Reconstructed SST v5 (ERSSTv5; Huang et al., 2017) was used to identify and categorize ENSO and IOD events. Data on divergence and velocity potential at 200 hPa and geopotential height at 750 hPa (z750) and 200 hPa (z200) were obtained from the ECMWF ERA5 reanalysis (Hersbach et al., 2020) to characterize the circulation conditions. Precipitation and temperature anomalies were described using the Global Precipitation Climatology Centre (GPCC; Schneider et al., 2020) v2020 dataset at 0.25° × 0.25° resolution and the gridded Climatic Research Unit (CRU) Time-series (TS) data version 4.05 (Harris et al., 2020), respectively. The linear trend was filtered, and a 3-month seasonal mean was calculated for all variables. It is noteworthy that the conclusions of this study do not change substantially if the period is limited to the satellite era (not shown).
2.2 ENSO and IOD indices
The Oceanic Niño Index (ONI) and the ENSO events were obtained following the Climate Prediction Center (CPC; https://origin.cpc.ncep.noaa.gov/products/analysis_monitoring/ensostuff/ONI_v5.php, last access: 30 October 2024). The CPC criterion for classifying an event as ENSO is that the ONI exceeds ±0.5 °C for at least five overlapping quarters. The Dipole Mode Index (DMI; Saji and Yamagata, 2003a) was used to identify and categorize IOD events. This index describes the zonal gradient of SST anomalies in the IO through the difference between the average of these anomalies between the western (IOW; 10° S–10° N, 50–70° E) and eastern (IOE; 0° S–10°, 90–110° E) sectors of the IO. The monthly anomalies of the time series for IOW and IOE were calculated based on the 1940–2020 climatology, filtering out the linear trend and interdecadal anomalies defined as periodicities longer than 7 years and applying a 3-month running mean. The difference between the IOW and IOE was computed after this pre-processing. Unlike Saji and Yamagata (2003a), we did not filter out the lagged effect of ENSO on tropical IO SST anomalies. Following Saji and Yamagata (2003a), we define an IOD event as an event during which the magnitude of the DMI exceeds half its standard deviation (SD) during the three overlapping quarters that make up the SON quarter of each year (i.e., when it exceeds 0.5 ⋅ SD during the SON months after applying the 3-month running mean).
2.3 Model data
Previous studies that relied solely on a composite technique to analyze the atmospheric effects of the IOD (Saji and Yamagata, 2003b; Saji et al., 2005) face a constraint in the robustness of their results due to the small size of the observed samples. This limitation applies to the ENSO response in cases of pure events, i.e., without the IOD. Therefore, to overcome these limitations, we also used a large ensemble of initialized predictions from the National Centers for Environmental Prediction (NCEP) Climate Forecast System version 2 (CFSv2) model (Saha et al., 2014). We follow Kumar and Chen (2017) and Osman et al. (2022), who used initialized simulations of models that are widely used for seasonal-scale forecasts, such as the CFSv2 model, and therefore represent teleconnections well. We used SST and z200 forecasts for SON (3-month seasonal mean) initialized 0, 1, 2, and 3 months in advance, i.e., from June to September, in the period combining hindcast (1982–2011) with real-time forecasts (2011–2020). Since the CFSv2 model has 24 ensemble members, the total sample has approximately 3744 ensemble members for SON. SON anomalies were calculated based on different periods due to the abrupt shift in the climatology of the CFSv2 SST forecasts between 1998 and 1999 (Kumar et al., 2012; Saha et al., 2014). Following Kumar and Chen (2017), for the period 1982–1998, the seasonal anomalies are based on the climatology of the same period, and for 1999–2020 they are based on the climatology of 1999–2011. The linear trends of the anomalies were filtered separately for the periods 1982–1998, 1999–2011, and 2011–2020. In the CFSv2 model, the DMI and Niño 3.4 index were computed from the seasonal mean of the SST anomalies in SON for each forecast in the sample. For the simulation, an event is defined as an IOD event when the index magnitude exceeds 0.5 ⋅ SD of the DMI over the entire sample, while an event is defined as an ENSO event when the magnitude of Niño 3.4 exceeds ±0.5 °C, in line with the observed events.
2.4 Partial regression technique
To isolate the influence on the atmospheric anomalies of ENSO and the IOD that are linearly independent of each other, we used the partial regression technique, following Cai et al. (2011). This technique consists of computing the linear regression between a predictand (e.g., z200) and a predictor (e.g., ONI) after removing, by regression, the linear relationship of a second predictor (e.g., DMI) from both the predictand and the first predictor. Following the notation of Cai et al. (2011), we refer to this regression as the ONI|DMI. Likewise, the regression between a variable and DMI without the effect of ONI is referred to as DMI|ONI. The statistical significance of the regression coefficients was estimated based on that of the corresponding correlation coefficients using Student's t test at a 95 % confidence level. It is important to note that due to the high correlation between DMI and ONI, it is possible that by removing the effect of one on the other through linear regression, some intrinsic properties of each one are also removed. Moreover, this technique is limited to capturing only the linear aspects of the phenomenon. For ease of visual comparison, the size of the regression anomalies has been scaled by 1 SD anomaly of the predictor in each case.
2.5 Composite technique
Composite fields of all variables were made by the difference between the mean of all fields in the sample (observational or model data) with the same type of event (e.g., El Niño or a positive IOD event) and the mean of all neutral fields in the sample in which no ENSO or IOD events occurred. The significance of the observed composites was analyzed using the Monte Carlo technique, following Osman and Vera (2017). This technique consists of computing anomaly composites by randomly selecting N instances from a dataset of neutral events and N events of the same type (e.g., El Niño). This procedure is repeated 10 000 times to compute the 5th and 95th percentiles of the mean anomaly composites based on 10 000 values for each grid point. Then, each anomaly composite is tested against the 5th and 95th percentiles to assess its significance. We divide the composites into three cases, ENSO pure, IOD pure, and simultaneous. A pure event is one in which only a single event, either ENSO or the IOD, occurs (according to the criteria explained above), and a simultaneous event is one in which both events occur simultaneously.
The robustness of the composite based on CFSv2 model predictions was assessed by estimating the signal-to-noise ratio (SNR) from each composite and for each case (e.g., El Niño), following Kumar and Chen (2017). The signal is the composite mean, and the noise is the SD between the forecasts that make up the composite.
To describe the energy dispersion associated with the teleconnections, we calculated the wave activity fluxes (WAFs) following Takaya and Nakamura (2001).
3.1 Reanalysis
Figure 1 shows the joint distribution of ONI and DMI in SON for the observed period of 1940–2020. As expected, the correlation between ENSO and the IOD is high (0.54), in agreement with previous works (Cai et al., 2011), and most events occur simultaneously and in the same phase, i.e., El Niño–positive IOD (13 events) or La Niña–negative IOD (10 events). It is noteworthy that we only found two instances with events of opposite sign, characterized by a positive IOD and La Niña (2011) and a negative IOD and El Niño (1979). In addition, only a few pure events (4 positive IOD, 8 negative IOD, 12 El Niño, 13 La Niña events) were identified to analyze the individual response without resorting to any filtering technique, such as partial regression. Moreover, as reported in previous works (Hong et al., 2008; Cai et al., 2013), it is evident that pure positive IOD events have a larger magnitude than pure negative ones. Note that, in Fig. 1, cases outside the gray bands that are not categorized as IOD, ENSO, or purely simultaneous do not meet the temporal criteria to be considered events (see Sect. 2.2).
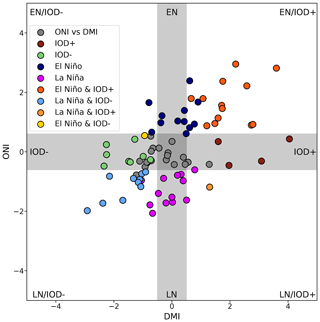
Figure 1Scatter plot between DMI and ONI in SON for 1940–2020. The blue (magenta) and dark red (green) colors denote pure El Niño (La Niña) and positive (negative) IOD events, respectively. Simultaneous positive (negative) events are shown in red (light blue). The horizontal and vertical gray bands indicate the threshold for determining the events (see text). Cases outside the gray bands that are not categorized as IOD, ENSO, or purely simultaneous do not meet the temporal criteria to be considered events (see text).
3.1.1 Partial regression
The regression fields for the anomalies of SST, divergence, and velocity potential (VP) at 200 hPa associated with ONI, ONI|DMI, DMI, and DMI|ONI in SON are shown in Fig. 2. The full regression fields for ENSO and the IOD (Fig. 2a and b, respectively) are very similar due to the high correlation between their indices. However, the SST anomalies in the equatorial Pacific are larger in ONI than in DMI. Moreover, the anomaly upward and downward motions are also stronger for ONI, as shown by regions of divergence and negative VP in the equatorial Pacific and convergence and positive VP over the maritime continent and eastern IO. For the IOD (Fig. 2b), these rising and sinking anomaly patterns are weaker, and the upward motion over the western IO and east Africa associated with convection due to the warm SST is more evident than for ENSO. The ONI|DMI regression field (Fig. 2c) shows a small signal of ENSO on the SST anomalies in the IO. Moreover, the downward anomaly pattern over the maritime continent and the eastern IO is more widespread and less intense than for the ONI full regression. On the other hand, the DMI|ONI regression pattern (Fig. 2d) shows almost no connection between the IOD and the anomalies of both SST and the atmospheric circulation in the Pacific Ocean. The upward and downward anomaly patterns are weaker compared to the full regression and are restricted to the IO basin. From these results, similar anomalous circulation patterns can be expected for ENSO and the IOD, which lose intensity when the effect of one on the other is removed. This should be more pronounced in the pattern associated with the IOD without the effect of ENSO.
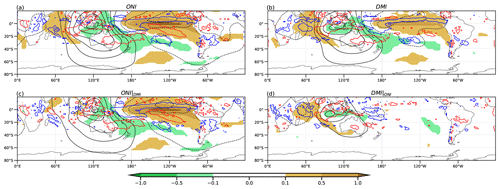
Figure 2Regression of SST anomalies (°C, shaded), velocity potential (black contours by 0.5 × 10⁶ m2 s−1), and significant divergence (blue contour at 4.33 × 10⁻⁷ s−1) and convergence (red contour at −4.33 × 10⁻⁷ s−1) based on a 95 % Student's t test at 200 hPa on ONI (a), DMI (b), partial ONI (c), and partial DMI (d).
As for the previous variables, the z200 (Fig. 3) anomaly regression fields for ENSO and the IOD are similar, but the former has stronger anomalies. For both ENSO and the IOD full regressions (Fig. 3a and b, respectively), a PSA-like pattern across the central Pacific and a wave train (IO wave train, following Cai et al., 2011) emanating from the eastern IO southeastward to high latitudes are evident. However, the WAF shows that the IO wave train only contributes to the PSA-like pattern over the South Pacific for the IOD full regression (Fig. 3b). For all cases, the circulation anomalies at 750 hPa represent almost insignificant values over the Pacific Ocean equatorwards of 20°S (Fig. 4). The ENSO full regression for this level (Fig. 4a) shows an anticyclonic anomaly over the IO basin, with the largest values to the west of Australia, which links with a cyclonic anomaly in the central South Pacific associated with the PSA-like pattern. A very similar pattern is observed in the case of the IOD full regression at 750 hPa (Fig. 4b), but this anticyclonic anomaly is located slightly further east of the IO, the maritime continent, and Australia, and it is more intense than in the ENSO full regression. Unlike at the upper level, the WAF at 750 hPa shows the contribution of the IO wave train to the PSA-like pattern for both ENSO and IOD full regressions (Fig. 4a and b, respectively). Cai et al. (2011) identified this wave train as equivalent barotropic and suggested that, in SON, it arises from the joint contribution of the east and west IO convection anomalies. This results in a more zonal propagation compared to that observed in austral winter, where only the eastern IO contributes (Cai et al., 2011).
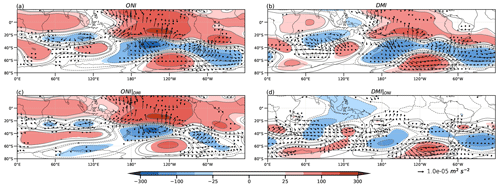
Figure 3Regression of geopotential height (m, shaded and contours) and wave activity flux (m2 s−2, vectors) at 200 hPa onto ONI (a), DMI (b), partial ONI (c), and partial DMI (d). Colored regions indicate 95 % statistical significance with a t test.
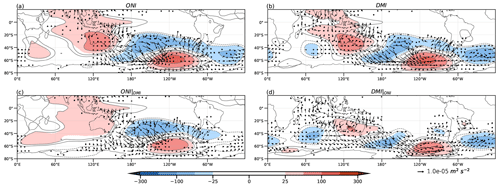
Figure 4As in Fig. 3 but for 750 hPa.
The IO wave train is less intense and less significant for ONI|DMI (Fig. 3c) than in the ONI full regression (Fig. 3a), as evidenced by the changes in the z200 circulation anomalies. This is consistent with the weakening of the sinking region at 200 hPa (cf. VP in Fig. 2a and c) at the eastern IO when the IOD effect is removed. Therefore, the IO wave train no longer seems to contribute to the PSA pattern, which is slightly weaker. At 750 hPa the ONI|DMI regression (Fig. 4c) shows that both the anticyclonic anomaly over Australia and the cyclonic anomaly downstream lose intensity, while the wave train propagation towards the Pacific Ocean, as described by the WAF, is no longer evident. On the other hand, in the DMI|ONI regressions at both levels, the IO wave train maintains its significance with an equivalent barotropic structure and propagates throughout the high latitudes of the SH from the IO and the southern region of Australia (Figs. 3d and 4d).
These results show that, despite the weaker SST and VP anomaly patterns (Fig. 2d), the IOD by itself can affect circulation anomalies throughout the SH at middle and high latitudes. In addition, the co-occurrence of ENSO and IOD events could lead to an enhanced ENSO circulation response through the IO wave train.
3.1.2 Composites
Given the limitations of the regression technique in capturing only linear aspects and its possible insufficiency in completely isolating effects due to the strong correlation between ENSO and the IOD, we also explored composites for pure IOD and ENSO events separately, as well as for their combinations.
In general, the SST composites (Fig. 5) resemble the regressed anomalies in spatial distribution and the expected sign (similar sign for the positive phase and opposite for the negative phase). However, for both pure event composites, weak SST anomalies appear in the basin where the other event takes place, such as negative SST anomalies in the equatorial Pacific region for the positive IOD composite (Fig. 5c). Concerning the composites for divergence and VP anomalies at 200 hPa over the tropics, they also resemble the corresponding regression fields in spatial distribution and expected sign. However, while the intensities of the anomalous upward and downward anomalies are similar between both ENSO phases (Fig. 5a and b), they are more intense for the positive IOD (Fig. 5c) compared to its negative phase (Fig. 5d). Accordingly, in the case of simultaneous events, these anomalous patterns are enhanced in El Niño–positive IOD (Fig. 5e) but not too much in La Niña–negative IOD (Fig. 5f). Here, by distinguishing between phases, a strong nonlinearity is observed between the positive and negative IOD responses. This asymmetry is also present in the combined events but is not as intense as in the pure IOD.
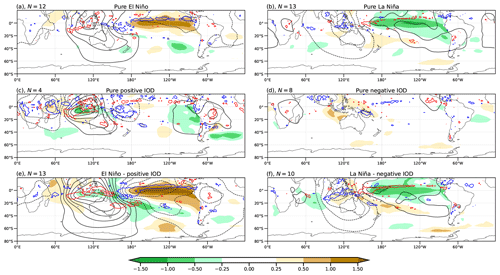
Figure 5Composites of SST anomalies (°C, shaded), velocity potential (black contours by 0.75 × 10⁶ m2 s−1), and significant divergence (blue contour at 1.6 × 10⁻⁶ s−1) and convergence (red contour at −1.6 × 10⁻⁶ s−1) based on a 95 % Student's t test at 200 hPa for positive (left) and negative (right) events for ENSO (a, b), the IOD (c, d), and simultaneous ENSO–IOD (e, f). The number in the title of each plot indicates the number of samples that makes up each composite.
Composites fields for z200 and z750 (Figs. 6 and 7, respectively) exhibit similar structures due to the equivalent barotropic nature of the anomalies. At both levels, composites show a typical PSA-like pattern for pure El Niño (Figs. 6a and 7a), with significant anomalies covering smaller regions at middle and high latitudes than for the tropics. On the other hand, composites for the positive IOD (Figs. 6c and 7c) show a wave train propagating downstream from the IO to South America, which bears some resemblance to the El Niño wave train at middle and high latitudes, though the significant parts of the positive IOD wave train differ from those associated with El Niño. Regardless of the differences in the significance of the anomalies, the anomalous circulation patterns for El Niño and the positive IOD correspond well with the regressed anomalies (Fig. 3c and d). The co-occurrence of positive IOD and El Niño events (Figs. 6e and 7e) is associated with a combination of the IO wave train and the PSA pattern and larger anomalies over the South Pacific than those associated with the pure events. In addition, the WAFs at 750 hPa for the pure positive IOD (Fig. 7c) appear disorganized, lacking a clear and coherent wave dispersion direction. However, combined events of a positive IOD and El Niño (Fig. 7e) show clear energy dispersion associated with the merging of the IO wave train and the PSA pattern.
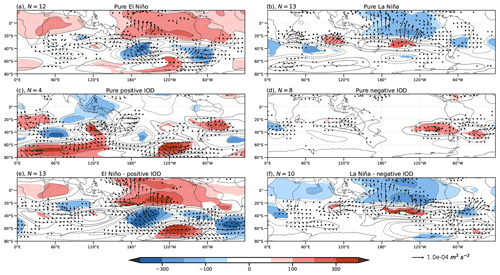
Figure 6Composites of geopotential height anomalies (m, shaded) and wave activity flux (m2 s−2, vectors) at 200 hPa for positive (a, c, e) and negative (b, d, f) events of ENSO (a, b), the IOD (c, d), and simultaneous ENSO–IOD (e, f). Colored regions indicate 95 % statistical significance with a Monte Carlo test (see text). The number in the title of each plot indicates the number of samples that makes up each composite.
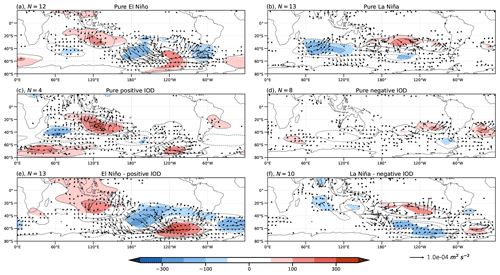
Figure 7As Fig. 6 but for 750 hPa.
The z200 and z750 composites for La Niña (Figs. 6b and 7b) present the PSA-like pattern of opposite sign to El Niño, and it is modulated at high latitudes when La Niña events occur simultaneously with negative IOD events (Figs. 6f and 7f). In the La Niña–negative IOD composite, the cyclonic anomaly in the South Pacific intensifies and shifts southward with respect to the pure La Niña composite. From this cyclonic anomaly, a well-organized wave train propagates toward South America. On the other hand, the negative IOD composite lacks the wave pattern observed in the positive IOD phase over the Pacific Ocean. At both levels for the negative IOD composite (Figs. 6d and 7d), only the midlatitude anticyclonic anomalies are noticeable, with the most intense and significant occurring along the west coast of South America. This pattern does not resemble the one derived from the regression (Fig. 3d). As expected from Fig. 5, the response in the hemispherical circulation also reflects this nonlinearity between the IOD phases. However, given the small sample sizes available for the composites and the previously mentioned regression limitations, caution is necessary with these assertions. We must consider whether the observed response accurately reflects the nature of these events or whether it is merely the result of sampling variability.
It is worth noting that the individual events that make up the negative IOD composite exhibit substantial variability among each other, more than in the positive ones (see Figs. S1 and S2, respectively), making it challenging to identify a consistent atmospheric response when compositing. These differences may be related to the barrier created by the negative meridional gradient of mean absolute vorticity associated with the subtropical jet over southern and southwestern Australia. This area, as described through the stationary wave number Ks (Kiladis, 1998) when it is negative, hinders the propagation of the barotropic Rossby wave trains in the meridional component. According to this theoretical framework, events with a larger region of Ks < 0 would not exhibit clear Rossby wave patterns, while those with a smaller area of Ks < 0 would. While this holds true for some events, such as in 1990 and 1996, it is not universally valid (see Figs. S1 and S3). Gillett et al. (2022) demonstrated for the austral winter that wave trains associated with negative IODs can propagate through this barrier by several mechanisms, which indicates that the barotropic mechanisms do not dominate there. Nonetheless, the analysis of negative IOD events separately suggests that some of them encounter less favorable conditions for wave propagation, leading to more varied responses compared to the positive phase (see Figs. S2 and S4). In addition, the influence of other climate modes of variability, such as the SAM, cannot be ruled out, as they can influence the propagation of Rossby waves.
These results then suggest that the positive IOD phase has a significant response in the SH circulation. In addition, the joint action of the positive IOD with El Niño tends to reinforce the typical ENSO-related circulation pattern. On the other hand, circulation anomalies for the negative IOD phase do not show the same magnitude and consistency between individual events as for the positive phase. However, the negative IOD seems to modulate La Niña-related circulation anomalies, mainly through changes in the location and intensity of the anomalous circulation centers at middle and high latitudes that can give rise to different climate responses.
From the comparison of regressions and composites, it can be said that the magnitude of the IOD response to the large-scale circulation in the SH is not symmetric, as could be assumed from the regression and as found for Cai et al. (2012). This suggests two non-exclusive hypotheses: (a) forcing related to the negative IOD is not intense enough to generate a significant large-scale circulation response, and (b) some negative IOD events are associated with a mean state that does not favor the meridional propagation of barotropic Rossby waves at high levels, as we have just shown. This may result in a very different response in large-scale circulation between each negative event.
3.2 Model outputs
To increase the robustness of the results, we use the large ensemble from the CFSv2 model outputs described in Sect. 2. First, we briefly assessed how the model reproduces the mean climate and the mean composites for ENSO and the IOD. Figure S3a shows the mean differences in geopotential height at 200 hPa between the model outputs and ERA5 reanalysis for SON. Overall, the model underestimates the geopotential height northward to 60° S and overestimates it southward. In addition, the CFSv2 model correctly reproduces the ENSO and IOD characteristics in the SH (Fig. S3b, c, d, e). However, over the IO the anomaly composites for both positive and negative phases of ENSO and the IOD are greater than those for the reanalysis.
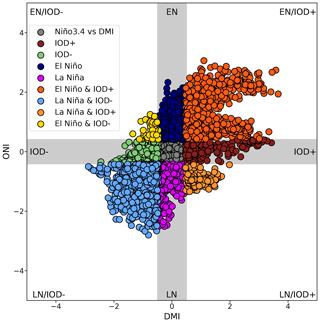
The joint distribution of the Niño 3.4 index and DMI in the CFSv2 model (Fig. 8c) shows similar characteristics to the reanalysis (Fig. 1). Most of the events occur simultaneously and in the same phase, and the positive IODs are more intense than the negative ones. The occurrence of El Niños alongside negative IODs and La Niñas with positive IODs is also evident, although the number of cases is less than 10 % compared to the number of neutral events. In addition, model-based SST composites of the DMI and Niño 3.4 index (Fig. 9) correspond to what is expected for IOD and ENSO events, respectively.
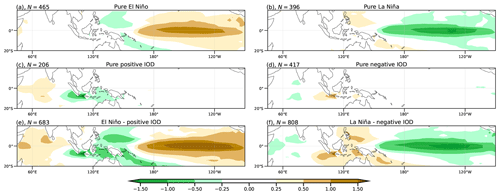
Figure 9Composites of SST anomalies (°C, shaded) from the CFSv2 model for positive (a, c, e) and negative (b, d, f) events of ENSO (a, b), the IOD (c, d), and simultaneous ENSO–IOD (e, f). The number in the title of each plot indicates the number of samples that makes up each composite.
We make composites following the same procedure as for the reanalysis dataset. We do not consider the composites of events in opposite phases (e.g., El Niño and negative IOD) because they represent less than 10 % of the total number of neutral events.
For both El Niño and La Niña, the composites of z200 (Fig. 10a and b, respectively) show a PSA-like pattern but with greater intensity for El Niño, especially at high latitudes. The positive IOD composite (Fig. 10c) closely resembles the observed (Fig. 6c) and regressed (Fig. 3d) composites. Composites of simulated z200 for simultaneous positive IOD and El Niño show larger circulation anomalies through the IO wave train (Fig. 10a and e), in agreement with the observations (Fig. 6a and e). On the other hand, negative IOD composites from model outputs (Fig. 10d) resemble the regressed anomalies (Fig. 3d) but with the expected opposite sign. However, this pattern is totally different from the observed negative IOD composites (Fig. 6d). Negative IOD and La Niña composites describe enhanced circulation anomalies through the IO wave train (Fig. 10f). Nevertheless, the intensification of the anomalies (cf. Fig. 10a and f) at middle and high latitudes is smaller than for the simultaneous positive phase.
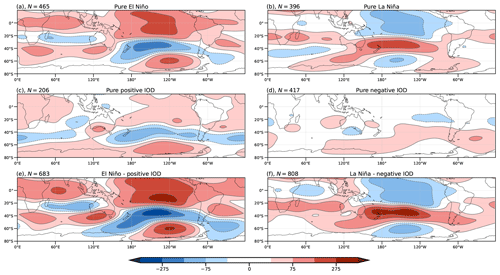
Figure 10As Fig. 6 but for geopotential height at 200 hPa.
Figure 11 shows the signal-to-noise ratio (SNR; see Sect. 2) for each composite. In the El Niño and La Niña (Fig. 11a and b, respectively) composites, the SNR is higher over the tropical Pacific Ocean. However, at high latitudes, the signal is comparable to the noise (SNR ∼ 0.5) only in the El Niño composite. In the case of the IOD composite, the noise is larger than the signal (SNR < 0.5) in almost the entire SH for both phases (Fig. 11c and d). When El Niño and the positive IOD occur simultaneously (Fig. 11e), the SNR magnitude intensifies (0.7–0.8) compared to El Niño, especially in the IO wave train and in the PSA-like pattern at middle and high latitudes. In the case of La Niña combined with a negative IOD (Fig. 11f), the SNR values are similar to those for pure La Niña. In fact, signal enhancements in the simultaneous negative events compared to the pure La Niña are only identified over the southern IO and the South Pacific, where noise still dominates.
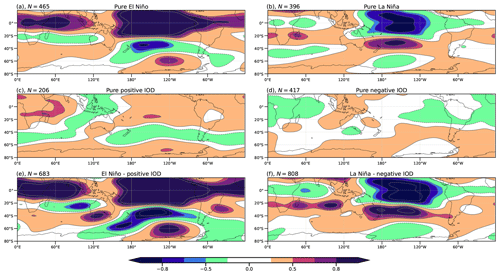
Figure 11As Fig. 10 but for the signal-to-noise ratio of geopotential height anomalies at 200 hPa.
So far, the model results agree with the reanalysis for the positive IOD and for its joint action with El Niño. On the other hand, for negative IODs, the CFSv2 results suggest that the sample used in the observed composites may not be representative of the nature of these events. The combined action of La Niña with the negative IOD seems to give rise to a more intense anomalous circulation in the model outputs than in the pure La Niña events, although it is not as strong as in the positive phase. The differences between the model results and those of the observations for La Niña and negative IOD composites could be related to the characteristics of negative IOD cases in the observational record, which are less intense than those from the model. To address this issue, we exploit the large ensemble to analyze the role of ENSO and IOD magnitude in the composites. Figure 12 shows the composites of the different ENSO and IOD phases conditioned on their magnitude. Using the criteria described in Sect. 2, ENSO and IOD events were categorized into two types: moderate events (those whose magnitude was less than 1 SD for the IOD and less than 1 °C for ENSO) and strong events (those whose magnitude exceeded these thresholds). In agreement with the observed composites and regressions, the IO wave train for moderate events is more evident in the pure positive IODs than in the pure negative ones (Fig. 12g, h, i, and j). However, for strong events (Fig. 12g and j), the IO wave train is evident for both phases and slightly more intense for the positive phase.
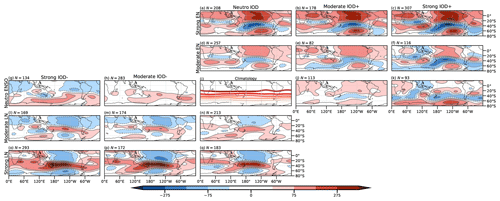
Figure 12Composites of geopotential height anomalies (m) at 200 hPa for the CFSv2 model, conditioned on the magnitude of the ENSO and IOD indices (see text). From top (left) to bottom (right): IODs (ENSOs) classified as strong positive, moderate positive, neutral, moderate negative, and strong negative.
The combination of El Niño events and a positive IOD phase is associated with a more intense anomalous circulation pattern than that associated with pure El Niño events, either moderate or strong (Fig. 12b, c, e, and f). However, the combination of La Niña and a negative IOD is not associated with a coherent change in the circulation anomalies (Fig. 12k, l, n, and o). Composites for moderate and strong negative IODs (Fig. 12h and g, respectively) combined with moderate La Niña events (Fig. 12n) are not notably different from those for pure moderate La Niña events (Fig. 12m), in terms of the PSA-like pattern over the Pacific Ocean. However, the contribution of both moderate and strong negative IODs to the La Niña pattern is evident through the presence of the IO wave train (Fig. 12k and l, respectively). On the other hand, the combination of strong La Niña events (Fig. 12p) with a moderate or strong IOD tends to amplify the circulation anomalies over middle and high latitudes (Fig. 12o and n, respectively). In moderate La Niña events, the IO wave pattern is also present but weaker, while in the strong La Niña events, it is embedded in the corresponding PSA-like pattern but with opposite sign over southwest Australia.
The SNR was also analyzed for the expanded set of composites. SNR is small (less than 0.5) for the moderate IOD events of both IOD phases and for the strong negative ones (Fig. 13g, h, i, and j). However, SNR for the strong positive IOD events (Fig. 13j) exhibits larger values associated with the IO wave train. Although an intensification of circulation anomalies for all El Niño events along with positive IODs was found relative to those for pure El Niño (Fig. 12b, c, e, and f), SNR changes differ according to the intensity of the events (Fig. 13b, c, e, and f). For both moderate and strong El Niño events, SNR does not increase noticeably when they are combined with moderate positive IODs (Fig. 13e and b), which suggests that even though the circulation pattern intensifies, the noise does too. In contrast, when El Niño occurs simultaneously with strong positive IODs (Fig. 13c), the SNR increases throughout the entire domain, including the IO wave train. On the other hand, neither moderate nor strong events of a negative IOD show substantial SNR changes when occurring concurrently with moderate La Niña (Fig. 13k, l, n, and o). However, SNR increases at middle and high latitudes when strong La Niñas combine with negative IOD events (Fig. 13n and o). These results are consistent with the positive skewness in the DMI described in the reanalysis (Sect. 3.1). Due to their higher intensity, the observed pure positive IOD events show a stronger signal than pure negative IODs.
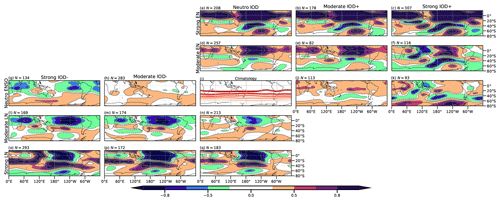
Figure 13As Fig. 12 but for the signal-to-noise ratio of geopotential height anomalies at 200 hPa.
3.3 Temperature and precipitation
We evaluate the impact of the combined activity of ENSO and the IOD on surface air temperature and precipitation in the major continental land masses south of 20° S. Following the same procedure as for the atmospheric circulation variables, Fig. 14 shows the regression fields of temperature and precipitation anomalies in SON using the observational datasets described in Sect. 2. In addition, Figs. 15 and 16 show the composites of temperature and precipitation anomalies, respectively. It is important to note that the regression still has the limitation of capturing only the linear aspect of the problem, and the composites are constrained by the number of samples available. Moreover, for pure IOD composites, it is worth keeping in mind that the observed negative events are less intense than the positive ones.
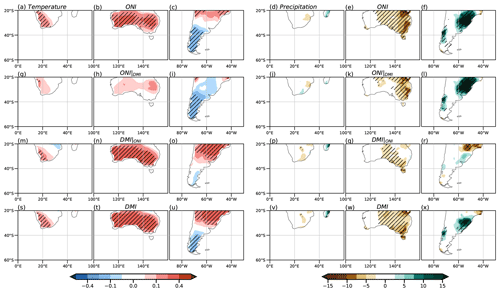
Figure 14Regression of temperature from the CRU dataset (°C, left) and precipitation anomalies from the GPCC dataset (mm, right) from top to bottom: ONI, partial ONI, partial DMI, and DMI in the period 1940–2020. The dotted areas indicate 95 % statistical significance with a t test.
The ENSO full regression shows positive temperature anomalies in Africa that are smaller and less significant when the IOD effect is removed (Fig. 14a and g, respectively). This change could be related to the decrease in the intensity of the anticyclonic anomaly over this region by removing the IOD effect of ENSO (Fig. 4a and c). On the other hand, the temperature anomalies remain significant in the full and partial IOD regressions (Fig. 14s and m, respectively), although their relationship with circulation is not clear (Fig. 4e). Consistent with the anticyclonic anomaly over the continent, the precipitation anomaly regression fields in all cases (Fig. 14d, j, p, and v) indicate negligible anomalies across the entire African region considered. Regarding the composites, significant temperature anomalies are only observed in this region during La Niña events (Fig. 15d), and their negative sign is in agreement with the expected results of the regression. Regardless of the significance, temperature composites show good correspondence with the temperature regressions in the simultaneous cases for both phases (Fig. 15m and p) and in negative IODs (Fig. 15j). On the other hand, precipitation anomaly composites are also negligible at the southern tip, which is consistent with the regressions.
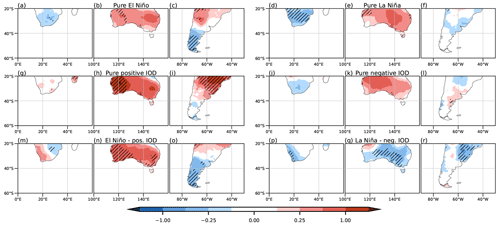
Figure 15Composites of temperature anomalies from the CRU dataset (°C) for positive (left) and negative (right) events for ENSO (top), the IOD (middle), and simultaneous ENSO–IOD (bottom) in the period 1940–2020. The dotted areas indicate 95 % statistical significance with a Monte Carlo test (see text).
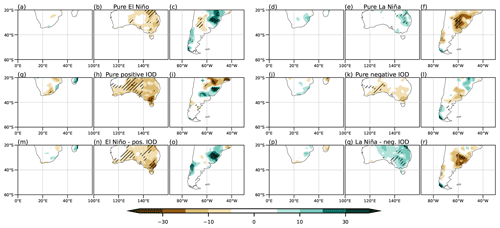
Figure 16As Fig. 15 but for precipitation anomalies from the GPCC dataset (mm).
In Australia, the full regression fields of temperature anomalies are similar for ENSO and the IOD (Fig. 14b and t, respectively), with positive anomalies over most of the country. However, the ENSO pattern of positive anomalies loses all of its significance and intensity when the effect of the IOD is removed (Fig. 14h). On the contrary, the IOD-related anomalies maintain their significance even without considering ENSO (Fig. 14n). Therefore, the IOD seems to be more important in influencing temperature anomalies than ENSO. For precipitation, the full regression fields are similar for ENSO and the IOD, with negative anomalies across the eastern half of the domain (Fig. 14e and w, respectively), which is consistent with Cai et al. (2011, 2012), Liguori et al. (2022), and Holgate et al. (2022). However, not entirely in agreement with Cai et al. (2011) but in accordance with Liguori et al. (2022), the partial regression fields reveal that ENSO has a more intense and focused influence in eastern Australia (Fig. 14k), while for the IOD the anomalies are weaker and localized in the central south (Fig. 14q). These behaviors for temperature and precipitation can be related to the anticyclonic anomaly over most of Australia in the full regressions (Fig. 4a and b), which weakens in the partial regression with ENSO (Fig. 4c) and remains strong south of the country for the partial IOD regression (Fig. 4d). For the composites, this anticyclonic anomaly over Australia behaves similarly to that observed in the regressions during the positive phases, resulting in similar impacts to those found with the regression, that is, positive temperature anomalies in El Niño, El Niño–positive IOD, and the pure positive IOD phase in particular, although they do not have much significance (Fig. 15b, h, and n, respectively). On the other hand, La Niña and negative IOD composites show the same positive anomaly as in the positive phase and no significance (Fig. 15e and k, respectively), i.e., the opposite of what can be assumed from the linear regression. Only in the simultaneous events (Fig. 15n and q) does the behavior agree with what is described by the regression for both phases, although almost without significance. These results may be related to the lack of strong and significant circulation anomalies for the negative phases (Fig. 6b, d, and e). In the precipitation anomaly composites, the behavior is similar to that for temperature. In composites for all positive phases (Fig. 16b, h, and n), significant precipitation anomalies align with the regression, but in negative phases, only La Niña and the combination of La Niña with a negative IOD exhibit this consistency (Fig. 16e and q, respectively). For the negative IOD, the anomalies are close to zero (Fig. 16k).
In South America, the full regression fields of temperature anomalies for ENSO and the IOD are similar (Fig. 14c and u, respectively), but they exhibit some differences that become evident in the partial regression. In the ENSO partial regression when the IOD is removed (Fig. 14i), negative anomalies are observed at middle and high latitudes of this region, being more intense and significant at the southern tip of the continent, in agreement with previous results (Cai et al., 2020). On the other hand, in the IOD partial regression pattern (Fig. 14o), positive temperature anomalies are observed in the center of the continent, with anomalies close to zero further south, in agreement with Saji et al. (2005). These changes might respond to the position and intensity of the cyclonic anomaly over the south-central part of the continent. In the ENSO partial regression, the cyclonic anomaly extends slightly northward, while in the IOD partial regression, the anomaly splits into two, and the anticyclonic anomaly intensifies further north. These changes in the circulation can partly explain the observed precipitation patterns. The full regression fields of the precipitation anomalies over South America are similar for ENSO and the IOD (Fig. 14f and x, respectively) but are much stronger for the former. Moreover, when the IOD effect is removed from ENSO (Fig. 14l), the pattern of anomalies remains almost the same, but the region of positive anomalies in the east-central part of the continent shifts slightly northward as it intensifies. This ENSO-related precipitation anomaly pattern is in agreement with Cai et al. (2020). On the other hand, when the ENSO effect is removed from the IOD (Fig. 14r), a north–south dipole is observed in the east-central part of the continent that agrees in sign with Chan et al. (2008) but not in intensity. As in the other continents, composites of temperature anomalies agree with the regression in the positive phases but not in the negative ones (Fig. 15c, i, p and f, l, r, respectively), where the intensity is also smaller. For precipitation, the anomaly composites (Fig. 16c, i, o, f, l, and r) align in terms of sign with the regression results for both phases. However, the agreement is more pronounced in intensity and significance for the positive phases (Fig. 16c, i, and o).
As for the circulation anomalies, the asymmetric intensity of the response between the positive and negative phases of the IOD alongside its joint action with ENSO is also observed in the precipitation and temperature effects over the three continents. Moreover, this asymmetry seems to depend on the variable and whether the activity of ENSO and the IOD is combined or not. All of this highlights the complexity and the need to understand how both large-scale variability patterns influence the austral spring climate of each continent in more detail.
Previous investigations of the extratropical circulation associated with the IOD and its interaction with ENSO have provided different and even contradictory results, mainly due to their assumptions and methodologies. Many of these studies assumed symmetry in magnitude of the IOD response to the large-scale circulation (Saji and Yamagata, 2003a, b; Cai et al., 2011), which was later refuted by Cai et al. (2012). However, Cai et al. (2012) employed linear regression without separating the effects of ENSO and the IOD (for the large-scale circulation analysis) due to the high correlation between their indices in SON. This can lead to the observed characteristics not being uniquely attributable to each event (ENSO or the IOD), especially during the positive phases of both the IOD and ENSO, where the correlation is stronger than that of the negative phase. This limitation also arises when using partial regression but in the opposite direction, as attempting to isolate the effects may eliminate individual characteristics. In our study, we complemented our analysis of the partial regression by employing composites and the CFSv2 model outputs to provide a wider and more complex analysis of the separated and combined influence of both the IOD and ENSO on the austral spring climate anomalies in the SH.
By comparing the results obtained with the three methodologies, it is evident that while the IOD positive phase is associated with significant anomalies in the circulation of the entire SH, the IOD negative phase presents a less consistent anomaly circulation pattern. Compared to positive IODs, the response to SH circulation of negative IODs shows higher inter-event variability, lower significance, and a lower magnitude. The same is found for temperature and precipitation anomalies on the three continents. These differences may be due to the magnitude of the events, since, as shown in this study and in agreement with previous works (Cai et al., 2013), positive IODs are typically more intense than negative ones. The results suggest that the differences in the magnitude of the convection anomaly at the equatorial IO between both IOD phases could explain the observed differences in atmospheric responses between IOD phases.
Regarding the interplay between ENSO and the IOD, the nonlinearity/asymmetry in the intensity of the response between both phases of the IOD also comes into play. All results obtained with both regressions and composites based on both reanalysis and CFSv2 model outputs indicate that a positive IOD can reinforce the El Niño circulation by merging the IO wave train with the PSA-like pattern over the Pacific Ocean. The CFSv2 model results also suggest that the co-occurrence of moderate positive IOD events with El Niño events does not result in an SNR increase. However, strong positive IODs can contribute to increasing the circulation signal of both moderate and strong El Niño circulation anomalies and the IO wave train. On the other hand, a negative IOD in combination with La Niña does not have a clear joint influence on the circulation. There is a moderate intensification of the circulation associated with La Niña, accompanied by some changes in the location of the anomalous circulation centers. However, unlike El Niño and the positive IOD, the results vary considerably between linear regression, the observed composites, and the model composites. It is worth noting that, as for the pure IOD, negative simultaneous events (La Niña–negative IOD) are less intense than positive ones. Moderate and strong negative IODs from the model simulation do not produce important changes in the intensity and SNR of the moderate La Niña circulation pattern. On the other hand, the combination of strong La Niña with a moderate and strong IOD gives rise to the intensification of anomalies and the SNR of the circulation pattern at middle and high latitudes.
Finally, the influence of the pure IOD and its combination with ENSO on precipitation and temperature over the three continents in midlatitudes is affected by the differences found between the IOD phases mentioned above. The magnitude and sign of the response associated with ENSO and the IOD vary markedly depending on their phase and the variable to be considered. This is important for impact analyses of interest to productive sectors in extratropical regions where ENSO and the IOD have influence, for example, on corn crops in the Argentine Pampas region (Muller et al., 2015) and wheat crops in Australia (Yuan and Yamagata, 2015; Ummenhofer et al., 2009).
In conclusion, the IOD positive phase can have effects over the entire SH extratropical circulation, which can intensify in combination with El Niño. These results highlight the importance of considering the IOD when studying and characterizing ENSO events. On the other hand, negative IODs can modulate the circulation response to strong La Niñas, although the results exhibit considerable inter-event variability that requires further study.
All codes used in this work can be found at https://github.com/LucianoAndrian/ENSO-IOD (last access: 30 October 2024) (https://doi.org/10.5281/zenodo.14014116, Andrian, 2024).
Raw ERA5 reanalysis data can be found at https://doi.org/10.24381/cds.f17050d7 (Hersbach et al., 2023), CFSv2 model outputs at https://iridl.ldeo.columbia.edu/SOURCES/.Models/.NMME/.NCEP-CFSv2/ (IRI, 2024), CRU temperature at https://crudata.uea.ac.uk/cru/data/hrg/cru_ts_4.05/ (CRU, 2024), and GPCC precipitation at https://doi.org/10.5676/DWD_GPCC/FD_M_V2020_025 (Schneider et al., 2020).
The supplement related to this article is available online at: https://doi.org/10.5194/wcd-5-1505-2024-supplement.
LGA: data curation, formal analysis, investigation, methodology, visualization, writing – original draft. MO: conceptualization, data curation, supervision, methodology, writing. CSV: funding acquisition, project administration, resources, conceptualization, supervision, methodology, writing.
The contact author has declared that none of the authors has any competing interests.
Publisher’s note: Copernicus Publications remains neutral with regard to jurisdictional claims made in the text, published maps, institutional affiliations, or any other geographical representation in this paper. While Copernicus Publications makes every effort to include appropriate place names, the final responsibility lies with the authors.
We acknowledge the agencies that support the NMME-Phase II system, and we thank the climate modeling groups (Environment Canada, NASA, NCAR, NOAA/GFDL, NOAA/NCEP, and the University of Miami) for producing and making their model output available. NOAA/NCEP, NOAA/CTB, and NOAA/CPO jointly provided coordinating support and led the development of the NMME-Phase II system. We thank the members of the DiVar group of the University of Buenos Aires – CONICET, Argentina, for their valuable comments during the development of this research.
This research has been supported by the Agencia Nacional de Promoción Científica y Tecnológica (grant no. PICT-2021-GRF-TI-00498), the Universidad de Buenos Aires (grant no. 20020220100075BA), the Belmont Forum (grant no. ANR-15-JCL/-0002-01), and the Consejo Nacional de Investigaciones Científicas y Técnicas (CONICET) (grant no. PIP 11220200102038CO). Luciano Gustavo Andrian is supported by a fellowship grant from CONICET.
This paper was edited by Tim Woollings and reviewed by two anonymous referees.
Andrian, L. G.: LucianoAndrian/ENSO_IOD: Code_Andrian_etal_2024, Zenodo [code], https://doi.org/10.5281/zenodo.14014116, 2024. a
Cai, W., Rensch, P., Cowan, T., and Hendon, H.: Teleconnection Pathways of ENSO and the IOD and the Mechanisms for Impacts on Australian Rainfall, J. Climate, 24, 3910–3923, https://doi.org/10.1175/2011JCLI4129.1, 2011. a, b, c, d, e, f, g, h, i, j, k, l, m, n
Cai, W., Rensch, P., Cowan, T., and Hendon, H.: An Asymmetry in the IOD and ENSO Teleconnection Pathway and Its Impact on Australian Climate, J. Climate, 25, 6318–6329, https://doi.org/10.1175/JCLI-D-11-00501.1, 2012. a, b, c, d, e, f
Cai, W., Zheng, X.-T., Weller, E., Collins, M., Cowan, T., Lengaigne, M., Yu, W., and Yamagata, T.: Projected response of the Indian Ocean Dipole to greenhouse warming, Nat. Geosci., 6, 999–1007, 2013. a, b, c
Cai, W., McPhaden, M., Grimm, A., Rodrigues, R., Taschetto, A., Garreaud, R., Dewitte, B., Poveda, G., Ham, Y.-G., Santoso, A., Ng, B., Anderson, W., Wang, G., Geng, T., Jo, H.-S., Marengo, J., Alves, L., Osman, M., Li, S., and Vera, C.: Climate impacts of the El Niño–Southern Oscillation on South America, Nature Reviews Earth & Environment, 1, 215–231, https://doi.org/10.1038/s43017-020-0040-3, 2020. a, b
Chan, S., Behera, S., and Yamagata, T.: Indian Ocean Dipole influence on South American rainfall, Geophys. Res. Lett., 35, L14S12, https://doi.org/10.1029/2008GL034204, 2008. a, b, c
CRU: CRU TS v. 4.08, CRU [data set], https://crudata.uea.ac.uk/cru/data/hrg/cru_ts_4.05/ (last access: 30 October 2024), 2024. a
Fan, L., Liu, Q., Wang, C., and Guo, F.: Indian Ocean Dipole Modes Associated with Different Types of ENSO Development, J. Climate, 30, 2233–2249, https://doi.org/10.1175/JCLI-D-16-0426.1, 2016. a
Gillett, Z., Hendon, H., Arblaster, J., Lin, H., and Fuchs, D.: On the Dynamics of Indian Ocean Teleconnections into the Southern Hemisphere during Austral Winter, J. Atmos. Sci., 79, 2453–2469, https://doi.org/10.1175/JAS-D-21-0206.1, 2022. a, b, c
Harris, I., Osborn, T., Jones, P., and Lister, D.: Version 4 of the CRU TS monthly high-resolution gridded multivariate climate dataset, Scientific Data, 7, 109, https://doi.org/10.1038/s41597-020-0453-3, 2020. a
Hersbach, H., Bell, B., Berrisford, P., Hirahara, S., Horányi, A., Muñoz Sabater, J., Nicolas, J., Peubey, C., Radu, R., Schepers, D., Simmons, A., Soci, C., Abdalla, S., Abellan, X., Balsamo, G., Bechtold, P., Biavati, G., Bidlot, J., Bonavita, M., and Thépaut, J.-N.: The ERA5 global reanalysis, Q. J. Roy. Meteor. Soc., 146, 1999–2049, https://doi.org/10.1002/qj.3803, 2020. a
Hersbach, H., Bell, B., Berrisford, P., Biavati, G., Horányi, A., Muñoz Sabater, J., Nicolas, J., Peubey, C., Radu, R., Rozum, I., Schepers, D., Simmons, A., Soci, C., Dee, D., and Thépaut, J.-N.: ERA5 monthly averaged data on single levels from 1940 to present, Copernicus Climate Change Service (C3S) Climate Data Store (CDS) [data set], https://doi.org/10.24381/cds.f17050d7, 2023. a
Holgate, C., Evans, J. P., Taschetto, A. S., Gupta, A. S., and Santoso, A.: The Impact of Interacting Climate Modes on East Australian Precipitation Moisture Sources, J. Climate, 35, 3147–3159, https://doi.org/10.1175/JCLI-D-21-0750.1, 2022. a
Hong, C.-C., Li, T., LinHo, and Kug, J.-S.: Asymmetry of the Indian Ocean Dipole. Part I: Observational Analysis, J. Climate, 21, 4834–4848, https://doi.org/10.1175/2008JCLI2222.1, 2008. a, b
Huang, B., Thorne, P. W., Banzon, V. F., Boyer, T., Chepurin, G., Lawrimore, J. H., Menne, M. J., Smith, T. M., Vose, R. S., and Zhang, H.-M.: Extended Reconstructed Sea Surface Temperature, Version 5 (ERSSTv5): Upgrades, Validations, and Intercomparisons, J. Climate, 30, 8179–8205, https://doi.org/10.1175/JCLI-D-16-0836.1, 2017. a
IRI: CFSv2 model hindcast and real-time prediction data, IRI [data set], https://iridl.ldeo.columbia.edu/SOURCES/.Models/.NMME/.NCEP-CFSv2/, (last access: 30 October 2024), 2024. a
Karoly, D. J.: Southern Hemisphere Circulation Features Associated with El Niño-Southern Oscillation Events, J. Climate, 2, 1239–1252, https://doi.org/10.1175/1520-0442(1989)002<1239:SHCFAW>2.0.CO;2, 1989. a
Kiladis, G. N.: Observations of Rossby Waves Linked to Convection over the Eastern Tropical Pacific, J. Atmos. Sci., 55, 321–339, https://doi.org/10.1175/1520-0469(1998)055<0321:OORWLT>2.0.CO;2, 1998. a
Kumar, A. and Chen, M.: What is the variability in US west coast winter precipitation during strong El Niño events?, Clim. Dynam., 49, 2789–2802, https://doi.org/10.1007/s00382-016-3485-9, 2017. a, b, c
Kumar, A., Chen, M., Zhang, L., Wang, W., Xue, Y., Wen, C., Marx, L., and Huang, B.: An Analysis of the Nonstationarity in the Bias of Sea Surface Temperature Forecasts for the NCEP Climate Forecast System (CFS) Version 2, Mon. Weather Rev., 140, 3003–3016, https://doi.org/10.1175/MWR-D-11-00335.1, 2012. a
Liguori, G., Mcgregor, S., Singh, M., Arblaster, J., and Di Lorenzo, E.: Revisiting ENSO and IOD contributions to Australian Precipitation, Geophys. Res. Lett., 49, e2021GL094295, https://doi.org/10.1029/2021GL094295, 2022. a, b
McIntosh, P. and Hendon, H.: Understanding Rossby wave trains forced by the Indian Ocean Dipole, Clim. Dynam., 50, 2783–2798, https://doi.org/10.1007/s00382-017-3771-1, 2018. a, b
Mo, K.: Relationships between Low-Frequency Variability in the Southern Hemisphere and Sea Surface Temperature Anomalies, J. Climate, 13, 3599–3610, https://doi.org/10.1175/1520-0442(2000)013<3599:RBLFVI>2.0.CO;2, 2000. a, b
Muller, G. V., Fernández Long, M. E., and Bosch, E.: Relación entre la temperatura de la superficie del mar de diferentes océanos y los rendimientos de maíz en la Pampa Húmeda, Meteorológica, 40, 5–16, 2015. a
Osman, M. and Vera, C.: Climate predictability and prediction skill on seasonal time scales over South America from CHFP models, Clim. Dynam., 49, 2365–2383, https://doi.org/10.1007/s00382-016-3444-5, 2017. a
Osman, M., Shepherd, T., and Vera, C.: The combined influence of the stratospheric polar vortex and ENSO on zonal asymmetries in the southern hemisphere upper tropospheric circulation during austral spring and summer, Clim. Dynam., 59, 2949–2964, https://doi.org/10.1007/s00382-022-06225-0, 2022. a
Saha, S., Moorthi, S., Wu, X., Wang, J., Nadiga, S., Tripp, P., Behringer, D., Hou, Y.-T., Chuang, H.-Y., Iredell, M., Ek, M., Meng, J., Yang, R., Peña, M., Dool, H., Zhang, Q., Wang, W., Chen, M., and Becker, E.: The NCEP climate forecast system version 2, J. Climate, 27, 2185–2208, https://doi.org/10.1175/JCLI-D-12-00823.1, 2014. a, b
Saji, H. and Yamagata, T.: Structure of SST and Surface Wind Variability during Indian Ocean Dipole Mode Events: COADS Observations, J. Climate, 16, 2735–2751, https://doi.org/10.1175/1520-0442(2003)016<2735:SOSASW>2.0.CO;2, 2003a. a, b, c, d
Saji, H. and Yamagata, T.: Possible impacts of Indian Ocean Dipole Mode events on global climate, Clim. Res., 25, 151–169, https://doi.org/10.3354/cr025151, 2003b. a, b, c, d
Saji, H., Goswami, B. N., Vinayachandran, P., and Yamagata, T.: A dipole mode in the Tropical Indian Ocean, Nature, 401, 360–363, https://doi.org/10.1038/43854, 1999. a, b
Saji, H., Ambrizzi, T., and Ferraz, S.: Indian Ocean Dipole mode events and austral surface air temperature anomalies, Dynam. Atmos. Oceans, 39, 87–101, https://doi.org/10.1016/j.dynatmoce.2004.10.015, 2005. a, b, c, d, e
Schneider, U., Becker, A., Finger, P., Rustemeier, E., and Ziese, M.: GPCC Full Data Monthly Version 2020 at 0.25°: Monthly Land-Surface Precipitation from Rain-Gauges built on GTS-based and Historic Data, DWD [data set], https://doi.org/10.5676/DWD_GPCC/FD_M_V2020_025, 2020. a, b
Sena, A. C. T. and Magnusdottir, G.: Influence of the Indian Ocean Dipole on the Large-Scale Circulation in South America, J. Climate, 34, 6057–6068, https://doi.org/10.1175/JCLI-D-20-0669.1, 2021. a
Stuecker, M. F., Timmermann, A., Jin, F.-F., Chikamoto, Y., Zhang, W., Wittenberg, A. T., Widiasih, E., and Zhao, S.: Revisiting ENSO/Indian Ocean Dipole phase relationships, Geophys. Res. Lett., 44, 2481–2492, https://doi.org/10.1002/2016GL072308, 2017. a
Sun, S., Lan, J., Fang, Y., Tana, C., and Gao, X.: A Triggering Mechanism for the Indian Ocean Dipoles Independent of ENSO, J. Climate, 28, 5063–5076, https://doi.org/10.1175/JCLI-D-14-00580.1, 2015. a
Takaya, K. and Nakamura, H.: A Formulation of a Phase-Independent Wave-Activity Flux for Stationary and Migratory Quasigeostrophic Eddies on a Zonally Varying Basic Flow, J. Atmos. Sci., 58, 608–627, https://doi.org/10.1175/1520-0469(2001)058<0608:AFOAPI>2.0.CO;2, 2001. a
Ummenhofer, C., England, M., McIntosh, P., Meyers, G., Pook, M., Risbey, J., Sen Gupta, A., and Taschetto, A.: What causes Southeast Australia's worst droughts?, Geophys. Res. Lett., 36, L04706, https://doi.org/10.1029/2008GL036801, 2009. a
Vinayachandran, P., Francis, P., and Rao, S.: Indian Ocean dipole: processes and impacts, Current Trends in Science, 46, 569–589, 2010. a
Wang, H., Kumar, A., Murtugudde, R., Narapusetty, B., and Seip, K.: Covariations between the Indian Ocean dipole and ENSO: a modeling study, Clim. Dynam., 53, 5743–5761, https://doi.org/10.1007/s00382-019-04895-x, 2019. a
Yuan, C. and Yamagata, T.: Impacts of IOD, ENSO and ENSO Modoki on the Australian Winter Wheat Yields in Recent Decades, Sci. Rep., 5, 17252, https://doi.org/10.1038/srep17252, 2015. a
Zhao, S., Jin, F., and Stuecker, M.: Improved Predictability of the Indian Ocean Dipole Using Seasonally Modulated ENSO Forcing Forecasts, Geophys. Res. Lett., 46, 9980–9990, https://doi.org/10.1029/2019GL084196, 2019. a


