the Creative Commons Attribution 4.0 License.
the Creative Commons Attribution 4.0 License.
 | 08 Feb 2024
Linking Gulf Stream air–sea interactions to the exceptional blocking episode in February 2019: a Lagrangian perspective
Christian M. Grams
Lukas Papritz
Marc Federer
The development of atmospheric blocks over the North Atlantic–European region can lead to extreme weather events like heat waves or cold air outbreaks. Despite their potential severe impact on surface weather, the correct prediction of blocking lifecycles remains a key challenge in current numerical weather prediction (NWP) models. Increasing evidence suggests that latent heat release in cyclones, the advection of cold air (cold air outbreaks, CAOs) from the Arctic over the North Atlantic, and associated air–sea interactions over the Gulf Stream are key processes contributing to the onset, maintenance, and persistence of such flow regimes. To better understand the mechanism connecting air–sea interactions over the Gulf Stream with changes in the large-scale flow, we focus on an episode between 20 and 27 February 2019, when a quasi-stationary upper-level ridge was established over western Europe accompanied by an intensified storm track in the northwestern North Atlantic. During that time, a record-breaking winter warm spell occurred over western Europe bringing temperatures above 20 ∘C to the United Kingdom, the Netherlands, and northern France. The event was preceded and accompanied by the development of several rapidly intensifying cyclones that originated in the Gulf Stream region and traversed the North Atlantic. To explore the mechanistic linkage between the formation of this block and air–sea interactions over the Gulf Stream, we adopt a Lagrangian perspective, using kinematic trajectories. This allows us to study the pathways and transformations of air masses that form the upper-level potential vorticity anomaly and interact with the ocean front. We establish that more than one-fifth of these air masses interact with the Gulf Stream in the lower troposphere, experiencing intense heating and moistening over the region due to the frequent occurrence of CAOs behind the cold front of the cyclones. Trajectories moistened by the advection of cold air over a warm ocean by one cyclone later ascend into the upper troposphere with the ascending airstream of a subsequent cyclone, fueled by the strong surface fluxes. These findings highlight the importance of CAOs in the Gulf Stream region, indicating that their intense coupling between the ocean and atmosphere plays a role in block development. Additionally, they provide a mechanistic pathway linking air–sea interactions in the lower troposphere and the upper-level flow.
- Article
(18809 KB) - Full-text XML
-
Supplement
(219839 KB) - BibTeX
- EndNote


Atmospheric blocks are quasi-stationary anticyclonic circulation anomalies disrupting the eastward propagation of synoptic weather systems. The associated surface high-pressure system can dominate the weather over a particular location for an extended period of time, from several days to weeks (Wazneh et al., 2021), and lead to the development of extreme weather, like cold spells (e.g., de'Donato et al., 2013; Demirtaş, 2017; Pang et al., 2020; Zhuo et al., 2022) and heat waves (e.g., Grumm, 2011; Barriopedro et al., 2011; Spensberger et al., 2020; Dae et al., 2022; Kautz et al., 2022) with significant socioeconomic impacts. Despite the ongoing development and increasing resolution of numerical climate and weather prediction models, the correct prediction of those quasi-stationary weather patterns still poses a challenge (Matsueda and Palmer, 2018; Ferranti et al., 2018; Grams et al., 2018; Büeler et al., 2021).
The dynamics of cyclones and blocking anticyclones are mutually linked with the position and tilt of the upper-tropospheric jet. The crucial role of cyclones in the formation and maintenance of the blocks has been established by multiple studies (e.g., Colucci, 1985; Colucci and Alberta, 1996; Lupo and Smith, 1995; Nakamura and Wallace, 1993; Mullen, 1987; Yamazaki and Itoh, 2009). The development of cyclones results in the cross-isentropic ascent of air from the lower to the upper troposphere, in the so-called warm conveyor belt (WCB; Wernli and Davies, 1997; Madonna et al., 2014; Pfahl et al., 2014). Condensation and resulting latent heat release during the ascent are critical for both cyclone intensification, through the production of potential vorticity (PV) below the level of maximum heating (Binder et al., 2016; Reed et al., 1992; Čampa and Wernli, 2012) and growth of the upper-level ridge due to the destruction of PV above the level of maximum heating (Methven, 2015; Madonna et al., 2014; Joos and Forbes, 2016; Grams et al., 2011). The injection of low-PV air into the upper troposphere together with diabatically enhanced divergent outflow amplifies and reinforces the upper-tropospheric ridge (Grams et al., 2011; Teubler and Riemer, 2016; Grams and Archambault, 2016; Steinfeld and Pfahl, 2019). Diabatic processes, as recently quantified by Pfahl et al. (2015), Steinfeld and Pfahl (2019), Steinfeld et al. (2020), and Yamamoto et al. (2021) are in many cases essential for the development of blocks in the North Atlantic–European region. In fact, recent studies indicate that the duration, strength, and possibly even formation of the block are influenced by latent heat release in the ascending airstreams (Steinfeld et al., 2020; Pfahl et al., 2015).
The key role of moist dynamics in blocking formation and development suggests that a relationship exists between upstream, lower-tropospheric processes and the formation of the upper-level, quasi-stationary ridge. Recent studies suggest that during winter the moisture source locations of cyclone precipitation are fairly local and over the ocean (Pfahl et al., 2014; Papritz et al., 2021). In the North Atlantic, the most intense evaporation events are associated with the Gulf Stream (Aemisegger and Papritz, 2018). The propagation of cyclones across the Gulf Stream region provides conditions for large surface latent and sensible heat fluxes (Tilinina et al., 2018; Moore and Renfrew, 2002) due to the development of cold air outbreaks (CAOs) and the descent of dry air in the cold sector (Vannière et al., 2017b; Raveh-Rubin, 2017; Aemisegger and Papritz, 2018). The warm waters of the Gulf Stream have been identified by Papritz et al. (2021) as a primary moisture source for cyclone-related precipitation in the North Atlantic. Papritz et al. (2021) demonstrated also that air masses moistened and heated in the cold sector of one cyclone are then brought into the warm sector of the consecutive cyclone through a cyclone relative flow, called feeder airstream (Dacre et al., 2019). This type of cyclone–cyclone interaction has been previously identified by Sodemann and Stohl (2013) and termed a “hand-over” mechanism. Furthermore, Boutle et al. (2011) support this understanding, having established that the moisture adjustment timescale in the boundary layer is approximately 2.3 d. Moreover, intense turbulent heat fluxes during CAO events also play a crucial role in the restoration of baroclinicity in the lower troposphere (Papritz and Spengler, 2015; Vannière et al., 2017b) and precondition the atmosphere for the development of consecutive low-pressure systems (Tilinina et al., 2018; Papritz et al., 2021; Vannière et al., 2017a). In consequence, CAOs are important for cyclone development and hence potentially affect downstream large-scale dynamics (Papritz and Grams, 2018).
Previous studies demonstrated that intense heat transfer in the regions of western boundary currents influences the position of the storm tracks (Kwon et al., 2010; Shaw et al., 2016) and plays an important role in the upper-level jet variability (Nakamura et al., 2008). In fact, Kwon et al. (2010) found in their modeling study that the absence of the Gulf Stream sea surface temperature (SST) gradient results in a reduced frequency of blocks downstream. Furthermore, O'Reilly et al. (2017) determined that wintertime poleward displacements of the jet stream are preceded by high eddy heat fluxes over the Gulf Stream and western North Atlantic. The mechanism behind those displacements is explained by Novak et al. (2015) and Kwon et al. (2020), who showed that the shift in the upper-level flow is caused by the northward shift in eddy heat flux in the lower troposphere. An increasing number of studies also indicate that the Gulf Stream region might serve as a moisture source for air masses ascending into the blocking regions. Yamamoto et al. (2021), using a 31-year climatology of backward air trajectories starting from the upper-level North Atlantic–European blocks, found that the Atlantic basin provides most of the moisture for the moist air masses ascending into the block. Moreover, they established that trajectories that gather moisture from the ocean follow the path of the Gulf Stream and identified the region of the SST gradient in the western North Atlantic as the region where trajectories ascend to the upper troposphere. Those results are also in agreement with the findings of Pfahl et al. (2014), who determined that moisture supplies for WCBs are collocated with the regions of intense ocean evaporation in the western North Atlantic.
Throughout the literature, researchers have established the importance of ocean–atmosphere coupling over the Gulf Stream and its relevance for downstream large-scale dynamics (e.g., Vannière et al., 2017b; Sheldon et al., 2017; Papritz and Spengler, 2015). However, the scientific community has yet to gain a clear understanding of the physical pathway through which signals from individual processes in the marine boundary layer are conveyed to the large-scale circulation (Czaja et al., 2019). In this study, we propose a possible explanation for this missing mechanistic link by conducting a case study of European blocking from February 2019. This event brought record-breaking winter “heat” to western Europe and was accompanied by a series of upstream, rapidly intensifying cyclones. We investigate the potential connections between air–sea interactions over the Gulf Stream region and the formation of an upper-level ridge over western Europe using a Lagrangian perspective in a synoptic analysis. The paper is structured as follows. First, we provide a detailed description of the data and methods, including trajectory calculations (Sect. 2). Second, we introduce the European blocking case study of February 2019 (Sect. 3.1). In the subsequent section, we provide a detailed description of our analysis results, examining the characteristics of air masses that interact with the Gulf Stream and assessing their links to cold air outbreaks and cyclones (Sect. 3.2). Then, we analyze the moisture sources and transport paths of the air ascending into the block (Sect. 3.3). Finally, we discuss our findings and establish a connection between air–sea interactions over the Gulf Stream, cyclone development, and the potential influence of these air masses on atmospheric blocking events.
2.1 Data
2.1.1 ERA5 reanalysis
The calculation of kinematic trajectories and the analyses presented in this study are based on the European Center for Medium-Range Weather Forecasts (ECMWF) reanalysis – ERA5 (Hersbach et al., 2020). For most of the study, we use reanalysis data at the 3-hourly temporal resolution, interpolated on a horizontal grid. In addition, we employ ERA5 data with a higher temporal resolution of 1 h for the investigation of cyclone tracks (Sect. 2.1.2), the vertical and horizontal distribution of negative potential vorticity, potential temperature, and the cloud liquid water content (Appendix A). We chose the lower 98σ vertical pressure levels out of a total of 137 available levels for our investigation, covering the pressure range from ∼26 hPa to the surface. The analyzed data cover the period from 10 to 28 February 2019.
2.1.2 Cyclone dataset
The cyclone tracks are obtained using the method of Sprenger (2017) and Wernli and Schwierz (2006), based on the identification and tracking of sea level pressure (SLP) minima, defined as the grid points with an SLP value lower than at all the neighboring grid points (eight in our case). In addition, the cyclone extent is determined by the outermost closed SLP contour surrounding the identified SLP minimum. This is limited to areas beyond 25∘ N/S, with a contour circumference cap at 7500 km. This approach ensures the exclusion of SLP minima linked to tropical convection and overly extensive cyclone masks that encompass multiple cyclones. The tracking algorithm is applied to hourly fields of SLP from ERA5 reanalysis. Rapidly intensifying cyclones are identified using the criterion of Sanders and Gyakum (1980) of a central pressure drop of at least 24 hPa within 24 h. This criterion is further normalized using the factor , where ϕ represents the average latitude of the cyclone's center during the given time span.
2.1.3 Identification of the block and upper-tropospheric negative potential vorticity anomalies
The European block in February 2019 is identified using the year-round weather regime definition of Grams et al. (2017) for the North Atlantic–European region. The block is characterized by a positive geopotential height anomaly over the eastern North Atlantic and Europe and a negative geopotential height anomaly upstream over Greenland. The methodology for identifying specific weather regimes is described in detail in Grams et al. (2017) and Hauser et al. (2023).
The formation of the atmospheric block in the Euro-Atlantic region is associated with the poleward advection of low-PV air. The accumulation of low-PV air in the upper troposphere leads to the development of negative potential vorticity anomalies (NPVAs; Teubler and Riemer, 2016), which amplify the upper-level ridge. In our study, we use the method of Hauser et al. (2023) to identify NPVAs in the ERA5 dataset. First, the deviations of PV from a 30 d running mean climatology (1979–2019) centered on the day of interest are calculated. Then, vertical averages of obtained values between 500 and 150 hPa are computed and labeled as NPVA objects if they fall below the threshold of −0.8 PVU. In the next step, a quasi-Lagrangian framework is employed to follow the evolution of NPVAs and assign them to the lifecycle of the European block in February 2019. NPVAs are assigned to an active weather regime (European block) based on their spatial overlap with a predefined regime mask. The mask is defined as the area where the vertical average PV anomaly of the composite for the respective weather regime is below −0.3 PVU. The composite is determined by averaging the PV between 500 and 150 hPa during the active phase of a weather regime (in our case European block, as defined by Grams et al., 2017). If there is at least a 10 % overlap between a NPVA and this mask during an active phase, we associate it with that specific regime's lifecycle. Note that a single regime can sometimes be influenced by several NPVAs.
The formation of the studied block was related to one major NPVA which formed 10 d prior to blocking onset, as well as another minor NPVA that appeared on 23 February over Greenland (Fig. 2). The major NPVA originated in the North Pacific and started to strengthen a few days before the block onset when it propagated into the North Atlantic. For the purpose of the present study, we neglect the NPVAs' lifecycle prior to their arrival in the North Atlantic region.
2.1.4 Identification of cold air outbreaks
Cold air outbreaks (CAO) in the ERA5 dataset are identified using the method of Papritz et al. (2015). First, the air–sea potential temperature difference between θSST−θ850 is calculated, where θSST denotes sea surface potential temperature and θ850 air potential temperature at 850 hPa. The reference pressure p0=1000 hPa is used for the calculation of surface potential temperature. In agreement with Papritz et al. (2015), we require the θSST−θ850 over the ocean to exceed 0 K to identify the CAO events.
To determine if a trajectory (Sect. 2.2) is a part of a CAO, we consider θSST−θ, where θ is the air parcel potential temperature (see Papritz and Spengler, 2017). If the potential temperature of an air parcel (at a pressure greater than 850 hPa) is lower than the SST beneath it, we classify the trajectory as a CAO trajectory.
2.2 Trajectory datasets
The LAGRANTO analysis tool (LAGRANTO Sprenger and Wernli, 2015) is employed to calculate kinematic trajectories, using three-dimensional wind on model levels from the ERA5 dataset described above. Output positions of trajectories are available in 3-hourly intervals, and the following variables are traced along the trajectories: pressure height (p), temperature (T), specific humidity (Q), potential vorticity (PV), potential temperature (θ), surface pressure (PS), surface latent heat flux (SLHF), surface sensible heat flux (SSHF), boundary layer height (BLH), and sea surface temperature (SST). We have created a primary trajectory dataset, termed NPVA base trajectories (Table 1). This dataset is further filtered in order to work out the relationship between the atmospheric block and air–sea interactions over the Gulf Stream (GS) and to examine the specific properties of the trajectories (Appendix A). The main trajectory subsets, which are crucial to this paper, are outlined in Table 1; relative fractions are shown in Table 2 and will be discussed in subsequent sections.
Table 1Overview of the trajectory subsets used in the study. The datasets primarily used in the study are highlighted in bold font.
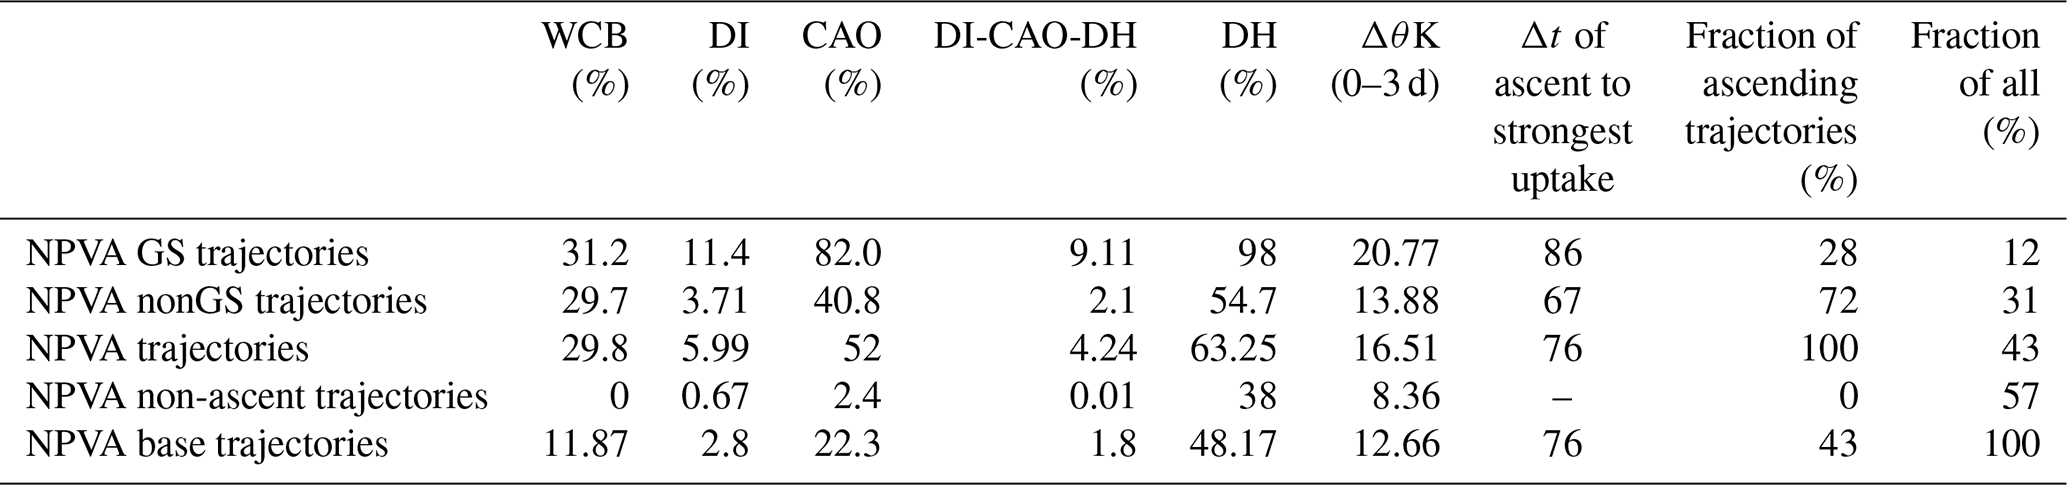
Table 2Fractions of various airstreams within the NPVA trajectories and the subsets created for the analysis presented in the article. WCB, DI, CAO, DI-CAO-DH, and DH refer to proportions within their own subset. For NPVA GS, NPVA nonGS, and NPVA trajectories “Fraction of ascending trajectories” refers to the proportion within NPVA trajectories, which are all ascending. “Fraction of all” denotes the proportion within the entire set of NPVA base trajectories. “ΔθK (0–3 d)” refers to the change in potential temperature (θ) within 3 d from the start of the trajectories. “Δt of ascent to strongest uptake” refers to the average time delay between the strongest uptake of trajectories and the time they start ascending later. See Sect. 3.2 for more details.
2.2.1 NPVA trajectories
The base trajectory dataset comprises 10 d backward trajectories starting from the upper-level NPVA objects (Sect. 2.1.3) every 3 h between 20 February at 09:00 UTC and 28 February at 12:00 UTC (NPVA base trajectories; Table 1). Those 10 d kinematic backward trajectories are initiated from equidistant grid points with a separation of 100 km between each point. Vertically, the starting points span from 500 to 150 hPa within both NPVAs, with an interval of Δp=25 hPa. To avoid the possibility of trajectory double-counting, we remove those that remain for two consecutive time steps within the starting grid of the NPVA. This filtering technique removes approximately 10 % of trajectories, ensuring that we do not count the same air mass multiple times.
In the consecutive analysis, the obtained trajectory dataset is refined as we apply additional selection criteria. To select only the ascending trajectories, we require trajectories to experience a pressure decrease of 500 hPa within 10 d prior to the arrival in the upper-level NPVA; hence the air parcel can ascend at any time and any rate (NPVA trajectories; Table 1). The threshold of 500 hPa is chosen to ensure that the trajectory has ascended all the way from the lower troposphere and is motivated by common criteria to identify WCB airstreams (e.g., Madonna et al., 2014). However, it is a bit weaker and allows ascending motion over a longer time span, enabling the analysis of ocean influence on the ascending air also independent of WCB activity. Approximately 43 % of the NPVA base trajectories experience such an ascent of 500 hPa before their arrival into the upper-level NPVA. Those ascending and filtered trajectories will be referred to throughout the following analysis as “NPVA trajectories” (Table 1).
For the ascending NPVA trajectories, we further refer to their inflow, ascent, and outflow stages. Therefore at a given time, we identify the position of air parcels from all trajectories with different trajectory starting times and group them into three distinct layers:
-
The inflow layers (p>800 hPa) is where air parcels remain within the lower troposphere, are modified by the underlying ocean while moving almost horizontally towards the frontal system, and later converge into the ascent region.
-
In the ascent layer ( hPa) air parcels ascend towards the upper troposphere in a relatively coherent airstream, undergoing condensation, latent heat release, and precipitation.
-
The outflow layer (p<400 hPa) is where the air parcels stop ascending in a coherent airstream and start diverging in the upper troposphere.
This classification is based on methods often used to characterize WCB airstreams, as outlined in studies of, for example, Schäfler et al. (2014), Binder et al. (2020), Quinting and Grams (2022), and Pickl et al. (2023). It is important to add that the thresholds of 800 and 400 hPa used to define the different layers in this context are somewhat arbitrary and serve as general guidelines. Air parcels in the inflow layer, despite having pressures higher than 800 hPa, may already be ascending. Conversely, in the ascent layer, where pressures are below 800 hPa, some air parcels might still be advected towards the frontal system. Furthermore, while most air parcels with pressures below 400 hPa, typically in the outflow layer, are primarily advected horizontally, there are instances where they continue ascending into higher levels of the troposphere. Nevertheless, this method helps us to qualitatively differentiate between stages in the temporal evolution of air parcel trajectories.
2.2.2 NPVA GS trajectories
Taking into account the importance of the Gulf Stream for the selected study, we create an additional subset of trajectories consisting of only those NPVA trajectories that have passed over the Gulf Stream in the lower troposphere (NPVA GS; see Table 1). To identify NPVA GS trajectories, we define the boundary for the lower troposphere at 800 hPa, consistent with the upper boundary of the inflow layer (e.g., Binder et al., 2020). The region of the Gulf Stream (GS masks) is defined for every 3-hourly time step of the ERA5 dataset for February 2019 using the following steps: (i) first, the horizontal gradient of the SST is identified in both west–east and north–south directions; (ii) a threshold of K is applied to extract the area of the Gulf Stream SST front; and (iii) a buffer of 100 km is added to the identified gradient, creating a continuous region. The rest of the trajectories, i.e., those that did not interact with the atmospheric boundary layer (ABL) over the Gulf Stream, are labeled as “NPVA nonGS trajectories” (Table 1).
The NPVA GS and NPVA nonGS trajectories are split into their inflow, ascent, and outflow stages (as described in Sect. 2.2.1). Furthermore, for each trajectory within the NPVA GS and NPVA nonGS datasets, we pinpoint the onset of ascent. This specific moment is identified when the trajectory's pressure first drops below 800 hPa. After this, the trajectory consistently rises until it reaches the upper troposphere, marked by pressures falling below 500 hPa.
2.3 Moisture source identification
The method of Sodemann et al. (2008) is applied for the purpose of moisture source identification. In this approach, a specific humidity change along a trajectory is considered an uptake if the specific humidity difference between two time steps (difference of 3 h) exceeds 0.02 g kg−1. Each uptake is given a weight based on all consecutive changes in the specific humidity along the trajectory. This means that the contribution of each uptake is adjusted by considering precipitation events en route and subsequent uptakes. This method has been widely recognized as appropriate for the identification of moisture sources and used in a number of other studies (e.g., Papritz et al., 2021; Xin et al., 2022; Jullien et al., 2020; Aemisegger and Papritz, 2018).
This method is applied to both the NPVA GS and the NPVA nonGS trajectories to identify the sources of moisture present at the start of the ascent. The use of the start of the trajectory's ascent as a reference time for the moisture diagnostic allows us to identify the sources of moisture contributing to latent heat release during an air parcel's upward movement. For the purpose of this analysis, every backward NPVA trajectory (NPVA GS and NPVA nonGS, Table 1) is extended another 10 d backward from the time when the ascent started.
3.1 The European blocking heat wave of 2019
The European blocking event in February 2019 lasted for about 7 d, from 20 to 27 February. The duration of this event was below the average for winter block events in the Northern Hemisphere (Wazneh et al., 2021). However, it was accompanied by record high temperatures for this month in France, the Netherlands, and the United Kingdom (Young and Galvin, 2020) with 2 m temperature anomalies in western Europe exceeding +10 ∘C (Fig. 1). This exceptional, wintertime heat wave was linked to the formation of a quasi-stationary upper-level ridge, which brought southerly airflow and clear skies to western Europe (Leach et al., 2021).
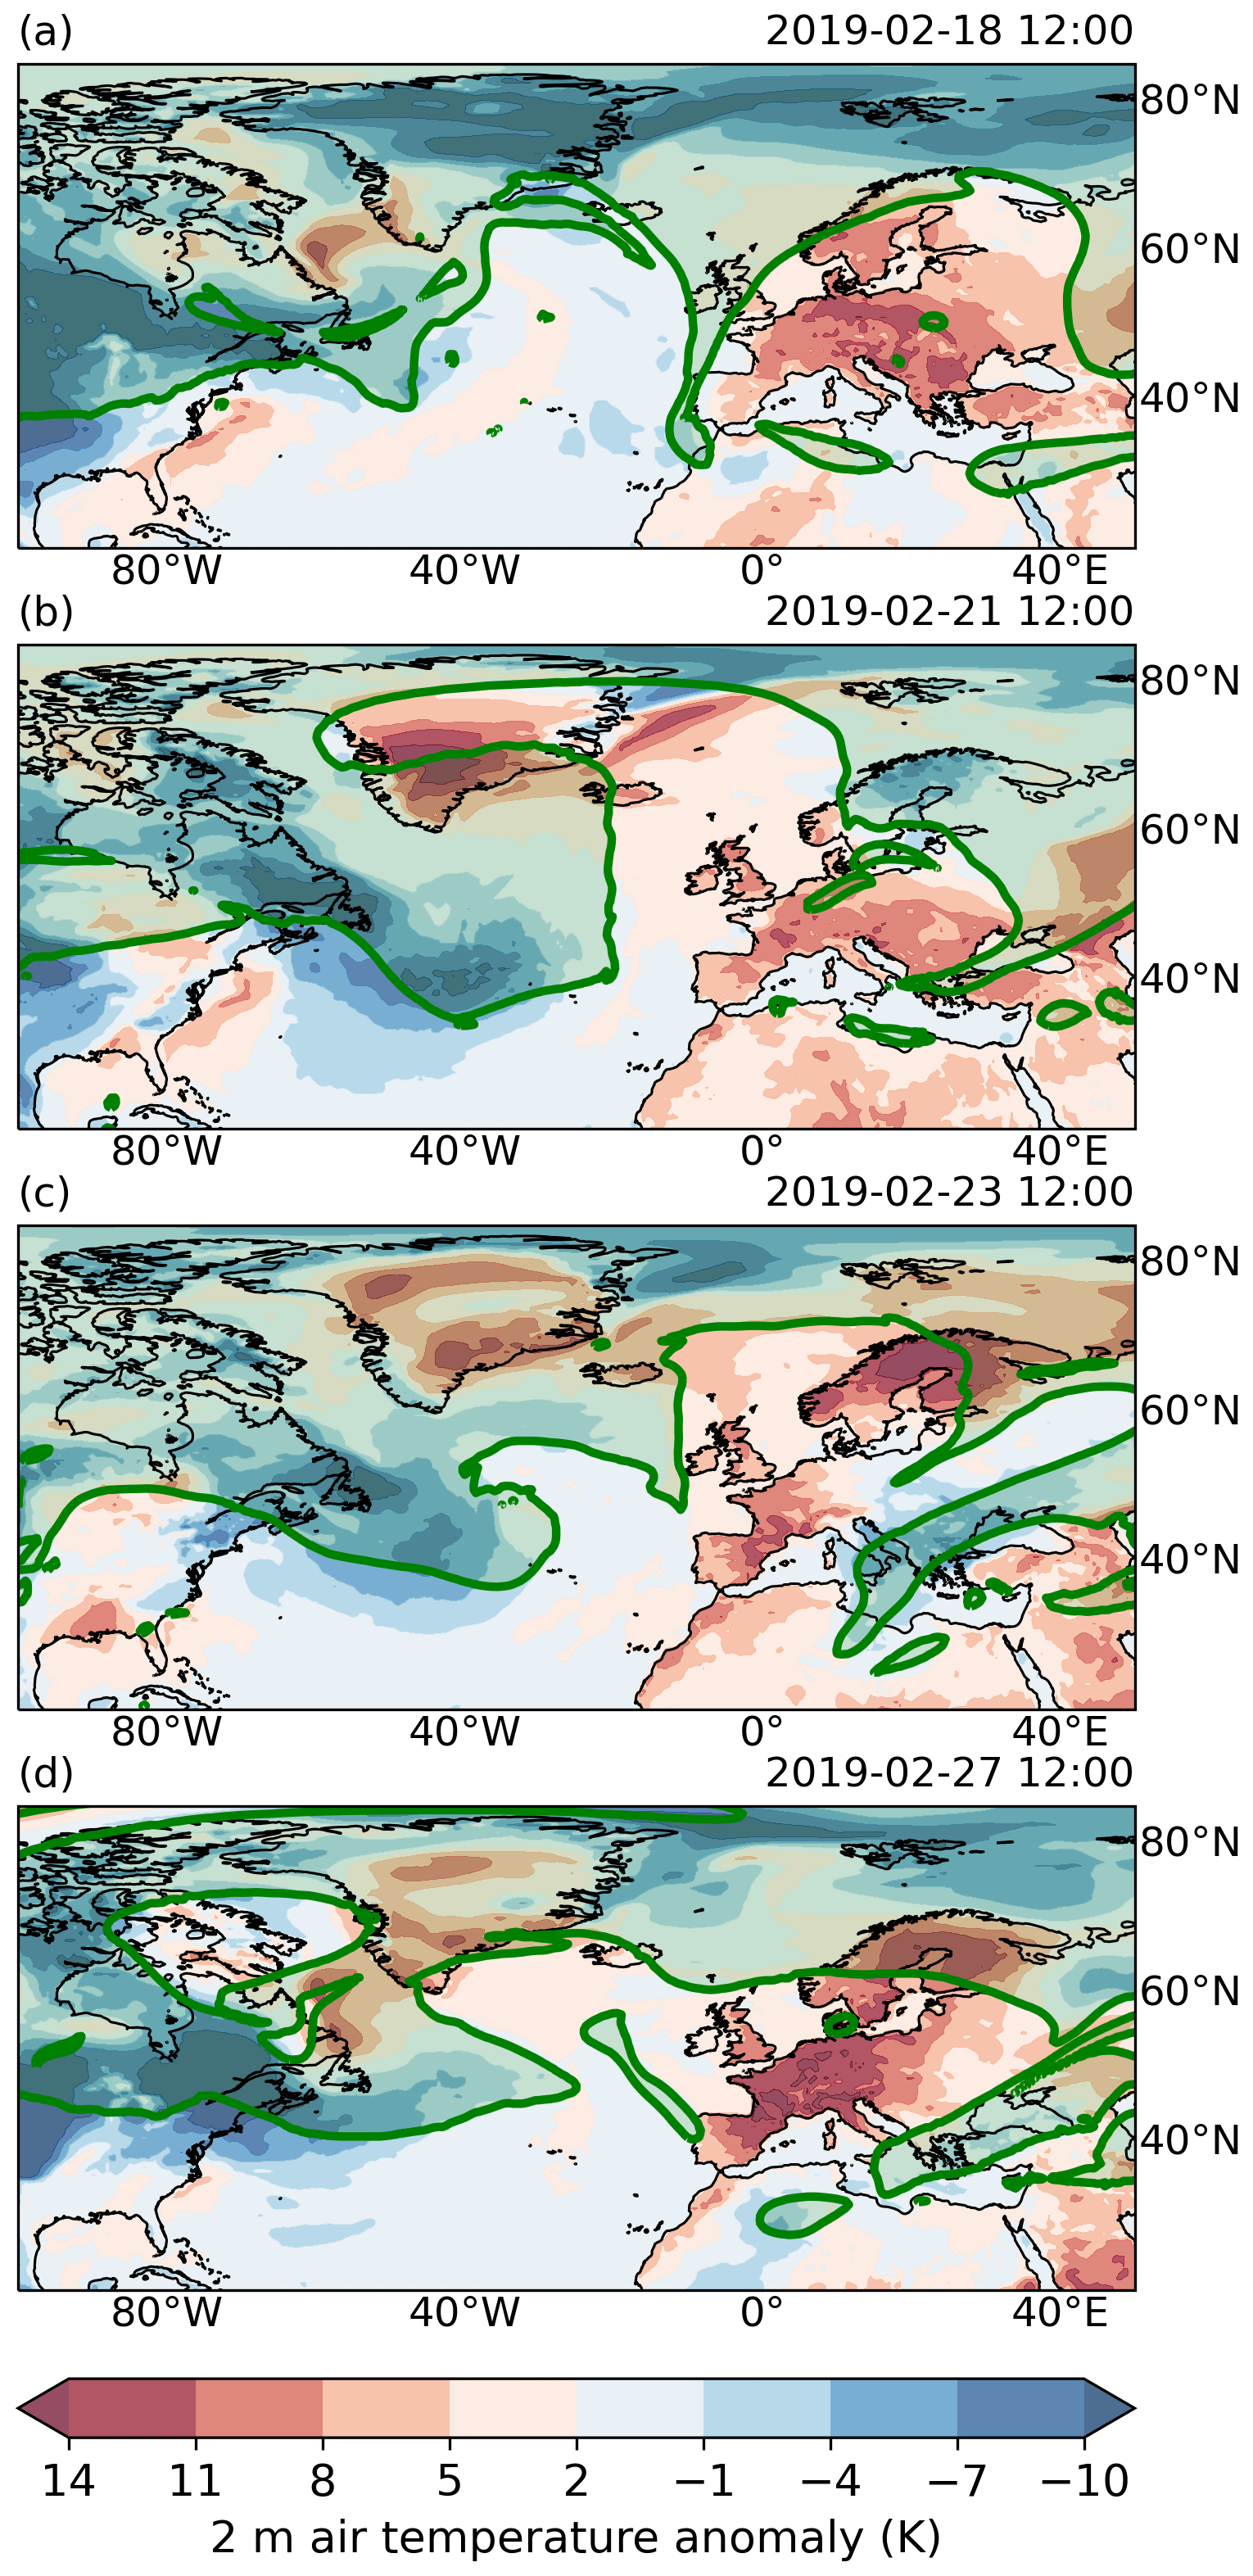
Figure 1The 2 m temperature anomalies (with respect to a 30 d running mean, shading) and upper-level 2 PVU contour at 315 K (green line), with PV values higher than 2 PVU shaded in green. Panels are for 12:00 UTC on 18 February 2019 (a), 21 February 2019 (b), 23 February 2019 (c), and 27 February 2019 (d).
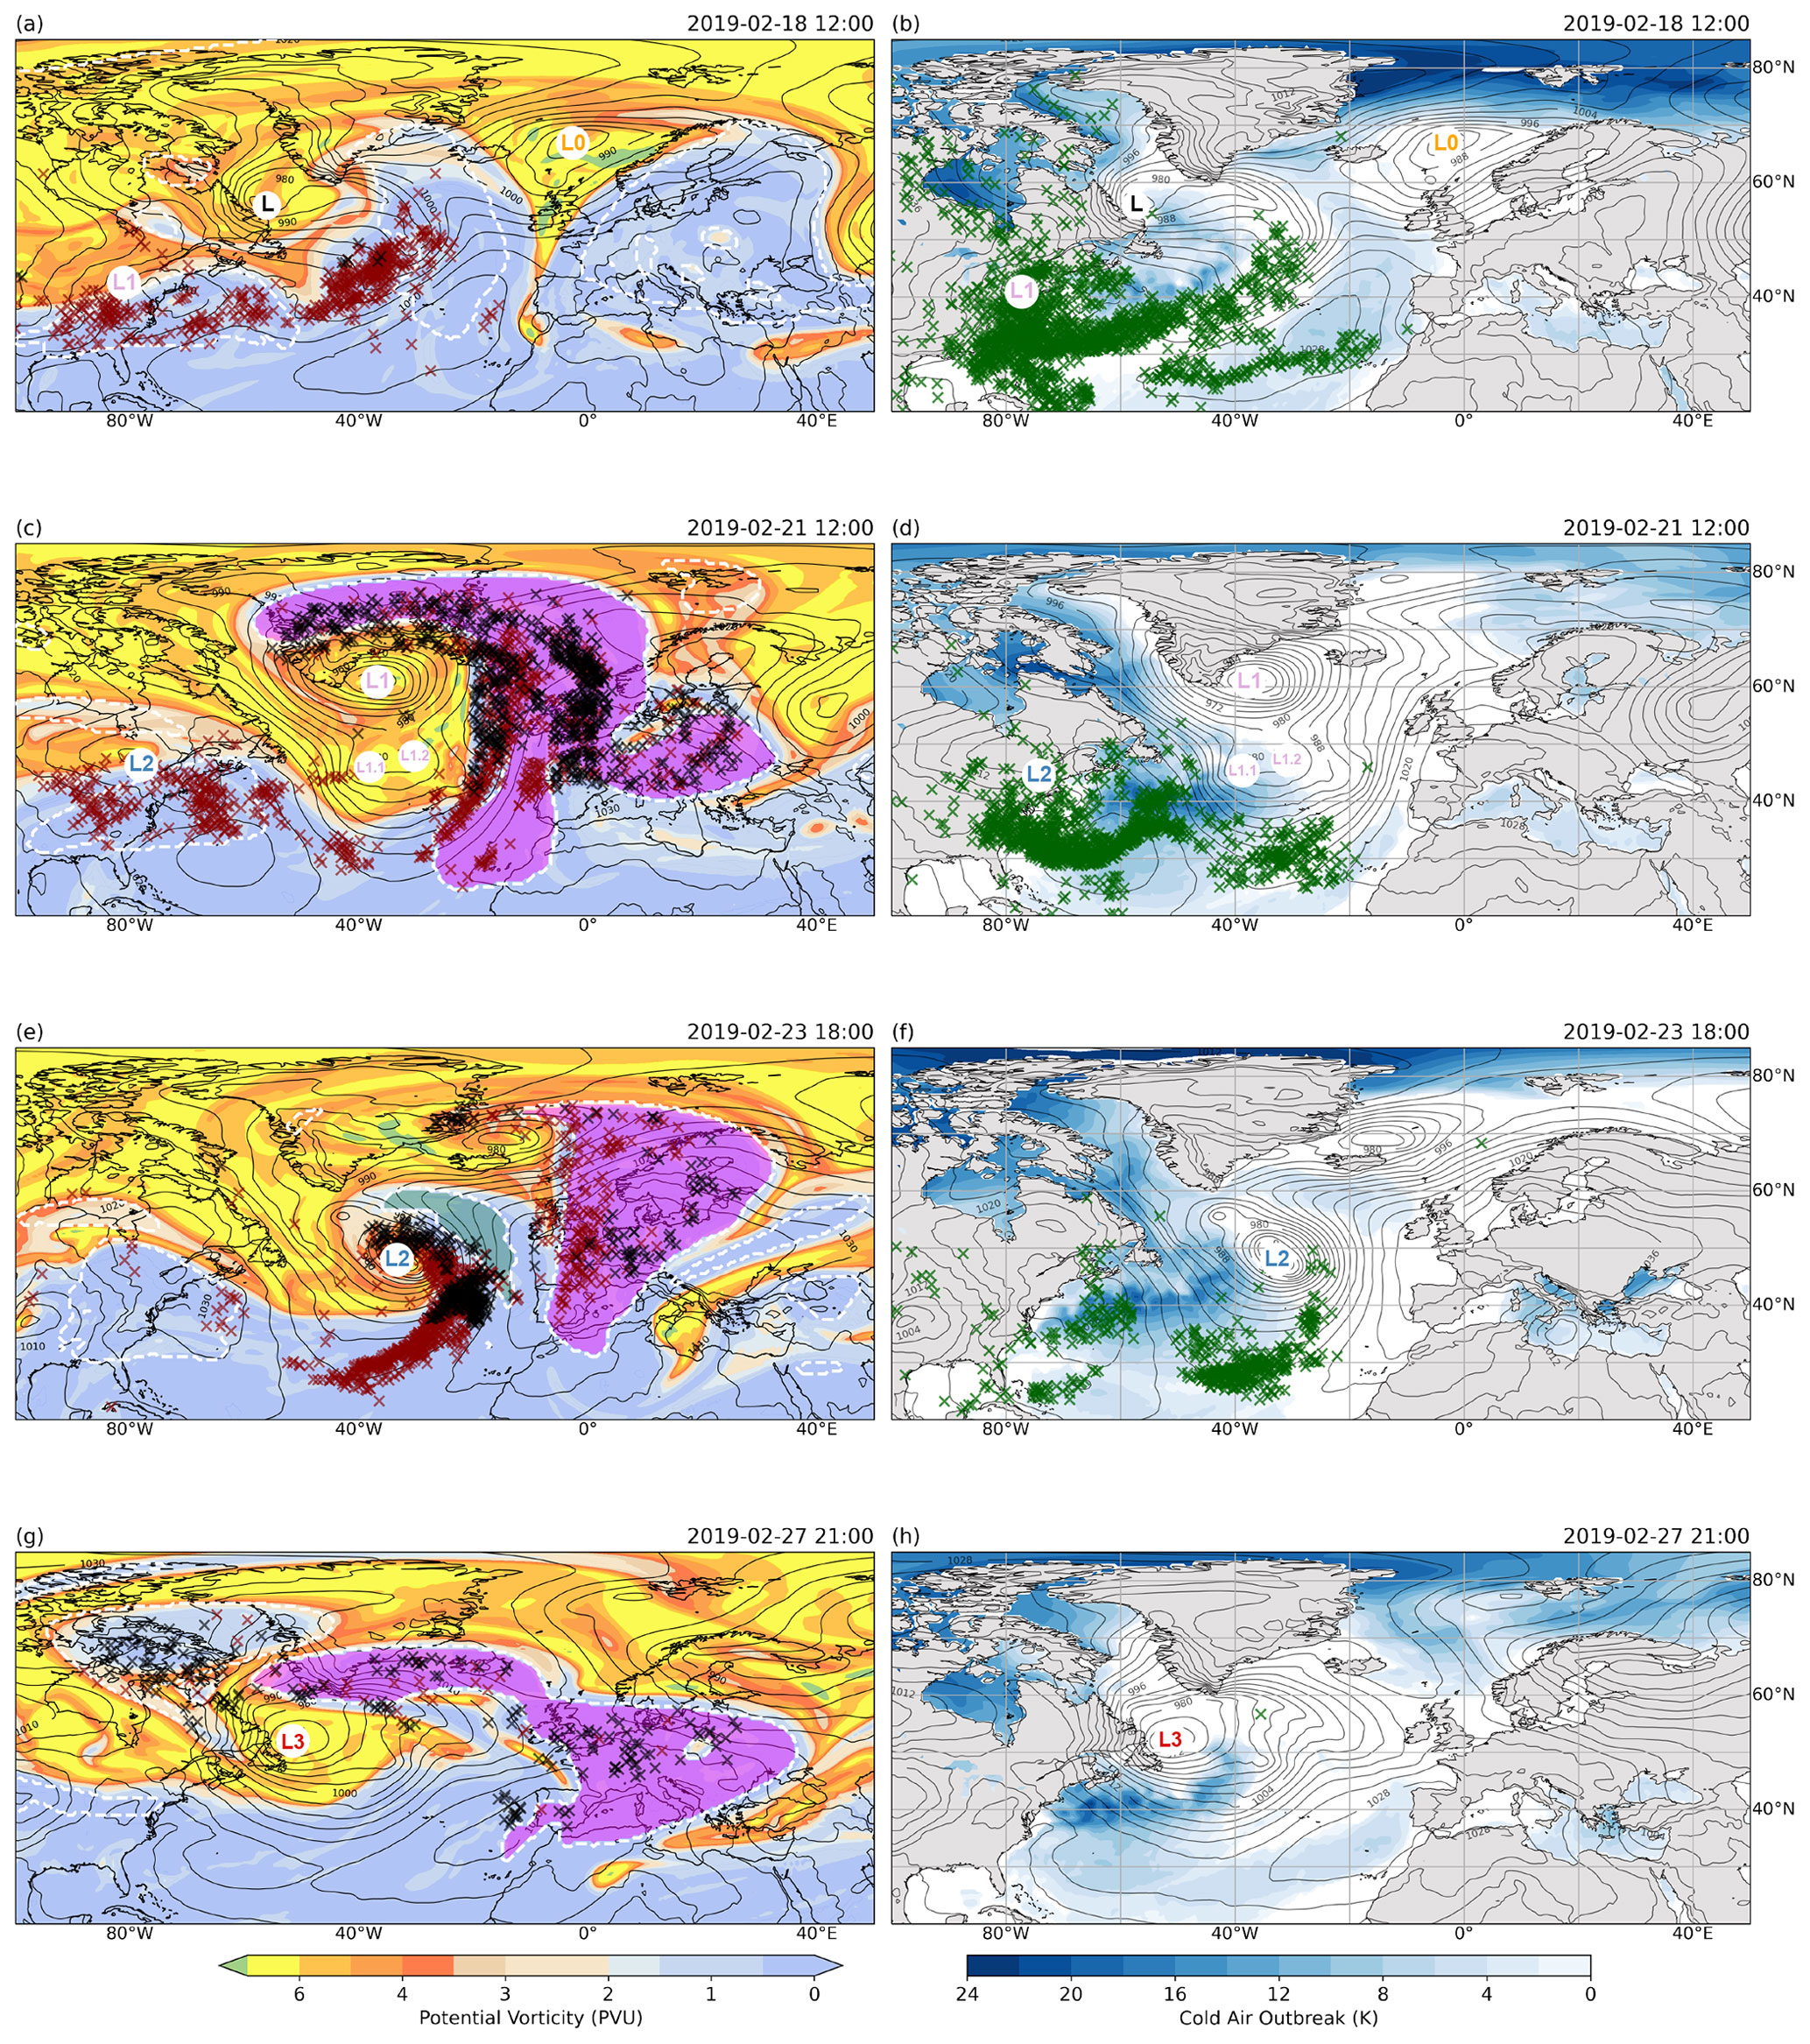
Figure 2Synoptic evolution of European blocking episode from February 2019. (a, c, e, g) Potential vorticity (shading, PVU) at 315 K and negative potential vorticity anomaly (NPVA) objects (dashed white contours). The major NPVA is shaded in magenta and the minor in light green (Sect. 2.1.3). Black crosses represent the location of every 30th NPVA GS air parcel at the outflow stage (p>400 hPa) at the corresponding time. Red crosses indicate the locations of every 30th NPVA GS air parcel during the ascent stage (400 hPa < p < 800 hPa) for the same timestamp. (b, d, f, h) Cold air outbreak index (shading, K). Green crosses denote the positions of every 30th NPVA GS air parcel at the inflow stage (p>800 hPa) at the corresponding time. Panels are shown for 12:00 UTC on 18 February 2019 (a, b), 12:00 UTC on 21 February 2019 (c, d), 18:00 UTC on 23 February 2019 (e, f), and 21:00 UTC on 27 February 2019 (g, h). Black contours in both columns show mean sea level pressure (hPa), and labels L0–L4 refer to the mentioned cyclones with their tracks shown in Fig. 3.
Temperature data from weather stations illustrate the extreme nature of this event. The highest temperature anomalies were observed on 26 and 27 February (Fig. 1d), with the record high temperature in February for the United Kingdom of 21.2 ∘C measured in Kew Gardens, London (Young and Galvin, 2020). Record-breaking observations were also made in Scotland (18.3 ∘C), the Netherlands (18.9 ∘C), and Sweden (16.7 ∘C), highlighting the spatial extent of the event (Young and Galvin, 2020).
In the following, we discuss the synoptic evolution based on maps of potential vorticity at 315 K and mean sea level pressure (Fig. 2). In addition, the tracks of all cyclones during the study period are shown in Fig. 3. Europe had already experienced moderate winter weather prior to the blocking event. In the second part of February, the upper-level flow was repeatedly interrupted by the formation of upper-tropospheric NPVAs. A total of 2 d prior to the analyzed event, on 18 February, the west-to-east propagation of the jet stream was disrupted by the NPVA in the upper troposphere stretching over western Europe and another over the central North Atlantic (dashed white contours in Fig. 2a). Over Europe, this was accompanied by south and southwesterly flow in the western part of the anticyclone bringing high temperatures to western and central Europe with anomalies exceeding 10 ∘C (Fig. 1a).
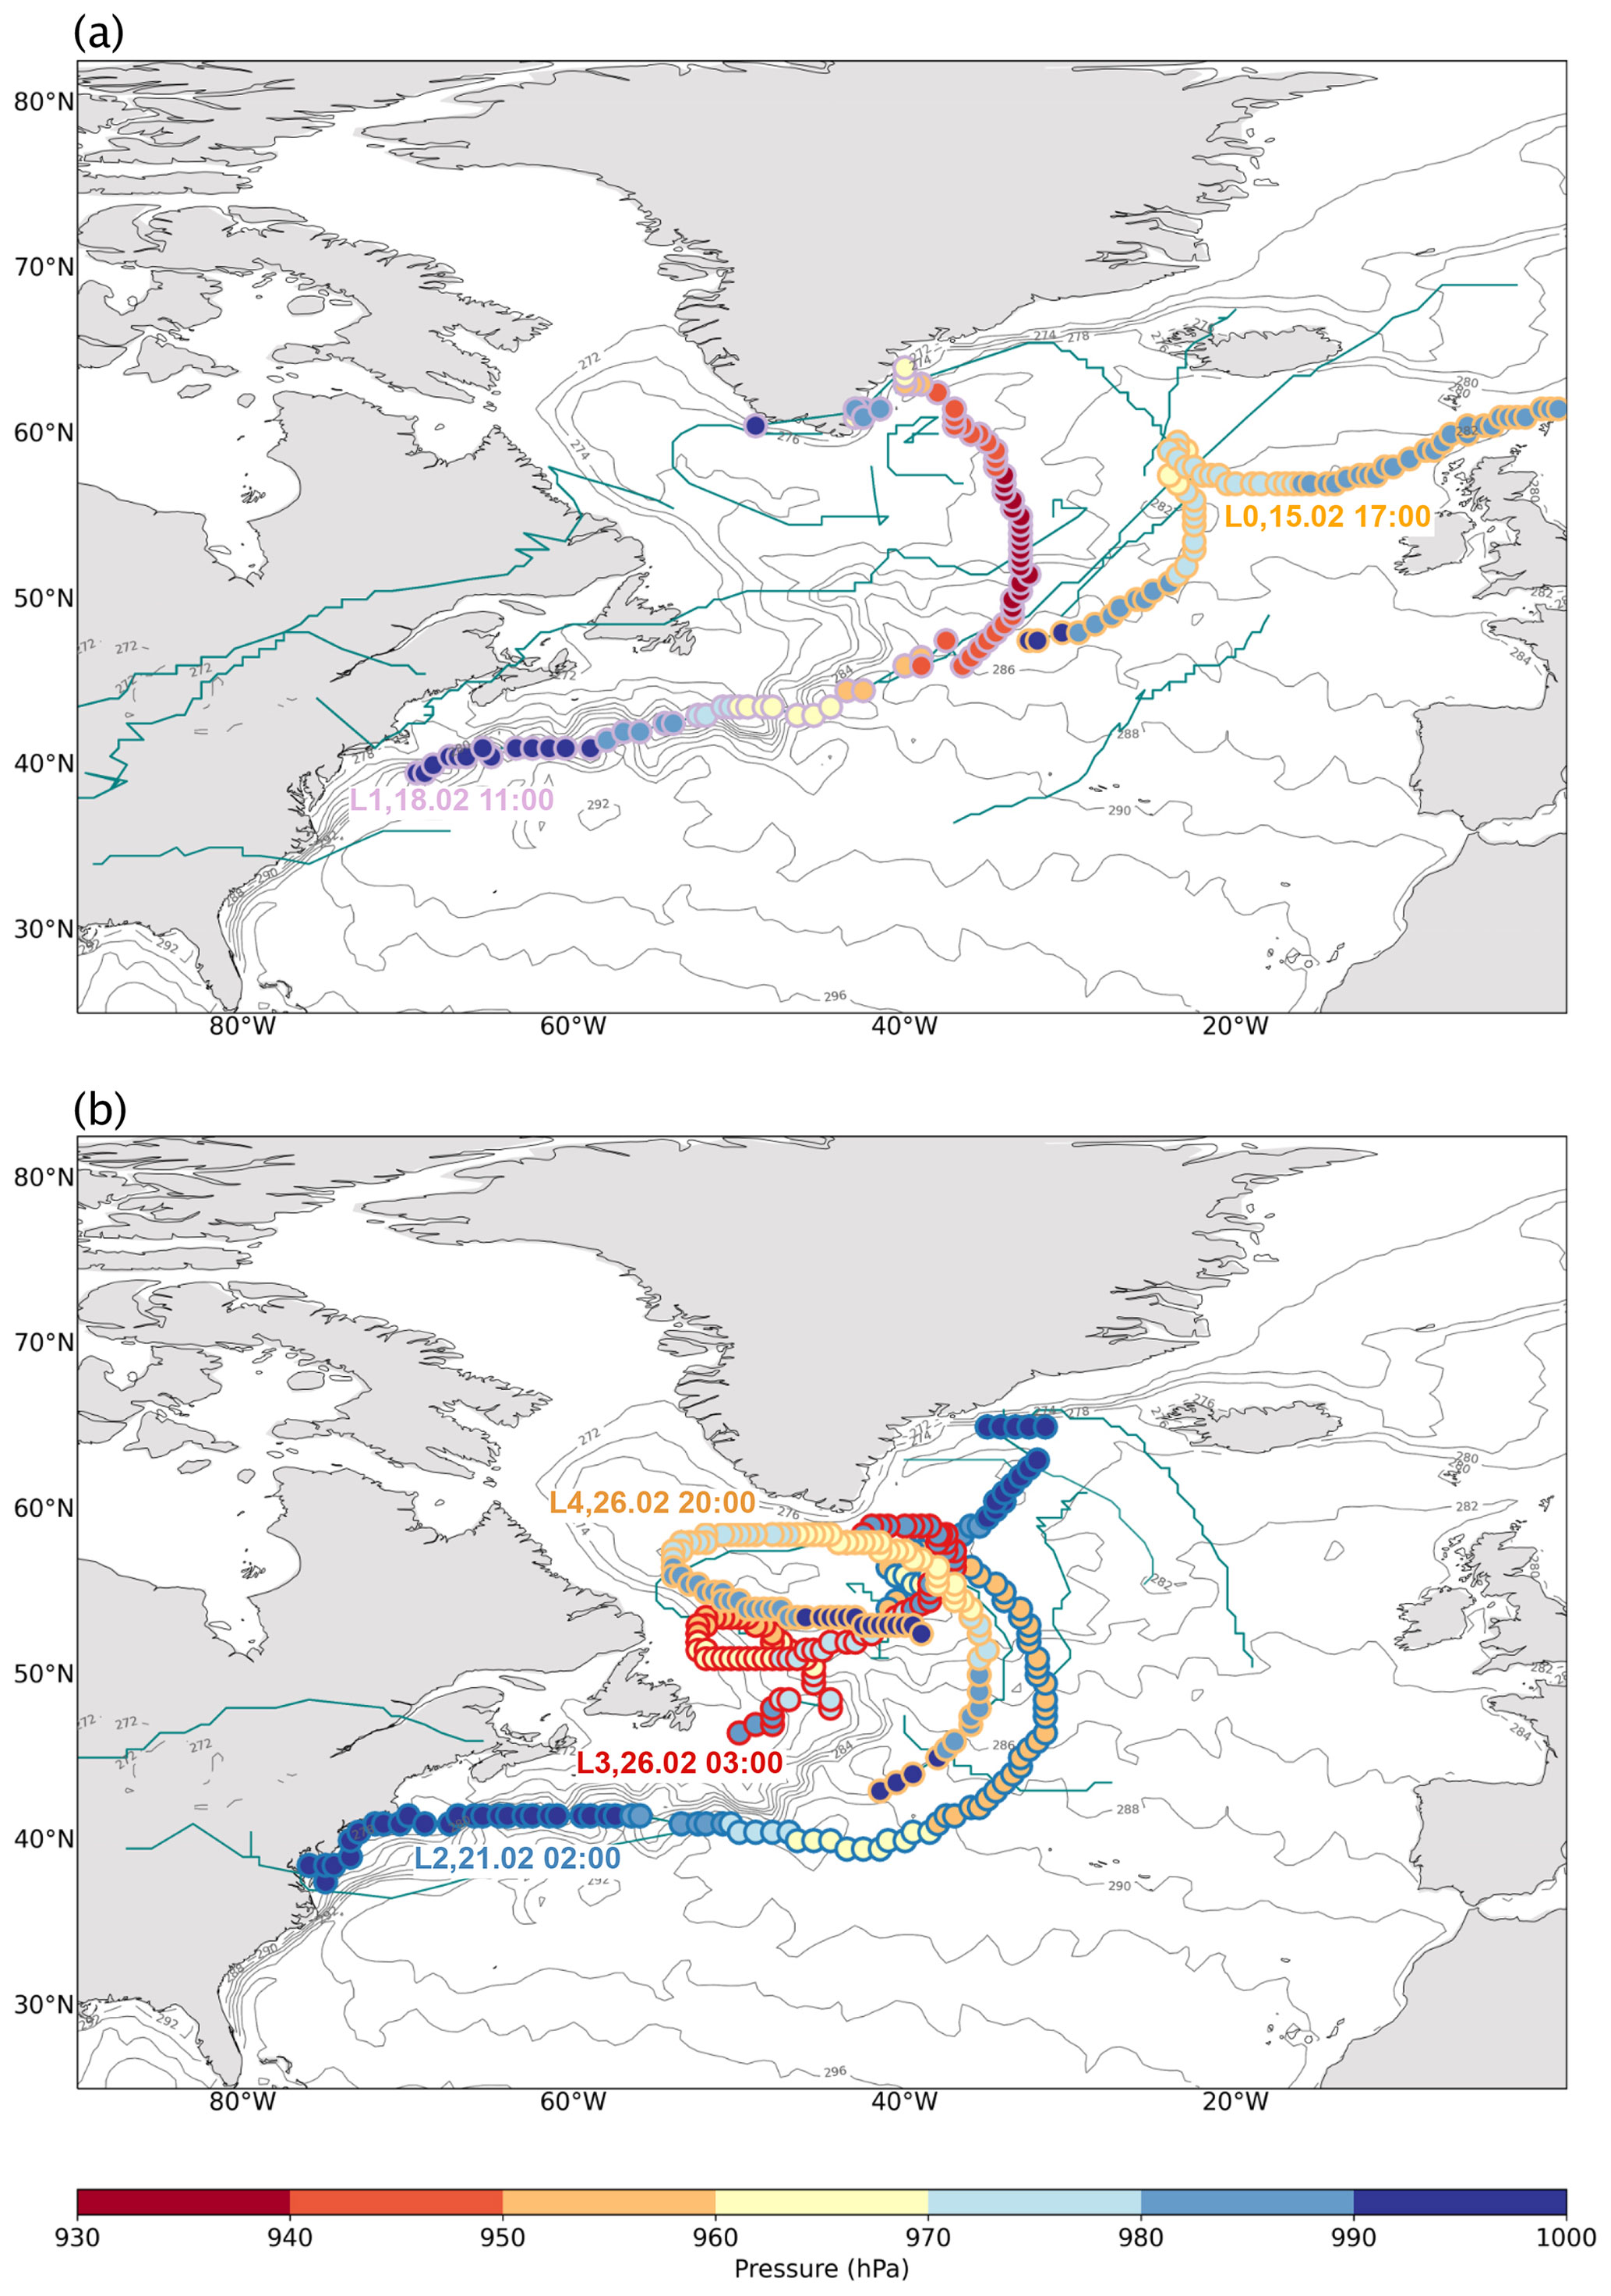
Figure 3Tracks of cyclones with genesis in the North Atlantic between 15–20 February 2019 (a) and 20–28 February 2019 (b) with contours representing the average sea surface temperature during that period, which serves as an indicator of the Gulf Stream's gradient position. The tracks of rapidly intensifying cyclones (L0–L4; Sanders and Gyakum, 1980) are shown by colored circles with the interior color representing minimum sea level pressure. The date near a cyclone's identifier (L0–L4) refers to the genesis time. The tracks of other, non-rapidly intensifying cyclones are shown by thin blue lines.
On 18 February, the bulk of air parcels related to the NPVA GS trajectories remained in the lower troposphere (p>800 hPa; green crosses in Fig. 2b). These low-level air masses, primarily found in areas experiencing CAOs in the western and central North Atlantic (Fig. 2b), were significantly affected and modified by ocean–atmosphere interface processes. Those CAOs occurred behind the very intense cyclone L0 (Fig. 3a), as well as a smaller cyclone present at the time over the Labrador Sea (L, Fig. 2a) and just before the formation of another powerful cyclone, L1, near the North American coastline (Fig. 3a). Alongside these low-level air parcels, some of the air parcels were already in the ascent phase, beginning their upward movement into the block (red crosses in Fig. 2a).
The upper-level flow was disturbed 3 d later by another major NPVA, extending from southern Europe to the North Atlantic and Greenland (magenta shading in Fig. 2c). In contrast to the NPVA object from 18 February, this new NPVA became quasi-stationary and persisted over the region for a week. Air parcels in their outflow stage and initially emerging from the Gulf Stream encompass a notable segment of this major NPVA (black crosses, Fig. 2c). In addition, a considerable number of the parcels are in the ascent stage (red crosses, Fig. 2c), progressing towards the upper-level ridge. Both the outflow and ascent are potentially linked to the ascending airstream of the rapidly intensifying cyclone L1 (Fig. 3a), followed by the genesis of smaller-scale cyclones (L1.1, L1.2) in its wake. The transit of this cyclone (L1), characterized by a pressure drop of 39 hPa within 24 h, resulted in the development of a CAO over the western and central North Atlantic, as seen in Fig. 2d. At that moment, the majority of trajectories in the inflow stage (green crosses) are collocated with this CAO.
On 23 February, the upper-level flow was further disturbed by another minor NPVA (light green in Fig. 2e), which strengthened the block and led to its extension westward. This, combined with clear skies and the sustained influx of warm air due to the anticyclonic circulation (Leach et al., 2021), amplified the warm spell across France, the Netherlands, the United Kingdom, and even Scandinavia (Fig. 1c). Examining Fig. 2e and f, we see distinct patterns. The green crosses in Fig. 2f represent trajectories at the inflow stage, while the red and black crosses in Fig. 2e correspond to the ascent and outflow stages, respectively. These patterns collectively display a WCB-like structure, directly associated with cyclone L2. This structure not only suggests the genesis of a minor NPVA but also, as indicated by the presence of black crosses in the major NPVA, underscores their potential role in sustaining the block. It is important to highlight the fact that as cyclone L2 propagated, it traveled into the region where the air in the lower troposphere had been heavily modified due to the surface fluxes that occurred in the wake of cyclone L1 (Fig. 2d). Furthermore, the advection of cold air behind the cold front of L2 resulted in another strong surface evaporation event over the Gulf Stream region (Fig. 2f).
The date of 27 February marks the last day of the blocking event when the NPVA started to shrink in size and propagate east (Fig. 2g) and temperature anomalies in western Europe reached their peak (Fig. 1d). Air parcels originating from trajectories that interacted with the Gulf Stream are found in the upper troposphere in the region covered by the NPVA or in its vicinity (black crosses, Fig. 2g). The ascent of those air parcels was most probably associated with cyclones L3 and L4 (Fig. 3). Unlike cyclones L1 and L2, the tracks of cyclones L3 and L4 were predominantly constrained to the western North Atlantic. The enhanced outflow from the rising airstreams of these cyclones could have played a role in fortifying the upper-level NPVA from a westerly direction, as indicated by the magenta shading and black crosses in Fig. 2g. Following the passage of cyclone L3, a subsequent CAO event was observed over the Gulf Stream (Fig. 2h). However, unlike earlier events, this CAO was more spatially confined, largely limited to areas near the Gulf Stream.
Our synoptic analysis suggests that a mix of various factors was responsible for the emergence of the February 2019 block and the associated record-high temperatures, potentially connecting upper-level atmospheric dynamics to air–sea interactions in the western North Atlantic. The cyclones set the stage for trajectories from the Gulf Stream to move into the upper troposphere. These same cyclones also triggered distinct CAOs in the inflow areas of the trajectories, leading to increased heating and moistening of the atmospheric boundary layer. In the following sections, we will examine the details of NPVA GS trajectories to better understand the evolution of the air masses that interacted with the Gulf Stream.
3.2 Connection between the Gulf Stream region and the large-scale dynamics
To investigate a potential link between the Gulf Stream region and the upper-level circulation during the blocking episode, we investigate the characteristics of backward trajectories starting in the NPVA objects forming the block in February 2019 (Sect. 2.2). Given our study's aim to understand how the Gulf Stream influences the upper troposphere, we mainly focus on trajectories that show an ascent of 500 hPa within 10 d backward and that traveled over the Gulf Stream in the lower atmosphere (referred to as NPVA GS trajectories in Table 1). Out of all the NPVA base trajectories (Table 1), 43 % meet the ascent criteria, and 28 % of those are classified as NPVA GS trajectories (Table 2). Although NPVA GS trajectories represent just 12 % of all trajectories originating from NPVAs (NPVA base trajectories), a focus on these helps us to better understand how signals from air–sea interactions over the Gulf Stream propagate to the upper troposphere. Furthermore, as will be shown in the following, their distinct properties hint at a disproportional relevance for the formation and maintenance of the atmospheric block.
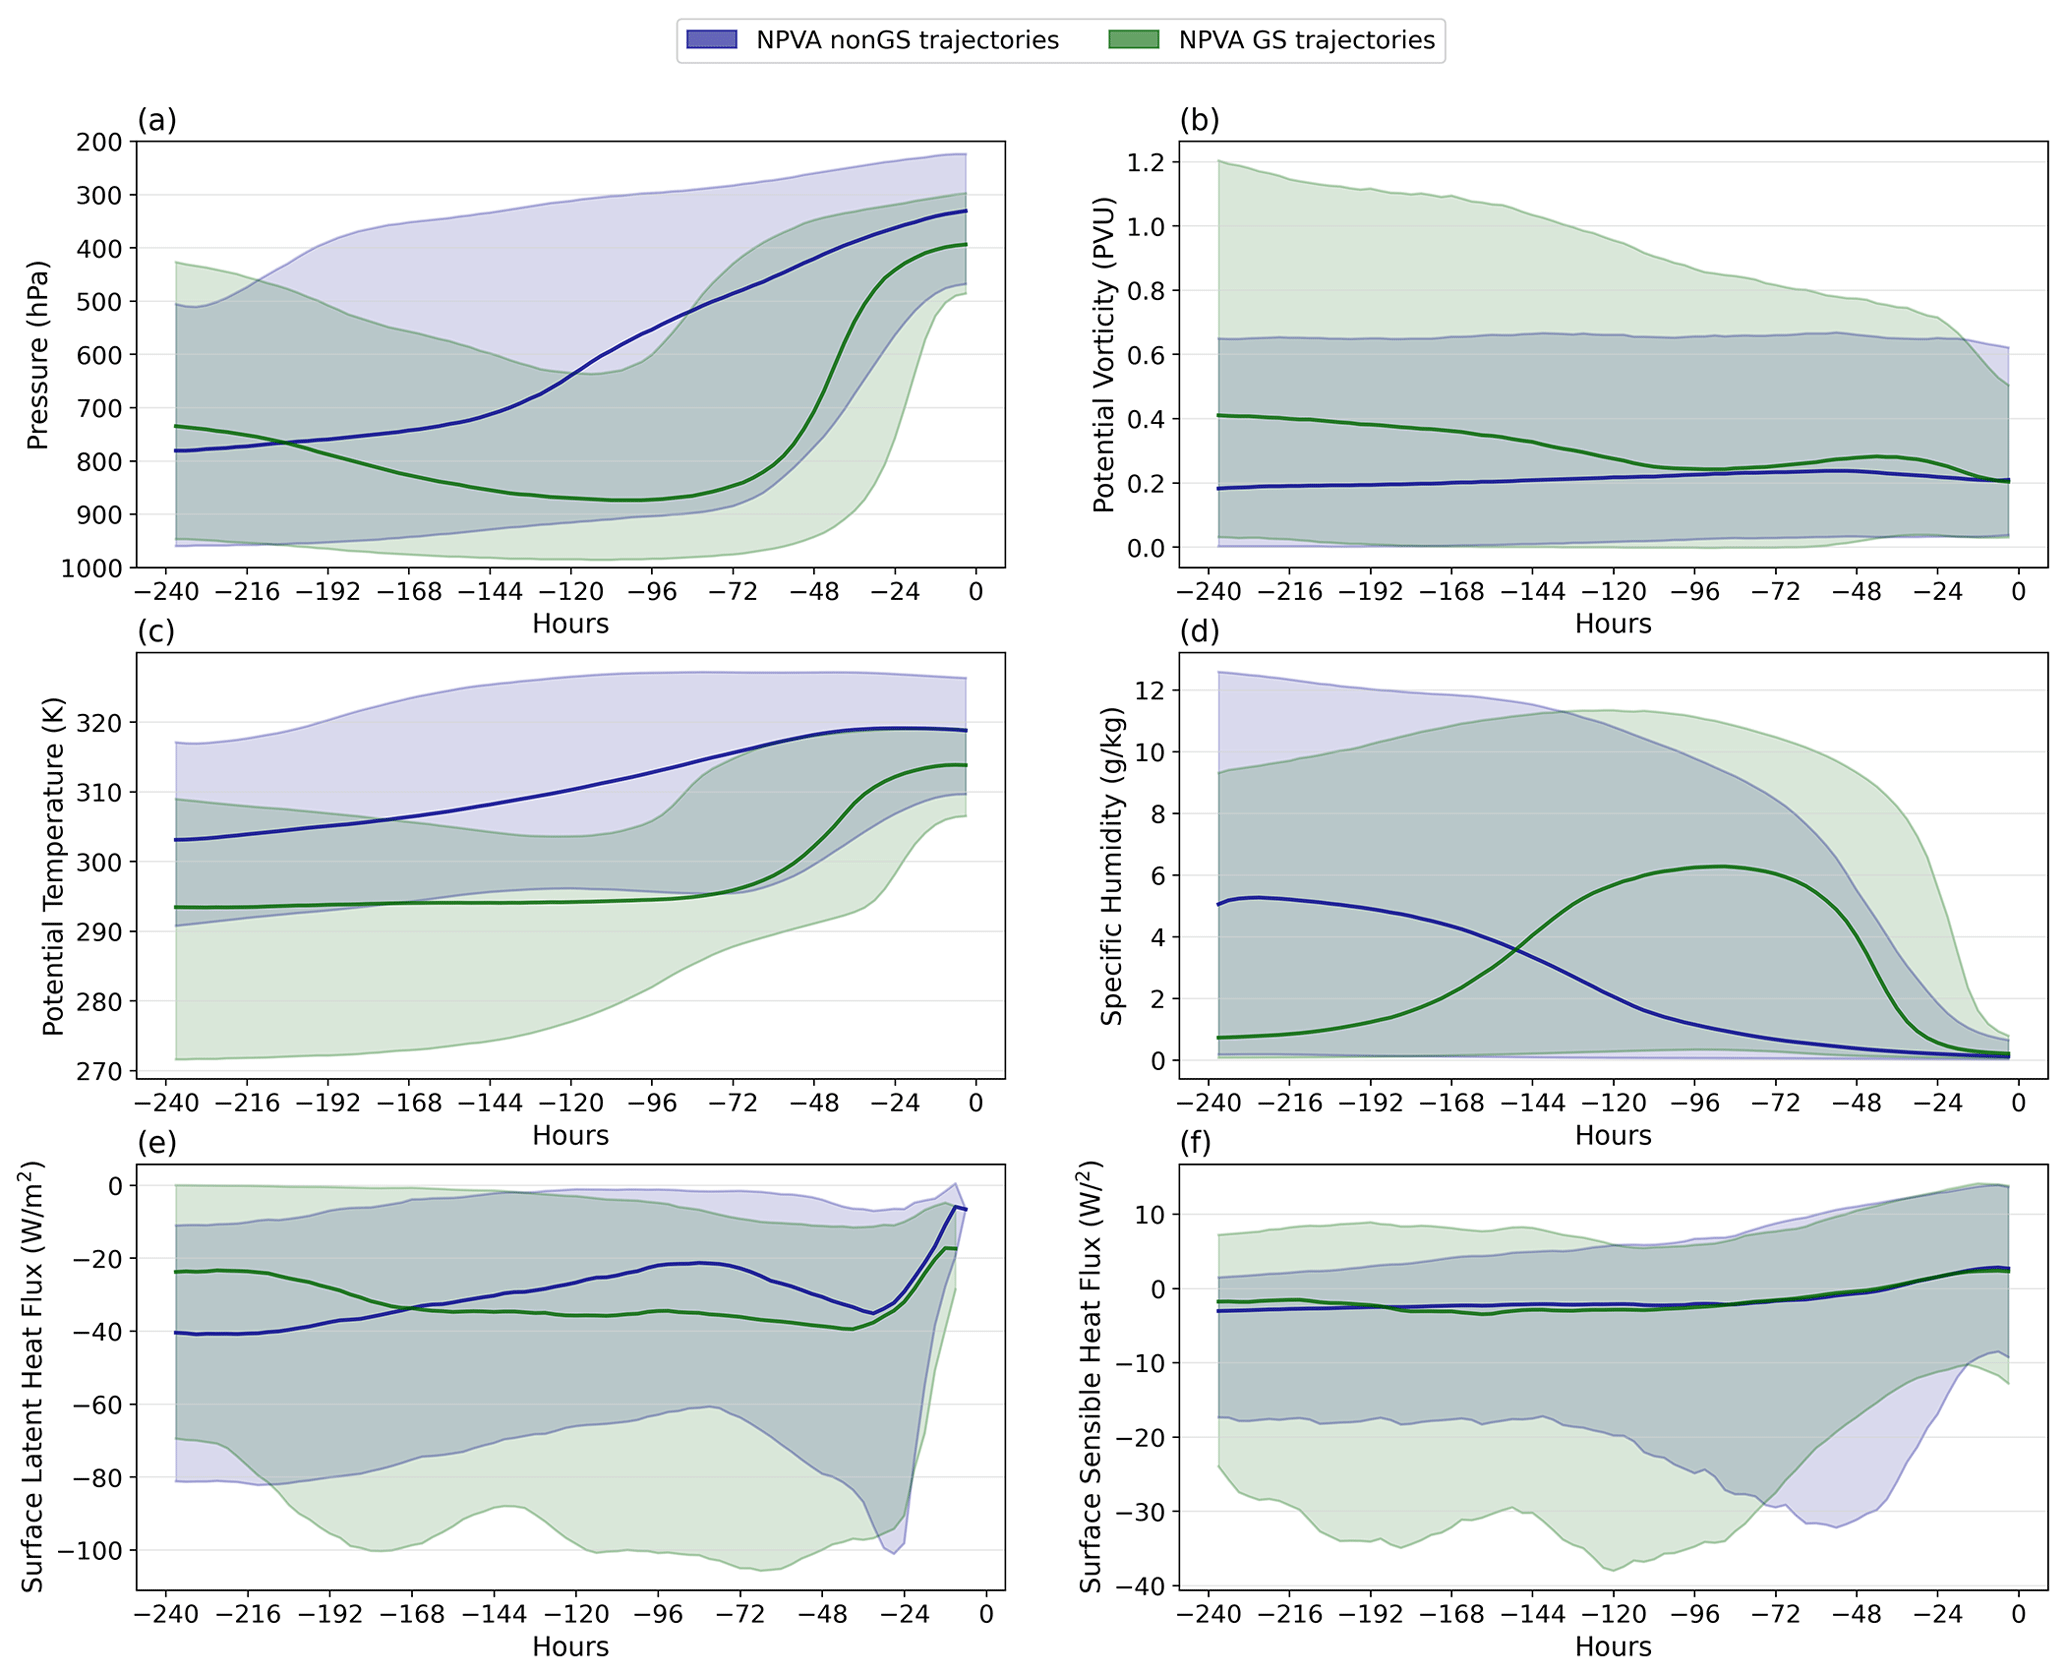
Figure 4Temporal evolution of (a) pressure, (b) potential temperature, (c) surface latent heat flux, (d) surface sensible heat flux, (e) potential vorticity, and (f) specific humidity along NPVA GS (green) and NPVA nonGS (blue) trajectories. Time 0 h refers to the start of the backward trajectory in the NPVA object. The medians are represented as thick lines, and the 10th to 90th percentile range is shaded in light green and light blue.
First, we examine the differences in pressure changes between NPVA GS and nonGS trajectories. NPVA GS trajectories initially undergo a slight descent from the mid-troposphere towards the atmospheric boundary layer (green shading, Fig. 4a). Here, on average, they remain for about 48–72 h. Then, quite swiftly between −72 to −36 h, they ascend into the upper troposphere. Conversely, on average NPVA nonGS trajectories start from higher pressure levels and ascend steadily to the upper troposphere (blue shading, Fig. 4a). The ascent of NPVA GS trajectories closely mirrors the distinctive features of the warm conveyor belt (WCB), which typically occurs in the warm sector of extratropical cyclones. As defined by Madonna et al. (2014), a trajectory is denoted as a WCB trajectory if it experiences an ascent of at least 600 hPa within a 48 h interval. It is crucial to note that their criterion focuses only on the most vigorous part of the airstream that ascends in the warm sector of an extratropical cyclone. Indeed, about 87 % of NPVA GS trajectories ascend from pressures greater than 800 hPa to pressures below 500 hPa within only 48 h, reflecting their relatively fast ascent. Meanwhile, when applying this criterion to NPVA nonGS trajectories, only 72 % of them meet the condition.
Applying the strict WCB requirement of 600 hPa ascent within 48 h, both NPVA GS and nonGS trajectories comprise approximately 30 % of WCB trajectories (Table 2). The temporal variations in PV for NPVA GS trajectories, as shown in Fig. 4b, display a typical WCB-like behavior. An initial increase in PV from −72 to −48 h followed by a decrease suggests the release of latent heat due to condensation in a WCB-like ascent (Madonna et al., 2014). Indeed the average potential temperature increases from 294 to 315 K in this time window along with a marked moisture reduction (Fig. 4c and d). Thus the formation of stratiform and convective clouds, as well as precipitation, leads to the release of latent heat, resulting in diabatic heating of rising air masses.
The influence of diabatic heating on blocks within the North Atlantic–European region has been underscored by recent research (e.g., Steinfeld and Pfahl, 2019; Steinfeld et al., 2020; Pfahl et al., 2015). Within a 38-year global study, Steinfeld and Pfahl (2019) identified that between 30 %–45 % of backward trajectories initiated in upper-level blocks underwent diabatic heating. This contrasts slightly with the 51.8 % reported by Yamamoto et al. (2021), who suggest that variations in blocking definitions and trajectory approaches could account for the difference. For a quantitative comparison with these studies, we detect diabatic heating in trajectories based on the criterion set by Pfahl et al. (2015), which requires a change in potential temperature (Δθ) of at least 2 K over a 3 d period from the onset of backward trajectories. Our findings indicate that approximately 48 % of all trajectories starting from the NPVA objects (NPVA base trajectories; see DH in Table 2) underwent diabatic heating in the 3 d leading up to their arrival in the blocking region. This observation aligns with the aforementioned data from previous climatological investigations (Steinfeld and Pfahl, 2019). As anticipated, a larger proportion of ascending trajectories, 63 %, undergo diabatic heating compared to just 38 % of non-ascending trajectories. This contrast is further amplified when distinguishing between GS and nonGS trajectories within the ascending category, with fractions of 98 % and 54.7 %, respectively. The dominance of diabatic heating in the air masses that interacted with the Gulf Stream is further mirrored by an increase in potential temperature visible in Fig. 4c, where NPVA GS trajectories demonstrate on average a 21 K increase, which is 7 K more than that in nonGS trajectories (Table 2). Building on the insights of Steinfeld and Pfahl (2019) and Pfahl et al. (2015), the presence of such pronounced diabatic heating, often termed “latent heating bursts”, suggests that the air transport through the preceding cyclones has influenced the block.
Strong heating occurs also at the surface, as indicated by negative values in the sensible and latent heat fluxes (Fig. 4e and f). This heating correlates with the prevalent CAO events across the western and central North Atlantic, as shown in Fig. 2. Supporting this, a considerable portion (82 %) of NPVA GS trajectories are identified as CAOs (Table 2; see Sect. 2.1.4), in agreement with the findings presented in Sect. 3.1. The development of multiple cyclones in the western North Atlantic created conditions favorable for the advection of cold air of continental origin over warmer waters, particularly south of the Gulf Stream. This resulted in enhanced heat and moisture exchanges between the ocean and atmosphere, even leading to the emergence of negative potential vorticity values, signaling an unstable environment (see Appendix A).
Finally – as a sidetrack – we investigate “dry intrusions” (DIs; Raveh-Rubin, 2017), which are characteristics of the NPVA trajectories. This is motivated by the fact that DIs, which typically occur in the cold sector of extratropical cyclones, bring relatively dry air to lower levels, enhancing surface fluxes in particular over the ocean. Thus, as suggested by Demirdjian et al. (2023), the preconditioning of DIs may play a vital role in the rapid intensification of upstream cyclones by creating conducive conditions for moisture uptake in the inflow layer of our NPVA GS trajectories. Raveh-Rubin (2017) defines DIs as the descending counterpart to WCBs with a descent of 400 hPa within 48 h. When DIs reach the lower troposphere, they affect the atmospheric boundary layer through enhanced surface fluxes, heightened wind speeds, and the elevation of the planetary boundary layer (see Ilotoviz et al., 2021). We find 11.4 % of the NPVA GS trajectories feature DI characteristics (Table 2). DIs occurred particularly over the southern part of the Gulf Stream, northeast of Florida (not shown). The extreme nature of dry intrusions and their role in potentially triggering intense CAO events prompted us to analyze trajectories that sequentially experience DI, CAO, and diabatic heating (DH). Notably, a majority of DI trajectories follow this sequence (∼80 %; see Table 2). Thus, in our case study, a DI near the GS exhibits a high likelihood of subsequent ascent in a WCB-like airstream into the upper troposphere, thereby contributing to blocking formation. While these trajectories represent a minor portion of all those originating from NPVAs (∼2 %), we find this dynamical relevance of DI airstreams interacting with the Gulf Stream noteworthy and of potential importance for subsequent research studies.
Our findings emphasize that while only 28 % of all ascending trajectories originate from the block and interact with the Gulf Stream in the lower troposphere, these trajectories display unique features, suggesting pronounced air–sea interaction affecting the upper-level block downstream. In addition, while it is widely established that diabatic heating in regions of intense surface heat fluxes influences the large-scale atmospheric circulation (e.g., Pfahl et al., 2015; Yamamoto et al., 2021; Tilinina et al., 2018), the understanding of the mechanistic link between processes that take place within CAOs in the wake of extratropical cyclones and upper-level ridge formation is still missing (Czaja et al., 2019). Our results show that the intense, CAO-induced air–sea interactions in the western North Atlantic and an episode of European blocking might be inherently linked. Furthermore, the connection between the surface fluxes and coherent airstreams hints at a dynamical linkage of the Gulf Stream front to the large-scale atmospheric circulation. In the following section, we aim to further detail this mechanistic link.
3.3 Moisture sources for NPVA GS trajectories
The rapid, cross-isentropic ascent of air parcels into the upper-level NPVA is driven by the latent heat release during cloud formation and precipitation (Joos and Wernli, 2012). For clouds and precipitation to form, a sufficient moisture supply is needed (Eckhardt et al., 2004; Pfahl et al., 2014). Employing the method from Sodemann et al. (2008), we examined the moisture sources for the ascent of both NPVA GS and NPVA nonGS trajectories (Table 1). However, given our paper's primary focus, we primarily concentrate on trajectories that interacted with the Gulf Stream.
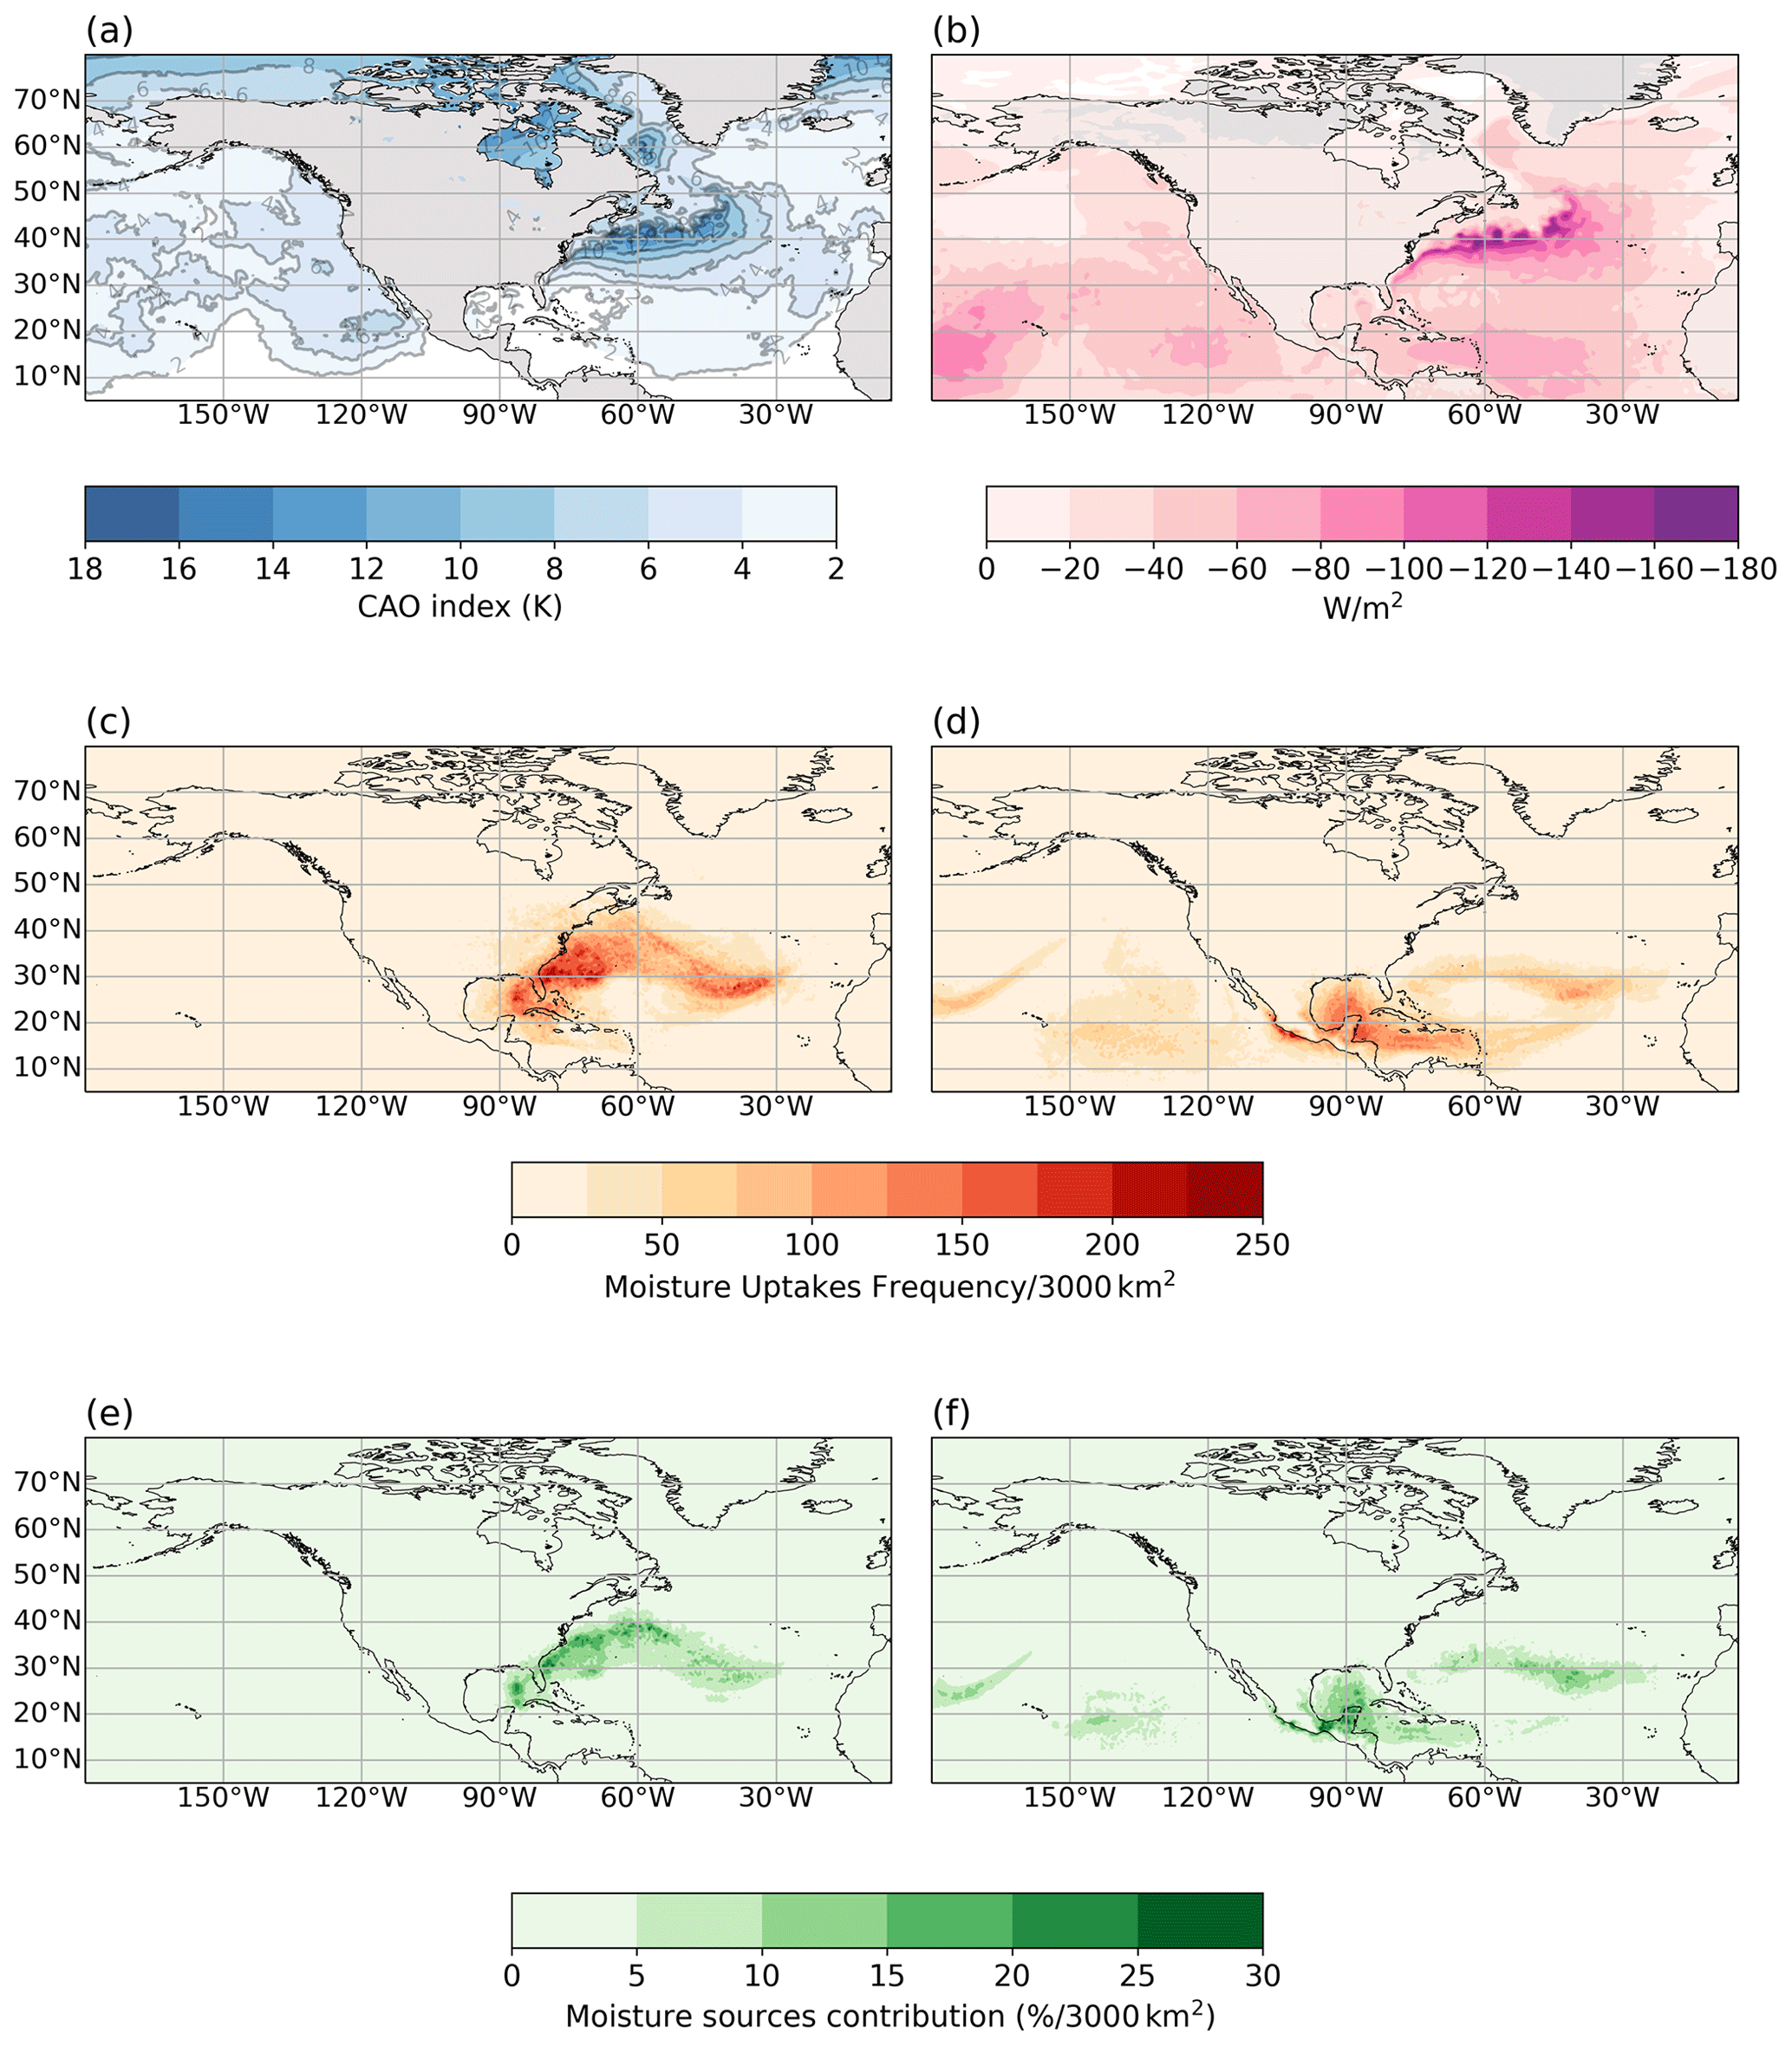
Figure 5(a) Mean of the 3-hourly CAO index (θSST−θ850) during the period from 15 to 28 February 2019 (shading and contours); contours are plotted every 2 K from 2 to 20 K. (b) Same as (a) but for surface latent heat flux (SLHF, shading). Negative SLHF in the ERA5 dataset indicates that SLHF is from the ocean to the atmosphere. (c–f) Analysis of moisture sources for NPVA GS (left column) and NPVA nonGS trajectories (right column; Table 1). Panels (c, d) show the frequency of moisture uptakes per 3000 km2 and panels (e, f) the moisture source contribution to total moisture content present in the trajectory prior to ascent (% per 3000 km2).
First, we will focus on the timing and spatial patterns of moisture uptakes along the trajectories. NPVA GS trajectories typically begin accumulating moisture around 3.5 d before ascent, with a major share (60 %) of this uptake occurring in the 5 d leading up to ascent (Table 3). By contrast, NPVA nonGS trajectories start collecting moisture approximately 3.8 d before ascent, with nearly half (48 %) of their moisture uptakes occurring in the 5 d period preceding ascent (Table 3). Interestingly, over a span of 10 d, only 44 % of NPVA nonGS trajectories occur over the ocean, in contrast to 78 % for NPVA GS trajectories (Table 3). Furthermore, from the start of their ascent, NPVA GS trajectories reach the upper-level NPVA in an average of 2.6 d (Table 3). This is notably quicker than the 6.65 d taken by NPVA nonGS trajectories, implying that the ascent regions for these two trajectories might be distinct.
Table 3Summary of general characteristics and moisture sources for NPVA GS and NPVA nonGS trajectories.
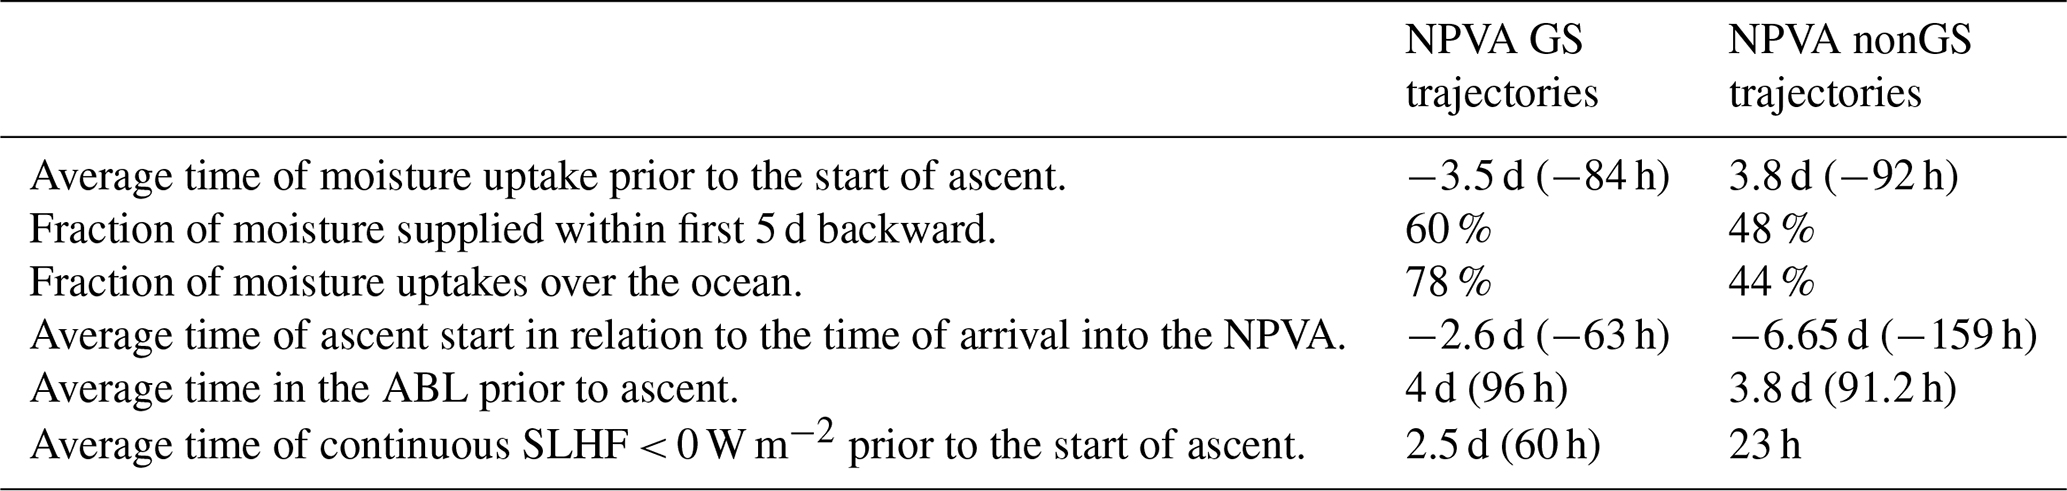
Figure 5c illustrates the spatial distribution of moisture uptakes for all NPVA GS trajectories. There are two prominent areas of moisture uptake: one close to the Gulf Stream and another over the central North Atlantic. Interestingly, these regions seem to align with the locations of CAOs observed during our study period (Fig. 5a). This may suggest that CAOs and resulting upward latent heat fluxes (Fig. 5b) might play a role in the water cycle of NPVA GS trajectories. Examining the specifics of these uptake regions further underscores the significance of certain geographic locations in the moisture collection process. Our moisture source identification methodology indicates that 80 %–90 % of the uptakes (Fig. 5e) come directly from the Gulf Stream area, supplemented by uptakes from the eastern Gulf of Mexico. Meanwhile, the central North Atlantic contributes approximately 20 % to the total moisture content before ascent.
Conversely, for NPVA nonGS trajectories, moisture is mainly sourced from the regions characterized by weak or no CAOs and notably diminished surface fluxes (Fig. 5a and b). Predominant moisture contributions stem from the Gulf of Mexico's subtropical regions and the Caribbean Sea (Fig. 5f). A distinct observation for the NPVA nonGS trajectories is that their moisture uptakes within the Gulf of Mexico are positioned further to the west compared to those of NPVA GS trajectories (Fig. 5e and f).
The primary uptake regions for NPVA GS trajectories not only align with the Gulf Stream SST front but also correspond to areas of intense CAOs (Fig. 5a), which seem to play a significant role in the evolution of NPVA GS trajectories. On average, 62 % of all moisture uptakes happen during CAO events over the ocean, when cold, continental air is advected over the warmer water surface (green line in Fig. 6b). Some of the moisture uptakes, especially between 19 and 23 February, align with intense SLHF events (Fig. 6a). On the other hand, the NPVA nonGS trajectories tell a slightly different story: only 43 % experience a CAO during moisture uptake, and the surface evaporation events observed during the same time frame in February were weaker for these trajectories (Fig. 6a).
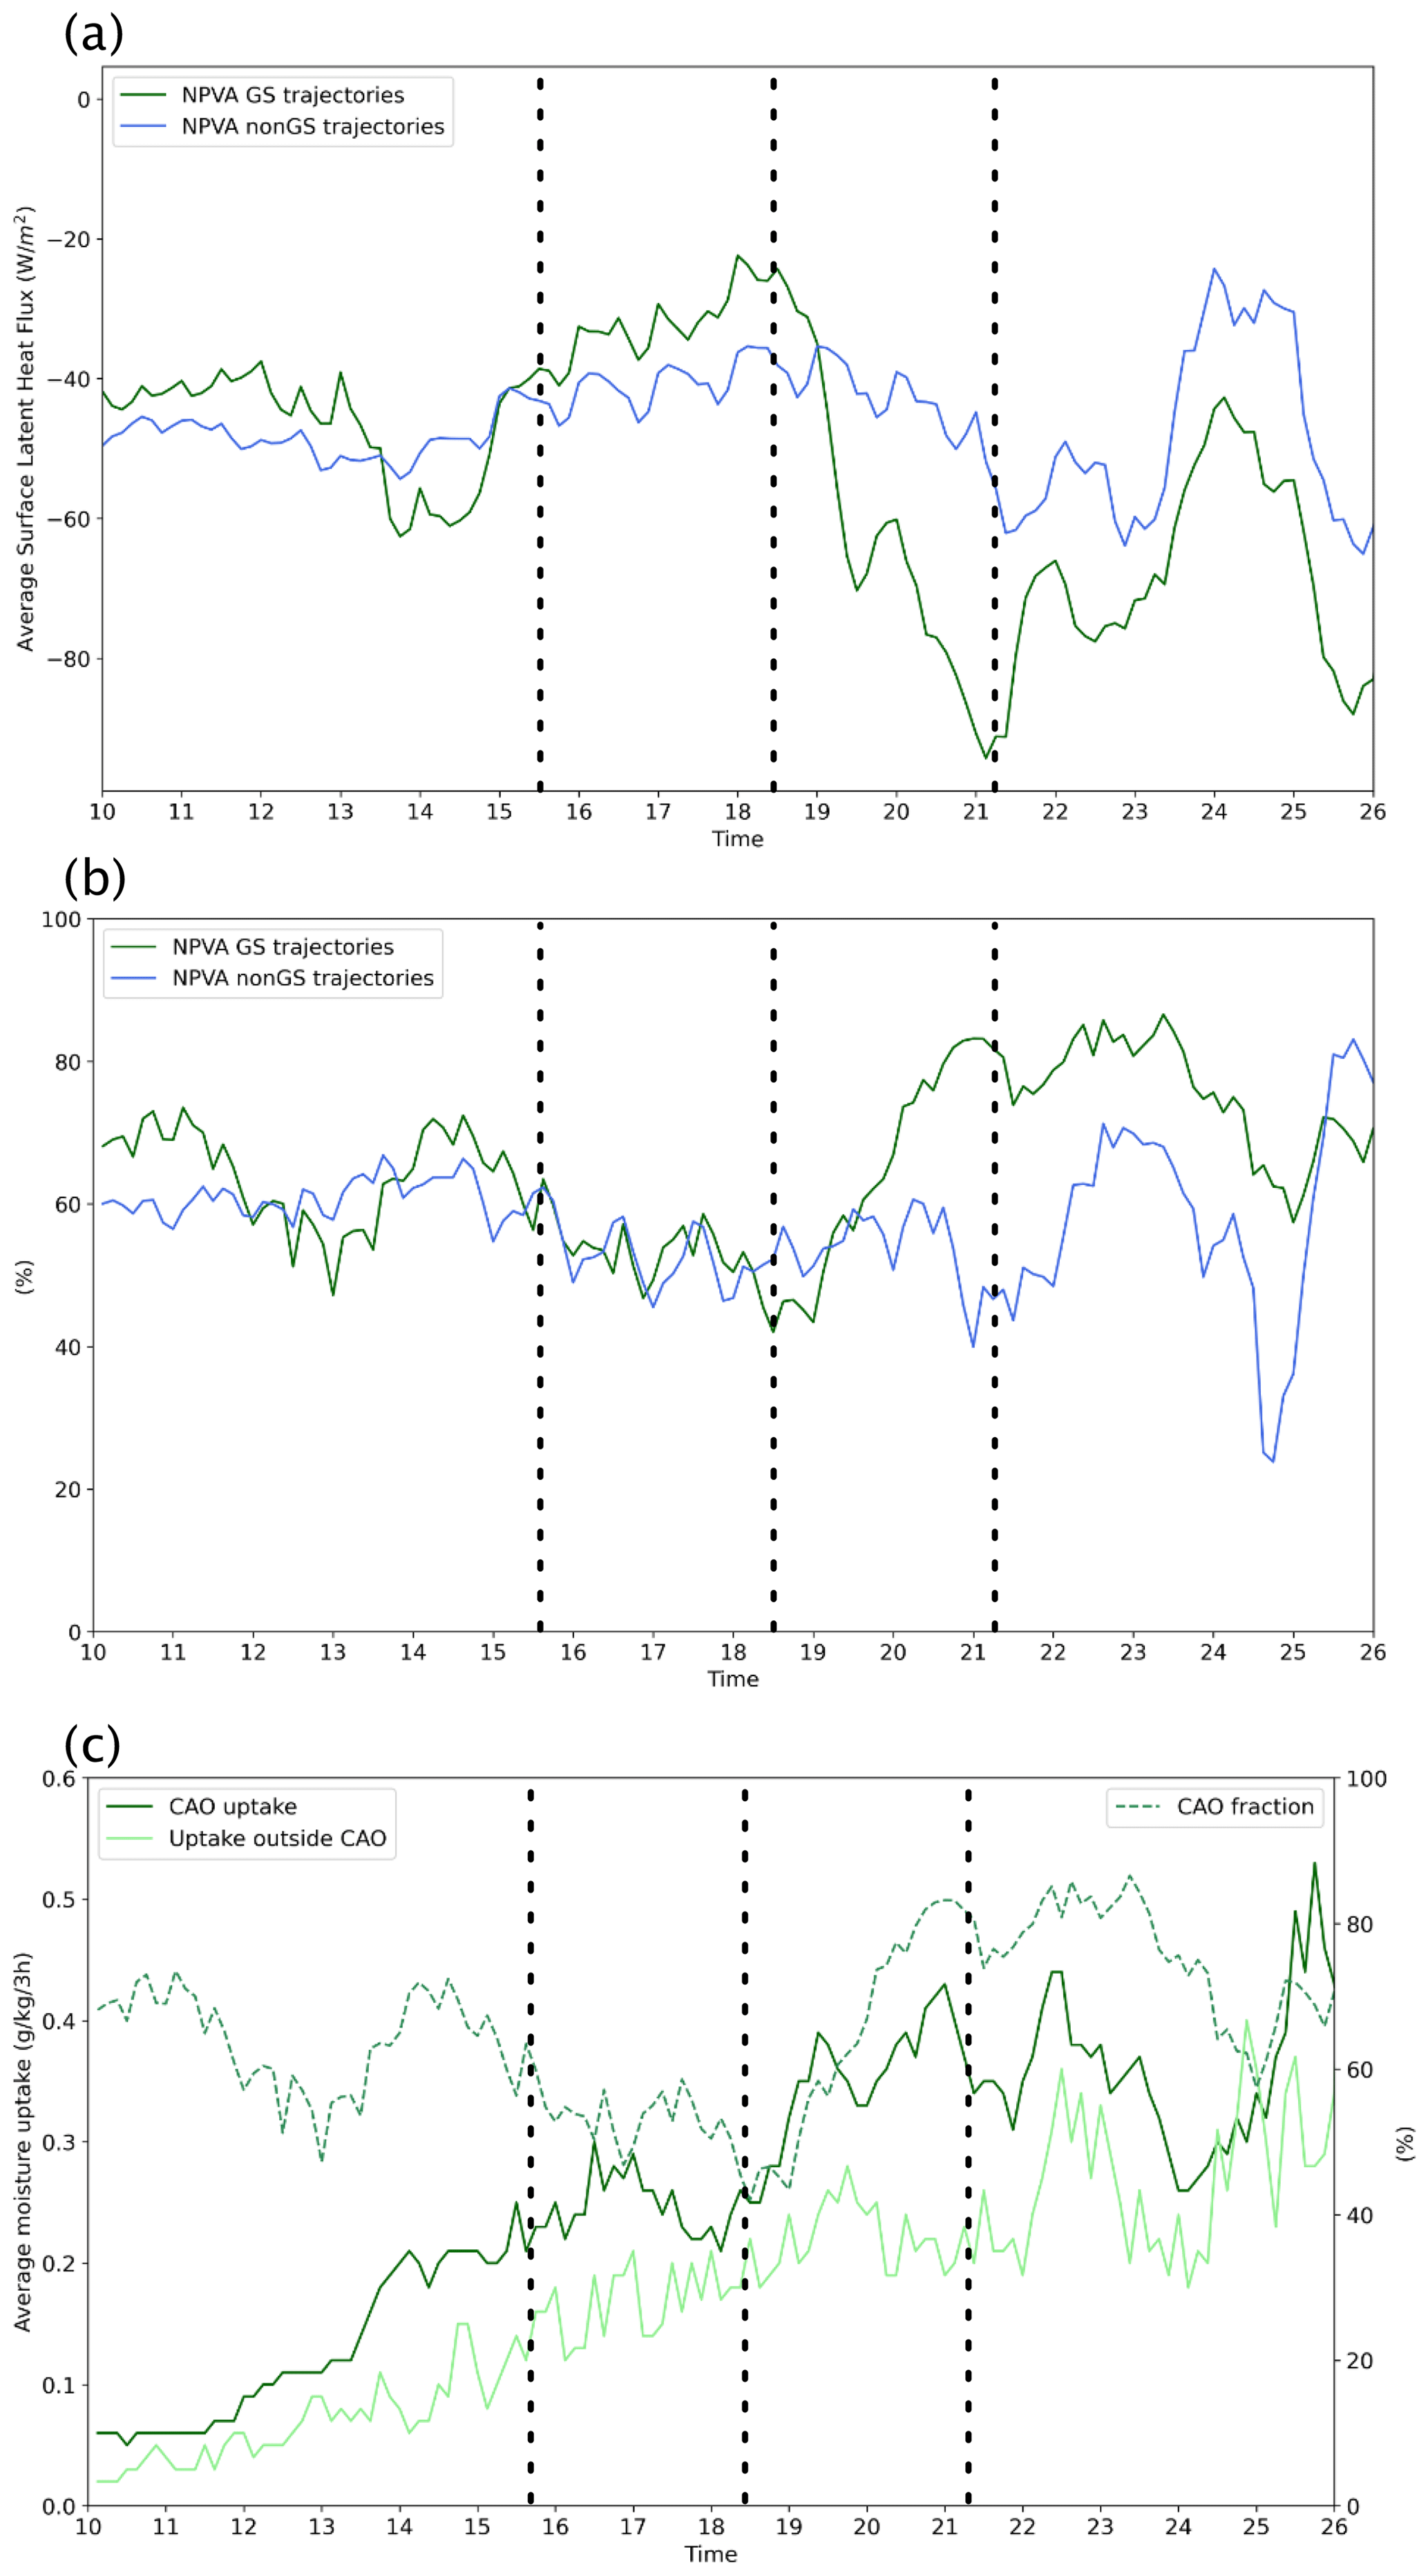
Figure 6Properties of the air parcels during moisture uptakes. (a) Average surface latent heat flux at the locations of moisture uptakes occurring at the times indicated on the x axis. The green line represents NPVA GS trajectories, while the blue line denotes NPVA nonGS trajectories. (b) Fraction of moisture uptakes taking place in the CAO regions (θSST−θ850); colors correspond to those in (a). (c) Average moisture uptake () for the time specified on the x axis. The dark green line represents uptakes for NPVA GS trajectories within CAO, while the light green line represents uptakes outside of CAO regions. The dashed green line indicates the fraction of moisture uptakes occurring within CAO regions for NPVA GS trajectories as in (b). Vertical dashed lines refer to cyclogenesis times of cyclones (from left to right): L0, L1, and L2 (Fig. 3).
These intense SLHF events are likely tied to pronounced CAOs, potentially triggered by cyclone L1 (Fig. 3). High surface heat fluxes, as pointed out by Tilinina et al. (2018), indicate that the cyclones responsible for these pronounced fluxes usually have greater depth and undergo quicker intensification. Our results support this perspective, as the highest fluxes experienced by NPVA GS air parcels coincide with the period when cyclones L1 and L2 are present in the North Atlantic (Fig. 6a). As depicted in Fig. 2d and f, both cyclones triggered significant CAO events which affected many of the NPVA GS air parcels present at the time in the lower troposphere. When focusing specifically on these trajectories, we observe that the average uptakes occurring in CAOs are consistently more intense than those outside CAOs, particularly between 19 and 22 February (Fig. 6c). This observation is consistent with insights from other studies (e.g., Papritz and Grams, 2018; Aemisegger and Papritz, 2018; Hawcroft et al., 2012), which highlight the pivotal role of CAOs in moisture-related dynamics. However, it remains poorly understood how air parcels moistened in the region behind a passing cyclone's cold front end up in the upper-level NPVA.
One possible explanation is the existence of the so-called hand-over mechanism described in detail by Papritz et al. (2021). They found that moisture precipitating in deep North Atlantic cyclones originates in the cold sector of a preceding cyclone and is fed into the ascent regions of the subsequent cyclone via the feeder airstream (Dacre et al., 2015). In order to explore the hand-over mechanism in our case study we now use the surface latent heat flux (SLHF) from ERA5 as a proxy for surface evaporation and relate it to the NPVA trajectories. Following the methods of Yamamoto et al. (2021) and Tilinina et al. (2018), we identified regions of maximum SLHF beneath the trajectories to locate the areas of the most intense surface evaporation. We also examined the locations where the trajectory ascent into the upper troposphere begins (Fig. 7).
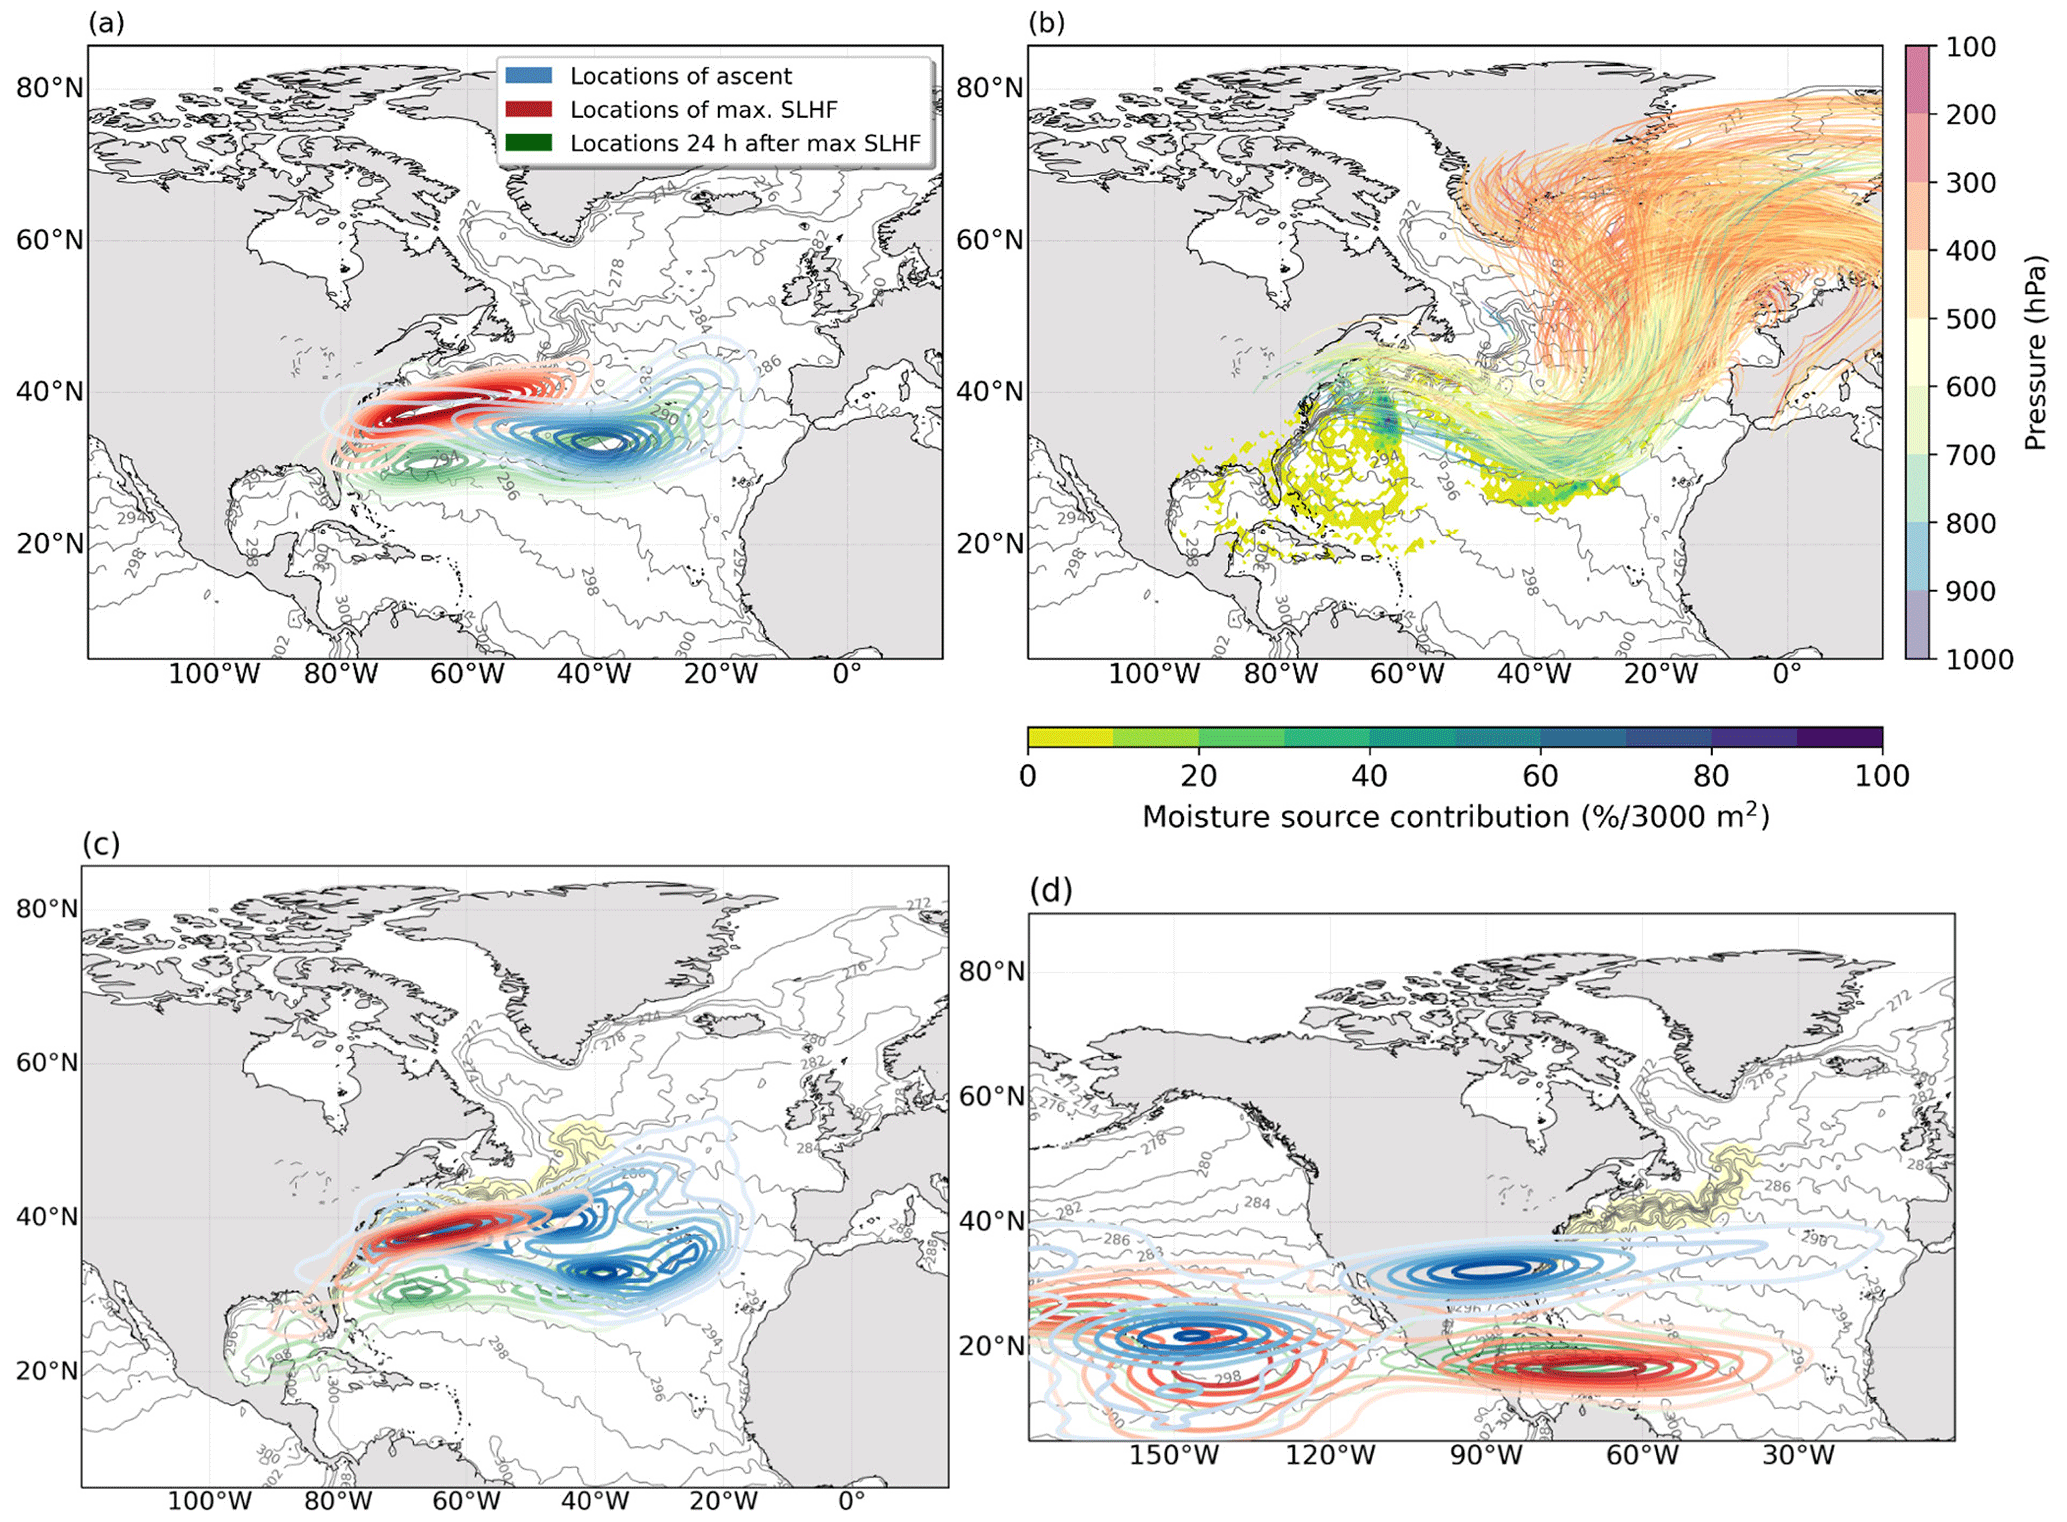
Figure 7Kernel density estimation (KDE; using Scott's rule; Scott, 2015) of air parcel locations at the time of maximum upward surface latent heat flux along trajectories (red contours), 24 h later (green contours), and when they start ascending (blue contours) (a) for NPVA GS trajectories starting on 24 February at 21:00 UTC and (c, d) for all trajectories starting between 20–28 February 2019 for (c) all the NPVA GS trajectories and for (d) all the NPVA nonGS trajectories. Contours represent 10 % steps of the density of air parcels. (b) NPVA GS trajectories starting on 24 February at 21:00 UTC colored in pressure height, together with moisture source contribution to total moisture present at the time of the start of ascent.
Figure 7a (red contours) illustrates the analysis for 24 February at 21:00 UTC, revealing that when air parcels of NPVA GS trajectories experience the most intense evaporation underneath, they are located below 800 hPa near the Gulf Stream and in areas with the highest CAO index values. The air parcels do not ascend immediately but remain in the atmospheric boundary layer for at least 24 h, being advected south and southeast with the cold air in the cyclone's cold sector (green contours in Fig. 7a). The ascent occurs approximately 54 h after the maximum SLHF values (blue contours in Fig. 7b), suggesting that the ascent might not be caused by the cyclone responsible for strong surface evaporation. Instead, our findings suggest that cyclone L2 (Fig. 3a) and subsequent cyclones might have a significant role in lifting the moistened air parcels into the upper troposphere's NPVA. This hypothesis aligns with the insights presented by Papritz et al. (2021). Drawing on the conclusions from their research, it can be inferred that cyclone L2 moves through a region of significantly modified, moisture-rich air, a result of cyclone L1's passage (Fig. 2b and d). This moist air subsequently becomes a part of the ascending flow within cyclone L2.
To explore whether the process detailed above is dominant in our case study, we conducted the analysis depicted in Fig. 7a for all the NPVA GS trajectories (Fig. 7c). Analyzed trajectories experience the most intense moistening along the Gulf Stream SST front (red contours). The moistened air moves south or southeast 1 d later, together with the air in the cyclone's cold sector (green contours). Trajectories begin their ascent into the upper troposphere (blue contours) on average 3.5 d after reaching maximum SLHF values (Table 3). This is very much in line with the exemplary trajectory discussed before and in stark contrast to NPVA nonGS trajectories. The latter primarily experience regions of the strongest surface evaporation in the subtropics near 20∘ N and remain there before making their ascent further north at a later time (Fig. 7d). The lingering of NPVA GS trajectories at low levels suggests that the involvement of multiple cyclones might be necessary for the entire chain of processes, i.e., moistening followed by ascent, to take place.
This notion is further supported by the analysis of the time difference between the time trajectories experiencing the strongest moisture uptake and the time when they start to ascend and their pressure drops below 800 hPa (Fig. 8). For NPVA GS trajectories, longer periods between the strongest moisture uptake and time of ascent are typical (green shading, Fig. 8). The probability density function features its highest density in the 20 to 60 h range. Following this peak, there is a significant drop in density past 60 h. However, the function then stabilizes, showing a consistent density level from 100 to 150 h before experiencing a steep fall-off, indicating a decrease in events with longer time differences between uptake and ascent. The 20 h peak corresponds to trajectories ascending directly from the Gulf Stream region (blue contours, Fig. 7c). The second peak, coupled with the high density of values exceeding 100 h, implies a significant temporal gap between moisture uptake and the start of ascent for the majority of NPVA GS trajectories. In contrast, NPVA nonGS trajectories show a single peak around 40 h and thus a rather immediate ascent after experiencing the strongest moisture uptake.
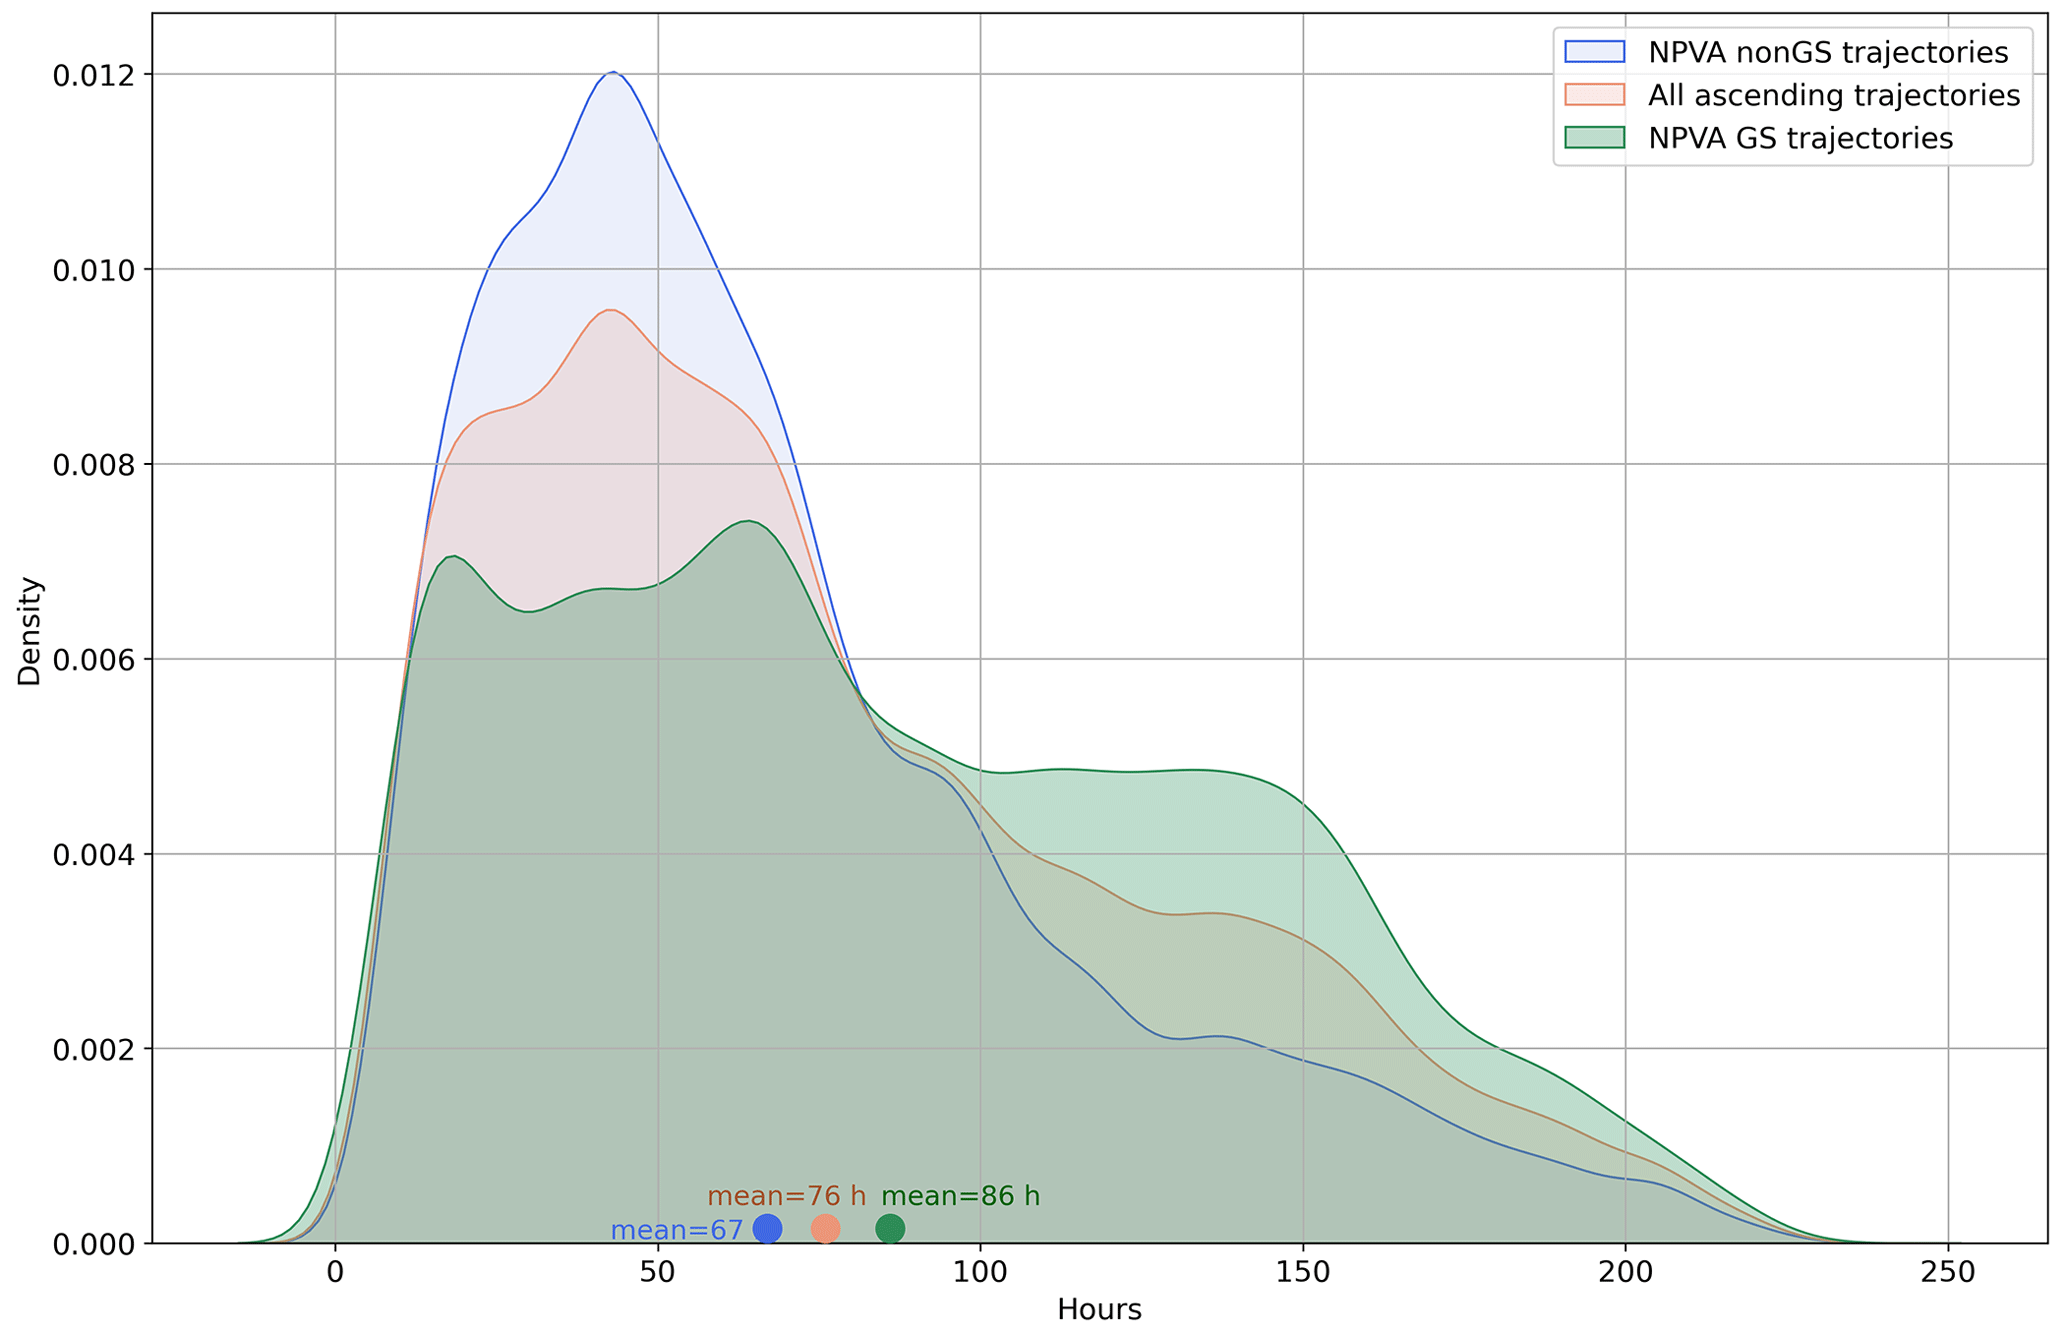
Figure 8Probability distribution function of the time difference between the strongest moisture uptake and the point at which the pressure decreases to below 800 hPa during the ascent (start of ascent) for NPVA (orange), NPVA GS (green), and NPVA nonGS (blue) trajectories (Table 1). Dots with labels represent mean values for each set of trajectories.
The statistics and results presented thus far hint at the relevance of a hand-over mechanism in our case study. However, to truly identify its presence and understand how signals from the Gulf Stream air–sea interactions are related to the upper troposphere, we delve deeper by computing various metrics for each initiation time of the trajectories. These metrics include average trajectory positions at a given time, density of strongest moisture uptakes, and the average times of ascent and strongest moisture uptake. Next, we plot these metrics alongside cyclone masks during the times of moisture uptake (represented by green contours) and the start of ascent (represented by red contours). Visual representations of this analysis are provided in Figs. 9 and 10 and in the Supplement (for each time step of the case study).
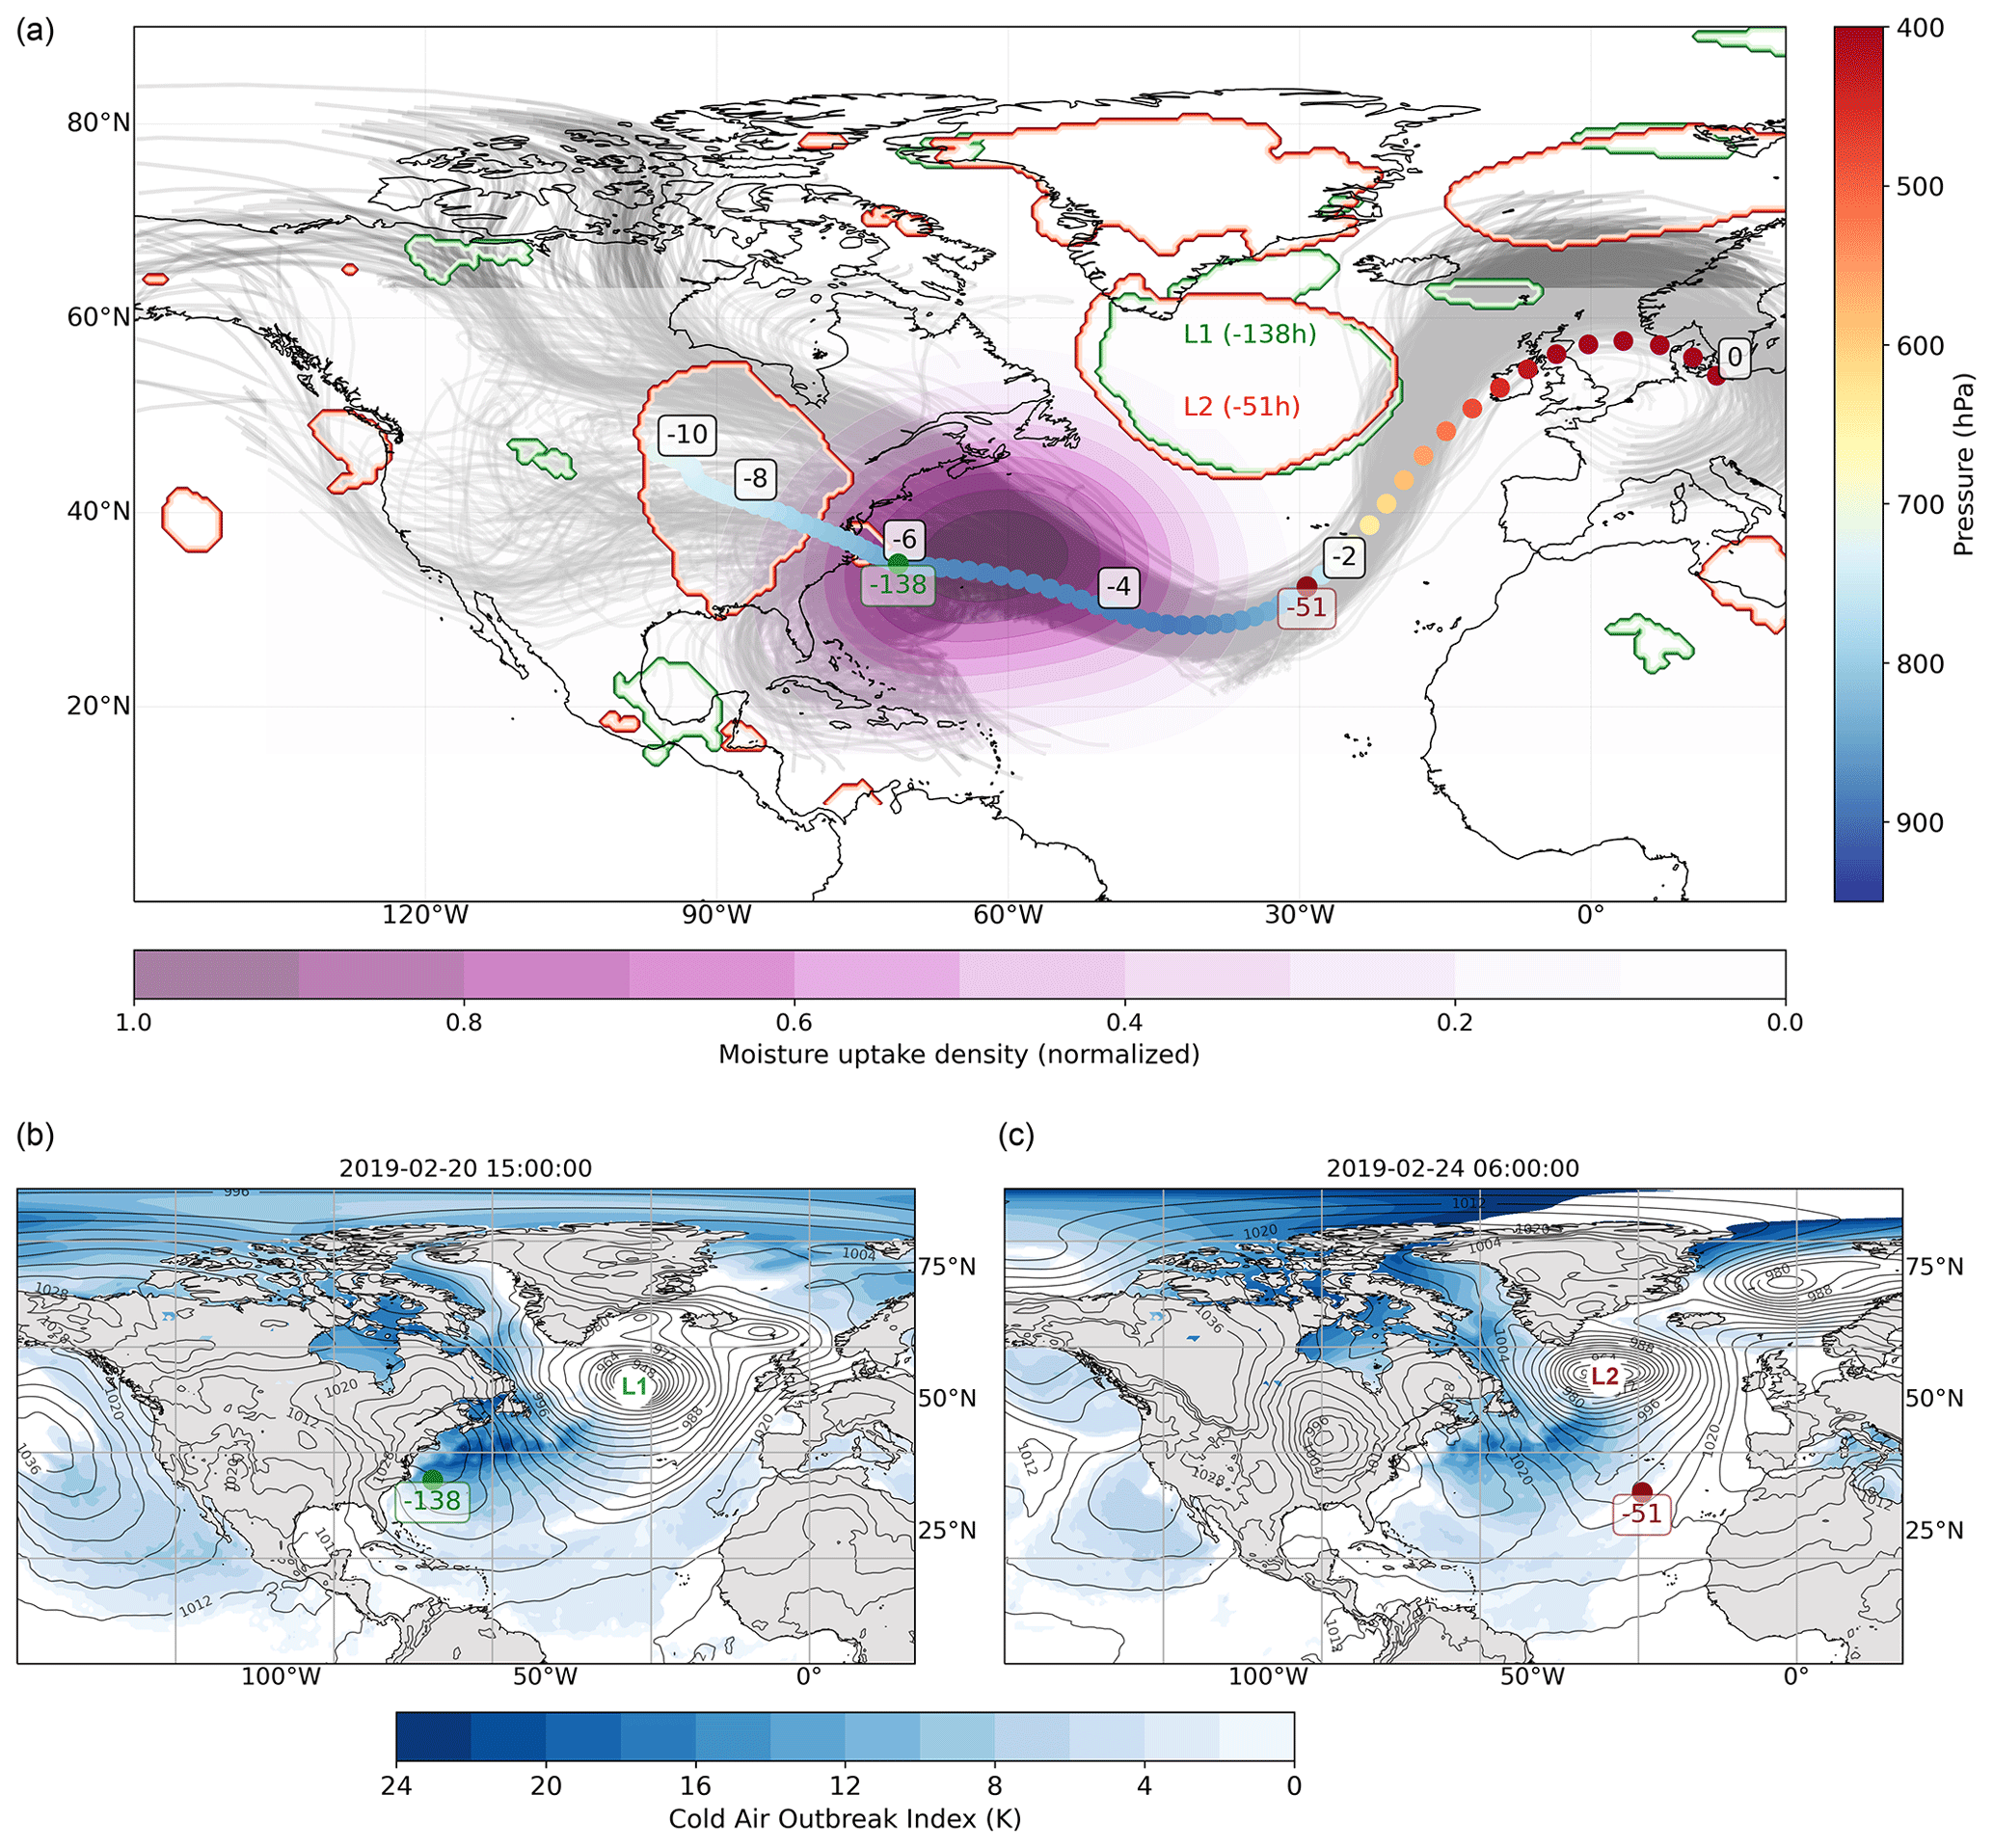
Figure 9The 10 d backward trajectories initialized on 26 February 2019 at 09:00 UTC. (a) Colored dots represent the mean location and pressure (hPa) of trajectories crossing latitude 30∘ N and longitude 50∘ W (to southeast), while light gray lines represent individual trajectories used for the calculation of the mean. Black labels mark days prior to arrival in the upper-level NPVA. The green dot (with its corresponding green label) indicates the average moisture uptake time (in hours) for the displayed trajectories, and the green contours outline cyclones present at that moment. The red dot (with its corresponding red label) indicates the average time of start of ascent (in hours) for the displayed trajectories, and the red contours outline cyclones present at that moment. Purple shading represents the normalized (0–1) density of the trajectory positions at the time of most intense moisture uptake. (b) Cold air outbreak index (K) (shading) and mean sea level pressure at the average time of most intense uptake (−138 h). (c) Same as (b) but for the average time of start of ascent (−51 h).
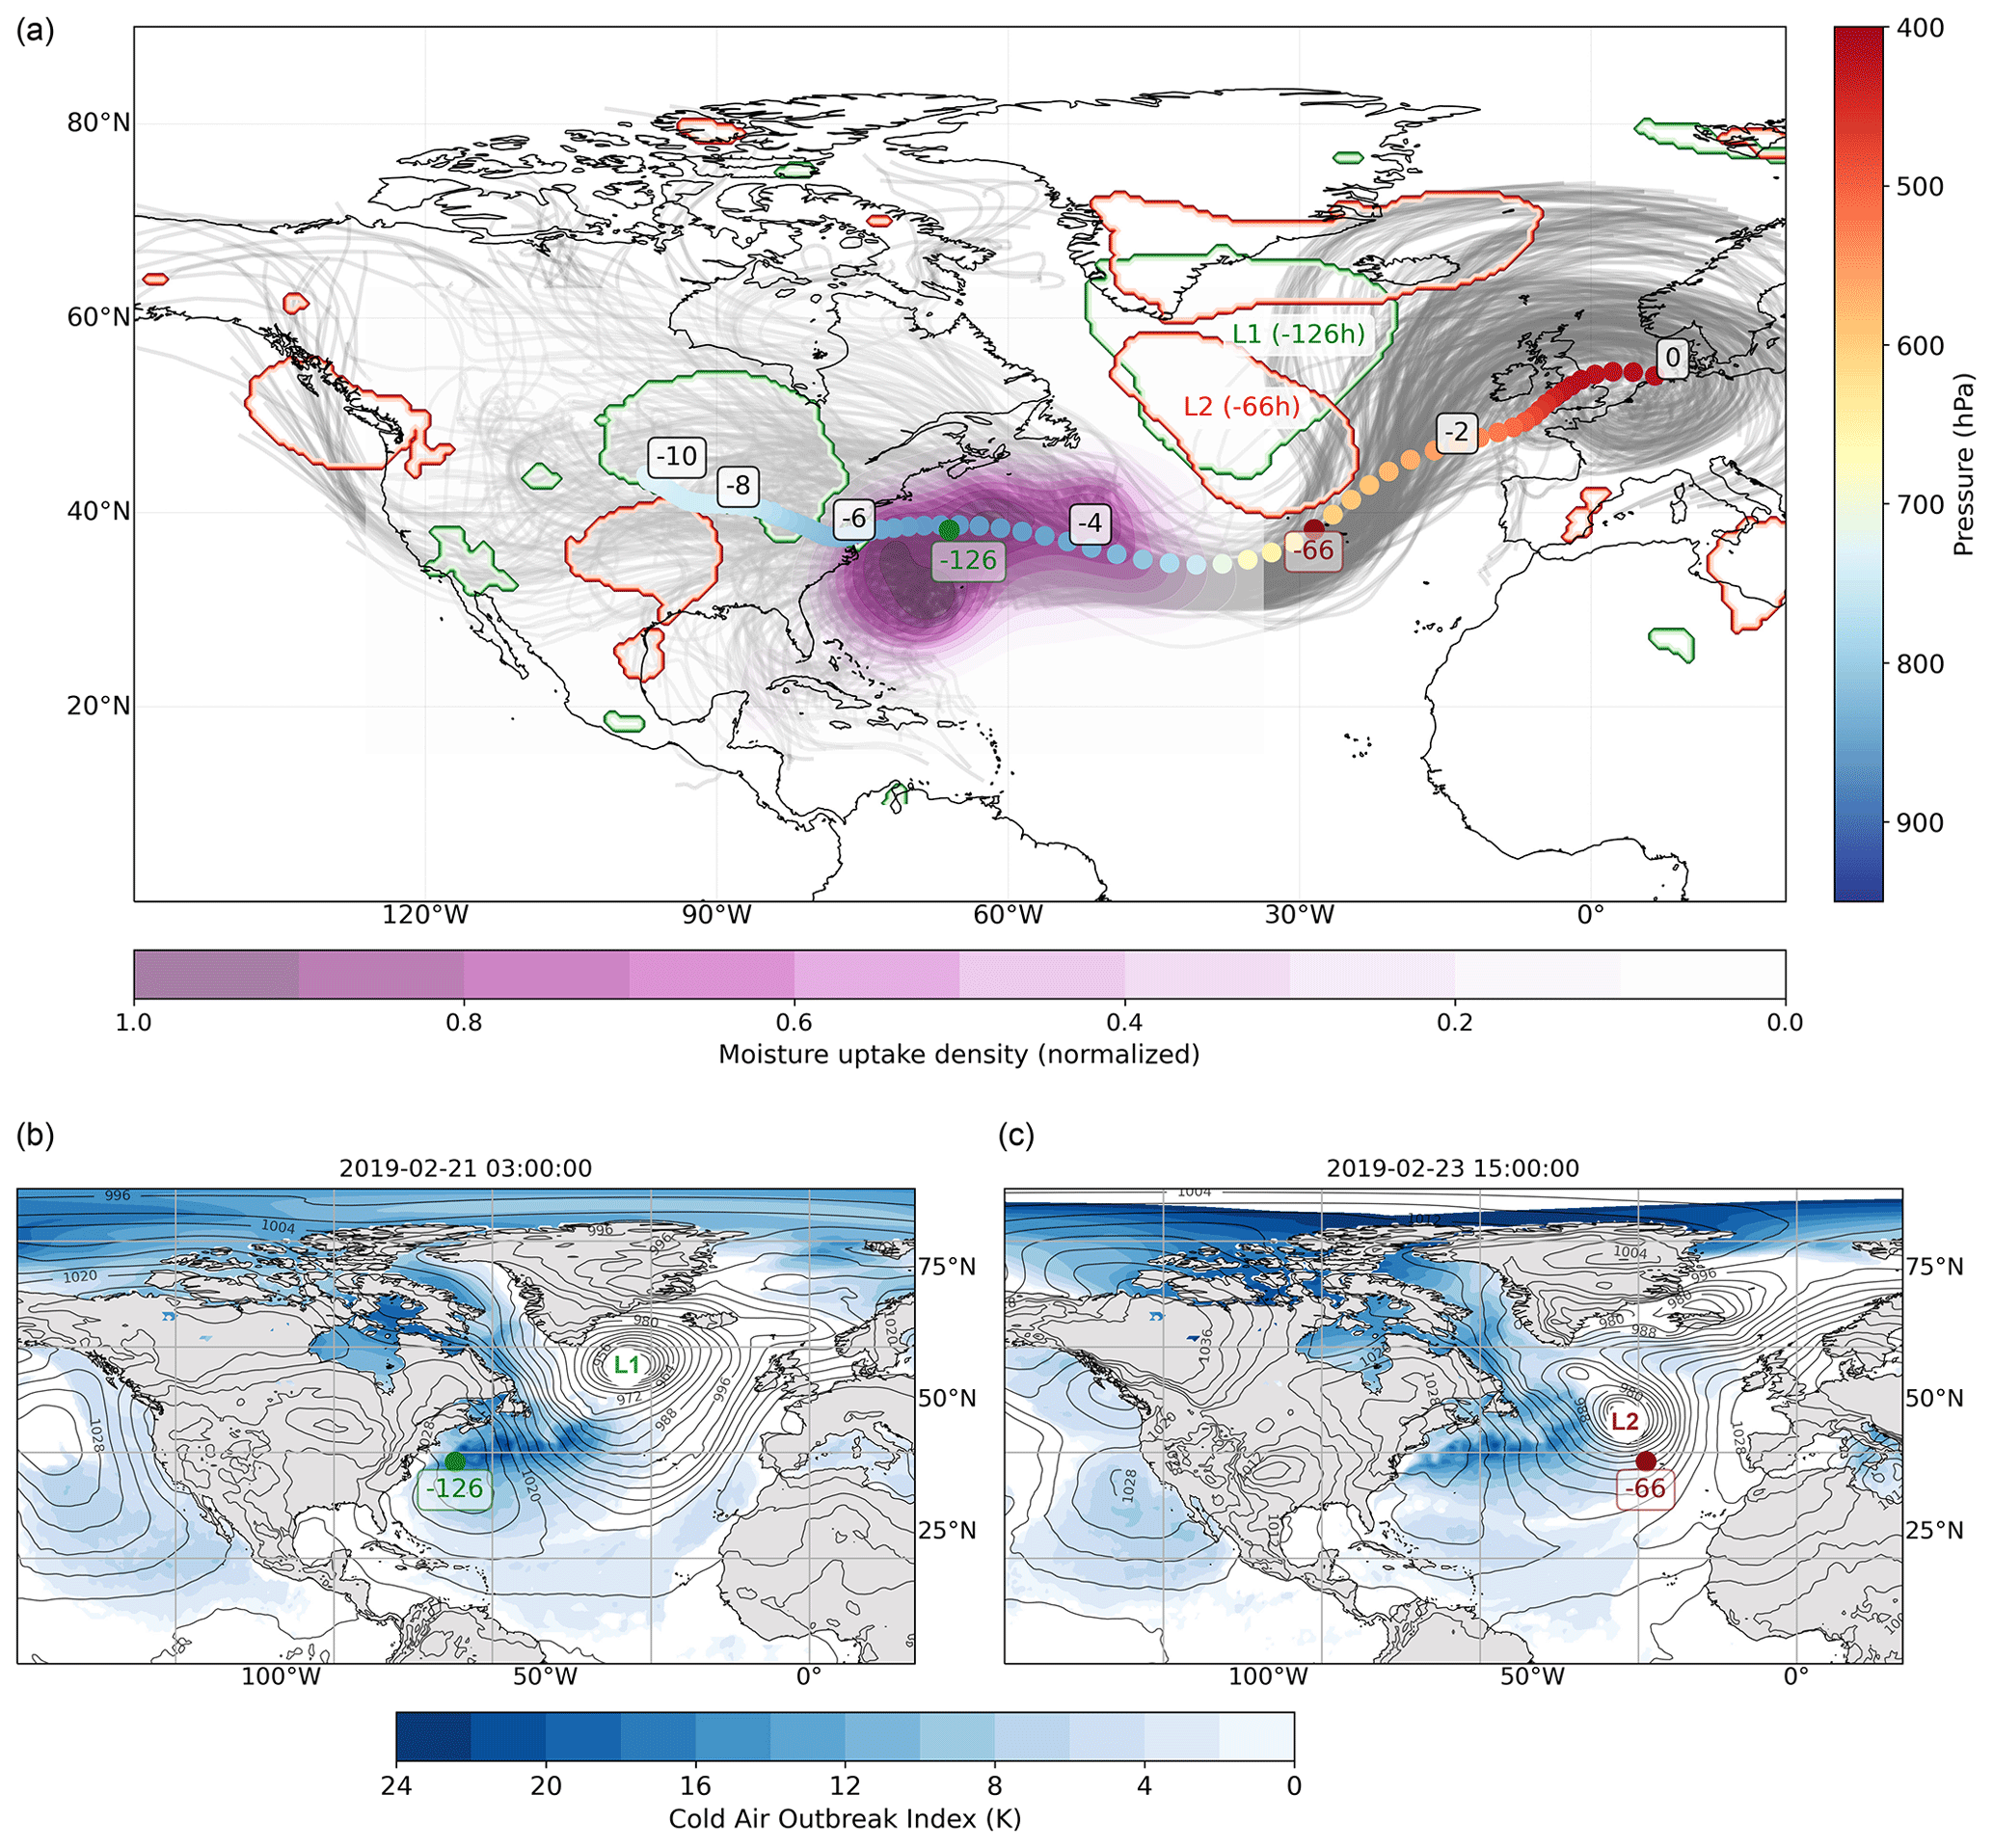
Figure 10Same as Fig. 9 but for trajectories that do not cross into the quadrant to the southeast of latitude 30∘ N and longitude 50∘ W.
In our analysis, we focus on the NPVA GS trajectories that were initiated on 26 February 2019 at 09:00 UTC (Figs. 9 and 10). This particular set of trajectories is chosen because their moisture uptake and subsequent ascent are closely linked to the activities of cyclones L1 and L2. For illustrative purposes, we categorize trajectories based on their initial direction after crossing the Gulf Stream. Those that move into the quadrant southeast of 30∘ N and 50∘ W are differentiated from those heading more eastward, as determined by tracing their paths forward in time towards the block. Such a division of the trajectories helps us pinpoint those that, before ascent, travel further south into the North Atlantic and are therefore likely to encounter the milder CAOs forming in that area after the passage of a rapidly intensifying cyclone. In the example depicted in Fig. 9, trajectories that after crossing the Gulf Stream move on a southeastward path constitute approximately 65 % of the NPVA GS trajectories starting on this specific date and time.
A total of 10 d before their initiation, these trajectories are located northwest of the Gulf Stream region (Fig. 9a). As they move towards the North Atlantic, they begin accumulating moisture 4–6 d before entering the block, particularly in a region stretching southeast from the Gulf Stream (purple shading, Fig. 9a). The strongest moisture uptakes occur around 138 h (∼5.75 d) prior to their entry into the block (green dot, Fig. 9a). As they continue traversing the North Atlantic, these trajectories begin ascending into the upper troposphere approximately 51 h (∼2 d) before reaching the upper-level NPVA (red dot, Fig. 9a). During both the moisture uptake (green contours) and ascent phases (red contours), two rapidly developing cyclones, L1 and L2 (Fig. 3), are observed south of Greenland, each influencing different phases. The majority of moisture uptakes happen in regions affected by a strong CAO (Fig. 9b), developing in the wake of cyclone L1, while the ascent mainly occurs in the warm sector of cyclone L2 (Fig. 9c).
For the remaining 34 % of NPVA GS trajectories starting on 26 February 2019 at 09:00 UTC, the Gulf Stream region also emerges as the primary moisture source. In this case, the moisture uptake events are more specifically concentrated around the Gulf Stream itself. On average, these trajectories accumulate moisture about 126 h (∼5.25 d) before their initiation (green dot in Fig. 10a). At that time (−126 h), cyclone L1 (green contour) is located south of Greenland, with a CAO event developing in its wake and the Gulf Stream region (Fig. 10b). The ascent of these trajectories occurs approximately 60 h later, ahead of cyclone L2 (red dot and contours, Fig. 10a and c).
While a series of cyclones plays a crucial role in the moistening and ascent of most trajectories in our study, it is particularly those trajectories which, when tracked forward in time, veer southeast after crossing the Gulf Stream that most clearly demonstrate the hand-over mechanism as detailed by Papritz et al. (2021) (Fig. 9). They account for approximately 30 % of all NPVA GS trajectories, with this proportion increasing to as much as 65 % at certain starting times (e.g., 26 February at 09:00 UTC; Fig. 9). These trajectories demonstrate a stronger alignment with the hand-over mechanism, collecting moisture in regions that cyclone L2 later traverses and intensifies over. Such a pattern suggests that they are fed into the cyclone as it advances towards the central North Atlantic. This behavior is even more distinct in trajectories associated with the ascending airstream of cyclone L1, such as those initiated on 21 February at 12:00 UTC (Fig. A1). In this case, moisture uptake extends far into the central North Atlantic, and trajectories undergo recirculation in that region prior to their ascent. Conversely, for trajectories that head eastward after crossing the Gulf Stream without entering the quadrant southeast of 30∘ N and 50∘ W, we find that moisture uptake is primarily concentrated within the Gulf Stream region itself. An analysis across all time steps (Supplement) indicates that this confinement to the Gulf Stream is typical for most instances in those trajectories. Such results suggest that while the Gulf Stream may create favorable conditions for the initial formation of cyclones, the main source of moisture in the warm sector of these cyclones, later on, comes from trajectories that have gathered moisture over large areas influenced by CAOs, triggered by an earlier cyclone.
Nevertheless, one consistent observation stands out when looking at Figs. 10a and 9a and the Supplement: the presence of a cyclone south of Greenland. Intriguingly, while both moisture uptake and ascent events feature a cyclone in this position, distinct cyclones are responsible for each of these processes. This suggests that a series of cyclones plays a pivotal role – initially moistening the NPVA GS trajectories thanks to the passage of one cyclone and subsequently lifting them into the upper troposphere with a subsequent cyclone. Moisture uptake can occur directly in the wake of a cyclone, during a CAO event initiated by the cyclone's passage, or in the cold sector of secondary cyclones that develop following a strong primary cyclone. This observation is consistent with findings from Papritz et al. (2021) and Dacre et al. (2019). They highlighted the localized origins of moisture sources for North Atlantic cyclones and underscored the significance of consecutive cyclone appearances in shaping the region's moisture cycle.
Based on the above findings, we conclude that during our study period, a succession of cyclones was essential for the evolution of trajectories crossing the Gulf Stream (NPVA GS trajectories). This pathway enabled them to accumulate moisture and subsequently rise into the upper troposphere, thereby influencing the block's dynamics. Our analysis thus sheds light on the mechanisms through which signals from Gulf Stream air–sea interactions reach the upper layers of the atmosphere. This understanding might also clarify why changes in SSTs in the western North Atlantic in model simulations lead to alterations in large-scale dynamics (e.g., Czaja et al., 2019; Athanasiadis et al., 2022; Scaife et al., 2011).
Our detailed case study of a European blocking event in February 2019 offers insights into how air–sea interactions over the Gulf Stream may be associated with the dynamics of an upper-level ridge. Although air masses identified as interacting with the Gulf Stream represent roughly 12 % of all trajectories originating within the block's region, we show evidence of their role in maintaining or enhancing the block's persistence. The potential importance of those air masses for the development of the block can be established based on the results of Steinfeld et al. (2020), who determined that critical features of the block, including extent, strength, and lifetime, are strongly affected by latent heating taking place in the ascending airstreams. Our analysis revealed that almost all of the Gulf Stream trajectories (representing ∼12 % of all NPVA base trajectories and ∼28 % of all ascending ones; Tables 1 and 2) experience diabatic heating during the first 3 d after starting from the blocking region. Additionally, trajectories that interact with the Gulf Stream exhibit a significantly higher proportion of diabatically heated trajectories (98 %) than those not traversing the Gulf Stream (54.7 %).
Our findings reveal that air warmed and moistened in the CAO regions induced by one cyclone can ascend into the upper troposphere through the upward airstream of a subsequent cyclone. This observation aligns with studies by Papritz et al. (2021), Dacre et al. (2019), and Sodemann and Stohl (2013), and the process is graphically illustrated in Fig. 11. When cyclone L1 moves across the western North Atlantic, it initiates a CAO behind its cold front (Fig. 11a), stretching southeast from the Gulf Stream region. This CAO is further intensified by the development of a secondary cyclone, labeled L1.1, developing behind L1. Those events initiate atmospheric boundary layer warming and moistening, with the most intense heat fluxes observed along the Gulf Stream SST front due to the sharp air–sea temperature gradient. Here, the majority of trajectories undergo substantial moisture uptake. Interestingly, trajectories that head further south, specifically moving southeast after crossing the Gulf Stream, tend to experience moisture uptake over a wider expanse of the ocean, as shown in Fig. 9. This is partly due to encountering additional moisture from the milder CAOs that occur over large areas of the North Atlantic in the aftermath of cyclone L1, as well as from a secondary cyclone L1.1 (Fig. 11a). After 63 h, a new cyclone, labeled L2, forms in the same location previously impacted by cyclone L1. This cyclone strengthens in areas influenced by the CAOs induced by cyclone L1. The already moistened and warmed air parcels are then channeled into the warm sector of cyclone L2, contributing to the air parcels' ascent into the upper layers of the troposphere.
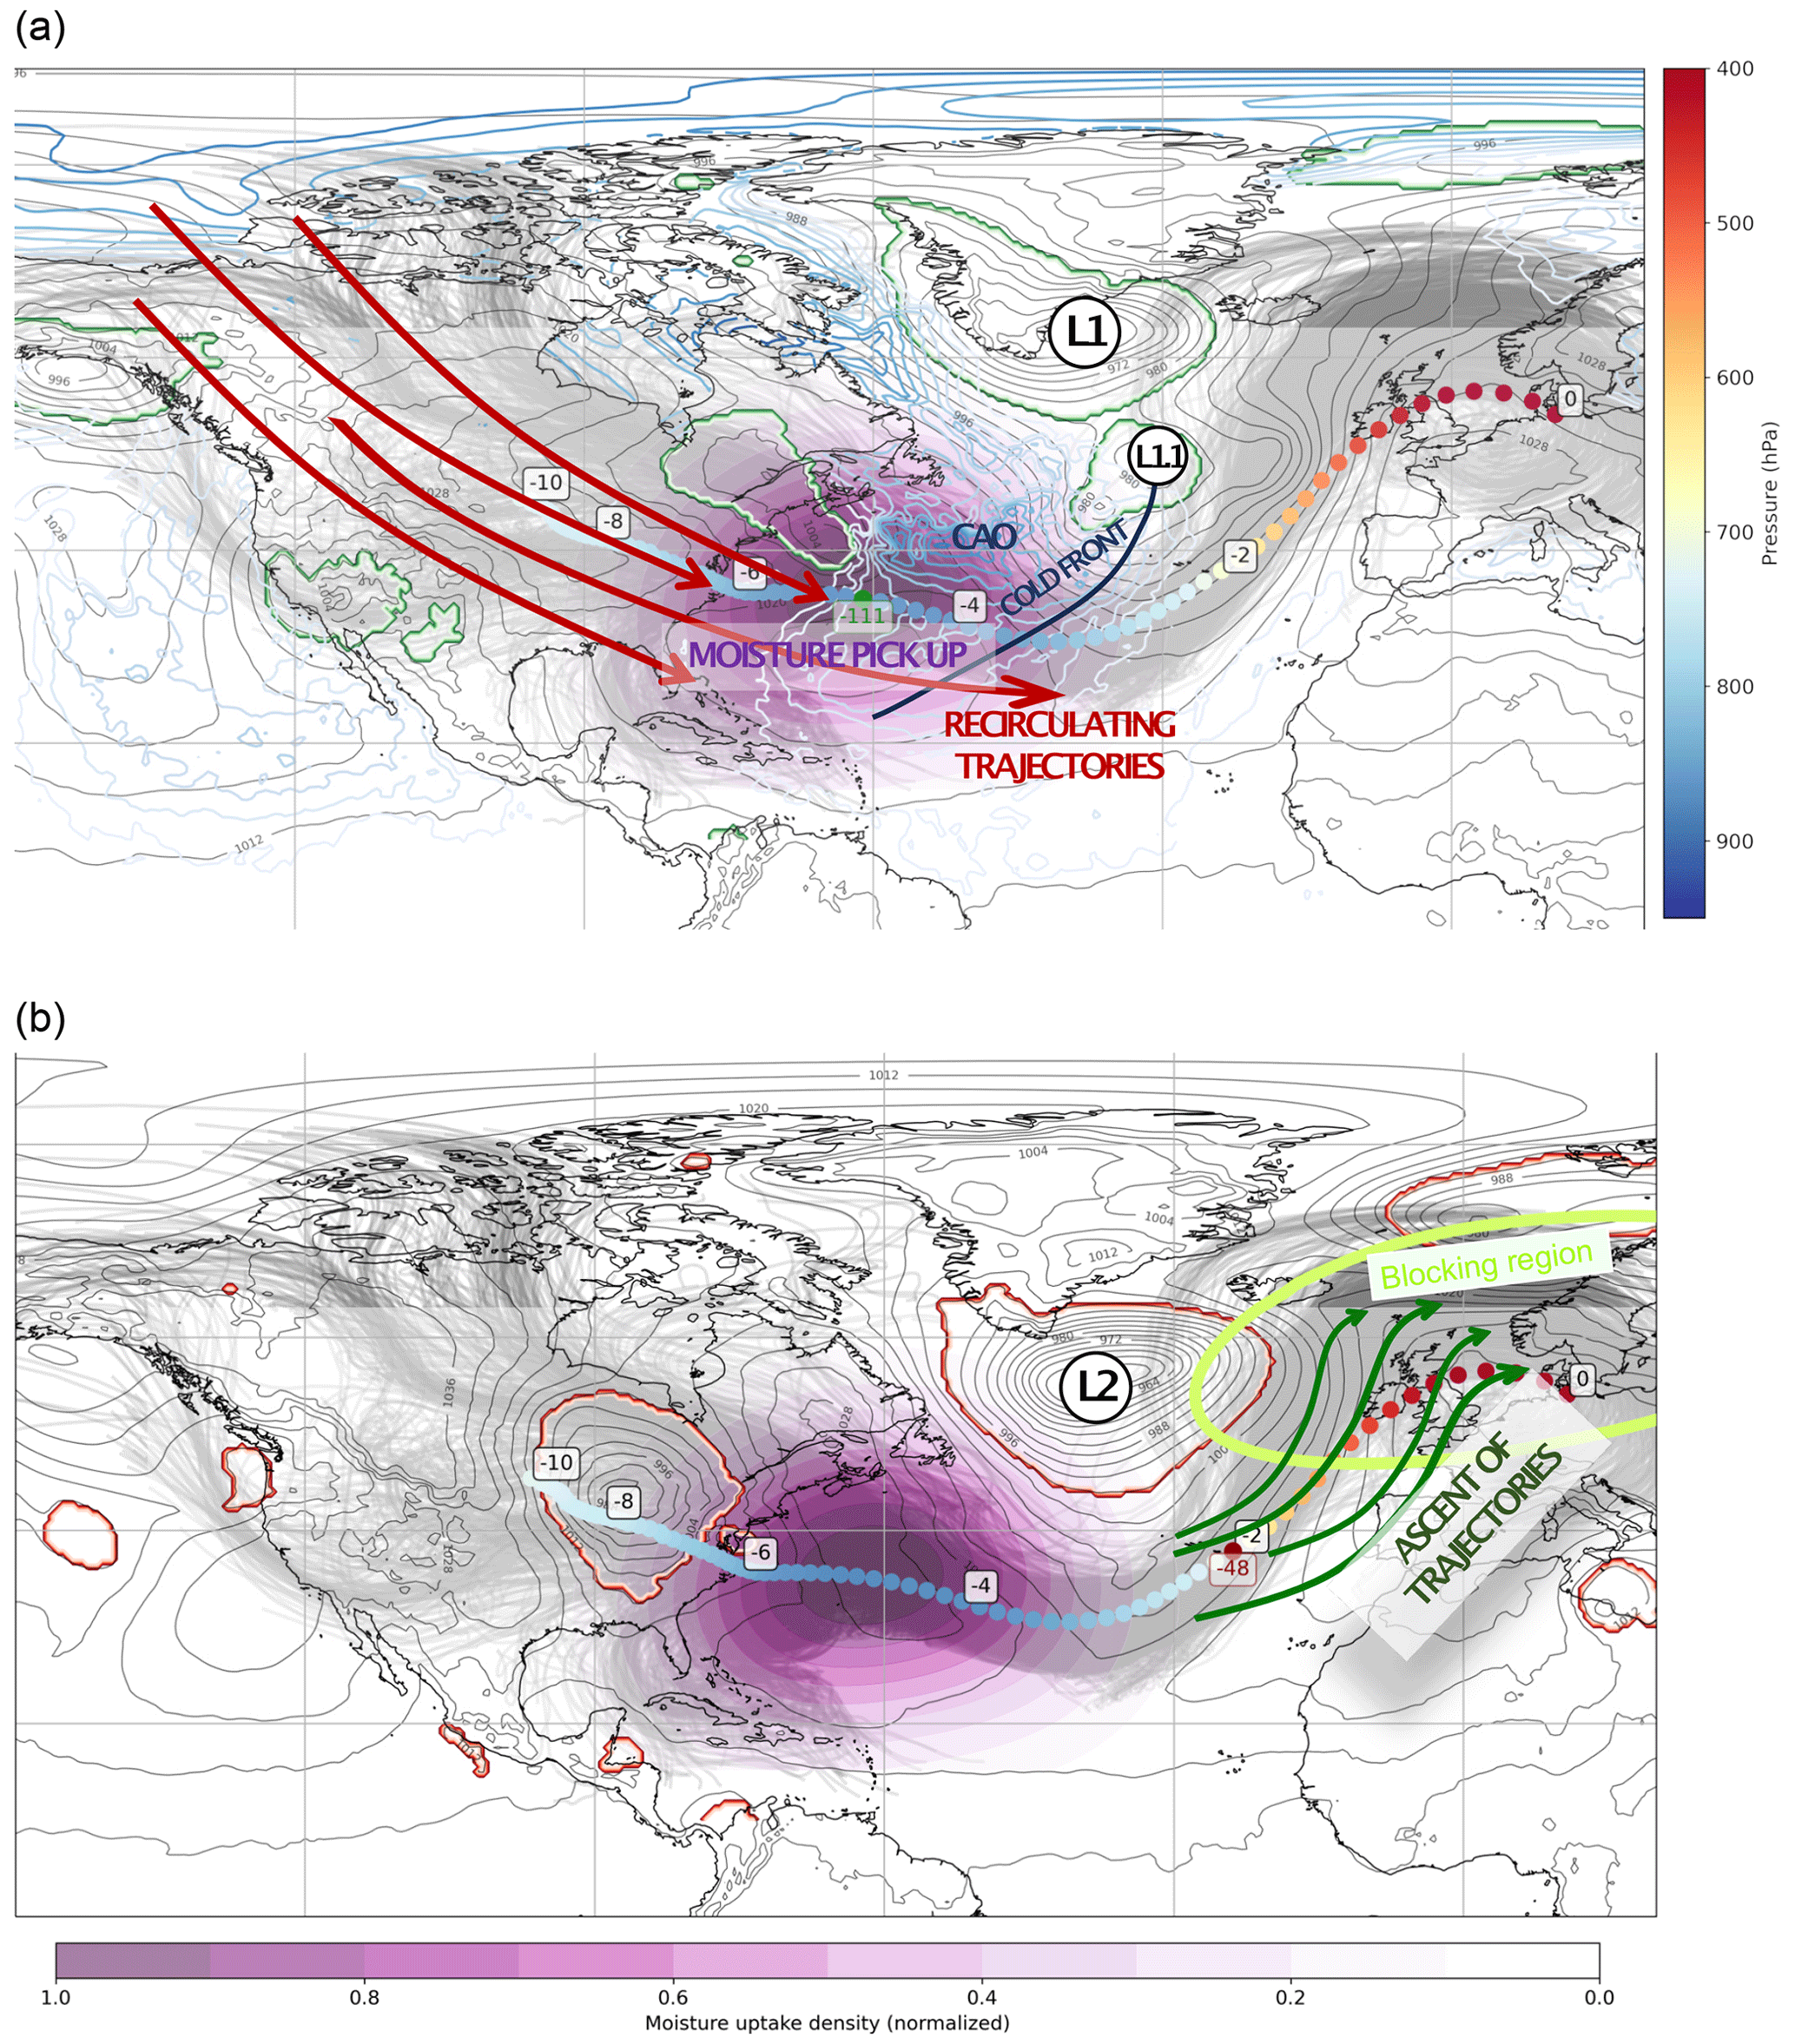
Figure 11Schematic illustrating the link between cyclones and the pathways of NPVA GS trajectories based on the trajectories initiated from the upper-level NPVA on 26 February at 09:00 UTC. (a) The synoptic situation at the average moisture pick-up time on 21 February at 18:00 UTC. Black contours depict the mean sea level pressure (hPa), green contours represent cyclone masks, purple shading indicates the normalized density of moisture uptake locations, and blue contours show the cold air outbreak index (K). (b) Same as (a) but corresponding to the average start time of trajectory ascent on 24 February at 09:00 UTC, with red contours highlighting cyclone masks and green contours showing the area of the block.
Our results particularly highlight the hand-over mechanism in trajectories categorized as “recirculating” (Fig. 11, Supplement) – those traveling further southeast, behind the cold front of the first cyclone. Their behavior aligns more closely with the feeder airstream concept, as described by Papritz et al. (2021) and Dacre et al. (2019), since their moisture uptake is not strictly limited to the narrow area around the Gulf Stream but extends across the storm's track. Therefore, when the cyclone's warm sector encounters this significantly modified, moist, and warm air, it is subsequently drawn into its ascending airstream. Additionally, we infer that air warmed and moistened in the narrow Gulf Stream region initially supplies moisture to the newly developing cyclone, while later stages, related to the cyclone's intensification, see moisture contributions from a broader area of the North Atlantic. Crucially, our study reveals a key insight: the interaction of at least two cyclones with the Gulf Stream is vital for achieving both the moistening of air masses and their subsequent ascent into the upper troposphere. Additionally, our data suggest a potential preconditioning role played by a preceding cyclone, which helps in the formation and intensification of subsequent cyclones. This phenomenon is evident as several cyclones in our study traverse and strengthen within the area of the ocean affected by CAOs initiated by preceding cyclones (Fig. 2).
The Gulf Stream region serves as an important moisture source for those NPVA trajectories that passed over it in the lower troposphere, in agreement with the results of Yamamoto et al. (2021) and Pfahl et al. (2014). In fact, the Gulf Stream contributes most of the moisture present in the air prior to its ascent. Those findings imply that the moisture sources for extratropical cyclones in the North Atlantic have a regional character and are concentrated in areas where there is a strong ocean–atmosphere temperature contrast. Another area of moistening of the atmospheric boundary layer is found in the central North Atlantic, south of the Gulf Stream's eastward extension. This area is frequently affected by the advection of cold air from the Labrador Sea or the passage of a cyclone, which provides conditions for strong air–sea interactions. In fact, the cyclones recognized as rapidly intensifying propagate into this stretch of the ocean, while several of the secondary cyclones originate there (Fig. 3). The consistent occurrence of cyclones in areas with intense surface evaporation suggests a “preconditioning” for cyclone development, as described by Papritz et al. (2021).
It should be noted that the subtropical regions of the Caribbean seas and eastern North Pacific are significant moisture sources for airstreams progressing to the block, with the NPVA nonGS trajectories comprising 72 % of the trajectories. However, these airstreams predominantly ascend in regions such as the Gulf of Mexico and the Pacific Ocean, which lie outside the main cyclonic activity in the western North Atlantic.
A study by Papritz and Grams (2018) suggests that weather regimes modulate the occurrence of CAOs. However, our findings present a more intricate picture where this relationship appears mutual. During our observed period, CAOs predominantly arose due to the advection of cold air in the wake of cold fronts from passing cyclones, particularly in the Gulf Stream region and its extension. Such CAOs not only induce intense surface heat fluxes, which are essential for maintaining baroclinicity (Papritz and Spengler, 2015), but also play pivotal roles in sustaining the storm track (Aemisegger and Papritz, 2018). Furthermore, they promote the formation of rapidly intensifying low-pressure systems, essential for the growth of atmospheric blocks (Colucci, 1985; Colucci and Alberta, 1996). In tandem, these CAOs create conditions favorable for vigorous evaporation events in the western North Atlantic. This abundant moisture aids the swift intensification of cyclones and the genesis of secondary low-pressure systems, contributing to the northward expansion of an upper-level ridge. This, in turn, weakens the zonal flow, paving the way for further CAO development and subsequent intense surface evaporation events (Kautz et al., 2022; Gao et al., 2015). It is also worth noting that these pronounced oceanic evaporation events are instrumental for the emergence of WCBs (Pfahl et al., 2014; Eckhardt et al., 2004), which contribute to the formation of low-PV anomalies in the upper troposphere (Pfahl et al., 2015; Steinfeld and Pfahl, 2019; Methven, 2015).
While our study concentrates on a limited set of trajectories in comparison to all trajectories initiated from the NPVA objects, it is important to note that air parcels modified over the Gulf Stream could play a role in either strengthening or maintaining the block.
To summarize, our study provides a possible explanation for a mechanistic link between air–sea interactions over the Gulf Stream region and the formation of blocks over the North Atlantic and European regions. It also underscores the potential significance of the boundary layer modification by CAOs and the associated strong air–sea interactions in the formation or preservation of a quasi-stationary, upper-level ridge. In light of the growing evidence suggesting that biases in North Atlantic SST representation are linked to model inaccuracies in block prediction (e.g., Athanasiadis et al., 2022; Czaja et al., 2019; Kwon et al., 2020), it is vital to clarify how the processes taking place in the lower troposphere over the western North Atlantic are connected with the dynamics in the upper levels. Additionally, the recurrent influence of SST observed in climatological studies (Michel et al., 2023; Omrani et al., 2019; Scaife et al., 2011) implies that the mechanisms linking the Gulf Stream, diabatic processes, and large-scale extratropical circulation might be relevant on a climatological scale. Nevertheless, it is essential to note that a single case study cannot be used to draw any general conclusions. However, considering the fact that singular aspects of our analysis are in agreement with recent publications focusing on moisture transport in the North Atlantic and the formation of blocks (e.g., Papritz et al., 2021; Aemisegger and Papritz, 2018; Hirata et al., 2019; Yamamoto et al., 2021; Steinfeld et al., 2020; Dacre et al., 2019), it provides a basis for further research. Therefore, in a subsequent study, we are going to analyze those relationships using a similar trajectory dataset spanning 40 years of ERA5 data. Using the methods applied in this case study, we will aim to establish whether the air–sea interactions over the Gulf Stream modulate the large-scale dynamics and formation of blocked weather regimes over Europe and to identify the predominant way by which the signal from the lower troposphere is transferred to the upper-level flow.
In the course of our study, we consistently observed the presence of negative PV during the inflow stage of trajectories, defined as the phase preceding ascent when trajectories are confined within the atmospheric boundary layer (pressure exceeding 800 hPa). Upon further examination, we found that 82 % of NPVA GS trajectories displayed negative PV values at certain intervals prior to their ascent. Given the potential significance of this feature (Methven, 2015), we chose to examine it more closely.
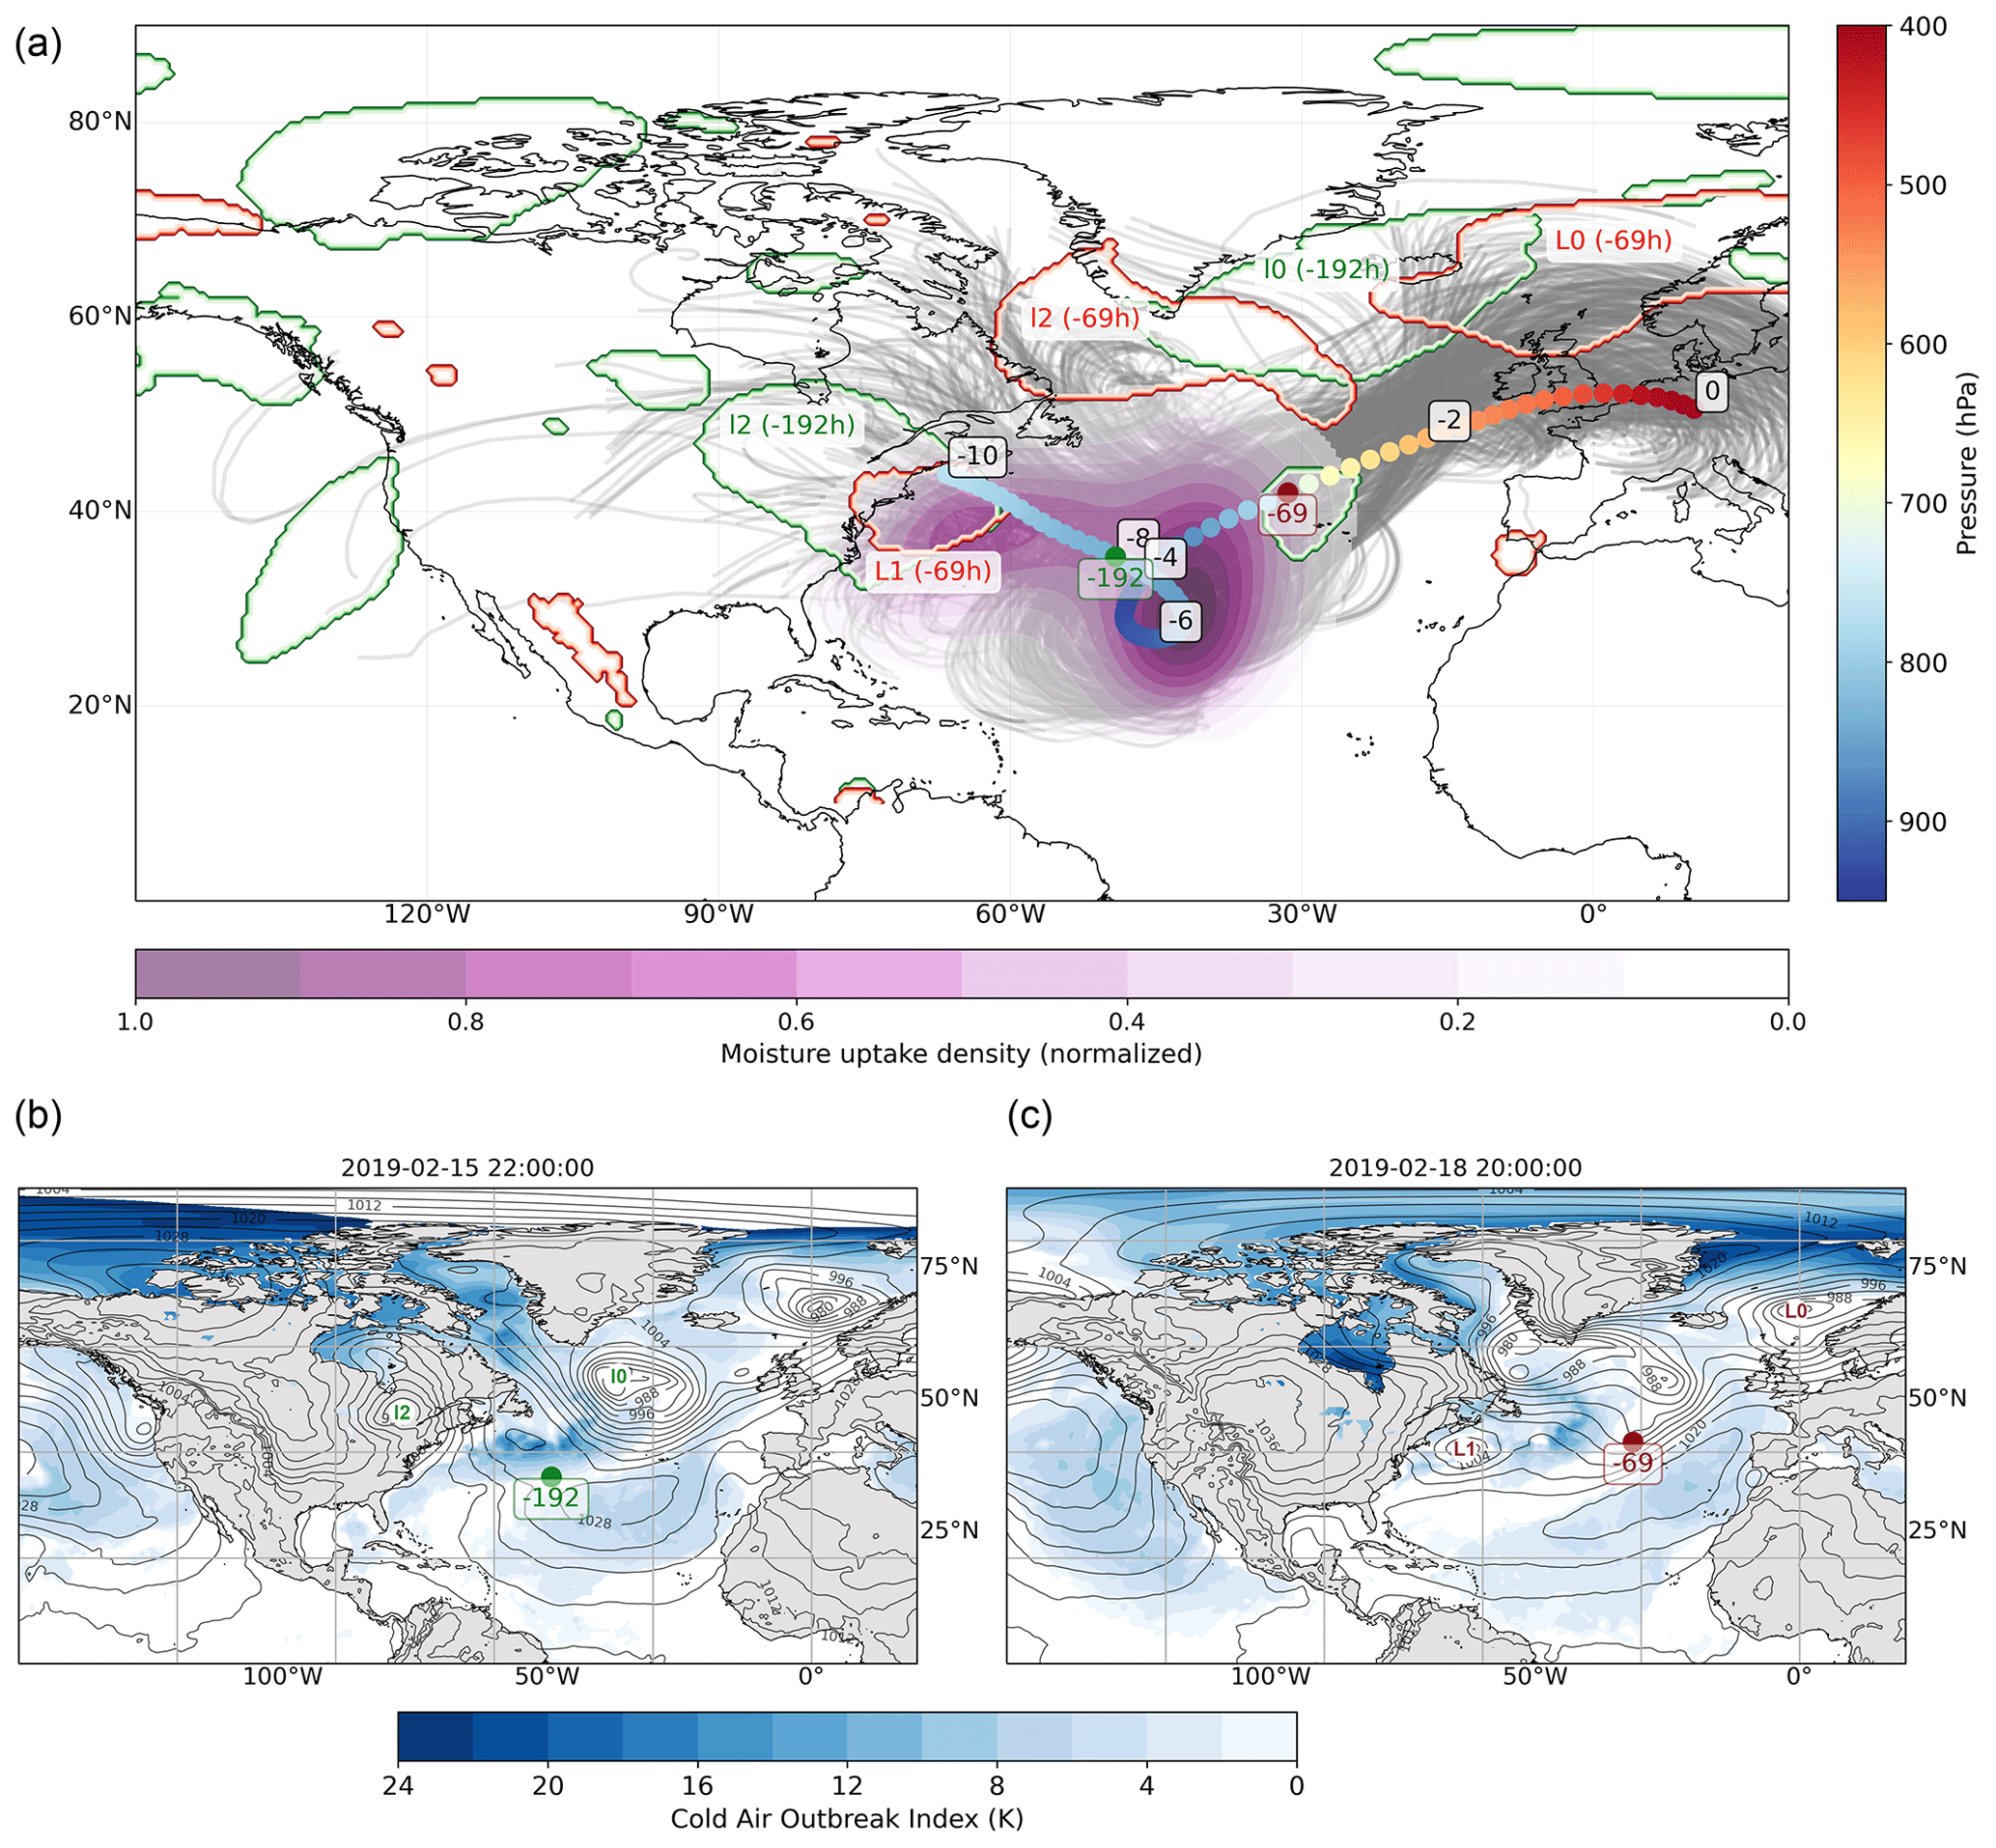
Figure A1The 10 d backward trajectories initialized on 21 February 2019 at 12:00 UTC. (a) Colored dots represent the mean location and pressure (hPa) of trajectories crossing latitude 30∘ N and longitude 50∘ W (to southeast), while light gray lines represent individual trajectories used for the calculation of the mean. Black labels mark days prior to arrival in the upper-level NPVA. The green dot (with its corresponding green label) indicates the average moisture uptake time (in hours) for the displayed trajectories, and the green contours outline cyclones present at that moment. The red dot (with its corresponding red label) indicates the average time of start of ascent (in hours) for the displayed trajectories, and the red contours outline cyclones present at that moment. Purple shading represents the normalized (0–1) density of the trajectory positions at the time of most intense moisture uptake. (b) Cold air outbreak index (K) (shading) and mean sea level pressure at the average time of most intense uptake (−192 h). (c) Same as (b) but for the average time of start of ascent (−69 h).
To explore the role of air parcels with negative PV in the formation of upper-level negative PV anomalies (NPVAs) we divided the NPVA GS trajectories into two subsets: those with negative PV (NPVA GS negPV trajectories, 82 % of all NPVA GS trajectories) and those with continuous positive PV (NPVA GS posPV trajectories, 18 % of NPVA GS trajectories) in the lower troposphere. To investigate the potential influence of negative PV in the lower troposphere on the formation of upper-level NPVA, we examined the inflow and outflow stages of ascent. Specifically, we re-centered the time evolution of the trajectories at the time of maximum heating, which is indicative of the release of latent heat during upward air mass movement. By comparing the two sets of trajectories, we aim to determine whether the presence of negative-PV air in the inflow stage of the ascending airstream leads to the formation of low-PV air in the upper troposphere. Our results show that the NPVA GS negPV trajectories are located in the lower layers of the troposphere (Fig. A2a) and experience more intensive heating during the ascent (Fig. A2b). Without indicating a cause-and-effect connection, greater fluxes in the inflow stage (Fig. A2c and d) and elevated moisture content during the ascent (Fig. A2f) co-occur with a rise in heating intensity throughout the ascent. Interestingly, despite experiencing negative values of PV in the atmospheric boundary layer and a strong heating rate, the PV of the NPVA GS negPV trajectories is not lower than that of the NPVA GS posPV trajectories in the upper troposphere (Fig. A2e), nor do they reach a higher outflow height (Fig. A2a, b). In fact, the NPVA GS negPV trajectories typically begin at a lower altitude, and as a result, more heating is required for these trajectories to achieve a comparable outflow height to that of the NPVA GS negPV trajectories. Surprisingly, the PV values in the NPVA GS negPV trajectories are even slightly higher when reaching the upper troposphere. Furthermore, we note that air masses with only positive PV values have limited interactions with CAOs. This is evident from the temporal variations in latent and sensible heat fluxes observed in the two trajectory types. In fact, our analysis reveals that 85 % of negative PV values are located within CAO regions. This suggests that the processes during CAOs might play a pivotal role in reducing PV in the atmospheric boundary layer.
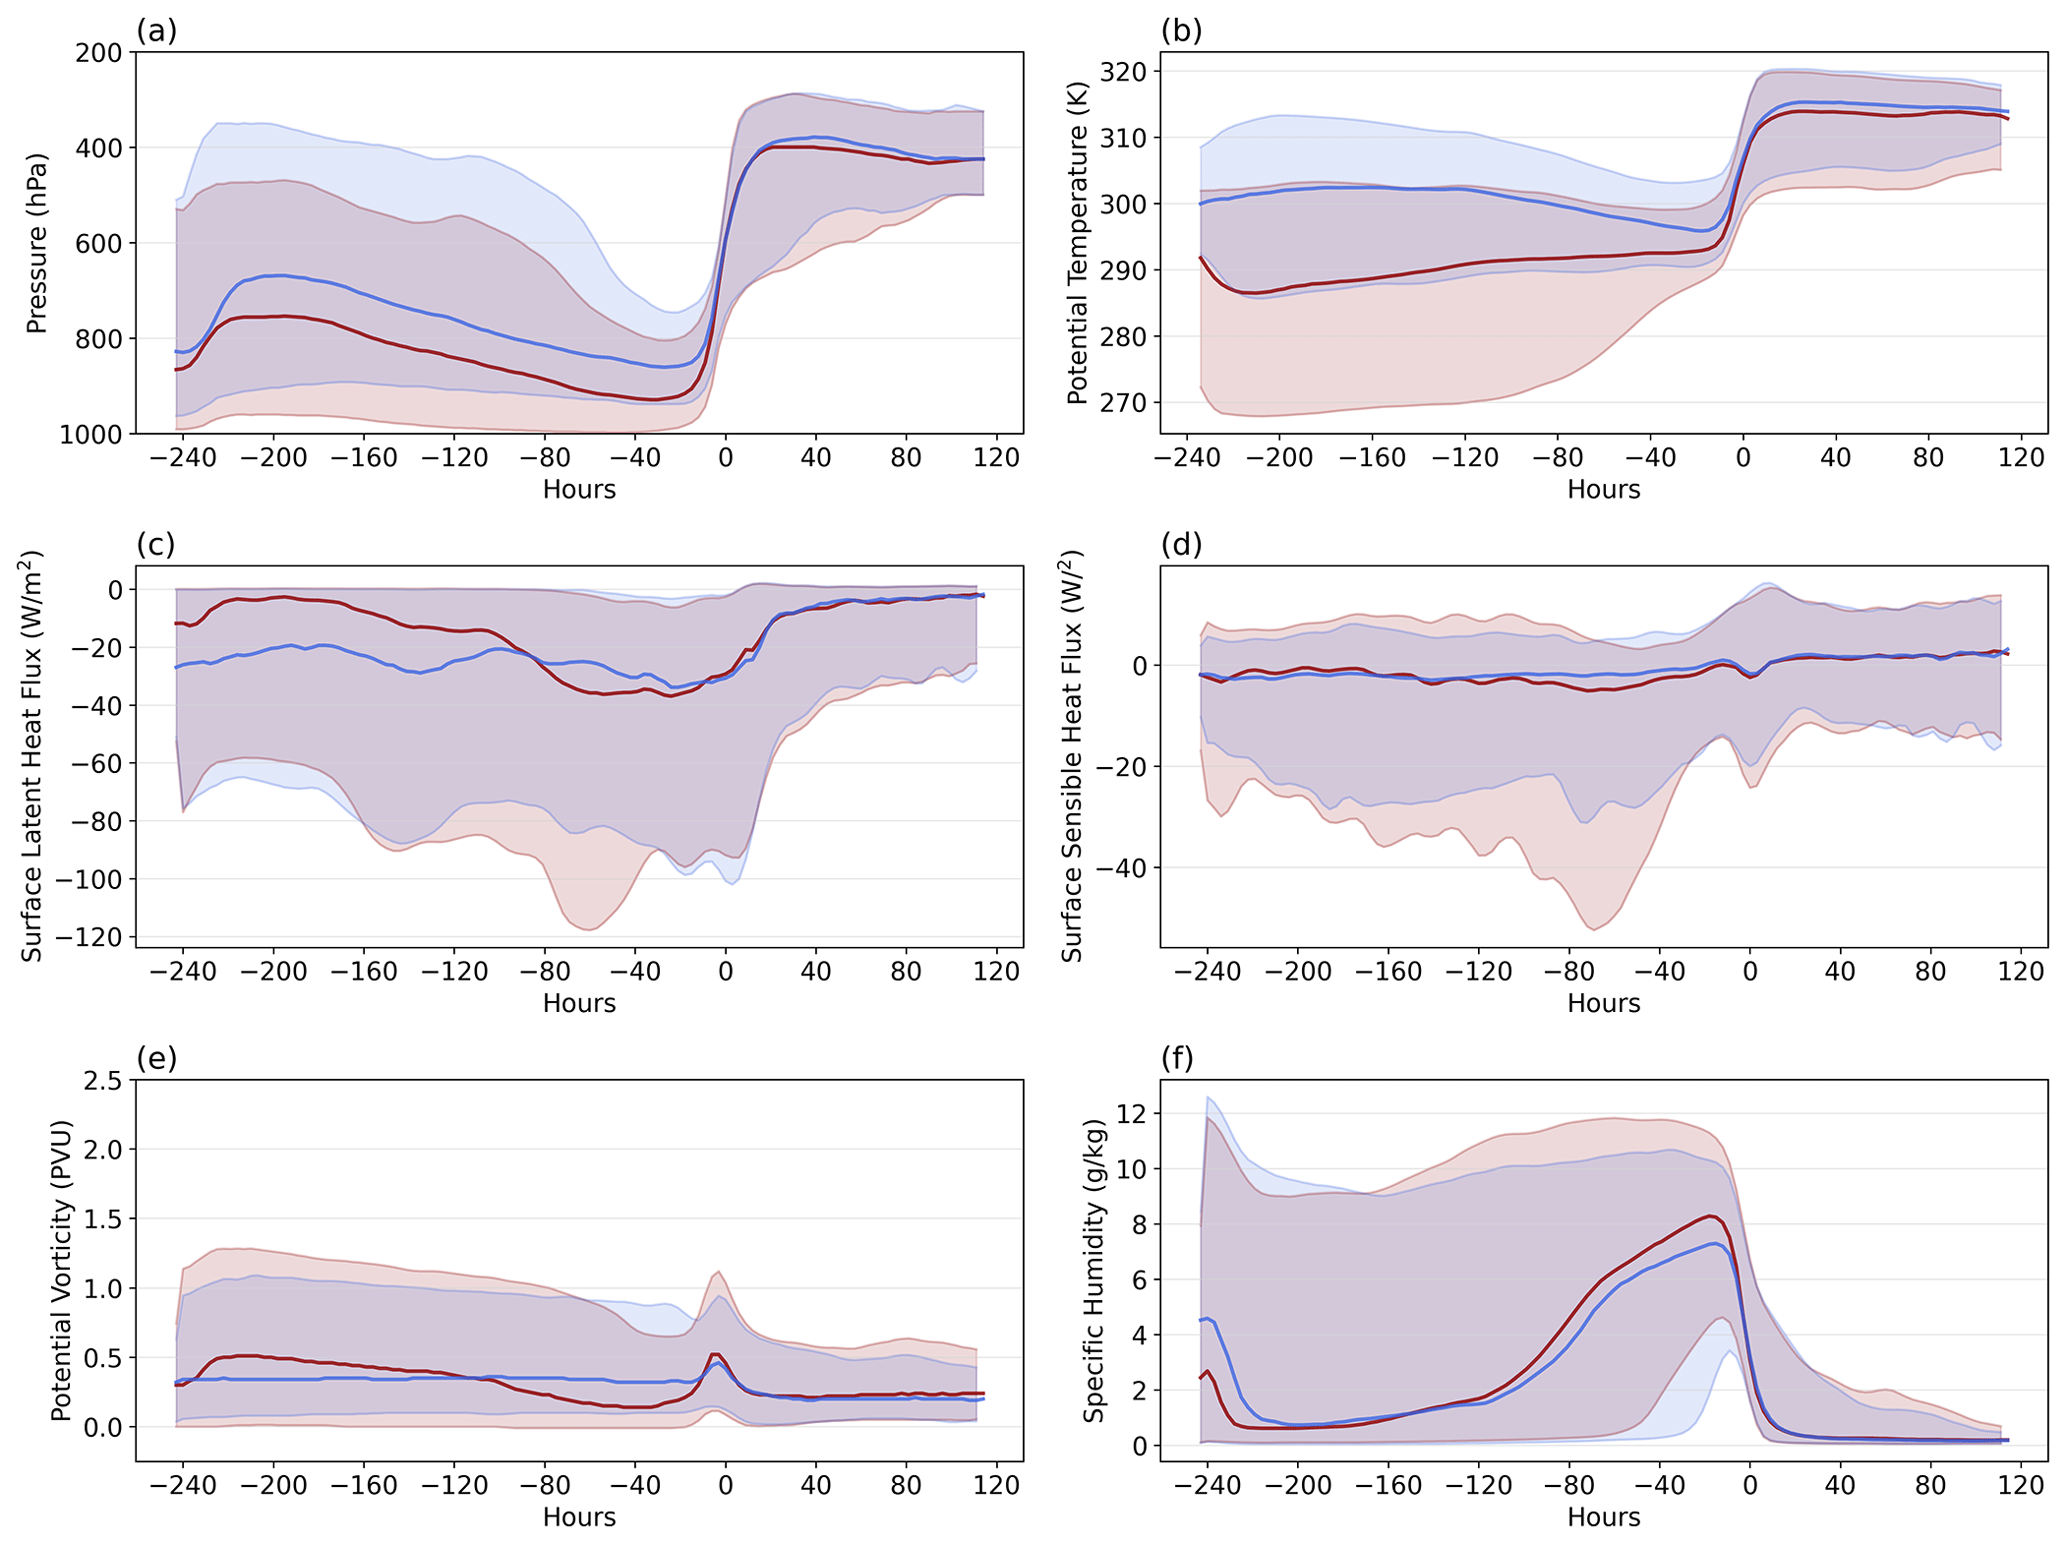
Figure A2Temporal evolution of (a) potential vorticity, (b) pressure, (c) surface latent heat flux, (d) surface sensible heat flux, (e) potential temperature, and (f) specific humidity along NPVA GS trajectories with negative PV in the atmospheric boundary layer (at least one time step) (red) and with only positive PV (blue). Trajectories are centered on the time step with maximum latent heating (hour 0). The medians are represented as thick red and blue lines and the 90th and 10th percentiles as light red and blue shading.
There are several processes that can result in the destruction of PV in the lower troposphere, including friction, evaporative cooling, sublimation of snow, snow melting, or turbulent fluxes (Crezee et al., 2017; Attinger et al., 2019, 2021). To establish what mechanism leads to PV destruction throughout our case study, we examined vertical cross sections of cloud liquid water content and potential vorticity over the area of the Gulf Stream. For the purpose of this analysis, we used the ERA5 reanalysis dataset with a higher temporal resolution of 1 h. Obtained results reveal that the air parcels with negative PV in the lower troposphere are primarily located below liquid water clouds (Fig. A3a) in the cold sectors of the cyclones (Figs. 3 and A3c). The cold sector is evident in Fig. A3a around 40∘ N latitude, identifiable by the cloud structure. It can also be discerned in Fig. A3b based on the temperature contrast. It should be highlighted that these cross sections represent values averaged between −50 and −60∘ W. Thus, to accurately assess the locations of air parcels, one should refer to Fig. A3a–c collectively. Clouds in the warm sector of the cyclone extend deep into the atmospheric boundary layer, while the cold sector is dominated by low-level stratiform clouds. Low-level clouds forming during the advection of cold air over the ocean due to the cooling of the surface are classified as stratiform clouds (Painemal et al., 2021). The presence of air parcels with negative PV in those areas suggests that evaporative cooling is the main cause of PV reduction. This was confirmed by Chagnon et al. (2013), who discovered that evaporative cooling in the air descending behind the cold front decreases PV. This idea is further reinforced by the studies of, for example, Wood (2005), Jensen et al. (2000), and Paluch and Lenschow (1991), who found that evaporative cooling in the sub-cloud layer of stratiform clouds is often triggered by the cooling that results from drizzle evaporation.
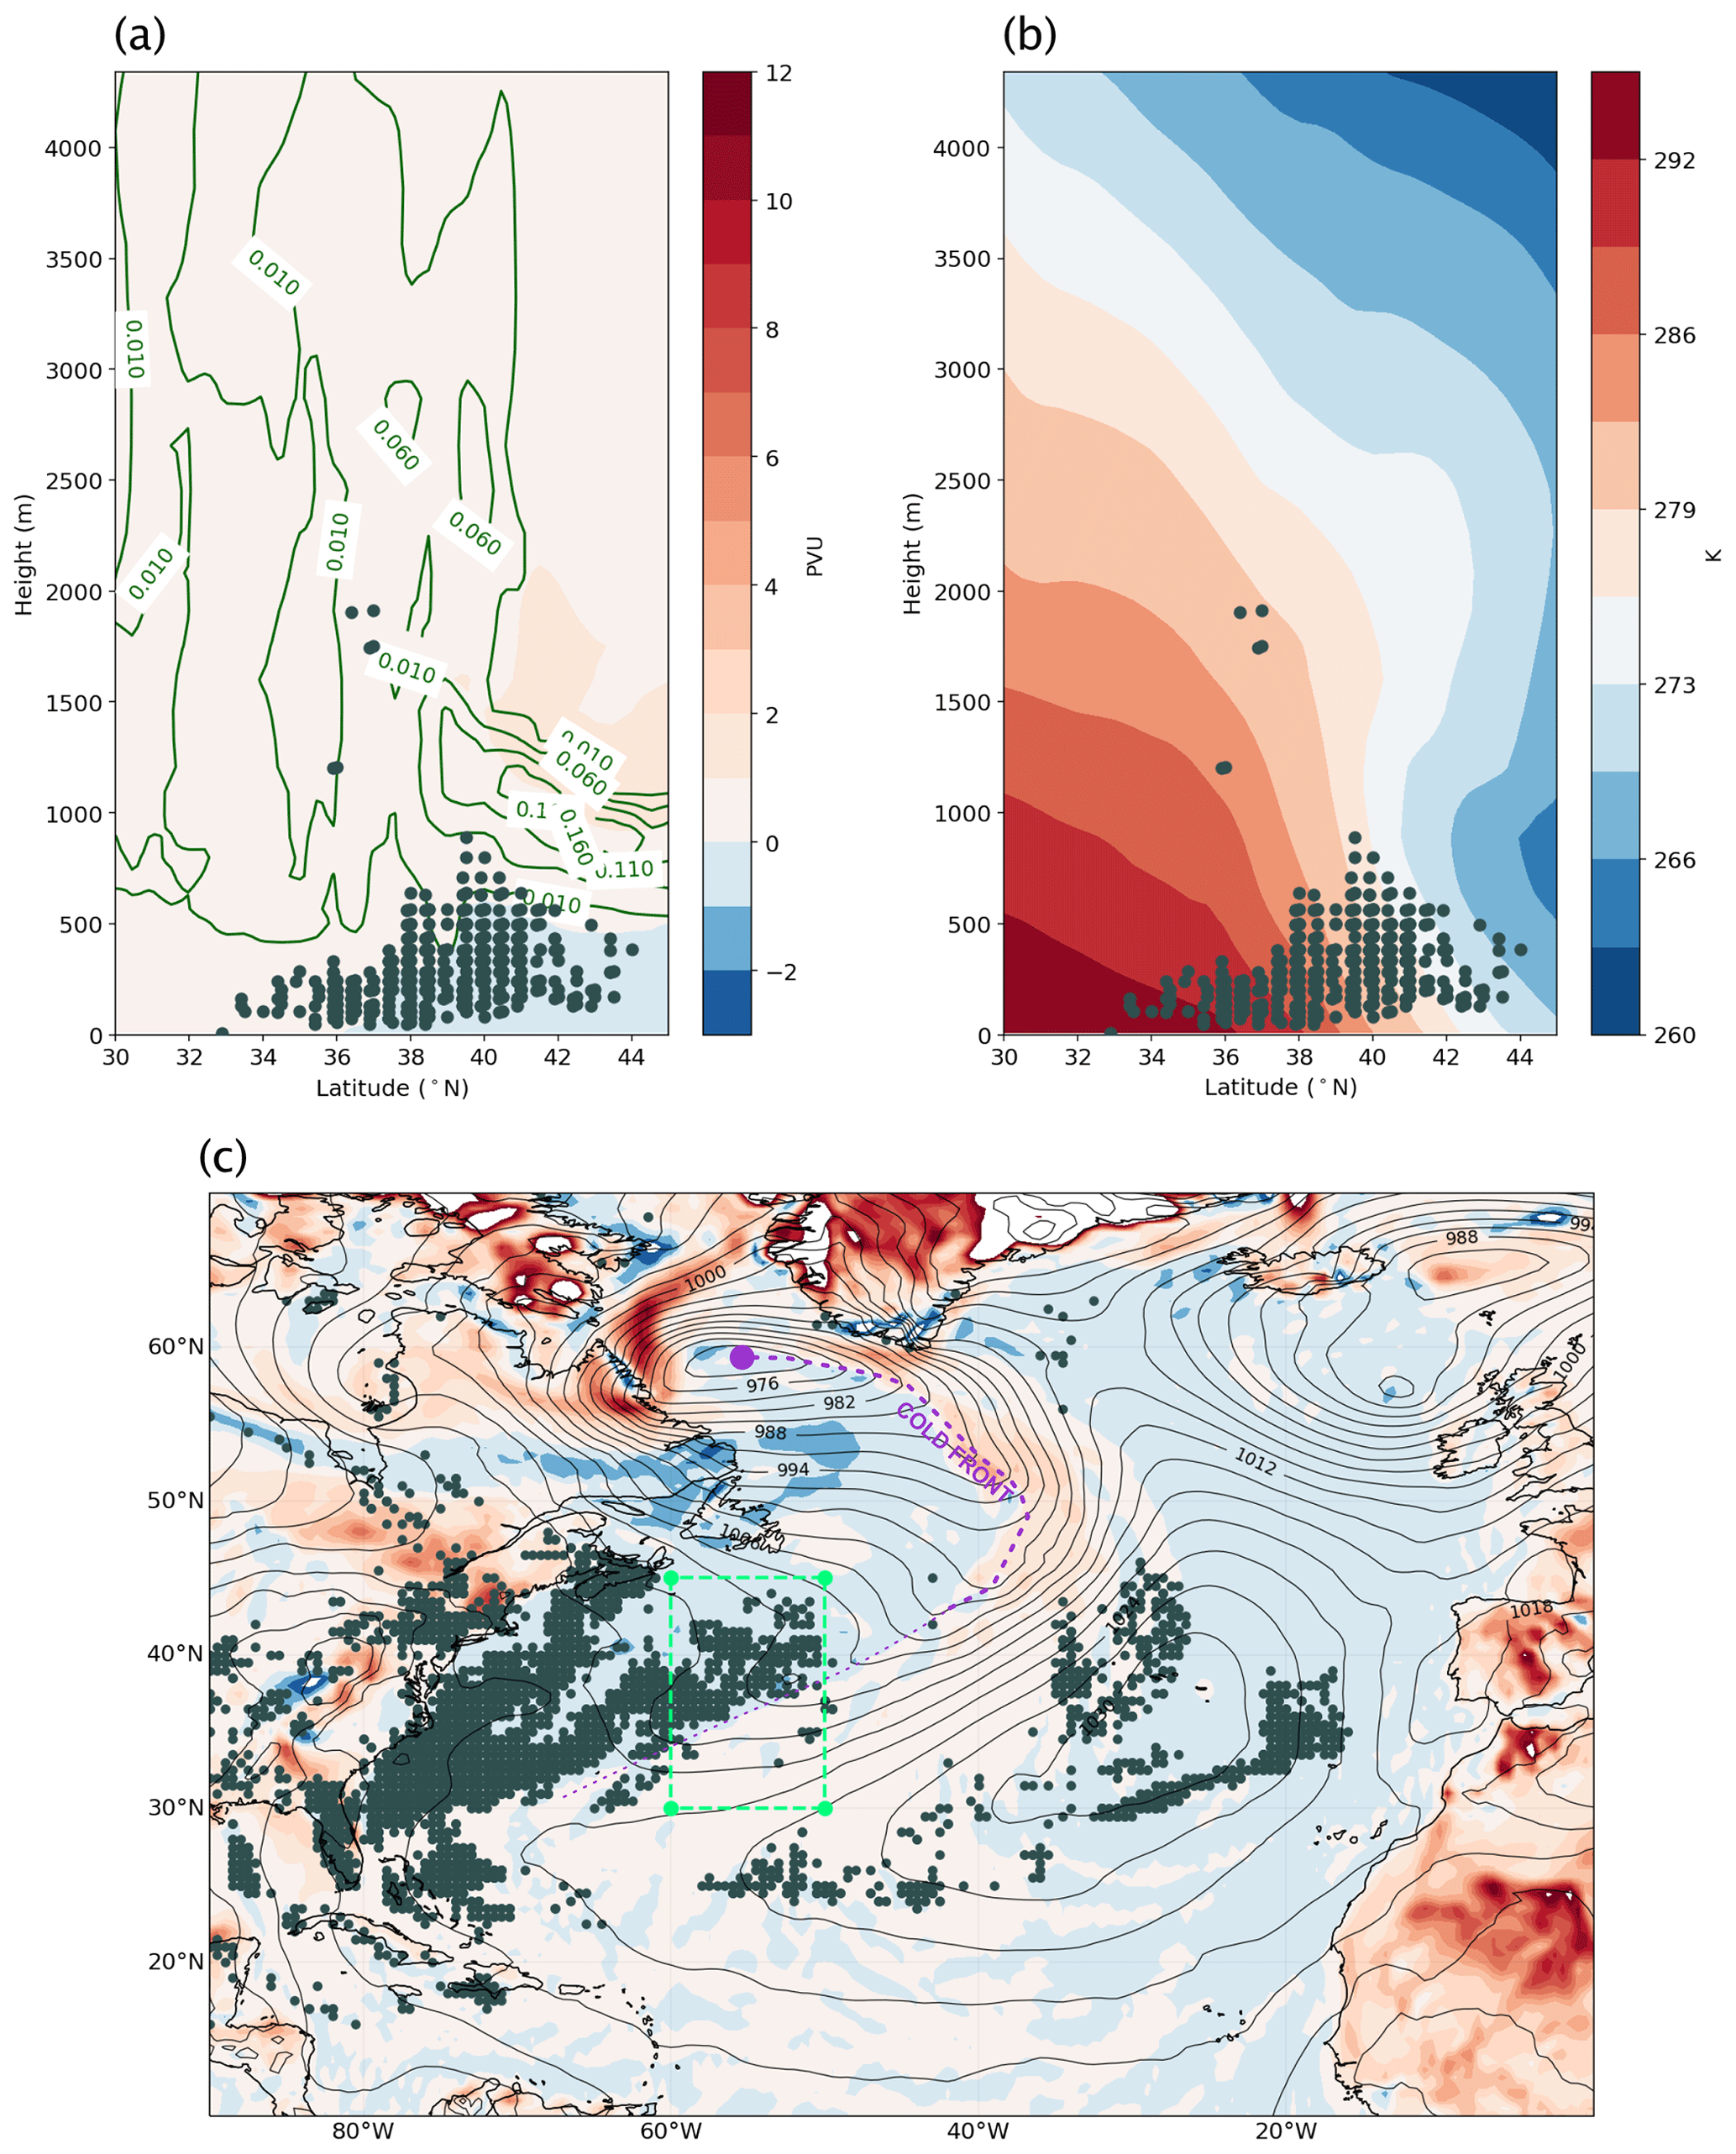
Figure A3Vertical and horizontal distribution of negative potential vorticity and potential temperature over the area inside the green box in panel (c) on 18 February at 00:00 UTC. (a) Vertical distribution of potential vorticity (shading) and liquid water content (green contours) averaged over the area between 55–60∘ W and 30–45∘ N, together with the location of all air parcels from the box that have negative PV in the atmospheric boundary layer on 18 February at 00:00 UTC. (b) Same as (a) but the contours represent the vertical distribution of potential temperature (shading) averaged over the area between 55–60∘ W and 30–45∘ N. (c) Potential vorticity on the lowest model level and locations of air parcels with negative PV in the atmospheric boundary layer. The plots were created using ERA5 data with a 1 h time resolution.
In most of the analyzed time steps (e.g., Fig. A2) the PV in the lower troposphere does not go below −1 PVU. However, for several air parcels, we found values below −2 PVU in the two lowest model layers right behind the cold front. Attinger et al. (2019) and Vannière et al. (2017a) attribute the prevalence of negative PV along the cold front to unstable conditions and high surface fluxes. This applies also to our case, as the high negative PV values are found at low altitudes in the regions of very intense surface fluxes, mainly during the intensification stage of the extreme cyclones (Fig. 3a). Overall, we presume that the combination of strong surface fluxes, heating from the surface, and evaporative cooling from low clouds leads to the development of a highly unstable environment, making the presence of negative PV in our case so widespread.
It is worth highlighting that a significant number of air parcels in Fig. A3 have negative PV and are positioned ahead of the cold front. Our analysis of consecutive time steps reveals that these parcels are transported to this location due to the advection of cold air that trails the cold front from a preceding cyclone. Given the sequence of cyclones previously described as necessary for the moistening and ascent of trajectories, it is plausible to assume that these air parcels, having interacted with a CAO induced by one cyclone, will subsequently ascend into the upper troposphere with cyclone L1 (Fig. 3)
To summarize, in contrast to the hypothesis of Methven (2015), which proposes that the average PV of WCB outflow is nearly equal to the PV of its inflow due to an almost negligible net change in models, our study offers a slightly different viewpoint. In the analyzed case study, trajectories with negative PV in the atmospheric boundary layer (ABL) exhibit a somewhat higher PV in the upper troposphere when compared to trajectories with positive PV in the ABL. Therefore, we cannot directly link the growth of NPVAs to the presence of negative PV in the atmospheric boundary layer. In our case study, negative PV functions more as a marker for an unstable environment and evaporative cooling associated with low-level stratiform clouds.
These findings imply that diabatic PV production and destruction may often not exactly balance during ascent as suggested by Methven (2015). This highlights the potential need for further research on the relationship between diabatic processes and changes in PV in ascending airstreams.
The data are referenced in Sect. 2, with ERA5 data available on the Copernicus Climate Change Service (C3S) Climate Data Store: https://doi.org/10.24381/cds.adbb2d47 (Hersbach et al., 2023). Other codes and data from this study can be provided by the authors upon request.
The supplement related to this article is available online at: https://doi.org/10.5194/wcd-5-181-2024-supplement.
MW, CMG, LP, and MF planned and designed the case study. MW analyzed the data and wrote the manuscript. CMG, LP, and MF gave important guidance during the project and provided feedback on the manuscript.
At least one of the (co-)authors is a member of the editorial board of Weather and Climate Dynamics. The peer-review process was guided by an independent editor, and the authors also have no other competing interests to declare.
Publisher's note: Copernicus Publications remains neutral with regard to jurisdictional claims made in the text, published maps, institutional affiliations, or any other geographical representation in this paper. While Copernicus Publications makes every effort to include appropriate place names, the final responsibility lies with the authors.
We gratefully acknowledge the European Centre for Medium‐Range Weather Forecasts (ECMWF) for providing the ERA5 reanalysis dataset, which was made available through their website (http://www.ecmwf.int; last access: 7 February 2024). We also thank the members of the Large-Scale Dynamics and Predictability group at KIT, as well as Jamie Mathews and Arnaud Czaja from Imperial College London, for their valuable discussions and contributions to this project. Additionally, we extend our thanks to Heini Wernli and Michael Sprenger for providing the LAGRANTO toolkit and cyclone dataset, which greatly facilitated our analyses. The contributions of Marta Wenta and Marc Federer are funded by the German Research Foundation (DFG; grant GR 5540/2-1) and the Swiss National Science Foundation (SNSF; grant 200021E_196978), respectively, as part of the Swiss–German collaborative project “The role of coherent airstreams in shaping the Gulf stream's impact on the large-scale extratropical circulation (GULFimpact)”. The contribution of Christian M. Grams is funded by the Helmholtz Association as part of the Young Investigator Group “Sub-seasonal Predictability: Understanding the Role of Diabatic Outflow” (SPREADOUT, grant VH-NG-1243).
This research has been supported by the Deutsche Forschungsgemeinschaft (grant no. GR 5540/2-1) and the Schweizerischer Nationalfonds zur Förderung der Wissenschaftlichen Forschung (grant no. 200021E_196978).
This paper was edited by Silvio Davolio and reviewed by two anonymous referees.
Aemisegger, F. and Papritz, L.: A Climatology of Strong Large-Scale Ocean Evaporation Events. Part I: Identification, Global Distribution, and Associated Climate Conditions, J. Climate, 31, 7287–7312, https://doi.org/10.1175/JCLI-D-17-0591.1, 2018. a, b, c, d, e, f
Athanasiadis, P., Ogawa, F., Omrani, N.-E., Keenlyside, N., Schiemann, R., Baker, A., Vidale, P., Bellucci, A., Ruggieri, P., Haarsma, R., Roberts, M., Roberts, C., Novak, L., and Gualdi, S.: Mitigating Climate Biases in the Midlatitude North Atlantic by Increasing Model Resolution: SST Gradients and Their Relation to Blocking and the Jet, J. Climate, 35, 3385–3406, https://doi.org/10.1175/JCLI-D-21-0515.1, 2022. a, b
Attinger, R., Spreitzer, E., Boettcher, M., Richard, F., Wernli, H., and Joos, H.: Quantifying the role of individual diabatic processes for the formation of PV anomalies in a North Pacific cyclone, Q. J. Roy. Meteorol. Soc., 145, 2454–2476, https://doi.org/10.1002/qj.3573, 2019. a, b
Attinger, R., Spreitzer, E., Boettcher, M., Wernli, H., and Joos, H.: Systematic assessment of the diabatic processes that modify low-level potential vorticity in extratropical cyclones, Weather Clim. Dynam., 2, 1073–1091, https://doi.org/10.5194/wcd-2-1073-2021, 2021. a
Barriopedro, D., Fischer, E., Luterbacher, J., Trigo, R., and García-Herrera, R.: The Hot Summer of 2010: Redrawing the Temperature Record Map of Europe, Science, 332, 220–224, https://doi.org/10.1126/science.1201224, 2011. a
Binder, H., Böttcher, M., Joos, H., and Wernli, H.: The role of warm conveyor belts for the intensification of extratropical cyclones in Northern Hemisphere winter, J. Atmos. Sci., 73, 3997–4020, https://doi.org/10.1175/JAS-D-15-0302.1, 2016. a
Binder, H., Boettcher, M., Joos, H., Sprenger, M., and Wernli, H.: Vertical cloud structure of warm conveyor belts – a comparison and evaluation of ERA5 reanalysis, CloudSat and CALIPSO data, Weather Clim. Dynam., 1, 577–595, https://doi.org/10.5194/wcd-1-577-2020, 2020. a, b
Boutle, I., Belcher, S., and Plant, R.: Moisture transport in midlatitude cyclones, Q. J. Roy. Meteorol. Soc., 137, 360–373, https://doi.org/10.1002/qj.783, 2011. a
Büeler, D., Ferranti, L., Magnusson, L., Quinting, J., and Grams, C.: Year-round sub-seasonal forecast skill for Atlantic–European weather regimes, Q. J. Roy. Meteorol. Soc., 147, 4283–4309, https://doi.org/10.1002/qj.4178, 2021. a
Čampa, J. and Wernli, H.: A PV perspective on the vertical structure of mature midlatitude cyclones in the northern hemisphere, J. Atmos. Sci., 69, 725–740, https://doi.org/10.1175/JAS-D-11-050.1, 2012. a
Chagnon, J., Gray, S., and Methven, J.: Diabatic processes modifying potential vorticity in a North Atlantic cyclone, Q. J. Roy. Meteorol. Soc., 139, 1270–1282, https://doi.org/10.1002/qj.2037, 2013. a
Colucci, S.: Explosive Cyclogenesis and Large-Scale Circulation Changes: Implications for Atmospheric Blocking, J. Atmos. Sci., 42, 2701–2717, https://doi.org/10.1175/1520-0469(1985)042<2701:ECALSC>2.0.CO;2, 1985. a, b
Colucci, S. and Alberta, T.: Planetary-Scale Climatology of Explosive Cyclogenesis and Blocking, Mon. Weather Rev., 124, 2509 – 2520, https://doi.org/10.1175/1520-0493(1996)124<2509:PSCOEC>2.0.CO;2, 1996. a, b
Crezee, B., Joos, H., and Wernli, H.: The Microphysical Building Blocks of Low-Level Potential Vorticity Anomalies in an Idealized Extratropical Cyclone, J. Atmos. Sci., 74, 1403–1416, https://doi.org/10.1175/JAS-D-16-0260.1, 2017. a
Czaja, A., Frankignoul, C., Minobe, S., and Vannière, B.: Simulating the Midlatitude Atmospheric Circulation: What Might We Gain From High-Resolution Modeling of Air-Sea Interactions?, Curr. Clim. Change Rep., 5, 390–406, https://doi.org/10.1007/s40641-019-00148-5, 2019. a, b, c, d
Dacre, H., Clark, P., Martinez-Alvarado, O., Stringer, M., and Lavers, D.: How Do Atmospheric Rivers Form?, B. Am. Meteorol. Soc., 96, 1243–1255, https://doi.org/10.1175/BAMS-D-14-00031.1, 2015. a
Dacre, H., Martínez-Alvarado, O., and Mbengue, C.: Linking Atmospheric Rivers and Warm Conveyor Belt Airflows, J. Hydrometeorol., 20, 1183–1196, https://doi.org/10.1175/JHM-D-18-0175.1, 2019. a, b, c, d, e
Dae, J., Cannon, A., and Yu, B.: Influences of atmospheric blocking on North American summer heatwaves in a changing climate: a comparison of two Canadian Earth system model large ensembles, Climatic Change, 172, 5, https://doi.org/10.1007/s10584-022-03358-3, 2022. a
de'Donato, F., Leone, M., Noce, D., Davoli, M., and Michelozzi, P.: The Impact of the February 2012 Cold Spell on Health in Italy Using Surveillance Data, PLOS ONE, 8, 1–9, https://doi.org/10.1371/journal.pone.0061720, 2013. a
Demirdjian, R., Doyle, J., Finocchio, P., and Reynolds, C.: Preconditioning and Intensification of Upstream Extratropical Cyclones through Surface Fluxes, J. Atmos. Sci., 80, 1499–1517, https://doi.org/10.1175/JAS-D-22-0251.1, 2023. a
Demirtaş, M.: The large-scale environment of the European 2012 high-impact cold wave: prolonged upstream and downstream atmospheric blocking, Weather, 72, 297–301, https://doi.org/10.1002/wea.3020, 2017. a
Eckhardt, S., Stohl, A., Wernli, H., James, P., Forster, C., and Spichtinger, N.: A 15-Year Climatology of Warm Conveyor Belts, J. Climate, 17, 218–237, https://doi.org/10.1175/1520-0442(2004)017<0218:AYCOWC>2.0.CO;2, 2004. a, b
Ferranti, L., Magnusson, L., Vitart, F., and Richardson, D.: How far in advance can we predict changes in large-scale flow leading to severe cold conditions over Europe?, Q. J. Roy. Meteorol. Soc., 144, 1788–1802, https://doi.org/10.1002/qj.3341, 2018. a
Gao, Y., Leung, L., Lu, J., and Masato, G.: Persistent cold air outbreaks over North America in a warming climate, Environ. Res. Lett., 10, 044001, https://doi.org/10.1088/1748-9326/10/4/044001, 2015. a
Grams, C. and Archambault, H.: The Key Role of Diabatic Outflow in Amplifying the Midlatitude Flow: A Representative Case Study of Weather Systems Surrounding Western North Pacific Extratropical Transition, Mon. Weather Rev., 144, 3847–3869, https://doi.org/10.1175/MWR-D-15-0419.1, 2016. a
Grams, C., Wernli, H., Böttcher, M., Čampa, J., Corsmeier, U., Jones, S., Keller, J., Lenz, C.-J., and Wiegand, L.: The key role of diabatic processes in modifying the upper-tropospheric wave guide: a North Atlantic case-study, Q. J. Roy. Meteorol. Soc., 137, 2174–2193, https://doi.org/10.1002/qj.891, 2011. a, b
Grams, C., Beerli, R., Pfenninger, S., Staffell, I., and Wernli, H.: Balancing Europe's wind-power output through spatial deployment informed by weather regimes, Nat. Clim. Change, 7, 557–562, https://doi.org/10.1038/nclimate3338, 2017. a, b, c
Grams, C., Magnusson, L., and Madonna, E.: An Atmospheric Dynamics Perspective on the Amplification and Propagation of Forecast Error in Numerical Weather Prediction Models: A Case Study, Q. J. Roy. Meteorol. Soc., 144, 2577–2591, https://doi.org/10.1002/qj.3353, 2018. a
Grumm, R.: The Central European and Russian Heat Event of July–August 2010, Bu. Am. Meteorol. Soc., 92, 1285 – 1296, https://doi.org/10.1175/2011BAMS3174.1, 2011. a
Hauser, S., Teubler, F., Riemer, M., Knippertz, P., and Grams, C. M.: Towards a holistic understanding of blocked regime dynamics through a combination of complementary diagnostic perspectives, Weather Clim. Dynam., 4, 399–425, https://doi.org/10.5194/wcd-4-399-2023, 2023. a, b
Hawcroft, M., Shaffrey, L., Hodges, K., and Dacre, H.: How much Northern Hemisphere precipitation is associated with extratropical cyclones?, Geophys. Res. Lett., 39, L24809, https://doi.org/10.1029/2012GL053866, 2012. a
Hersbach, H., Bell, B., Berrisford, P., Hirahara, S., Horányi, A., Muñoz-Sabater, J., Nicolas, J., Peubey, C., Radu, R., Schepers, D., Simmons, A., Soci, C., Abdalla, S., Abellan, X., Balsamo, G., Bechtold, P., Biavati, G., Bidlot, J., Bonavita, M., De Chiara, G., Dahlgren, P., Dee, D., Diamantakis, M., Dragani, R., Flemming, J., Forbes, R., Fuentes, M., Geer, A., Haimberger, L., Healy, S., Hogan, R. J., Hólm, E., Janisková, M., Keeley, S., Laloyaux, P., Lopez, P., Lupu, C., Radnoti, G., de Rosnay, P., Rozum, I., Vamborg, F., Villaume, S., and Thépaut, J.-N.: The ERA5 global reanalysis, Q. J. Roy. Meteorol. Soc., 146, 1999–2049, https://doi.org/10.1002/qj.3803, 2020. a
Hersbach, H., Bell, B., Berrisford, P., Biavati, G., Horányi, A., Muñoz Sabater, J., Nicolas, J., Peubey, C., Radu, R., Rozum, I., Schepers, D., Simmons, A., Soci, C., Dee, D., and Thépaut, J.-N.: ERA5 hourly data on single levels from 1940 to present, Copernicus Climate Change Service (C3S) Climate Data Store (CDS) [data set], https://doi.org/10.24381/cds.adbb2d47, 2023. a
Hirata, H., Kawamura, R., Nonaka, M., and Tsuboki, K.: Significant Impact of Heat Supply From the Gulf Stream on a “Superbomb” Cyclone in January 2018, Geophys. Res. Lett., 46, 7718–7725, https://doi.org/10.1029/2019GL082995, 2019. a
Ilotoviz, E., Ghate, V. P., and Raveh-Rubin, S.: The Impact of Slantwise Descending Dry Intrusions on the Marine Boundary Layer and Air-Sea Interface Over the ARM Eastern North Atlantic Site, J. Geophys. Res.-Atmos., 126, e2020JD033879, https://doi.org/10.1029/2020JD033879, 2021. a
Jensen, J., Lee, S., Krummel, P., Katzfey, J., and Gogoasa, D.: Precipitation in marine cumulus and stratocumulus: Part I: Thermodynamic and dynamic observations of closed cell circulations and cumulus bands, Atmos. Res., 54, 117–155, https://doi.org/10.1016/S0169-8095(00)00040-5, 2000. a
Joos, H. and Forbes, R. M.: Impact of different IFS microphysics on a warm conveyor belt and the downstream flow evolution, Q. J. Roy. Meteorol. Soc., 142, 2727–2739, https://doi.org/10.1002/qj.2863, 2016. a
Joos, H. and Wernli, H.: Influence of microphysical processes on the potential vorticity development in a warm conveyor belt: a case-study with the limited-area model COSMO, Q. J. Roy. Meteorol. Soc., 138, 407–418, https://doi.org/10.1002/qj.934, 2012. a
Jullien, N., Vignon, E., Sprenger, M., Aemisegger, F., and Berne, A.: Synoptic conditions and atmospheric moisture pathways associated with virga and precipitation over coastal Adélie Land in Antarctica, The Cryosphere, 14, 1685–1702, https://doi.org/10.5194/tc-14-1685-2020, 2020. a
Kautz, L.-A., Martius, O., Pfahl, S., Pinto, J., Ramos, A., Sousa, P., and Woollings, T.: Atmospheric blocking and weather extremes over the Euro-Atlantic sector – a review, Weather Clim. Dynam., 3, 305–336, https://doi.org/10.5194/wcd-3-305-2022, 2022. a, b
Kwon, Y., Alexander, M., Bond, N., Frankignoul, C., Nakamura, H., Qiu, B., and Thompson, L.: Role of the Gulf Stream and Kuroshio–Oyashio Systems in Large-Scale Atmosphere–Ocean Interaction: A Review, J. Climate, 23, 3249– 3281, https://doi.org/10.1175/2010JCLI3343.1, 2010. a, b
Kwon, Y.-O., Seo, H., Ummenhofer, C., and Joyce, T.: Impact of Multidecadal Variability in Atlantic SST on Winter Atmospheric Blocking, J. Climate, 33, 867–892, https://doi.org/10.1175/JCLI-D-19-0324.1, 2020. a, b
Leach, N., Weisheimer, A., Allen, M., and Palmer, T.: Forecast-based attribution of a winter heatwave within the limit of predictability, P. Natl. Acad. Sci. USA, 118, e2112087118, https://doi.org/10.1073/pnas.2112087118, 2021. a, b
Lupo, A. and Smith, J.: Climatological features of blocking anticyclones in the Northern Hemisphere, Tellus A, 47, 439–456, https://doi.org/10.3402/tellusa.v47i4.11527, 1995. a
Madonna, E., Wernli, H., Joos, H., and Martius, O.: Warm Conveyor Belts in the ERA-Interim Dataset (1979–2010). Part I: Climatology and Potential Vorticity Evolution, J. Climate, 27, 3–26, https://doi.org/10.1175/JCLI-D-12-00720.1, 2014. a, b, c, d, e
Matsueda, M. and Palmer, T.: Estimates of flow-dependent predictability of wintertime Euro-Atlantic weather regimes in medium-range forecasts, Q. J. Roy. Meteorol. Soc., 144, 1012–1027, https://doi.org/10.1002/qj.3265, 2018. a
Methven, J.: Potential vorticity in warm conveyor belt outflow, Q. J. Roy. Meteorol. Soc., 141, 1065–1071, https://doi.org/10.1002/qj.2393, 2015. a, b, c, d, e
Michel, S., Heydt, A., Westen, R., Baatsen, M., and Dijkstra, H.: Increased wintertime European atmospheric blocking frequencies in General Circulation Models with a coupled eddy-permitting ocean, npj Clim. Atmos. Sci., 6, 50, https://doi.org/10.21203/rs.3.rs-1811560/v1, 2023. a
Moore, G. and Renfrew, I.: An Assessment of the Surface Turbulent Heat Fluxes from the NCEP–NCAR Reanalysis over the Western Boundary Currents, J. Climate, 15, 2020–2037, https://doi.org/10.1175/1520-0442(2002)015<2020:AAOTST>2.0.CO;2, 2002. a
Mullen, S.: Transient Eddy Forcing of Blocking Flows, J. Atmos. Sci., 44, 3–22, https://doi.org/10.1175/1520-0469(1987)044<0003:TEFOBF>2.0.CO;2, 1987. a
Nakamura, H. and Wallace, J.: Synoptic Behavior of Baroclinic Eddies during the Blocking Onset, Mon. Weather Rev., 121, 1892–1903, https://doi.org/10.1175/1520-0493(1993)121<1892:SBOBED>2.0.CO;2, 1993. a
Nakamura, H., Sampe, T., Goto, A., Ohfuchi, W., and Xie, S.: On the importance of midlatitude oceanic frontal zones for the mean state and dominant variability in the tropospheric circulation, Geophys. Res. Lett., 35, L15709, https://doi.org/10.1029/2008GL034010, 2008. a
Novak, L., Ambaum, M., and Tailleux, R.: The Life Cycle of the North Atlantic Storm Track, J. Atmos. Sci., 72, 821–833, https://doi.org/10.1175/JAS-D-14-0082.1, 2015. a
Omrani, N.-E., Ogawa, F., Nakamura, H., Keenlyside, N., Lubis, S., and Matthes, K.: Key Role of the Ocean Western Boundary currents in shaping the Northern Hemisphere climate, Sci. Rep., 9, 3014, https://doi.org/10.1038/s41598-019-39392-y, 2019. a
O'Reilly, C., Minobe, S., Kuwano-Yoshida, A., and Woollings, T.: The Gulf Stream influence on wintertime North Atlantic jet variability, Q. J. Roy. Meteorol. Soc., 143, 173–183, https://doi.org/10.1002/qj.2907, 2017. a
Painemal, D., Corral, A. F., Sorooshian, A., Brunke, M. A., Chellappan, S., Gorooh, V. A., Ham, S.-H., O'Neill, L., Smith Jr., W. L., Tselioudis, G., Wang, H., Zeng, X., and Zuidema, P.: An Overview of Atmospheric Features Over the Western North Atlantic Ocean and North American East Coast – Part 2: Circulation, Boundary Layer, and Clouds, J. Geophys. Res.-Atmos., 126, e2020JD033423, https://doi.org/10.1029/2020JD033423, 2021. a
Paluch, I. R. and Lenschow, D. H.: Stratiform Cloud Formation in the Marine Boundary Layer, J. Atmos. Sci., 48, 2141–2158, https://doi.org/10.1175/1520-0469(1991)048<2141:SCFITM>2.0.CO;2, 1991. a
Pang, B., Lu, R., and Ren, R.: Influence of Siberian Blocking on Long-Lived Cold Surges over the South China Sea, J. Climate, 33, 6945–6956, https://doi.org/10.1175/JCLI-D-19-0944.1, 2020. a
Papritz, L. and Grams, C.: Linking Low-Frequency Large-Scale Circulation Patterns to Cold Air Outbreak Formation in the Northeastern North Atlantic, Geophys. Res. Lett., 45, 2542–2553, https://doi.org/10.1002/2017GL076921, 2018. a, b, c
Papritz, L. and Spengler, T.: Analysis of the slope of isentropic surfaces and its tendencies over the North Atlantic, Q. J. Roy. Meteorol. Soc., 141, 3226–3238, https://doi.org/10.1002/qj.2605, 2015. a, b, c
Papritz, L. and Spengler, T.: A Lagrangian Climatology of Wintertime Cold Air Outbreaks in the Irminger and Nordic Seas and Their Role in Shaping Air–Sea Heat Fluxes, J. Climate, 30, 2717–2737, https://doi.org/10.1175/JCLI-D-16-0605.1, 2017. a
Papritz, L., Pfahl, S., Sodemann, H., and Wernli, H.: A Climatology of Cold Air Outbreaks and Their Impact on Air–Sea Heat Fluxes in the High-Latitude South Pacific, J. Climate, 28, 342–364, https://doi.org/10.1175/JCLI-D-14-00482.1, 2015. a, b
Papritz, L., Aemisegger, F., and Wernli, H.: Sources and Transport Pathways of Precipitating Waters in Cold-Season Deep North Atlantic Cyclones, J. Atmos. Sci., 78, 3349–3368, https://doi.org/10.1175/JAS-D-21-0105.1, 2021. a, b, c, d, e, f, g, h, i, j, k, l, m
Pfahl, S., Madonna, E., Boettcher, M., Joos, H., and Wernli, H.: Warm Conveyor Belts in the ERA-Interim Dataset (1979–2010). Part II: Moisture Origin and Relevance for Precipitation, J. Climate, 27, 27–40, https://doi.org/10.1175/JCLI-D-13-00223.1, 2014. a, b, c, d, e, f
Pfahl, S., Schwierz, C., Croci-Maspoli, M., Grams, C., and Wernli, H.: Importance of latent heat release in ascending air streams for atmospheric blocking, Nat. Geosci., 8, 610–614, https://doi.org/10.1038/ngeo2487, 2015. a, b, c, d, e, f, g
Pickl, M., Quinting, J., and Grams, C.: Warm conveyor belts as amplifiers of forecast uncertainty, Q. J. Roy. Meteorol. Soc., 149, 3064–3085, https://doi.org/10.1002/qj.4546, 2023. a
Quinting, J. and Grams, C.: EuLerian Identification of ascending AirStreams (ELIAS 2.0) in numerical weather prediction and climate models – Part 1: Development of deep learning model, Geosci. Model Dev., 15, 715–730, https://doi.org/10.5194/gmd-15-715-2022, 2022. a
Raveh-Rubin, S.: Dry Intrusions: Lagrangian Climatology and Dynamical Impact on the Planetary Boundary Layer, J. Climate, 30, 6661–6682, https://doi.org/10.1175/JCLI-D-16-0782.1, 2017. a, b, c
Reed, R., Stoelinga, M., and Kuo, Y.-H.: A model-aided study of the origin and evolution of the anomalously high potential vorticity in the inner region of a rapidly deepening marine cyclone, Mon. Weather Rev., 120, 893–913, https://doi.org/10.1175/1520-0493(1992)120<0893:AMASOT>2.0.CO;2, 1992. a
Sanders, F. and Gyakum, J.: Synoptic-dynamic climatology of the `bomb', Mon. Weather Rev., 108, 1589–1606, https://doi.org/10.1175/1520-0493(1980)108<1589:SDCOT>2.0.CO;2, 1980. a, b
Scaife, A., Copsey, D., Gordon, C., Harris, C., Hinton, T., Keeley, S., O'Neill, A., Roberts, M., and Williams, K.: Improved Atlantic winter blocking in a climate model, Geophys. Res. Lett., 38, L23703, https://doi.org/10.1029/2011GL049573, 2011. a, b
Schäfler, A., Boettcher, M., Grams, C., Rautenhaus, M., Sodemann, H., and Wernli, H.: Planning aircraft measurements within a warm conveyor belt, Weather, 69, 161–166, https://doi.org/10.1002/wea.2245, 2014. a
Scott, D.: Multivariate density estimation: Theory, practice, and visualization: Second edition, Wiley, ISBN 9781118575574, https://doi.org/10.1002/9781118575574, 2015. a
Shaw, T. A., Baldwin, M., Barnes, E. A., Cabalerro, R., Garfinkel, C. I., Hwang, Y.-T., Li, C., O'Gorman, A. P., Rivière, G., Simpson, I. R., and Voigt, A.: Storm track processes and the opposing influences of climate change, Nat. Geosci., 9, 656–664, https://doi.org/10.1038/ngeo2783, 2016. a
Sheldon, L., Czaja, A., Vannière, B., Morcrette, C., Sohet, B., Casado, M., and Smith, D.: A ‘warm path’ for Gulf Stream–troposphere interactions, Tellus A, 69, 1299397, https://doi.org/10.1080/16000870.2017.1299397, 2017. a
Sodemann, H. and Stohl, A.: Moisture Origin and Meridional Transport in Atmospheric Rivers and Their Association with Multiple Cyclones, Mon. Weather Rev., 141, 2850–2868, https://doi.org/10.1175/MWR-D-12-00256.1, 2013. a, b
Sodemann, H., Schwierz, C., and Wernli, H.: Interannual variability of Greenland winter precipitation sources: Lagrangian moisture diagnostic and North Atlantic Oscillation influence, J. Geophys. Res., 113, D03107, https://doi.org/10.1029/2007JD008503, 2008. a, b
Spensberger, C., Madonna, E., Boettcher, M., Grams, C., Papritz, L., Quinting, J., Röthlisberger, M., Sprenger, M., and Zschenderlein, P.: Dynamics of Concurrent and Sequential Central European and Scandinavian Heatwaves, Q. J. Roy. Meteorol. Soc., 146, 2998–3013, https://doi.org/10.1002/qj.3822, 2020. a
Sprenger, M.: Global climatologies of Eulerian and Lagrangian flow features based on ERA-Interim, B. Am. Meteorol. Soc., 98, 1739–1748, 2017. a
Sprenger, M. and Wernli, H.: The LAGRANTO Lagrangian analysis tool – version 2.0, Geosci. Model Dev., 8, 2569–2586, https://doi.org/10.5194/gmd-8-2569-2015, 2015. a
Steinfeld, D. and Pfahl, S.: The role of latent heating in atmospheric blocking dynamics: a global climatology, Clim. Dynam., 53, 6159–6180, https://doi.org/10.1007/s00382-019-04919-6, 2019. a, b, c, d, e, f, g
Steinfeld, D., Boettcher, M., Forbes, R., and Pfahl, S.: The sensitivity of atmospheric blocking to upstream latent heating – numerical experiments, Weather Clim. Dynam., 1, 405–426, https://doi.org/10.5194/wcd-1-405-2020, 2020. a, b, c, d, e
Teubler, F. and Riemer, M.: Dynamics of Rossby Wave Packets in a Quantitative Potential Vorticity–Potential Temperature Framework, J. Atmos. Sci., 73, 1063–1081, https://doi.org/10.1175/JAS-D-15-0162.1, 2016. a, b
Tilinina, N., Gavrikov, A., and Gulev, S.: Association of the North Atlantic Surface Turbulent Heat Fluxes with Midlatitude Cyclones, Mon. Weather Rev., 146, 3691–3715, https://doi.org/10.1175/MWR-D-17-0291.1, 2018. a, b, c, d, e
Vannière, B., Czaja, A., and Dacre, H.: Contribution of the cold sector of extratropical cyclones to mean state features over the Gulf Stream in winter, Q. J. Roy. Meteorol. Soc., 143, 1990–2000, https://doi.org/10.1002/qj.3058, 2017a. a, b
Vannière, B., Czaja, A., Dacre, H., and Woollings, T.: A “Cold Path” for the Gulf Stream–Troposphere Connection, J. Climate, 30, 1363–1379, https://doi.org/10.1175/JCLI-D-15-0749.1, 2017b. a, b, c
Wazneh, H., Gachon, P., deVernal, A., Laprise, R., and Tremblay, B.: Atmospheric blocking events in the North Atlantic: trends and links to climate anomalies and teleconnections, Clim. Dynam., 56, 2199–2221, https://doi.org/10.1007/s00382-020-05583-x, 2021. a, b
Wernli, H. and Davies, H.: A Lagrangian-based analysis of extratropical cyclones, I, The method and some applications, Q. J. Roy. Meteorol. Soc., 123, 467–489, https://doi.org/10.1002/qj.49712353811, 1997. a
Wernli, H. and Schwierz, C.: Surface cyclones in the ERA-40 dataset (1958–2001). Part I: Novel identification method and global climatology, J. Atmos. Sci., 63, 2486–2507, 2006. a
Wood, R.: Drizzle in Stratiform Boundary Layer Clouds. Part I: Vertical and Horizontal Structure, J. Atmos. Sci., 62, 3011–3033, https://doi.org/10.1175/JAS3529.1, 2005. a
Xin, F., Peng, D., Liu, R., and Liu, S.-C.: Moisture sources for the weather pattern classified extreme precipitation in the first rainy season over South China, Int. J. Climatol., 42, 6027–6041, https://doi.org/10.1002/joc.7576, 2022. a
Yamamoto, A., Nonaka, M., Martineau, P., Yamazaki, A., Kwon, Y.-O., Nakamura, H., and Taguchi, B.: Oceanic moisture sources contributing to wintertime Euro-Atlantic blocking, Weather Clim. Dynam. 2, 819–840, https://doi.org/10.5194/wcd-2-819-2021, 2021. a, b, c, d, e, f, g
Yamazaki, A. and Itoh, H.: Selective absorption mechanism for the maintenance of blocking, Geophys. Res. Lett., 36, L05803, https://doi.org/10.1029/2008GL036770, 2009. a
Young, M. and Galvin, J.: The record-breaking warm spell of February 2019 in Britain, the Channel Islands, France and the Netherlands, Weather, 75, 36–45, https://doi.org/10.1002/wea.3664, 2020. a, b, c
Zhuo, W., Yao, Y., Luo, D., Simmonds, I., and Huang, F.: Combined impact of the cold vortex and atmospheric blocking on cold outbreaks over East Asia and the potential for short-range prediction of such occurrences, Environ. Res. Lett., 17, 084037, https://doi.org/10.1088/1748-9326/ac8362, 2022. a