the Creative Commons Attribution 4.0 License.
the Creative Commons Attribution 4.0 License.
 | 27 Mar 2024
The upstream–downstream connection of North Atlantic and Mediterranean cyclones in semi-idealized simulations
Alexander Scherrmann
Heini Wernli
Emmanouil Flaounas
Cyclogenesis in the Mediterranean is typically triggered by the intrusion of a potential vorticity (PV) streamer over the Mediterranean. The intrusion of the PV streamer results from a preceding Rossby wave breaking (RWB) upstream over the North Atlantic. The ridge leading to the RWB is typically amplified by the presence of warm conveyor belts (WCBs) in at least one North Atlantic cyclone about 4 d prior to Mediterranean cyclogenesis. Thus, the sequence of these four main events (namely a North Atlantic cyclone, WCBs, RWB, and the resulting PV streamers) forms an archetypal scenario leading to Mediterranean cyclogenesis. However, they rarely occur in a spatially consistent, fully repetitive pattern for real cyclone cases. To more systematically study this connection between upstream North Atlantic cyclones and Mediterranean cyclogenesis, we perform a set of semi-idealized simulations over the Euro-Atlantic domain. For these simulations, we prescribe a constant climatological atmospheric state in the initial and boundary conditions. To trigger the downstream Mediterranean cyclogenesis scenario, we perturb the climatological polar jet through the inversion of a positive upper-level PV anomaly. The amplitude of this perturbation determines the intensity of the triggered North Atlantic cyclone. This cyclone provokes RWB, the intrusion of a PV streamer over the Mediterranean, and thereby the formation of a Mediterranean cyclone. Therefore, our results show a direct connection between the presence of a North Atlantic cyclone and the downstream intrusion of a PV streamer into the Mediterranean, which causes cyclogenesis about 4 d after perturbing the polar jet. We refer to this as the upstream–downstream connection of North Atlantic and Mediterranean cyclones. To investigate the sensitivity of this connection, we vary the position and amplitude of the upper-level PV anomaly. In all simulations, cyclogenesis occurs in the Mediterranean. Nevertheless, the tracks and intensity of the Mediterranean cyclones may vary by up to 20° and 10 hPa (at the time of the mature stage), respectively. This indicates that the Mediterranean cyclone dynamics are sensitive to the dynamical structure and amplitude of the intruding PV streamer, which itself is sensitive to the interaction of the upstream cyclone and the RW(B). By applying different seasonal climatological atmospheric states as initial conditions we show that cyclogenesis occurs in distinct regions in different seasons. Thus, the seasonal cycle of Mediterranean cyclogenesis might be partly determined by the large-scale atmospheric circulation, i.e., the seasonal location of the polar jet. Furthermore, we show that the Mediterranean cyclones in these semi-idealized simulations show characteristics that agree with the observed climatology of Mediterranean cyclones in the respective season.
- Article
(13534 KB) - Full-text XML
- BibTeX
- EndNote


Mediterranean cyclones are frequent and potentially high-impact weather systems in one of the most densely populated regions of the world. In fact, the Mediterranean basin belongs to the regions of highest winter cyclone activity around the globe (Trigo et al., 1999; Ulbrich et al., 2009; Neu et al., 2013). Mediterranean cyclones typically form due to Rossby wave breaking (RWB) in the upper troposphere and the consequent southward intrusion of stratospheric air of high potential vorticity (PV; PV streamers; Appenzeller and Davies, 1992) over the region (Raveh-Rubin and Flaounas, 2017). The spatially distinct regions of cyclogenesis in, e.g., the eastern and western parts of the Mediterranean basin (e.g., Bartholy et al., 2009; Almazroui et al., 2015), suggest that there is high variability in the spatial structure of the PV streamers that result in Mediterranean cyclogenesis. Indeed, it has been shown by several case studies (e.g., Grams et al., 2011; Chaboureau et al., 2012; Pantillon et al., 2013; Portmann et al., 2020) that, depending on where the PV streamer intrudes into the Mediterranean, cyclogenesis occurs in different parts of the Mediterranean and the resulting cyclones may affect different areas in the basin with different impacts. For instance, PV streamers and the resulting cyclones in the western parts of the Mediterranean, e.g., the Gulf of Genoa, potentially lead to heavy precipitation south of the Alps (e.g., Massacand et al., 1998) and North Africa (e.g., Argence et al., 2008). But the RWB can also lead to PV streamers further east with cyclones affecting the eastern Mediterranean (e.g., Portmann et al., 2020).
The presence of the PV streamer is regarded as essential to trigger cyclogenesis (Massacand et al., 1998; Emanuel, 2005; Fita et al., 2006; Chaboureau et al., 2012; Flaounas et al., 2015; Raveh-Rubin and Flaounas, 2017), and, in addition, several studies have shown that the detailed structure of the streamer is essential for determining the cyclone's track and intensity (e.g., Flocas, 2000; Romero, 2001; Homar and Stensrud, 2004; Argence et al., 2009; Claud et al., 2010; Carrió et al., 2017). Despite the importance of the PV streamer, our knowledge of the chain of events that determines the location of its intrusion over the Mediterranean and its detailed structure are still not fully clear.
Indeed, Portmann et al. (2020) highlighted the importance of a credible representation of the upstream RWB for the accurate forecasting of the intrusion of the PV streamer and the consequent cyclogenesis. They showed that forecast errors of the location of a PV streamer over the Mediterranean were significantly reduced once the outflow of a warm conveyor belt (WCB; Madonna et al., 2014) of an upstream North Atlantic cyclone was represented accurately in the initial conditions. WCBs can amplify the ridge by transporting low-PV air from the lower to the upper troposphere (condensation inside the ascending airstreams results in PV destruction above) and thereby lead to the RWB downstream of the amplified negative PV anomaly. Therefore, North Atlantic WCBs seem to play a crucial role in forecasting Mediterranean cyclones. Furthermore, Pantillon et al. (2013) showed that a tropical cyclone over the North Atlantic that underwent extratropical transition is essential for the RWB and the intrusion of a PV streamer into the Mediterranean; when they removed the North Atlantic cyclone from the initial conditions of a forecast, they could suppress the formation of the downstream Mediterranean cyclone.
Raveh-Rubin and Flaounas (2017) showed that there is a systematic scenario that links Mediterranean cyclogenesis to different preceding atmospheric features. This scenario includes one or several extratropical cyclones over the North Atlantic. From those cyclones, WCBs originate and amplify the ridge downstream (typically over the central or eastern North Atlantic). The anticyclonic circulation induced by the (amplified) ridge provokes the RWB, which causes the intrusion of a PV streamer over the Mediterranean. Finally, the cyclonic circulation induced by the upper-level streamer contributes to surface cyclogenesis in the Mediterranean. In summary, the chain of events that leads to Mediterranean cyclogenesis includes (i) North Atlantic cyclone(s), (ii) WCBs amplifying a ridge, (iii) RWB, and (iv) an intruding PV streamer. Raveh-Rubin and Flaounas (2017) identified these features in the ERA-Interim reanalysis as coherent spatial objects and connected them in time. They showed that this scenario occurred in 181 out of the 200 intense Mediterranean cyclones they investigated. They found that one to five North Atlantic cyclones are connected to each Mediterranean cyclone downstream, suggesting that there is indeed an upstream–downstream connection between cyclones over the North Atlantic and in the Mediterranean. Although the same preceding atmospheric features are present for almost all Mediterranean cyclone events, the large-scale atmospheric conditions, i.e., the location of the jet and already acquired wave activity, are highly variable. Therefore, every case of Mediterranean cyclogenesis might be unique even if the features (i–iv) were always present. Hence, it is unknown how the location and intensity of the polar jet and of the North Atlantic cyclone affect the consequent intensity and location of the downstream Mediterranean cyclone.
In these regards, idealized model simulations may serve to better understand this upstream–downstream connection of cyclones as they can be operated with reduced complexity, e.g., less internal variability, compared to realistic simulations. Using such an idealized framework, several studies (e.g., Schär and Wernli, 1993; Wernli et al., 1999; Schemm et al., 2013) showed that downstream cyclogenesis can be triggered by locally perturbing the zonal jet and that moist processes affect the intensity of the downstream cyclone. However, these studies used a so-called channel setup with zonally uniform, analytically prescribed atmospheric conditions, which are not directly comparable to the (sub-)daily and zonally varying atmospheric states over the North Atlantic. Furthermore, they do not involve the unique geographical features of the Mediterranean basin, which have been shown to be a key factor for cyclone dynamics in the Mediterranean (e.g., Flaounas et al., 2022; Scherrmann et al., 2023).
To contribute to closing the gap in understanding the connection between the upstream and downstream cyclones, here the North Atlantic and Mediterranean cyclones, respectively, we introduce a semi-idealized modeling framework. In this framework, we trigger cyclogenesis in climatological flow conditions over the North Atlantic and investigate the chain of events suggested in the literature, i.e., the formation of a cyclone over the North Atlantic, the downstream ridge, RWB, intrusion of the PV streamer, and eventually cyclogenesis in the Mediterranean. To study the characteristics and sensitivity of this upstream–downstream connection, we trigger cyclogenesis over the North Atlantic in a similar way as done in previous baroclinic channel simulations, i.e., by placing a finite-amplitude, localized, positive upper-level PV anomaly with varying amplitude in different locations relative to the upper-level jet. With this approach we address the following objectives.
-
Develop a semi-idealized modeling framework that demonstrates the upstream–downstream cyclogenesis connection of North Atlantic and Mediterranean cyclones.
-
Determine the sensitivity of Mediterranean cyclogenesis to the location and intensity of the upstream cyclone over the Atlantic Ocean.
-
Investigate the sensitivity of Mediterranean cyclogenesis to the initial large-scale flow, representing climatological mean conditions in different seasons.
The study is structured as follows: in Sect. 2 we provide an overview of the model, the setup of the simulations, and algorithms used, before showing that the upstream–downstream cyclogenesis connection occurs in our simulations for winter in Sect. 3. The results of the sensitivity analysis with varying initial perturbations are presented in Sect. 4. Section 5 provides results where we vary the initial basic state by choosing the climatological mean flow from another season. In the last section we summarize and discuss our results and give an outlook for future studies.
2.1 Modeling approach
In this study, we use the Weather Research and Forecasting model (WRF; version 4.3; Skamarock et al., 2021). The domain of our experiments covers the North Atlantic–European domain (Fig. 1a) with a horizontal grid spacing of 0.5°×0.5° and we use 45 vertical hybrid sigma-pressure levels, which is adequate to reproduce Mediterranean cyclogenesis and dynamics (Flaounas et al., 2013). Simulations with a nested domain over the Mediterranean of 0.1° resolution provided similar results and conclusions within the variability of cyclone intensities and tracks presented below. The constant-in-time initial and boundary conditions consist of climatological averages calculated from ERA5 reanalyses (Hersbach et al., 2020) for a particular season. For all simulations, the duration has been set to 9 d. In our experiments microphysical processes are parameterized by a one-moment five-class scheme (Hong et al., 2004) and convection is parameterized by the Kain–Fritsch scheme (Kain, 2004). Both longwave radiation and shortwave radiation are taken from the RRTMG scheme (Iacono et al., 2008). We use the Yonsei University Scheme (Hong et al., 2006) for the planetary boundary layer parameterization and for land processes a 5-layer thermal diffusion scheme according to Dudhia (1996). Finally, the surface layer physics are represented by the revised MM5 scheme after Jiménez et al. (2012). The combination of these physical parameterizations has been shown to adequately reproduce Mediterranean cyclones (e.g., Claud et al., 2010; Miglietta and Rotunno, 2019; Flaounas et al., 2021).
2.2 Numerical experiments
In order to study the characteristics of the upstream–downstream connection of cyclones, we construct a semi-idealized atmospheric basic state. We calculate it by taking the average of ERA5 reanalysis (Hersbach et al., 2020) at 00:00 and 12:00 UTC during the period from 1979–2020. Initializing the model with climatological conditions, we remove synoptic-scale wave activity that provides the intense daily and sub-daily variability that characterizes the large-scale dynamics in the North Atlantic storm tracks. Further, it allows us to provide a more straightforward analysis of the relationship between North Atlantic cyclones and downstream cyclogenesis in the Mediterranean. Therefore, our semi-idealized numerical framework, with a climatological basic state and idealized initial perturbations, produces realistic large-scale dynamics in the region, without being influenced by already established wave activity. Note that this approach is not unlike the one used by Grams and Archambault (2016), who studied limited-area numerical simulations of extratropical transition in the western North Pacific, using initial and boundary conditions from compositing suitable large-scale flow situations. A major difference is that here, the initial conditions simply correspond to the seasonal mean state.
Figure 1 provides an overview of the climatological atmospheric state in the four seasons. Due to the averaging, the climatological PV fields at 300 hPa in Fig. 1a, d, g, and j are lacking the sharp gradients we find in instantaneous fields. In winter, the climatological fields show a prominent Icelandic Low (1000 hPa) and a broad Azores High (1020 hPa) that extends over the entire central North Atlantic into the Mediterranean and over North Africa (purple contours). In between those systems the polar jet spans from North America to the United Kingdom, with its maximum zonal velocity of about 40 m s−1 at the east coast of North America (Fig. 1b).
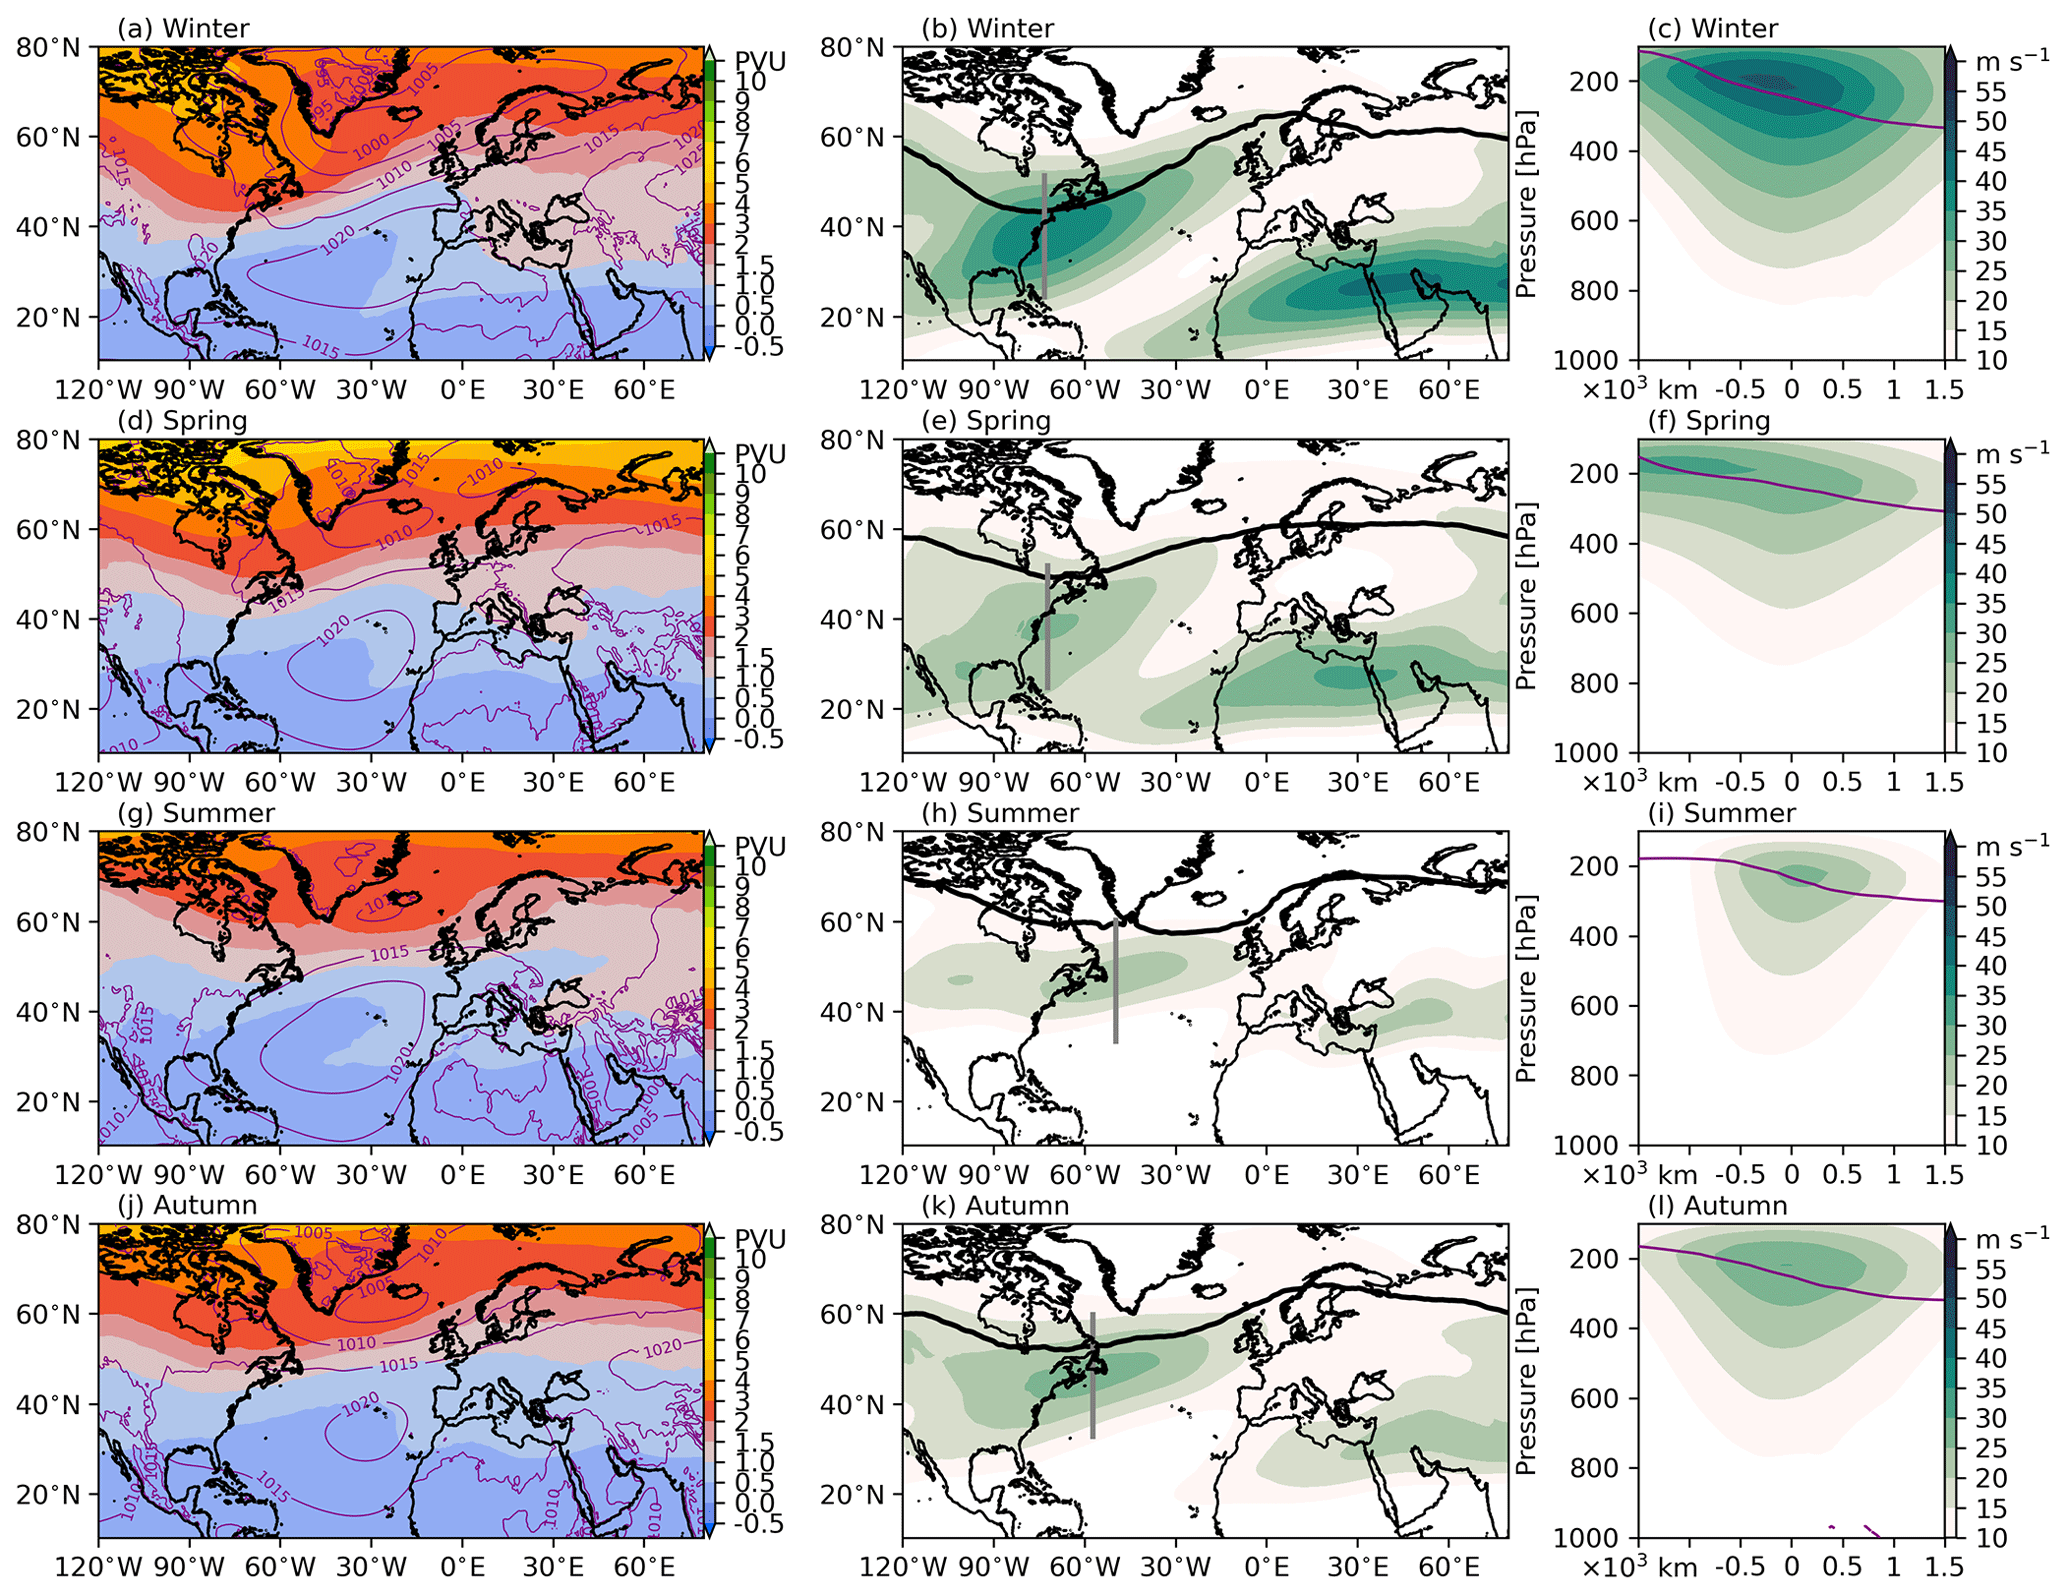
Figure 1Overview of the climatological atmospheric conditions in winter (a–c), spring (d–f), summer (g–i), and autumn (j–l). (a, d, g, j) PV at 300 hPa; the purple contours show SLP with intervals of 5 hPa. (b, e, h, k) Zonal wind at 300 hPa; the black line shows the 2 PVU contour. (c, f, i, l) Vertical cross-section of zonal wind along the gray line in panels (b), (e), (h), and (k) from south to north. The 2 PVU contour is shown in purple.
To analyze the seasonal dependency of Mediterranean cyclogenesis with respect to large-scale atmospheric conditions, we also calculate the climatological atmospheric state for spring, summer, and autumn; see Fig. 1d–l. In spring and autumn conditions the dynamical tropopause (depicted by the 2 PVU contour at 300 hPa; black line in Fig. 1b, e, h, k) is nearly at the same latitude, which in both cases is shifted towards the north compared to winter and is stronger for autumn (Fig. 1k) than for spring (Fig. 1e). The dipole of the Icelandic Low and the Azores High is weakest in spring, moderate in autumn, and strongest in winter. In spring the maximum zonal jet at 300 hPa (Fig. 1e) is at a similar position as in winter, whereas in autumn it is shifted northeastward and located around the Gulf of Saint Lawrence (Fig. 1k). In both spring and autumn, the jet is much weaker than in winter, with maximum zonal wind speeds of slightly above 20 m s−1. In spring the jet becomes asymmetric to the south in the upper troposphere (Fig. 1f) compared to autumn (Fig. 1l) and winter (Fig. 1c). In summer both the dipole in SLP (Fig. 1g) and the polar jet, which primarily extends zonally at 50° N (Fig. 1h), are of the lowest amplitude (1010–1020 hPa and 15 m s−1). The dynamical tropopause at 300 hPa is entirely north to 60° N.
Model integration is initialized with the reference atmospheric states in Fig. 1 and localized wind, temperature, and geopotential perturbations. These perturbations correspond to a positive upper-level quasi-geostrophic PV anomaly located at the latitude of the maximum zonal jet speed at 300 hPa. The anomalies are of different amplitudes (A), with a horizontal extension of km and a vertical exponential decay length of Lz=4 km, which have been used before in the studies by Wernli et al. (1999) and Schemm et al. (2013):
where xp, yp, and zp mark the spatial position of the center of the anomaly. We use the geopotential height at the location of the maximum zonal jet for the height zp. PV anomalies have been inverted according to the approach of Sprenger (2007), where we use a constant surface pressure p0=1017 hPa, a uniform stratification in the troposphere (up to 10 km) of N=0.015 s−1, and constant potential temperature at the surface of θsurface=290 K, which provides the corresponding wind, temperature, and pressure anomalies. From those anomalies we calculate the resulting geopotential height perturbation, Z′, at vertical level k according to
with the specific gas constant of dry air R and the gravitational acceleration g. Here, the ′ indicates the perturbation by the imposed anomaly. We assume that the surface (k=0) is unaffected by the anomaly and add the perturbations to the reference atmospheric state to obtain the initial conditions for our runs. We use quasi-geostrophic PV amplitudes of A=0.7, 1.4, and s−1, which translate to a maximum zonal wind speed perturbation of 11, 22, and 34 m s−1, respectively. Note that hereafter we will refer to the amplitude of the induced wind speed perturbation when mentioning the anomaly.
As an example, Fig. 2 shows the climatological atmospheric state in winter that is perturbed by a quasi-geostrophic PV anomaly with a maximal amplitude in the zonal wind of 22 m s−1 at 300 hPa. The PV anomaly amounts to 4–5 PVU, resulting in a total PV value of 6–7 PVU (Fig. 2a) at the location of the zonal jet maximum (≈ 60 m s−1) at 300 hPa over the east coast of North America (Fig. 2b). Furthermore, the addition of the anomaly yields a deformation of the jet, i.e., an acceleration of winds in the south (solid contours in Fig. 2c).
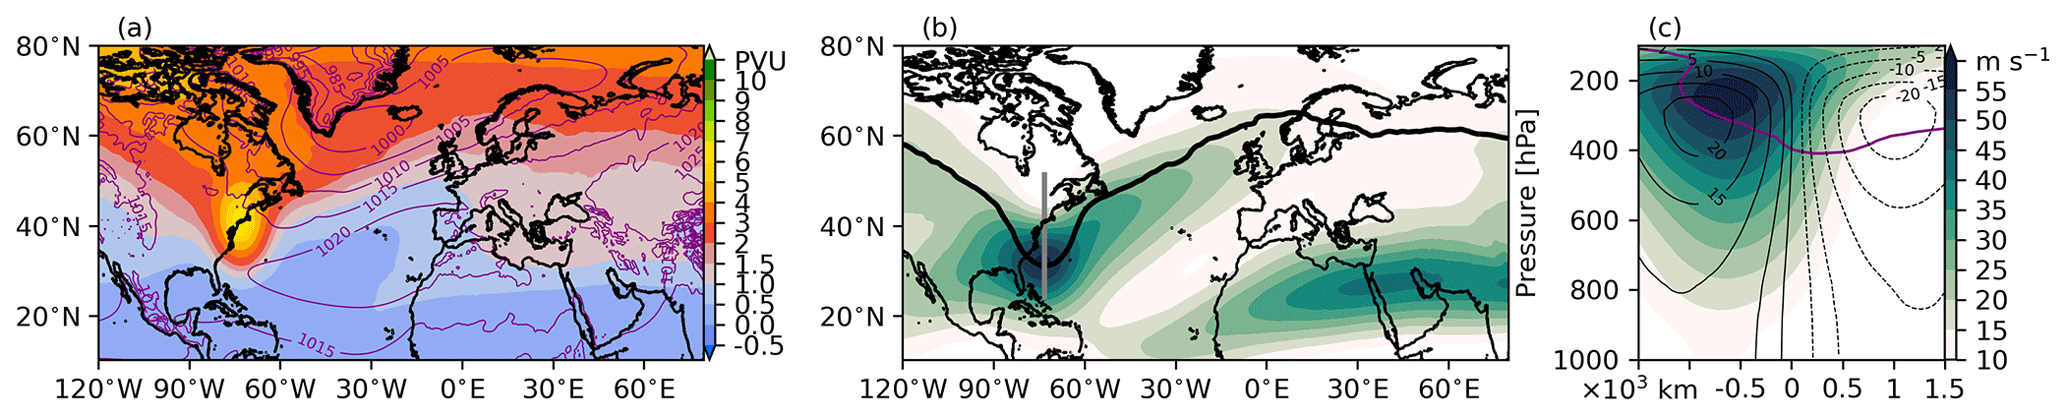
Figure 2Same as Fig. 1a–c, but here with an additional upper-level positive PV perturbation with a 22 m s−1 wind anomaly. The black contours in panel (c) indicate the difference from the unperturbed reference state; solid lines show positive and dashed lines negative differences.
Table 1Overview of the conducted simulations in all four seasons: winter, spring, summer, and autumn. The location indicates the horizontal position of the initial perturbation relative to the maximum zonal jet at 300 hPa, which is either central (no shift) or shifted by 200 or 400 km to the east, north, south, and west.
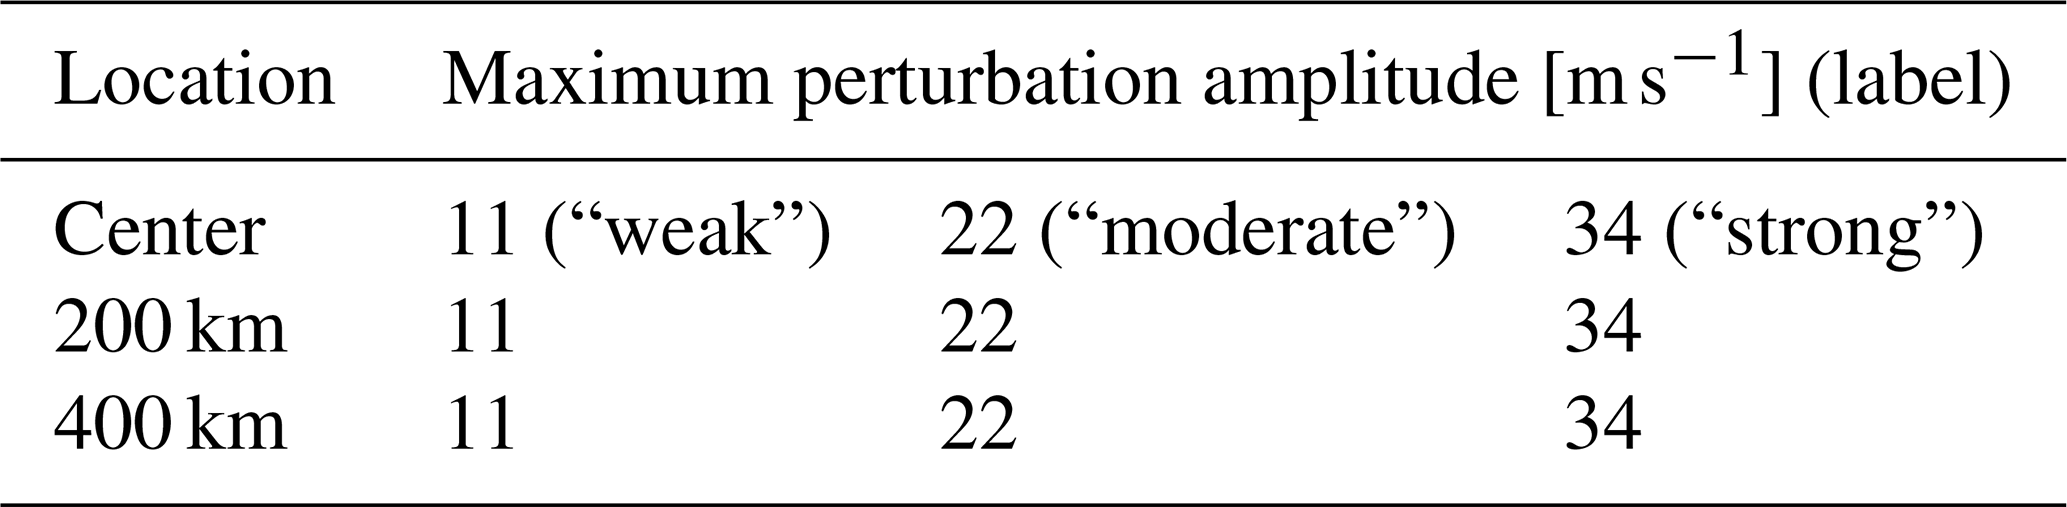
Table 1 lists the conducted simulations in all four seasons. We apply three perturbation amplitudes that we refer to as “weak”, “moderate”, and “strong”, which correspond to a maximum wind perturbation of 11, 22, and 34 m s−1, respectively.
2.3 Cyclone tracking
To establish the relationship between cyclones, we apply the method of Wernli and Schwierz (2006) with the modifications described in Sprenger et al. (2017) to objectively identify and track cyclones in all simulations. The updated algorithm introduced by Sprenger et al. (2017) first detects local sea level pressure minima, which are then enclosed by pressure contours that meet a minimum and maximum length threshold. These identified enclosed areas are then classified as cyclones at a given point in time. Note that cyclones identified above an elevation of 1500 m are eliminated, as the temperature interpolation for the SLP calculation over mountains might lead to spurious small-scale features (Wernli and Schwierz, 2006). To obtain cyclone tracks, the identified cyclones are concatenated in time, but only if the consecutive positions of the cyclones are less than a certain threshold distance apart. We track the North Atlantic cyclone initialized by the imposed initial perturbation and the consequent Mediterranean cyclone. Note that each simulation will provide a pair of a North Atlantic cyclone (triggered by the initially imposed perturbation) and a Mediterranean cyclone (triggered by the PV streamer associated with the RWB that is induced by the North Atlantic cyclone).
3.1 Simulation with the unperturbed winter basic state
In this section we investigate how the large-scale circulation and cyclones develop in a simulation with unperturbed initial conditions. The left panels in Fig. 3 show the evolution of PV at 300 hPa and SLP in the first 8 d of the simulation. 2 d after the model initialization (Fig. 3b), almost no upper-level wave activity developed and the large-scale circulation is still fairly close to the initial conditions (Fig. 3a). By day 4 (Fig. 3c), a (deep) cyclone starts to develop over the central North Atlantic, while another weak one has reached Brittany (white star, A), which formed at day 2 in the central North Atlantic and moved eastward (white line in Fig. 3b-e). To the east of both cyclones, RWB is starting to develop over western Europe and in the central North Atlantic, respectively, and by day 6 (Fig. 3d), both RWB events resulted in the intrusion of stratospheric PV streamers into the Mediterranean. The PV streamer over the central Mediterranean breaks anticyclonically, similarly to the so-called “life cycle 1” (LC1) in Thorncroft et al. (1993), and extends over northwestern Africa. The second PV streamer is located over the Black Sea and Turkey. The streamers are separated by a narrow ridge over Greece that is caused by the shallow cyclone now located over Poland and Belarus (white star in Fig. 3d). After 6.5 d, genesis of a very shallow Mediterranean cyclone (1015 hPa) took place close to Cyprus (B and white line in Fig. 3e). As cyclogenesis took place underneath the PV streamer that resulted from the shallow North Atlantic cyclone, we associate this Mediterranean cyclone with the early shallow cyclone over the North Atlantic. After 8 d (Fig. 3e), the polar jet shows pronounced wave activity with multiple ridges over the Mediterranean and North Atlantic, as well as cyclones over the North Atlantic (south of Greenland, to the east of the UK and of the east coast of North America) that reach spatial sizes, amplitudes, and intensities comparable to observed systems represented in reanalyses.
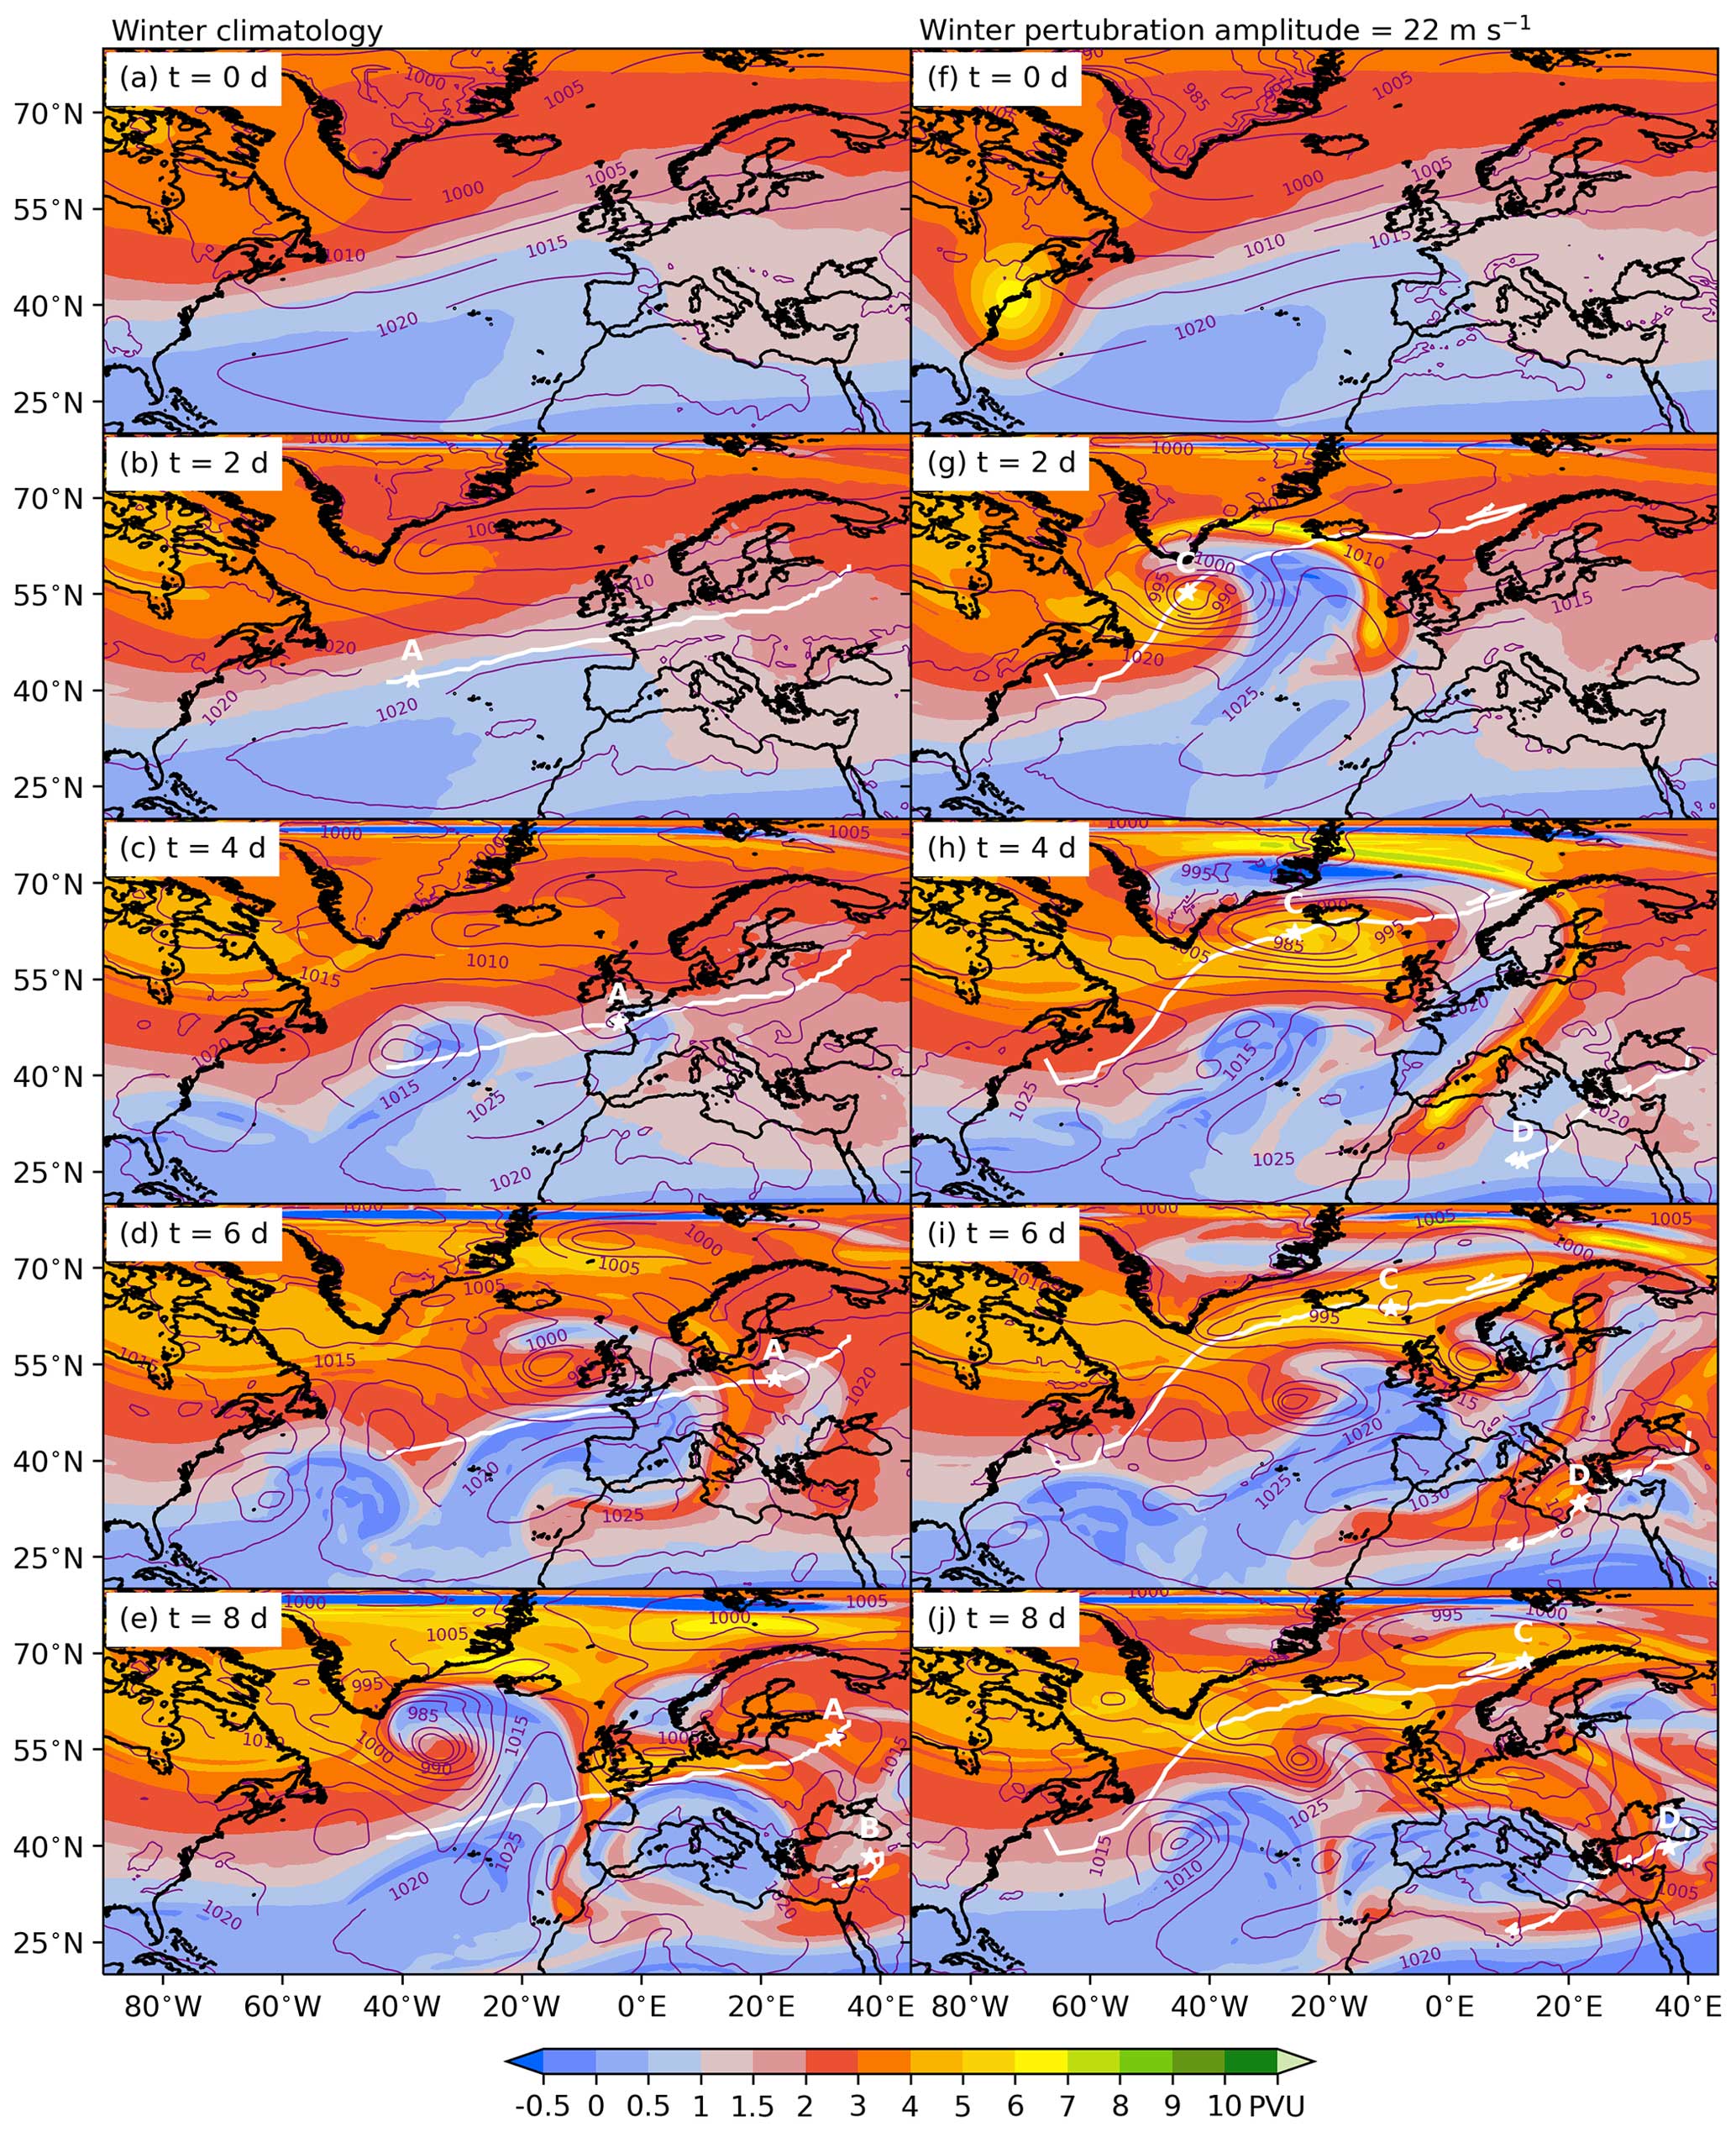
Figure 3Time evolution of the simulation initialized with the unperturbed climatological reference state in winter (a–e) and with a moderate initial perturbation (f–j). Panels show PV at 300 hPa at (a, f) 0 d, (b, g) 2 d, (c, h) 4 d, (d, i) 6 d, and (e, j) 8 d of simulation time. Purple contours show SLP in 5 hPa intervals. The white lines show the tracks of the initial North Atlantic (A, C) and Mediterranean (B, D) cyclones, and white stars show their current location.
Compared to the cyclone climatology (e.g., Flaounas et al., 2014), the first cyclones that develop in this simulation over the North Atlantic (A) and the Mediterranean (B), respectively, are of low intensity. Without a well-defined upper-level trough as initial perturbation, cyclogenesis is expected to be weaker. Therefore, the North Atlantic cyclone starts with a low intensity of 1018 hPa and reaches its mature stage (time of minimum SLP along the cyclone track) over central Europe around day 5 with a central SLP of 1002 hPa. Also, the horizontal PV gradients along the PV streamer over the Black Sea and Turkey are weak and the resulting Mediterranean cyclone is shallow with 1015 hPa at cyclogenesis and 1010 hPa at its mature stage over Turkey. Later in the simulation, when upper-level waves have grown to larger amplitude, cyclones with more realistic intensity and sizes develop (Fig. 3d, e).
3.2 Simulation with an additional initial upper-level PV perturbation
In this section, we analyze how the presence of a North Atlantic cyclone, triggered by an initial upper-level PV perturbation (Fig. 2) at the location of the maximum climatological zonal jet at 300 hPa, affects the upper-level wave and downstream cyclogenesis. The positive PV perturbation has a wind amplitude of 22 m s−1 and represents an approaching trough over the North Atlantic (Fig. 3f). Compared to the evolution in the unperturbed simulation (Fig. 3a–e), the presence of the perturbation triggers almost instantaneous cyclogenesis over the North Atlantic to the east of the perturbation. After 2 d of model integration (Fig. 3g), the cyclone (C) has deepened below 985 hPa, while moving northeastward (white line) to the south of Greenland (white star). Furthermore, the perturbation led to the formation of an intense ridge and a disruption of the zonal orientation of the tropopause (Fig. 3g), which results in the formation and southward intrusion of a PV streamer to the west of the UK (Fig. 3g). The upper-level trough and ridge pattern and the North Atlantic cyclone are spatially larger and more intense compared to the ones forming between days 4 and 6 in the unperturbed simulation (Fig. 3c, d). The North Atlantic cyclone continuously deepens until it reaches its mature stage between Greenland and Iceland, with a minimum SLP of 977 hPa around day 3. After day 4 (Fig. 3h), a prominent and, compared to the unperturbed reference run (Fig. 3c), narrow but large-amplitude PV streamer (≈ 6 PVU) has intruded into the western and central Mediterranean. The spatial size and amplitude of the streamer are comparable to PV streamers described in real case studies (e.g., Tripoli et al., 2005; Argence et al., 2008; Wiegand and Knippertz, 2014, their Figs. 4a, 1c, and 8b, respectively), which induced intense Mediterranean cyclones. The streamer triggers cyclogenesis over Libya (D, white line in Fig. 3h), from where the Mediterranean cyclone propagates to the northeast and transitions to the Mediterranean Sea northwest of Egypt on day 6 (Fig. 3i). At the time of minimum SLP around day 8 (Fig. 3j), the Mediterranean cyclone (994 hPa) is located over the eastern Pontic Mountains.
Perturbing the initial conditions at the center of the zonal jet immediately triggers cyclogenesis over the North Atlantic, with a prominent cyclonic RWB and a strong ridge forming downstream as a consequence. The timing, spatial size, and intensity of the large-scale features, i.e., the cyclone over the North Atlantic, the ridge east of the cyclone, the intrusion of a PV streamer into the Mediterranean, and Mediterranean cyclogenesis, are very different in the perturbed compared to the unperturbed experiment (Sect. 3.1). In particular, perturbing the zonal jet in this particular way reveals the upstream–downstream connection between North Atlantic and Mediterranean cyclones. The important role of the WCBs in this connection is discussed in Appendix A. In the next section we discuss how different locations and amplitudes of the initial perturbation affect the wave evolution, intensity, and location of the North Atlantic cyclone, as well as the subsequent downstream development of the Mediterranean cyclone.
We now probe the sensitivity of the upstream–downstream connection in winter to different intensities and locations of the initial upper-level perturbation and hence also of the North Atlantic cyclones. Therefore, we repeat the simulation in which the initial perturbation is positioned at the maximum intensity of the jet at 300 hPa (Fig. 3f–j), with two different amplitudes of the perturbation, i.e., 11 and 34 m s−1, corresponding to half and 1.5 times the one applied in Sect. 3.2. Henceforth, we will refer to the three perturbation intensities as weak (11 m s−1), moderate (22 m s−1), and strong (34 m s−1). Furthermore, we displace the perturbation by 200 and 400 km to the north, south, east, and west relative to the location of the maximum zonal wind at 300 hPa, which gives a total of nine simulations per intensity of the perturbation (see Table 1). Regardless of the change in the location and intensity of the perturbation, the upstream–downstream connection consistently occurs.
4.1 Morphology and intensity of the RWB
We first investigate the effect of displacing the initial perturbation on the RWB for the moderate-intensity case already discussed in Sect. 3.2. The effect on the PV streamer that forms on day 4 (Fig. 3h) is surprisingly small. Figure 4 shows the overlapping frequency (shading) of PV ≥2 PVU at 300 hPa and the corresponding 2 PVU contours (colored lines) after 4 d for all nine experiments in winter with a moderate initial perturbation. The dark red shading shows that the overall location and timing of the PV streamer over Central Europe are fairly consistent and rather independent of the imposed variations in the location of the initial upper-level PV perturbation. However, the exact position of the PV streamer is slightly shifted according to the horizontal shift of the initial perturbation; e.g., the eastward-shifted perturbation results in an eastward-shifted ridge and PV streamer (purple contour). The spatial displacement of ridges and PV streamers is slightly larger for a larger displacement of the initial upstream PV perturbation. Overall, similar results in the variability of the ridge and PV streamer within the set of simulations initialized with the same perturbation amplitude are found for the strong and weak initial perturbation. However, the shifts in the position of the PV streamer over Europe are larger for strong perturbations compared to weak perturbations (not shown). This suggests that the variations of the initial upper-level PV structure over the North Atlantic are advected and further enhanced with the nonlinear flow evolution. This is consistent with the findings of Portmann et al. (2020), who showed that upstream differences in the PV structure over the Gulf of Saint Lawrence resulted in different shapes and location of PV streamers over the Mediterranean in an ensemble forecast. However, they observed shifts in longitude up to 15°, which is much larger than the shifts observed in our experiments (±4°). This difference in amplitude of the spread of the PV streamers might be due to the choice of the climatological initial conditions in our case, which appears to be more robust against small perturbations than instantaneous fields with larger isentropic PV gradients. The spread of the PV streamers is equally low with up to ±2.5° in the weak and ±5.5° in the strong perturbation experiments, respectively (not shown).
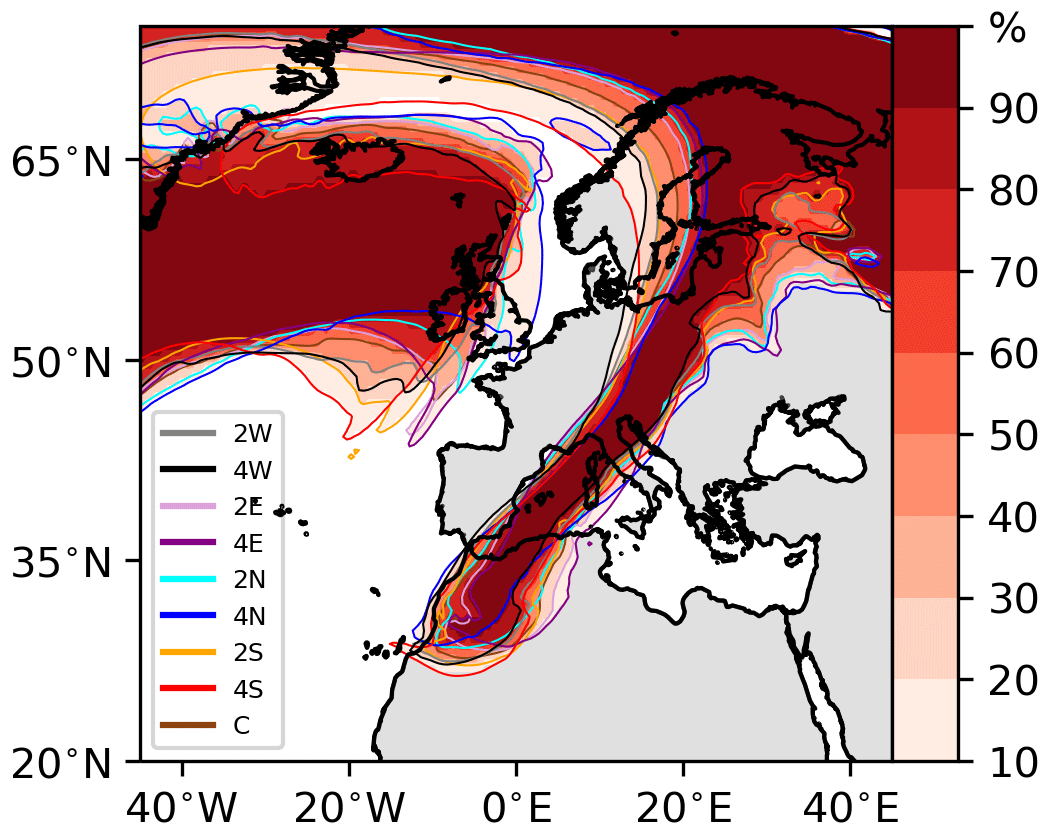
Figure 4Averaged frequency of the PV streamer at 300 hPa (≥2 PVU) at t=4 d of the nine simulations with the moderate-intensity perturbation located at slightly different initial positions. Colored contours mark the 2 PVU line for the individual simulations. The legend indicates the horizontal shift relative to the location of the maximum zonal wind speed at 300 hPa: labels 2 and 4 denote displacements by 200 and 400 km, respectively, and E, N, W, and S indicate the direction of the shift. Finally, label C indicates the experiment with the perturbation located at the center of the jet (discussed in Sect. 3.2).
In contrast to the weak sensitivity of the morphology of the ridge and PV streamer to the location of the initial perturbation (with constant amplitude), the sensitivity to the initial amplitude of the perturbation (to the degree tested with our setup) is much larger. We first consider the evolution during the first 4 d, i.e., until the formation of the PV streamer over Europe, in the weak and strong perturbation simulations (Fig. 5) and compare them with the simulation with the moderate perturbation (Fig. 3f–h). For all three simulations, the initial perturbation was not shifted relative to the position of the maximum zonal wind at 300 hPa. Figure 5 shows that the stronger the initial perturbation, the larger becomes the ridge that forms within 2 d over the central North Atlantic (Fig. 5a, c). Furthermore, in the experiment with a strong perturbation (Fig. 5c), the ridge has lower PV values and its comma shape extends further north. As a result, the cyclonic RWB occurs near southern Greenland compared to the central North Atlantic in the experiment with a weak perturbation (Fig. 5a). In the experiment with a strong perturbation, the more amplified RWB with a more intense negative PV anomaly in the ridge causes the intruding PV streamer over western Europe after 4 d to be of higher amplitude and to reach further south over Algeria (Fig. 5d) compared to the weak perturbation experiment (Fig. 5b).
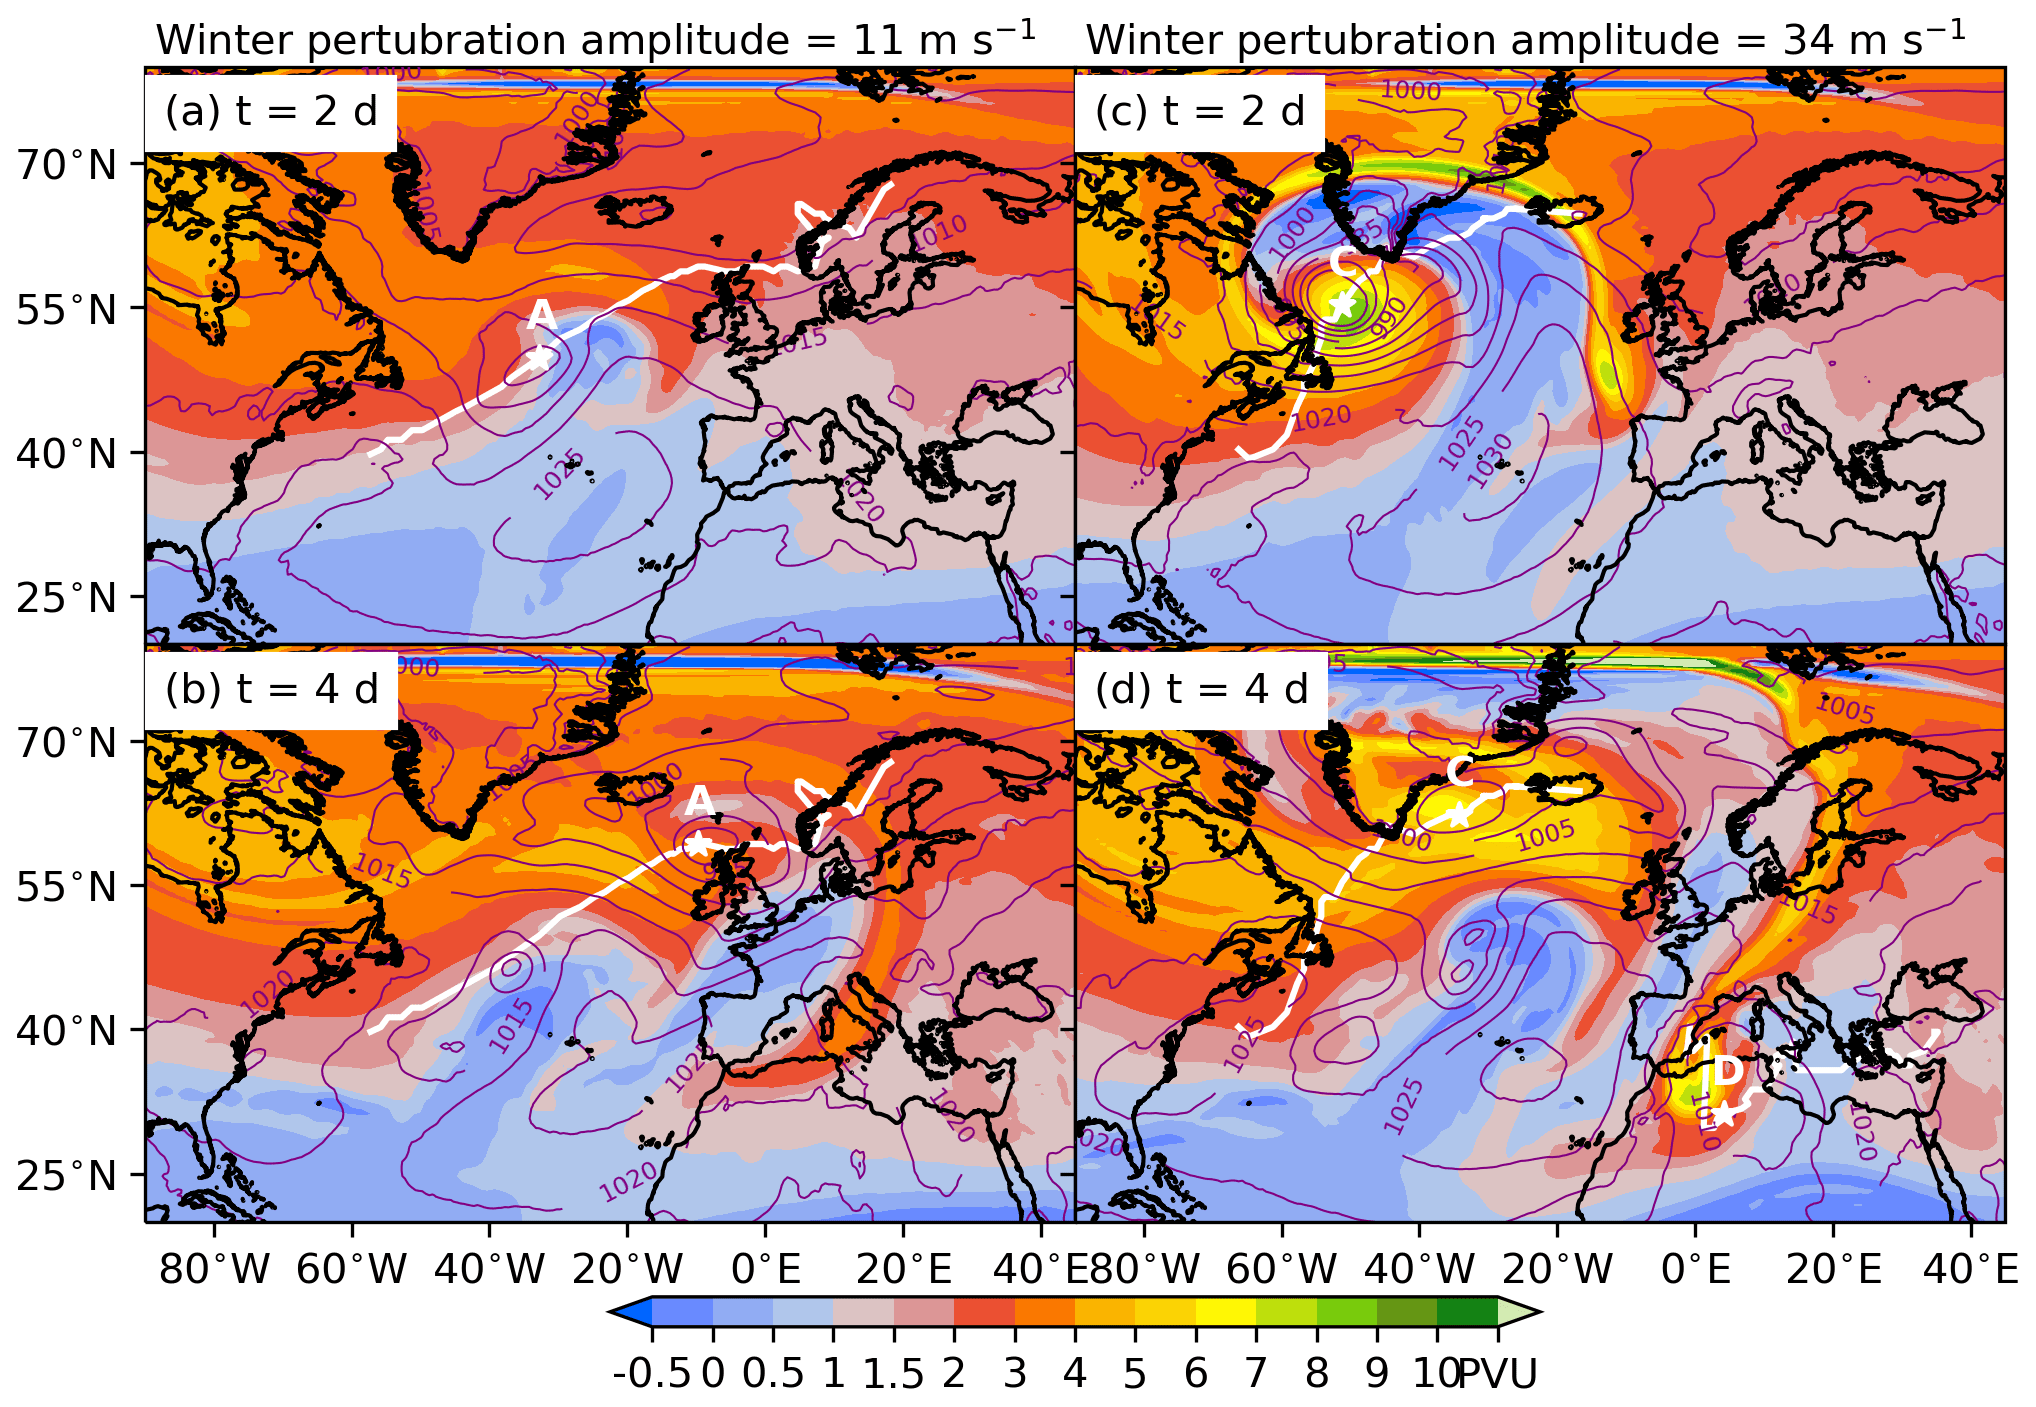
Figure 5Same as Fig. 3f–j for an initial wind anomaly of 11 m s−1 (a, b) and 34 m s−1 (c, d). Panels show the development after 2 and 4 d, respectively.
These important differences in the character of the RWB and structure of the PV streamer over Europe after 4 d when increasing the amplitude of the initial perturbation are still very obvious when comparing small ensembles for each perturbation amplitude. To this end, ensembles with nine simulations each were performed for the weak, moderate, and strong initial perturbation with slightly shifted positions of the initial perturbation as described above for the moderate-intensity case. Figure 6 shows the ensemble-averaged PV at 300 hPa for the three intensity categories, revealing well-defined PV streamers and therefore a very similar large-scale evolution for the simulations with the same intensity of the initial perturbation. The spread of the PV streamers for the moderate initial perturbation experiments is given in Fig. 4. With a weak initial perturbation (Fig. 6a), the PV streamer curves anticyclonically and extends over Italy. In the experiments with a moderate (Fig. 6b) and strong (Fig. 6c) initial perturbation, the PV streamer has higher PV values and extends further equatorward. In the moderate case, a straight PV streamer forms with almost uniform PV from Poland to Morocco, whereas in the case of the strong perturbation, a “bulb” (or tip vortex) with high PV values forms at its southern end. The composite SLP fields (purple contours in Fig. 6) reveal that with increasing intensity of the initial upstream perturbation, the higher PV values of the PV streamers provide a stronger baroclinic forcing and thus cyclogenesis occurs earlier in the simulation (further discussed in Sect. 5.2). In the simulations with the strong initial perturbation (6c), a weak surface cyclone appears in the composite at day 4 over northwestern Africa, most likely induced by the prominent upper-level tip vortex.
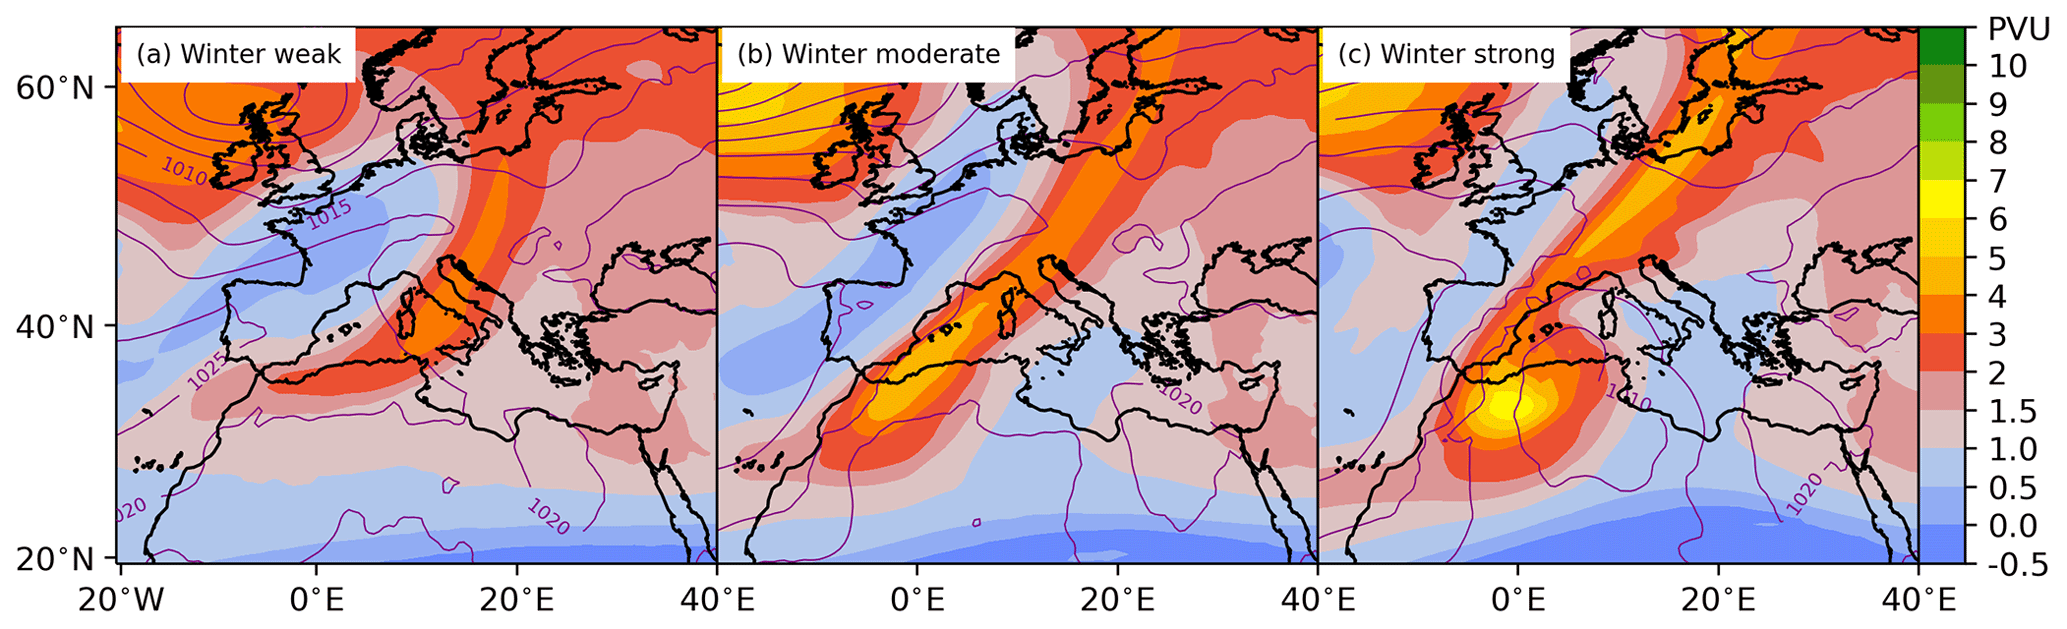
Figure 6Composites after 4 d of nine simulations each with slightly displaced initial perturbations (Table 1) for (a) weak, (b) moderate, and (c) strong perturbation amplitudes. Colors show PV at 300 hPa, and the purple contours show SLP with 5 hPa intervals.
4.2 Tracks and intensities of the upstream and downstream cyclones
We now turn our attention to the effects of the initial perturbation on the resulting North Atlantic and Mediterranean cyclones, first considering cyclones in the nine simulations in the moderate-intensity category (Fig. 7). The North Atlantic cyclones (Fig. 7a) propagate fairly coherently (±2°) from south of Newfoundland towards Iceland and reach the mature stage at similar locations (indicated by star), except for the simulation labeled 4S, where the initial perturbation is shifted 400 km to the south. Larger differences occur at the end of the cyclone tracks. The Mediterranean cyclone tracks (Fig. 7c) show slightly more spread with substantial differences in the location of the mature stage (up to 20°), which varies from the Aegean Sea to Syria. Also considering the evolution of minimum SLP along the cyclone tracks (Fig. 7b) reveals substantial differences in the timing of the intensification and the maximum intensity reached for both the North Atlantic and Mediterranean cyclones. For instance, the peak intensity of the North Atlantic cyclone in the simulations 4N and 4S differs by 10 hPa and the time of maximum intensity by 2 d, and for the Mediterranean cyclones, there is relatively poor agreement in the timing of the intensification.
As a next step, we consider the maximum intensity of North Atlantic and Mediterranean cyclones in all simulations listed in Table 1. The goal is to identify potential correlations between the intensities of the upstream–downstream cyclone pairs and between characteristics of the initial conditions and the intensity of the North Atlantic cyclone. To this end, the maximum zonal wind at 300 hPa in the vicinity of the initial perturbation is chosen as an important characteristic of the initial conditions (via the thermal wind relationship, high wind speed implies strong baroclinicity). This zonal wind maximum clearly increases with the amplitude of the PV perturbation, but it also depends on the position of the perturbation. For instance, for the moderate-intensity perturbation located at the central position, the maximum zonal wind in the initial conditions amounts to about 58 m s−1 (see Fig. 2b,c). Figure 8a shows that the maximum intensity (minimum SLP along the cyclone track) of the North Atlantic cyclone (gray dots) increases almost linearly with the maximum zonal jet velocity in the initial conditions (the correlation is statistically significant with the Pearson correlation coefficient , with a confidence level of ). Perturbations with higher PV values induce a stronger cyclonic wind field for the vertical baroclinic coupling, similar to the results of Barnes et al. (2022). Furthermore, they create a more intense jet streak, leading to increased large-scale forcing for upward motion that amplifies the development of the cyclone.
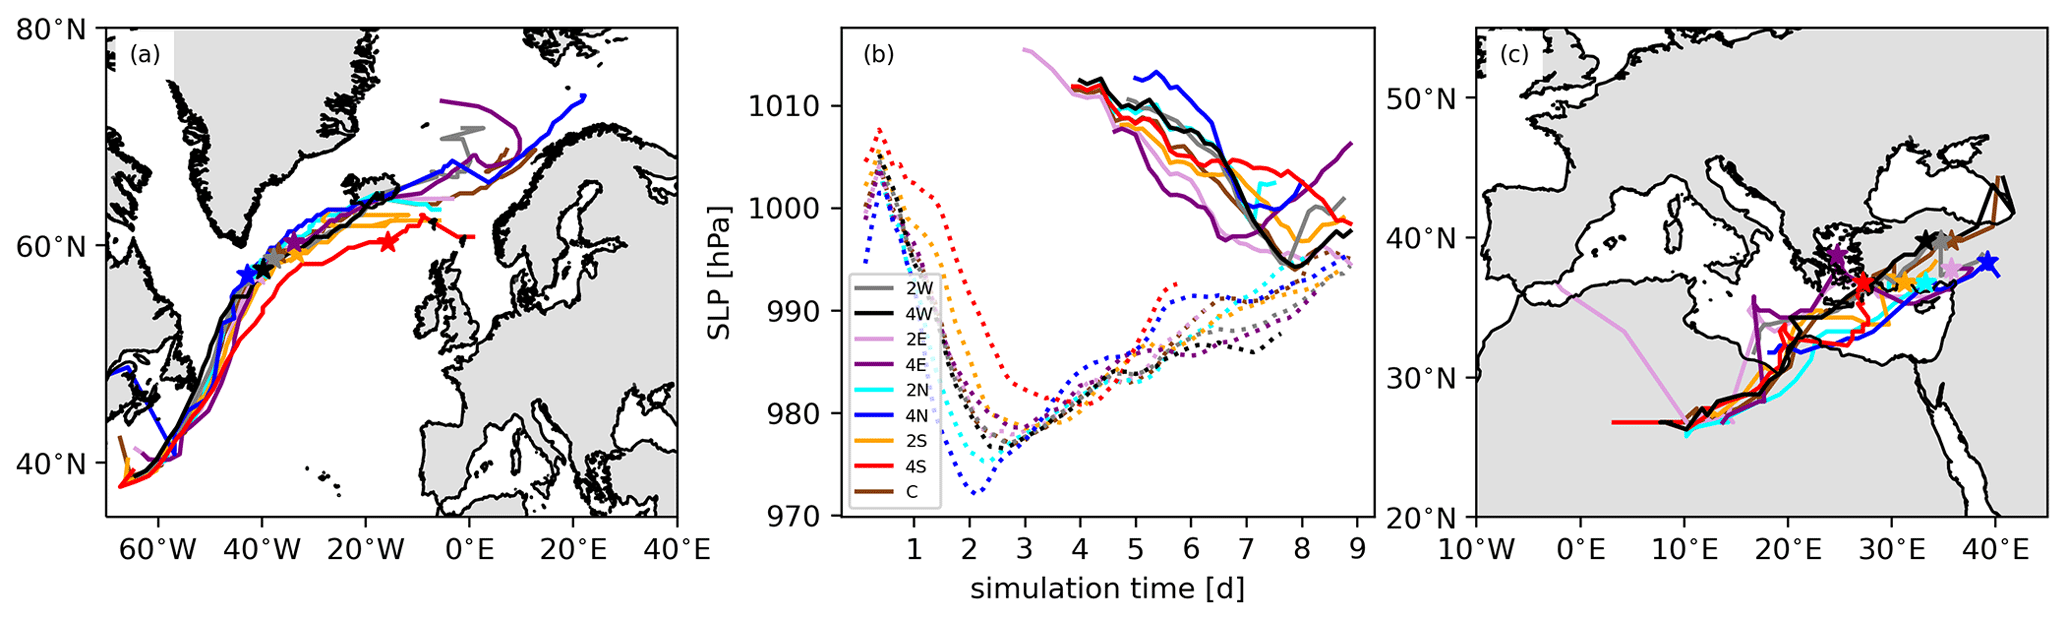
Figure 7Cyclone tracks and characteristics for all nine experiments in winter with a perturbation amplitude of 22 m s−1. (a) North Atlantic cyclone tracks with maximum intensity highlighted by a star. (b) SLP evolution of the North Atlantic (dotted) and Mediterranean (solid) cyclones. The legend indicates the horizontal location of the initial perturbation relative to the location of the maximum zonal jet: 2 and 4 mark displacements by 200 and 400 km, respectively, and E, N, W, and S indicate the direction of the shift. C labels the experiment with the perturbation located at the center of the jet. (c) Mediterranean cyclone tracks, with stars again highlighting maximum intensity.
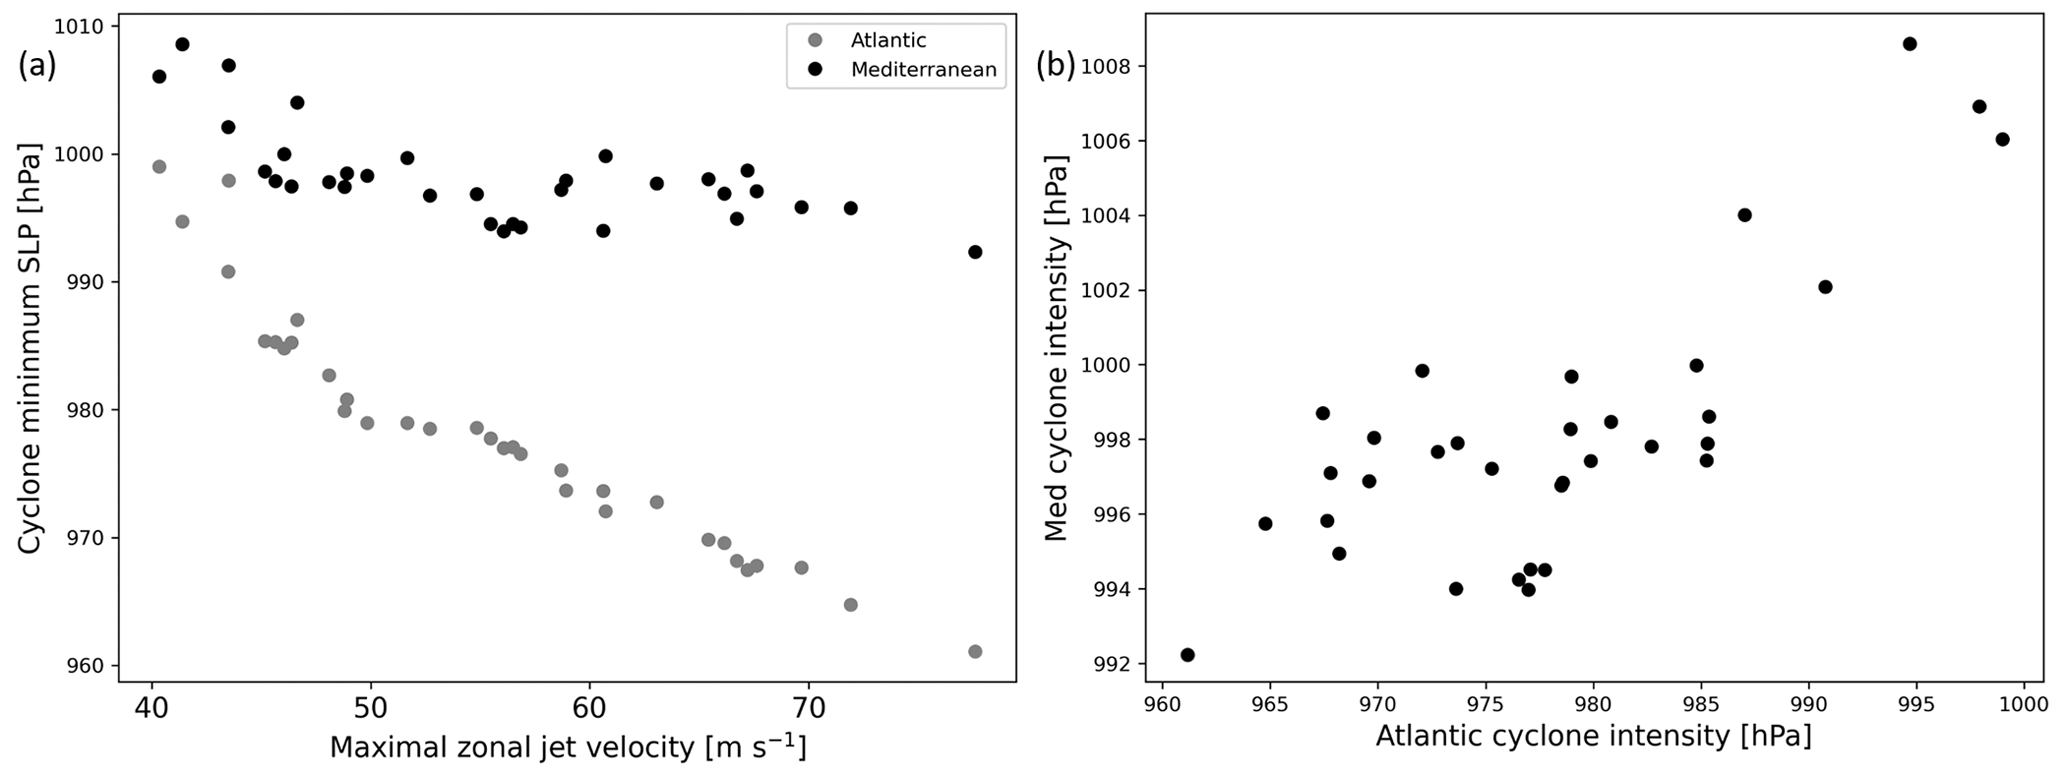
Figure 8Scatter plots for all winter simulations of (a) the maximum 300 hPa zonal wind near the initial perturbation and the minimum SLP of the North Atlantic (gray) and Mediterranean (black) cyclones, as well as (b) the minimum SLP of the Mediterranean vs. the North Atlantic cyclone. Every dot represents one simulation.
The maximum intensity of the Mediterranean cyclone (black markers in Fig. 8a) also increases with an increased maximum zonal wind speed at 300 hPa, but the correlation is much less obvious than for the North Atlantic cyclone. There appears to be a threshold zonal wind speed value of about 50 m s−1 beyond which the intensity of the Mediterranean cyclones remains fairly constant. The discussion above has shown that the PV streamers in the experiments with stronger perturbations have higher maximum PV values, which could lead to stronger Mediterranean cyclones. However, since other nonlinear atmospheric processes also contribute to the intensity of the Mediterranean cyclone, there is no straightforward correlation with the amplitude of the initial maximum zonal upper-level wind as we found for the North Atlantic cyclones. The variability of the intensities of the Mediterranean cyclones suggests that this intensity depends on the detailed structure and location of the PV streamer, which is consistent with the findings from several previous studies (Flocas, 2000; Romero, 2001; Homar and Stensrud, 2004; Argence et al., 2009; Claud et al., 2010; Carrió et al., 2017).
In Fig. 8b, we correlate the intensities of the cyclone pairs, which, consistent with Fig. 8a, shows a good correlation for relatively weak North Atlantic cyclones and no correlation for North Atlantic cyclones deeper than 980 hPa. The primary finding of this analysis is that while the intensity of the North Atlantic cyclone is closely connected to the amplitude of the initial upper-level zonal wind peak, the connection is substantially weaker for the intensity of the Mediterranean cyclone downstream when all zonal wind speeds are considered. Up to 50 m s−1 the intensity of the Mediterranean cyclones also shows a strong correlation with the initial zonal wind. Consistent with previous studies, the dynamics of the latter are heavily influenced by local factors like sea surface temperature (e.g., Hagay and Brenner, 2021; Varlas et al., 2023) and orography (e.g., Horvath et al., 2006) in the Mediterranean and by the nonlinear flow evolution during the 4 d simulation period prior to Mediterranean cyclogenesis.
So far, all experiments have been performed for (perturbed) winter mean initial conditions. In this section, we investigate whether the upstream–downstream connection exists when initializing the simulations with climatological mean states of the other seasons. Thereby, we investigate how the track and intensity of the North Atlantic cyclone, the morphology of the RWB and the PV streamer, and the track and intensity of the Mediterranean cyclone are affected by different locations and intensities of the polar jet (Fig. 1), as well as different temperature and moisture profiles. Therefore, we repeat the previous experiments but now use the climatological mean states for spring, summer, and autumn (see Table 1 and Fig. 1). Independent of the locations and amplitudes of the initial perturbation, the downstream cyclogenesis over the Mediterranean occurs in all simulations for spring and autumn but not for summer, which is consistent with the lowest observed cyclone frequency during the summer season (Campins et al., 2011; Flaounas et al., 2013; Lionello et al., 2016).
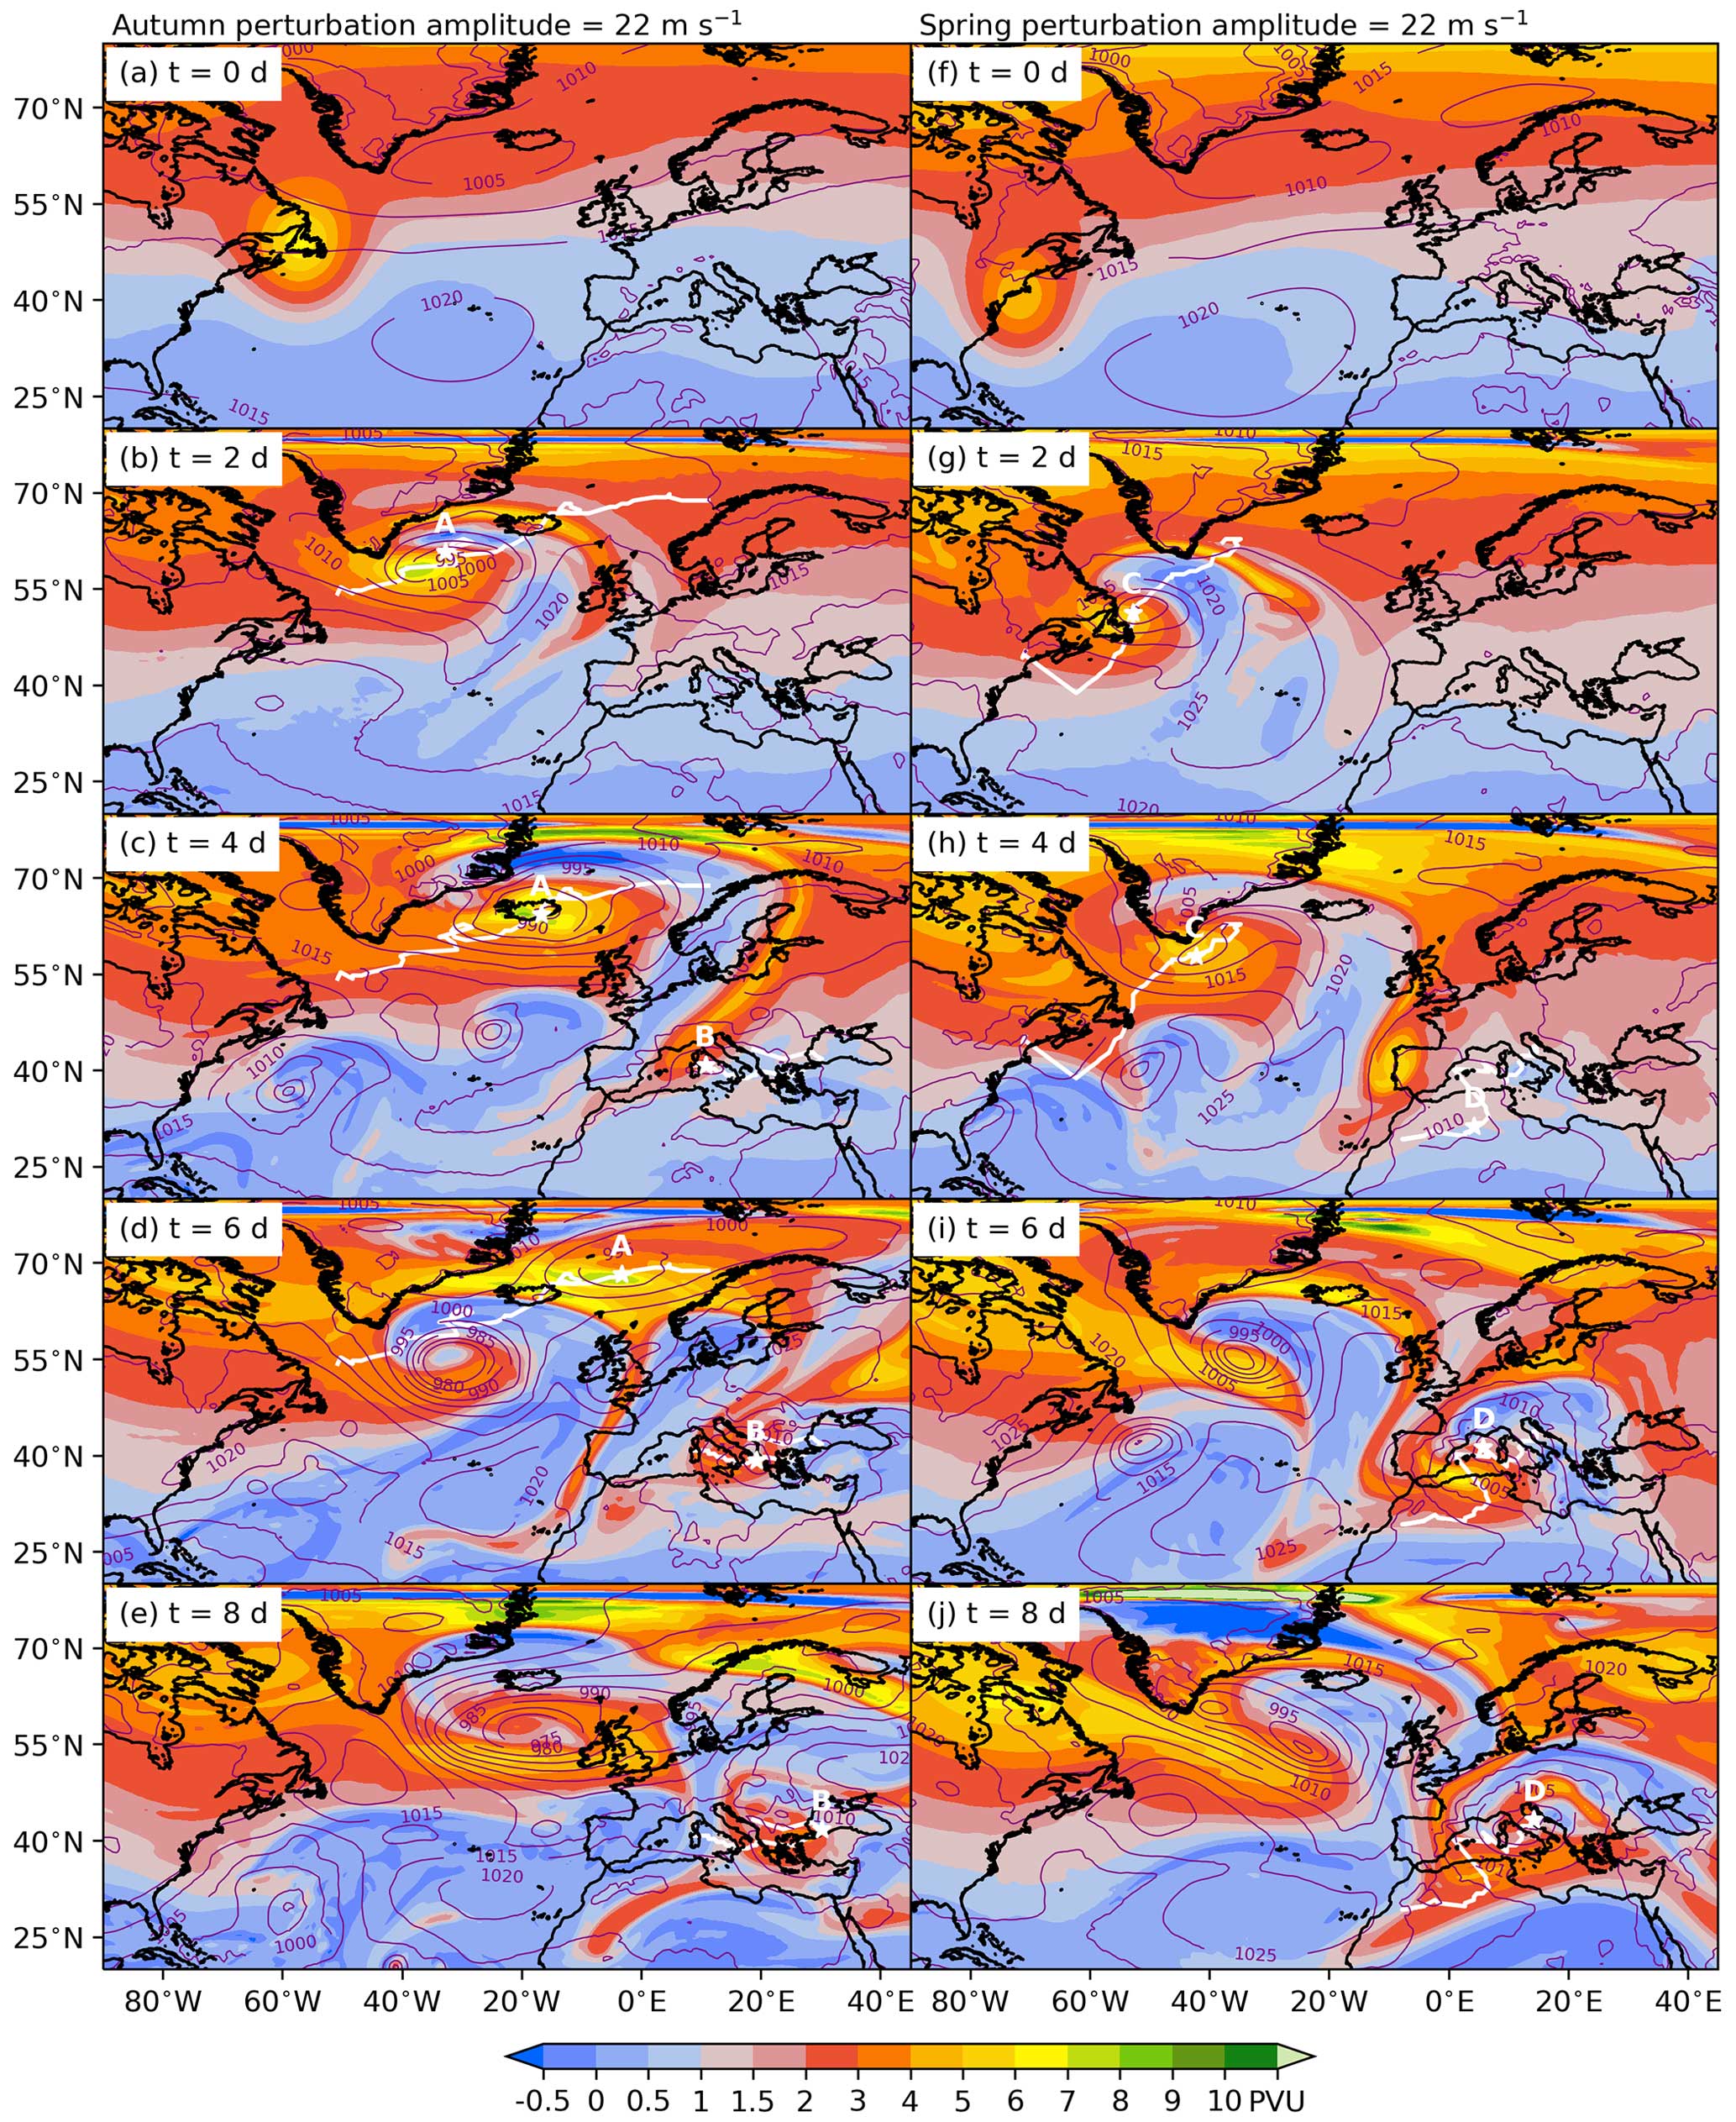
Figure 9Same as Fig. 3f–j for initial conditions corresponding to the climatological mean in autumn (a–e) and spring (f–j).
5.1 Morphology of the RWB
First, we investigate the evolution of the autumn and spring simulations that are perturbed by a moderate initial perturbation, placed at the maximum zonal wind speed of the polar jet at 300 hPa, similar to the winter experiment in Sect. 3.2. Figure 9 shows the evolution of PV at 300 hPa and SLP for the autumn (Fig. 9a–e) and spring (Fig. 9f–j) initial conditions (compare to winter in Fig. 3f–j). In autumn, the initial perturbation is located over the Gulf of Saint Lawrence (Fig. 9a), whereas in spring it is located over the east coast of North America (Fig. 9f), similar to the one in winter (Fig. 3f). With the more northerly location of the jet and thereby the initial perturbation, at about 50° N in autumn (compared to about 40° N in winter), cyclogenesis over the North Atlantic occurs at higher latitudes and the North Atlantic cyclone (A) propagates primarily eastward (white line in Fig. 9b) in the first 2 d compared to the northeastward propagation of the cyclones forming close to Newfoundland in spring (C; Fig. 9g) and winter (C; Fig. 3g). After 4 d, both the ridge and PV streamer in autumn are comparable in morphology to the ones in winter (Fig. 3h), but the PV streamer over the Mediterranean has lower PV values (Fig. 9c). Over the North Atlantic, the ridge, the RWB, and the PV streamer are all located further north, with the tip of the PV streamer located over the Gulf of Genoa (Fig. 9c), in contrast to the winter simulation where the tip reaches Algeria (Fig. 3h). In autumn, the PV streamer triggers Mediterranean cyclogenesis in the Tyrrhenian Sea, from where the cyclone (B) moves eastwards over Greece (white star in Fig. 9d) and afterwards into the Black Sea (Fig. 9e).
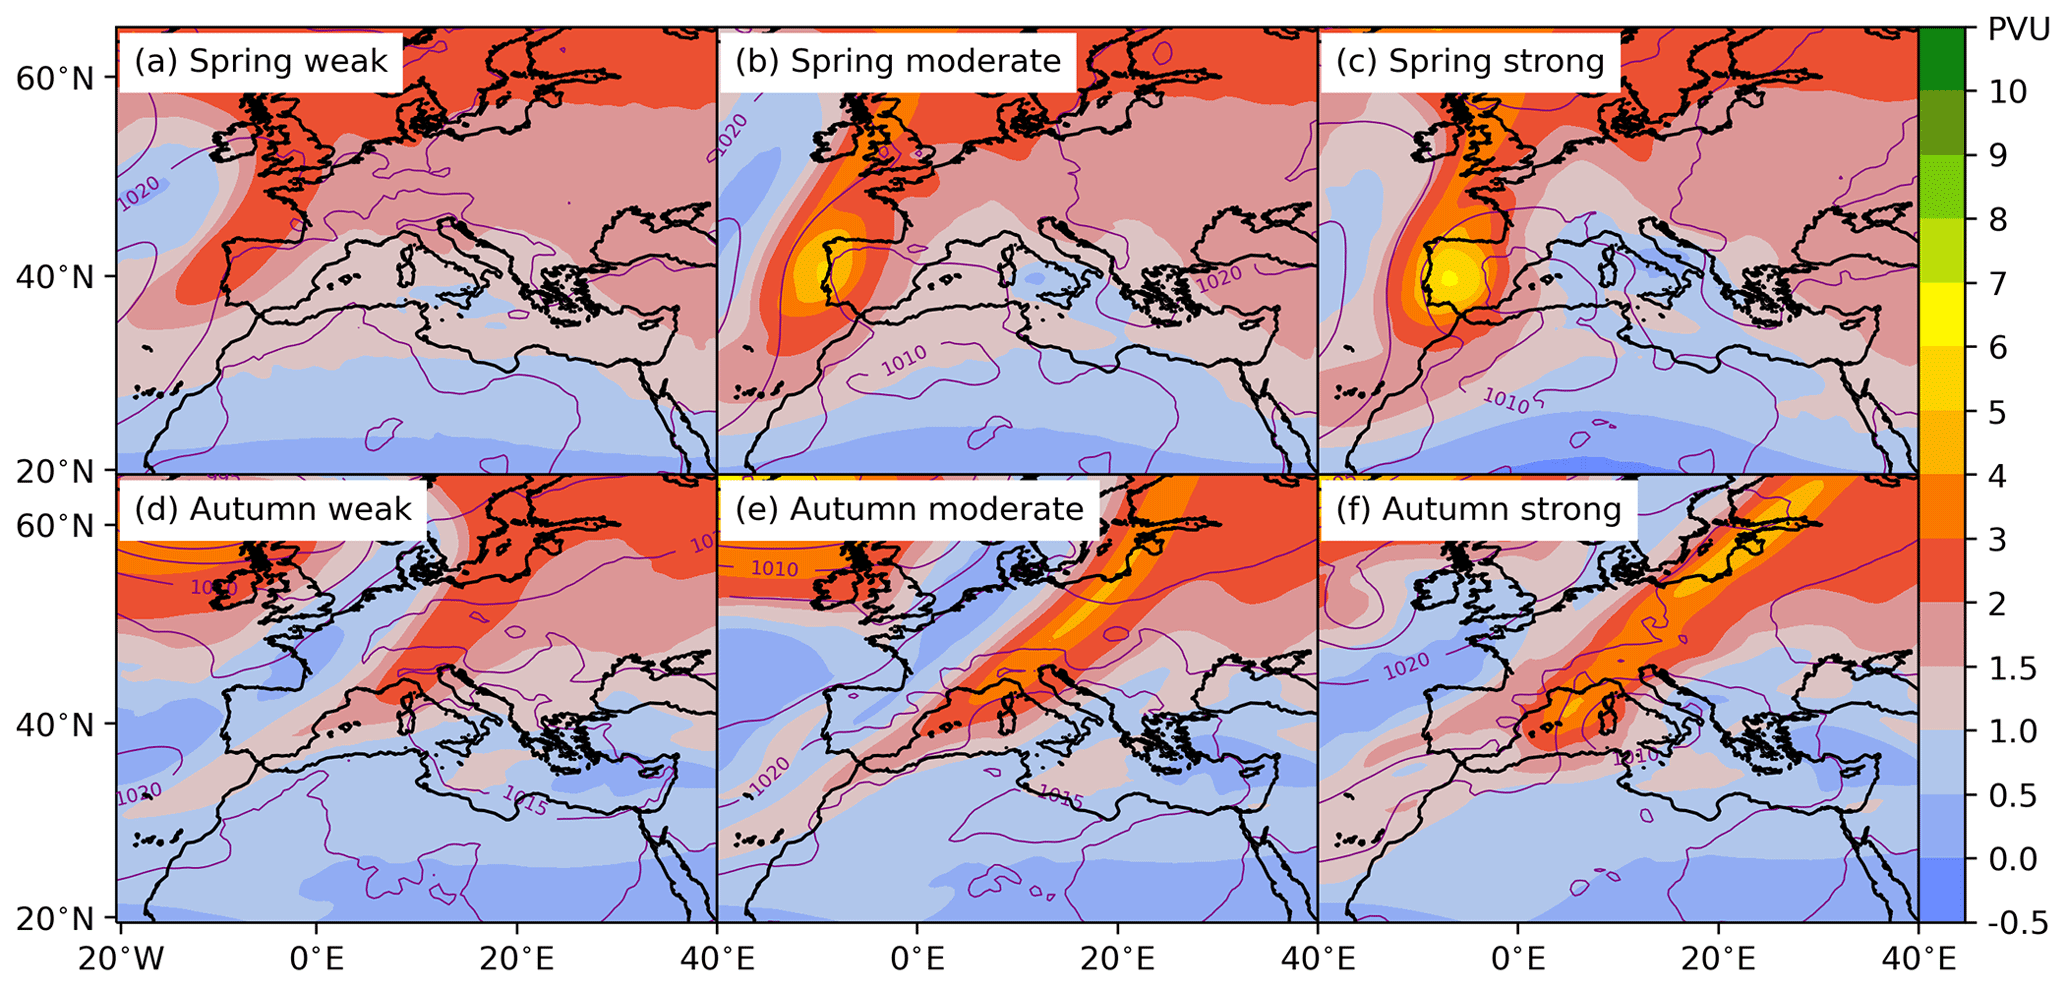
Figure 10Same as Fig. 6 for initial conditions corresponding to the climatological mean in spring (a–c) and autumn (d–f).
Repeating the experiment with the climatological mean state in spring reproduces the upstream–downstream connection with a similar development of the ridge, RWB, and PV streamer (Fig. 9g, h) as in winter (Fig. 3g, h). However, the intrusion of the PV streamer differs as it is located further west, over Portugal and Spain after 4 d (Fig. 9h). It appears that the weaker jet in spring (Fig. 1e) leads to a slower eastward propagation of the flow compared to the more intense jet and thereby faster propagation in winter. The intrusion of the PV streamer into the western Mediterranean triggers cyclogenesis over Algeria (D), from where the cyclone propagates northwards into the Balearic Sea (white star in Fig. 9i) and afterwards into the Adriatic Sea (Fig. 9j).
These results showed that for all spring and autumn experiments with a moderate initial perturbation we find similar RWB patterns and coherent locations of the PV streamers after 4 d of model integration, similar to winter (Fig. 4). The average locations of the PV streamers of the nine ensemble experiments are summarized in Fig. 10 for weak, moderate, and strong initial perturbations. For all perturbation amplitudes, the spring PV streamer is located over Spain and Portugal (Fig. 10a–c), while in autumn it is located over the Gulf of Genoa (Fig. 10d–f) and the Balearic Sea, compared to northern Africa and Algeria in winter (Fig. 6). For spring, Fig. 10 shows that the larger the amplitude of the initial perturbation the more the tip of the PV streamer tends to wrap cyclonically, resulting in strongly positive PV anomalies in the upper troposphere, similar to winter (Fig. 6). In all simulations the stronger baroclinic forcing by higher-amplitude PV streamers provokes earlier cyclogenesis, as indicated by the composite SLP fields (purple contours in Fig. 10c, f).
5.2 Cyclone tracks and intensities of the upstream and downstream cyclones
In this section, we focus on the change in the tracks and intensities of the North Atlantic and Mediterranean cyclones, similar to Sect. 4.2. Note that the variability of the cyclone tracks and their intensities in the experiments in spring and autumn in the nine-experiment ensemble is comparable to the findings presented in Sect. 4.2.
Figure 11 shows the cyclone track frequency (percentage of simulations that share cyclone track points within ±2.5°) of the North Atlantic and Mediterranean cyclones). The similar morphology and location of the polar jet in winter and spring lead to comparable cyclone tracks over the North Atlantic, with cyclogenesis taking place south of Newfoundland both in winter (11a–c) and spring (11d–f). In autumn, the North Atlantic cyclones form over the central North Atlantic (Fig. 11g) and east of Newfoundland (11h, i), as the polar jet is located at higher latitudes (Fig. 1k). Independent of the season, the North Atlantic cyclones propagate more zonally in the experiments with weak initial perturbations (Fig. 11a, d, g) and more meridionally in the simulations with strong initial perturbations (Fig. 11c, f, i). The high track frequencies (dark red) in each panel of Fig. 11 suggest that the cyclone tracks over the North Atlantic are fairly coherent, independent of the initial upstream upper-level PV perturbation. The deepest cyclones over the North Atlantic form in winter and autumn, where the baroclinicity is larger compared to spring. The deepest North Atlantic cyclones in spring reach intensities of about 990 hPa compared to 970 hPa in winter and autumn (not shown).
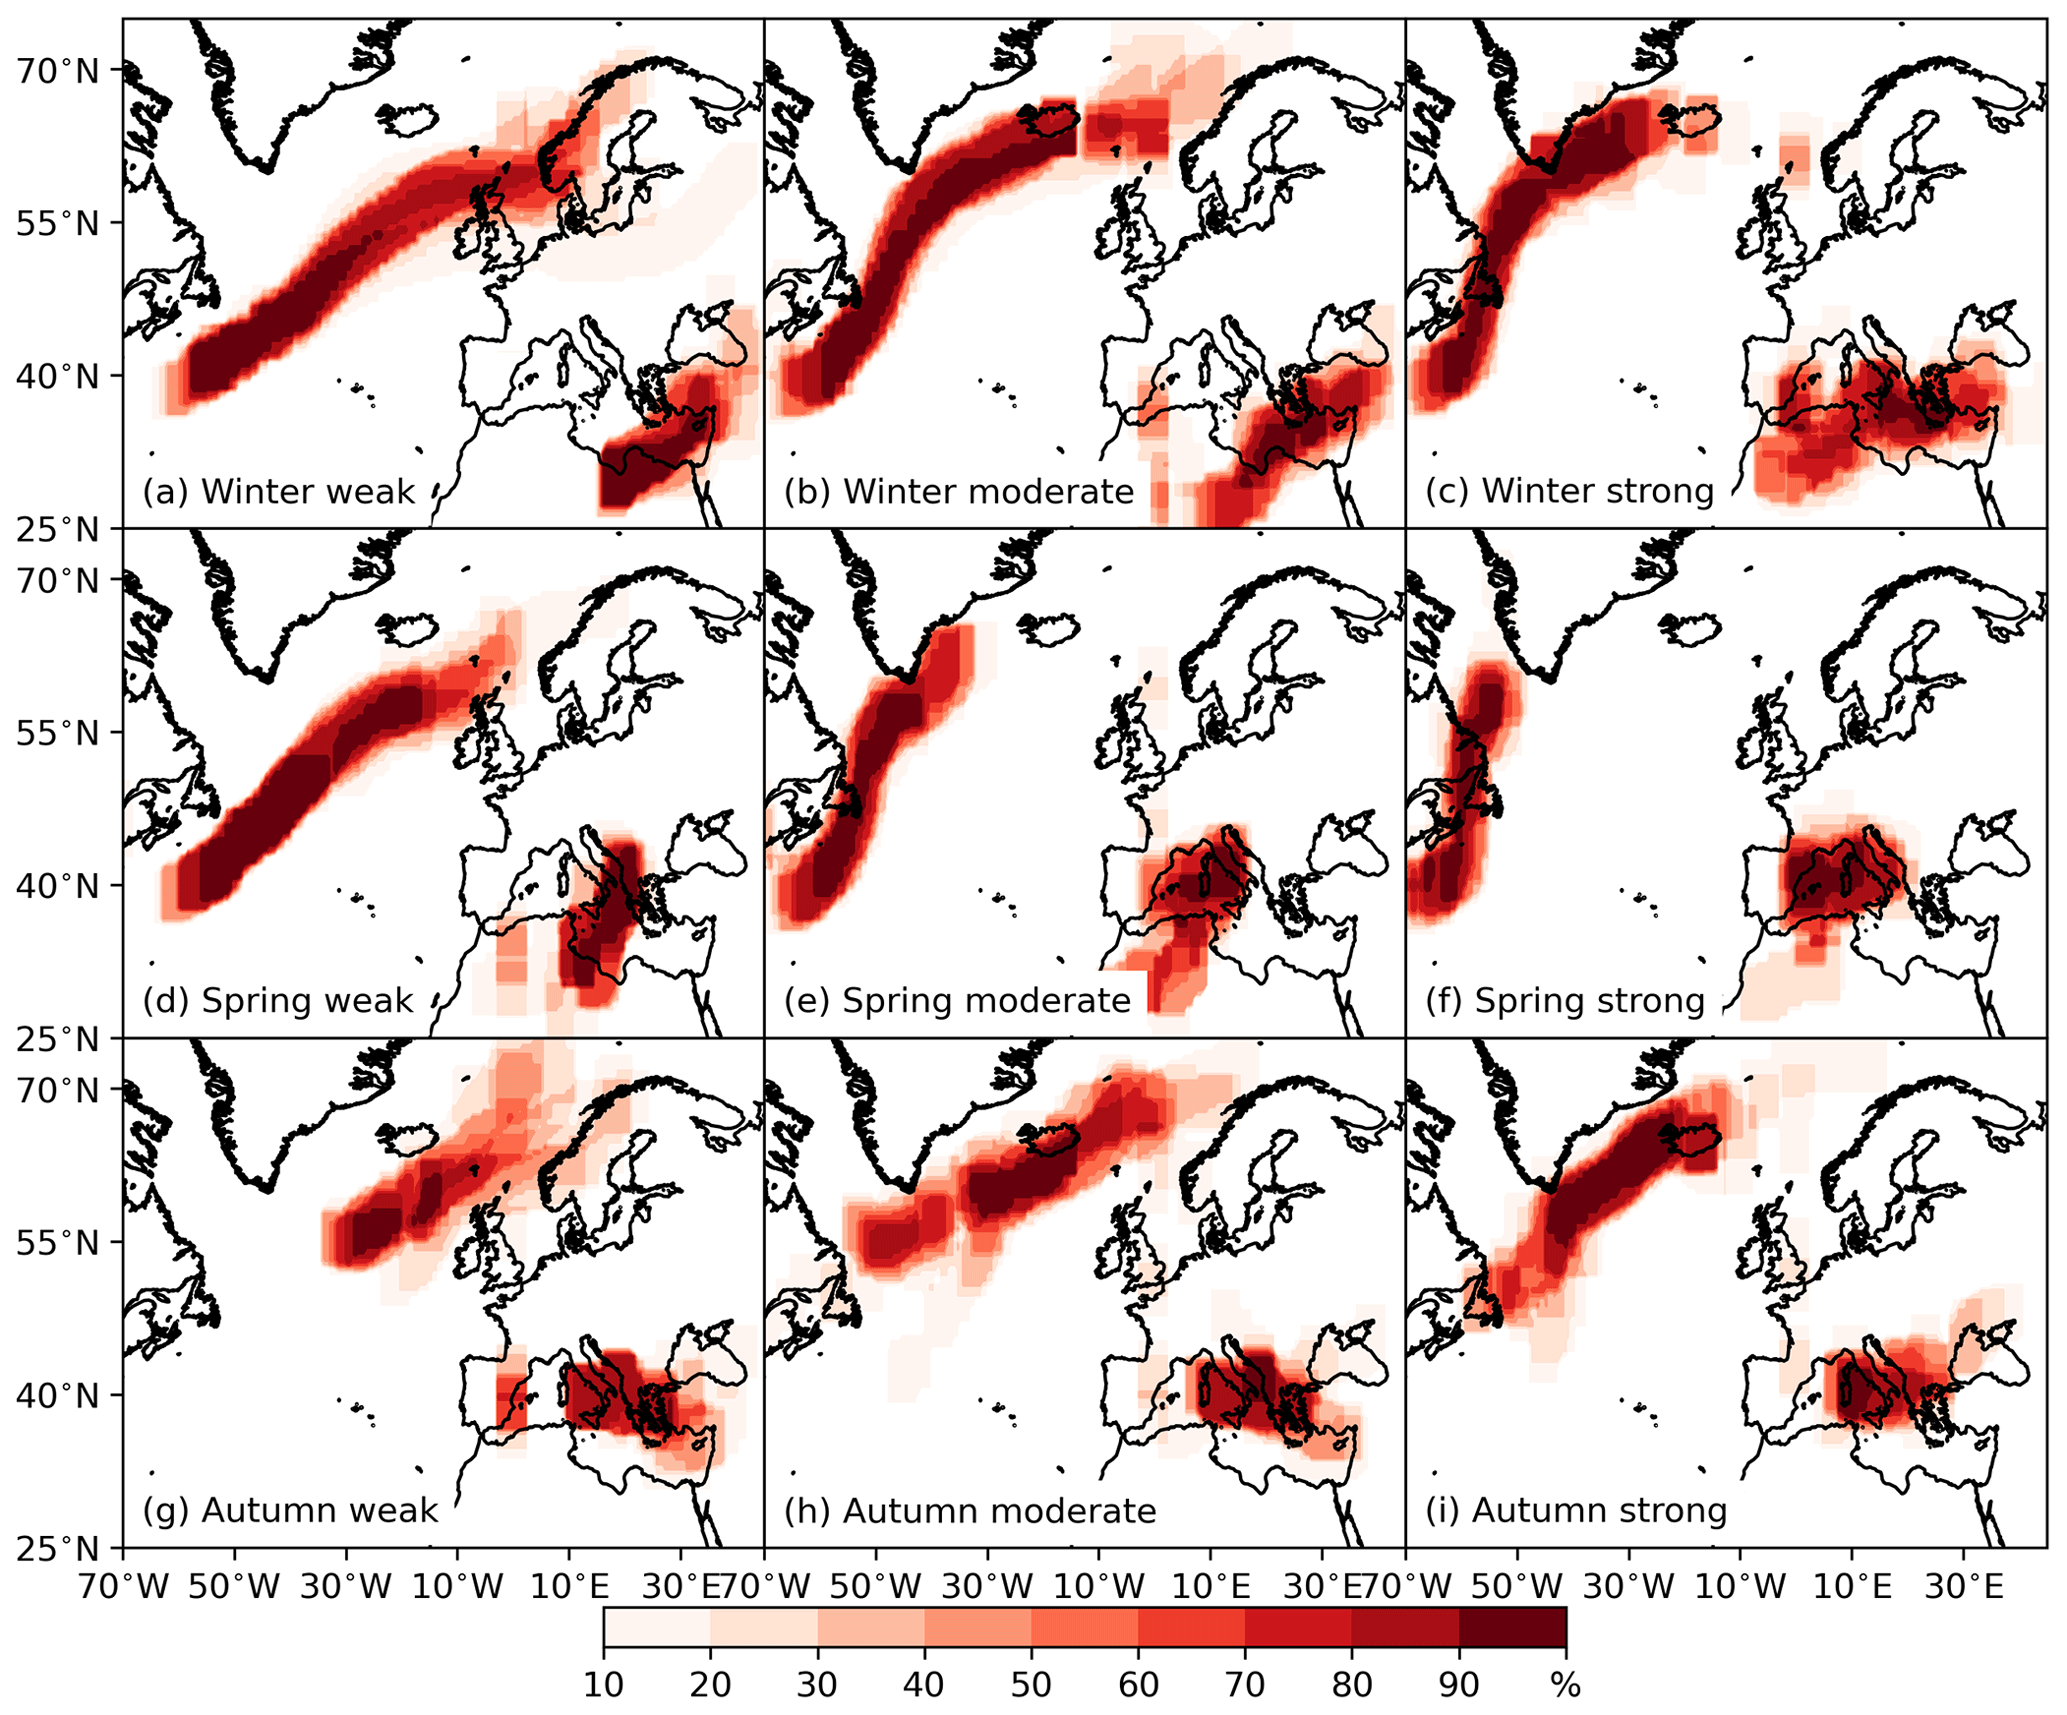
Figure 11Cyclone track density for all winter (a–c), spring (d–f), and autumn (g–i) experiments, initialized with (a, d, g) weak, (b, e, h) moderate, and (c, f, i) strong initial perturbation experiments.
The different location of the PV streamers (Figs. 10 and 6) leads to Mediterranean cyclogenesis in different regions. In winter (Fig. 11a, b, c), cyclogenesis takes place over Libya (Fig. 11a, b) from where the cyclones propagate towards Greece, Cyprus, and Turkey. In spring cyclogenesis takes places over Algeria for the weak and moderate initial perturbations. Afterwards, these cyclones move over to the east and west of Italy, respectively (Fig. 11d, e). In the strong perturbation experiments (Fig. 11f) cyclones form and remain over the western Mediterranean Sea, i.e., the Balearic Sea and Gulf of Genoa. In autumn cyclogenesis takes place in the central Mediterranean and the cyclones propagate eastwards (Fig. 11g, h, i). In all experiments with a strong initial perturbation (Fig. 11c, f, i), the PV streamers have larger PV values (Figs. 6 and 10c, f) and thus provide a stronger baroclinic forcing that triggers Mediterranean cyclogenesis at earlier times (Fig. 12c, f, i), resulting in westward-shifted cyclogenesis and cyclone tracks (Fig. 11c, f, i). The Mediterranean cyclone tracks in winter are consistent in time and space with the tracks of Almazroui et al. (2015) during the extended winter period (their Figs. 3 and 4). The tracks and mature stages of Mediterranean cyclones in spring and autumn are consistent with the tracks from Campins et al. (2006). However, cyclogenesis does not take place in the hotspots in the western Mediterranean, i.e., the Gulf of Genoa, Balearic Sea, and west coast of Spain, found by Bartholy et al. (2009) in either season.
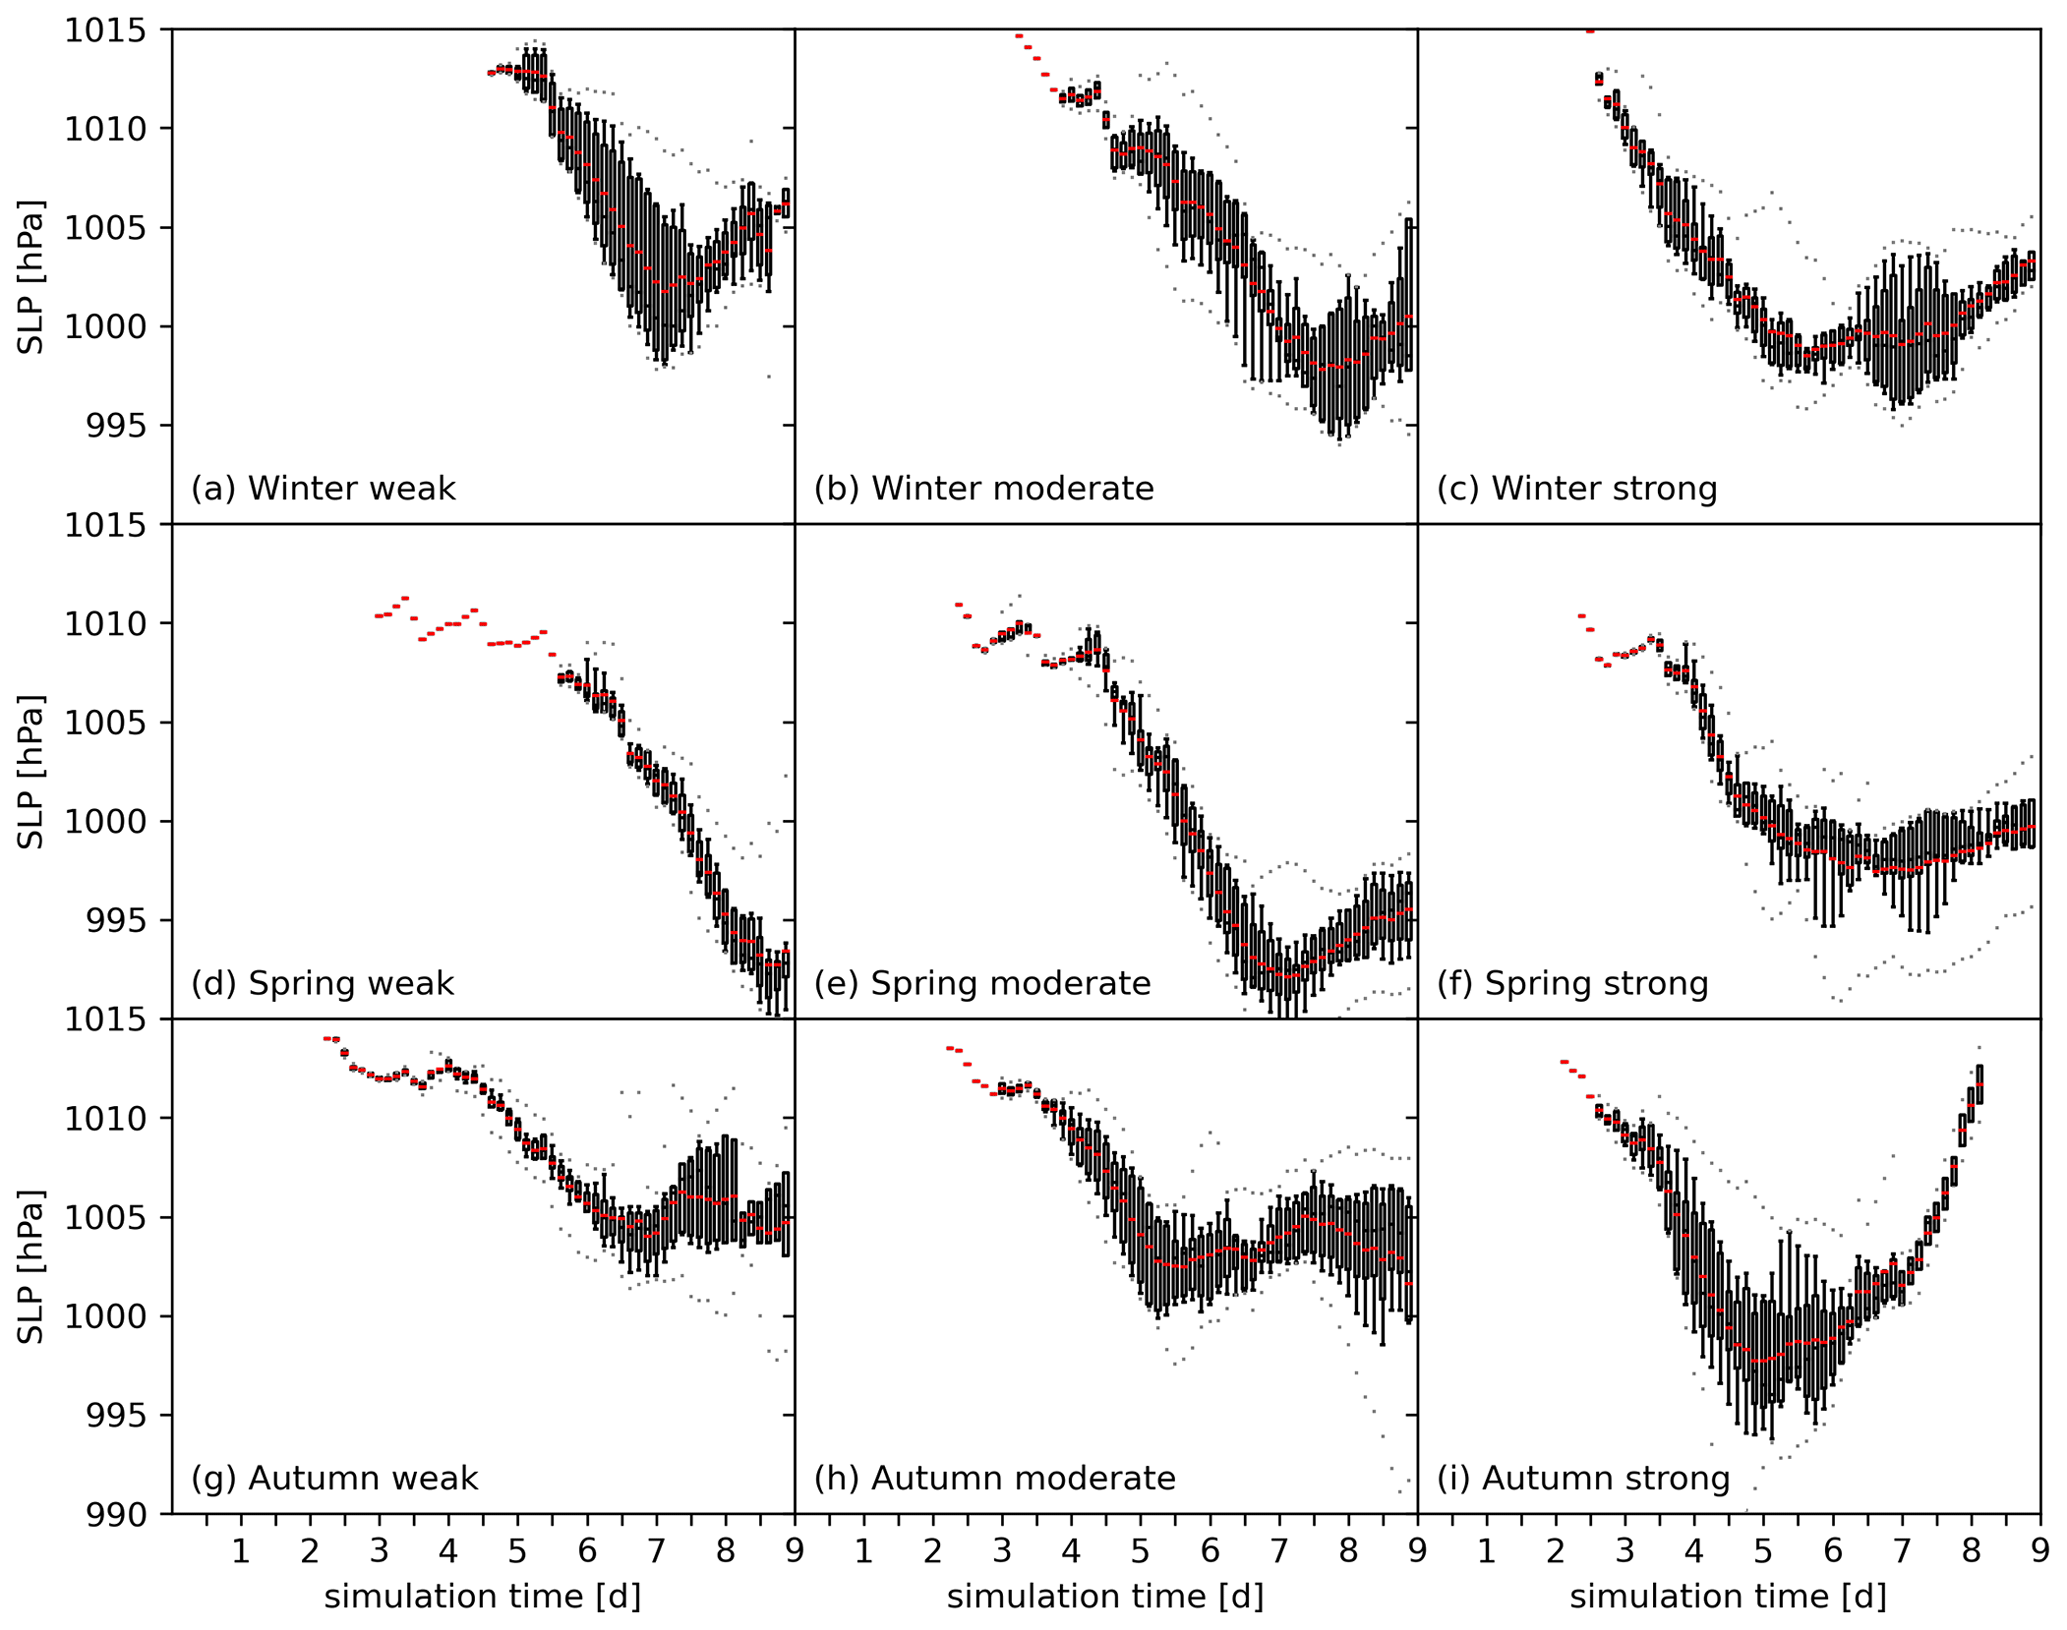
Figure 12SLP evolution of Mediterranean cyclones in all (a–c) winter, (d–f) spring, and (g–i) autumn simulations, perturbed with a (a, d, g) weak upper-level PV anomaly, (b, e, h) moderate-intensity anomaly experiments, and (c, f, i) strong PV anomaly. Boxes mark the interquartile range, whiskers the 10th and 90th percentile, and the red and black line the mean and median, respectively. The gray dots mark outliers of the 10th and 90th percentiles.
The different seasonal mean conditions over the Mediterranean and the different intrusion of the PV streamers not only result in different locations of cyclogenesis but further provide different intensification rates and maximum intensities of Mediterranean cyclones. Figure 12 shows the distribution of SLP along the Mediterranean cyclone tracks. In all experiments, the average SLP (red) shows a stronger decrease with increasing amplitude of the initial perturbation (columns in Fig. 12). Here, higher-amplitude PV streamers provide a stronger baroclinic forcing and thus a stronger intensification of the Mediterranean cyclones. Further, when comparing the weak- to moderate-amplitude experiments (left and central column in Fig. 12) the cyclones reach lower minimum SLP values and thereby a larger maximum intensity in the simulations with a moderate initial perturbation. The intensity of Mediterranean cyclones in the strong perturbation experiments (right column in Fig. 12) is similar in winter (Fig. 12c), lower in spring (Fig. 12f), and stronger in autumn (Fig. 12i) compared to the moderate perturbation experiments. In the experiments in spring with a strong initial perturbation (Fig. 12f), Mediterranean cyclones obtain an average minimum of about 996 hPa that is about 4 hPa higher than for the ones in the experiments with a moderate initial perturbation (about 992 hPa in Fig. 12e). Although the cyclones are weaker in the experiments with a strong initial perturbation in spring, they maintain their maximum intensity for about 3 d, as suggested by the increasing perseverance of the lowest average SLP value (red in Fig. 12f). This might be due to less propagation of the cyclones over the Balearic Sea (Fig. 11f) where they access the moisture provided by the ocean surface and can therefore maintain their intensity by latent heat release in convection.
Compared to winter and autumn, we find the most intense Mediterranean cyclones in spring. Here, a less stable atmospheric state, i.e., weaker vertical temperature gradients, might favor convection and thus result in a stronger deepening of the Mediterranean cyclones. It is interesting to note that in the strong perturbation experiments the high-amplitude PV streamers do not result in the highest intensities of Mediterranean cyclones. Considering the results of Flaounas et al. (2021), who showed that the stronger the upper-level forcing of Mediterranean cyclones the weaker the diabatic forcing, there might be a balancing factor that makes it difficult to attribute a straightforward connection between the amplitude of the PV streamers and the intensity of the cyclones. We have two hypotheses: one is that convection is exceptionally stronger in the strong perturbation experiments compared to the moderate ones and might thus erode the upper-level PV and thereby inhibit its maximum contribution to the intensity of the cyclones. The second hypothesis involves the displacement of the PV streamer by low-PV air that is transported to the upper troposphere, thereby resulting in a less favorable alignment of the PV streamer and the cyclone, yielding a reduced intensity. However, both hypotheses require further investigation, as we could only find some cases that agree with one of the hypotheses but no systematic pattern.
For the first time, we show, using a semi-idealized simulation setup, the direct relationship between upstream North Atlantic and downstream Mediterranean cyclones, which we refer to as the upstream–downstream connection, and investigate its sensitivity to variations in the upstream PV perturbation. Therefore, we introduce a modeling framework using WRF in which we prescribed the climatological winter mean atmospheric state as initial and boundary conditions and perturbed them by a weak, moderate, and strong PV anomaly near the maximum zonal wind speed of the polar jet at 300 hPa. We investigated the flow evolution over the North Atlantic and Mediterranean region, which is primarily affected by the North Atlantic cyclone that forms rapidly after the model initialization due to the presence of the initial perturbation. An upper-tropospheric ridge builds up downstream of the cyclone, which is amplified by the WCBs present in the North Atlantic cyclone (see also the brief discussion of additional model experiments in Appendix A), and thereby provokes RWB, causing a PV streamer to intrude into the Mediterranean and trigger cyclogenesis or enhance the intensity of a Mediterranean cyclone after about 4 d of simulation time.
To investigate the sensitivity of this upstream–downstream connection to variations in the upstream upper-level PV structure over the North Atlantic, we changed both the horizontal position of the initial perturbation around the maximum zonal jet and its amplitude. Our results show that the upstream–downstream connection occurs consistently, regardless of the position and amplitude of the initial perturbation (within the variations considered in this study). Furthermore, we find that the intensity of the synoptic-scale dynamics, i.e., the intensity of the North Atlantic cyclone, the area and amplitude of the ridge, the amplitude of the PV streamer over the Mediterranean, and thereby, to some extent, the intensity of the Mediterranean cyclone, is strongly influenced by and correlated with the amplitude of the initial upper-level PV perturbation. With increasing amplitude of the initial perturbation we find a northward shift of the North Atlantic cyclone track and the RWB but a similar position of cyclogenesis in the Mediterranean in a given season. This suggests that different flavors of RWB and resulting structures of PV streamers can lead to cyclogenesis in similar regions in the Mediterranean.
To study the influence of the differing seasonal large-scale flow configurations on the upstream–downstream connection, we repeated the experiments using as initial conditions the climatological seasonal mean conditions of spring, summer, and autumn. The upstream–downstream connection is not present in the simulations for summer, which is plausibly consistent with the lowest cyclone frequency during that time period (Flaounas et al., 2013, 2015). For spring and autumn, the RWB shows a similar spread as in winter and our findings demonstrate that the seasonal position of the polar jet influences the specific location of the intrusion of PV streamers to the Mediterranean. Thereby, cyclogenesis is provoked in different regions of the Mediterranean (e.g., preferentially in the eastern Mediterranean when using winter initial conditions and further west when using autumn and spring initial conditions), with the corresponding seasonal variability in the tracks and intensity of these cyclones.
The tracks of the North Atlantic cyclone as well as the RWB and the intrusion of the PV streamers are fairly insensitive to horizontal shifts of the initial perturbation by 200 and 400 km. However, this lack of sensitivity of the North Atlantic cyclone tracks and downstream intrusion of the PV streamer to the initial perturbation might be due to our choice of the climatological atmospheric states as initial conditions. For instance, Portmann et al. (2020) showed that the detailed structure of a high-PV anomaly in the lower stratosphere over the Gulf of Saint Lawrence (north to the jet streak) in an ensemble forecast resulted in different shapes and location of PV streamers over the Mediterranean prior to cyclogenesis and consequently different cyclone tracks and intensities. Therefore, the coherency of the downstream PV streamer in our simulations might be the result of weaker gradients at the level of the tropopause (because we consider climatologically smoothed initial conditions), which might be less sensitive to perturbations than sharper gradients in instantaneous fields. However, this choice of initial conditions allows us to establish a clear connection between the simulated North Atlantic and Mediterranean cyclones.
The small shifts of the location of the PV streamers over the Mediterranean due to variations in the horizontal positions of the initial perturbation and the associated changes in their upper-level PV structure affect the intensity of the Mediterranean cyclones. The weaker the amplitude of the PV streamer, the more essential its PV structure becomes for the intensity of the Mediterranean cyclone. This sensitivity of the intensity of Mediterranean cyclones to the upper-level PV structure is consistent with case studies of heavy-precipitation events and Mediterranean cyclones (e.g., Fehlmann and Davies, 1997; Fehlmann and Quadri, 2000; Romero, 2001; Homar and Stensrud, 2004; Argence et al., 2008, 2009; Chaboureau et al., 2012). They showed that even mesoscale variations in the upper-tropospheric PV structure resulted in different intensities (and tracks) of those events. In essence, our results show that the weaker the initial upstream perturbation, the more the intensification and maximum intensity of the North Atlantic and Mediterranean cyclone are affected by changes in the upstream upper-level PV structure.
Nevertheless, factors such as seasonal variations of static stability and Mediterranean SST, and the relative location of cyclones to orography might further contribute to the variability of the intensity and tracks of the Mediterranean cyclones. In particular in the experiments during spring the intensity of the downstream Mediterranean cyclone is rather independent of the intensity of the initial upstream perturbation, in contrast to the experiments in winter and autumn, in which the intensity of the Mediterranean cyclone scales to some extent with the amplitude of the initial upstream perturbation. This suggests that the atmosphere in spring might have reduced static stability and thus favors convection and intensification of the Mediterranean cyclone provoked by the approaching PV streamer but also that the intensity of the Mediterranean cyclones is significantly affected by the temperature and moisture distribution over the Mediterranean. In this regard, although we found that increasing the horizontal resolution to 0.1° does not significantly change the variability of the intensities of the Mediterranean cyclones or their tracks, future studies could address the role of convection in the intensity of the cyclones in experiments with higher resolution and explicitly resolved convection.
In our study, we investigated how North Atlantic cyclones, triggered by an upper-level PV anomaly, affect the propagation of the RW and the RW's impact on downstream cyclone dynamics over the Mediterranean. We specifically analyzed how the intensity and location of North Atlantic cyclones affect this connection. However, our research is restricted to the selected initial conditions that impact this link. Therefore, identifying pairs of North Atlantic and Mediterranean cyclones in ERA5 reanalyses, similar to Raveh-Rubin and Flaounas (2017), could serve to further study the relationship between the position and strength of North Atlantic cyclones and subsequent Mediterranean cyclones. Such an analysis could contribute to research about the correlation between cyclone properties in the North Atlantic and the resulting cyclogenesis in different regions of the Mediterranean, with interesting implications for forecasting Mediterranean cyclones. Additionally, the proposed modeling framework provides a new perspective on future trends of Mediterranean cyclones. Recent studies (e.g., Lionello and Giorgi, 2007; Ulbrich et al., 2009; Cavicchia et al., 2014; Nissen et al., 2014) have examined the impact of future climate projections on the tracks and intensities of Mediterranean cyclones. However, the interpretation of the spread of various model results requires support from a more comprehensive understanding of large-scale forcing of Mediterranean cyclogenesis, specifically the effects of future changes in the upstream–downstream connection. Presently, this aspect is missing from the state of the art and is a critical factor for comprehending the impact of climate change on regional high-impact weather. In particular, such a study would allow the investigation of how climate change impacts the jet stream, i.e., altered intensity and position affect the prevalence of this cyclone connection, in future climates.
To quantify the effects of the WCBs, we performed experiments with a weak, moderate, and strong initial perturbation positioned at the maximum zonal jet at 300 hPa in winter with the microphysics and convection parameterization switched off. In these dry sensitivity experiments the Atlantic cyclone is significantly weaker (≈1000 hPa in Fig. A1a) compared to the experiments with the parameterizations turned on (985 hPa in Fig. 3g). In all experiments we observe the eastward propagation of the RW induced by the initial perturbation. However, in the dry sensitivity experiments, we do not observe RWB and therefore no intrusion of a PV streamer into the Mediterranean comparable to the one in Fig. 3h. Nonetheless, as the RW propagates eastwards, a broad trough-like PV perturbation intrudes into the Mediterranean for the moderate initial perturbation after 4 d (Fig. A1b). The PV values of that system are lower by 2–3 PVU in the sensitivity experiment with the suppressed WCB compared to the PV streamer in the full-physics simulation (compare Fig. A1b to Fig. 3h). The trough-like system does not lead to cyclogenesis in the Mediterranean in the experiments with a weak or moderate initial perturbation.
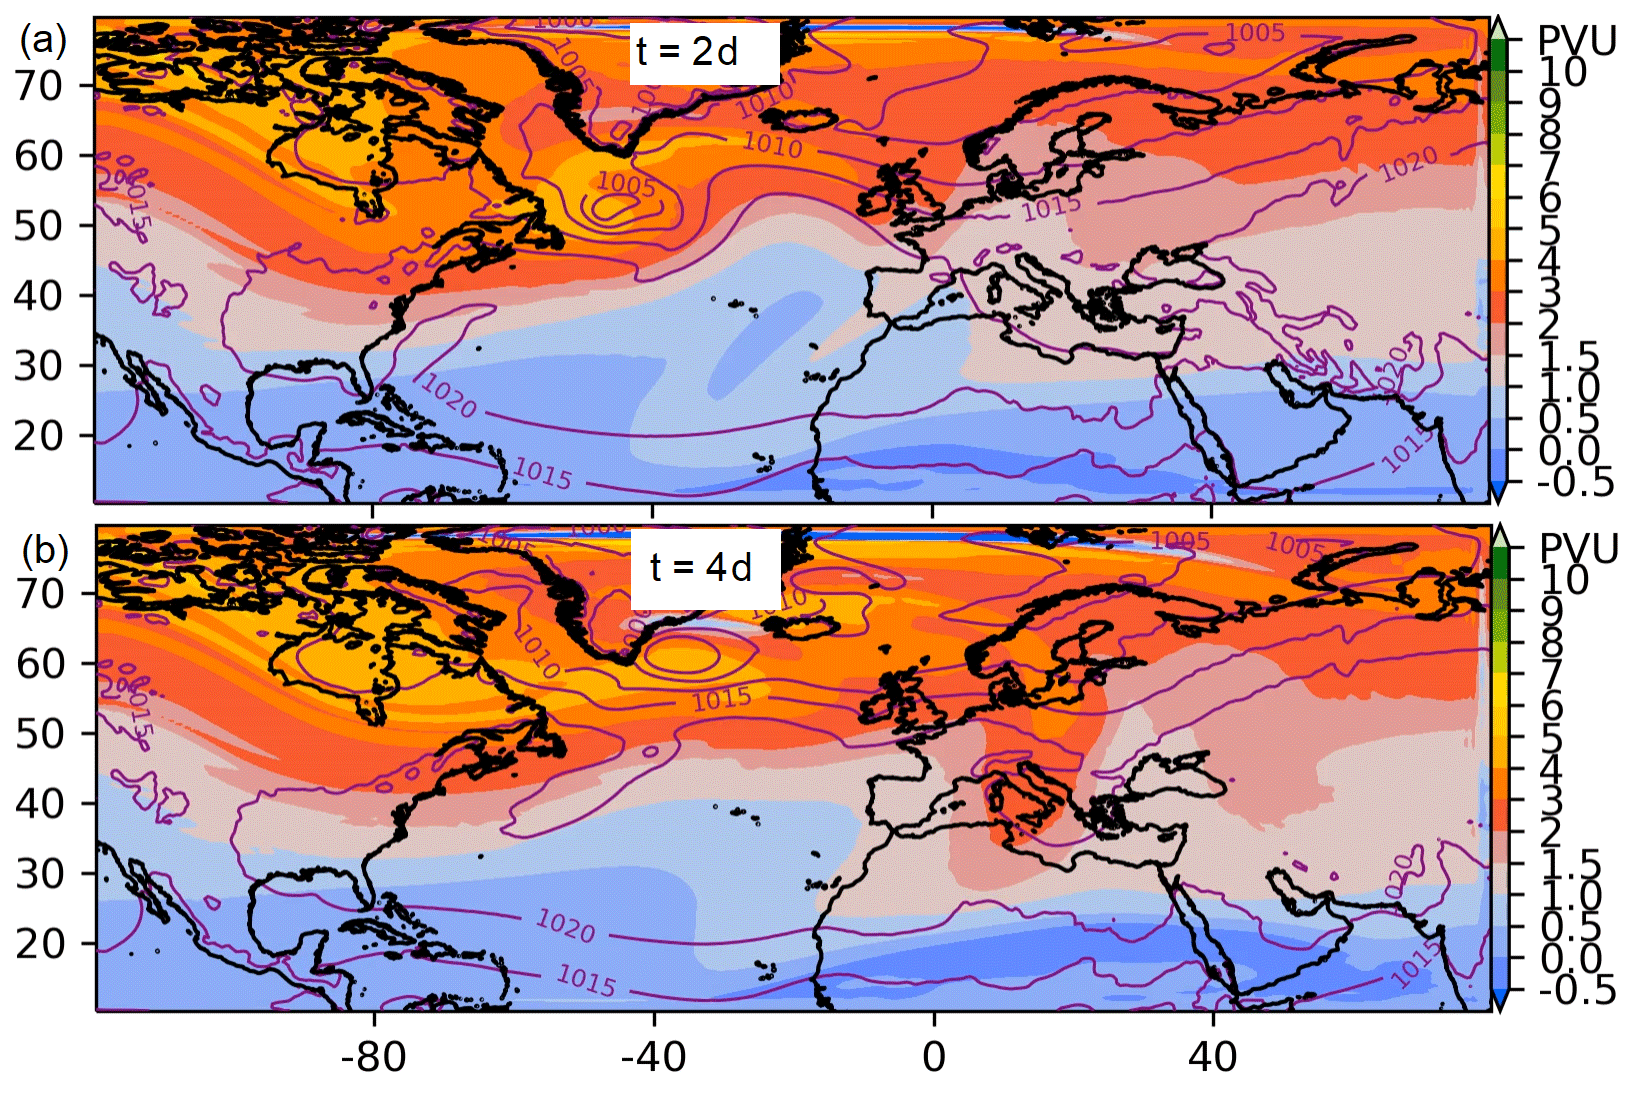
Figure A1Same as Fig. 3g and h for the dry sensitivity experiment (convective and microphysical parameterizations turned off) with a moderate initial perturbation in winter.
In the case of the dry sensitivity experiment with the strong initial perturbation, the cyclone tracking algorithm identifies a Mediterranean cyclone with a central pressure of about 1015 hPa after 3.5 d west of Italy (not shown). However, it is debatable whether this weak cyclone corresponds to an actual well-organized mesoscale vortex. Therefore, from the comparison of the dry sensitivity experiments with the full-physics simulations, we conclude that the diabatic processes within the WCBs of the North Atlantic cyclone are an essential element in provoking RWB for the consequent intrusion of the PV streamer over the Mediterranean and eventually for Mediterranean cyclogenesis, as discussed by several previous studies. When suppressing the WCB (by turning moist parameterizations off), no RWB occurs in our simulations and no (substantial) cyclone forms in the Mediterranean.
The WRF model and ERA5 reanalysis are openly available. Upon request the authors can provide the namelists used to perform the simulations.
AS prepared all analyses and the paper. EF and HW provided scientific advice throughout the project and provided valuable suggestions for improving the paper.
At least one of the (co-)authors is a member of the editorial board of Weather and Climate Dynamics. The peer-review process was guided by an independent editor, and the authors also have no other competing interests to declare.
Publisher's note: Copernicus Publications remains neutral with regard to jurisdictional claims made in the text, published maps, institutional affiliations, or any other geographical representation in this paper. While Copernicus Publications makes every effort to include appropriate place names, the final responsibility lies with the authors.
We thank the anonymous reviewer and Florian Pantillon for the constructive and valuable feedback that helped to further improve the paper. Furthermore, Alexander Scherrmann thanks Lukas Papritz for the help with the simulation setup and Michael Sprenger for guidance with the cyclone tracking. This work is a contribution to the COST Action CA19109 “MedCyclones: European Network for Mediterranean Cyclones in weather and climate”.
This research has been supported by the Schweizerischer Nationalfonds zur Förderung der Wissenschaftlichen Forschung (grant no. 188660).
This paper was edited by Michael Riemer and reviewed by Florian Pantillon and one anonymous referee.
Almazroui, M., Awad, A. M., Islam, M. N., and Al-Khalaf, A.: A climatological study: wet season cyclone tracks in the East Mediterranean region, Theor. Appl. Climatol., 120, 351–365, https://doi.org/10.1007/s00704-014-1178-z, 2015. a, b
Appenzeller, C. and Davies, H. C.: Structure of stratospheric intrusions into the troposphere, Nature, 358, 570–572, https://doi.org/10.1038/358570a0, 1992. a
Argence, S., Lambert, D., Richard, E., Chaboureau, J.-P., and Söhne, N.: Impact of initial condition uncertainties on the predictability of heavy rainfall in the Mediterranean: A case study, Q. J. Roy. Meteor. Soc., 134, 1775–1788, https://doi.org/10.1002/qj.314, 2008. a, b, c
Argence, S., Lambert, D., Richard, E., Pierre Chaboureau, J., Philippe Arbogast, J., and Maynard, K.: Improving the numerical prediction of a cyclone in the Mediterranean by local potential vorticity modifications, Q. J. Roy. Meteor. Soc., 135, 865–879, https://doi.org/10.1002/qj.422, 2009. a, b, c
Barnes, M. A., Ndarana, T., Sprenger, M., and Landman, W. A.: Stratospheric intrusion depth and its effect on surface cyclogenetic forcing: an idealized potential vorticity (PV) inversion experiment, Weather Clim. Dynam., 3, 1291–1309, https://doi.org/10.5194/wcd-3-1291-2022, 2022. a
Bartholy, J., Pongrácz, R., and Pattantyús-Ábrahám, M.: Analyzing the genesis, intensity, and tracks of western Mediterranean cyclones, Theor. Appl. Climatol., 96, 133–144, https://doi.org/10.1007/s00704-008-0082-9, 2009. a, b
Campins, J., Jansà, A., and Genovés, A.: Three-dimensional structure of western Mediterranean cyclones, Int. J. Climatol., 26, 323–343, https://doi.org/10.1002/joc.1275, 2006. a
Campins, J., Genovés, A., Picornell, M., and Jansà, A.: Climatology of Mediterranean cyclones using the ERA-40 dataset, Int. J. Climatol., 31, 1596–1614, https://doi.org/10.1002/joc.2183, 2011. a
Carrió, D., Homar, V., Jansa, A., Romero, R., and Picornell, M.: Tropicalization process of the 7 November 2014 Mediterranean cyclone: Numerical sensitivity study, Atmos. Res., 197, 300–312, https://doi.org/10.1016/j.atmosres.2017.07.018, 2017. a, b
Cavicchia, L., von Storch, H., and Gualdi, S.: Mediterranean tropical-like cyclones in present and future climate, J. Climate, 27, 7493–7501, https://doi.org/10.1175/JCLI-D-14-00339.1, 2014. a
Chaboureau, J.-P., Pantillon, F., Lambert, D., Richard, E., and Claud, C.: Tropical transition of a Mediterranean storm by jet crossing, Q. J. Roy. Meteor. Soc., 138, 596–611, https://doi.org/10.1002/qj.960, 2012. a, b, c
Claud, C., Alhammoud, B., Funatsu, B. M., and Chaboureau, J.-P.: Mediterranean hurricanes: large-scale environment and convective and precipitating areas from satellite microwave observations, Nat. Hazards Earth Syst. Sci., 10, 2199–2213, https://doi.org/10.5194/nhess-10-2199-2010, 2010. a, b, c
Dudhia, J.: A multi-layer soil temperature model for MM5, in: Preprints, The Sixth PSU/NCAR mesoscale model users’ workshop, 22–24, Boulder, 1996. a
Emanuel, K.: Genesis and maintenance of “Mediterranean hurricanes”, Adv. Geosci., 2, 217–220, https://doi.org/10.5194/adgeo-2-217-2005, 2005. a
Fehlmann, R. and Davies, H. C.: Misforecasts of Synoptic Systems: Diagnosis via PV Retrodiction, Mon. Weather Rev., 125, 2247–2264, https://doi.org/10.1175/1520-0493(1997)125<2247:MOSSDV>2.0.CO;2, 1997. a
Fehlmann, R. and Quadri, C.: Predictability issues of heavy Alpine south-side precipitation, Meteorol. Atmospheric Phys., 72, 223–231, https://doi.org/10.1007/s007030050017, 2000. a
Fita, L., Romero, R., and Ramis, C.: Intercomparison of intense cyclogenesis events over the Mediterranean basin based on baroclinic and diabatic influences, Adv. Geosci., 7, 333–342, https://doi.org/10.5194/adgeo-7-333-2006, 2006. a
Flaounas, E., Drobinski, P., and Bastin, S.: Dynamical downscaling of IPSL-CM5 CMIP5 historical simulations over the Mediterranean: benefits on the representation of regional surface winds and cyclogenesis, Clim. Dynam., 40, 2497–2513, https://doi.org/10.1007/s00382-012-1606-7, 2013. a, b, c
Flaounas, E., Kotroni, V., Lagouvardos, K., and Flaounas, I.: CycloTRACK (v1.0) – tracking winter extratropical cyclones based on relative vorticity: sensitivity to data filtering and other relevant parameters, Geosci. Model Dev., 7, 1841–1853, https://doi.org/10.5194/gmd-7-1841-2014, 2014. a
Flaounas, E., Raveh-Rubin, S., Wernli, H., Drobinski, P., and Bastin, S.: The dynamical structure of intense Mediterranean cyclones, Clim. Dynam., 44, 2411–2427, https://doi.org/10.1007/s00382-014-2330-2, 2015. a, b
Flaounas, E., Gray, S. L., and Teubler, F.: A process-based anatomy of Mediterranean cyclones: from baroclinic lows to tropical-like systems, Weather Clim. Dynam., 2, 255–279, https://doi.org/10.5194/wcd-2-255-2021, 2021. a, b
Flaounas, E., Davolio, S., Raveh-Rubin, S., Pantillon, F., Miglietta, M. M., Gaertner, M. A., Hatzaki, M., Homar, V., Khodayar, S., Korres, G., Kotroni, V., Kushta, J., Reale, M., and Ricard, D.: Mediterranean cyclones: current knowledge and open questions on dynamics, prediction, climatology and impacts, Weather Clim. Dynam., 3, 173–208, https://doi.org/10.5194/wcd-3-173-2022, 2022. a
Flocas, H.: Diagnostics of cyclogenesis over the Aegean Sea using potential vorticity inversion, Meteorol. Atmospheric Phys., 73, 25–33, https://doi.org/10.1007/s007030050061, 2000. a, b
Grams, C. M. and Archambault, H. M.: The key role of diabatic outflow in amplifying the midlatitude flow: A representative case study of weather systems surrounding western North Pacific extratropical transition, Mon. Weather Rev., 144, 3847–3869, https://doi.org/10.1175/MWR-D-15-0419.1, 2016. a
Grams, C. M., Wernli, H., Böttcher, M., Čampa, J., Corsmeier, U., Jones, S. C., Keller, J. H., Lenz, C.-J., and Wiegand, L.: The key role of diabatic processes in modifying the upper-tropospheric wave guide: a North Atlantic case-study, Q. J. Roy. Meteor. Soc., 137, 2174–2193, https://doi.org/10.1002/qj.891, 2011. a
Hagay, O. and Brenner, S.: Sensitivity of Simulations of Extreme Mediterranean Storms to the Specification of Sea Surface Temperature: Comparison of Cases of a Tropical-Like Cyclone and Explosive Cyclogenesis, Atmosphere, 12, 921, https://doi.org/10.3390/atmos12070921, 2021. a
Hersbach, H., Bell, B., Berrisford, P., Hirahara, S., Horányi, A., Muñoz-Sabater, J., Nicolas, J., Peubey, C., Radu, R., Schepers, D., Simmons, A., Soci, C., Abdalla, S., Abellan, X., Balsamo, G., Bechtold, P., Biavati, G., Bidlot, J., Bonavita, M., De Chiara, G., Dahlgren, P., Dee, D., Diamantakis, M., Dragani, R., Flemming, J., Forbes, R., Fuentes, M., Geer, A., Haimberger, L., Healy, S., Hogan, R. J., Hólm, E., Janisková, M., Keeley, S., Laloyaux, P., Lopez, P., Lupu, C., Radnoti, G., de Rosnay, P., Rozum, I., Vamborg, F., Villaume, S., and Thépaut, J.-N.: The ERA5 global reanalysis, Q. J. Roy. Meteor. Soc., 146, 1999–2049, https://doi.org/10.1002/qj.3803, 2020. a, b
Homar, V. and Stensrud, D. J.: Sensitivities of an intense Mediterranean cyclone: Analysis and validation, Q. J. Roy. Meteor. Soc., 130, 2519–2540, https://doi.org/10.1256/qj.03.85, 2004. a, b, c
Hong, S.-Y., Dudhia, J., and Chen, S.-H.: A revised approach to ice microphysical processes for the bulk parameterization of clouds and precipitation, Mon. Weather Rev., 132, 103–120, https://doi.org/10.1175/1520-0493(2004)132<0103:ARATIM>2.0.CO;2, 2004. a
Hong, S.-Y., Noh, Y., and Dudhia, J.: A new vertical diffusion package with an explicit treatment of entrainment processes, Mon. Weather Rev., 134, 2318–2341, https://doi.org/10.1175/MWR3199.1, 2006. a
Horvath, K., Fita, L., Romero, R., and Ivancan-Picek, B.: A numerical study of the first phase of a deep Mediterranean cyclone: Cyclogenesis in the lee of the Atlas Mountains, Meteorolo. Z., 15, 133–146, https://doi.org/10.1127/0941-2948/2006/0113, 2006. a
Iacono, M. J., Delamere, J. S., Mlawer, E. J., Shephard, M. W., Clough, S. A., and Collins, W. D.: Radiative forcing by long-lived greenhouse gases: Calculations with the AER radiative transfer models, J. Geophys. Res., 113, https://doi.org/10.1029/2008JD009944, 2008. a
Jiménez, P. A., Dudhia, J., González-Rouco, J. F., Navarro, J., Montávez, J. P., and García-Bustamante, E.: A revised scheme for the WRF surface layer formulation, Mon. Weather Rev., 140, 898–918, https://doi.org/10.1175/MWR-D-11-00056.1, 2012. a
Kain, J. S.: The Kain–Fritsch convective parameterization: an update, J. Appl. Meteorol., 43, 170–181, https://doi.org/10.1175/1520-0450(2004)043<0170:TKCPAU>2.0.CO;2, 2004. a
Lionello, P. and Giorgi, F.: Winter precipitation and cyclones in the Mediterranean region: future climate scenarios in a regional simulation, Adv. Geosci., 12, 153–158, https://doi.org/10.5194/adgeo-12-153-2007, 2007. a
Lionello, P., Trigo, I. F., Gil, V., Liberato, M. L., Nissen, K. M., Pinto, J. G., Raible, C. C., Reale, M., Tanzarella, A., Trigo, R. M., et al.: Objective climatology of cyclones in the Mediterranean region: a consensus view among methods with different system identification and tracking criteria, Tellus A, 68, 29391, https://doi.org/10.3402/tellusa.v68.29391, 2016. a
Madonna, E., Wernli, H., Joos, H., and Martius, O.: Warm conveyor belts in the ERA-Interim dataset (1979–2010). Part I: Climatology and potential vorticity evolution, J. Climate, 27, 3–26, https://doi.org/10.1175/JCLI-D-12-00720.1, 2014. a
Massacand, A. C., Wernli, H., and Davies, H. C.: Heavy precipitation on the Alpine southside: An upper-level precursor, Geophys. Res. Lett., 25, 1435–1438, https://doi.org/10.1029/98GL50869, 1998. a, b
Miglietta, M. M. and Rotunno, R.: Development mechanisms for Mediterranean tropical-like cyclones (medicanes), Q. J. Roy. Meteor. Soc., 145, 1444–1460, https://doi.org/10.1002/qj.3503, 2019. a
Neu, U., Akperov, M. G., Bellenbaum, N., Benestad, R., Blender, R., Caballero, R., Cocozza, A., Dacre, H. F., Feng, Y., Fraedrich, K., Grieger, J., Gulev, S., Hanley, J., Hewson, T., Inatsu, M., Keay, K., Kew, S. F., Kindem, I., Leckebusch, G. C., Liberato, M. L. R., Lionello, P., Mokhov, I. I., Pinto, J. G., Raible, C. C., Reale, M., Rudeva, I., Schuster, M., Simmonds, I., Sinclair, M., Sprenger, M., Tilinina, N. D., Trigo, I. F., Ulbrich, S., Ulbrich, U., Wang, X. L., and Wernli, H.: IMILAST: A Community Effort to Intercompare Extratropical Cyclone Detection and Tracking Algorithms, B. Am. Meteorol. Soc., 94, 529–547, https://doi.org/10.1175/BAMS-D-11-00154.1, 2013. a
Nissen, K. M., Leckebusch, G. C., Pinto, J. G., and Ulbrich, U.: Mediterranean cyclones and windstorms in a changing climate, Reg. Environ. Change, 14, 1873–1890, https://doi.org/10.1007/s10113-012-0400-8, 2014. a
Pantillon, F., Chaboureau, J.-P., Lac, C., and Mascart, P.: On the role of a Rossby wave train during the extratropical transition of Hurricane Helene (2006), Q. J. Roy. Meteor. Soc., 139, 370–386, https://doi.org/10.1002/qj.1974, 2013. a, b
Portmann, R., González-Alemán, J. J., Sprenger, M., and Wernli, H.: How an uncertain short-wave perturbation on the North Atlantic wave guide affects the forecast of an intense Mediterranean cyclone (Medicane Zorbas), Weather Clim. Dynam., 1, 597–615, https://doi.org/10.5194/wcd-1-597-2020, 2020. a, b, c, d, e
Raveh-Rubin, S. and Flaounas, E.: A dynamical link between deep Atlantic extratropical cyclones and intense Mediterranean cyclones, Atmos. Sci. Lett., 18, 215–221, https://doi.org/10.1002/asl.745, 2017. a, b, c, d, e
Romero, R.: Sensitivity of a heavy-rain-producing western Mediterranean cyclone to embedded potential-vorticity anomalies, Q. J. Roy. Meteor. Soc., 127, 2559–2597, https://doi.org/10.1002/qj.49712757805, 2001. a, b, c
Schär, C. and Wernli, H.: Structure and evolution of an isolated semi-geostrophic cyclone, Q. J. Roy. Meteor. Soc., 119, 57–90, https://doi.org/10.1002/qj.49711950904, 1993. a
Schemm, S., Wernli, H., and Papritz, L.: Warm conveyor belts in idealized moist baroclinic wave simulations, J. Atmos. Sci., 70, 627–652, https://doi.org/10.1175/JAS-D-12-0147.1, 2013. a, b
Scherrmann, A., Wernli, H., and Flaounas, E.: Origin of low-tropospheric potential vorticity in Mediterranean cyclones, Weather Clim. Dynam., 4, 157–173, https://doi.org/10.5194/wcd-4-157-2023, 2023. a
Skamarock, W. C., Klemp, J. B., Dudhia, J., Gill, D. O., Liu, Z., Berner, J., Wang, W., Powers, J. G., Duda, M. G., Barker, D. M., and Huang, X.-Y.: A description of the advanced research WRF model version 4.3, National Center for Atmospheric Research: Boulder, CO, USA, 145, 165, https://doi.org/10.5065/1dfh-6p97, 2021. a
Sprenger, M.: Numerical piecewise potential vorticity inversion: A user guide for real-case experiments, ETH Zurich, 87, 2007. a
Sprenger, M., Fragkoulidis, G., Binder, H., Croci-Maspoli, M., Graf, P., Grams, C. M., Knippertz, P., Madonna, E., Schemm, S., Škerlak, B., and Wernli, H.: Global Climatologies of Eulerian and Lagrangian Flow Features based on ERA-Interim, B. Am. Meteorol. Soc., 98, 1739–1748, https://doi.org/10.1175/BAMS-D-15-00299.1, 2017. a, b
Thorncroft, C., Hoskins, B., and McIntyre, M.: Two paradigms of baroclinic-wave life-cycle behaviour, Q. J. Roy. Meteor. Soc., 119, 17–55, https://doi.org/10.1002/qj.49711950903, 1993. a
Trigo, I. F., Davies, T. D., and Bigg, G. R.: Objective climatology of cyclones in the Mediterranean region, J. Climate, 12, 1685–1696, https://doi.org/10.1175/1520-0442(1999)012<1685:OCOCIT>2.0.CO;2, 1999. a
Tripoli, G., Medaglia, C., Dietrich, S., Mugnai, A., Panegrossi, G., Pinori, S., and Smith, E.: The 9–10 November 2001 Algerian flood: A numerical study, B. Am. Meteorol. Soc., 86, 1229–1235, https://doi.org/10.1175/BAMS-86-9-1229, 2005. a
Ulbrich, U., Leckebusch, G., and Pinto, J. G.: Extra-tropical cyclones in the present and future climate: a review, Theor. Appl. Climatol., 96, 117–131, https://doi.org/10.1007/s00704-008-0083-8, 2009. a, b
Varlas, G., Pytharoulis, I., Steeneveld, G.-J., Katsafados, P., and Papadopoulos, A.: Investigating the impact of sea surface temperature on the development of the Mediterranean tropical-like cyclone “Ianos” in 2020, Atmos. Res., 291, 106827, https://doi.org/10.1016/j.atmosres.2023.106827, 2023. a
Wernli, H. and Schwierz, C.: Surface cyclones in the ERA-40 dataset (1958–2001). Part I: Novel identification method and global climatology, J. Atmos. Sci., 63, 2486–2507, https://doi.org/10.1175/JAS3766.1, 2006. a, b
Wernli, H., A. Shapiro, M., and Schmidli, J.: Upstream development in idealized baroclinic wave experiments, Tellus A, 51, 574–587, https://doi.org/10.1034/j.1600-0870.1999.00003.x, 1999. a, b
Wiegand, L. and Knippertz, P.: Equatorward breaking Rossby waves over the North Atlantic and Mediterranean region in the ECMWF operational Ensemble Prediction System, Q. J. Roy. Meteor. Soc., 140, 58–71, https://doi.org/10.1002/qj.2112, 2014. a
- Abstract
- Introduction
- Numerical experiments and methods
- The upstream–downstream connection of cyclones
- Sensitivity of the upstream–downstream connection to variations of the upstream conditions
- Seasonal variability of the upstream–downstream connection
- Discussion and conclusion
- Appendix A: The role of the warm conveyor belt in the upstream–downstream connection
- Data availability
- Author contributions
- Competing interests
- Disclaimer
- Acknowledgements
- Financial support
- Review statement
- References