the Creative Commons Attribution 4.0 License.
the Creative Commons Attribution 4.0 License.
 | 03 Apr 2024
Analysing 23 years of warm-season derechos in France: a climatology and investigation of synoptic and environmental changes
Davide Faranda
Derechos are severe convective storms known for producing widespread damaging winds. While less frequent than in the United States of America (USA), derechos also occur in Europe. The notable European event on 18 August 2022 exhibited gusts exceeding 200 km h−1, spanning 1500 km in 12 h. This study presents a first climatology of warm-season derechos in France, identifying 38 events between 2000 and 2022. Typically associated with a southwesterly mid-level circulation, warm-season derechos in France generally initiate in the afternoon and exhibit peak activity in July, with comparable frequencies in June and August. Predominantly impacting the northeast of France, these events exhibit a maximum observed frequency of 0.65 events per year, on average, within a 200 km by 200 km square region. These characteristics are similar to those observed in Germany, with notable differences seen in the USA, where frequencies can attain significantly higher values. The study also examines synoptic and environmental changes linked with analogues of the 500 hPa geopotential height patterns associated with past warm-season derechos, comparing analogues from a relatively distant past (1950–1980) with a recent period (1992–2022). For most events, a notable increase in convective available potential energy (CAPE) is observed, aligning with trends identified in previous studies for southern Europe. However, no consistent change in 0–6 km vertical wind shear is observed in the recent period. These environmental shifts align with higher near-surface temperatures, altered mid-level atmospheric flow patterns and often increased rainfall. The role of anthropogenic climate change in these changes remains uncertain, given potential influences of natural variability factors such as the El Niño–Southern Oscillation (ENSO) or the Atlantic Multidecadal Oscillation (AMO).
- Article
(4461 KB) - Full-text XML
-
Supplement
(1849 KB) - BibTeX
- EndNote


During the night of 17 to 18 August 2022, a mesoscale convective system (MCS) originated over the northern Balearic Islands, initially forming as a line of thunderstorms that gradually curved into a bow echo. This system swiftly propagated to the northeast, impacting Corsica in the early morning before reaching central and northern Italy, Slovenia, Austria, and Czechia within a span of 12 h. Notably, the convective system was sustained by the exceptionally warm sea-surface temperatures (SSTs) of the Mediterranean Sea, leading to intense downbursts and surface wind gusts reaching up to 225 km h−1 in Corsica. The severity and extensive destruction caused by this extraordinary storm caught the general public by surprise. The event, resulting in 12 casualties, over 100 injuries and disruptions to electric power lines (Wikipedia, 2023), prompted immediate inquiries into its uniqueness, comparisons with similar past events and considerations of the potential role of anthropogenic climate change in contributing to such occurrences. Specifically, the warming of the Mediterranean Sea, characterized by anomalies exceeding +3 °C during the summer compared to seasonal values for the period 1990–2020, has been identified as a significant contributor to the development and intensity of the MCS on 18 August 2022 (González-Alemán et al., 2023). This warming likely enhanced convective instability by supplying substantial moisture and heat to the lower levels of the atmosphere.
This storm aligns with the definition of a “derecho” as described by Hinrichs (1888), a term denoting convective storm episodes marked by prolonged and widespread occurrences of damaging downbursts. More specifically, a derecho is defined as “any family of downburst clusters generated by an extratropical mesoscale convective system,” in accordance with Johns and Hirt (1987). The associated radar signatures generally exhibit predominantly linear characteristics, often incorporating bow echo(es) indicative of regions with the highest wind speeds (Fujita, 1978). Derechos are commonly classified into two types: “serial” and “progressive” (Johns and Hirt, 1987; Corfidi et al., 2016; Squitieri et al., 2023a). A “progressive” derecho is characterized by a rapidly propagating MCS featuring a long-lived bow echo pattern nearly perpendicular to the mean wind direction. Typically occurring in the warm season (May–August), this type of derecho propagates faster than the mean wind and is associated with high convective instability. Key features include a rear-inflow jet and mesoscale vortices. In contrast, a “serial” derecho typically showcases an extensive squall line with a line echo wave pattern (LEWP) (Nolen, 1959) embedded within a cold front. This type tends to occur in the cold season (September–April) in an environment characterized by strong forcing and low instability. Convective systems of this type generally propagate more slowly than progressive derechos.
Various criteria have been employed to delineate a sequence of downburst clusters as a derecho, using observational data such as wind gust reports and weather radar data. For instance, Johns and Hirt (1987) proposed the following criteria: (i) a concentrated area of convective wind gust with a speed greater than or equal to 26 m s−1 or – when wind-speed measurements are not available – the presence of damage following downbursts. The major axis length must be at least 400 km. (ii) The convective gusts must have an identifiable spatio-temporal progression. (iii) At least three gusts greater than or equal to 33 m s−1 must be measured or assessed on the basis of damage within the area covered by the episode, and these reports must be separated by at least 64 km from each other. (iv) There must be no more than 3 h between two consecutive severe wind gust reports. (v) The associated convective system must have temporal and spatial continuity in surface pressure or wind field. (vi) All the wind gust reports must emanate from the same MCS based on radar data. Nevertheless, subsequent studies have frequently adjusted or relaxed the criteria outlined above, particularly the most restrictive criterion (iii). It was argued by Bentley and Mote (1998) that there is no explicit reference to wind threshold criteria in the common definition of derechos as a family of downburst clusters by Fujita and Wakimoto (1981). Notably, Coniglio and Stensrud (2004), Bentley and Mote (1998), and Gatzen et al. (2020) have opted not to retain this criterion. Instead, they assigned intensity to events based on the number of wind gust reports at different thresholds of wind speed. Corfidi et al. (2016) proposed a more stringent definition of derechos, focusing exclusively on the most severe, long-lived progressive or warm-season derechos. This distinction arises from the different dynamics and environments associated with progressive and serial derechos. Serial derechos are associated with “external” synoptic-scale forcing for ascent, while progressive derechos are characterized by more “internally driven” dynamics. The persistence of progressive derechos is attributed to the presence of mesoscale features such as a rear-inflow jet, a well-defined surface cold pool and the swift downstream propagation of new updrafts along the gust front of the cold pool (Corfidi, 2003; Schumacher and Rasmussen, 2020). The refined definition proposed by Corfidi et al. (2016) stipulates that the damage swath “must be nearly continuous, at least 100 km wide along most of its extent, and 650 km long”. Additionally, this definition requires clear evidence of radar features, including bow echoes, mesoscale vortices and rear-inflow jets. For a comprehensive overview of research on derechos, including the varied criteria used in past studies, the reader is referred to the recent review by Squitieri et al. (2023a, b).
Derechos are primarily documented phenomena in the USA, particularly in the Midwest and Southern Plains, as noted by various studies (Hinrichs, 1888; Johns and Hirt, 1985, 1987; Bentley and Mote, 1998; Evans and Doswell, 2001; Coniglio and Stensrud, 2004; Ashley and Mote, 2005; Guastini and Bosart, 2016). In contrast, the scientific exploration of derechos in Europe is more recent, with events being officially recognized and reported as such since the 2000s (Gatzen, 2004; Punkka et al., 2006; López, 2007; Púčik et al., 2011; Hamid, 2012; Celiński-Mysław and Matuszko, 2014; Mathias et al., 2019). Despite this, comprehensive national climatologies are scarce in Europe (Gatzen et al., 2020; Celiński-Mysław et al., 2020), and research on derechos in France is notably limited. While individual cases have been reported in scientific articles (López, 2007; Hamid, 2012; Gatzen et al., 2020) and in weather reports from Keraunos, the French observatory of severe convective storms (website: https://www.keraunos.org/, last access: 19 March 2024), there is currently no systematic study of derecho climatology in the country. Recognizing this gap in research motivates our current study, where we aim to provide a first analysis of derecho occurrences in France and contribute to the broader understanding of these phenomena in the European context.
Unravelling the nuanced impact of anthropogenic climate change on severe convective events poses another formidable challenge (National Academies of Sciences, Engineering and Medicine, 2016), particularly when it involves discerning trends in convective hazards like convective winds (Kunkel et al., 2013). Because of their complexity involving a large range of time and spatial scales and various physical phenomena such as wind gust, precipitation and lightning, MCSs are not well resolved in global climate models, while they can be better simulated in convection-permitting, regional climate models although at a high computational cost (Meredith et al., 2015; Gensini and Mote, 2015; Gensini et al., 2023; Coppola et al., 2020; Ban et al., 2021; Stocchi et al., 2022). It is therefore difficult to find clear climate change statements about severe convective storms, including derechos. Due to these modelling difficulties, even the IPCC reports do not contain many strong statements about the influence of anthropogenic climate change on severe convective events. Indeed, in the AR6 report (IPCC, 2023), the authors find that there is high confidence that “a warmer climate intensifies very wet and very dry weather events and seasons, but the location and frequency of these events depend on projected changes in regional atmospheric circulation”. Particularly for Europe, there is moderate confidence that at 1.5 °C of warming, “heavy precipitation and associated flooding are projected to intensify and be more frequent”, as well as low confidence that “large-scale conditions conducive to severe convection will tend to increase in the future climate”.
Numerous studies have delved into exploring potential changes in the frequency and intensity of MCS (Schumacher and Rasmussen, 2020). Additionally, investigations into environmental factors influencing convection, such as convective available potential energy (CAPE) and vertical wind shear (Púčik et al., 2017; Taszarek et al., 2021a, b; Glazer et al., 2021) or convective hazards (Battaglioli et al., 2023; Gensini and Mote, 2015; Gensini et al., 2023; Pichelli et al., 2021), have been conducted in the context of global warming. Although the findings exhibit significant regional variations, there is a broad consensus indicating an increase in rainfall rate and volume associated with MCS under global warming conditions (Schumacher and Rasmussen, 2020). Within the northern midlatitudes, studies indicate a rise in CAPE over southern Europe and the northern Great Plains of the USA, accompanied by a marginal decrease in 0–6 km wind shear over southern Europe and a slight increase in the Great Plains (Taszarek et al., 2021a, b). However, these regions also witness an increase in convective inhibition (CIN) and a decline in relative humidity (Taszarek et al., 2021a; Pilguj et al., 2022), leading to an overall reduction in the fraction of environments conducive to storm initiation. This complex interplay makes definitive statements about the frequency of severe thunderstorms challenging, as highlighted by previous research (Kunkel et al., 2013; Taszarek et al., 2021a; Pilguj et al., 2022). The absence of unequivocal conclusions regarding the intensity and frequency of severe convective storms, including derechos, under anthropogenic climate change motivates the analysis presented in this study.
This paper aims to create a first climatology of warm-season derechos in France, analysing their characteristics in comparison with other countries as its primary objective. The secondary goal is to detect potential alterations in synoptic conditions and environmental convective parameters, including CAPE and vertical wind shear, linked to past warm-season derecho-producing MCSs in France. The study also seeks to evaluate the contributions of climate change and natural variability to these observed changes. In Sect. 2, we delve into the methodological aspects of our work and introduce the datasets employed. Specifically, Sect. 2.1 outlines the methodology and observational datasets used for detecting past derecho events over France, along with associated limitations. Additionally, Sect. 2.2 introduces the methodology for detecting and attributing changes in synoptic conditions, accompanied by the presentation of the reanalysis and observational datasets. Moving on to Sect. 3, we present the outcomes related to the detected derechos, including their frequency, intensity and geographical distribution in comparison with established climatologies in Germany and the USA (Sect. 3.1). Furthermore, we discuss the detailed attribution for the case of the 18 August 2022 derecho (Sect. 3.2) and provide an overall attribution for all events with interpretations (Sect. 3.3). Finally, conclusions and future perspectives are presented in Sect. 4.
2.1 Derecho detection
Following the methodology employed by Gatzen et al. (2020) in establishing a derecho climatology for Germany from 1997 to 2014, we utilize daily weather station data from Météo-France (automatic stations of type 0 and 1). Our initial step involves selecting warm-season days (May, June, July, August, September) when more than five stations report a severe daily wind gust, defined as a measured wind gust speed exceeding 25 m s−1. Following this, we eliminate days without a concentrated area of wind gust reports by applying the criterion that the area must cover at least 400 km along its major axis. Additionally, we stipulate that wind gust reports should be within 200 km of each other and that there should be no more than a 3 h interval between successive reports, aligning with the methodology employed by Coniglio and Stensrud (2004). To circumvent the limited geographical coverage of wind reports in France, we use severe wind gust reports from three additional sources: (i) the Integrated Surface Database (ISD) (Smith et al., 2011) from the National Oceanic and Atmospheric Administration (NOAA) (accessible from https://www.ncei.noaa.gov/products/land-based-station/integrated-surface-database, last access: 19 March 2024), composed of worldwide surface weather observations including synoptic observations; (ii) weather station data from the German Weather Service (DWD), accessible at https://cdc.dwd.de/portal (last access: 19 March 2024); and (iii) the European Severe Weather Database (ESWD) (accessible at https://eswd.eu/, last access: 19 March 2024), created by the European Severe Storm Laboratory (ESSL) (Dotzek et al., 2009) whenever the associated MCS track extends into other countries. The ESWD provides detailed and quality-controlled reports from severe convective events in Europe including severe wind gusts, heavy rain, hail, tornadoes and damaging lightning from a variety of sources. For our study, we only retained reports at minimum level quality QC1 (“report confirmed by reliable source”). These reports originate from various channels, including weather stations providing specific wind gust speeds and wind gust damage reports, such as those involving fallen trees. However, the latter type of report lacks precise wind gust speed information, impeding the accurate estimation of derecho intensity. In cases where reports are insufficient, we also consider days on which derechos have been reported over France by Gatzen et al. (2020).
Then we use the Python FLEXible object TRacKeR (PyFLEXTRKR) algorithm developed by Feng et al. (2023a) to systematically detect and track potential associated MCSs for each previously selected day. This algorithm has notably been used to build a global MCS database (Feng et al., 2021) using satellite imagery data, namely brightness temperature and precipitation. It has also been used to track MCSs in convection-permitting simulations (Feng et al., 2023b) or convective cells from radar data (Feng et al., 2022). To detect and track MCSs, the algorithm uses brightness temperature thresholds to identify cold cloud systems (Tb<241 K) with an additional size constraint of an area greater than 4×10⁴ km2. Precipitation data are used in addition to enable a more robust identification of MCSs by requiring that an intense precipitation feature (criteria include rain rate greater than 3 mm h−1 and major axis length greater than 100 km) is embedded within the cold cloud system. These criteria must be met for at least 4 h to define a cold cloud system as an MCS. We specifically use the Global Precipitation Measurement (GPM) Integrated Multi-satellitE Retrievals (IMERG) V06 precipitation database (Huffman et al., 2019) and the NOAA NCEP/CPC Globally Merged IR (MERGIR) brightness temperature (Tb) database (Janowiak et al., 2017), as in Feng et al. (2021). Both datasets are available from the year 2000 and cover the area between 60° S and 60° N at a time resolution of 30 min. The MERGIR database has a finer resolution (4 km) than IMERG (10 km or equivalently, 0.1°), so we regrid Tb data to a resolution of 0.1° using the xESMF Python package (Zhuang et al., 2023) prior to applying the tracking algorithm. If PyFLEXTRKR detects an MCS for a specific selected date, we conduct a visual comparison, aligning the detected MCS structure, as illustrated on brightness temperature and precipitation rate maps, with the severe wind gust reports in both time and space. For illustration, a snapshot of Tb and precipitation rate, highlighting the contour of the detected MCS using PyFLEXTRKR, is provided in the Supplement (Fig. S1). Subsequently, we retain only those days when the reports exhibit a discernible match with an MCS along a minimum distance of 400 km. Additionally, we assign to each detected derecho an intensity following the criteria set by Gatzen et al. (2020) and Coniglio and Stensrud (2004). Specifically, an event is deemed high intensity if there are at least three reports with wind speed ≥38 m s−1, moderate intensity if the last condition is not met and at least three reports show wind speed ≥33 m s−1, and low intensity if the event does not meet the previous criteria. Similar to the methodology of Gatzen et al. (2020), the trajectories, path lengths and duration of all derechos are determined by analysing the direction and length of the geodesic connecting the geographical locations of the first and last wind gust reports and the time elapsed between these two reports. While this method offers a coarse estimate of the actual path of the MCS, it does not enable a precise evaluation of the direction of MCS propagation. In particular it does not consider the potential curvature in the track. Limitations in the available severe wind gust reports also constrain the accuracy of duration and path length estimations for derechos, introducing potential biases due to underreporting in certain regions.
In contrast to the methodologies employed by Coniglio and Stensrud (2004) and Gatzen et al. (2020), who utilized radar data for convective system identification, we opted for satellite data due to their greater accessibility (from, e.g. https://disc.gsfc.nasa.gov/, last access: 19 March 2024) and their large spatial coverage. Radar data, commonly managed and hosted by national weather services, typically restrict coverage to national geographical domains, and their accessibility is often limited. Radar data would be crucial for studying the specific shape of MCSs (e.g. detecting bow echoes), ensuring wind gusts originate from the same convective system and precisely aligning the timestamps of wind gust reports with radar echo positions. Consequently, our methodology may not effectively distinguish between a swath of wind gusts produced by a well-organized bow echo and a more disorganized convective cluster. Given our focus on warm-season derechos, the use of radar data becomes less critical compared to cold-season derechos, where distinguishing damaging winds related to downbursts from concurrent synoptic-scale winds is challenging (van den Broeke et al., 2005; Gatzen et al., 2020). Coniglio and Stensrud (2004) demonstrated that the MCSs associated with warm-season derechos can be identified quite well even without radar data. Notably, as there has been some debate regarding whether the specific structure of the convective system producing a swath of severe wind gusts should be considered in defining a derecho-producing MCS (Bentley and Mote, 1998; Johns and Evans, 2000; Bentley et al., 2000; Coniglio and Stensrud, 2004; Corfidi et al., 2016), we assert that our approach is reasonable for establishing a first climatology of these severe convective windstorms in France.
2.2 Detection of changes in synoptic patterns
To understand how anthropogenic climate change may have influenced the synoptic patterns associated with severe convective events like derechos, we consider analogues of patterns of atmospheric circulation. While a direct one-to-one correspondence between synoptic patterns and derecho occurrences may not exist, these patterns commonly represent recurring large-scale conditions conducive to the development of severe convective events (Bentley et al., 2000; van Delden, 2001; Coniglio et al., 2004; Lewis and Gray, 2010; Markowski and Richardson, 2010; Yang et al., 2017; Mohr et al., 2019; Piper et al., 2019; Schumacher and Rasmussen, 2020). We use the geopotential height field at 500 hPa (Z500) as a proxy for large-scale atmospheric flow in a similar way as Burke and Schultz (2004), Coniglio et al. (2004), and Gatzen et al. (2020). To isolate the dynamical changes in the atmospheric circulation patterns, the average thermodynamic contribution of global warming is removed by subtracting its spatial mean from each daily geopotential height field. Indeed, this mean value exhibits a trend associated with anthropogenic climate change (Christidis and Stott, 2015). This approach allows us to focus specifically on changes in the Z500 gradient, a parameter intricately tied to mid-level atmospheric flow. Although synoptic patterns predominantly influence the environmental factors driving diverse extreme events, such as the formation of derecho-producing MCSs, it is crucial to acknowledge the significant role of sub-synoptic-scale environments in convective storm development. This becomes particularly pertinent in the context of convective initiation and the subsequent release of CAPE (Markowski and Richardson, 2010).
More specifically, for each event, we look for Z500 analogues in both a relative distant past period (1950–1980) and a more recent past period (1992–2022). Our assumption in dividing the historical past in two periods is that the most distant period serves as a hypothetical world where the Earth's climate was only weakly affected by greenhouse gas emissions and that 31 years is a sufficient period to account for natural variability in atmospheric motions. This time period is also recommended by the World Meteorological Organization (WMO) for the computation of climate normals (Arguez and Vose, 2011). Nevertheless, it is crucial to account for long-term natural variability, as induced by phenomena like the Atlantic Multidecadal Oscillation (AMO) or the El Niño–Southern Oscillation (ENSO). If we can exclude a direct impact from such low-frequency variability by examining the indices related to these phenomena alongside the analogues between the two periods under investigation, any changes in the analogues can be attributed to the signal of climate change. While conventional statistical techniques, rooted in extreme value theory, focus on analysing univariate meteorological variables without tracing them back to the underlying atmospheric processes, our approach ensures that comparisons of variable maps are conditioned on the associated atmospheric circulation. Additionally, the method enables the identification of unprecedented weather events resulting from previously unobserved atmospheric circulations, posing a statistical challenge in attributing the event's likelihood to climate change. The attribution methodology described in Faranda et al. (2022) has already been applied and validated for sea-level pressure maps linked to various extreme events in 2021. In this study, we extend its application for the first time to synoptic patterns related to severe convective events, with a particular focus on derechos.
In our examination, we analyse changes in temperature, precipitation and wind speed, along with proxies and environmental parameters commonly utilized as predictors for convection associated with these analogues within the historical period. Specifically, we focus on the most unstable convective available potential energy (CAPE) and 0–6 km vertical wind shear, calculated as the wind vector difference between 500 hPa and 10 m, referred to as deep-layer shear (DLS). CAPE serves as a proxy for buoyant instability, intricately linked to the intensity of convective updrafts (Holton and Hakim, 2013), while vertical wind shear fosters the organization of convection (Markowski and Richardson, 2010; Schumacher and Rasmussen, 2020). Numerous studies have demonstrated an augmented probability of severe convection with increasing levels of instability and vertical wind shear, frequently employing CAPE and DLS as metrics (Brooks et al., 2003; Trapp et al., 2007; Brooks, 2013; Púčik et al., 2015; Taszarek et al., 2020b; Battaglioli et al., 2023). We use data from ERA5 (Hersbach et al., 2020), the latest climate reanalysis produced by the European Centre for Medium-Range Weather Forecasts (ECMWF) as part of the implementation of the EU-funded Copernicus Climate Change Service (C3S). It provides hourly data on atmospheric, land surface and sea state parameters from 1950 to the present. The ERA5 data are available from the C3S Climate Data Store on regular latitude–longitude grids at a horizontal resolution of 0.25° × 0.25°. We opted for ERA5 data in this study primarily due to the dataset's remarkable consistency over an extensive time span (73 years), facilitating the detection of changes in large-scale dynamics. The global nature of ERA5 also mitigates issues related to combining datasets from diverse national weather services, ensuring a uniform spatial and temporal coverage. Nevertheless, it is important to acknowledge certain caveats arising from the long-term advancements in observation instruments, including satellites. These advancements may impact the uniformity of the quality of the dataset and have the potential to introduce spurious trends (Thorne and Vose, 2010; Hersbach et al., 2020). In addition, parameterizations can bring errors in the estimation of convective parameters such as CAPE and modelled precipitation and wind gusts (Taszarek et al., 2021c). Despite these considerations, ERA5 continues to be regarded as one of the best reanalyses currently available.
For each period, we examine all daily averaged Z500 maps and select the 37 best analogues, i.e. the maps minimizing the Euclidean distance to the event map itself. The number of 37 corresponds approximately to the smallest 8 ‰ Euclidean distances in each subset of our data. We tested the extraction of 25 to 50 analogous maps without finding qualitatively important differences in our results. For the factual period, as is customary in attribution studies, the date of the event considered is discarded. In addition, we prohibit the search for analogues within a 1-week window centred on the date of the event. We also restrict the search for analogues to the season in which each event occurs (in this case the warm season comprising May, June, July, August and September). This allows us to identify possible changes in seasonality – defined as the relative frequency of analogue occurrence per calendar month – between the counterfactual and factual periods while avoiding confounding the different physical processes that may contribute to a given class of extreme events during warm and cold seasons. We then examine composites of the analogues in each period for daily averaged 2 m temperature and wind speed, daily cumulative precipitation, daily maximum CAPE, and DLS all computed from ERA5 hourly fields. For comparison, we also consider daily mean 2 m temperature and cumulative rainfall from the E-OBS observational dataset v27.0 (Cornes et al., 2018) (available from https://www.ecad.eu/download/ensembles/download.php, last access: 19 March 2024) which interpolates measurements from land weather stations across Europe on a regular grid at 0.1° resolution. To determine significant changes between the two periods, we adopt a bootstrap procedure which consists of pooling the dates from the two periods together, randomly extracting 37 dates from this pool 1000 times, creating the corresponding difference maps and marking as significant only grid point changes above 2 standard deviations of the bootstrap sample.
To account for the possible influence of low-frequency modes of natural variability in explaining the differences between the two periods, we also consider the possible roles of ENSO, the AMO, the Pacific Decadal Oscillation (PDO), the North Atlantic Oscillation (NAO), and the East Atlantic (EA) and Scandinavian (SCAND) North Atlantic patterns. Piper et al. (2019) found that convection-favouring environments are strongly influenced by teleconnection patterns such as NAO, EA and SCAND and SST in Europe. NAO, EA and to a lesser extent ENSO have also been found to have a significant role in modulating extreme precipitation events in Europe by Nobre et al. (2017). The role of AMO has been discussed, e.g. in Zampieri et al. (2017), who found an influence on pressure, precipitation and temperature patterns. Wei et al. (2021) found an influence of PDO on northwestern Europe extreme rainfall. Similarly, Casanueva et al. (2014) found a significant role of SCAND in autumn and spring in extreme precipitation in Europe. In practice, we examine the association of the analogues with the aforementioned factors of natural variability (ENSO, AMO, PDO, NAO, EA, SCAND). We perform this analysis using monthly indices from NOAA ERSSTv5 data that are retrieved from the Royal Netherlands Meteorological Institute (KNMI) Climate Explorer (accessible at https://climexp.knmi.nl/selectindex.cgi, last access: 19 March 2024). In particular, the ENSO index is computed in region 3.4 as defined by Huang et al. (2017), and the AMO index is calculated as described in Trenberth et al. (2015). To assess the possible association of these different indices with circulation changes between factual and counterfactual periods, we compare the distributions of each index for the analogues of the two periods, and we evaluate any significant changes between factual and counterfactual distributions by performing a two-tailed Cramér–von Mises test (Anderson, 1962) at the 0.05 significance level. If the p value is smaller than 0.05, the null hypothesis (H=0) that both samples are from the same distribution is rejected, and the influence of internal variability cannot be excluded (H=1). On the other hand, if the null hypothesis of equal distributions is not rejected, the observed changes in the analogues are attributed to anthropogenic climate change. All relevant figure panels display the p value (pval) and the H test results in the title.
We further investigate the seasonality of analogues within the warm season by quantifying the number of analogues in each month, aiming to identify potential shifts in circulation towards earlier or later months in the season. Such shifts could carry significant thermodynamic implications; for instance, if a circulation pattern associated with substantial positive temperature anomalies in early spring becomes more prevalent later in the season when average temperatures are considerably higher. To evaluate the significance of potential changes in analogue seasonality between the two periods, we apply the same statistical test that we use to compare the distributions of indices of natural variability. Additionally, we extend our analysis by computing the best 8 ‰ analogues for the entire Z500 dataset from 1950 to 2022 without segregating it into factual and counterfactual periods. Subsequently, we estimate a linear trend for this global quantile, recognizing that the total number of analogues in all decades for this specific quantile is 91. To evaluate the significance of these trends, we calculate the confidence interval using the Wald method (Stein and Wald, 1947).
Following Faranda et al. (2022), we define certain quantities that support our interpretation of analogue-based assignment. All these quantities can then be compared between the counterfactual and factual periods.
-
Analogue quality Q. Q is the average Euclidean distance of a given day from its 37 closest analogues. To evaluate the quality of the analogues, we compare Q for the day of each event to the distribution of the same metric computed for each of its analogues. If the value of Q for the day considered stands within the distribution of Q for its analogues, then the quality of the analogues is considered good. The event is not unprecedented and the attribution can be performed. However, if the value of Q for the event is greater than that of its analogues, the quality of the analogues is considered low, and the event is unprecedented and therefore not attributable.
-
Predictability index D. Using dynamical systems theory (Freitas et al., 2011, 2016; Lucarini et al., 2016), we can compute the local dimension D of each Z500 map (Faranda et al., 2017a, 2019). The local dimension is a proxy for the number of degrees of freedom of the field, meaning that the higher D is, the more unpredictable the temporal evolution of the Z500 maps will be (Faranda et al., 2017b; Messori et al., 2017; Hochman et al., 2019). If the dimension D of the pattern associated with a derecho event analysed is higher or lower than that of its analogues, then the extreme will be respectively less or more predictable than the closest dynamical situations identified in the data.
-
Persistence index Θ. Another quantity derived from dynamical systems theory is the persistence Θ of a given configuration (Faranda et al., 2017a). Persistence provides an estimate of the number of days we are likely to encounter a map that is an analogue of the one under consideration (Moloney et al., 2019). As with Q and D, we compute the two values of persistence for the extreme event in the factual and counterfactual world and the corresponding distributions of the persistence for the analogues.
3.1 Detected derechos over France between 2000 and 2022
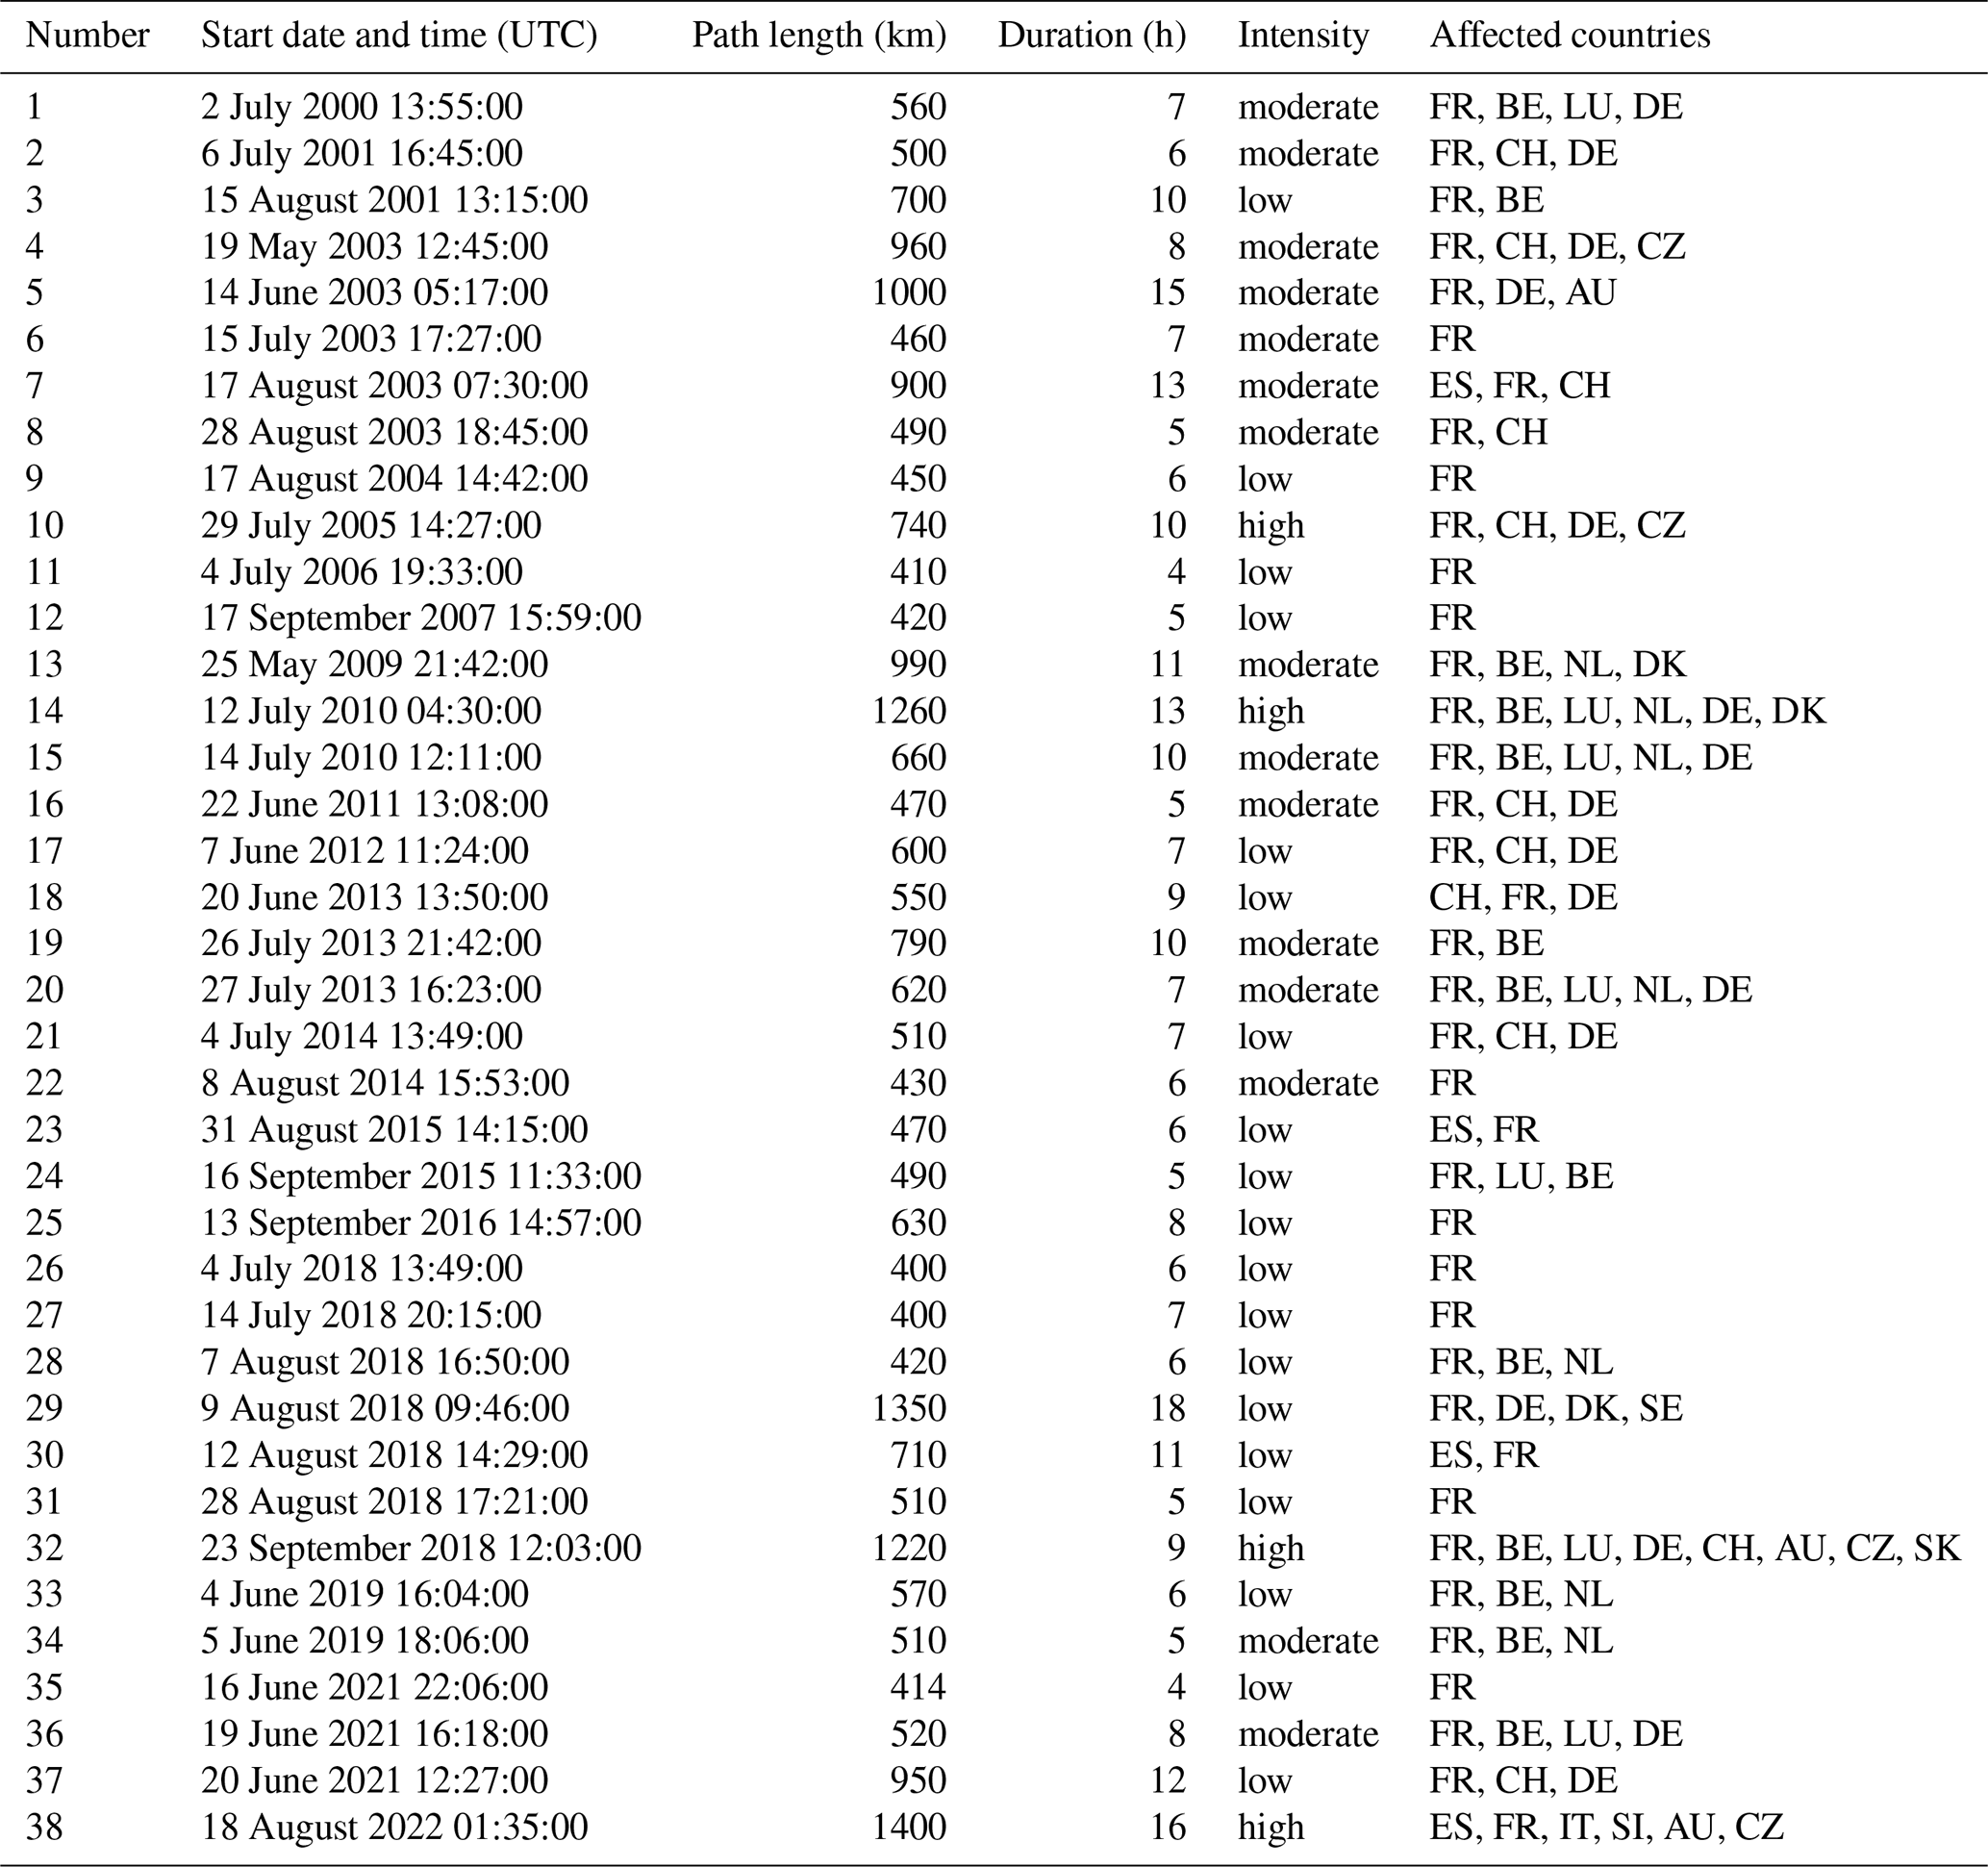
In total, we identify 38 warm-season derechos in France from 2000 to 2022. Table 1 presents a summary of these derechos, including their start date and time, path length, duration, intensity, and affected countries.
Table 1List of warm-season derechos that affected France between 2000 and 2022. The countries are abbreviated with their ISO 3166-1 alpha-2 code.
The trajectories of warm-season derechos in France, illustrated as straight arrows in Fig. 1a, predominantly follow a northeastern direction. Additionally, upon examining the daily averaged 500 hPa geopotential height patterns associated with the events (not shown), we predominantly observe southwesterly flows. This is consistent with the favoured development of extratropical MCS ahead of a trough or a cut-off low (van Delden, 2001; Gatzen, 2004; Coniglio et al., 2004; Gatzen, 2013; Yang et al., 2017; Houze, 2018; Piper et al., 2019; Gatzen et al., 2020). Many Z500 patterns associated with warm-season derechos in France bear resemblance to the Spanish plume (Morris, 1986; Holley et al., 2014), a typical configuration known for its association with severe convective weather in northwestern Europe. Examining more precisely the map of tracks (Fig. 1a), we note a significant number of derechos that propagate from the southeastern and eastern regions of France, advancing towards the east-northeast, often reaching Switzerland and/or southern Germany. These derechos commonly traverse north of the Alps or the Jura Mountains, aligning with the majority of warm-season events identified by Gatzen et al. (2020). Another set of derechos originates in central and northern France, extending through Belgium, Luxembourg and the Netherlands, with some instances affecting western and northern Germany, as well as a few persistent events extending as far as Denmark and Sweden. Additionally, certain derechos initiate in the southwest of France or northern Spain, propagating in various directions from north to east. The 2022 derecho impacting Corsica is distinctive, originating near the Balearic Islands in the Mediterranean Sea with no comparable event identified. The derecho of 17 August 2003 serves as the closest comparable event, albeit with a shorter path positioned further to the north. It originated in Spain and reached France after traversing the Gulf of Lion. It is possible that events similar to the 2022 derecho occurred but went undetected due to the limited number of weather stations over the sea. This particular derecho also affected multiple countries, suggesting the potential for identifying similar events by focusing on Mediterranean countries like Italy and Spain.
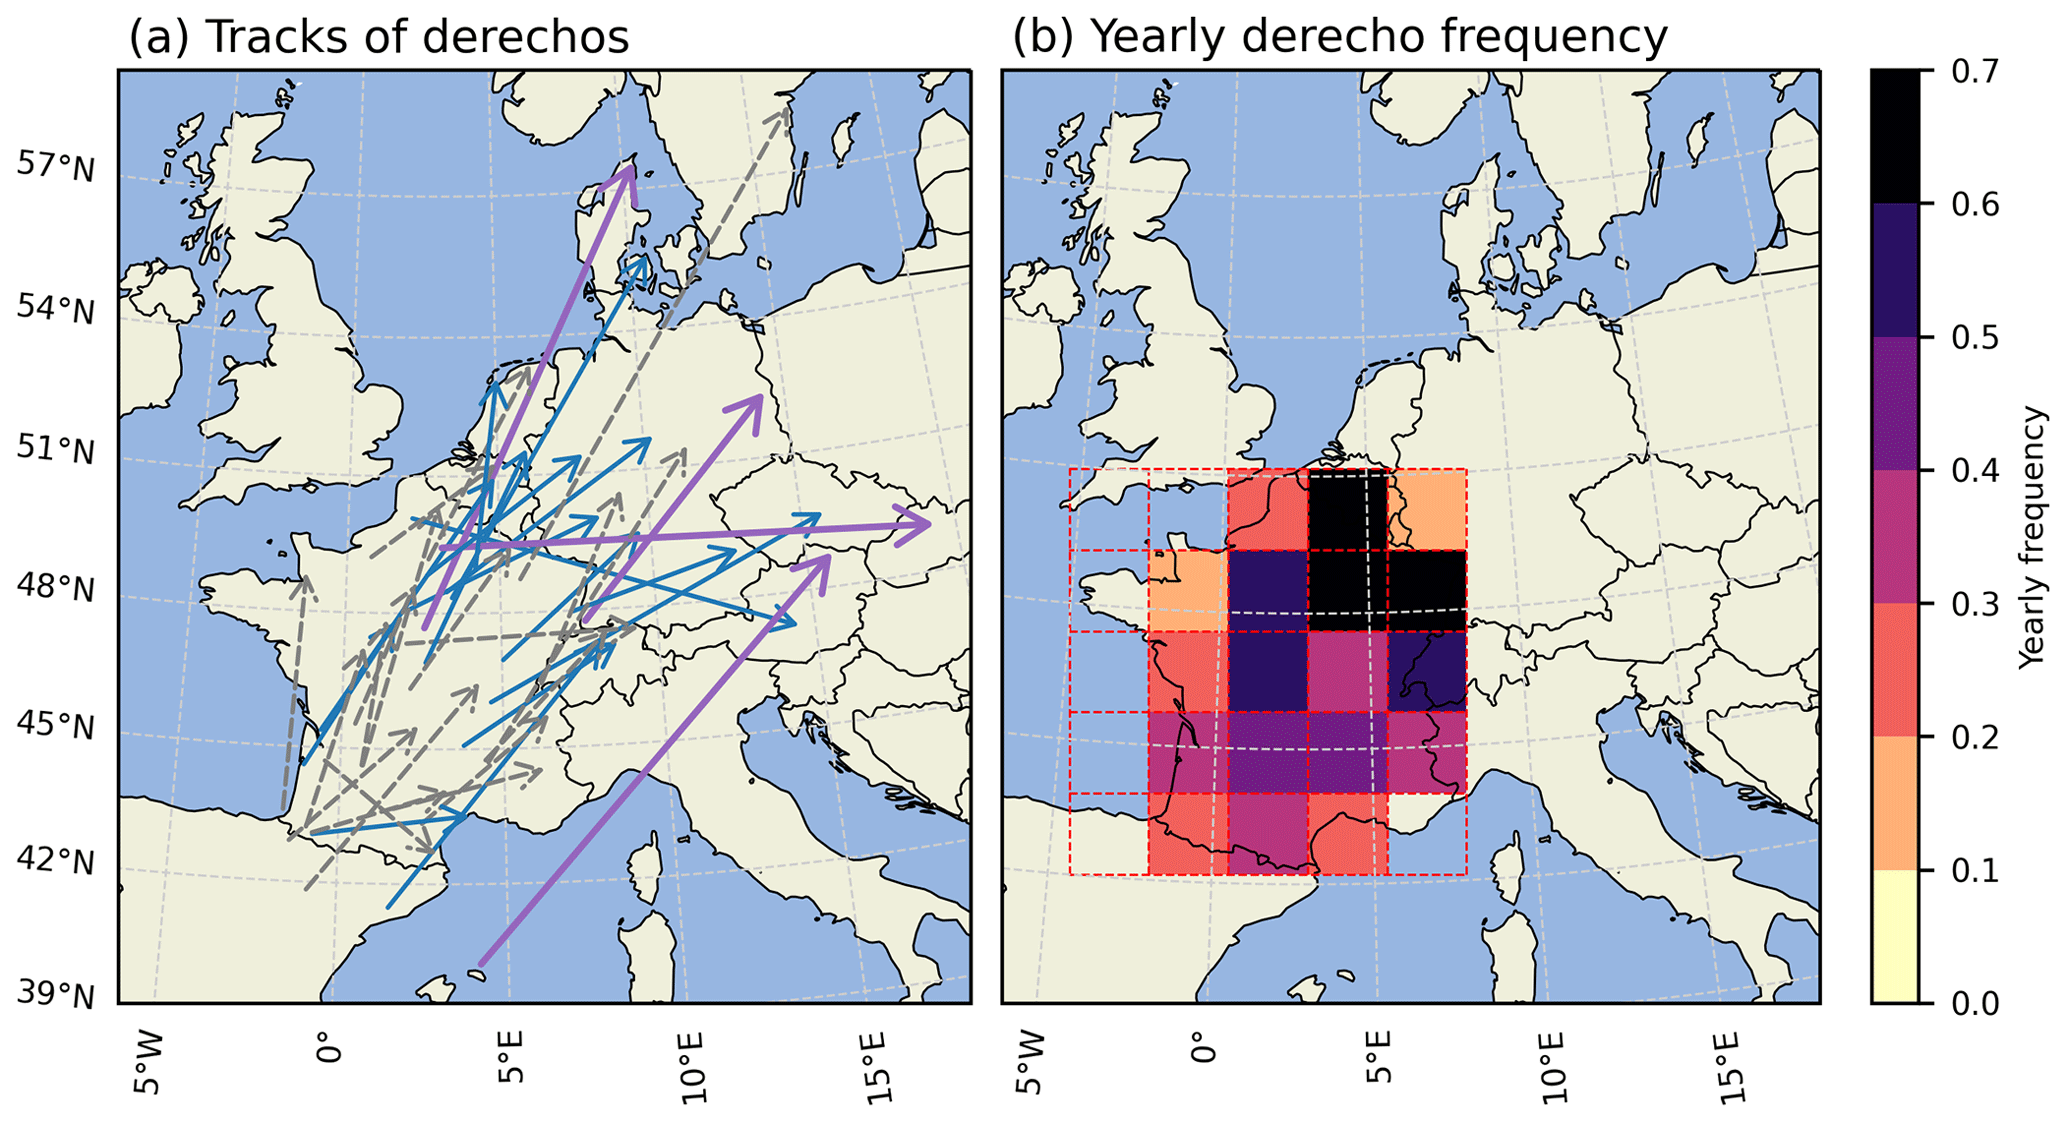
Figure 1(a) Approximate tracks of warm-season derechos that affected France between 2000 and 2022. The tracks are depicted by straight arrows between the first and last severe wind gust reports. The thin broken grey lines, thin blue lines and thick purple lines respectively represent low-, moderate- and high-intensity derechos. (b) Heatmap of the yearly frequency of warm-season derechos computed for geographical cells of dimensions 200 km × 200 km.
On average, we observe 1.65 derechos impacting France per warm season. However, regional variations are significant, as depicted in Fig. 1b, where we show the average number of warm-season derechos per year per 200 km × 200 km square region, following the approach of Gatzen et al. (2020) and Coniglio and Stensrud (2004). This involves counting the occurrences of associated severe wind gusts within each cell. Notably, the northeast of France exhibits the highest frequency of events, peaking at 0.65 derechos per year, while Brittany, the westernmost part of France, and Côte d'Azur in the southeast record no events. After closely examining the spatial distribution of observed derecho frequencies in Fig. 1b, we find a partial alignment with the European climatology of lightning in summer, as presented in Taszarek et al. (2020a) and with the density map of MCSs in Europe from Morel and Senesi (2002). Notably, high activity is observed near mountain ranges such as the Pyrenees and the Alps, extending roughly to the southern and eastern regions of France, with relatively less activity in Brittany and Normandy in the northwest. However, the highest frequency of derechos observed in the northeast of France diverges from these climatologies. Alternatively, when considering the climatology of severe wind events based on reports from ESWD in Taszarek et al. (2020a), we find a better correspondence. Severe wind events are indeed more frequent in central Europe, including Germany, Poland and Czechia, and to a lesser extent in the northeast of France and the Benelux. Nevertheless, it is essential to emphasize that the reliability of this climatology is constrained by the relatively brief period under consideration (13 years) and the lack of spatial and temporal uniformity in the reports from ESWD. This limitation is particularly pronounced in the case of wind reports, where the frequency has been steadily rising, as documented by Groenemeijer et al. (2017).
In Fig. 2, we depict histograms illustrating the path length, duration, intensity, month of occurrence and start time of observed derechos. The majority of identified events exhibit low (50 %) or moderate (39 %) intensity, with only 11 % classified as high intensity (Fig. 2a). The average path length of derechos in France is 670 km, and a substantial portion of events exhibit a relatively short path length (63 %) (Fig. 2d), falling below the 650 km threshold proposed by Corfidi et al. (2016) for revising the derecho definition. Consistent results emerge for event duration, with a majority lasting less than 6 h (Fig. 2c). The frequency of derechos varies considerably from year to year, reaching peaks of up to seven events in 2018 and five events in 2003, while certain years experience no recorded events (2002, 2008, 2017 and 2020). Successive events also occur, such as the consecutive events on 26 and 27 July 2013, 4 and 5 June 2019, and 19 and 20 June 2021. Transitioning to the analysis of their occurrence by month (Fig. 2b), there is a distinct peak in warm-season derecho occurrences during July, with frequencies in June and August being comparable, accounting for 84 % of the events combined. The remaining 16 % are distributed across May and September. Examining the start times of derechos (Fig. 2e), we observe that most events initiate in the afternoon, with peaks occurring around 13:00 UTC and again around 16:00 UTC.
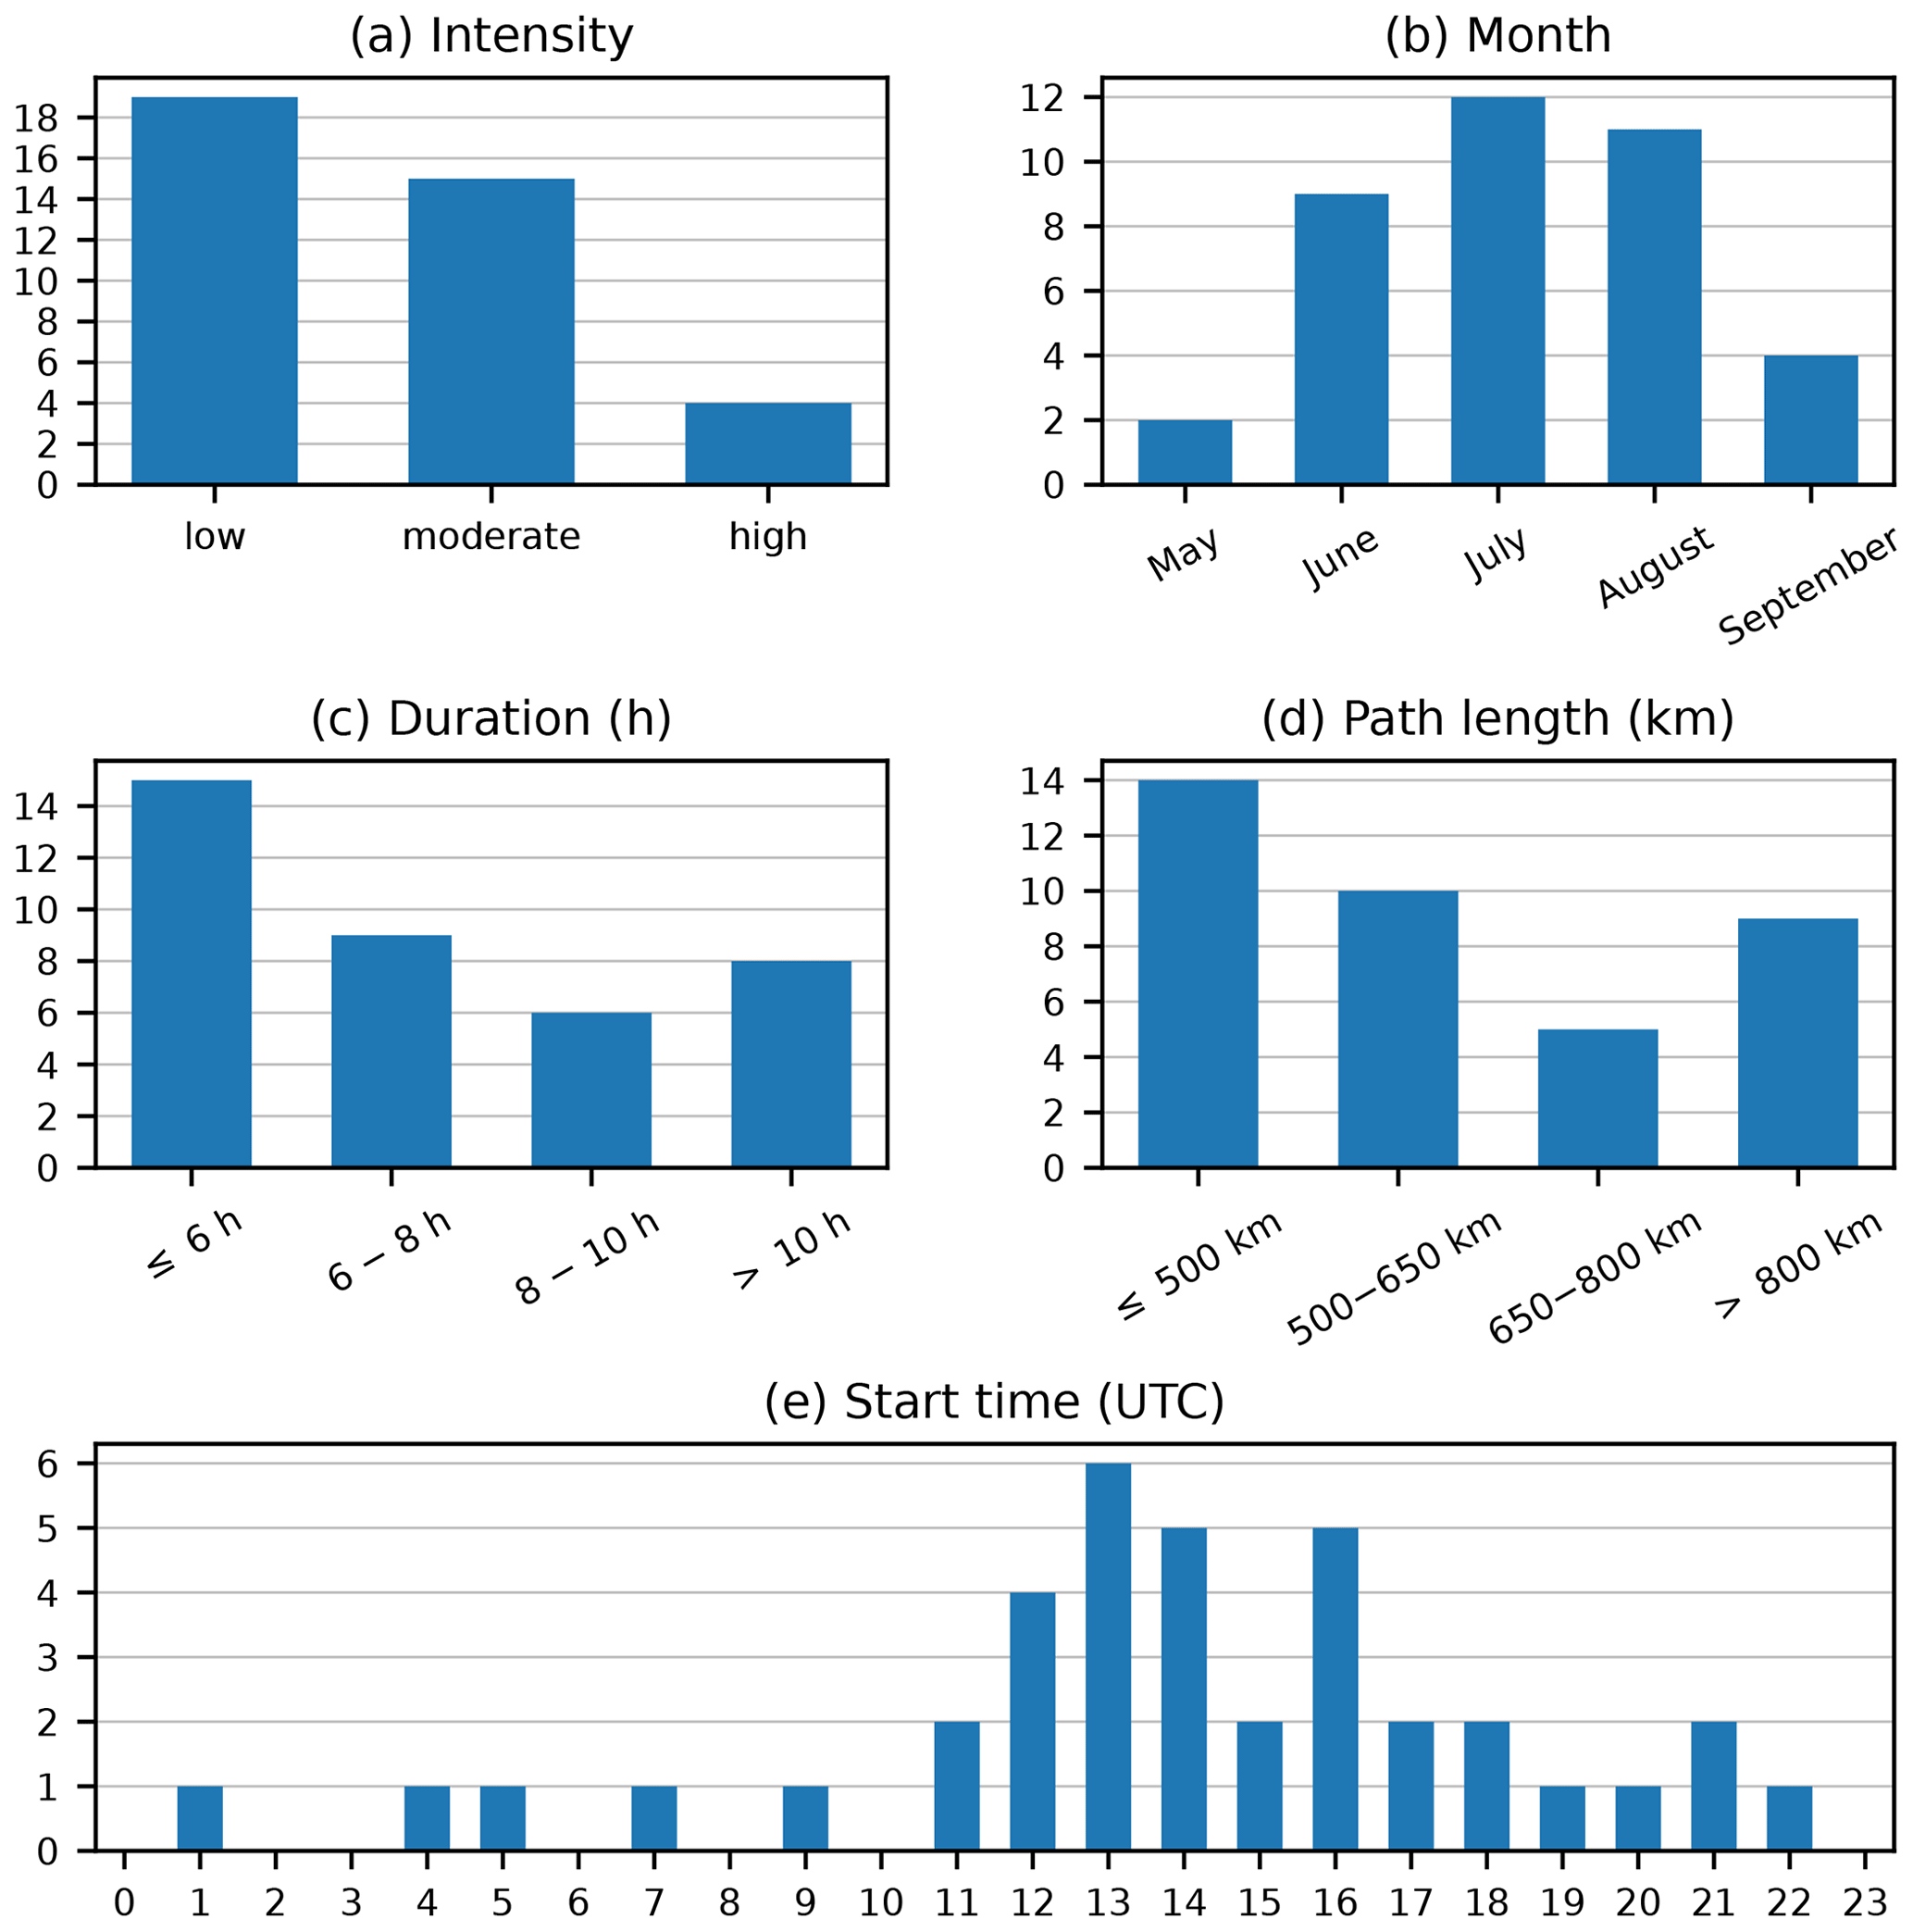
Figure 2Statistics of observed warm-season derechos over France between 2000 and 2022. (a) Intensity defined from the number of reports exceeding given wind gust speed thresholds (high: at least three reports >38 m s−1; moderate: at least three reports >33 m s−1; low: all remaining events). (b) Path length of derechos computed from the distance between first and last severe wind gust reports. (c) Duration defined as the elapsed time between the first and last reports. (d) Month of occurrence.
Comparing these results with those from Gatzen et al. (2020) for Germany, we notice a slightly higher frequency of warm-season derechos in France overall (1.65 vs. 1.22 events per year), although it is noteworthy that France is approximately 50 % larger by area than Germany. When adjusting for the size difference, the observed frequency of warm-season derechos in France is slightly lower (1.07 events per year). The highest regional frequency in a standardized 200 km by 200 km square area in France (0.65 per year) is comparable to the value observed in Germany throughout the entire year, specifically for moderate and high-end events (0.72 per year). In contrast, warm-season derechos are more prevalent in the USA, reaching up to 1.9 events per year for equal-sized grid cells, particularly in the Southern Plains and the Midwest (Coniglio and Stensrud, 2004; Guastini and Bosart, 2016). Regarding trajectory patterns, most warm-season derecho paths in Germany are also directed towards the northeast, aligning with the associated southwesterly flow. In contrast, there appears to be a wider variety of patterns and directions of propagation for warm-season derechos in the USA, with instances of zonal or northwesterly associated circulations (Coniglio et al., 2004). We note smaller proportions of moderate-intensity and high-intensity events (respectively 39 % vs. 54 % and 11 % vs. 14 %) and a larger fraction of low-intensity events (50 % vs. 32 %) in France compared to Germany. However, given the limited sample size, we refrain from asserting the significance of this difference, a conclusion supported by a chi-squared test (Pearson, 1900) at the 0.05 level (p value = 0.39). These conclusions still hold true when comparing with warm-season derechos in the USA, where the observed proportions are 19 % high-intensity events, 49 % moderate-intensity events and 33 % low-intensity events (Coniglio and Stensrud, 2004). Peak activity in Germany is also concentrated between June and August, whereas in the USA, it tends to be higher between May and July (Squitieri et al., 2023a). In France, we observe higher activity in August compared to both Germany and the USA. Thus, the distribution seems to lean more towards the late season in France, although this difference lacks statistical significance. If this discrepancy were to be validated with larger sample sizes, it could potentially be attributed to the proximity of the Mediterranean Sea. Its warm waters continue to serve as abundant sources of moisture and heat late in the season, fostering significant instability and the development of severe convective storms (Taszarek et al., 2020a; Morel and Senesi, 2002). Notably, southern France is renowned for experiencing extreme convective rainfall episodes during the fall season (Fumière et al., 2020; Ribes et al., 2019; Taszarek et al., 2019).
3.2 Results of attribution for the 18 August 2022 derecho
We initiate our analysis by closely examining the outcomes of the attribution analysis employing the analogue methodology for the 2022 Corsica derecho. This examination aims to illustrate the interpretation of results across various variables and metrics. As introduced in Sect. 1, a MCS developed and advanced northeastward, impacting Corsica, northern Italy, Slovenia, Austria and Czechia within a 12 h time frame. The event was marked by the generation of robust wind gusts along a 1000 km axis, accompanied by severe hail and substantial rainfall in specific regions. Wind reports from Météo-France (for Corsica) and ISD (mainly for Austria) and the storm's trajectory are depicted in Fig. 3. The synoptic conditions during the storm featured a meridional circulation with a cut-off low situated over the Gulf of Lion in the south of France, as illustrated by the daily average map of Z500 in Fig. 4a. Notably, we observe exceptionally high values of daily maximum CAPE (Fig. 4e) and DLS (Fig. 4f) along the storm's path, particularly over the Mediterranean Sea. These observations underscore the highly favourable conditions that contributed to the initiation of this particularly severe storm. For a comprehensive meteorological report of this event, the reader is referred to ESSL (2023).
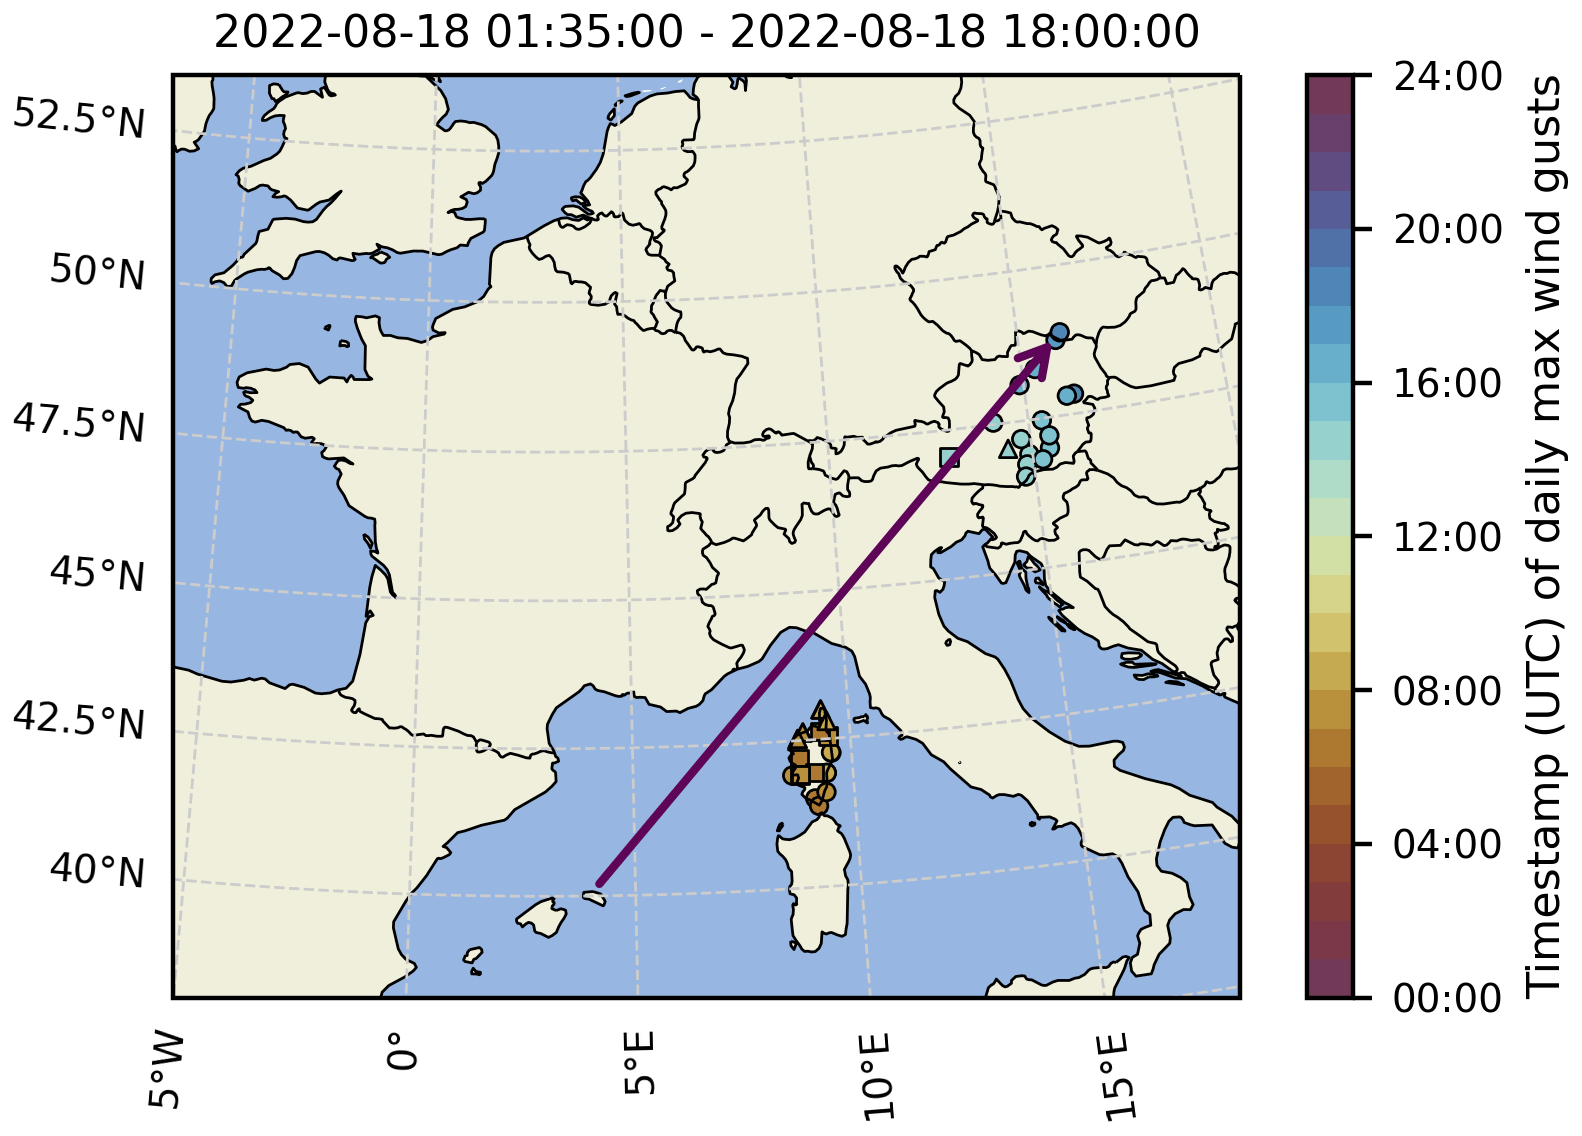
Figure 3Approximate path of 18 August 2022 derecho and locations of severe wind gust reports from Météo-France and ISD coloured by their timestamp. The triangles represent extremely severe wind gusts (>38 m s−1), the rectangles represent medium severe wind gusts (>33 m s−1), and the circles represent other severe wind gusts (>25 m s−1). The timestamps of the first and last reports, including those from ESWD, are shown in the title.
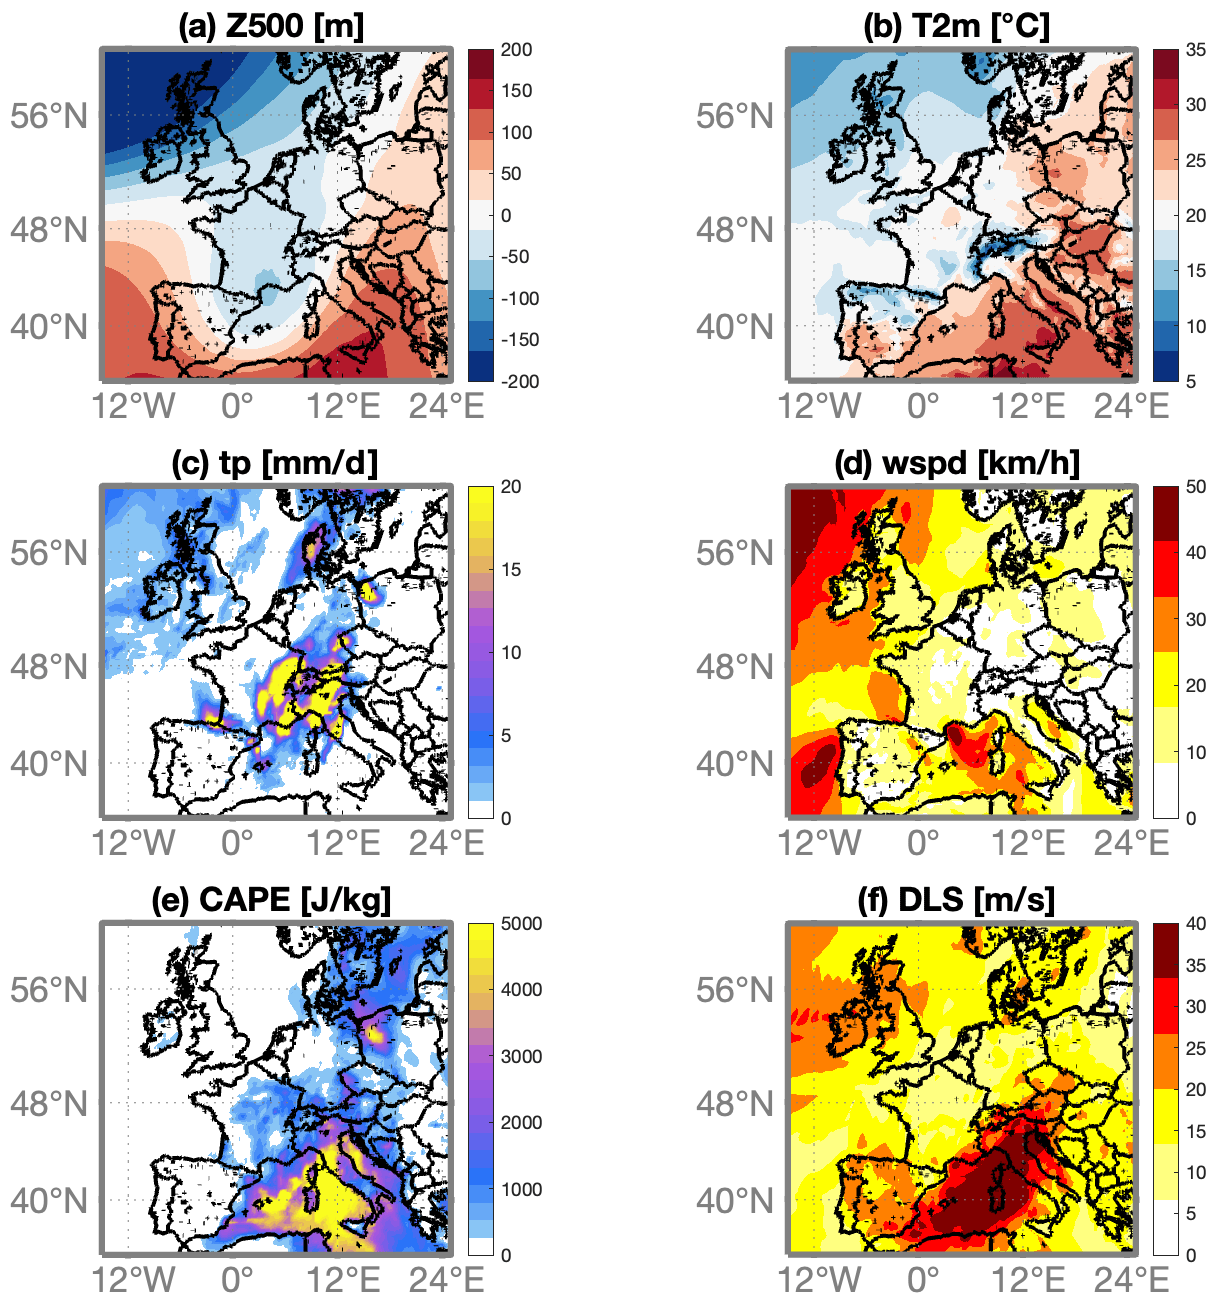
Figure 4Daily averaged maps of geopotential height at 500 hPa, with the spatial mean subtracted (a), 2 m temperature (b), total precipitation (c), wind speed (d), CAPE (e) and DLS (f) for 18 August 2022.
Figure 5 presents the results of the attribution study focusing on the synoptic configuration associated with the episode. The Z500 field of the event (Fig. 4a) served as the basis for identifying 37 analogues for both the counterfactual and factual periods, with their composites displayed in Fig. 5a and b. Upon scrutiny, we observe no significant changes in the circulation pattern (Fig. 5c). Notably, there is a pronounced increase in 2 m temperature across most of Europe, particularly over the Mediterranean Sea. Concurrently, there is a substantial reduction in precipitation over northern Italy, contrasting with a significant increase in Eastern Europe and certain regions of the Mediterranean Sea (Fig. 5g, h, i). These findings are consistent with results from the E-OBS dataset for temperature and precipitation (Figs. S2 and S3 provided as Supplement). Analysis of daily maximum CAPE (Fig. 5m, n, o) reveals a significant surge over the Mediterranean, aligning closely with the exceptionally high values observed on 18 August 2022. It is worth noting that ERA5 values for CAPE exhibit an unrealistic spike for the 2022 derecho (local values exceeding 5000 J kg−1 in Fig. 4e); this is a known common issue highlighted in the documentation of ERA5. On the other hand, the examination of deep-layer shear (Fig. 5p, q, r) shows no significant signal along the path of the MCS.
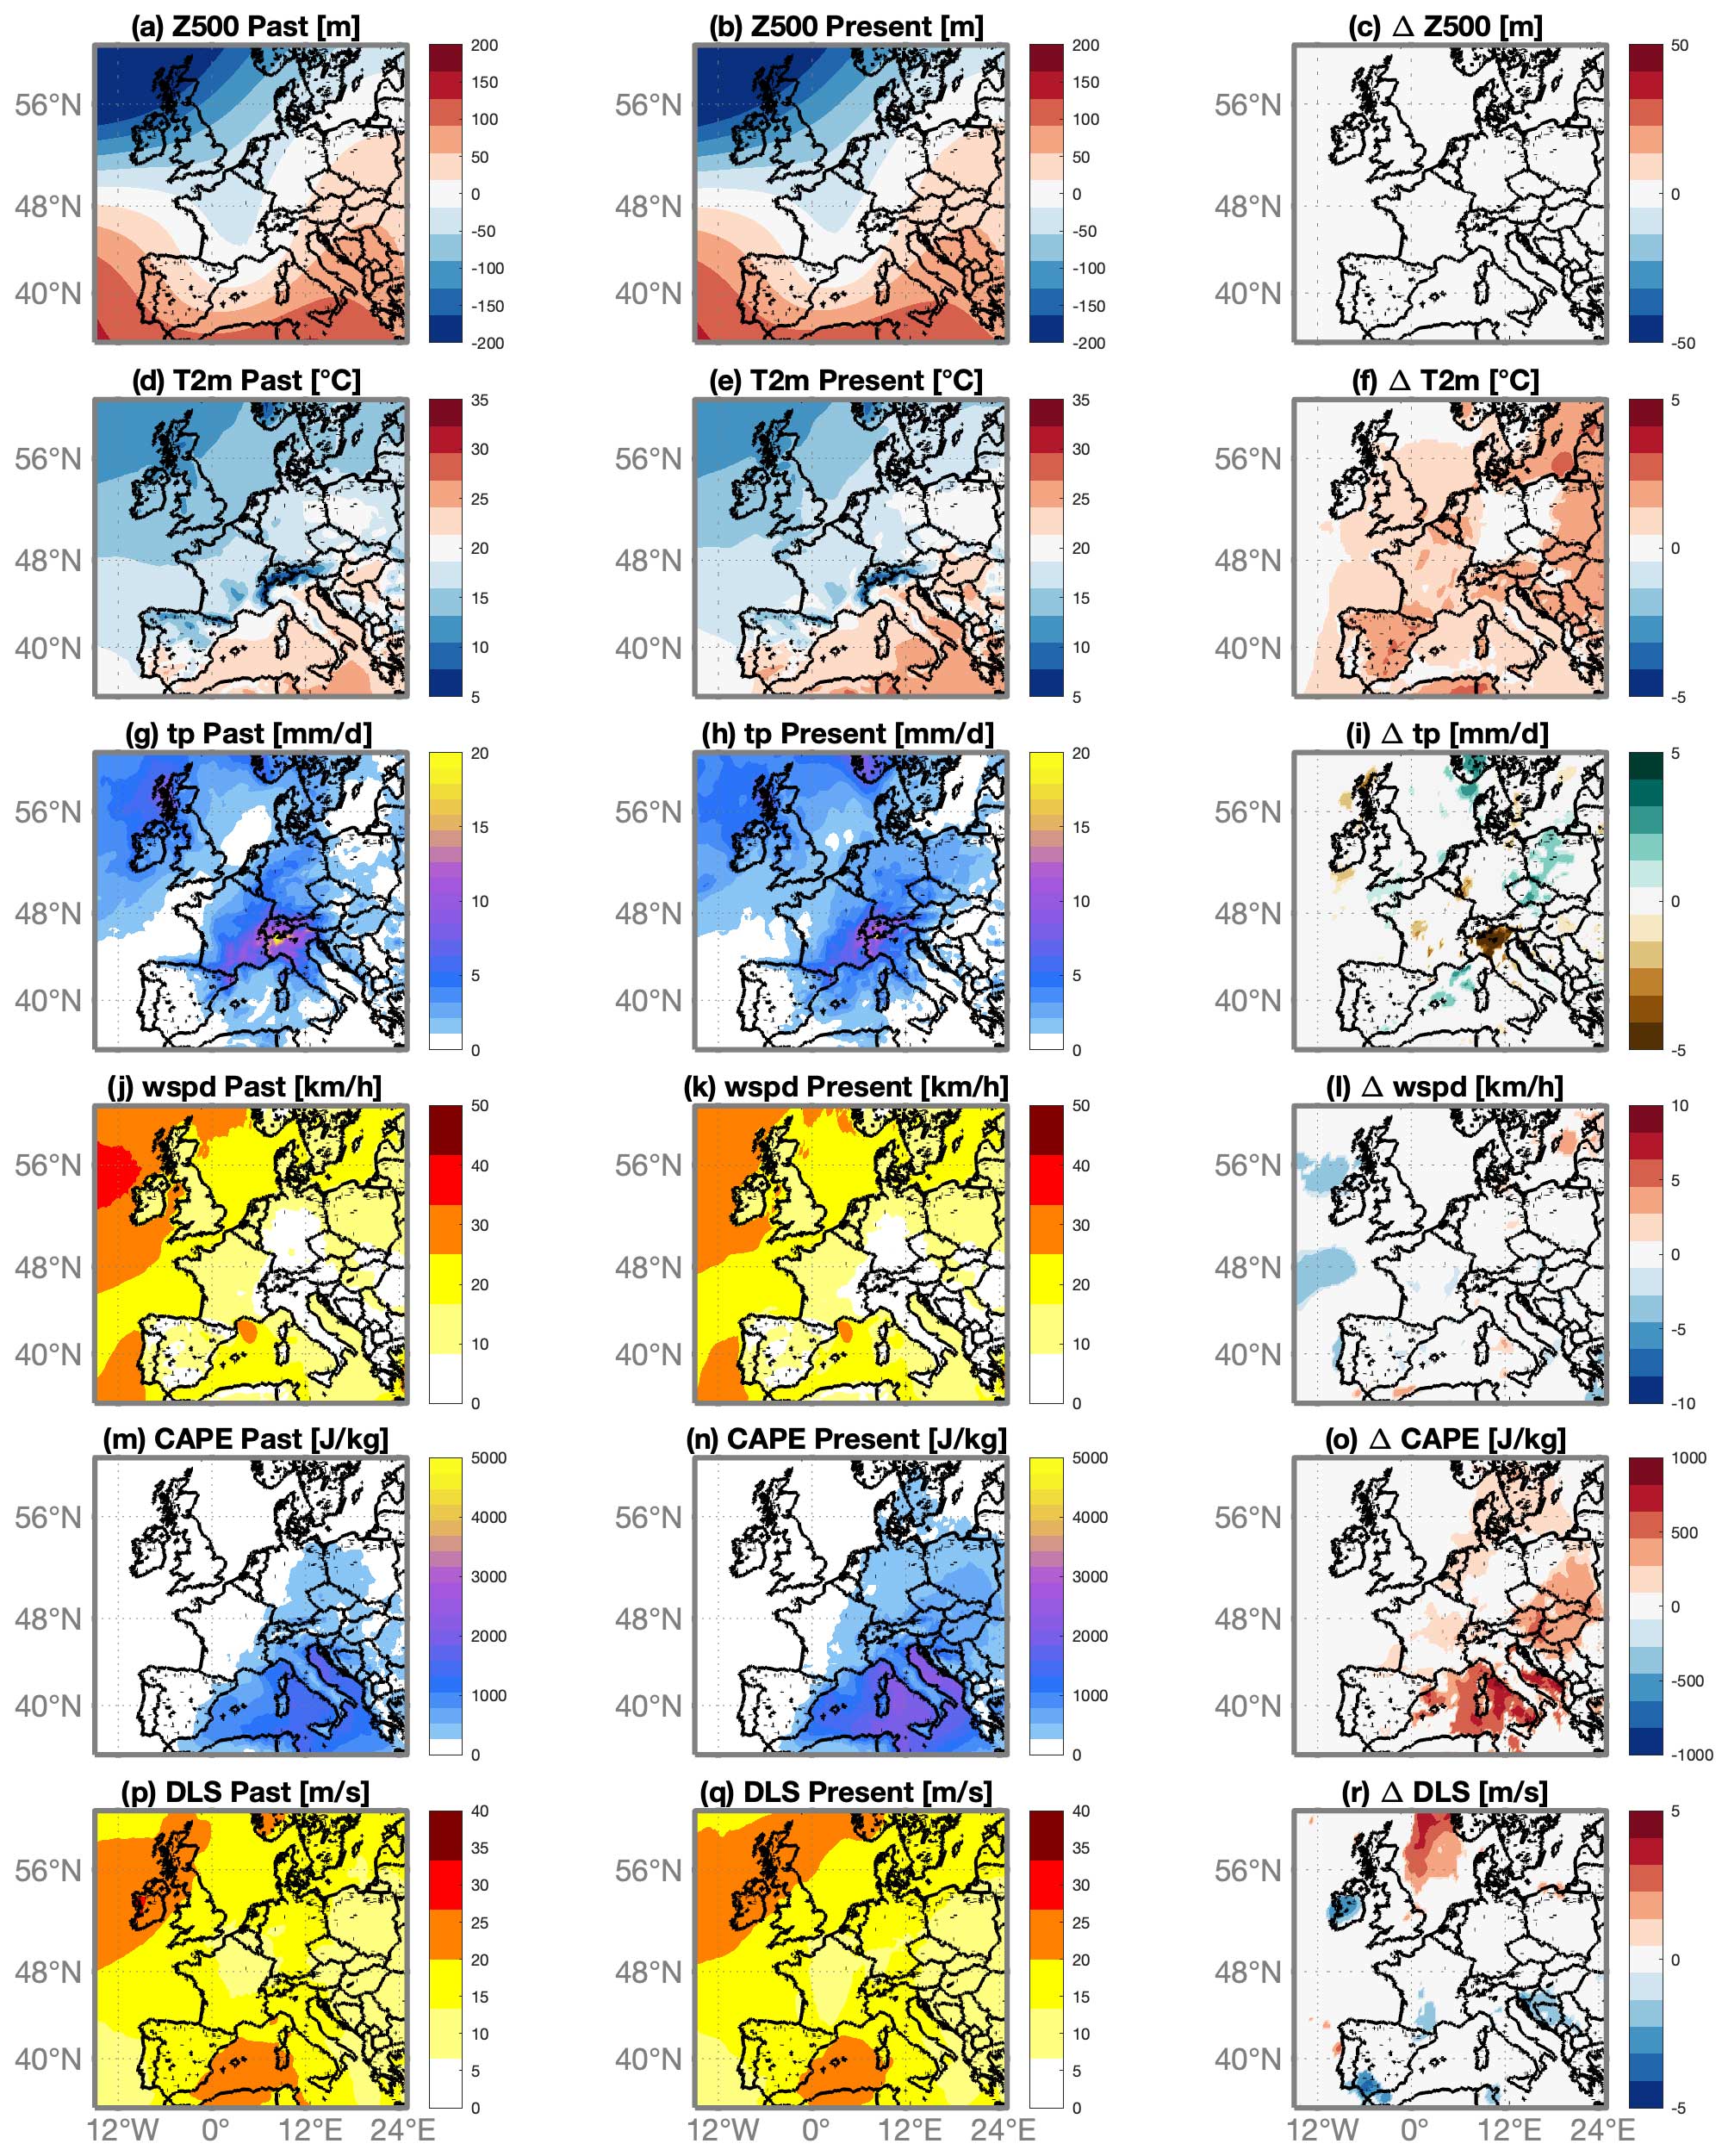
Figure 5Attribution for the 18 August 2022 derecho storm. Average of the 37 analogues of daily mean zero-centred geopotential height anomaly at 500 hPa (Z500) found for the counterfactual (1950–1980) (a) and factual (1992–2022) (b) periods and corresponding 2 m temperatures (T2m) (d, e), daily total precipitation (tp) (g, h) and wind speed (wspd) (j, k). Changes in the corresponding variables: ΔZ500 (c), ΔT2m (f), Δtp (i) and Δwspd (l) between factual and counterfactual periods (coloured-filled areas show significant anomalies with respect to the bootstrap procedure).
The evaluation of analogue quality (Fig. 6a) indicates that the observed circulation is relatively common when compared to the rest of the analogues with no changes between the two periods. Although we do not observe a significant change in persistence Θ (Fig. 6c) relative to the counterfactual world, there is an apparent increase in the local dimension D (Fig. 6b) in the recent past, signifying a decrease in the predictability of this pattern. Regarding changes in the ENSO, NAO, PDO, EA and SCAND indices (Fig. 6d, e, f, h, i), they are not statistically significant, whereas the distributions of the AMO index exhibit a notable shift between the two periods (Fig. 6g), suggesting a potential role of natural variability in explaining the observed changes. A thorough comparison of sea-level pressure, surface temperature and precipitation patterns characteristic of AMO in Europe (Zampieri et al., 2017) with the changes identified here reveals a remarkable agreement, supporting the notion that the AMO might be a significant influencing factor. The seasonal occurrence of analogues (Fig. 7a) aligns well with the months of lightning and severe wind events in this region (Taszarek et al., 2020a), peaking between August and September, with no significant shift in seasonality observed between the two periods. Lastly, when computing analogues for the entire period and counting their frequency per decade, no discernible trend emerges (Fig. 7b).
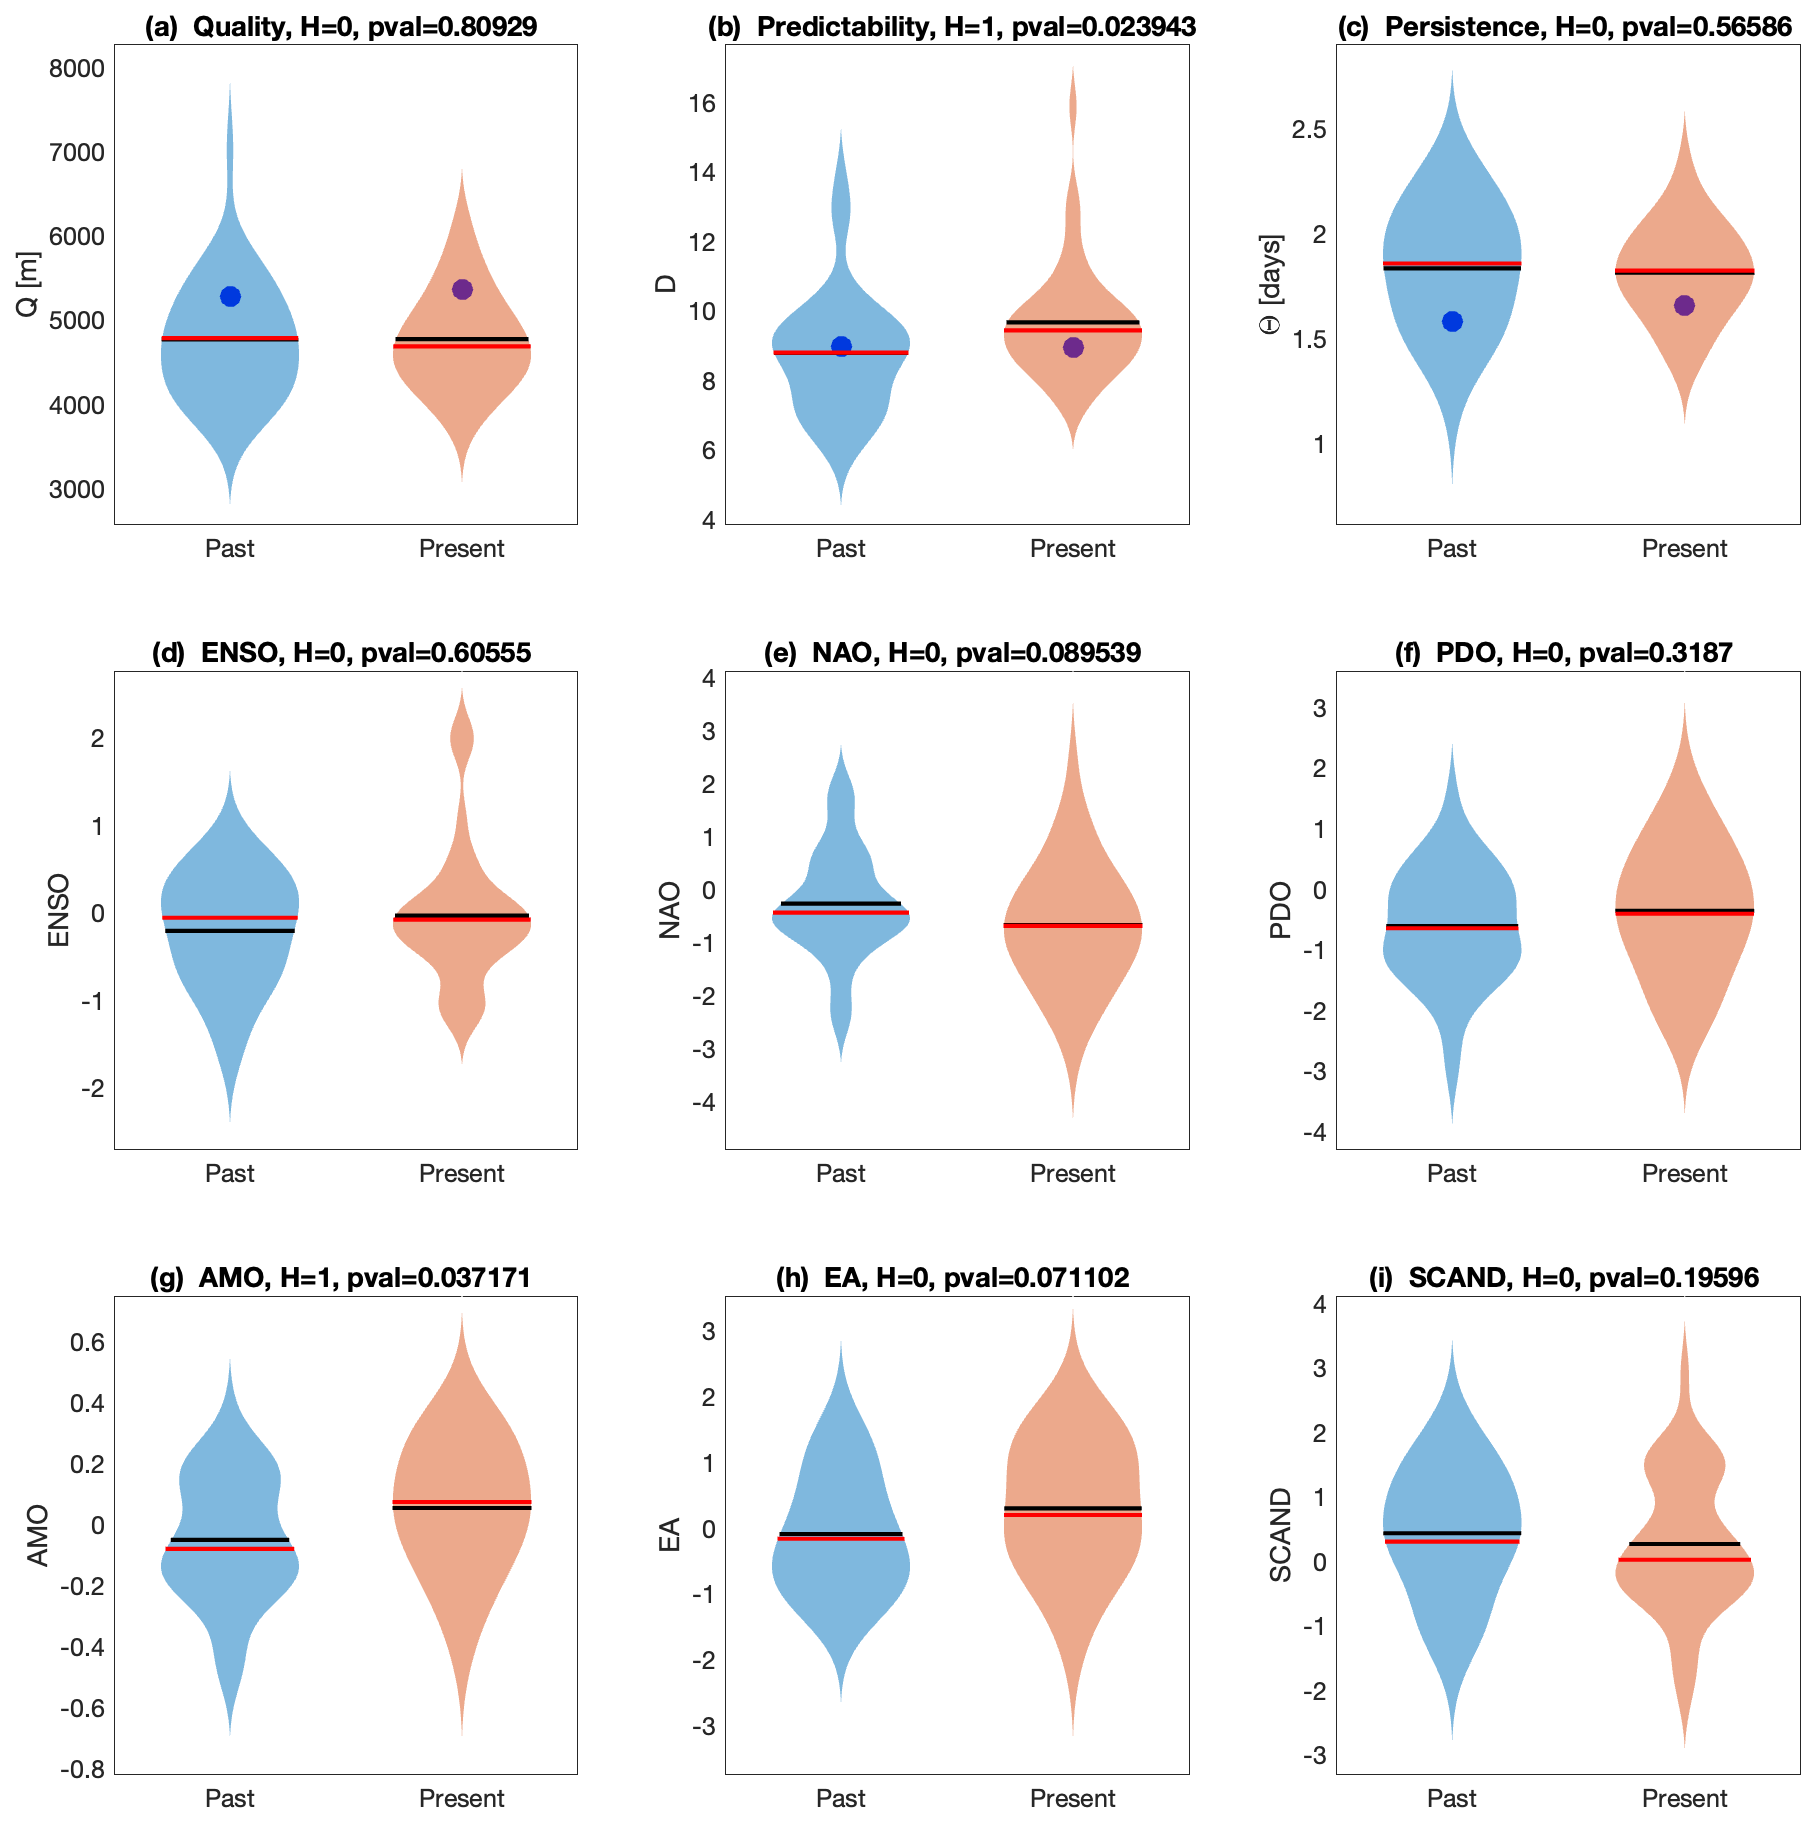
Figure 6Violin plots for counterfactual (blue) and factual (orange) periods for the analogue quality Q (a), the predictability index D (b) and the persistence index Θ (c). Violin plots for counterfactual (blue) and factual (orange) periods for ENSO (u), AMO (v) and PDO (w). Values for the day of the event are marked by a dot. Horizontal black and red lines respectively represent the empirical mean and median of the distributions. Titles in (a–i) report the results of the Cramér–von Mises test (H) at the 0.05 significance level (H=0 implies that the distributions are compatible and H=1 that they are different) and the p value (pval).
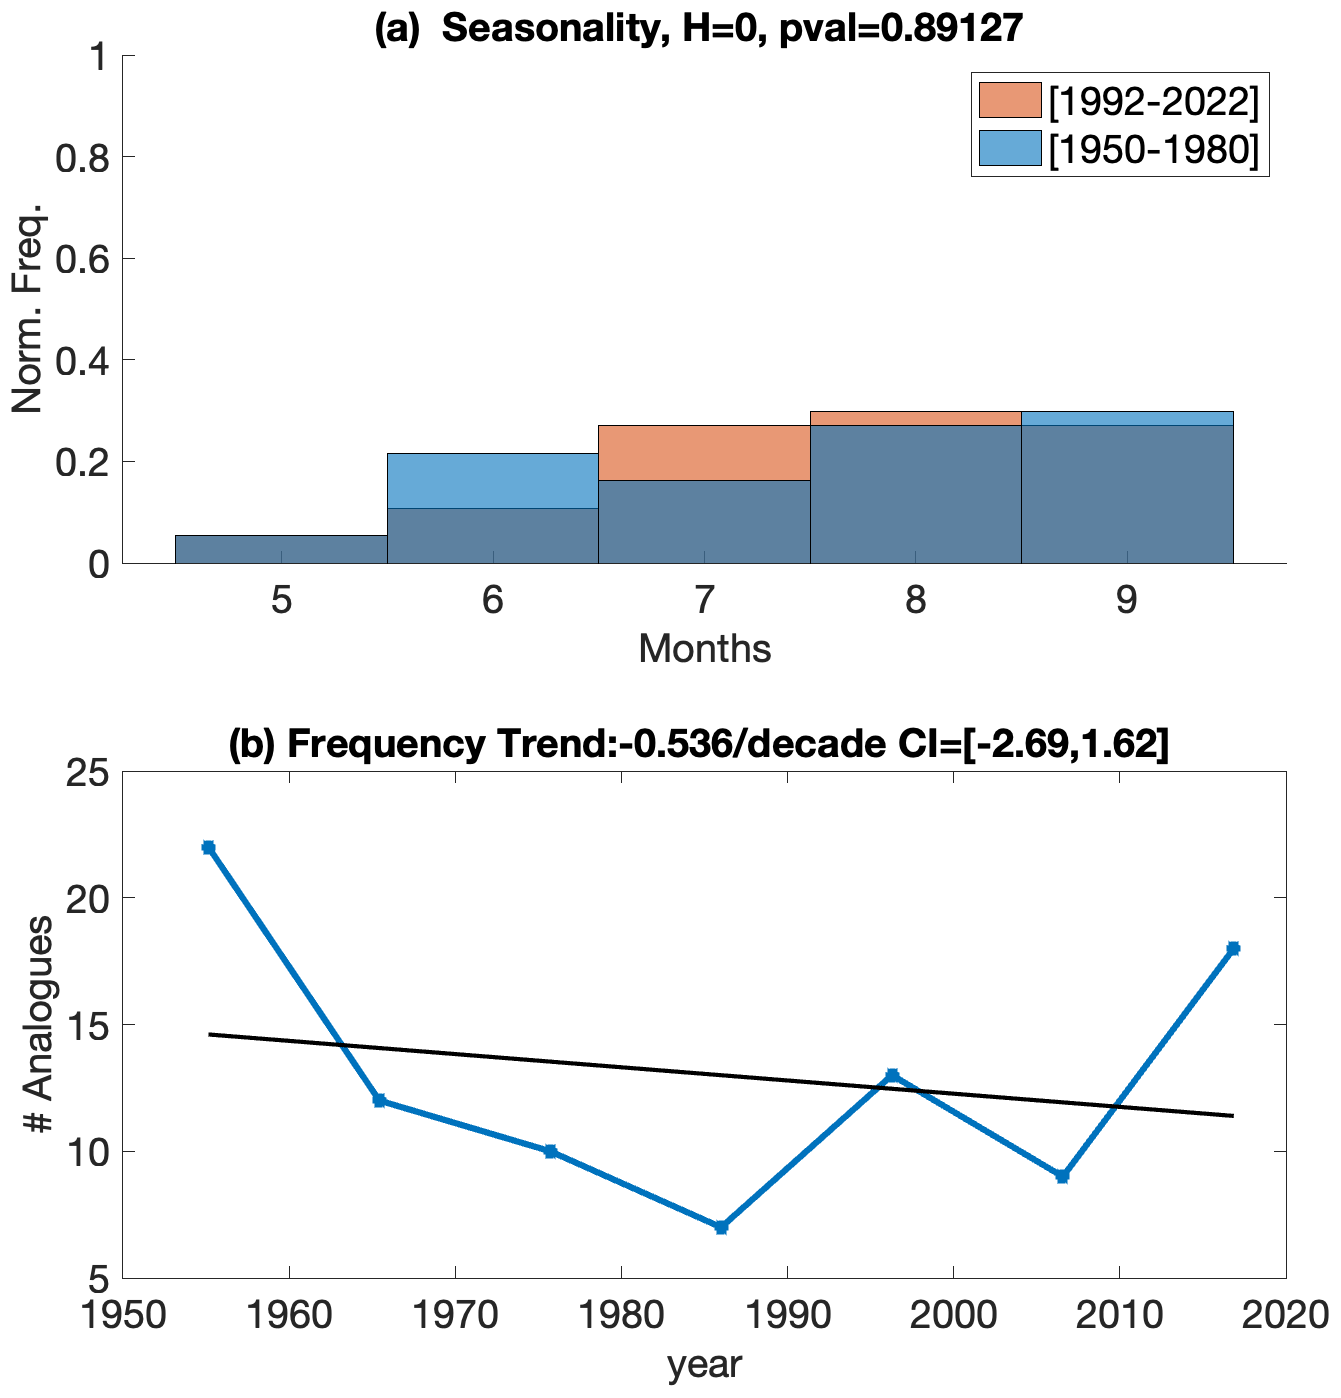
Figure 7(a) Distribution of analogues in each month for the daily mean Z500 map of 18 August 2022. The title report the results of the test (H) at the 0.05 significance level and the p value (pval). (b) Number of analogues per decade (blue) and the linear trend (black). The title includes the value of the linear trend slope and its confidence interval (CI) in square brackets.
In summary, our analysis indicates that there is no significant change in the circulation patterns between the past and present based on the best analogues of the Z500 map associated with the derecho of 18 August 2022. However, it is noteworthy that the surface temperatures associated with the cut-off lows are higher in the current period. A prominent signal of increased CAPE is identified in the present climate, which, with unchanged circulation, can be attributed to the exceptionally high temperature of the Mediterranean Sea. These findings align with the recent research by González-Alemán et al. (2023), highlighting the pivotal role of elevated temperatures in the Mediterranean Sea, characterized by anomalies surpassing +3 °C during the summer compared to the seasonal values of 1990–2020, in influencing the development and intensity of the MCS responsible for the 18 August 2022 derecho. However, our analysis underscores the possibility of the Atlantic Multidecadal Oscillation (AMO) contributing to heightened temperatures and CAPE.
3.3 Overall changes in synoptic patterns and environmental proxies
For each event, we conduct a comprehensive analysis similar to the one performed for the 2022 event. The summarized results are presented in Table A1. Subsequently, we go through the overall results for the 38 events.
We identify good-quality analogues for all events, as the event-to-best-analogue distance falls within the distribution of its analogues (not shown). This ensures a meaningful comparison between analogues in the two periods. However, we consistently observe significant changes in the Z500 field (89 %), emphasizing the need for caution when making attribution statements for observed changes in diagnostic variables (2 m temperatures (T2m), total precipitation (tp), CAPE and DLS). Some of these changes might result from shifts in circulation patterns, making it challenging to attribute them directly to anthropogenic climate change (Faranda et al., 2023; Vautard et al., 2023). For 42 % of the events, we observe a notable decrease in the average distance (Q) for each analogue compared to its own analogues, indicating that these patterns may be more prevalent in the recent period. However, this does not necessarily result in a substantial positive trend in analogue frequency. Only five events (13 %) display a significant positive trend in the frequency of their Z500 analogues, with trend values ranging between 1.4 and 2.3 analogues per decade – a noteworthy change relative to the mean number of analogues per decade. While analysing the relative frequency of analogue occurrence during the warm season, the majority of results appear statistically insignificant. Nevertheless, in three cases, we note a relative increase in frequency during the late season coupled with a decrease in the early season, while an inverse tendency is observed in three other cases. We find limited significant results for the local dimension (D), a proxy for predictability, with three increasing and four decreasing cases. Regarding persistence (Θ), we more frequently observe a significant decrease (24 %), while in 11 % of cases, there is an increase in persistence.
For the majority of events (82 %), we observe a significant increase in temperature, in line with expectations of anthropogenic climate change. There are no cases with a significant decrease, while the remaining cases show no significant change. In almost half of the cases (42 %), we observe an increase in precipitation, while a smaller fraction (18 %) shows a decrease. The increase in precipitation volume aligns with the projected rise in extreme precipitation in Europe (IPCC, 2023; Ribes et al., 2019). However, our comparison involves average situations for a given circulation pattern, which may not necessarily correspond to each being an extreme precipitation event. In 74 % of the cases, we observe an increase in instability measured by CAPE, with only one instance of a decrease. This finding aligns with previous studies on the observed or projected rise in convective instability in Europe, particularly in southern Europe (Rädler et al., 2019; Taszarek et al., 2021a, b; Pilguj et al., 2022). Results for DLS show fewer significant trends, with 24 % indicating a decrease and 18 % indicating an increase. These findings are consistent with the more modest and less frequent trends observed in vertical wind shear in the aforementioned studies.
As for the role of natural variability in contributing to these changes, we cannot dismiss its influence on the observed shifts. Examining the factors in descending order of frequency, we find ENSO (74 %), AMO (71 %), SCAND and PDO (both 37 %), NAO (32 %), and EA (24 %) as the studied variables. These results align with prior studies emphasizing the substantial impact of natural variability on convective activity in Europe (Casanueva et al., 2014; Tippett et al., 2015; Zampieri et al., 2017; Nobre et al., 2017; Piper et al., 2019; Wei et al., 2021). While previous research has suggested a relatively limited influence of ENSO on phenomena such as extreme precipitation in Europe compared to teleconnection patterns (Nobre et al., 2017; Piper et al., 2019), our findings suggest a potentially significant role of ENSO in shaping severe convective environments. Additional investigations are warranted to ascertain the robustness of this observation. One potential explanation for the dominance of AMO and ENSO, among the natural variability factors examined in our analysis, might lie in their longer typical timescales (ranging from annual to multidecadal), in contrast to teleconnection patterns like NAO, EA and SCAND, which are more closely tied to the chaotic dynamics of the atmosphere and exhibit shorter-term variations on timescales of the order of the week (Hurrell et al., 2003; Hurrell and Deser, 2010). By comparing composites of analogues over 31-year periods, we anticipate that the faster processes would be more effectively smoothed out, emphasizing the influence of longer-term variability.
In summary, this study presents a 23-year climatology of warm-season derechos in France spanning from 2000 to 2022. To detect events, we used wind gust reports from weather station data, primarily sourced from Météo-France and supplemented by data from ISD, DWD and ESWD. Mapping was conducted using an MCS detection and tracking algorithm with satellite imagery, leading to the identification and analysis of 38 events. A comparative examination of their features was carried out, drawing parallels with climatologies in the USA and Germany. Derechos in France are notably less frequent than those in the USA and more comparable to those in Germany. Nationwide, an average of 1.65 warm-season derechos occur per year, with the highest local frequency observed in northeastern France at 0.65 derechos per year within a 200 km by 200 km square area. A frequency of occurrence leaning more toward the late season is found in France in comparison with Germany and the USA, with similar frequencies of derechos in July and August and a few events in September. Additionally, there is a larger proportion of low-intensity events in France compared to Germany. However, these differences between the two countries cannot be considered statistically significant due to the small number of events. Exploring the potential impact of climate change on altering atmospheric circulation and environmental conditions associated with historical derechos, we compared analogues of circulation patterns based on 500 hPa geopotential height between a relatively distant past (1950–1980) and a more recent period (1992–2022). The analysis revealed a concurrent significant increase in 2 m temperature and maximum daily CAPE, aligning with findings from other studies in Europe and expectations of a warming climate. However, attributing these changes is challenging due to accompanying shifts in circulation patterns represented by 500 hPa geopotential height. Additionally, natural variability, particularly from ENSO and AMO, cannot be ruled out as a contributor to the observed changes.
The methodology employed for derecho detection introduces some limitations, relying on a semi-objective analysis that includes manual decisions, particularly in the selection of days for verifying the existence of an associated MCS and mapping wind gust reports with the MCS. While the primary weather station data from Météo-France, DWD and ISD provide broad coverage, limitations arise in instances where ISD wind gust data are lacking in certain countries or during specific time periods. The scope of this study excludes derechos in the cold season, and a comprehensive full-year climatology remains unexplored. While exploring changes in synoptic conditions and convective environmental parameters, we aimed to estimate the potential impact of specific internal variability factors on large-scale conditions associated with derechos. However, our analysis does not achieve a precise understanding of the individual contributions of these factors and anthropogenic climate change to the occurrence of derecho-producing MCSs. Additionally, the study does not consider potential influences from land use and land cover changes and other surface variables like SST, and it focuses exclusively on France, without extending its considerations to other regions.
To address these limitations, future studies could benefit from radar data (Huuskonen et al., 2014) and lightning datasets (Schulz et al., 2016) to enhance detection accuracy and refine event definitions. The detection of derechos is arduous due to the collection of data from different sources, the volume of data to analyse and the manual identification procedure. Automation of derecho detection would prevent flaws due to subjectivity and improve efficiency. Additionally, more detailed observations on environmental conditions and dynamics associated with derechos, using proximity soundings (Evans and Doswell, 2001; Gatzen et al., 2020), high-resolution reanalyses such as the forthcoming ERA6 or the analyses provided by non-hydrostatic convection-permitting weather models (Coppola et al., 2021), could offer deeper insights. In subsequent studies, a more comprehensive evaluation and quantification of the role of internal variability could be attained by establishing connections between derecho occurrence and indices of these factors. The potential societal impact of derechos on society (Ashley and Mote, 2005), infrastructure and people's safety, including their correlation with other extreme weather events, would be another interesting aspect to consider. While this study contributes valuable insights, continued research is essential to advance our understanding of the climatology, dynamics, and potential links to internal variability and climate change in derechos in France and Europe.
The attractor of a dynamical system is a geometric object defined in the space hosting all the possible states of the system (phase-space). Each point ζ on the attractor can be characterized by two dynamical indicators: the local dimension D, which indicates the number of degrees of freedom active locally around ζ, and the persistence Θ, a measure of the mean residence time of the system around ζ (Faranda et al., 2017b). To determine D, we exploit recent results from the application of extreme value theory to Poincaré recurrences in dynamical systems. This approach considers long trajectories of a system – in our case successions of daily Z500 latitude–longitude maps – corresponding to a sequence of states on the attractor. For a given point ζ in phase space (e.g. a given Z500 map), we compute the probability that the system returns within a ball of radius ϵ centred on the point ζ. The Freitas et al. (2010) theorem, modified by Lucarini et al. (2012), states that logarithmic returns,
yield a probability distribution such that
where z=g(x(t)) and s is a high threshold associated with a quantile q of the series g(x(t)). Requiring that the orbit falls within a ball of radius ϵ around the point ζ is equivalent to asking that the series g(x(t)) is over the threshold s; therefore, the ball radius ϵ is simply e−s(q). The resulting distribution is the exponential member of the generalized Pareto distribution family. The parameters μ and σ, namely the location and the scale parameter of the distribution, depend on the point ζ in phase space. μ(ζ) corresponds to the threshold s(q), while the local dimension D(ζ) can be obtained via the relation . This is the metric of predictability introduced in Sect. 2.
When x(t) contains all the variables of the system, the estimation of D based on extreme value theory has a number of advantages over traditional methods (e.g. the box counting algorithm; Liebovitch and Toth, 1989; Sarkar and Chaudhuri, 1994). First, it does not require the volume of different sets to be estimated in scale space: the selection of s(q) based on the quantile provides a selection of different scales s which depends on the recurrence rate around the point ζ. Moreover, it does not require the a priori selection of the maximum embedding dimension as the observable g is always a univariate time series.
The persistence of the state ζ is measured via the extremal index , a non-dimensional parameter, from which we extract . Here, Δt is the time step of the dataset being analysed. Θ(ζ) is therefore the average residence time of trajectories around ζ, namely the metric of persistence introduced in Sect. 2, and it has a time unit (in this study days). If ζ is a fixed point of the attractor, then Θ(ζ)=∞. For a trajectory that leaves the neighbourhood of ζ at the next time iteration, Θ=1. To estimate ϑ, we adopt the Süveges estimator (Süveges, 2007). For further details on the extremal index, see Moloney et al. (2019).
Table A1Results of the attribution analysis. The columns represent the following. Number: identification number for each derecho event; Q: analogue quality change; D: local dimension change; Θ: persistence change; trend: trend in the number of analogues per decade (+ for increase, − for decrease, blank for no trend); S. shift: seasonality shift in the frequency of analogues (− for significant shift towards the early season, + for shift towards the late season, blank for no shift); Z500 (ERA5): changes in the Z500 pattern (1 if there are significant changes, blank otherwise); T2m (E-OBS), tp (E-OBS), CAPE (ERA5), DLS (ERA5): changes in those variable fields near the MCS path; ENSO, NAO, AMO, PDO, EA, SCAND: changes in the distribution of those natural variability indices between the two periods.
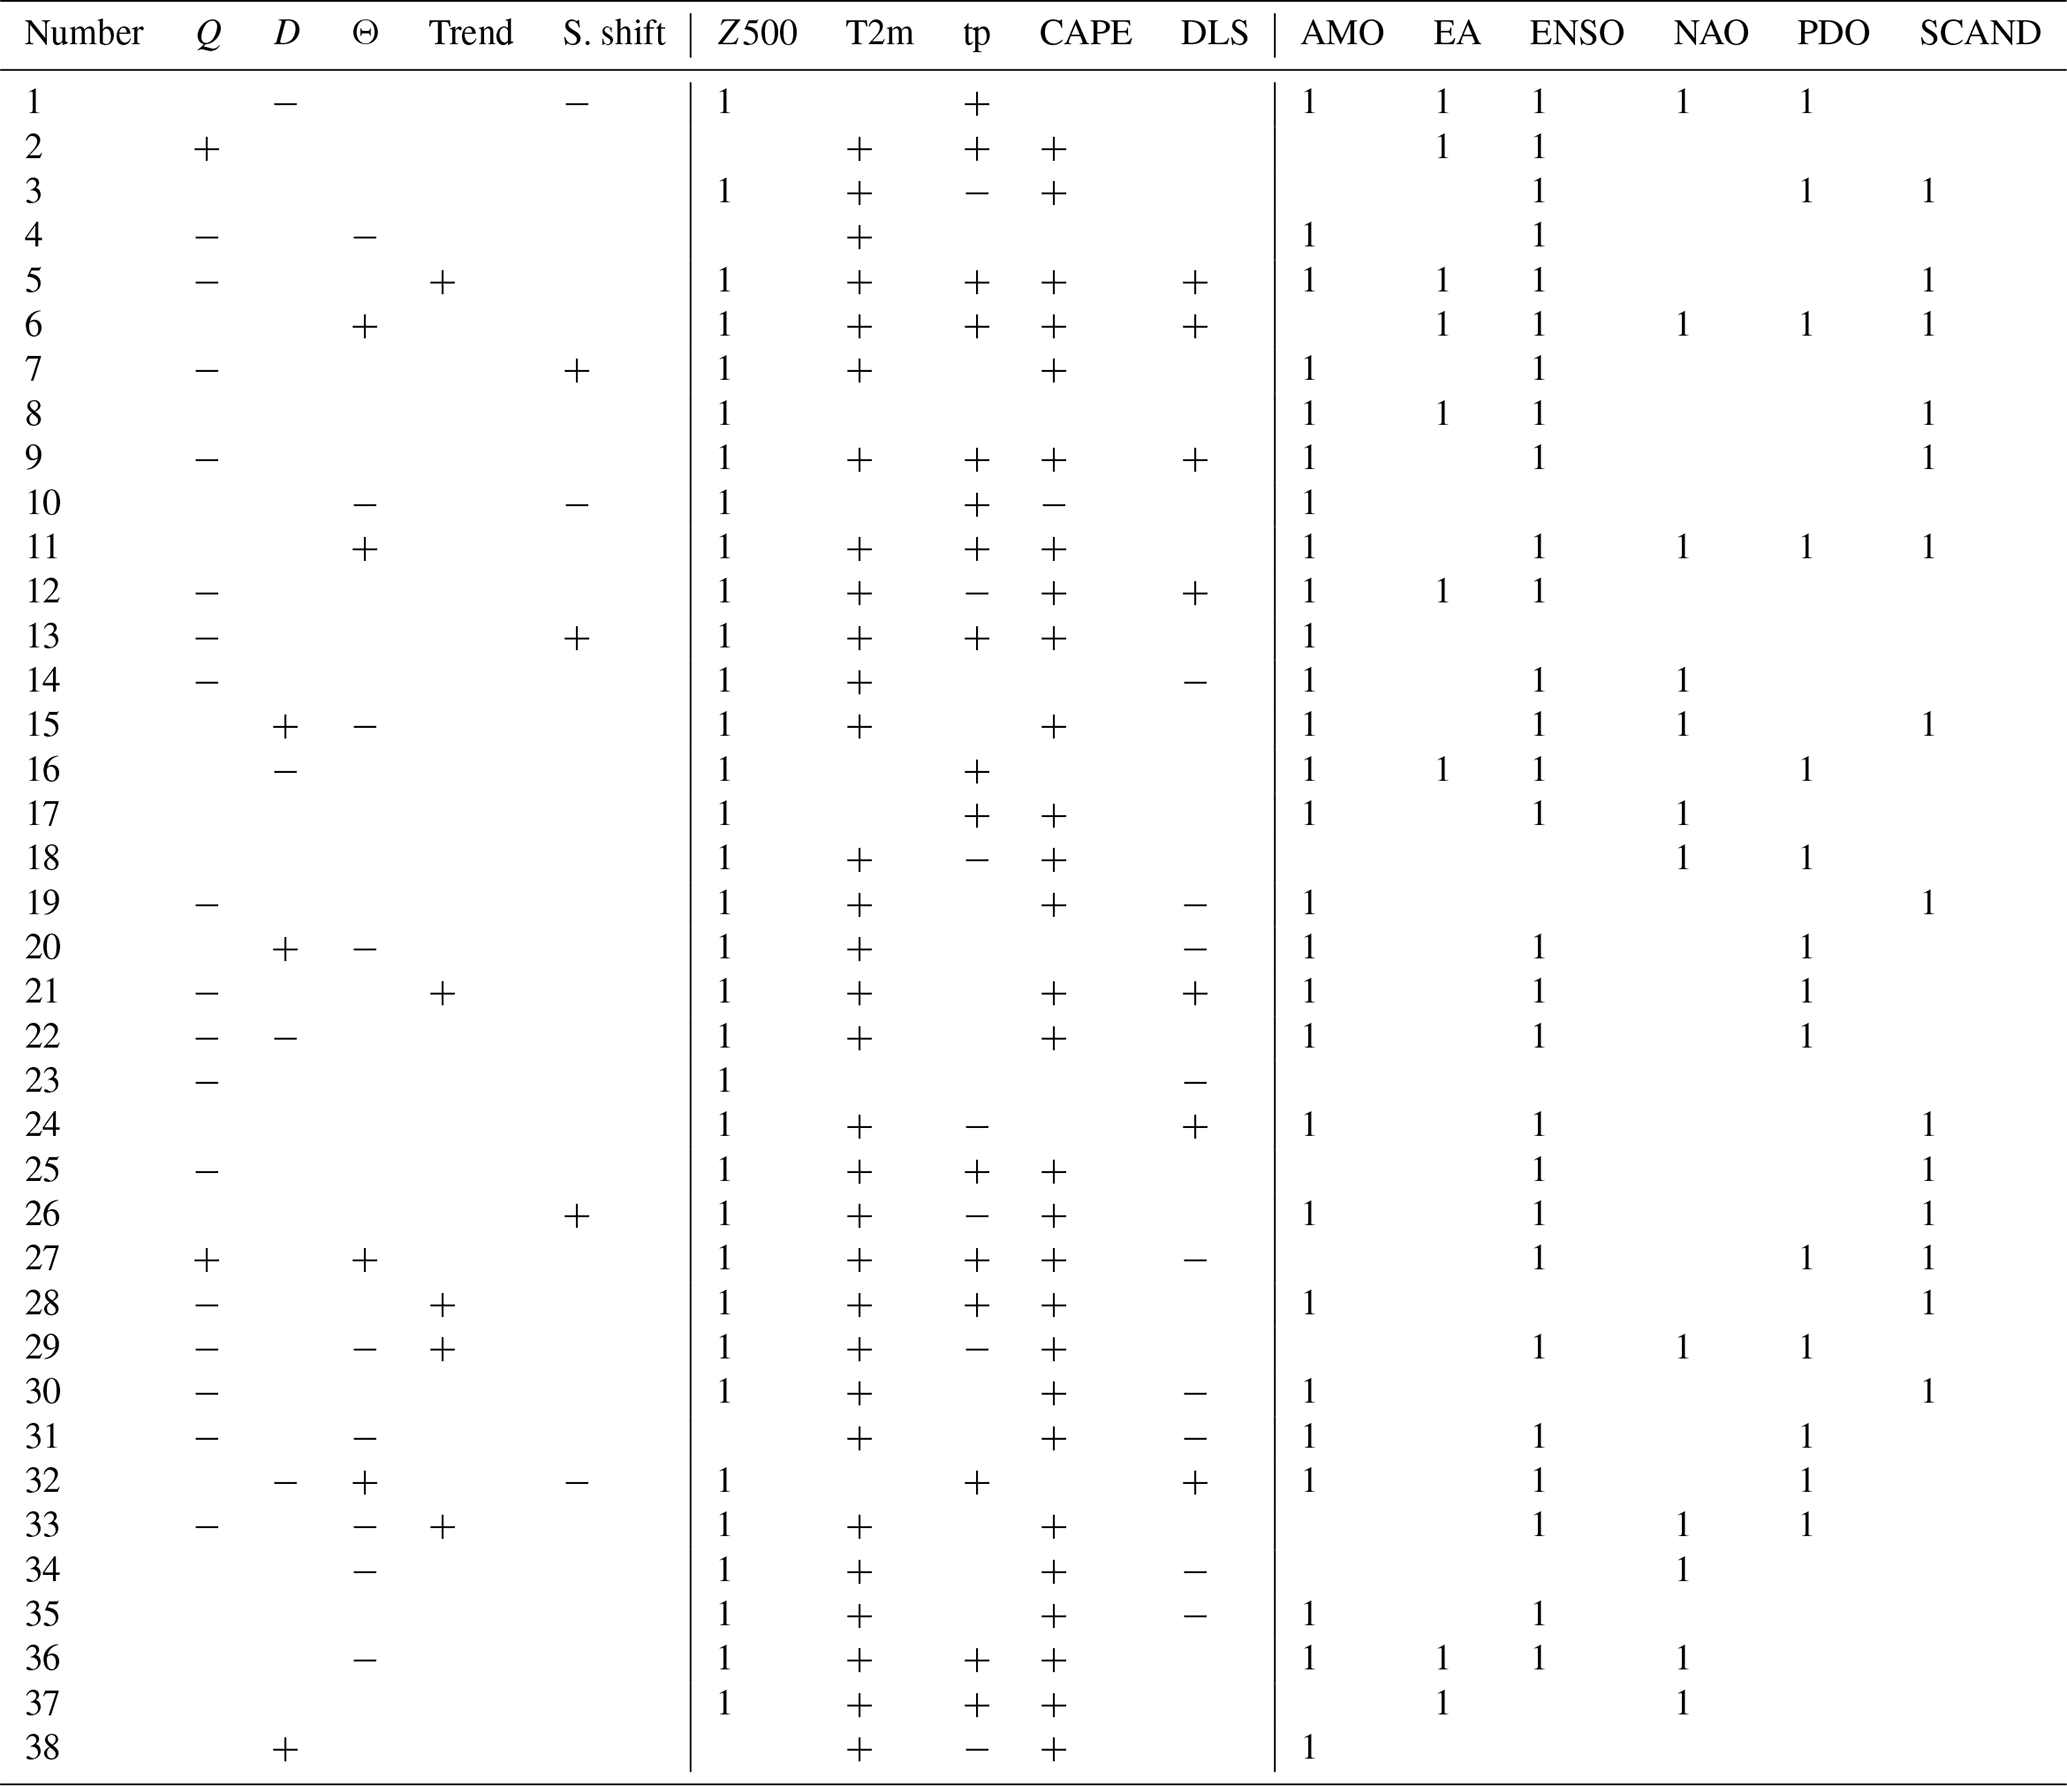
In Table A1, we present the detailed results of attribution for all 38 events. Each event's entry indicates whether there is a significant change in the distributions of analogue quality (average Euclidean distance to the 37 best analogues), dynamical indicators (local dimension D and persistence Θ) and indices of natural climate variability (ENSO, NAO, AMO, PDO, EA, SCAND). For analogue quality (Q), local dimension (D) and persistence (Θ), we specify the sign of the change in the mean value using “+” for an increase and “−” for a decrease and leaving the cell blank if there is no significant change. For atmospheric variables or parameters (T2m and tp using E-OBS and CAPE and DLS using ERA5), we apply the same notation. For climate variability indices (ENSO, NAO, AMO, PDO, EA, SCAND), we mark “1” when a significant change in the distribution between the two periods is observed and leave the cell blank otherwise. The same notation is used to indicate significant changes in the Z500 field (from ERA5), which may exhibit complex alterations in synoptic configurations, such as a dipolar or tripolar structure translating into changes in atmospheric flow intensity and/or direction. We also evaluate the significance of potential frequency trends (Trend) and seasonality shifts (S. shift), marking “+” or “−” for positive or negative trends and for shifts towards late or early months of the warm season, respectively.
The code to compute the dynamical indicators of predictability D and persistence Θ is available at https://fr.mathworks.com/matlabcentral/fileexchange/95768-attractor-local-dimension-and-local-persistence-computation (Faranda, 2021). The Python FLEXible object TRacKeR (PyFLEXTRKR) algorithm developed by Feng et al. (2023a) is available at https://doi.org/10.5281/zenodo.7429446 (Feng, 2022). Other analysis codes and the database of warm-season derechos in France are available upon requests from the authors.
ERA5 reanalysis data can be accessed through the Copernicus Climate Change Service (C3S) Climate Data Store (https://doi.org/10.24381/cds.adbb2d47, Hersbach et al., 2023a and https://doi.org/10.24381/cds.bd0915c6, Hersbach et al., 2023b). The ERA5 data for attribution have been downloaded from the preprocessed data available at https://climexp.knmi.nl/selectdailyfield2.cgi?id=someone@somewhere (KNMI Climate Explorer, 2024). The E-OBS dataset, sourced from the EU-FP6 project UERRA (http://www.uerra.eu, UERRA, 2024) and the C3S, is accessible via the ECA&D project (https://www.ecad.eu/download/ensembles/download.php#datafiles , ECA&D, 2024; Cornes et al., 2018). The GPM IMERG Final Precipitation L3 Half Hourly 0.1 degree × 0.1 degree V06 and the NCEP/CPC L3 Half Hourly 4 km Global (60° S–60° N) Merged IR V1 datasets are available from the Goddard Earth Sciences Data and Information Services Center (GES DISC) at https://doi.org/10.5067/GPM/IMERG/3B-HH/06 (Huffman et al., 2019) and https://doi.org/10.5067/P4HZB9N27EKU (Janowiak et al., 2017), respectively. Weather station data from Météo-France are accessible upon free request from https://portail-api.meteofrance.fr/web/en/api/DonneesPubliquesPaquetObservation, (Météo-France, 2024). The Integrated Surface Database (ISD) from the National Oceanic and Atmospheric Administration (NOAA) can be accessed via https://www.ncei.noaa.gov/data/global-hourly/ (NCEI and NOAA , 2024). The European Severe Weather Database (ESWD) from the European Severe Storms Laboratory is accessible at http://www.eswd.eu/ (ESSL, 2024). Data from German Weather Service (DWD) weather stations can be accessed at https://cdc.dwd.de/portal/ (EDWD, 2024).
The supplement related to this article is available online at: https://doi.org/10.5194/wcd-5-439-2024-supplement.
LF performed the detection and tracking of derechos and the subsequent analysis. DF performed the attribution analyses. Both authors contributed to the discussion of the results and writing of the manuscript.
The contact author has declared that neither of the authors has any competing interests.
Publisher’s note: Copernicus Publications remains neutral with regard to jurisdictional claims made in the text, published maps, institutional affiliations, or any other geographical representation in this paper. While Copernicus Publications makes every effort to include appropriate place names, the final responsibility lies with the authors.
The authors acknowledge the two anonymous reviewers for their insightful and constructive comments, which greatly contributed to improving the quality of this study and refining the manuscript. The authors also thank Bérengère Dubrulle for useful suggestions. Furthermore, the authors acknowledge Météo-France for providing wind gust data from its weather station network. The authors are grateful for the support provided by the CEA programme Focus Numérique Frugal, which funded Lucas Fery's PhD.
This research has been supported by Horizon 2020 (grant nos. XAIDA-101003469 and EDIPI-956396), the Agence Nationale de la Recherche (grant no. ANR-20-CE01-0008-01), the Centre national de la recherche scientifique (CNRS) (grant no. LEFE-MANU-CROIRE), the France 2030 (PEPR TRACCS programme, grant no. ANR-22-EXTR-0005) and the Commissariat à l'énergie atomique et aux énergies alternatives (CEA) (grant FOCUS Numérique Frugal).
This paper was edited by Peter Knippertz and reviewed by two anonymous referees.
Anderson, T. W.: On the distribution of the two-sample Cramer-von Mises criterion, Ann. Math. Stat., 33, 1148–1159, 1962. a
Arguez, A. and Vose, R. S.: The definition of the standard WMO climate normal: The key to deriving alternative climate normals, B. Am. Meteorol. Soc., 92, 699–704, 2011. a
Ashley, W. S. and Mote, T. L.: Derecho Hazards in the United States, B. Am. Meteorol. Soc., 86, 1577–1592, https://doi.org/10.1175/BAMS-86-11-1577, 2005. a, b
Ban, N., Caillaud, C., Coppola, E., Pichelli, E., Sobolowski, S., Adinolfi, M., Ahrens, B., Alias, A., Anders, I., Bastin, S., Belušić, D., Berthou, S., Brisson, E., Cardoso, R. M., Chan, S. C., Christensen, O. B., Fernández, J., Fita, L., Frisius, T., Gašparac, G., Giorgi, F., Goergen, K., Haugen, J. E., Hodnebrog, Ø., Kartsios, S., Katragkou, E., Kendon, E. J., Keuler, K., Lavin-Gullon, A., Lenderink, G., Leutwyler, D., Lorenz, T., Maraun, D., Mercogliano, P., Milovac, J., Panitz, H.-J., Raffa, M., Remedio, A. R., Schär, C., Soares, P. M. M., Srnec, L., Steensen, B. M., Stocchi, P., Tölle, M. H., Truhetz, H., Vergara-Temprado, J., de Vries, H., Warrach-Sagi, K., Wulfmeyer, V., and Zander, M. J.: The First Multi-Model Ensemble of Regional Climate Simulations at Kilometer-Scale Resolution, Part I: Evaluation of Precipitation, Clim. Dynam., 57, 275–302, https://doi.org/10.1007/s00382-021-05708-w, 2021. a
Battaglioli, F., Groenemeijer, P., Púčik, T., Taszarek, M., Ulbrich, U., and Rust, H.: Modelled Multidecadal Trends of Lightning and (Very) Large Hail in Europe and North America (1950–2021), J. Appl. Meteorol. Clim., 62, 1627–1653, https://doi.org/10.1175/JAMC-D-22-0195.1, 2023. a, b
Bentley, M. L. and Mote, T. L.: A Climatology of Derecho-Producing Mesoscale Convective Systems in the Central and Eastern United States, 1986–95. Part I: Temporal and Spatial Distribution, B. Am. Meteorol. Soc., 79, 2527–2540, https://doi.org/10.1175/1520-0477(1998)079<2527:ACODPM>2.0.CO;2, 1998. a, b, c, d
Bentley, M. L., Mote, T. L., and Byrd, S. F.: A Synoptic Climatology of Derecho Producing Mesoscale Convective Systems in the North-Central Plains, Int. J. Climatol., 20, 1329–1349, https://doi.org/10.1002/1097-0088(200009)20:11<1329::AID-JOC537>3.0.CO;2-F, 2000. a, b
Brooks, H. E.: Severe Thunderstorms and Climate Change, Atmos. Res., 123, 129–138, https://doi.org/10.1016/j.atmosres.2012.04.002, 2013. a
Brooks, H. E., Lee, J. W., and Craven, J. P.: The Spatial Distribution of Severe Thunderstorm and Tornado Environments from Global Reanalysis Data, Atmos. Res., 67–68, 73–94, https://doi.org/10.1016/S0169-8095(03)00045-0, 2003. a
Burke, P. C. and Schultz, D. M.: A 4-Yr Climatology of Cold-Season Bow Echoes over the Continental United States, Weather Forecast., 19, 1061–1074, https://doi.org/10.1175/811.1, 2004. a
Casanueva, A., Rodríguez-Puebla, C., Frías, M. D., and González-Reviriego, N.: Variability of extreme precipitation over Europe and its relationships with teleconnection patterns, Hydrol. Earth Syst. Sci., 18, 709–725, https://doi.org/10.5194/hess-18-709-2014, 2014. a, b
Celiński-Mysław, D. and Matuszko, D.: An Analysis of Selected Cases of Derecho in Poland, Atmos. Res., 149, 263–281, https://doi.org/10.1016/j.atmosres.2014.06.016, 2014. a
Celiński-Mysław, D., Palarz, A., and Taszarek, M.: Climatology and Atmospheric Conditions Associated with Cool Season Bow Echo Storms in Poland, Atmos. Res., 240, 104944, https://doi.org/10.1016/j.atmosres.2020.104944, 2020. a
Christidis, N. and Stott, P. A.: Changes in the Geopotential Height at 500 hPa under the Influence of External Climatic Forcings, Geophys. Res. Lett., 42, 10798–10806, https://doi.org/10.1002/2015GL066669, 2015. a
Coniglio, M. C. and Stensrud, D. J.: Interpreting the Climatology of Derechos, Weather Forecast., 19, 595–605, https://doi.org/10.1175/1520-0434(2004)019<0595:ITCOD>2.0.CO;2, 2004. a, b, c, d, e, f, g, h, i, j
Coniglio, M. C., Stensrud, D. J., and Richman, M. B.: An Observational Study of Derecho-Producing Convective Systems, Weather Forecast., 19, 320–337, https://doi.org/10.1175/1520-0434(2004)019<0320:AOSODC>2.0.CO;2, 2004. a, b, c, d
Coppola, E., Sobolowski, S., Pichelli, E., Raffaele, F., Ahrens, B., Anders, I., Ban, N., Bastin, S., Belda, M., Belusic, D., Caldas-Alvarez, A., Cardoso, R. M., Davolio, S., Dobler, A., Fernandez, J., Fita, L., Fumiere, Q., Giorgi, F., Goergen, K., Güttler, I., Halenka, T., Heinzeller, D., Hodnebrog, Ø., Jacob, D., Kartsios, S., Katragkou, E., Kendon, E., Khodayar, S., Kunstmann, H., Knist, S., Lavín-Gullón, A., Lind, P., Lorenz, T., Maraun, D., Marelle, L., van Meijgaard, E., Milovac, J., Myhre, G., Panitz, H.-J., Piazza, M., Raffa, M., Raub, T., Rockel, B., Schär, C., Sieck, K., Soares, P. M. M., Somot, S., Srnec, L., Stocchi, P., Tölle, M. H., Truhetz, H., Vautard, R., de Vries, H., and Warrach-Sagi, K.: A First-of-Its-Kind Multi-Model Convection Permitting Ensemble for Investigating Convective Phenomena over Europe and the Mediterranean, Clim. Dynam., 55, 3–34, https://doi.org/10.1007/s00382-018-4521-8, 2020. a
Coppola, E., Nogherotto, R., Ciarlo', J. M., Giorgi, F., van Meijgaard, E., Kadygrov, N., Iles, C., Corre, L., Sandstad, M., and Somot, S.: Assessment of the European climate projections as simulated by the large EURO‐CORDEX regional and global climate model ensemble, J. Geophys. Res.-Atmos., 126, e2019JD032356, https://doi.org/10.1029/2019JD032356, 2021. a
Corfidi, S. F.: Cold Pools and MCS Propagation: Forecasting the Motion of Downwind-Developing MCSs, Weather Forecast., 18, 997–1017, https://doi.org/10.1175/1520-0434(2003)018<0997:CPAMPF>2.0.CO;2, 2003. a
Corfidi, S. F., Coniglio, M. C., Cohen, A. E., and Mead, C. M.: A Proposed Revision to the Definition of “Derecho”, B. Am. Meteorol. Soc., 97, 935–949, https://doi.org/10.1175/BAMS-D-14-00254.1, 2016. a, b, c, d, e
Cornes, R. C., van der Schrier, G., van den Besselaar, E. J. M., and Jones, P. D.: An Ensemble Version of the E-OBS Temperature and Precipitation Data Sets, J. Geophys. Res.-Atmos., 123, 9391–9409, https://doi.org/10.1029/2017JD028200, 2018. a, b
Dotzek, N., Groenemeijer, P., Feuerstein, B., and Holzer, A. M.: Overview of ESSL's severe convective storms research using the European Severe Weather Database ESWD, Atmos. Res., 93, 575–586, 2009. a
DWD – Deutscher Wetterdienst: Climate Data Center, https://cdc.dwd.de/portal/ (last access: 19 March 2024), 2024. a
ECA&D – European Climate Assessment and Dataset: E-OBS Temperature and Precipitation Data sets, https://www.ecad.eu/download/ensembles/download.php#datafiles (last access: 19 March 2024), 2024. a
ESSL: The derecho and hailstorms of 18 August 2022, ESSL, https://www.essl.org/cms/the-derecho-and-hailstorms-of-18-august-2022/, (last access: 4 January 2023), 2023. a
ESSL – European Severe Storms Laboratory, European Severe Weather Database (ESWD), http://www.eswd.eu/ (last access: 19 March 2024), 2024. a
Evans, J. S. and Doswell, C. A.: Examination of Derecho Environments Using Proximity Soundings, Weather Forecast., 16, 329–342, https://doi.org/10.1175/1520-0434(2001)016<0329:EODEUP>2.0.CO;2, 2001. a, b
Faranda, D.: Attractor Local Dimension and Local Persistence computation, MathWorks [code], https://fr.mathworks.com/matlabcentral/fileexchange/95768-attractor-local-dimension-and-local-persistence-computation (last access: 19 March 2024), 2021. a
Faranda, D., Messori, G., Alvarez-Castro, M. C., and Yiou, P.: Dynamical properties and extremes of Northern Hemisphere climate fields over the past 60 years, Nonlin. Processes Geophys., 24, 713–725, https://doi.org/10.5194/npg-24-713-2017, 2017a. a, b
Faranda, D., Messori, G., and Yiou, P.: Dynamical proxies of North Atlantic predictability and extremes, Scientific Reports, 7, 41278, https://doi.org/10.1038/srep41278, 2017b. a, b
Faranda, D., Messori, G., and Vannitsem, S.: Attractor dimension of time-averaged climate observables: insights from a low-order ocean-atmosphere model, Tellus A, 71, 1554413, https://doi.org/10.1080/16000870.2018.1554413, 2019. a
Faranda, D., Bourdin, S., Ginesta, M., Krouma, M., Noyelle, R., Pons, F., Yiou, P., and Messori, G.: A climate-change attribution retrospective of some impactful weather extremes of 2021, Weather Clim. Dynam., 3, 1311–1340, https://doi.org/10.5194/wcd-3-1311-2022, 2022. a, b
Faranda, D., Messori, G., Jezequel, A., Vrac, M., and Yiou, P.: Atmospheric Circulation Compounds Anthropogenic Warming and Impacts of Climate Extremes in Europe, P. Natl. Acad. Sci. USA, 120, e2214525120, https://doi.org/10.1073/pnas.2214525120, 2023. a
Feng, Z.: PyFLEXTRKR Initial Public Release Codes, Zenodo [code] https://doi.org/10.5281/zenodo.7429446, 2022. a
Feng, Z., Leung, L. R., Liu, N., Wang, J., Houze Jr, R. A., Li, J., Hardin, J. C., Chen, D., and Guo, J.: A Global High-Resolution Mesoscale Convective System Database Using Satellite-Derived Cloud Tops, Surface Precipitation, and Tracking, J. Geophys. Res.-Atmos., 126, e2020JD034202, https://doi.org/10.1029/2020JD034202, 2021. a, b
Feng, Z., Varble, A., Hardin, J., Marquis, J., Hunzinger, A., Zhang, Z., and Thieman, M.: Deep Convection Initiation, Growth, and Environments in the Complex Terrain of Central Argentina during CACTI, Mon. Weather Rev., 150, 1135–1155, https://doi.org/10.1175/MWR-D-21-0237.1, 2022. a
Feng, Z., Hardin, J., Barnes, H. C., Li, J., Leung, L. R., Varble, A., and Zhang, Z.: PyFLEXTRKR: a flexible feature tracking Python software for convective cloud analysis, Geosci. Model Dev., 16, 2753–2776, https://doi.org/10.5194/gmd-16-2753-2023, 2023a. a, b
Feng, Z., Leung, L. R., Hardin, J., Terai, C. R., Song, F., and Caldwell, P.: Mesoscale Convective Systems in DYAMOND Global Convection-Permitting Simulations, Geophys. Res. Lett., 50, e2022GL102603, https://doi.org/10.1029/2022GL102603, 2023b. a
Freitas, A. C. M., Freitas, J. M., and Todd, M.: Hitting time statistics and extreme value theory, Probab. Theory Rel., 147, 675–710, 2010. a
Freitas, A. C. M., Freitas, J. M., and Todd, M.: Extreme value laws in dynamical systems for non-smooth observations, J. Stat. Phys., 142, 108–126, 2011. a
Freitas, A. C. M., Freitas, J. M., and Vaienti, S.: Extreme Value Laws for sequences of intermittent maps, arXiv [preprint], https://doi.org/10.48550/arXiv.1605.06287, 2016. a
Fujita, T. T.: Manual of Downburst Identification for Project NIMROD [National Intensive Meteorological Research on Downburst], Tech. Rep., Satellite and Mesometeorology Research Project, Dept. of the Geophysical Sciences, University of Chicago, https://ntrs.nasa.gov/citations/19780022828 (last access: 19 March 2024), 1978. a
Fujita, T. T. and Wakimoto, R. M.: Five Scales of Airflow Associated with a Series of Downbursts on 16 July 1980, Mon. Weather Rev., 109, 1438–1456, https://doi.org/10.1175/1520-0493(1981)109<1438:FSOAAW>2.0.CO;2, 1981. a
Fumière, Q., Déqué, M., Nuissier, O., Somot, S., Alias, A., Caillaud, C., Laurantin, O., and Seity, Y.: Extreme Rainfall in Mediterranean France during the Fall: Added Value of the CNRM-AROME Convection-Permitting Regional Climate Model, Clim. Dynam., 55, 77–91, https://doi.org/10.1007/s00382-019-04898-8, 2020. a
Gatzen, C.: A Derecho in Europe: Berlin, 10 July 2002, Weather Forecast., 19, 639–645, https://doi.org/10.1175/1520-0434(2004)019<0639:ADIEBJ>2.0.CO;2, 2004. a, b
Gatzen, C.: Warm-Season Severe Wind Events in Germany, Atmos. Res., 123, 197–205, https://doi.org/10.1016/j.atmosres.2012.07.017, 2013. a
Gatzen, C. P., Fink, A. H., Schultz, D. M., and Pinto, J. G.: An 18-year climatology of derechos in Germany, Nat. Hazards Earth Syst. Sci., 20, 1335–1351, https://doi.org/10.5194/nhess-20-1335-2020, 2020. a, b, c, d, e, f, g, h, i, j, k, l, m, n, o
Gensini, V. A. and Mote, T. L.: Downscaled Estimates of Late 21st Century Severe Weather from CCSM3, Climatic Change, 129, 307–321, https://doi.org/10.1007/s10584-014-1320-z, 2015. a, b
Gensini, V. A., Haberlie, A. M., and Ashley, W. S.: Convection-Permitting Simulations of Historical and Possible Future Climate over the Contiguous United States, Clim. Dynam., 60, 109–126, https://doi.org/10.1007/s00382-022-06306-0, 2023. a, b
Glazer, R. H., Torres-Alavez, J. A., Coppola, E., Giorgi, F., Das, S., Ashfaq, M., and Sines, T.: Projected Changes to Severe Thunderstorm Environments as a Result of Twenty-First Century Warming from RegCM CORDEX-CORE Simulations, Clim. Dynam., 57, 1595–1613, https://doi.org/10.1007/s00382-020-05439-4, 2021. a
González-Alemán, J. J., Insua-Costa, D., Bazile, E., González-Herrero, S., Miglietta, M. M., Groenemeijer, P., and Donat, M. G.: Anthropogenic Warming Had a Crucial Role in Triggering the Historic and Destructive Mediterranean Derecho in Summer 2022, B. Am. Meteorol. Soc., 104, E1526–E1532, https://doi.org/10.1175/BAMS-D-23-0119.1, 2023. a, b
Groenemeijer, P., Púčik, T., Holzer, A. M., Antonescu, B., Riemann-Campe, K., Schultz, D. M., Kühne, T., Feuerstein, B., Brooks, H. E., Doswell, C. A., Koppert, H.-J., and Sausen, R.: Severe Convective Storms in Europe: Ten Years of Research and Education at the European Severe Storms Laboratory, B. Am. Meteorol. Soc., 98, 2641–2651, https://doi.org/10.1175/BAMS-D-16-0067.1, 2017. a
Guastini, C. T. and Bosart, L. F.: Analysis of a Progressive Derecho Climatology and Associated Formation Environments, Mon. Weather Rev., 144, 1363–1382, https://doi.org/10.1175/MWR-D-15-0256.1, 2016. a, b
Hamid, K.: Investigation of the Passage of a Derecho in Belgium, Atmos. Res., 107, 86–105, https://doi.org/10.1016/j.atmosres.2011.12.013, 2012. a, b
Hersbach, H., Bell, B., Berrisford, P., Hirahara, S., Horányi, A., Muñoz-Sabater, J., Nicolas, J., Peubey, C., Radu, R., Schepers, D., Simmons, A., Soci, C., Abdalla, S., Abellan, X., Balsamo, G., Bechtold, P., Biavati, G., Bidlot, J., Bonavita, M., De Chiara, G., Dahlgren, P., Dee, D., Diamantakis, M., Dragani, R., Flemming, J., Forbes, R., Fuentes, M., Geer, A., Haimberger, L., Healy, S., Hogan, R. J., Hólm, E., Janisková, M., Keeley, S., Laloyaux, P., Lopez, P., Lupu, C., Radnoti, G., de Rosnay, P., Rozum, I., Vamborg, F., Villaume, S., and Thépaut, J.-N.: The ERA5 Global Reanalysis, Q. J. Roy. Meteor. Soc., 146, 1999–2049, https://doi.org/10.1002/qj.3803, 2020. a, b
Hersbach, H., Bell, B., Berrisford, P., Biavati, G., Horányi, A., Muñoz Sabater, J., Nicolas, J., Peubey, C., Radu, R., Rozum, I., Schepers, D., Simmons, A., Soci, C., Dee, D., and Thépaut, J.-N.: ERA5 hourly data on single levels from 1940 to present, Copernicus Climate Change Service (C3S) Climate Data Store (CDS) [data set], https://doi.org/10.24381/cds.adbb2d47, 2023a. a
Hersbach, H., Bell, B., Berrisford, P., Biavati, G., Horányi, A., Muñoz Sabater, J., Nicolas, J., Peubey, C., Radu, R., Rozum, I., Schepers, D., Simmons, A., Soci, C., Dee, D., and Thépaut, J.-N.: ERA5 hourly data on pressure levels from 1940 to present, Copernicus Climate Change Service (C3S) Climate Data Store (CDS) [data set], https://doi.org/10.24381/cds.bd0915c6, 2023b. a
Hinrichs, G.: Tornadoes and Derechos, The American Meteorological Journal, 5, 306–317, 341–349, 385–393, 1888. a, b
Hochman, A., Alpert, P., Harpaz, T., Saaroni, H., and Messori, G.: A new dynamical systems perspective on atmospheric predictability: Eastern Mediterranean weather regimes as a case study, Science Advances, 5, eaau0936, https://doi.org/10.1126/sciadv.aau0936, 2019. a
Holley, D., Dorling, S., Steele, C., and Earl, N.: A climatology of convective available potential energy in Great Britain, Int. J. Climatol., 34, 3811–3824, 2014. a
Holton, J. R. and Hakim, G. J.: An Introduction to Dynamic Meteorology, 5th edition edn., Academic Press, Amsterdam, ISBN 978-0-12-384866-6, 2013. a
Houze, R. A.: 100 Years of Research on Mesoscale Convective Systems, Meteor. Mon., 59, 17.1–17.54, https://doi.org/10.1175/AMSMONOGRAPHS-D-18-0001.1, 2018. a
Huang, B., Thorne, P. W., Banzon, V. F., Boyer, T., Chepurin, G., Lawrimore, J. H., Menne, M. J., Smith, T. M., Vose, R. S., and Zhang, H.-M.: Extended reconstructed sea surface temperature, version 5 (ERSSTv5): upgrades, validations, and intercomparisons, J. Climate, 30, 8179–8205, 2017. a
Huffman, G., Stocker, E., Bolvin, D., Nelkin, E., and Jackson, T.: GPM IMERG Final Precipitation L3 Half Hourly 0.1 degree × 0.1 degree V06, Greenbelt, MD, Goddard Earth Sciences Data and Information Services Center (GES DISC) [data set], https://doi.org/10.5067/GPM/IMERG/3B-HH/06, 2019. a, b
Hurrell, J. W. and Deser, C.: North Atlantic Climate Variability: The Role of the North Atlantic Oscillation, J. Marine Syst., 79, 231–244, https://doi.org/10.1016/j.jmarsys.2009.11.002, 2010. a
Hurrell, J. W., Kushnir, Y., Ottersen, G., and Visbeck, M.: An overview of the North Atlantic oscillation, Geophys. Monogr. Ser., 134, 1–35, https://doi.org/10.1029/134GM01, 2003. a
Huuskonen, A., Saltikoff, E., and Holleman, I.: The Operational Weather Radar Network in Europe, B. Am. Meteorol. Soc., 95, 897–907, https://doi.org/10.1175/BAMS-D-12-00216.1, 2014. a
Intergovernmental Panel On Climate Change (IPCC): Climate Change 2021 – The Physical Science Basis: Working Group I Contribution to the Sixth Assessment Report of the Intergovernmental Panel on Climate Change, 1 edn., Cambridge University Press, ISBN 978-1-00-915789-6, https://doi.org/10.1017/9781009157896, 2023. a, b
Janowiak, J., Joyce, B., and Xie, P.: NCEP/CPC L3 Half Hourly 4 km Global (60° S–60° N) Merged IR V1, Edited by Andrey Savtchenko, Greenbelt, MD, Goddard Earth Sciences Data and Information Services Center (GES DISC) [data set], https://doi.org/10.5067/P4HZB9N27EKU, 2017. a, b
Johns, R. H. and Evans, J. S.: Comments on “A Climatology of Derecho-Producing Mesoscale Convective Systems in the Central and Eastern United States, 1986–95. Part I: Temporal and Spatial Distribution”, B. Am. Meteorol. Soc., 81, 1049–1054, 2000. a
Johns, R. H. and Hirt, W. D.: The Derecho of July 19–20, 1983. A Case Study, National Weather Digest, 10, 17–32, 1985. a
Johns, R. H. and Hirt, W. D.: Derechos: Widespread Convectively Induced Windstorms, Weather Forecast., 2, 32–49, https://doi.org/10.1175/1520-0434(1987)002<0032:DWCIW>2.0.CO;2, 1987. a, b, c, d
KNMI Climate Explorer: ERA5 reanalysis preprocessed, KNMI Climate Explorer [data set], https://climexp.knmi.nl/selectdailyfield2.cgi?id=someone@somewhere (last access: 19 March 2024), 2024. a
Kunkel, K. E., Karl, T. R., Brooks, H., Kossin, J., Lawrimore, J. H., Arndt, D., Bosart, L., Changnon, D., Cutter, S. L., Doesken, N., Emanuel, K., Groisman, P. Y., Katz, R. W., Knutson, T., O'Brien, J., Paciorek, C. J., Peterson, T. C., Redmond, K., Robinson, D., Trapp, J., Vose, R., Weaver, S., Wehner, M., Wolter, K., and Wuebbles, D.: Monitoring and Understanding Trends in Extreme Storms: State of Knowledge, B. Am. Meteorol. Soc., 94, 499–514, https://doi.org/10.1175/BAMS-D-11-00262.1, 2013. a, b
Lewis, M. W. and Gray, S. L.: Categorisation of synoptic environments associated with mesoscale convective systems over the UK, Atmos. Res., 97, 194–213, 2010. a
Liebovitch, L. S. and Toth, T.: A fast algorithm to determine fractal dimensions by box counting, Phys. Lett. A, 141, 386–390, 1989. a
López, J. M.: A Mediterranean Derecho: Catalonia (Spain), 17th August 2003, Atmos. Res., 83, 272–283, https://doi.org/10.1016/j.atmosres.2005.08.008, 2007. a, b
Lucarini, V., Faranda, D., and Wouters, J.: Universal behaviour of extreme value statistics for selected observables of dynamical systems, J. Stat. Phys., 147, 63–73, 2012. a
Lucarini, V., Faranda, D., Freitas, A. C. M., Freitas, J. M., Holland, M., Kuna, T., Nicol, M., Todd, M., and Vaienti, S.: Extremes and recurrence in dynamical systems, John Wiley & Sons, ISBN 1-118-63219-2, 2016. a
Markowski, P. and Richardson, Y.: Mesoscale Meteorology in Midlatitudes, 1 edn., Wiley, ISBN 978-0-470-74213-6 978-0-470-68210-4, https://doi.org/10.1002/9780470682104, 2010. a, b, c
Mathias, L., Ludwig, P., and Pinto, J. G.: Synoptic-scale conditions and convection-resolving hindcast experiments of a cold-season derecho on 3 January 2014 in western Europe, Nat. Hazards Earth Syst. Sci., 19, 1023–1040, https://doi.org/10.5194/nhess-19-1023-2019, 2019. a
Meredith, E. P., Maraun, D., Semenov, V. A., and Park, W.: Evidence for Added Value of Convection-Permitting Models for Studying Changes in Extreme Precipitation, J. Geophys. Res.-Atmos., 120, 12500–12513, https://doi.org/10.1002/2015JD024238, 2015. a
Messori, G., Caballero, R., and Faranda, D.: A dynamical systems approach to studying midlatitude weather extremes, Geophys. Res. Lett., 44, 3346–3354, 2017. a
Météo-France: API Observations Package, https://portail-api.meteofrance.fr/web/en/api/DonneesPubliquesPaquetObservation (last access: 19 March 2024), 2024. a
Mohr, S., Wandel, J., Lenggenhager, S., and Martius, O.: Relationship between Atmospheric Blocking and Warm-Season Thunderstorms over Western and Central Europe, Q. J. Roy. Meteor. Soc., 145, 3040–3056, https://doi.org/10.1002/qj.3603, 2019. a
Moloney, N. R., Faranda, D., and Sato, Y.: An overview of the extremal index, Chaos: An Interdisciplinary Journal of Nonlinear Science, 29, 022101, https://doi.org/10.1063/1.5079656, 2019. a, b
Morel, C. and Senesi, S.: A Climatology of Mesoscale Convective Systems over Europe Using Satellite Infrared Imagery. II: Characteristics of European Mesoscale Convective Systems, Q. J. Roy. Meteor. Soc., 128, 1973–1995, https://doi.org/10.1256/003590002320603494, 2002. a, b
Morris, R.: The Spanish plume-testing the forecasters nerve, Meteorol. Mag., 115, 349–357, 1986. a
National Academies of Sciences, Engineering and Medicine: Attribution of Extreme Weather Events in the Context of Climate Change, The National Academies Press, Washington, DC, ISBN 978-0-309-38094-2, https://doi.org/10.17226/21852, 2016. a
NCEI and NOAA – National Centers for Environmental Information and National Oceanic and Atmospheric Administration: Global Hourly – Integrated Surface Database (ISD), NCEI and NOAA [data set], https://www.ncei.noaa.gov/data/global-hourly/ (last access: 19 March 2024), 2024. a
Nobre, G. G., Jongman, B., Aerts, J., and Ward, P. J.: The role of climate variability in extreme floods in Europe, Environ. Res. Lett., 12, 084012, https://doi.org/10.1088/1748-9326/aa7c22, 2017. a, b, c
Nolen, R. H.: A Radar Pattern Associated with Tornadoes, B. Am. Meteorol. Soc., 40, 277–279, https://doi.org/10.1175/1520-0477-40.6.277, 1959. a
Pearson, K.: X. On the criterion that a given system of deviations from the probable in the case of a correlated system of variables is such that it can be reasonably supposed to have arisen from random sampling, The London, Edinburgh, and Dublin Philosophical Magazine and Journal of Science, 50, 157–175, 1900. a
Pichelli, E., Coppola, E., Sobolowski, S., Ban, N., Giorgi, F., Stocchi, P., Alias, A., Belušić, D., Berthou, S., Caillaud, C., Cardoso, R. M., Chan, S., Christensen, O. B., Dobler, A., de Vries, H., Goergen, K., Kendon, E. J., Keuler, K., Lenderink, G., Lorenz, T., Mishra, A. N., Panitz, H.-J., Schär, C., Soares, P. M. M., Truhetz, H., and Vergara-Temprado, J.: The First Multi-Model Ensemble of Regional Climate Simulations at Kilometer-Scale Resolution Part 2: Historical and Future Simulations of Precipitation, Clim. Dynam., 56, 3581–3602, https://doi.org/10.1007/s00382-021-05657-4, 2021. a
Pilguj, N., Taszarek, M., Allen, J. T., and Hoogewind, K. A.: Are Trends in Convective Parameters over the United States and Europe Consistent between Reanalyses and Observations?, J. Climate, 35, 3605–3626, https://doi.org/10.1175/jcli-d-21-0135.1, 2022. a, b, c
Piper, D. A., Kunz, M., Allen, J. T., and Mohr, S.: Investigation of the Temporal Variability of Thunderstorms in Central and Western Europe and the Relation to Large-Scale Flow and Teleconnection Patterns, Q. J. Roy. Meteor. Soc., 145, 3644–3666, https://doi.org/10.1002/qj.3647, 2019. a, b, c, d, e
Púčik, T., Francová, M., Rýva, D., Kolář, M., and Ronge, L.: Forecasting Challenges during the Severe Weather Outbreak in Central Europe on 25 June 2008, Atmos. Res., 100, 680–704, https://doi.org/10.1016/j.atmosres.2010.11.014, 2011. a
Púčik, T., Groenemeijer, P., Rýva, D., and Kolář, M.: Proximity Soundings of Severe and Nonsevere Thunderstorms in Central Europe, Mon. Weather Rev., 143, 4805–4821, https://doi.org/10.1175/MWR-D-15-0104.1, 2015. a
Púčik, T., Groenemeijer, P., Rädler, A. T., Tijssen, L., Nikulin, G., Prein, A. F., van Meijgaard, E., Fealy, R., Jacob, D., and Teichmann, C.: Future Changes in European Severe Convection Environments in a Regional Climate Model Ensemble, J. Climate, 30, 6771–6794, https://doi.org/10.1175/JCLI-D-16-0777.1, 2017. a
Punkka, A.-J., Teittinen, J., and Johns, R. H.: Synoptic and Mesoscale Analysis of a High-Latitude Derecho – Severe Thunderstorm Outbreak in Finland on 5 July 2002, Weather Forecast., 21, 752–763, https://doi.org/10.1175/WAF953.1, 2006. a
Rädler, A. T., Groenemeijer, P. H., Faust, E., Sausen, R., and Púčik, T.: Frequency of Severe Thunderstorms across Europe Expected to Increase in the 21st Century Due to Rising Instability, npj Climate and Atmospheric Science, 2, 1–5, https://doi.org/10.1038/s41612-019-0083-7, 2019. a
Ribes, A., Thao, S., Vautard, R., Dubuisson, B., Somot, S., Colin, J., Planton, S., and Soubeyroux, J.-M.: Observed Increase in Extreme Daily Rainfall in the French Mediterranean, Clim. Dynam., 52, 1095–1114, https://doi.org/10.1007/s00382-018-4179-2, 2019. a, b
Sarkar, N. and Chaudhuri, B. B.: An efficient differential box-counting approach to compute fractal dimension of image, IEEE T. Syst. Man Cyb., 24, 115–120, 1994. a
Schulz, W., Diendorfer, G., Pedeboy, S., and Poelman, D. R.: The European lightning location system EUCLID – Part 1: Performance analysis and validation, Nat. Hazards Earth Syst. Sci., 16, 595–605, https://doi.org/10.5194/nhess-16-595-2016, 2016. a
Schumacher, R. S. and Rasmussen, K. L.: The Formation, Character and Changing Nature of Mesoscale Convective Systems, Nature Reviews Earth & Environment, 1, 300–314, https://doi.org/10.1038/s43017-020-0057-7, 2020. a, b, c, d, e
Smith, A., Lott, N., and Vose, R.: The integrated surface database: Recent developments and partnerships, B. Am. Meteorol. Soc., 92, 704–708, 2011. a
Squitieri, B. J., Wade, A. R., and Jirak, I. L.: A Historical Overview on the Science of Derechos. Part 1: Identification, Climatology, and Societal Impacts, B. Am. Meteorol. Soc., 104, E1709–E1733, https://doi.org/10.1175/BAMS-D-22-0217.1, 2023a. a, b, c
Squitieri, B. J., Wade, A. R., and Jirak, I. L.: A Historical Overview on the Science of Derechos. Part 2: Parent Storm Structure, Environmental Conditions, and History of Numerical Forecasts, B. Am. Meteorol. Soc., 104, E1734–E1763, https://doi.org/10.1175/BAMS-D-22-0278.1, 2023b. a
Stein, C. and Wald, A.: Sequential confidence intervals for the mean of a normal distribution with known variance, Ann. Math. Stat., 18, 427–433, 1947. a
Stocchi, P., Pichelli, E., Torres Alavez, J. A., Coppola, E., Giuliani, G., and Giorgi, F.: Non-Hydrostatic Regcm4 (Regcm4-NH): Evaluation of Precipitation Statistics at the Convection-Permitting Scale over Different Domains, Atmosphere, 13, 861, https://doi.org/10.3390/atmos13060861, 2022. a
Süveges, M.: Likelihood estimation of the extremal index, Extremes, 10, 41–55, 2007. a
Taszarek, M., Allen, J., Púčik, T., Groenemeijer, P., Czernecki, B., Kolendowicz, L., Lagouvardos, K., Kotroni, V., and Schulz, W.: A Climatology of Thunderstorms across Europe from a Synthesis of Multiple Data Sources, J. Climate, 32, 1813–1837, https://doi.org/10.1175/JCLI-D-18-0372.1, 2019. a
Taszarek, M., Allen, J. T., Groenemeijer, P., Edwards, R., Brooks, H. E., Chmielewski, V., and Enno, S.-E.: Severe Convective Storms across Europe and the United States. Part I: Climatology of Lightning, Large Hail, Severe Wind, and Tornadoes, J. Climate, 33, 10239–10261, https://doi.org/10.1175/JCLI-D-20-0345.1, 2020a. a, b, c, d
Taszarek, M., Allen, J. T., Púčik, T., Hoogewind, K. A., and Brooks, H. E.: Severe Convective Storms across Europe and the United States. Part II: ERA5 Environments Associated with Lightning, Large Hail, Severe Wind, and Tornadoes, J. Climate, 33, 10263–10286, https://doi.org/10.1175/JCLI-D-20-0346.1, 2020b. a
Taszarek, M., Allen, J. T., Brooks, H. E., Pilguj, N., and Czernecki, B.: Differing Trends in United States and European Severe Thunderstorm Environments in a Warming Climate, B. Am. Meteorol. Soc., 102, E296–E322, https://doi.org/10.1175/BAMS-D-20-0004.1, 2021a. a, b, c, d, e
Taszarek, M., Allen, J. T., Marchio, M., and Brooks, H. E.: Global Climatology and Trends in Convective Environments from ERA5 and Rawinsonde Data, npj Climate and Atmospheric Science, 4, 35, https://doi.org/10.1038/s41612-021-00190-x, 2021b. a, b, c
Taszarek, M., Pilguj, N., Allen, J. T., Gensini, V., Brooks, H. E., and Szuster, P.: Comparison of Convective Parameters Derived from ERA5 and MERRA-2 with Rawinsonde Data over Europe and North America, J. Climate, 34, 3211–3237, https://doi.org/10.1175/JCLI-D-20-0484.1, 2021c. a
Thorne, P. W. and Vose, R. S.: Reanalyses Suitable for Characterizing Long-Term Trends, B. Am. Meteorol. Soc., 91, 353–362, https://doi.org/10.1175/2009BAMS2858.1, 2010. a
Tippett, M. K., Allen, J. T., Gensini, V. A., and Brooks, H. E.: Climate and Hazardous Convective Weather, Current Climate Change Reports, 1, 60–73, https://doi.org/10.1007/s40641-015-0006-6, 2015. a
Trapp, R. J., Diffenbaugh, N. S., Brooks, H. E., Baldwin, M. E., Robinson, E. D., and Pal, J. S.: Changes in Severe Thunderstorm Environment Frequency during the 21st Century Caused by Anthropogenically Enhanced Global Radiative Forcing, P. Natl. Acad. Sci. USA, 104, 19719–19723, https://doi.org/10.1073/pnas.0705494104, 2007. a
Trenberth, K. E., Fasullo, J. T., and Shepherd, T. G.: Attribution of Climate Extreme Events, Nat. Clim. Change, 5, 725–730, https://doi.org/10.1038/nclimate2657, 2015. a
UERRA: Major Deliverable Reports, http://www.uerra.eu (last access: 19 March 2024), 2024. a
van Delden, A.: The Synoptic Setting of Thunderstorms in Western Europe, Atmos. Res., 56, 89–110, https://doi.org/10.1016/S0169-8095(00)00092-2, 2001. a, b
van den Broeke, M. S., Schultz, D. M., Johns, R. H., Evans, J. S., and Hales, J. E.: Cloud-to-Ground Lightning Production in Strongly Forced, Low-Instability Convective Lines Associated with Damaging Wind, Weather Forecast., 20, 517–530, https://doi.org/10.1175/WAF876.1, 2005. a
Vautard, R., Cattiaux, J., Happé, T., Singh, J., Bonnet, R., Cassou, C., Coumou, D., D'Andrea, F., Faranda, D., Fischer, E., Ribes, A., Sippel, S., and Yiou, P.: Heat Extremes in Western Europe Increasing Faster than Simulated Due to Atmospheric Circulation Trends, Nat. Commun., 14, 6803, https://doi.org/10.1038/s41467-023-42143-3, 2023. a
Wei, W., Yan, Z., and Li, Z.: Influence of Pacific Decadal Oscillation on Global Precipitation Extremes, Environ. Res. Lett., 16, 044031, https://doi.org/10.1088/1748-9326/abed7c, 2021. a, b
Wikipedia: 2022 European derecho, https://en.wikipedia.org/wiki/2022_European_derecho (last access: 4 January 2023), 2023. a
Yang, Q., Houze Jr, R. A., Leung, L. R., and Feng, Z.: Environments of Long-Lived Mesoscale Convective Systems Over the Central United States in Convection Permitting Climate Simulations, J. Geophys. Res.-Atmos., 122, 13288–13307, https://doi.org/10.1002/2017JD027033, 2017. a, b
Zampieri, M., Toreti, A., Schindler, A., Scoccimarro, E., and Gualdi, S.: Atlantic multi-decadal oscillation influence on weather regimes over Europe and the Mediterranean in spring and summer, Global Planet. Change, 151, 92–100, 2017. a, b, c
Zhuang, J., dussin, r., Huard, D., Bourgault, P., Banihirwe, A., Raynaud, S., Malevich, B., Schupfner, M., Filipe, Levang, S., Gauthier, C., Jüling, A., Almansi, M., RichardScottOZ, RondeauG, Rasp, S., Smith, T. J., Stachelek, J., Plough, M., Pierre, Bell, R., Caneill, R., and Li, X.: Pangeo-Data/xESMF: V0.8.2, Zenodo [code], https://doi.org/10.5281/zenodo.8356796, 2023. a
- Abstract
- Introduction
- Data and methods
- Results
- Conclusions
- Appendix A: Predictability and persistence indices
- Appendix B: Detailed results of attribution for all 38 events
- Code availability
- Data availability
- Author contributions
- Competing interests
- Disclaimer
- Acknowledgements
- Financial support
- Review statement
- References
- Supplement