the Creative Commons Attribution 4.0 License.
the Creative Commons Attribution 4.0 License.
 | 18 Jun 2024
Changes in the tropical upper-tropospheric zonal momentum balance due to global warming
Abu Bakar Siddiqui Thakur
Jai Sukhatme
We study the zonal momentum budget of the deep upper tropics in the context of present and future climates. In the zonal mean, as is known, a robust balance exists between the acceleration by the horizontal eddy momentum flux convergence and the deceleration by the mean meridional momentum advection. During summer, climatological stationary Rossby waves over the Asian monsoon longitudes converge westerly momentum into the tropics and are the primary contributors to the eddy term. During winter, anomalous westerly winds over the tropical east Pacific allow extratropical waves to propagate into the deep tropics, where they tend to break and decelerate the flow. When integrated over all longitudes, we find that eddies from these two regions sum constructively in summer and destructively in winter, always yielding a net positive momentum forcing that balances the mean flow term. The state-of-the-art CMIP6 suite qualitatively captures these features in the historical run and shows that the momentum fluxes change due to global warming. In summer, stationary eddy circulations in the Asian monsoon zone weaken in the upper troposphere (UT) but strengthen in the lower stratosphere (LS). Greater upward mass flux from the troposphere forces a stronger divergence and a more intense circulation in the LS following a Sverdrup vorticity balance. We observe this strengthening of summertime tropical and subtropical stationary waves in the LS over all longitudes and verify it in an idealized aquaplanet general circulation model experiment. In winter, we find that eddy westerlies over the east Pacific longitudes decrease in strength due to the expected weakening of the subtropical stationary waves with warming. This causes a significant decrease in the propagation of extratropical waves into this region, along with a drop in eddy potential vorticity fluxes associated with these waves. Thus, apart from the mean meridional flux, which weakens due to the projected weakening of the Hadley cells, our analysis of warming simulations clearly suggests significant and robust changes in the eddy momentum fluxes in the deep tropics. Potential implications of these changes in the context of the zonal mean flow and regional circulations are discussed.
- Article
(9300 KB) - Full-text XML
-
Supplement
(2974 KB) - BibTeX
- EndNote


The zonally averaged zonal momentum budget of the tropical upper troposphere has been the subject of numerous investigations (for example, Lee, 1999; Dima et al., 2005; Kraucunas and Hartmann, 2005). Reanalysis data show that, in the present-day climate, the primary balance is between the acceleration of the zonal mean flow by eddies and the deceleration provided by the seasonally reversing Hadley circulation. While climatological stationary Rossby waves and tropical transients like the Madden–Julian Oscillation (MJO) converge momentum into the tropical latitudes, the Hadley circulation advects momentum out of the tropics, offsetting the eddy acceleration and decelerating the flow (Dima et al., 2005; Lee, 1999). In the annual mean, the deceleration by the mean meridional circulation exceeds the eddy momentum flux convergence from tropical and extratropical sources and leads to tropical upper-tropospheric easterlies (Lee, 1999). There is a strong sense of anti-correlation between these two terms, even on seasonal timescales (Dima et al., 2005; Kelly and Mapes, 2011). In fact, Shaw (2014) noted a similar balance while emphasizing the roles of planetary and sub-planetary-scale eddies in the winter–summer transition of the Northern Hemisphere (NH) circulation.
While a zonal mean perspective is useful, longitudinal asymmetries are inherent characteristics of the Earth system, particularly in the tropics with oceans and landmasses, monsoon regions, and deserts in the same latitude band. These zonal asymmetries are associated with interesting dynamics that are masked by the zonal averaging – for example, the monsoon–desert mechanism (Rodwell and Hoskins, 1996), wherein diabatic heating associated with intense tropical convection forces moist ascent over the Asian monsoon region and corresponding adiabatic descent of dry air over the eastern Sahara and the Mediterranean, leading to desertification of these regions. Further, circulations that average to give the zonal mean Hadley circulation are confined to specific regions where both synoptic and intraseasonal activity are important (Hoskins et al., 2020; Hoskins and Yang, 2021, 2023), and these can be isolated from the divergent component of the horizontal flow (Keyser et al., 1989). In fact, contrary to the zonally symmetric view of the Hadley circulation, Galanti et al. (2022) show that the meridional overturning circulation organizes in clusters with variability on interannual timescales (see also Sun et al., 2019), and Raiter et al. (2020) present a large-scale conveyor belt view of the tropical circulation. Further, the long-term trends of these longitudinally localized meridional overturning circulations exhibit large regional differences (Schwendike et al., 2014).
In the context of global warming, atmospheric circulation changes are a major source of uncertainty in modern-day climate projections (Shepherd, 2014). On regional scales, effects on the hydrological cycle are closely associated with changes in the tropical circulation (Collins et al., 2013; Vallis et al., 2015; Ma et al., 2018). Using thermodynamic arguments, Held and Soden (2006) showed that the increase in globally averaged surface temperatures must be accompanied by a weakening of the circulation (see also Schneider et al., 2010). The weaker circulation is also accompanied by a widening of the tropics, evidence of which has been found in observations (Hu and Fu, 2007; Seidel et al., 2008; Nguyen et al., 2013) and full-complexity and idealized models (Lu et al., 2007; Frierson et al., 2007; Levine and Schneider, 2015). The Hadley cell widens with decreasing meridional temperature gradient (Adam et al., 2014), changes in the subtropical static stability (Frierson et al., 2007), and changing midlatitude baroclinic eddy activity (Chen et al., 2008). Such changes in the latitudinal extent of the tropics imply modifications in local radiative balances, changing precipitation patterns that induce shifts in regional climates and imply drastic impacts to regional ecosystems. However, most studies have analyzed these changes only in the zonal mean. But, warming-related expansion may not be similar across longitudes (Nguyen et al., 2018; Staten et al., 2019). This is embodied in the pronounced longitudinal patterns in sea surface temperature (SST) and precipitation that emerge in response to a spatially uniform increase in CO2 (Xie et al., 2010). Hence, developing a deeper understanding of the zonal momentum balance becomes important since this is intimately tied to the local atmospheric circulations, and there is a possibility that the existing balance may change due to warming.
Further, many climate models develop an El Niño-like SST anomaly in the equatorial Pacific in response to global warming (DiNezio et al., 2009; Xie et al., 2010). Paleoclimate evidence suggests that a similar El Niño-like SST pattern may have existed in past warm climates (Wara et al., 2005; Fedorov et al., 2006). Similar to the zonal mean effects of warming, the El Niño–Southern Oscillation (ENSO) drives hemispherically symmetric climate variations (Seager et al., 2003), although the atmospheric response is different in the two cases (Lu et al., 2008; Tandon et al., 2013). The future state of the tropical Pacific SST has a strong bearing on the climate system because it may reorganize convection in the deep tropics and reshape the Hadley and Walker circulations. A stronger east–west temperature contrast in the tropical Pacific may trigger planetary-scale Rossby waves that cause a localized westerly acceleration and, in an extreme case, cause equatorial superrotation1 (Pierrehumbert, 2000; Tziperman and Farrell, 2009). Recently, it has been shown that stationary eddies in the tropical upper troposphere drive a seasonal superrotation, which is not seen in the annual mean (Zhang and Lutsko, 2022). Such waves may also contribute towards high-latitude warming through poleward heat fluxes (Lee et al., 2011). In fact, global climate model simulations suggest that the upper-tropospheric winds may have transitioned to weak equatorial superrotation in past warm periods (Lan et al., 2023). Further, increased intraseasonal activity of the Madden–Julian Oscillation and the associated eddy fluxes may push the zonal mean flow towards a state of equatorial superrotation (Lee, 1999; Caballero and Huber, 2010; Arnold et al., 2012; Carlson and Caballero, 2016). Again, in the case of extreme equatorial superrotation where the upper-tropospheric westerlies extend down to the surface, the equatorial Pacific SST gradient can weaken, leading to an El Niño-like state (Tziperman and Farrell, 2009). Such ideas have been explored previously using idealized models (Caballero and Carlson, 2018). However, to the best of our knowledge, these ideas are yet to be explored using state-of-the-art model simulations from the IPCC archive.
In this study, we explore the longitudinally dependent momentum budget in the upper tropical troposphere in present-day and future climates by using reanalysis and the CMIP6 suite of warming simulations. There are five sections in the paper. Section 2 contains a description of the data and techniques used in the study. Section 3 highlights that the present-day balance in the tropics is a little more delicate than what has been emphasized in the literature. We use reanalysis data and showcase the longitudinal structure of momentum fluxes as a function of time through the year. We then examine if the historical runs in CMIP6 agree with the present-day reanalysis; indeed, a qualitative agreement allows us to proceed and examine changes in fluxes with warming. In Sect. 4, we study these changes in the various flux terms with CMIP6 projections under global warming. We discuss statistically significant changes in the equatorial mean meridional and eddy fluxes during winter and summer by comparing the historical runs to a warming scenario. Changes in each season, their geographical origins, and possible causes are then brought forth. Section 5 contains a summary of the results and their discussion.
2.1 Data
2.1.1 Present-day climate
The data used in the first part of this study comprise daily-averaged winds at a horizontal resolution of 2.5° across 17 pressure levels (1000, 925, 850, 700, 600, 500, 400, 300, 250, 200, 150, 100, 70, 50, 30, 20, and 10 mbar) from ERA5 (Hersbach et al., 2020) over 43 years from 1979 to 2021. We also make use of monthly mean GPCP precipitation data (Adler et al., 2003) with the same resolution and over the same period.
2.1.2 Future climate
For estimates of the future climate, we make use of full-complexity model simulations from the CMIP6 archive (Eyring et al., 2016). We employ 23 model simulations forced using the Shared Socioeconomic Pathway SSP5–8.5 (ssp585, henceforth referred to as forced in the rest of the paper; O'Neill et al., 2017), along with the historical simulations (henceforth referred to as control), for the assessment of the impact of anthropogenic climate change. SSP5–8.5 represents the upper boundary of the range of scenarios described in the literature, and it is an updated version of the CMIP5 RCP8.5 scenario; by the end of the year 2100, it has an additional radiative forcing of 8.5 W m−2. It must be mentioned that the SSP5–8.5 scenario is now practically implausible (Hausfather and Peters, 2020); however, we use it here as an extreme case of anthropogenic warming. For consistency, we use the first ensemble member (r1i1p1f1) for each model. The models used are listed in Table 1; for each model, we use ua (zonal wind), va (meridional wind), zg (geopotential height), ta (air temperature), and tos (sea surface temperature). ua and va were available as daily output, whereas the rest were monthly averages. While the monthly averaged output was available over 19 pressure levels (1000, 925, 850, 700, 600, 500, 400, 300, 250, 200, 150, 100, 70, 50, 30, 20, 10, 5, and 1 mbar), the daily data were only available over 8 (1000, 850, 700, 500, 250, 100, 50, and 10 mbar). Prior to the calculations, data from each model were interpolated onto a common 2.5°×2.5° grid. The calculations presented here are performed over the years 1980–2000 for the control set and 2080–2100 for the forced set. Flux calculations are performed using daily data. Other results presented use computations with monthly data or by downsampling from daily data. Statistical significance of the changes is tested using a two-tailed Student's t test for the difference between two independent sample means (Wilks, 2011).
Table 1List of models in the ssp585 and historical simulation ensembles used in this study. For all models, the variables used were daily means of ua and va, along with monthly mean ta, zg, and tos. The variable names are as they appear in the IPCC nomenclature.
2.1.3 Aquaplanet simulation
We also utilize aquaplanet simulations using the Community Atmosphere Model (CAM6), the atmospheric component of the Community Earth System Model (CESM v2.1.3; Danabasoglu et al., 2020). We have used the finite-volume dynamical core with a horizontal resolution of 1.9° latitude × 2.5° longitude and 32 vertical levels. To simulate the large-scale monsoon flow, the control run is forced using a stationary wave-1 SST perturbation centered at 30° N superimposed on a zonally symmetric SST distribution shifted to 10° N (Wu and Shaw, 2016), along with perpetual July insolation. The forced simulations are performed by increasing the CO2 concentration to 4 times its reference value with a uniform SST increase of 4 K (Webb et al., 2017). All the other parameters are kept at their default values. Each simulation is run for 3 years, with the first 2 years discarded as spin-up. The results of these simulations are presented in Sect. 4.2.
2.2 Diagnostics
2.2.1 Zonal momentum budget
The zonally averaged zonal momentum equation reads (Dima et al., 2005; Kraucunas and Hartmann, 2005)
The notation above is standard. Square brackets denote a zonal mean, and asterisks denote a deviation from this mean. The first term on the right is the mean meridional advection, the second is the meridional eddy momentum flux convergence, and the third and fourth terms are the mean vertical advection and vertical eddy flux convergence. The last term (X) is a residual and accounts for all sub-grid-scale processes. For day-of-year variations in the zonal momentum budget, daily estimates of each term are calculated, and then these are averaged over the respective days across all the years on record. Since we use daily-averaged data to compute the fluxes, our calculation excludes short-lived, high-frequency activities.
2.2.2 Helmholtz decomposition
For part of our analysis, we make use of a rotational–divergent partition of the flow (Dawson, 2016, https://ajdawson.github.io/windspharm/latest/, last access: October 2023). Treating the horizontal wind field on each pressure level as a two-dimensional vector field, we split it into rotational and divergent components via a Helmholtz decomposition. The horizontal velocity field is expressed as
χ is obtained from the inverse Laplacian of the divergence field, while ψ is obtained by inverting the vorticity field. The first term on the right-hand side describes the divergent component, while the second describes the rotational component. They are denoted by the subscripts “d” and “r”, respectively. Splitting the above equation into its vector components, the zonal and meridional winds can be written as
2.2.3 Wave activity flux
The propagation characteristics of Rossby wave activity are explored through the wave activity flux diagnostic of Plumb (1985) as it appeared in their Eq. (5.7). The wave activity flux Fs takes the form
Here, ψ is the horizontal streamfunction estimated by inverting the vorticity field. When the Wentzel–Kramers–Brillouin (WKB) theory is valid, i.e., when the background flow varies slowly, Fs (≈cg𝒜) is the advective flux of wave activity (𝒜) by the group velocity (cg). For frictionless and adiabatic flow, the wave activity follows the conservation relation:
The divergence and convergence of Fs indicate sources and sinks of wave activity flux. Further, in the zonal mean, the three-dimensional wave activity flux of Plumb (1985) reduces to the Eliassen–Palm flux (Eliassen and Palm, 1961).
3.1 Zonal balance of momentum in the deep upper tropics
The annual cycle of all terms in the zonal mean zonal momentum equation (Eq. 1) for the deep upper tropics is presented in Fig. 1. Consistent with previous studies that focused on yearly or seasonal means (Lee, 1999; Dima et al., 2005), the horizontal eddy and mean terms lead the momentum balance of the tropical upper troposphere. Compared to the rest of the year, these terms are particularly enhanced during the Asian summer monsoon season (June through September, day of year 152–273 in Fig. 1) and are much smaller during the equinoctial seasons.
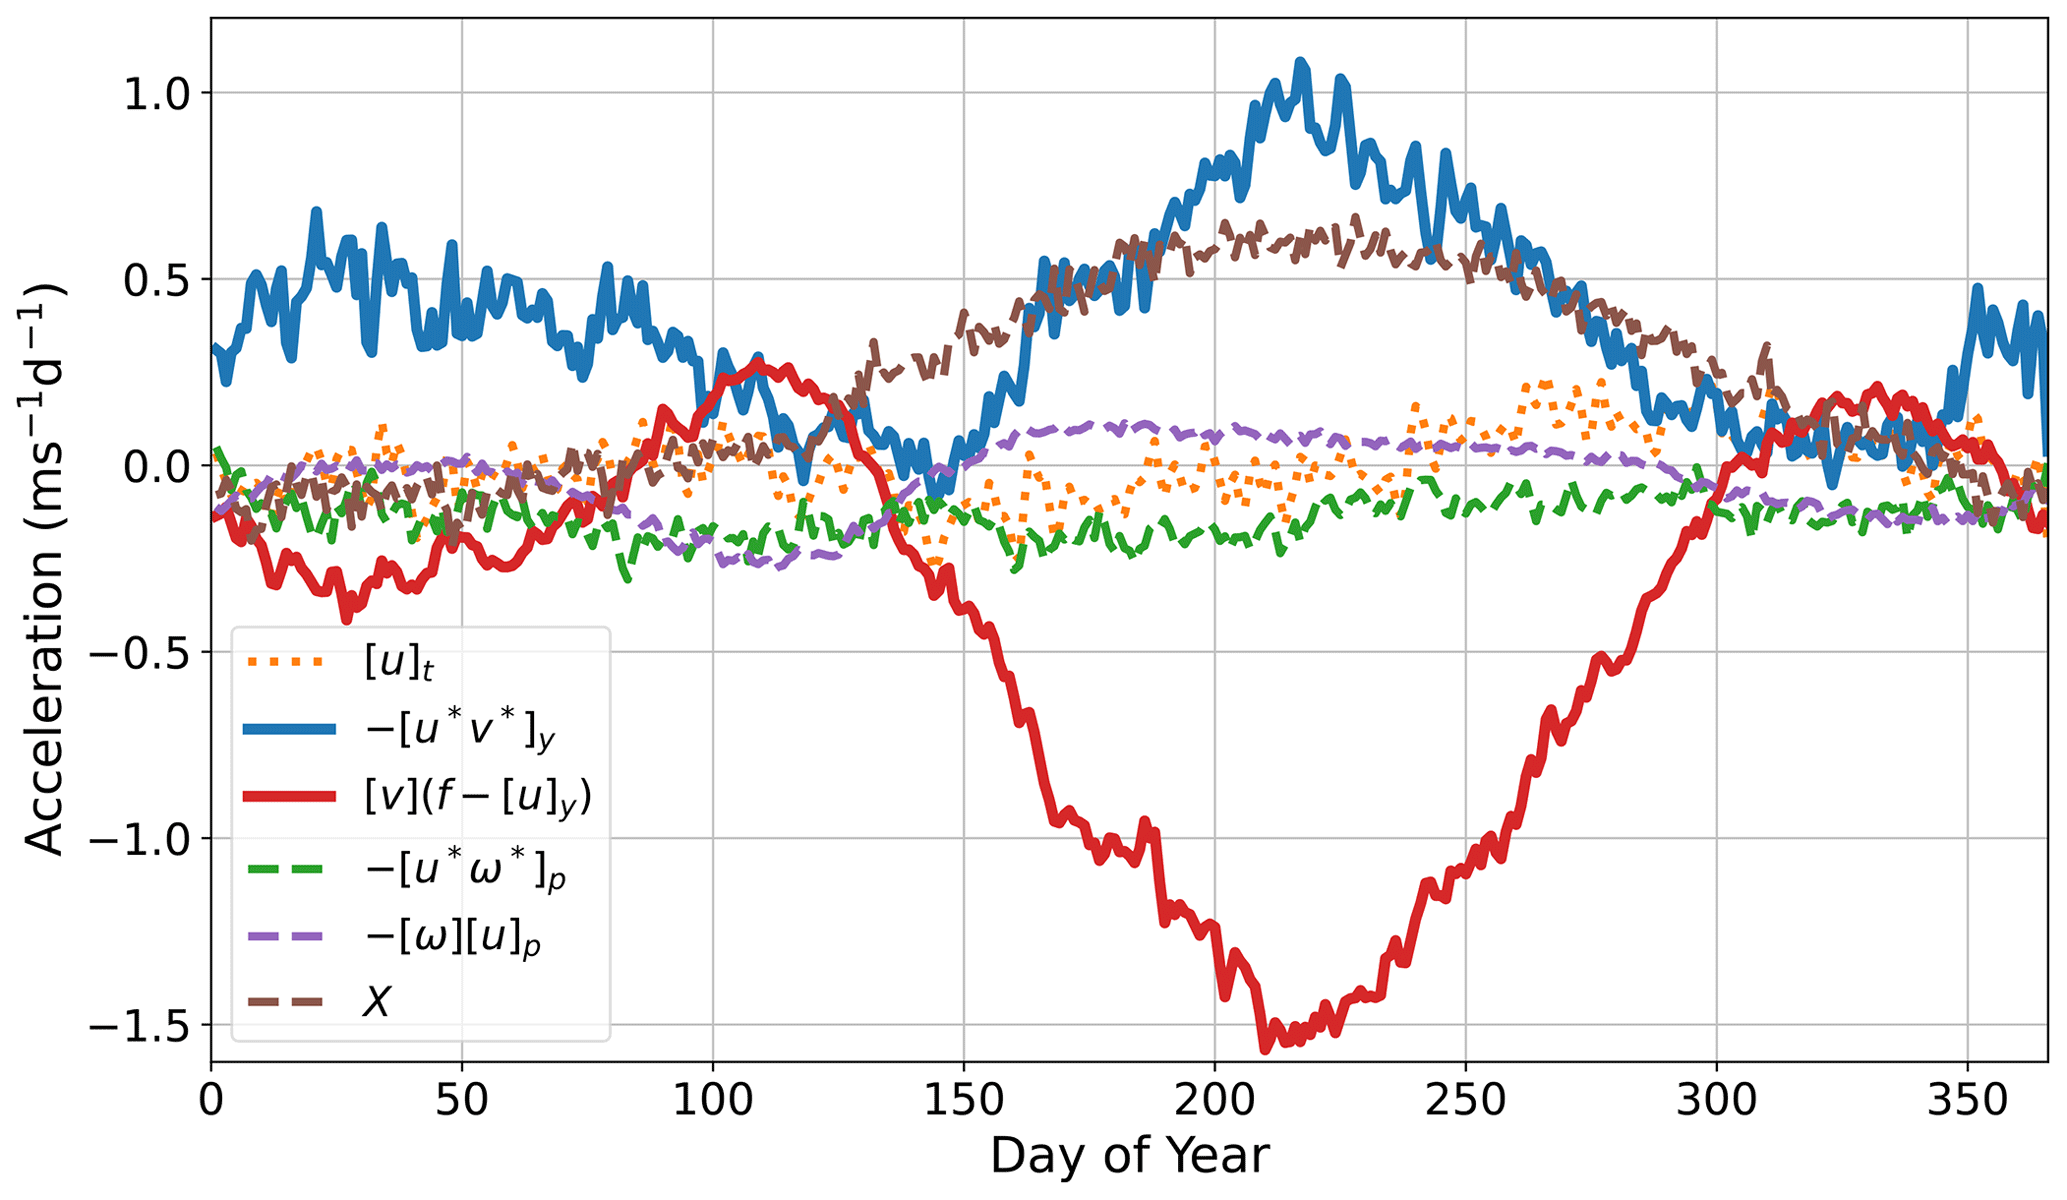
Figure 1Climatological day-of-year variation of each term of the zonally averaged zonal momentum budget, Eq. (1), averaged over 150–300 mbar, ±5° of the Equator.
The two dominant terms exhibit a high degree of anti-correlation over the course of the entire year. Dima et al. (2005) suggested that this tendency arises because the zonally averaged tropical rain bands and eddy forcing occur in the same latitudinal belt. The zonally averaged heating generates a meridional overturning circulation and a resultant upper-tropospheric mass flux divergence, while the eddy forcing results in a convergence of eddy momentum flux into the source region. This line of reasoning is also supported by idealized modeling studies (Kraucunas and Hartmann, 2005, 2007). In fact, Kraucunas and Hartmann (2007) demonstrate that the eddy momentum flux is amplified by the presence of a mean meridional flow and is directed opposite to it. Further, Zurita-Gotor (2019) showed that the tropical eddy momentum flux is largely made up of correlations between zonally anomalous divergent wind and the climatological stationary Rossby gyres. Essentially, a large cross-equatorial Hadley cell flow advects vorticity across hemispheres, forcing a dipolar vortex structure straddling the Equator, which results in the observed eddy momentum flux. Thus, the eddy momentum flux is always anti-correlated with the mean flow response.
The residual (X in Fig. 1) attains a large non-negligible value during the summer (∼0.5 m s−1 d−1) and is much stronger than the other remaining terms. This may be due to intense convective momentum transport that is known to occur over the Indian Ocean–Maritime Continent region during this season (Lin et al., 2008; Yang et al., 2013). However, convective momentum transport is usually modeled as a vertical convergence of zonal eddy momentum flux (Carr and Bretherton, 2001; Lin et al., 2008; Yang et al., 2013), which is an explicit forcing term in our momentum equation (Eq. 1; green dashed curve in Fig. 1). A comparison of the spatial distributions of X and the diabatic heating rate (Fig. S1 in the Supplement) suggests that convective momentum transport by unresolved eddies is an important contributor to the budget residual X in the deep convective regions over the open oceans in the tropics. Indeed, the use of daily-averaged wind fields underestimates the eddy covariances; however, the same calculation using the ERA-Interim dataset (Dee et al., 2011) resulted in a relatively smaller residual (not shown), indicating that the large residual here may be an ERA5 artifact. However, the budget terms in the pressure–latitude plane averaged over the boreal summer season suggest that the residual is much smaller than the horizontal eddy and mean flow terms (Fig. S2). The residual term weakens after the monsoon and becomes comparable in magnitude to the other terms that remain small throughout the year. Given the systematic dominance of the mean meridional advection and eddy momentum flux convergence throughout the year, the discussion that follows focuses entirely on these two terms.
3.2 Longitudinally varying contributions that make up the zonal mean
There has been increasing attention recently on the longitudinally limited portions that make up the zonal mean circulation (Raiter et al., 2020; Hoskins and Yang, 2023). In particular, it has been noted that these longitudinally restricted circulations exhibit variability on interannual timescales (Zhang and Wang, 2013; Sun et al., 2019; Galanti et al., 2022) and may respond differently to greenhouse-gas-induced climate change (Staten et al., 2019). These localized north–south overturning circulations are made up of the divergent component of the meridional wind (Zhang and Wang, 2013; Schwendike et al., 2014); the rotational contribution goes to zero when integrated over a latitude circle because it arises from a zonal gradient of the horizontal streamfunction (Eq. 2). Further, these divergent motions are intimately connected to the local distribution of precipitation. With the consideration that eddy momentum fluxes are fundamentally linked to the mean meridional flow (see Sec. 3.1), we construct a spatial map of the annual mean divergent meridional wind to explore the spatially varying contributions that constitute the robust zonal mean balance of momentum.
Figure 2 shows the annual mean difference between the upper- and lower-tropospheric divergent meridional wind along with contours of annual mean precipitation. Thus, Fig. 2 emphasizes the divergent upper-level motions linked with the monsoonal heating. The largest amount of precipitation is concentrated over the Indian Ocean–Maritime Continent region, collocated with an equatorially symmetric divergent outflow. This structure stretches across more than 120° in the zonal direction and more than 30° on either side of the Equator. A similar but smaller equatorially symmetric structure is visible over the African continent. In the east Pacific and west Atlantic, the precipitation is zonally elongated and off-equatorial, while that over South America has an equatorial peak over Colombia and north-western Brazil; the divergent circulation in this region is largely hemispherically asymmetric. Further, the meridional circulation in the tropical east Pacific is observed to be shallow (Zhang et al., 2004) and is quite different from the canonical picture of the zonal mean hemispherically symmetric Hadley circulation (Schneider, 2006). Based on this preliminary scrutiny, we subjectively partition the tropics into two regions. These are the Asia–Africa region (30–150° W; abbreviated as Af-A) and the central Pacific–west Atlantic region (150–30° W; abbreviated as CP-WA).
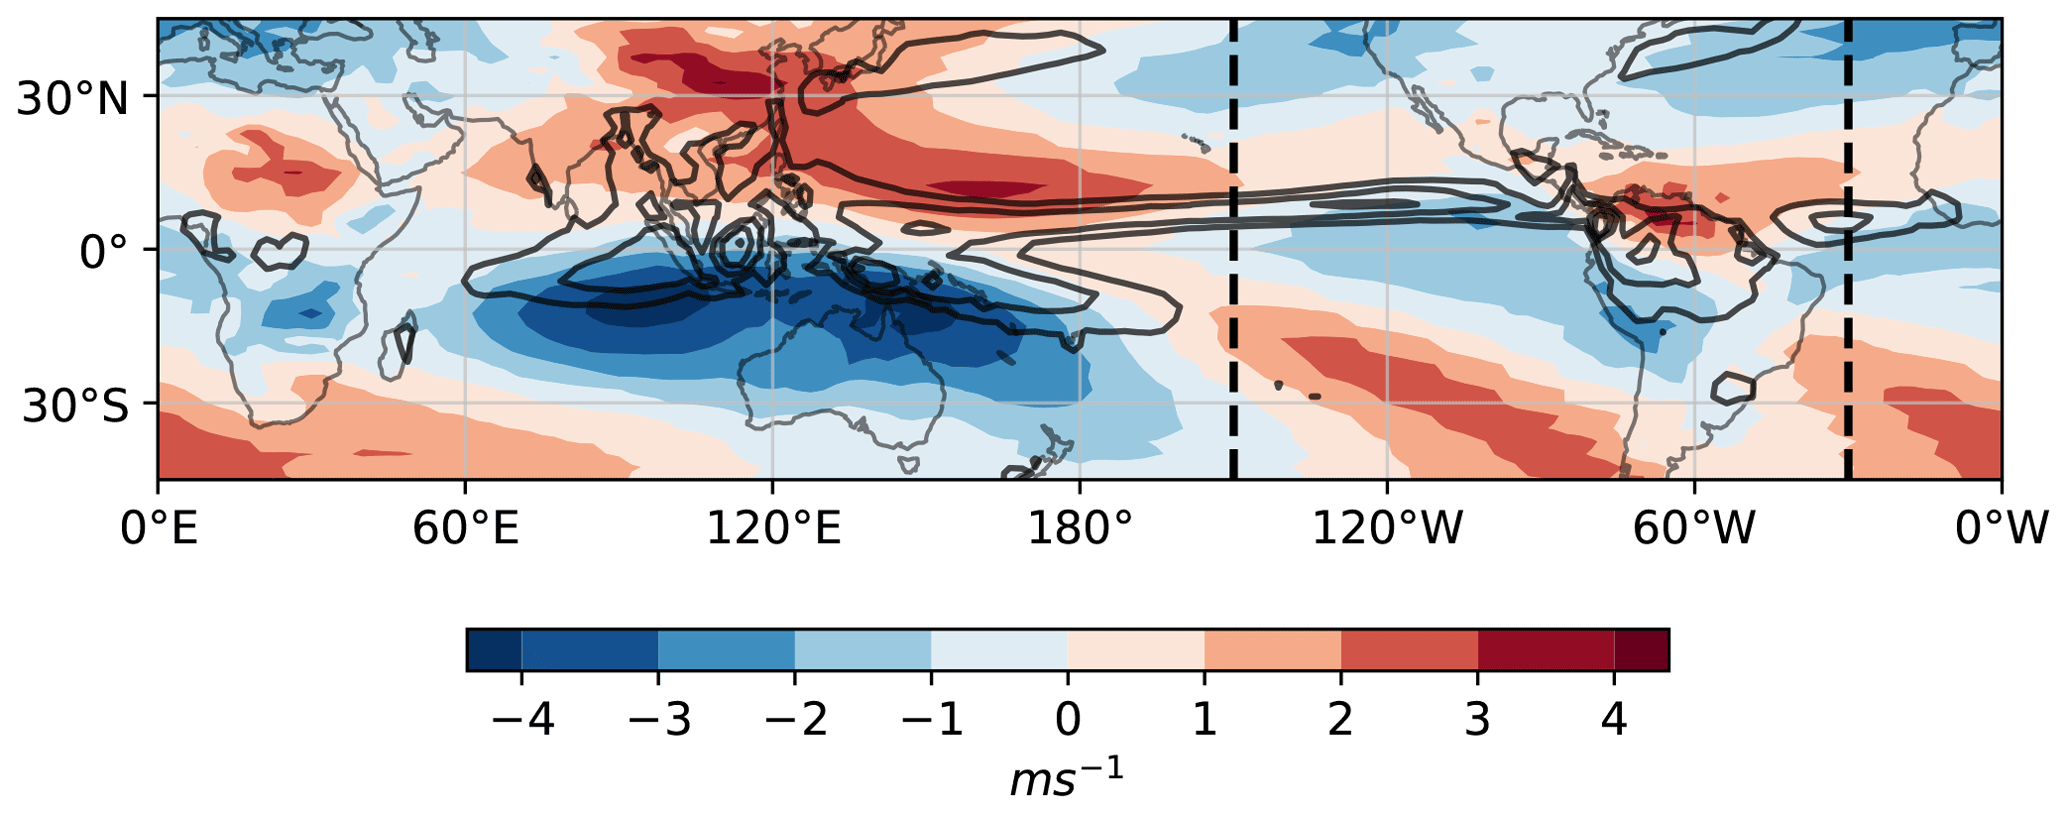
Figure 2Spatial map of the annual mean difference between upper-level (150 mbar) and lower-level (925 mbar) divergent meridional winds (colors), along with time mean precipitation (contours). The contours of precipitation are 5, 7, 9, and 11 mm d−1. Dashed vertical lines demarcate the averaging regions discussed in Sect. 3.2.
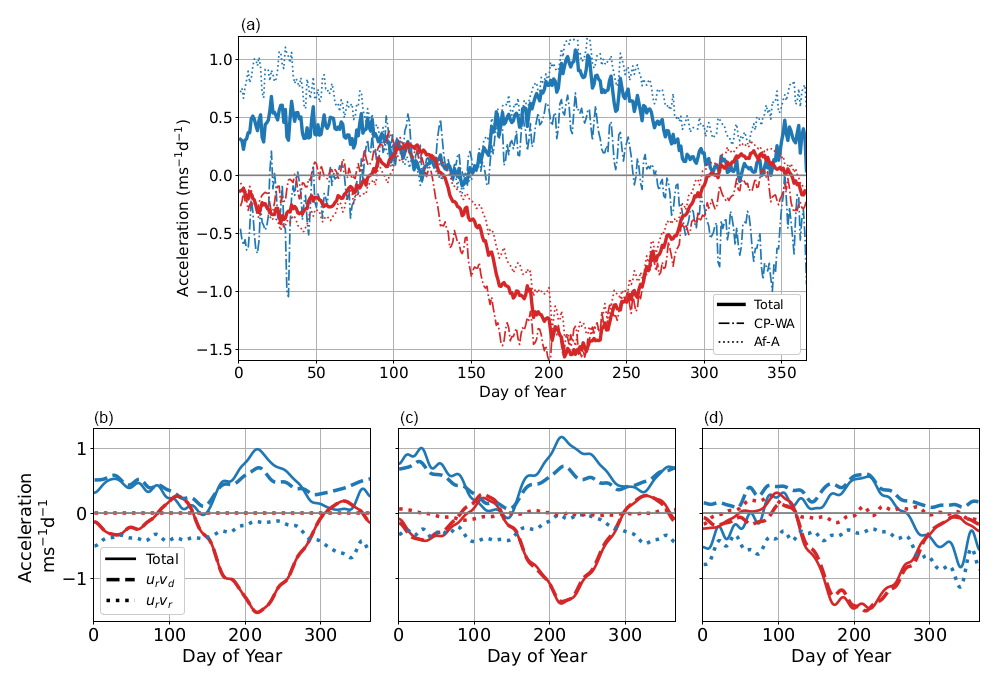
Figure 3Panel (a) shows the climatological day-of-year variation of the horizontal eddy and mean terms of the upper-level momentum balance computed over the global longitudes and over the Af-A and CP-WA sectors. The eddy momentum flux convergence is presented in blue, and the mean meridional advection is presented in red. The eddy and mean momentum terms computed over the Af-A and CP-WA regions are shown in dotted and dash-dotted lines, respectively. The eddy and mean fluxes shown in thick blue and red lines are the same quantities that were shown in Fig. 1, shown here again for reference. The quantities in panels (b)–(d) show the rotational–divergent partition of the eddy and mean terms computed over the global longitudes and Af-A and CP-WA sectors, respectively. The divergent component (urvd) is shown in dashed lines, while the rotational component (urvr) is shown in dotted lines. The udvd and udvr fluxes were found to be small and have not been considered. All quantities are averaged over 150–300 mbar and ±5° about the Equator. A 20 d low-pass filter is applied to the quantities in panels (b)–(d) prior to presentation. In all panels, the x axis is day of year and the y axis is acceleration (m s−1 d−1), as in Fig. 1. The legend in panel (b) also applies to panels (c) and (d).
3.2.1 Zonally and seasonally sensitive character of the eddies
Considering these two longitudinal sectors, Fig. 3a shows their contributions to each of the leading terms of Eq. (1). For reference, the zonally averaged eddy and mean terms have been plotted again in thick blue and red curves, respectively. Note that, in Fig. 3, all eddy terms are plotted in blue and mean terms are in red. Interestingly, the climatological day-of-year variation of the zonal mean eddy fluxes is determined by an internal compensation between eddies from the Af-A and CP-WA sectors. While eddies in the Af-A (dotted blue curve in Fig. 3a) tend to accelerate the flow for most of the year, eddies in the CP-WA (dashed blue curve) have a seasonally sensitive character. They tend to decelerate the flow during the winter season but provide a weak acceleration during summer. In the zonal mean, the decelerating tendency from CP-WA offsets a large portion of the accelerating tendency from Af-A to give a subdued maximum of ∼0.5 m s−1 d−1 during winter.
A rotational–divergent decomposition brings forth the detailed nature of these eddy fluxes (see Section 2.2.2; blue curves in Fig. 3b–d). As shown by Zurita-Gotor (2019), the divergent component (, dash-dotted line in Fig. 3b) dominates the zonal mean eddy momentum flux convergence throughout the year. It is largely attributed to the action of tropical stationary Rossby waves, forced by thermally divergent motions, that shift in tune with the large-scale monsoon flow. In contrast, the rotational component (, dotted line in Fig. 3b) provides a negative momentum forcing throughout the year. Typically, the rotational component arises from eddy vorticity fluxes associated with extratropical waves (Zurita-Gotor, 2019). These waves converge momentum into the source region, accelerating the midlatitude eddy-driven jet, but diverge momentum away from the tropics where they break and decelerate the flow (Vallis, 2017). Please note that the contribution from the and terms are much smaller than the other terms and are fairly constant throughout the year (not shown).
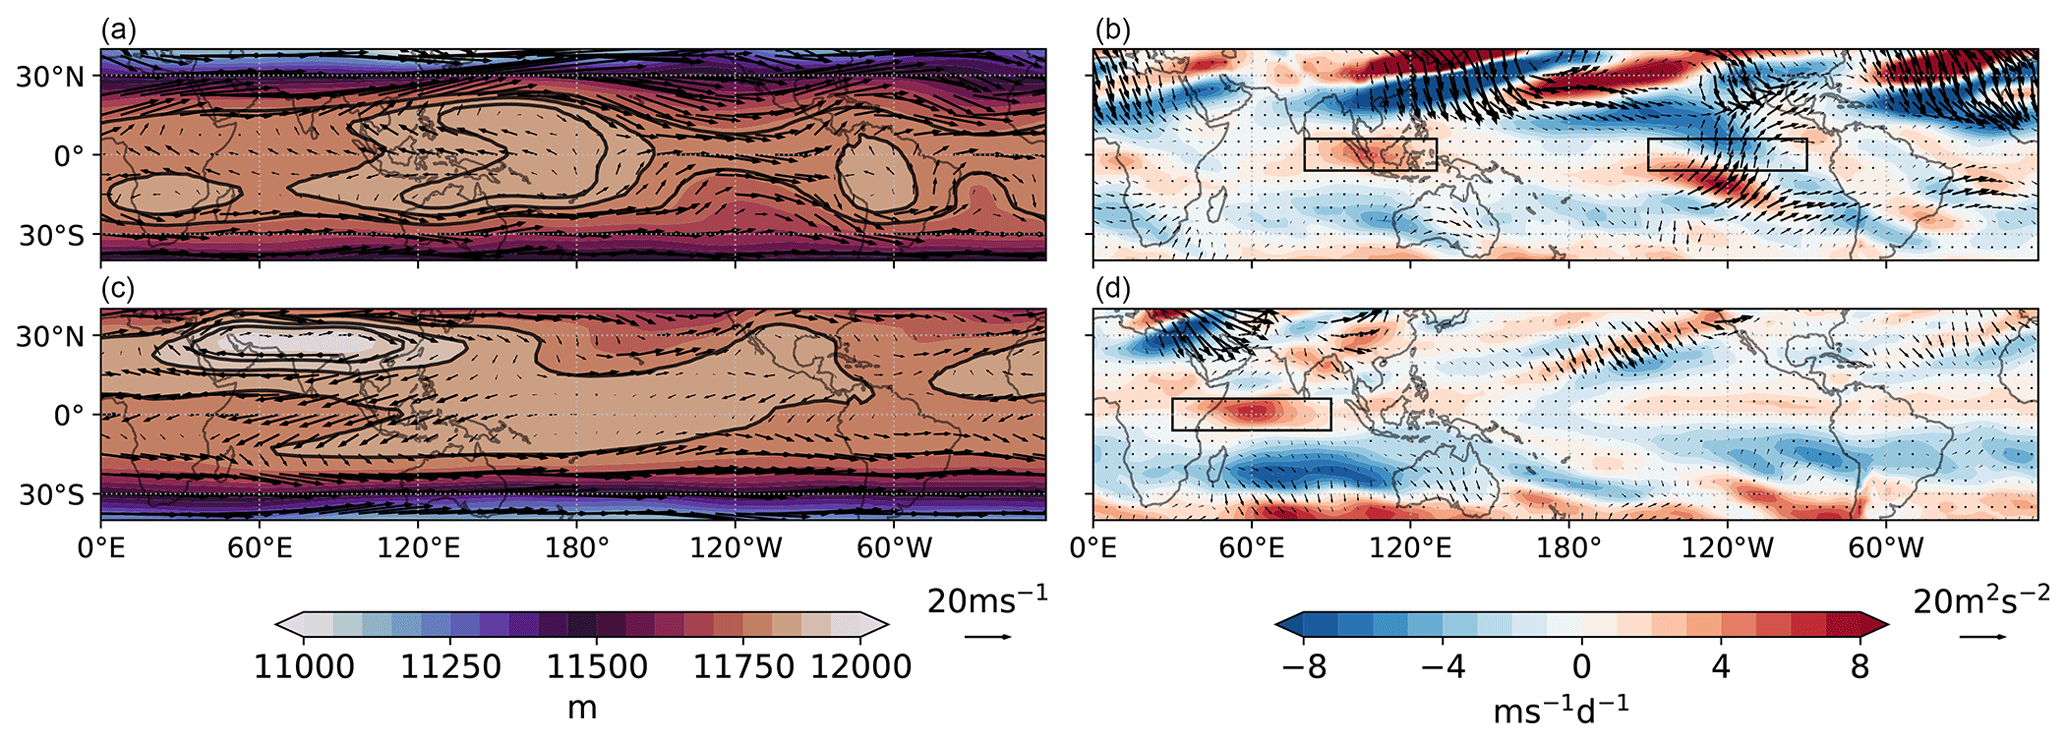
Figure 4Upper-tropospheric seasonal mean distribution of (a, c) eddy momentum flux convergence and (b, d) eddy geopotential height for boreal (a, b) winter and (c, d) summer, averaged over 150–300 mbar. Overlain are quivers of seasonally averaged (a, c) wave activity flux and (b, d) eddy horizontal velocity. The wave activity flux is computed using Eq. (3) (see also Plumb, 1985; Caballero and Anderson, 2009).
Figure 3c shows the rotational–divergent partition for the Af-A sector. Here too, the full eddy term follows the divergent term () very closely. Again, the rotational term () provides the familiar negative momentum forcing. However, its contribution goes to zero during the peak monsoon months; this is because extratropical waves are unable to propagate into the deep tropics due to the strong upper-level easterlies associated with the Asian summer monsoon. In contrast, the nature of the fluxes over the CP-WA sector is quite different (Fig. 3d). The full-eddy term switches between rotational and divergent tendencies as the seasons change from winter to summer and vice versa. Further, the divergent term is weak during winter but attains a moderately large magnitude during summer. This suggests that extratropical waves are able to make their way into the deep tropics in the CP-WA region during winter and make an important contribution to the tropical momentum balance.
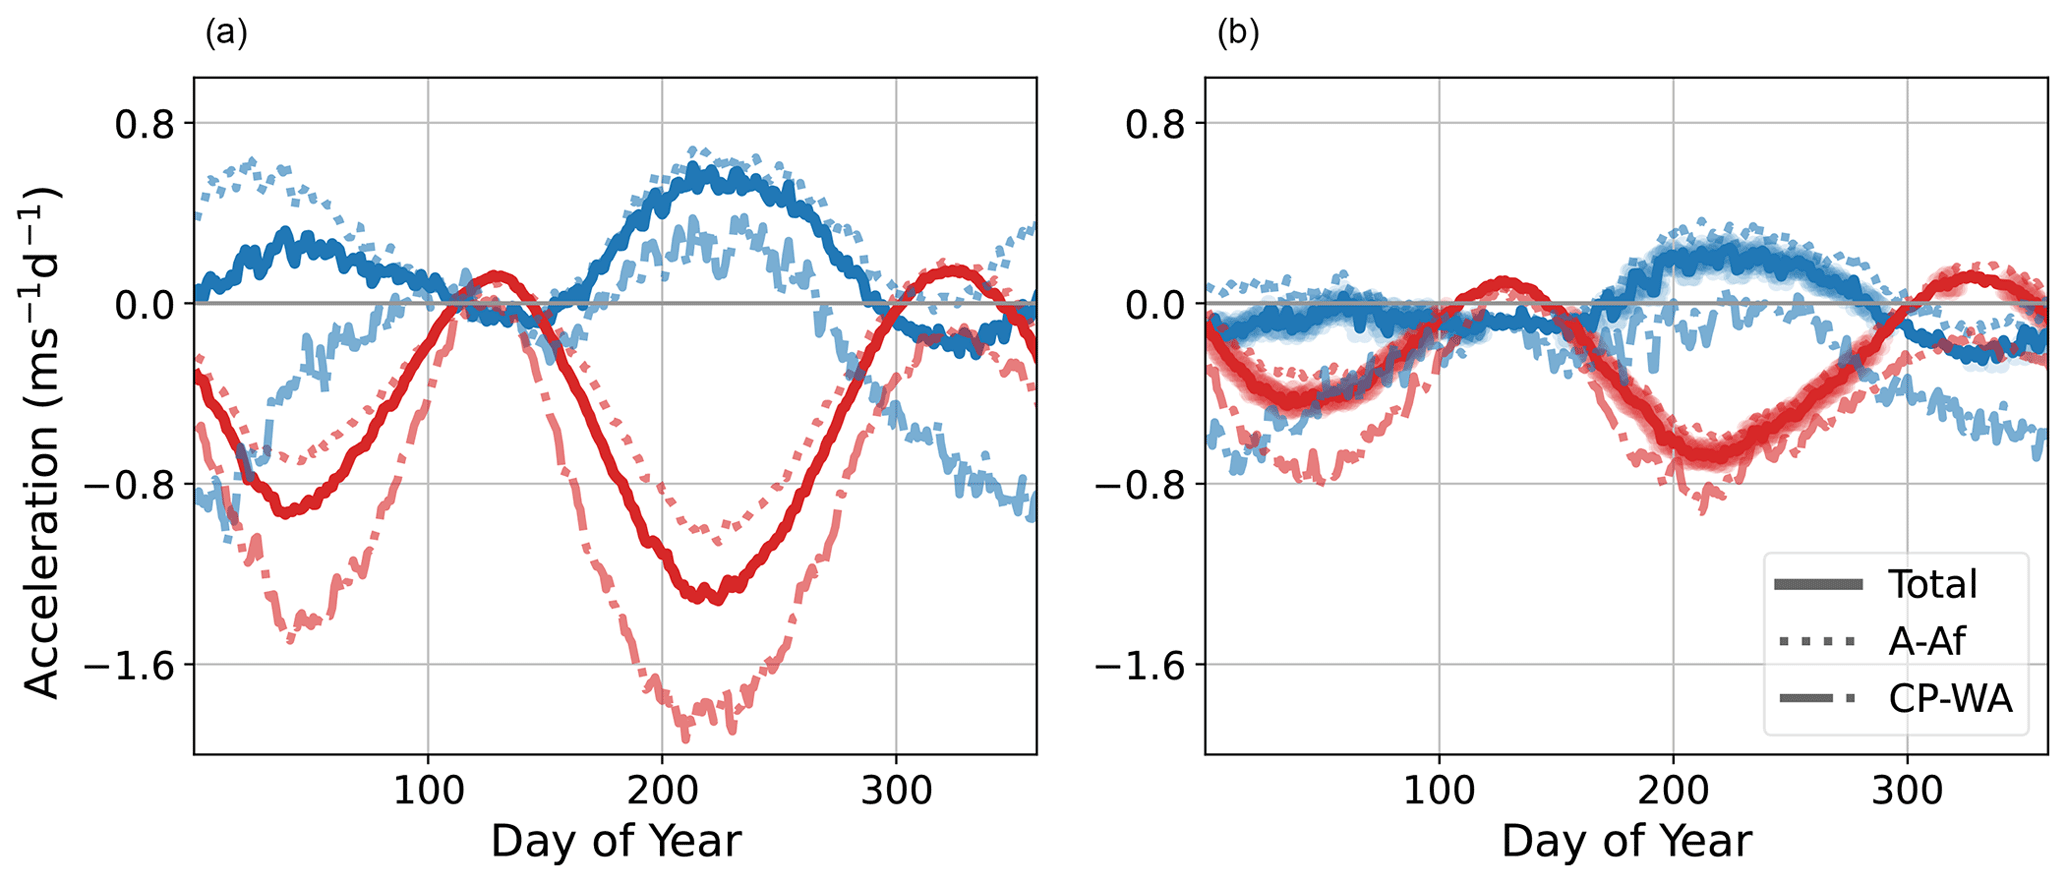
Figure 5Same as Fig. 3a, except for CMIP6 (a) control and (b) forced sets. The blurring of the curves in panel (b) indicates days where the full eddy and mean terms related to the forced simulations are statistically different from those for control at the 95 % level of significance.
To better understand the eddy momentum budget, the spatial features associated with the seasonal variation of the eddy fluxes are shown in Fig. 4. The internal compensation between the eddy fluxes from Af-A and CP-WA during winter, noted above (see Fig. 3b), arises due to the features highlighted by the black boxes in Fig. 4b. The eddy momentum flux convergence in the 120° E box is due to the contribution linked to the two off-equatorial anti-cyclonic Rossby gyres straddling the Equator around the Maritime Continent region (Fig. 4a). This flux is largely divergent in nature, as noted in Fig. 3c. In contrast, the deceleration in the east Pacific over the 120° W box is due to the rotational component associated with the convergence of extratropical wave activity (Fig. 3d). The Plumb flux (arrows in Fig. 4b) shows the propagation of a quasi-stationary Rossby wave from the SH Pacific Ocean across the tropics into the NH. This wave is apparently generated by deep convection in the Maritime Continent region and propagates towards the east Pacific after equatorward reflection from SH high latitudes (Goyal et al., 2021). Similar propagation characteristics have also been observed by other studies (see Fig. 6 of Barnes and Hartmann, 2012, and Fig. 1 of Caballero and Anderson, 2009). While the wave activity flux (arrows in Fig. 4b) captures stationary contributions, the negative eddy momentum forcing in the 120° W box is due to both stationary and transient Rossby waves. Large-amplitude Rossby waves, generated in the extratropics of the NH, undergo wave breaking in the westerly duct region and intrude high-PV (potential vorticity) air into the deep tropics (Waugh and Polvani, 2000; Waugh and Funatsu, 2003). Further, transient Rossby waves propagating along the SH subtropical jet can also be refracted towards the westerly duct over the central Pacific (Matthews, 2012). The relative contributions by stationary and transient eddies are discussed further in Sect. 4.3.
During the boreal summer, the net eddy fluxes in both zones are accelerating in nature. For Af-A, the dominant feature responsible for the eddy flux convergence in the deep tropics is the upper-tropospheric return flow of the Asian summer monsoon (see Dima et al., 2005; Hoskins et al., 2020, and Fig. 4c) – highlighted by the box in Fig. 4d. The climatological stationary Rossby gyres are now associated with the intense convection of the Asian summer monsoon and converge eddy momentum flux into the tropics near 60° E. The large-scale circulation structure is very similar to an off-equatorial Gill response (Gill, 1980; Dima et al., 2005). In stark contrast to winter, the characteristic westerly duct over the east Pacific has been replaced by anomalous weak easterlies (Fig. 4c). As a result, there is no cross-equatorial propagation of extratropical Rossby waves or the related eddy momentum flux divergence in the eastern tropical Pacific. However, this region experiences a weak acceleration during summer (∼0.5 m s−1 d−1 in magnitude). This weak eddy acceleration is possibly related to the circulation driven by a localized heat source (the summer inter-tropical convergence zone) (Suarez and Duffy, 1992; Kraucunas and Hartmann, 2005).
Thus, over the course of the seasonal cycle, we observe that the eddies in the Asia–Africa sector exert a positive momentum forcing on the zonal mean flow. However, those in the CP-WA sector exhibit a seasonally sensitive character, changing between negative and positive momentum forcing of the zonal mean flow as the seasons change from winter to summer. Further, the differences in the two regions as well as changes through different seasons are due to the equatorial and extra-tropical nature of eddies that make their way into the deep tropics.
3.2.2 Robust nature of the mean meridional flux
A striking feature of Fig. 3a is the high degree of similarity of the mean meridional fluxes when computed over the entire globe or either of the individual sectors (all red curves). This happens because the ur−vd contribution is either the leading influence or the only factor that determines the mean meridional advection of momentum over each sector (solid and dashed red curves of Fig. 3b–d). On splitting Eq. (2) into its zonal and meridional wind components, it can be readily seen that vr and ud are zonal gradients of a stream function and velocity potential, respectively (see Sect. 2.2.2), and go to zero when integrated over all longitudes. With this consideration, the mean meridional momentum advection term can be written as , which is the advection of zonal mean absolute vorticity by the zonal mean divergent meridional wind from the summer hemisphere into the winter hemisphere. Considering the annual cycle of vd and , averaged over the global longitudes and the individual sectors Af-A and CP-WA (Fig. S3), we find that these quantities have a similar character irrespective of their domain. Thus, this theme of cross-equatorial transport of vorticity by the thermally direct circulation is consistent across all domains considered in this study (Fig. S3).
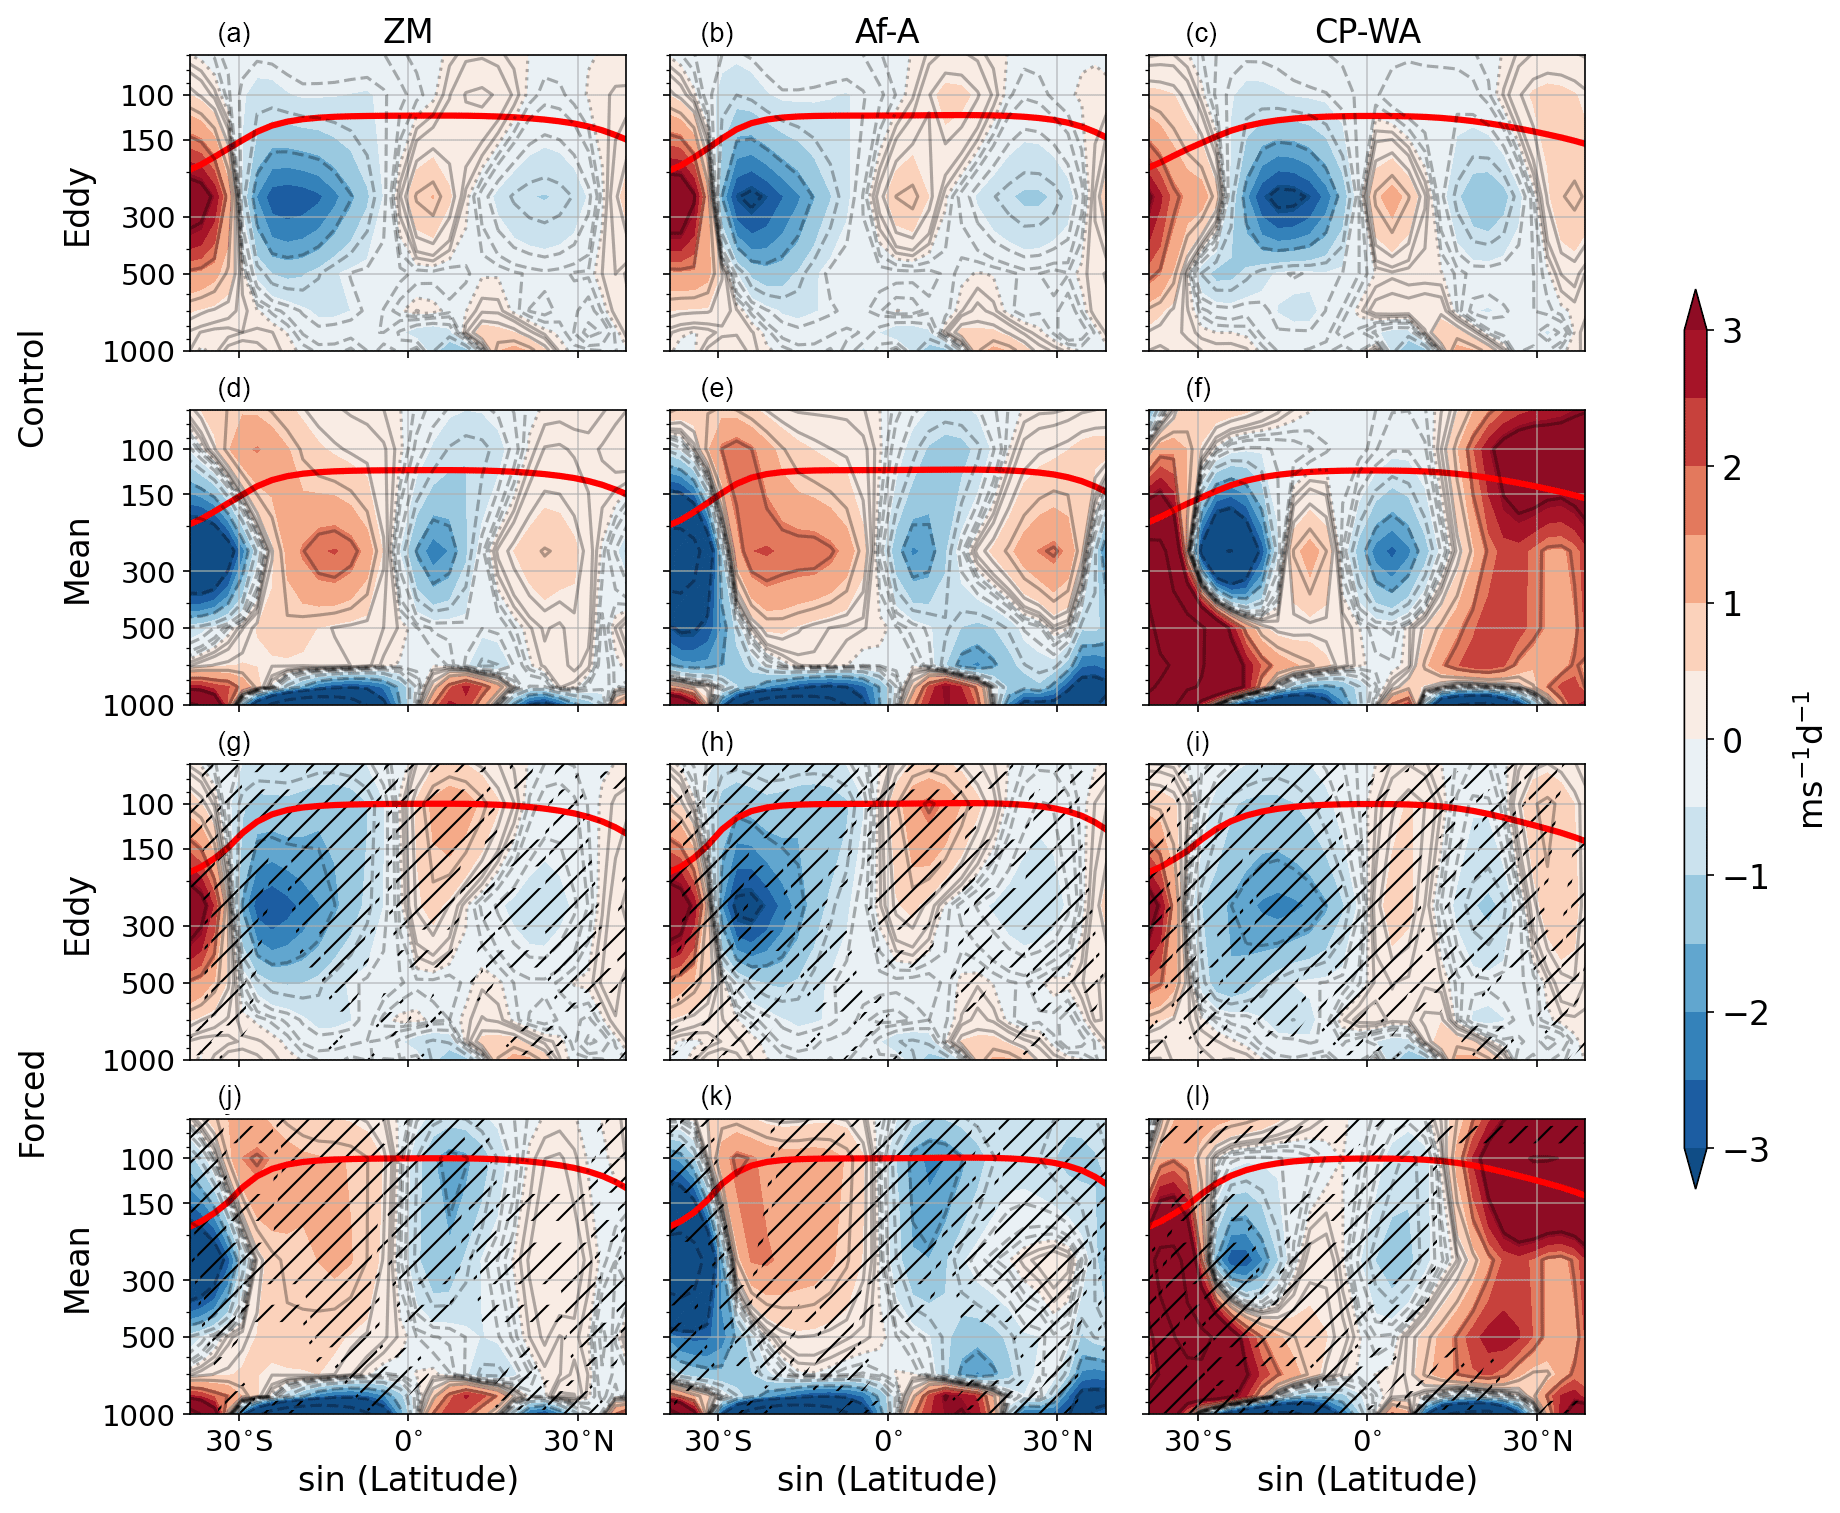
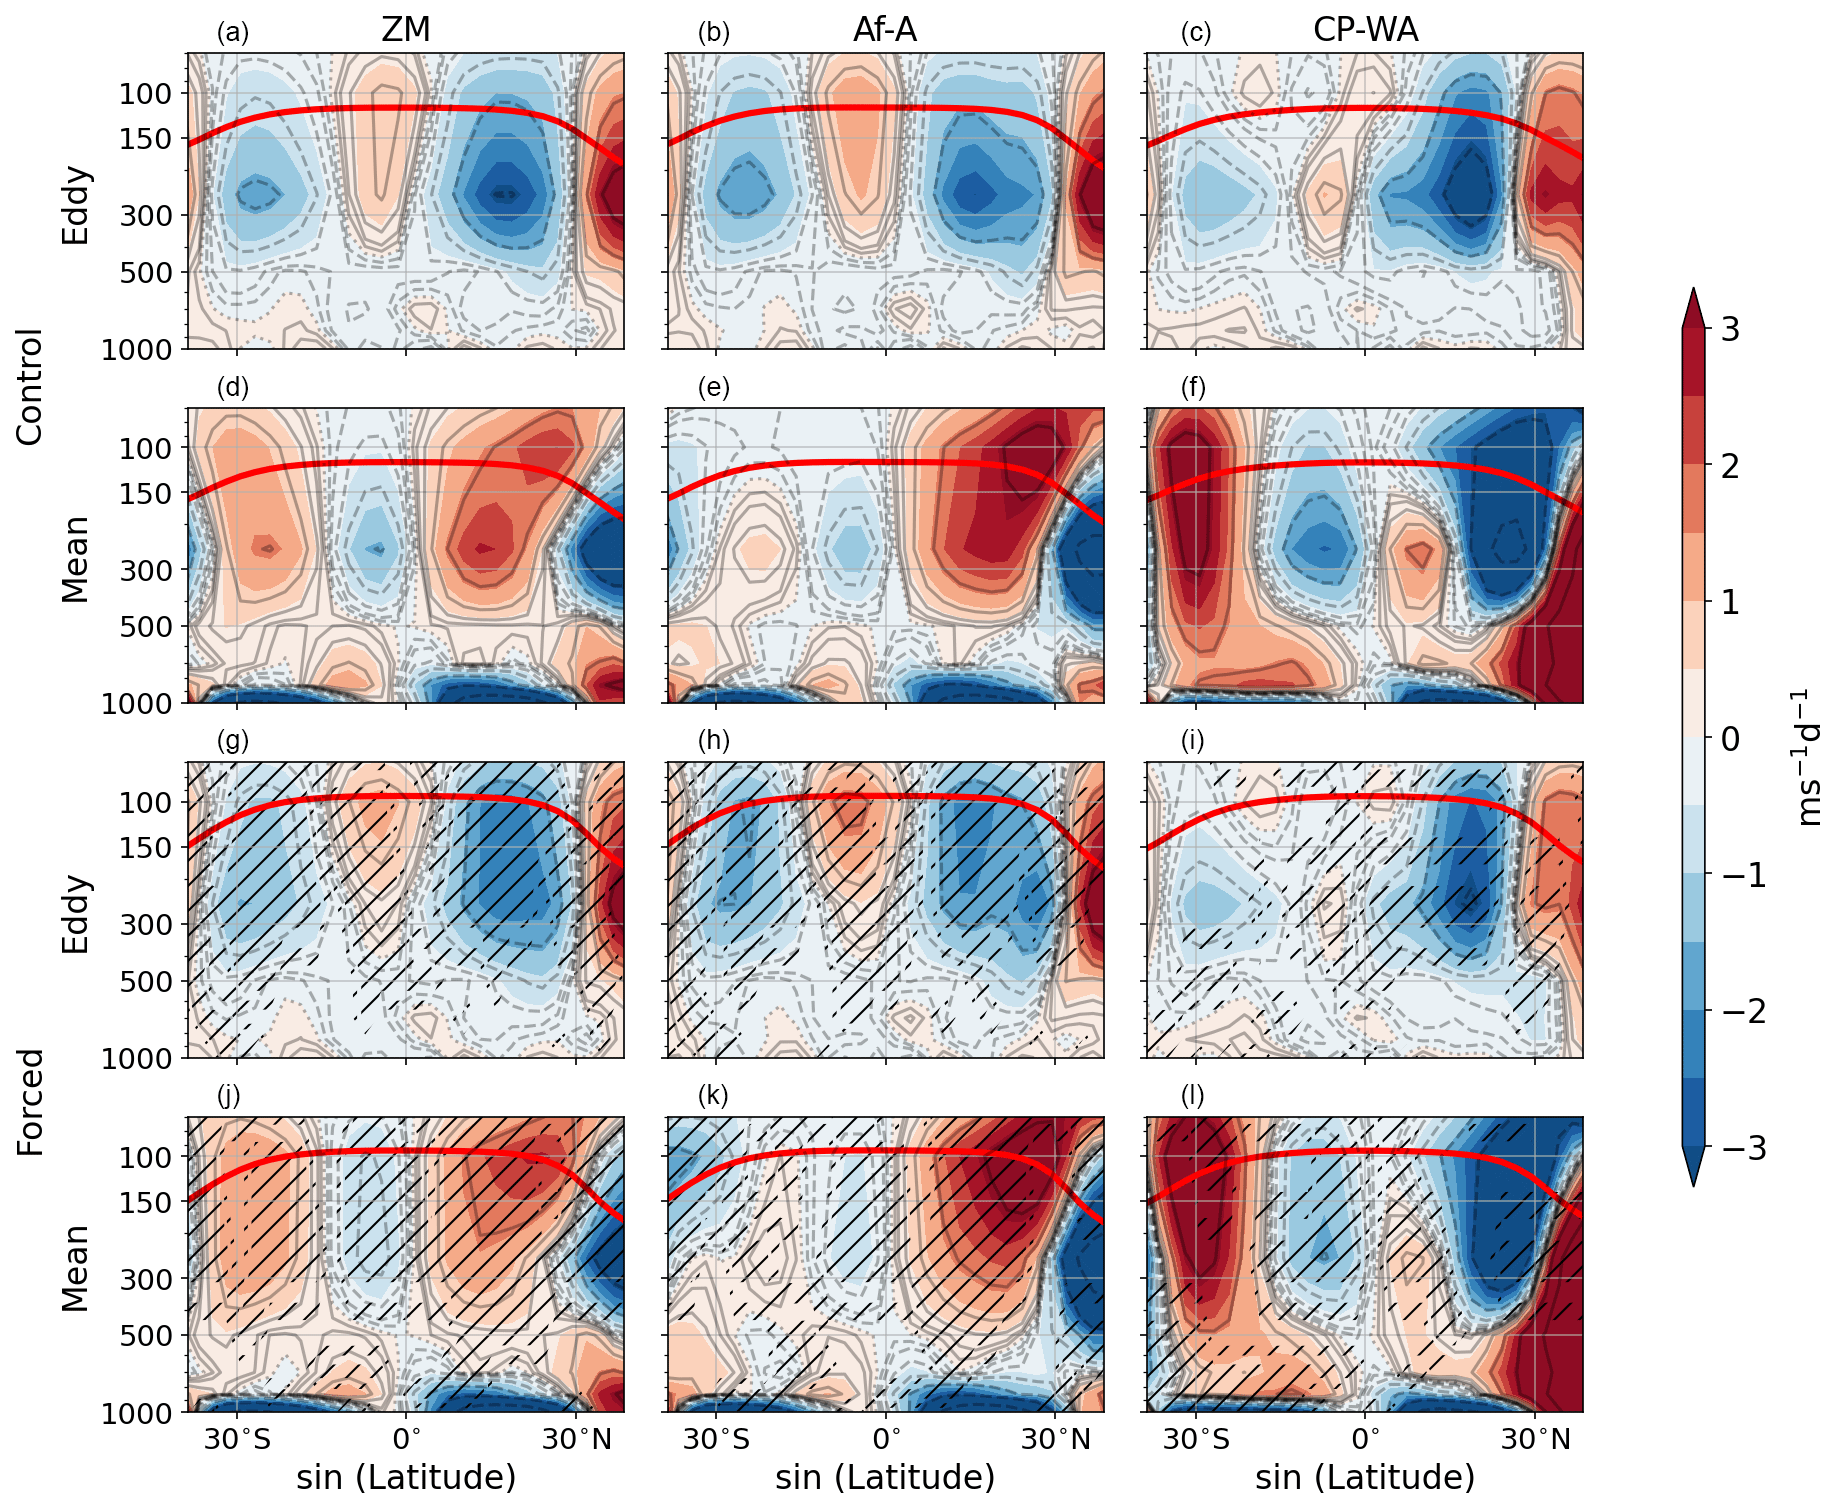
Figure 6Seasonally and zonally averaged multi-model mean vertical structure of (a–c and g–i) eddy momentum flux convergence and (d–f and j–l) mean meridional momentum flux convergence for the CMIP6 (top half, a–f) control and (bottom half, g–l) forced simulations for summer (JJA). The quantities displayed are computed over (a, d, g, j) the global longitudes, (b, e, h, k) Af-A, and (c, f, i, l) CP-WA, respectively. Logarithmically spaced contours have been plotted additionally for more clarity. Positive values are solid while, negative values are dashed, and the zero contour is dotted. The lowest non-zero value represented by the contours is 0.1 m s−1 d−1, and the subsequent contours double in magnitude. In each panel, the red curve is indicative of the multi-model mean tropopause height over the corresponding region (see Reichler et al., 2003). Hatching denotes statistically significant changes at the 95 % level by a two-tailed t test.
The substantial anti-correlation between the zonal mean eddy and mean fluxes (see Sect. 3.1) appears to be valid in the Af-A, with seasonally changing peaks of similar magnitude in both the eddy and mean fluxes (Fig. 3a and c). However, the CP-WA sector is an exception; the eddy flux is much weaker than the mean flow response (Fig. 3a and d) – indeed, this is due to the substantial contribution of the rotational extratropical eddy momentum fluxes in this region.
In all, the eddy momentum fluxes that participate in the zonal mean balance are quite diverse. The fluxes are dissimilar in winter, accelerating the zonal flow over Af-A while decelerating it over CP-WA. In summer, both of these regions experience acceleration due to the general convergent tendency of the eddy fluxes. In the zonal mean, the mean meridional momentum advection balances these eddy fluxes. The magnitude of the mean term in each zone peaks in the boreal summer despite representing different longitudinal zones. Further, the nature of the mean meridional momentum flux is similar for both the individual regions and the zonal mean throughout the year. With these considerations, it becomes evident that the tropical momentum balance involves a three-way compensation between tropical eddy acceleration, extratropical eddy deceleration, and zonal mean absolute vorticity advection by the divergent meridional flow. A change in any of these three components has the potential to alter the upper tropical momentum budget. Given the many changes anticipated in the tropical circulation due to global warming (see the discussion in the Introduction), it would be worthwhile to explore the influence of warming on these fluxes and whether there can be a change in the tropical momentum balance.
To see if such an analysis is feasible, we begin by examining the upper-tropospheric eddy and mean momentum flux terms for the control simulation of the CMIP6 multi-model ensemble (Fig. 5a). The control set qualitatively captures the mean meridional momentum flux term globally and locally over the Af-A and CP-WA sectors (compare Figs. 3a and 5a). It also captures the dissimilarity in wintertime eddy fluxes in the Af-A and CP-WA regions. While of the correct sign, some discrepancies are apparent. Firstly, the control run has a weaker eddy acceleration than that observed in the present-day reanalysis. Secondly, the mean meridional deceleration in the CP-WA sector is larger in magnitude than that noted in the reanalysis. Such discrepancies are possibly associated with systematic biases suffered by these models (Wang et al., 2014; Mitchell et al., 2020). Further, these discrepancies may arise from the inability of these models to simulate atmospheric stationary waves correctly (Boyle, 2006), which in turn may be due to the shortcomings of the modeled representation of stationary wave forcing mechanisms (see, for example, Held et al., 2002). Additionally, Frierson and Hwang (2012) show that the inter-model spread in the ITCZ response can be attributed to the response of extratropical clouds to external forcing. The high-latitude radiative perturbations strongly influence the ITCZ position (Kang, 2020). Many of these climate models struggle to reproduce the climatological balance between the warm pool, cold tongue, and the ITCZ (see Pierrehumbert, 2000, and the references therein). Nevertheless, given the overall qualitative agreement between the control and present-day estimates, it is worthwhile to use the CMIP6 suite for studying the influence of climate change on upper-tropospheric momentum fluxes. Momentum fluxes from the forced set suggest changes in both the summer and winter seasons when compared to the control (Fig. 5a and b). For example, the mean meridional term computed over the CP-WA weakens considerably. Although this anomaly is noticeable primarily over the CP-WA sector, it manifests in the globally averaged term by extension. We also notice changes in the eddy acceleration in both the CP-WA and Af-A regions during summer. Overall, the magnitude of momentum fluxes decreases due to warming.
One of the most robust responses to anthropogenic climate change is an increase in the tropopause height (Lorenz and DeWeaver, 2007; Vallis et al., 2015). As eddy fluxes of momentum tend to be concentrated in the upper troposphere (Ait-Chaalal and Schneider, 2015), there arises a possibility wherein fluxes undergo an upward displacement along with the tropopause. Further, idealized and full-complexity simulations suggest that the Hadley circulation is expected to undergo a weakening and poleward expansion due to warming (Lu et al., 2007; Frierson et al., 2007). Thus, rather than focusing on a particular set of pressure levels, a view of the fluxes with height and latitude is more appropriate; this is shown in Figs. 6 and 7 for summer and winter seasons, respectively. As with the upper-layer averages (Figs. 3a and 5a), the latitude–height computations for the control set bear a resemblance to reanalysis (see Dima et al., 2005). However, the magnitudes of the terms are smaller in the control set than those for the reanalysis.
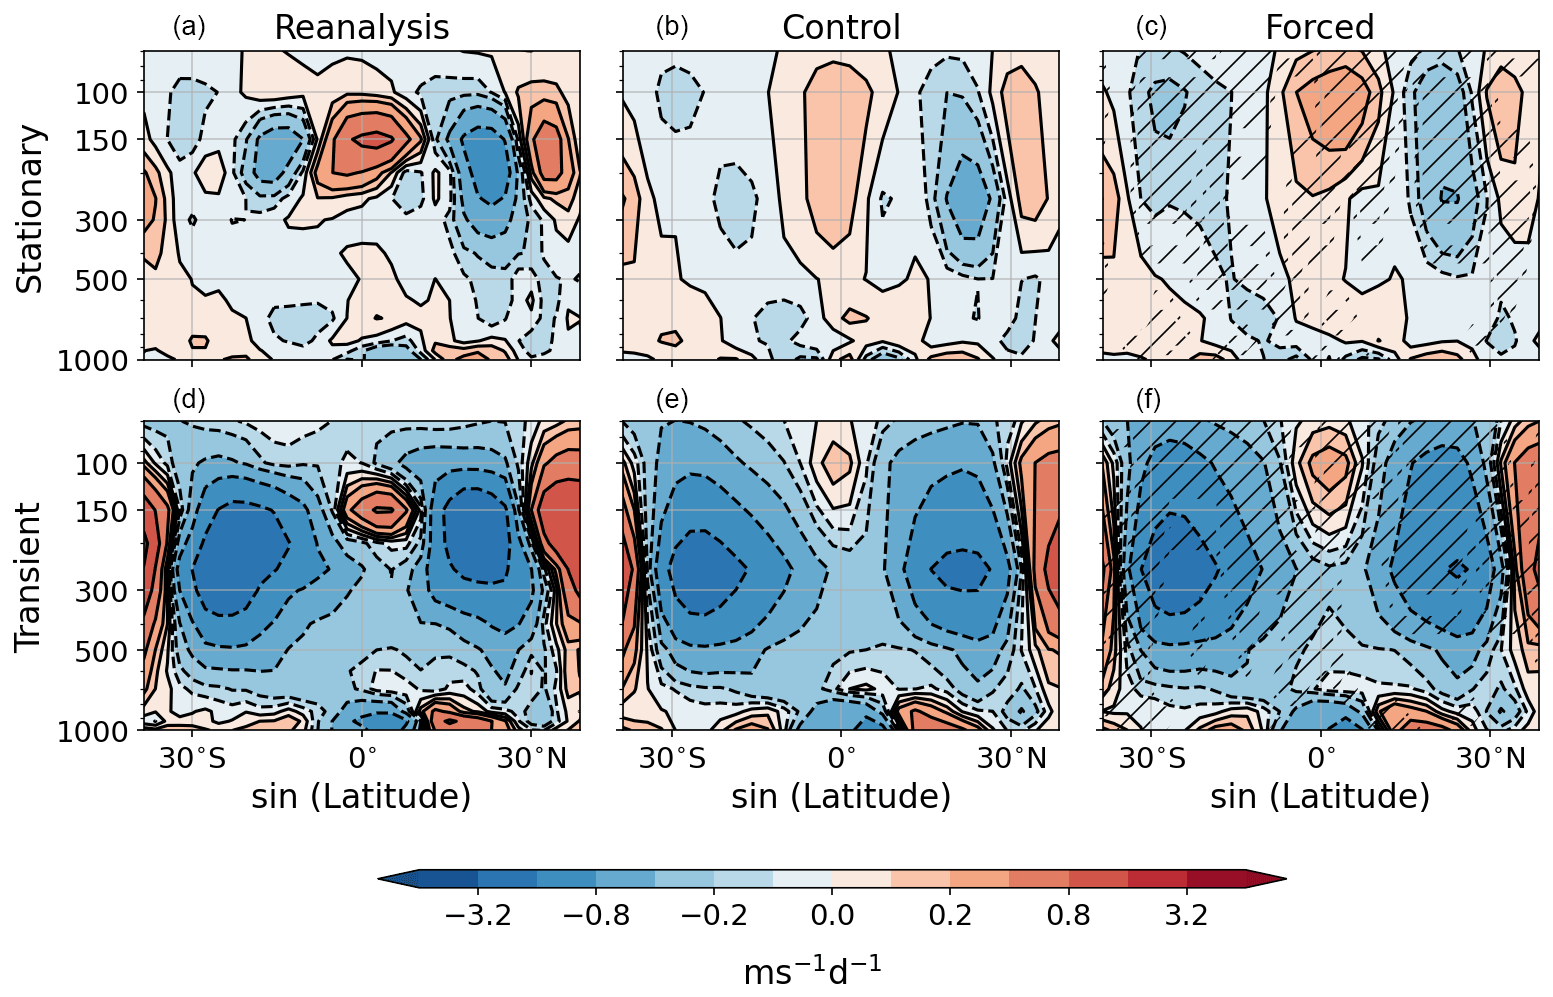
Figure 8Temporally and zonally averaged estimates of eddy momentum flux convergence due to (a–c) stationary eddies and (d–f) transient eddies (Lee, 1999) for (a, d) reanalysis, (b, e) CMIP6 control, and (c, f) forced set. Hatching denotes changes that are statistically significant at the 95 % level by a two-tailed t test.
4.1 Changes in the latitude–height plane
In response to anthropogenic warming, the near-equatorial eddy acceleration shifts upward and is concentrated near the 100 mbar level in the forced set (compare Fig. 6a and g for summer and Fig. 7a and g for winter). This is consistent with expectations of an increase in tropical tropopause height and an upward shift in the circulation with warming (Singh and O'Gorman, 2012). The increase in the magnitude of the zonal mean eddy fluxes during summer is largely due to the increase over the Af-A sector that can be observed in both the upper troposphere and lower stratosphere (compare Fig. 6b and h). This large increase of the eddy momentum flux over the Af-A sector is possibly related to changes in the Asian summer monsoon anti-cyclone, whose signature extends up to 10 mbar in present-day observations (Krishnamurti et al., 2008); this aspect is explored further in Sect. 4.2. A similar increment is visible over this region in the winter season as well (Fig. 7b and h).
In comparison, the response of the CP-WA sector is different in the summer and winter seasons, similar to its seasonally sensitive behavior observed in the present-day climate (see the discussion in Sect. 3.1). The tropical eddy momentum flux convergence is spread over a deeper vertical layer in summer, extending up to the tropical tropopause (Fig. 6c and i), whereas during winter the signature of the eddies weakens on either side of the Equator (Fig. 7c and i). This is possibly related to changes in the equatorward propagation of extratropical wave activity through the westerly duct (see discussion in Sect. 3.1) and is explored further in Sect. 4.3.
Further insight regarding changes in the vertical structure of the eddy fluxes is gained by splitting the eddy momentum flux into stationary and transient contributions (Fig. 8; Lee, 1999; Peixoto and Oort, 1992). We note that the present-day tropical momentum balance is largely dominated by the stationary eddy component (compare Fig. 8a and d). Although the peak values are similar, the stationary contribution is spread over a larger area than the transients, whose influence is confined to a small region in the deep tropics near 150 mbar. Further, the multi-model ensemble means of these quantities compare poorly with reanalysis, both in magnitude and position (compare Fig. 8a, b and d, e). The stationary eddies in the control set appear to be spread across the entire troposphere and the stratosphere as opposed to their expected position near the tropopause (Ait-Chaalal and Schneider, 2015). The transient eddies appear to peak at 100 mbar rather than 150 mbar, as in the reanalysis. In both cases, the maxima in the tropical eddy momentum flux convergence is ∼0.2 m s−1 d−1, which is far less than the ∼1.6 m s−1 d−1 peak in the reanalysis. However, in response to warming, both of these quantities exhibit an increase in their magnitude (compare Fig. 8b, c and e, f). Similar to the changes observed in the Af-A sector, the stationary eddy momentum flux appears to shift upwards and shows a large increase in magnitude with warming. The increase in transient eddy momentum flux in the tropics may be due to increased MJO amplitude with warming, as seen in externally forced idealized aquaplanet (Lee, 1999; Arnold et al., 2013) and super-parameterized Earth system model simulations (Arnold et al., 2015). However, a similar diagnosis in IPCC-class CMIP models has remained elusive (Maloney et al., 2019).
The mean meridional flux undergoes a weakening and upward spread during both seasons (compare panels d, and j in Figs. 6 and 7). Under the influence of warming, the peak in the flux over Af-A shifts close to the tropopause in summer (compare Fig. 6e and k), while that over the CP-WA decreases in strength (compare Fig. 6f and l). The mean flux undergoes a general weakening across all sectors during winter (compare Fig. 7e, k and f, l). These changes in the mean meridional flux are anticipated by theories that posit a wider and weaker Hadley cell in a warmer climate (Lu et al., 2007; Frierson et al., 2007; Levine and Schneider, 2011; Vallis et al., 2015). Further, the response of the Hadley circulation to greenhouse gas radiative forcing is spatially complex and involves intricate compensations between varied responses of the mean flow to external radiative forcing (Kim et al., 2022).
On the other hand, the changing nature of eddy fluxes, their regional dependence, and their signature in the upper troposphere and lower stratosphere is intriguing and, to the best of our knowledge, has not received much attention. We now probe the cause of these changes, with a particular focus on Af-A during summer and CP-WA during winter.
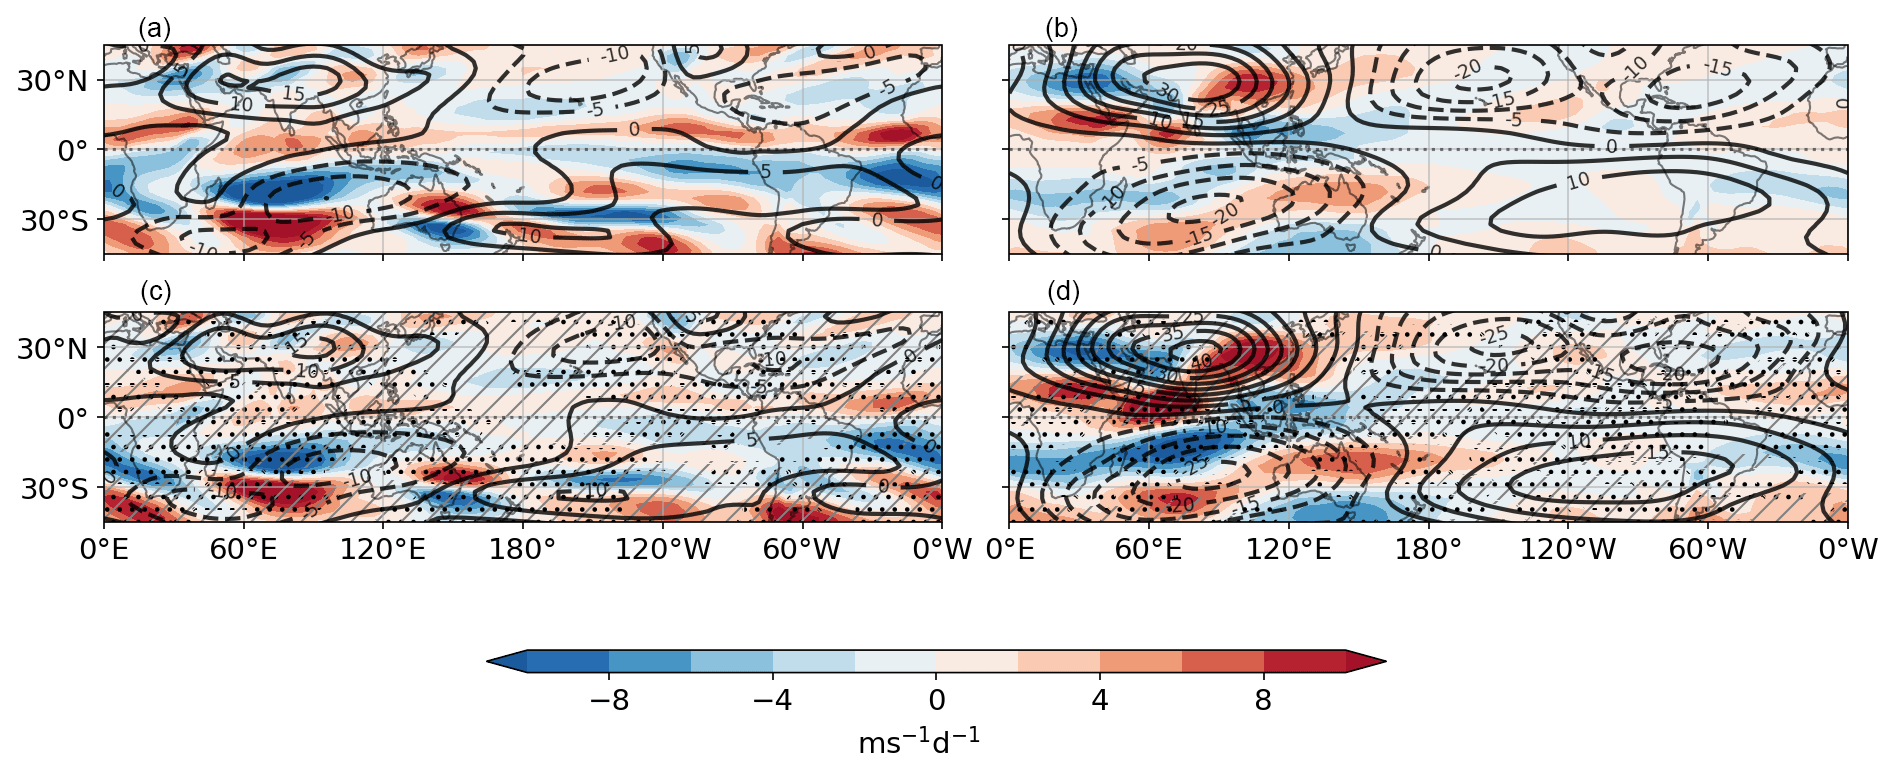
Figure 9Boreal summer seasonal mean upper-tropospheric (a, c; 250 mbar) and lower-stratospheric (b, d; 100 mbar) spatial maps of eddy momentum flux convergence (colors) and eddy streamfunction (contours). The top panels (a, b) show the ensemble mean for control, while the bottom panels (c, d) show that for forced simulations. Contour intervals are the same in all panels, and the units are 106 m2 s−1. Hatching with gray lines (stippling with black dots) denotes changes in streamfunction (eddy momentum flux convergence) that are statistically significant at the 95 % level by a two-tailed t test.
4.2 Changes in the Asia–Africa region
The most prominent feature of the tropical atmospheric circulation during the NH summer is the Asian summer monsoon (Hoskins and Yang, 2021). As noted in Sect. 3.1, the convergence of eddy momentum in the Af-A region is due to the outflow of the Asian summer monsoon anti-cyclone. Comparing the 15×106 m2 s−1 streamfunction contour of this vortex in the control and forced runs (Fig. 9a and c), we find that the intensity of the circulation weakens in response to warming. Specifically, the spatial extent of this contour decreases from being spread across a broad area spanning the core zone of the Indian summer monsoon along with parts of China, Pakistan, Afghanistan, and Iran in the control set to being confined to a much smaller region over China and north-east India in the forced set. This is consistent with the projections made using previous generations of CMIP models (Ueda et al., 2006; Sooraj et al., 2015) and with high-resolution GCMs (Hsu et al., 2012). The weakening of the monsoon circulation in the upper troposphere is the net result of two competing effects of climate change; the weakening effect due to smaller sea surface temperature gradients dominates the strengthening influence of increased upward mass flux caused by the uplift of the tropopause (Levine and Boos, 2016). Further, the eddy circulations appear more zonal in the forced set. This is consistent with the simulations of Joseph et al. (2004, see also Wills et al., 2019). Thus, the weaker eddy circulations in the upper troposphere explain the decrease in the tropical eddy momentum flux in summer (compare blue curves in Fig. 3e and f).
On the other hand, Fig. 9b and d suggest a strengthening of the subtropical stationary waves and the associated eddy fluxes in the lower stratosphere (100 mbar). Further, the tropical eddy fluxes appear to be strengthened in the Asia–Africa region. The increased magnitude of zonally asymmetric anomalies appears to be in close association with projections of a stronger zonal mean Brewer–Dobson circulation (BDC; Butchart, 2014). The westward drag induced by upward-propagating planetary-scale Rossby waves is balanced by the eastward Coriolis force on poleward-flowing air pumped upwards in the tropics, through the downward control mechanism (Butchart, 2014). The stronger BDC is typically attributed to increased planetary wave activity flux (McLandress and Shepherd, 2009) and the upward shift of critical layers into the lower stratosphere due to the warming (and the attendant drag due to wave breaking, Shepherd and McLandress, 2011). As more than 60 % of the mean upward mass flux is due to wave driving by resolved waves (Butchart et al., 2006; McLandress and Shepherd, 2009), a larger wave driving of the BDC should be accompanied by a larger tropical upwelling (Butchart, 2014). However, Oberländer-Hayn et al. (2016) suggest that most of the BDC trend is associated with an upward shift of the circulation.
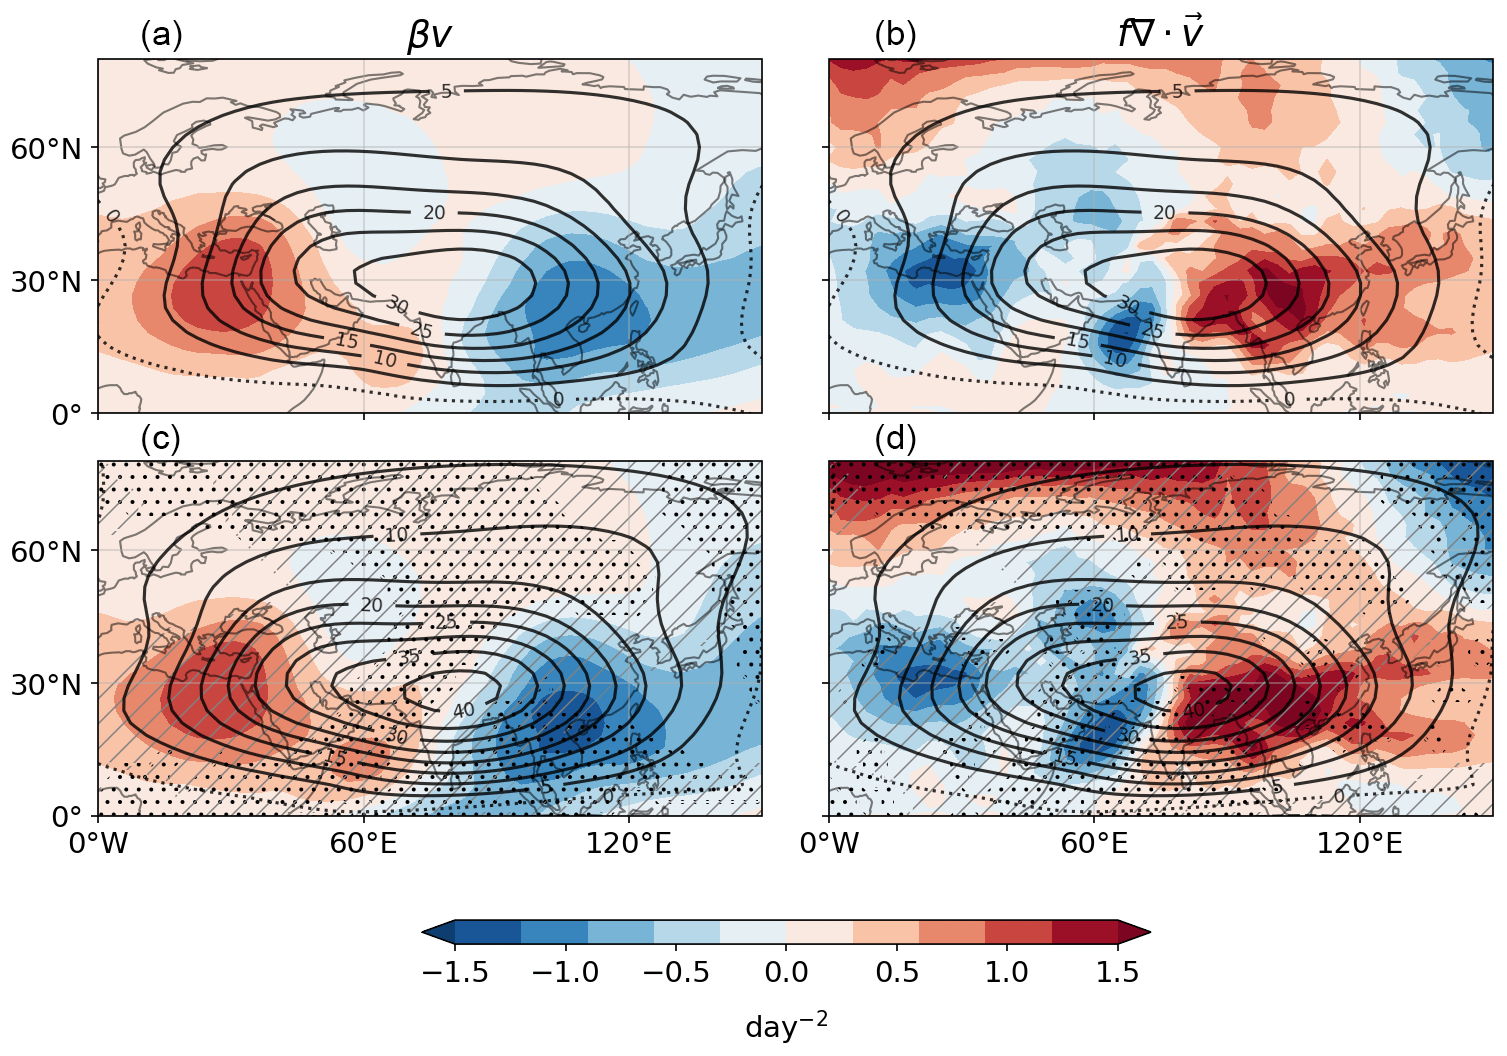
Figure 10Boreal summer seasonal mean lower-stratospheric (100 mbar) dominant terms of the linearized vorticity budget (colors) and eddy streamfunction (contours) for control (a, b) and forced (c, d) simulations. Terms of the vorticity budget are (a, c) and (b, d) . Contour intervals are the same in all panels, and the units are 106 m2 s−1. Hatching with gray lines (stippling with black dots) denotes global warming-induced changes in the streamfunction (vorticity budget terms) that are statistically significant at the 95 % level by a two-tailed t test.
Irrespective of the extent of wave driving or the cause of tropical upwelling, a larger tropical mass flux through the tropopause is expected with warming due to the deepening of tropical convection (Lau and Kim, 2015; Chou and Chen, 2010). Here, we propose an alternative way in which the lower stratospheric eddy fluxes are strengthened over the Asia–Africa region. The increased subtropical mass flux into the stratosphere during the NH summer, plausibly from the Indian summer monsoon (Randel and Park, 2006; Randel et al., 2010), is likely to result in a more extensive local lower-stratospheric divergence and hence a stronger rotational flow. This can be elucidated by a vorticity balance for the lower-stratospheric flow. Following Sardeshmukh and Held (1984), the steady-state vorticity equation for large-scale flow can be written as
The notation in the above equation is standard; v is the horizontal velocity, ζ is the relative vorticity, f is the Coriolis parameter, and β is the meridional gradient of the Coriolis parameter. Figure S4 shows the above approximate vorticity budget for the control and forced runs for the lower stratosphere. Linearizing the above equation about the zonal mean horizontal winds and collecting the terms that are dominant in the lower stratospheric tropical region using reanalysis data yields a Sverdrup balance given by
Here, * indicates a deviation from the zonal mean. In both the control and forced sets (Fig. 10), the primary balance is between the advection of planetary vorticity and the stretching term, implying a Sverdrup-like balance of the large-scale lower-stratospheric flow. Quite clearly, comparing the balance for the two scenarios suggests a higher degree of compensation between the beta and stretching terms via a larger divergence in the forced ensemble than the control set.
Given that the changes observed in the vertical structure of the Asian monsoon circulation appear to be due to relatively straightforward dynamical interactions, we now examine if they can be reproduced in the simple, bare-bones setting of an idealized aquaplanet model (see Sect. 2.1.3 for details). We adopt the idea that by forcing an aquaplanet with a planetary-scale wave-1 SST perturbation (see Fig. 11a; see also Wu and Shaw, 2016), it is possible to replicate the large-scale monsoonal flow. Figure 11b shows the latitude–height section of the horizontal streamfunction, zonally averaged over the forcing longitudes. Clearly, the model setup is able to reproduce the large-scale NH monsoon circulation with low-level cyclonic flow and upper-level anti-cyclonic flow.
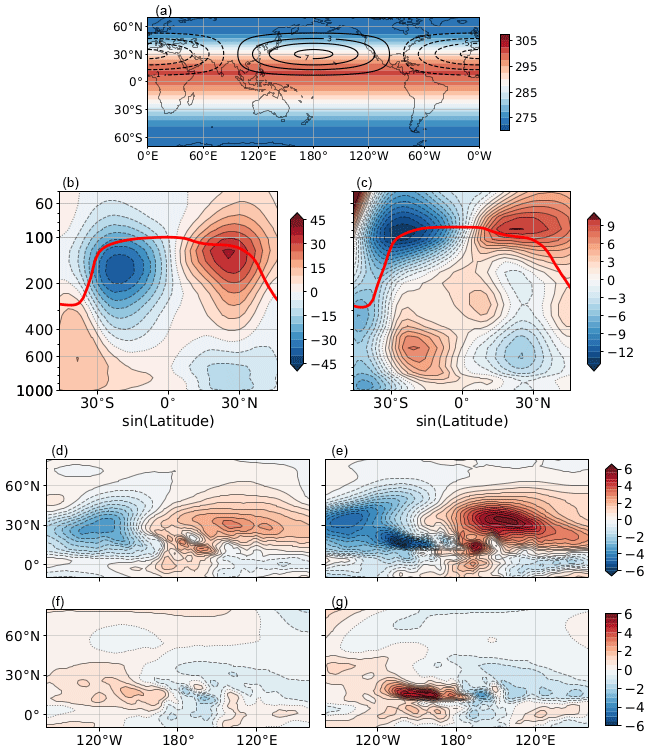
Figure 11(a) Zonally symmetric SST forcing (K) with the peak at 10° N superimposed with a planetary-scale wavenumber-1 SST perturbation located at 30° N (Wu and Shaw, 2016). The peak magnitude of the SST perturbation is 7.5 K. (b–g) Steady-state statistics for the aquaplanet runs averaged over year 3 of the simulation. (b, c) Vertical structure of the zonally anomalous horizontal streamfunction (ψ; units: 106 m2 s−1) for the (b) control simulation and (c) difference between forced and control simulations. (d, e) Eddy pressure velocity (ω; units: mbar d−1) distribution for (d) control and (e) forced simulations. (f, g) Eddy divergence field (∇⋅u; units: 106 s−1) distribution for (f) control and (g) forced simulations. The results in panels (b) and (c) are averaged over 120° E–120° W because the peak of the SST forcing lies in this longitude band. The results in panels (d)–(g) are all averaged over 60–100 mbar.
Anthropogenic climate change is simulated in the model by quadrupling the reference carbon dioxide concentration and uniformly increasing the SSTs everywhere by 4 K (Webb et al., 2017). Figure 11c shows the streamfunction anomaly induced by the climate change forcing. The lower-tropospheric cyclonic circulation strengthens, but the upper-tropospheric circulation weakens; this is consistent with the paradoxical Asian summer monsoon response to warming simulated by full-complexity CMIP models (Ma and Yu, 2014). Further, consistent with the results presented so far, the model tropopause shifts upwards (compare Fig. 11b and c), and the lower stratospheric circulation becomes more intense with warming. As noted in the CMIP6 suite, the aquaplanet simulations also suggest a larger mass flux from the troposphere to the stratosphere (Fig. 11d and e) that forces a greater divergence (Fig. 11f and g) in the lower stratosphere. This, in turn, leads to a stronger rotational flow in the lower stratosphere in the climate-change-forced simulation.
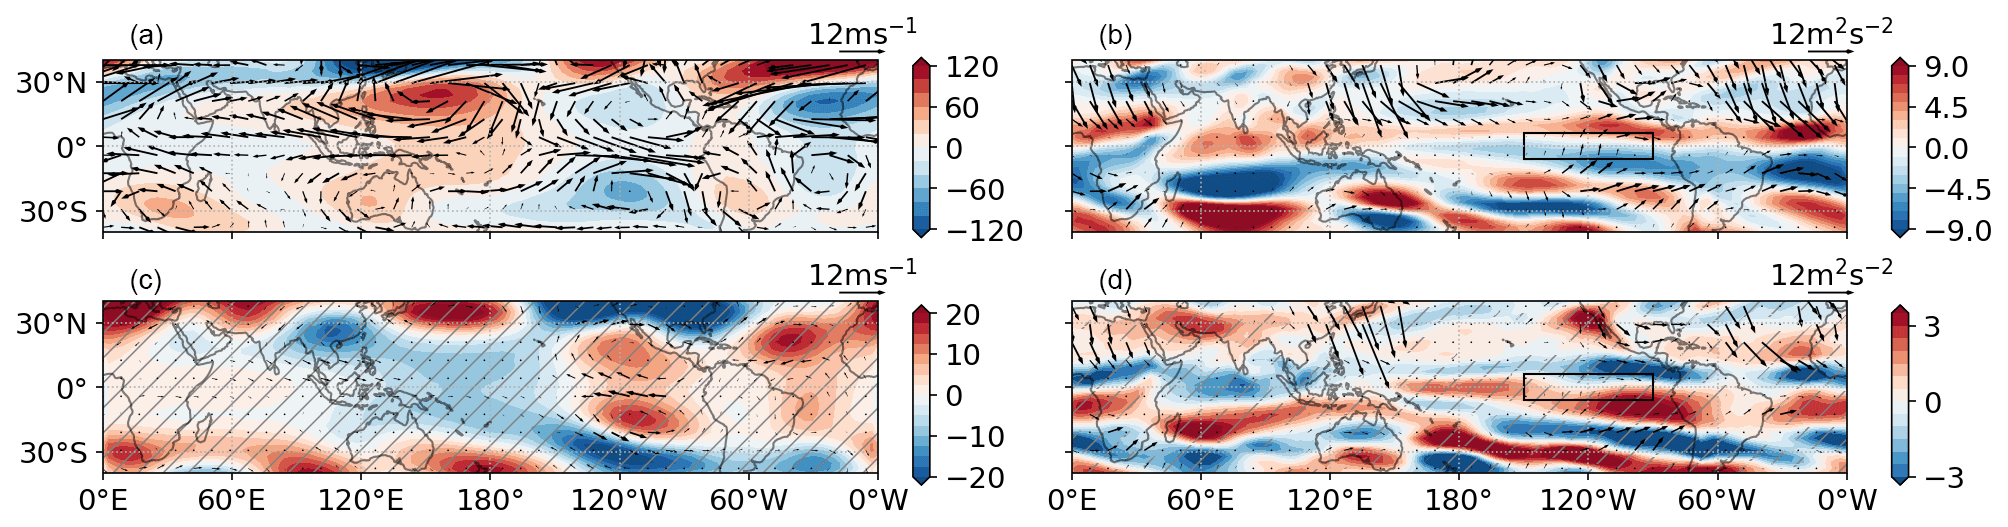
Figure 12Boreal winter seasonal mean distribution of eddy geopotential height (a, c; units: m) and eddy momentum flux convergence (b, d; units: m s−1 d−1), both for control (a, b) and the difference between forced and control simulations (c, d), at 250 mbar. Quivers represent eddy wind vectors (a, c) and wave activity flux vectors (b, d) computed at the same pressure level. In the climate change anomaly panels (c, d), the quivers are plotted at any point only if either the x or y component of the respective quantity is statistically significant at the 95 % level at that point. Please note that in panel (d) the quivers are for the forced run rather than the difference between forced and control simulations as in panel (c). Hatching denotes areas where the geopotential height (eddy momentum flux convergence) is statistically significant at the 95 % level.
Indeed, deeper convection and larger troposphere–stratosphere mass flux are anticipated in warming scenarios for winter as well. However, a brief look at the lower stratospheric vorticity balances over the Af-A sector during winter suggests important contributions from non-linear terms (Sardeshmukh and Hoskins, 1985). This is confirmed by Wang and Kushner (2011), who observe that the performance of their stationary wave model in simulating the NH winter stationary waves degrades when non-linearities are neglected. Hence, the underlying physical processes are possibly more involved than the elegant Sverdrup balance seen during summer. Further, climate change projections suggest that the trend of increased tropical upwelling and stronger BDC is larger in winter (Butchart et al., 2006; Butchart, 2014). Perhaps the stronger winter polar vortex allows stationary planetary-scale waves to propagate higher up into the stratosphere, leading to a deeper BDC through stratospheric control (Gerber, 2012).
It is possible that the changes in the summertime eddy flux over the CP-WA region (noted in Sect. 4.1, compare Fig. 6c and i) occur through similar dynamical interactions to those noted for the Af-A sector. This is because tropospheric vertical velocities strengthen in the east Pacific (Knutson and Manabe, 1995; Kang et al., 2023) and may lead to stronger eddy momentum flux convergence due to deeper and more intense convection. This would explain the strengthening of lower stratospheric rotational flow across all longitudes (Fig. 9b and d). However, in the next section, we explicitly focus on the wintertime change that is characterized by a significant decrease in the magnitude of the eddy momentum flux in the upper troposphere (Fig. 7c and i).
4.3 Changes in the east Pacific sector
Figure 12 captures the change that occurs in winter over the CP-WA sector. In comparison to the control set, the warming-induced changes suggest the appearance of anticyclonic anomalies straddling the Equator accompanied by eddy easterlies over the east Pacific (compare Fig. 12a and c). This suggests that the westerly duct weakens with warming, and this is possibly due to the general weakening of the upper-tropospheric stationary circulation pattern with warming (see Fig. 1b of Wills et al., 2019). As seen for the Af-A sector during summer, these stationary features weaken due to the larger weakening effect of the decrease in horizontal thermal gradients (Levine and Boos, 2016). Locally, over the east Pacific, this appears to be due to the weaker SST gradient associated with the appearance of the warm SST anomaly simulated by CMIP models in response to warming (DiNezio et al., 2009; Xie et al., 2010).
In turn, this is accompanied by a marked decrease in the eddy momentum fluxes on either side of the Equator (as seen in Sect. 4.1), along with a complete shutoff of the cross-equatorial propagation of wave activity over this region (Fig. 12d; note that the arrows in this panel are for the forced set rather than forced – control as in Fig. 12c). The warming-induced change in the basic-state background winds would impact the propagation characteristics of transient eddies as well. However, the wave activity fluxes of Fig. 12 only account for the stationary waves. Since these eddies are associated with the equatorward transport of PV across latitude circles (Ortega et al., 2018), we employ the PV flux metric on the 350 K isentrope to discern changes in the eddy activity. In the control set, the 350 K surface lies close to the 200 mbar surface (Fig. S5). As the tropical troposphere warms, the 350 K surface descends closer to the 300 mbar surface in the tropics. Since both of these levels stay within the upper troposphere, we consider PV fluxes on the 350 K isentrope.
On a given θ surface, the PV flux is defined as Ortega et al. (2018)
where p is the mass-weighted PV and v is the meridional wind, both in isentropic coordinates. We further decompose this flux into stationary and transient eddy contributions, following the standard Reynolds decomposition (Lee, 1999; Peixoto and Oort, 1992).
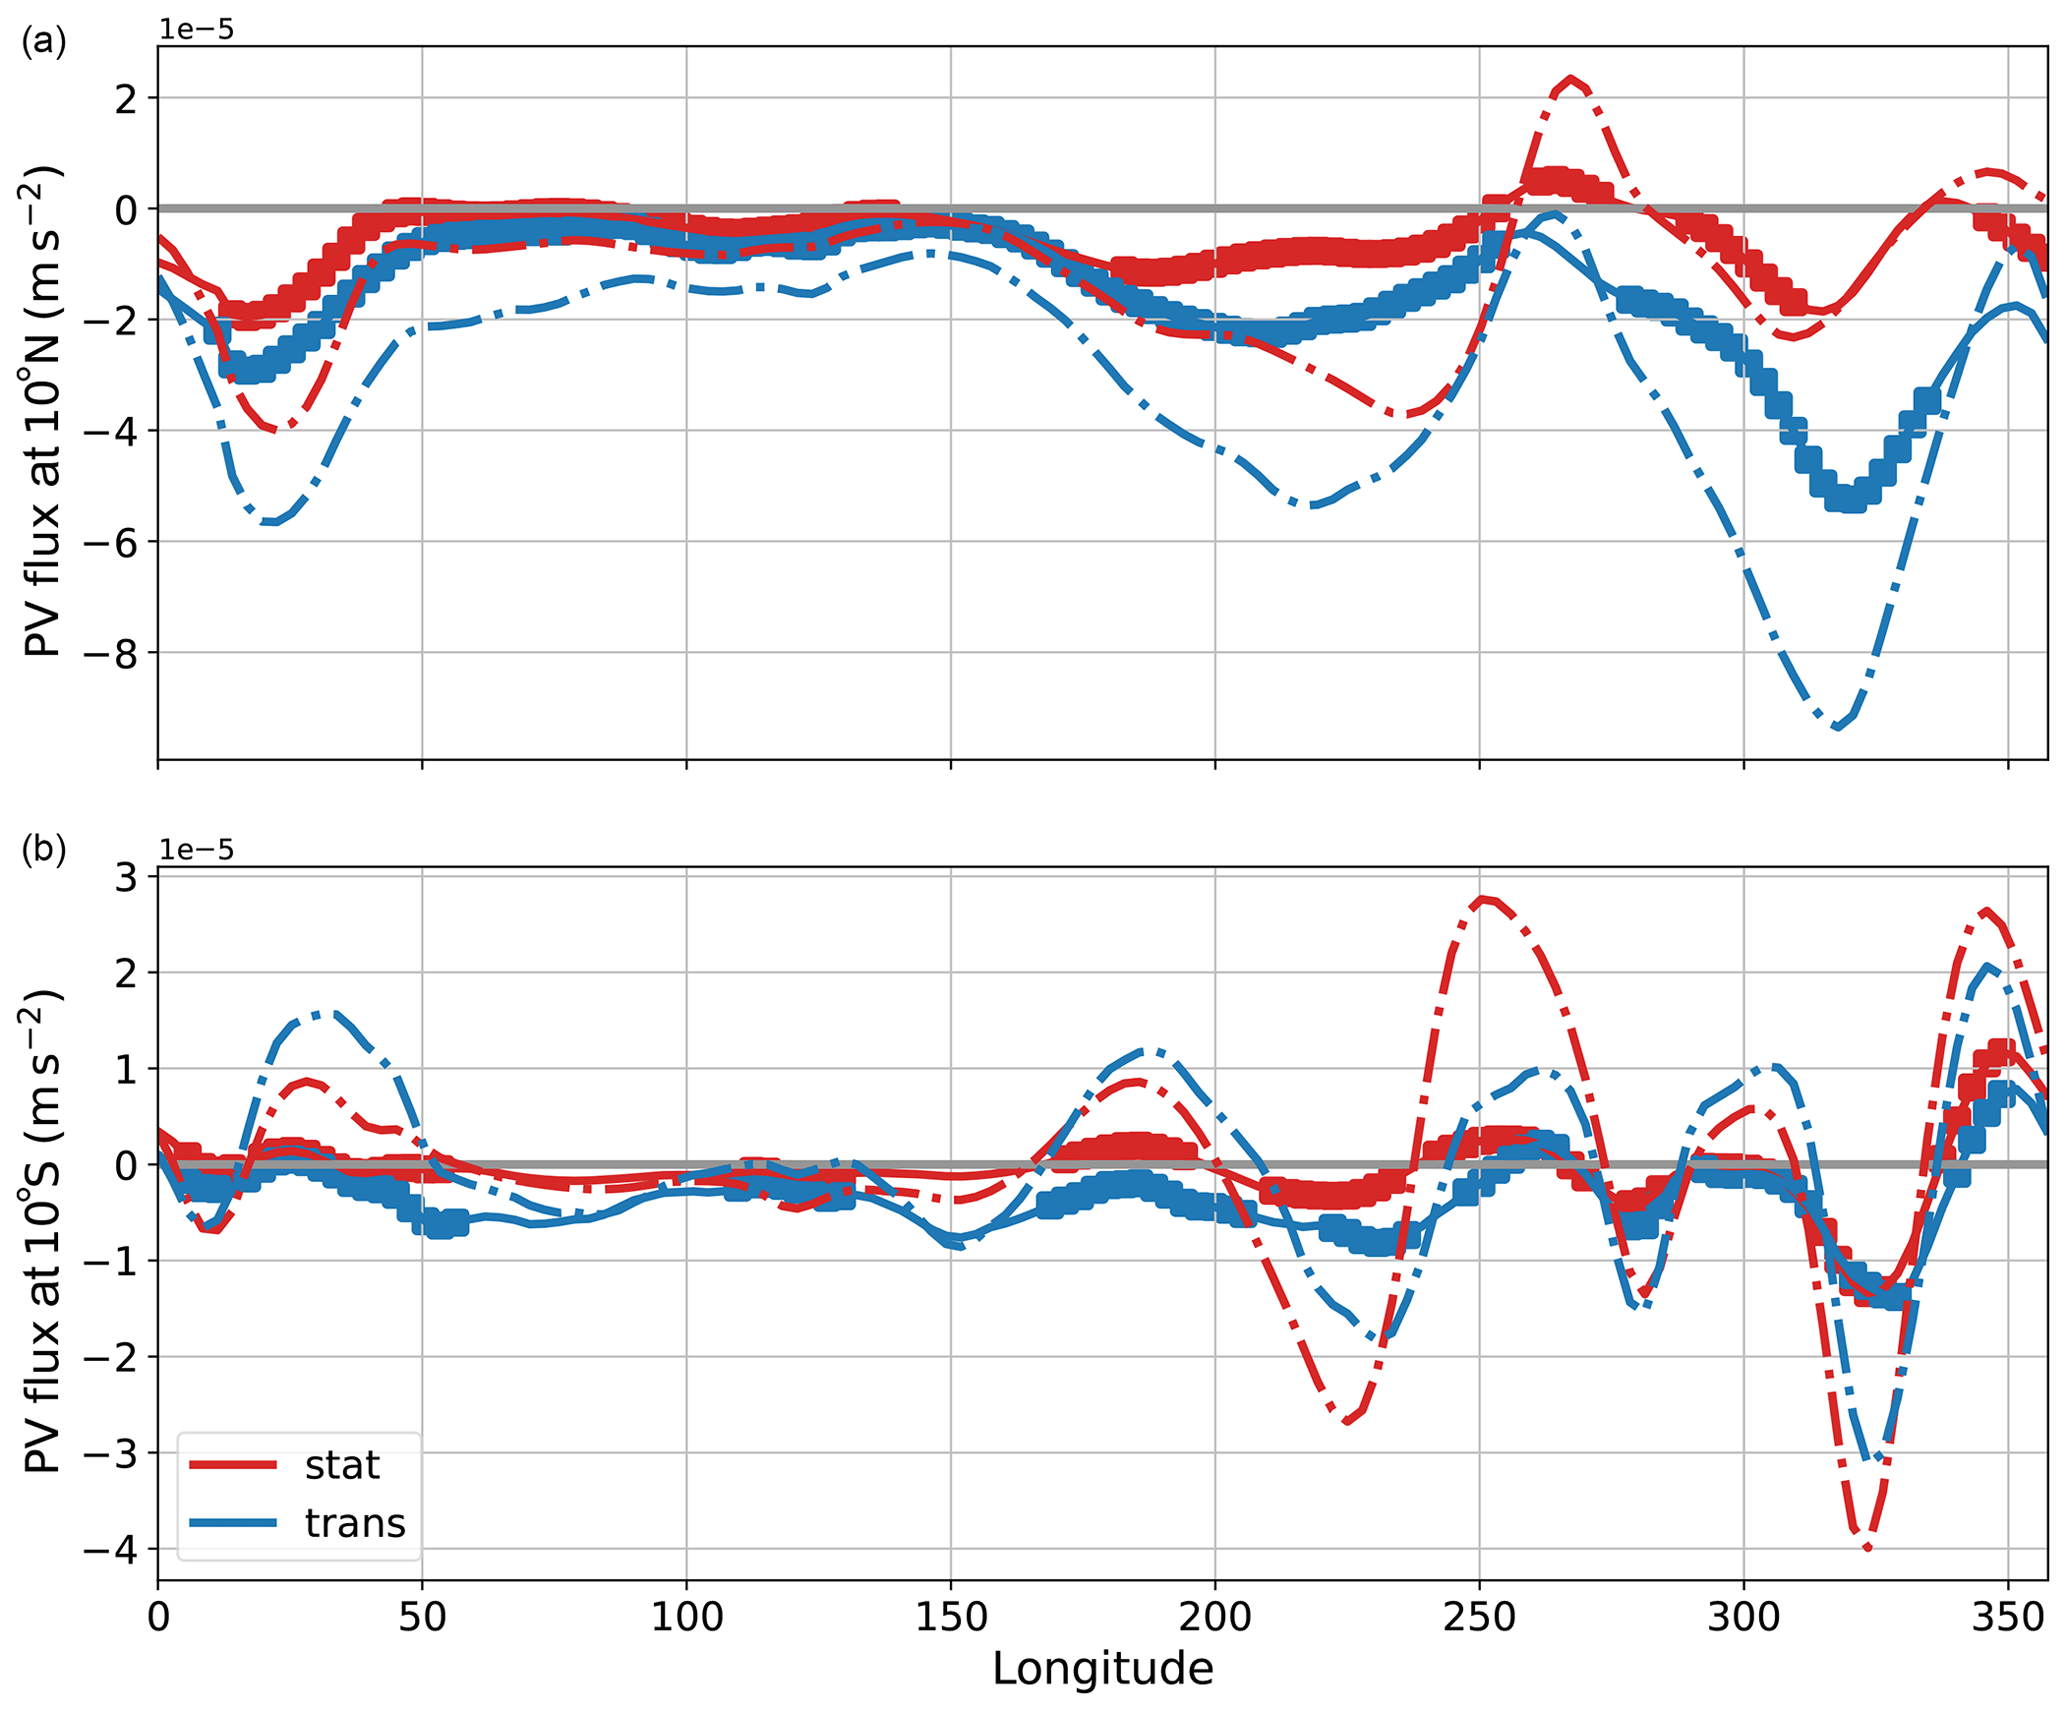
Figure 13Stationary (red) and transient (blue) fluxes of PV along (a) 10° N and (b) 10° on the 350 K isentrope averaged over winter (DJF). The solid (dash-dotted) curve represents the forced (control) set. Points marked with squares are statistically significant at the 95 % level. In both panels, positive (negative) values correspond to northward (southward) fluxes.
Figure 13 shows the stationary and transient fluxes of PV in red and blue curves at ±10°. In the control set (dash-dotted curves), the transient fluxes in the NH are generally equatorward and are larger in magnitude than the stationary fluxes (compare the dashed red and blue curves in Fig. 13). The transient disturbances originate in the extratropics and propagate towards the Equator (Edmon et al., 1980). The transient PV fluxes are weaker in the SH than in the NH. Consistent with the wave activity flux pattern (see Figs. 12b and 4b), we find equatorward stationary PV fluxes due to extratropical stationary waves. On either side of the Equator, the stationary flux has a northward component in the vicinity of the westerly duct. These features are in general agreement with the discussion in Sect. 3.
In response to warming, there is a sharp decrease in both the stationary and transient fluxes across all longitudes. Consistent with the wave activity flux for the forced set in Fig. 12d, the northward component of the stationary flux has almost disappeared. The decrease in the NH transient fluxes is generally larger than the stationary fluxes. These changes in the stationary and transient PV fluxes are consistent with the warming-induced changes in the extratropical stationary and transient eddy momentum fluxes, particularly in the NH (see Fig. 8). Further, the warming-induced changes in the wave activity fluxes may be due to changes in the propagation characteristics due to the changes in the basic-state background winds.
The warming-induced changes noted over the central and eastern Pacific are at odds with the historical trends in reanalysis data, which suggest an increase in the PV intrusions over this area (Nath et al., 2017). Such trends in observations have been attributed to the strengthening of the equatorial westerly window and, more fundamentally, the strengthening trend of the equatorial Pacific SST gradient. Thus, this is a manifestation of the dichotomy between observed La Niña-like strengthening and simulated El Niño-like weakening trends of the zonal SST gradients (Lee et al., 2022). The disagreement is usually attributed to model biases in simulating the equatorial Pacific cold tongue (Seager et al., 2019) or to multi-decadal internal climate variability obscuring the forced response (Watanabe et al., 2021). It has been suggested that models with poor representations of ENSO variability show the largest ENSO-like climate change in the tropical Pacific (Collins, 2005; Karamperidou et al., 2017). Further, models with larger Southern Ocean heat uptake exhibit lesser weakening of the zonal SST gradient (Kang et al., 2023). In all, future global and regional climate projections critically depend on the forced response of the equatorial Pacific Ocean.
The zonal mean momentum budget of the deep upper tropics is primarily known to be a balance between eddy momentum flux convergence and mean meridional momentum advection; these terms offset each other on seasonal and annual timescales (Lee, 1999; Dima et al., 2005). Since our motivation was to unravel the longitudinal heterogeneity that is a hallmark of our Earth system, we have focused on the regional contributions that sum to the zonal mean. Based on the zonal distribution of monsoonal diabatic heating, we subjectively partition the tropics into the zones of Africa–Asia (Af-A; 30–150° W) and the central Pacific–west Atlantic (CP-WA; 150–30° W). The nature of the fluxes in these geographically limited regions is considered.
We find that the Af-A sector provides the bulk of the eddy acceleration during the solstitial seasons. This is due to the action of the climatological stationary Rossby waves, forced by thermally divergent motions. These waves are present in this region throughout the year and shift in tune with the prevalent monsoon flow. The contribution from the CP-WA sector undergoes a semi-annual reversal; the eddies tend to accelerate the zonal flow in summer but exert a deceleration in winter. Analogous to the Asian sector, divergent motions forced by the summer ITCZ and the global monsoons converge eddy fluxes of momentum into this region during summer. However, during winter, the CP-WA sector experiences a deceleration due to the influx of extratropical wave activity in the east Pacific. A Helmholtz decomposition of the eddy fluxes concisely captures these features. Divergent eddy momentum flux characterizes the Af-A sector throughout the year, while the CP-WA undergoes a seasonal switch between rotational and divergent fluxes. In comparison, the mean meridional momentum advection has a similar character in the zonal mean and the individual sectors. Both sectors contribute cohesively toward the zonally averaged mean flow deceleration term via the advection of absolute vorticity by divergent meridional winds. Thus, in the context of the present-day climate, we have shown that the two-way balance between zonal mean eddy and mean flow terms is actually comprised of a seasonally sensitive three-way balance involving eddy fluxes of tropical and extratropical origin and the mean meridional momentum flux convergence.
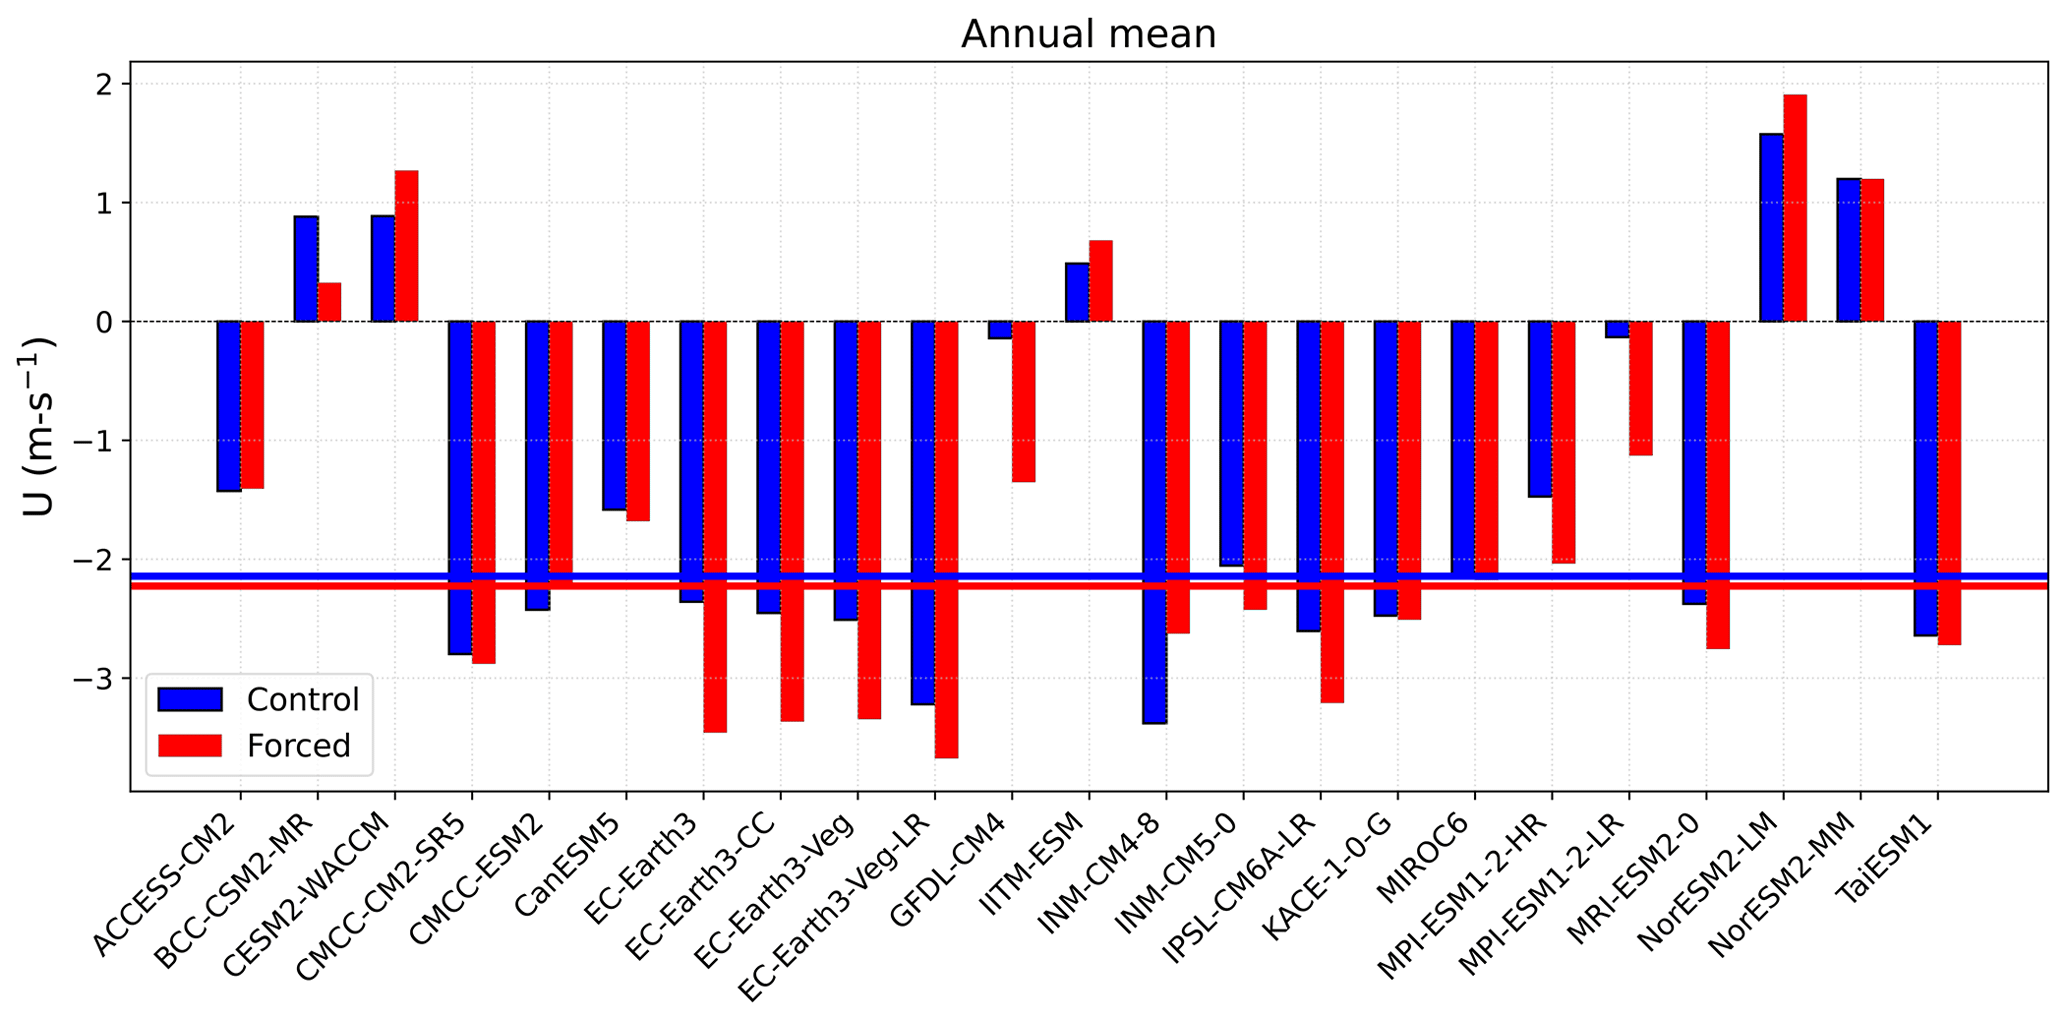
Figure 14Spread of the annual mean upper-tropospheric zonal mean zonal wind in the control (blue) and forced (red) ensembles, averaged over ±5° and 150–300 mbar. The horizontal lines indicate the median values of the forced (red) and control (blue) ensembles.
The expanding width of the tropics (Collins et al., 2013; Vallis et al., 2015), changing precipitation patterns and monsoon circulations (Ma et al., 2018; Wang et al., 2020), and weakening of the equatorial Pacific SST gradient (DiNezio et al., 2009; Xie et al., 2010) are some of the projections for a warmer tropical climate. These changes suggest that the impact of climate change is going to be felt strongly, even at a regional level. Given that the tropical momentum balance depends on both geographical location and the season, changes in the diabatic heating distribution associated with changing precipitation patterns may change the balance of momentum and, therefore, the zonal mean zonal winds as well. We analyze these possible changes in the second part of this study using the historical and ssp585 multi-model ensembles from the CMIP6 archive. Along with well-known robust responses of the circulation to externally forced warming, like the upward shift of the tropopause and a decrease in the mean meridional momentum advection term due to the weakening Hadley cell intensity, we observe statistically significant changes in eddy fluxes due to warming. As in the present-day climate, changes observed in the zonal mean closely resemble those in the Af-A sector. In the tropics, the eddy flux term shifts upwards along with the tropopause, decreasing the eddy momentum flux convergence in the upper troposphere but increasing it in the lower stratosphere. These changes are largely in the stationary component of the eddy flux, with a minor contribution from transient tropical eddies like the MJO.
Changes with warming during summer are most pronounced in the Asian region and are observed in both the upper troposphere and the lower stratosphere. The Asian monsoon anticyclone weakens in the upper troposphere and strengthens in the lower stratosphere. The upper-tropospheric change is well known (Ueda et al., 2006; Sooraj et al., 2015; Hsu et al., 2012) and is due to the larger weakening effect of smaller SST gradients with warming as opposed to the strengthening effect of warming-induced tropopause uplift (Levine and Boos, 2016). The strengthening in the lower stratosphere is larger in magnitude than the weakening in the upper troposphere, and as a result we observe a greater momentum flux convergence over the equatorial Indian Ocean with warming. We explain these changes using simple vorticity arguments. Since the large-scale summertime circulation is in Sverdrup balance, larger troposphere–stratosphere mass flux due to tropopause uplift leads to greater divergence and, consequently, stronger rotational flow. This mechanism is also qualitatively reproduced in a simple aquaplanet general circulation model. Given that the Asian summer anticyclone plays a vital role in the breaking of Rossby waves in the vicinity of the subtropical tropopause (Postel and Hitchmann, 1999), these structural changes may influence the frequency and intensity of such events as well as stratosphere–troposphere tracer and mass exchange (Chen, 1995; Dunkerton, 1995). Further, as pointed out by Postel and Hitchmann (1999), the Asian summer anticyclone appears as a smooth large-scale system in monthly and seasonal averages. In reality, it is a highly dynamic system that shows variability on finer spatial and temporal scales (Siu and Bowman, 2020), closely associated with the background flow (Rupp and Haynes, 2021). Given this background, the response of the Asian monsoon anticyclone to warming merits detailed investigation and will be taken up as future work.
During winter, the documented weakening of stationary waves (Joseph et al., 2004; Wills et al., 2019) causes a weakening of the upper-tropospheric eddy westerly winds over the east Pacific. This almost shuts off the equatorward propagation of wave activity, leading to a decrease in the magnitude of the zonal deceleration experienced by this region. We also note a drastic drop in equatorward stationary and transient potential vorticity fluxes on both sides of the Equator. Together, these changes cumulatively indicate a decrease in the intrusions of high potential vorticity air and tracers into the deep tropics (Waugh and Polvani, 2000). Such changes in the wave–mean flow interactions over the east Pacific bear important consequences for the weather and climate variability of this region. Indeed, the changes observed in eddy momentum fluxes, wave activity, and potential vorticity fluxes, as suggested by the CMIP6 projections, are a manifestation of many complicated processes induced by warming (Shaw, 2019; Vallis et al., 2015). In fact, warming-induced changes along similar lines have been reported previously as well. Freitas and Rao (2014) show that stationary Rossby wave propagation over long distances becomes unfavorable for the main waveguides in the NH and SH. Simpson et al. (2016) show that changes in the character of intermediate-scale stationary waves cause the circulation changes that impact the precipitation over California and the eastern Mediterranean. However, the warming-induced changes noted over the central and eastern Pacific are at odds with the recent trends in reanalysis data, which suggest an increase in the PV intrusions over this area (Nath et al., 2017). Such trends in observations have been attributed to the strengthening of the equatorial westerly window and, more fundamentally, the strengthening trend of the equatorial SST gradient. Therefore, this disagreement between observational and simulated trends originates in the mismatch in equatorial Pacific SST gradient trends, usually attributed to model biases or internal climate variability (Seager et al., 2019; Watanabe et al., 2021; Lee et al., 2022).
Similar discrepancies between observed and modeled trends have been shown to exist in other quantities related to the tropical general circulation. Santer et al. (2005) show that multi-decadal trends of tropospheric temperature amplification, captured by climate models, were observed in only one observational dataset. Mitas and Clement (2006) show that models and reanalyses disagree on the thermodynamic trends as well; while models exhibit warming in the upper troposphere and increased static stability, reanalyses show a cooling trend with decreased static stability. Further, models and reanalyses show opposite trends in the strength of the NH Hadley circulation (Chemke and Polvani, 2019). This stems from poor representation of diabatic heating (Chemke and Polvani, 2019) and long-term climate variability (Zaplotnik et al., 2022). Such disagreements are a major source of uncertainty in future projections and present a significant challenge to the scientific community.
Bringing together the changes in the upper troposphere with warming, we have shown that all terms involved in the momentum budget decrease in magnitude. The net effect on the annual and zonal mean zonal flow is a very slight decrease in the upper-tropospheric easterlies (compare median values of the control and forced ensembles in Fig. 14). This trend also holds for the seasonal mean values (Fig. S6). Indeed, there is a fair spread amongst the models; some models in the ensemble remain superrotating while others remain subrotating in both the control and forced sets (Figs. 14 and S6). However, the marginal decrease in the median values of the zonal mean zonal wind indicates that although projections suggest that the magnitudes of both the eddy and mean terms decrease with warming, the upper-tropospheric balance of momentum may not change significantly.
In all, one aspect of this study showcases the extent of internal compensations that occur when upper equatorial momentum fluxes are studied in a zonal mean sense. By presenting the results for the control simulations of CMIP6 alongside those for reanalysis, we hope to aid modeling groups in closing the gap between the two and, perhaps, provide better future projections on global and regional scales (Hall, 2014; Xie et al., 2015). For example, the smaller magnitude of eddy acceleration in the summer in the control set, especially in the CP-WA region, as compared to present-day estimates, possibly points to issues with the organization of the tropical convergence zone in the model runs. In summer, differences in the eddy and mean meridional momentum flux in the CP-WA region result in weaker upper-tropospheric easterlies in the CMIP6 control than in reanalysis. The second set of results involves state-of-the-art projections suggesting significant changes to the dominant terms contributing to the upper tropical momentum budget. Indeed, both the mean meridional and eddy fluxes are seen to change in a statistically significant manner. Particular attention was drawn to stationary contributions that dominate the eddy fluxes. At present, the balance of these terms is oriented to give upper tropical zonal mean easterlies (Lee, 1999; Dima et al., 2005). Which way this balance tilts will affect the future state of the atmosphere, including potential tipping to superrotation as is thought to have prevailed in past climates (Pierrehumbert, 2000; Tziperman and Farrell, 2009).
The ERA5 reanalysis (Hersbach et al., 2020) is available through the Climate Data Store (https://doi.org/10.24381/cds.143582cf, Hersbach et al., 2017). The CMIP6 data (Eyring et al., 2016) can be accessed through multiple sources including CDS (https://doi.org/10.24381/cds.c866074c, Copernicus Climate Change Service and Climate Data Store, 2005), WCRP archives (https://esgf-node.llnl.gov/projects/cmip6/, ESGF, 2024a, or https://esgf-node.ipsl.upmc.fr/projects/cmip6-ipsl/, ESGF, 2024b), and through the Pangeo project (https://gallery.pangeo.io/repos/pangeo-gallery/cmip6/, PANGEO Gallery, 2024). The CESM model code (CESM v2.1.3; Danabasoglu et al., 2020) is available at https://www.cesm.ucar.edu/models/cesm2 (NCAR, 2024). Further scripts can be made available upon reasonable request.
The supplement related to this article is available online at: https://doi.org/10.5194/wcd-5-839-2024-supplement.
JS conceived the idea of exploring the zonally dependent contributions that constitute the zonal mean momentum budget. Both authors designed the analysis. ABST collected the data, performed the simulations and the analysis, and wrote the first draft of the paper. Both authors contributed to the interpretation of the results and to the writing of the paper.
The contact author has declared that neither of the authors has any competing interests.
Publisher's note: Copernicus Publications remains neutral with regard to jurisdictional claims made in the text, published maps, institutional affiliations, or any other geographical representation in this paper. While Copernicus Publications makes every effort to include appropriate place names, the final responsibility lies with the authors.
Abu Bakar Siddiqui Thakur would like to thank Ruth Geen, Aiko Voigt, Suryadev Pratap Singh, and Rajat Masiwal for their helpful discussions, as well as Akshaya Nikumbh for her input on an initial version of the manuscript. The authors would like to thank the Supercomputer Education and Research Centre (SERC) at the Indian Institute of Science for high-performance computing facilities where the aquaplanet simulations were carried out.
Abu Bakar Siddiqui Thakur was funded by the Divecha Centre for Climate Change, Indian Institute of Science.
This paper was edited by Martin Singh and reviewed by two anonymous referees.
Adam, O., Schneider, T., and Harnik, N.: Role of changes in mean temperatures versus temperature gradients in the recent widening of the Hadley circulation, J. Climate, 27, 7450–7461, 2014. a
Adler, R. F., Huffman, G. J., Chang, A., Ferraro, R., Xie, P.-P., Janowiak, J., Rudolf, B., Schneider, U., Curtis, S., Bolvin, D., Gruber, A., Susskind, J., Arkin, P., and Nelkin, E.: The Version-2 Global Precipitation Climatology Project (GPCP) Monthly Precipitation Analysis (1979–Present), J. Hydrometeorol., 4, 1147–1167, https://doi.org/10.1175/1525-7541(2003)004<1147:TVGPCP>2.0.CO;2, 2003. a
Ait-Chaalal, F. and Schneider, T.: Why eddy momentum fluxes are concentrated in the upper troposphere, J. Atmos. Sci., 72, 1585–1604, https://doi.org/10.1175/JAS-D-14-0243.1, 2015. a, b
Arnold, N. P., Tziperman, E., and Farrell, B.: Abrupt transition to strong superrotation driven by equatorial wave resonance in an idealized GCM, J. Atmos. Sci., 69, 626–640, https://doi.org/10.1175/JAS-D-11-0136.1, 2012. a
Arnold, N. P., Kuang, Z., and Tziperman, E.: Enhanced MJO-like variability at high SST, J. Climate, 26, 988–1001, 2013. a
Arnold, N. P., Branson, M., Kuang, Z., Randall, D. A., and Tziperman, E.: MJO intensification with warming in the superparameterized CESM, J. Climate, 28, 2706–2724, 2015. a
Barnes, E. A. and Hartmann, D. L.: The global distribution of atmospheric eddy length scales, J. Climate, 25, 3409–3416, https://doi.org/10.1175/JCLI-D-11-00331.1, 2012. a
Boyle, J.: Upper level atmospheric stationary waves in the twentieth century climate of the Intergovernmental Panel on Climate Change simulations, J. Geophys. Res.-Atmos., 111, D14101, https://doi.org/10.1029/2005JD006612, 2006. a
Butchart, N.: The Brewer–Dobson circulation, Rev. Geophys., 52, 157–184, https://doi.org/10.1002/2013RG000448, 2014. a, b, c, d
Butchart, N., Scaife, A. A., Bourqui, M., de Grandpré, J., Hare, S. H. E., Kettleborough, J., Langematz, U, Manzini, E., Sassi, F., Shibata, K., Shindell, D., and Sigmond, M.: Simulations of anthropogenic change in the strength of the Brewer–Dobson circulation, Clim. Dynam., 27, 727–741, https://doi.org/10.1007/s00382-006-0162-4, 2006. a, b
Caballero, R. and Anderson, B. T.: Impact of midlatitude stationary waves on regional Hadley cells and ENSO, Geophys. Res. Lett., 36, L17704, https://doi.org/10.1029/2009gl039668, 2009. a, b
Caballero, R. and Carlson, H.: Surface superrotation, J. Atmos. Sci., 75, 3671–3689, https://doi.org/10.1175/JAS-D-18-0076.1, 2018. a
Caballero, R. and Huber, M.: Spontaneous transition to superrotation in warm climates simulated by CAM3, Geophys. Res. Lett., 37, L17704, https://doi.org/10.1029/2010GL043468, 2010. a
Carlson, H. and Caballero, R.: Enhanced MJO and transition to superrotation in warm climates, J. Adv. Model. Earth Syst., 8, 304–318, https://doi.org/10.1002/2015MS000615, 2016. a
Carr, M. T. and Bretherton, C. S.: Convective momentum transport over the tropical Pacific: Budget estimates, J. Atmos. Sci., 58, 1673–1693, 2001. a
Chemke, R. and Polvani, L. M.: Opposite tropical circulation trends in climate models and in reanalyses, Nat. Geosci., 12, 528–532, 2019. a, b
Chen, G., Lu, J., and Frierson, D. M.: Phase speed spectra and the latitude of surface westerlies: Interannual variability and global warming trend, J. Climate, 21, 5942–5959, 2008. a
Chen, P.: Isentropic cross-tropopause mass exchange in the extratropics, J. Geophys. Res., 100, 16661–16673, https://doi.org/10.1029/95JD01264, 1995. a
Chou, C. and Chen, C.-A.: Depth of convection and the weakening of tropical circulation in global warming, J. Climate, 23, 3019–3030, 2010. a
Collins, M.: El Niño-or La Niña-like climate change?, Clim. Dynam., 24, 89–104, 2005. a
Collins, M., Knutti, R., Arblaster, J., Dufresne, J.-L., Fichefet, T., Friedlingstein, P., Gao, X., Gutowski, W. J., Johns, T., Krinner, G., Shongwe, M., Tebaldi, C., Weaver, A. J., and Wehner, M.: Long-term climate change: projections, commitments and irreversibility, in: Climate Change 2013 – The Physical Science Basis: Contribution of Working Group I to the Fifth Assessment Report of the Intergovernmental Panel on Climate Change, Cambridge University Press, 1029–1136, https://www.ipcc.ch/report/ar5/wg1/ (last access: October 2023), 2013. a, b
Copernicus Climate Change Service and Climate Data Store: CMIP6 climate projections, Copernicus Climate Change Service (C3S) Climate Data Store (CDS) [data set], https://doi.org/10.24381/cds.c866074c, 2021. a
Danabasoglu, G., Lamarque, J.-F., Bacmeister, J., Bailey, D., DuVivier, A., Edwards, J., Emmons, L., Fasullo, J., Garcia, R., Gettelman, A., Hannay, C., Holland, M. M., Large, W. G., Lauritzen, P. H., Lawrence, D. M., Lenaerts, J. T. M., Lindsay, K., Lipscomb, W. H., Mills, M. J., Neale, R., Oleson, K. W., Otto-Bliesner, B., Phillips, A. S., Sacks, W., Tilmes, S., van Kampenhout, L., Vertenstein, M., Bertini, A., Dennis, J., Deser, C., Fischer, C., Fox-Kemper, B., Kay, J. E., Kinnison, D., Kushner, P. J., Larson, V. E., Long, M. C., Mickelson, S., Moore, J. K., Nienhouse, E.,Polvani, L., Rasch, P. J., and Strand, W. G.: The community earth system model version 2 (CESM2), J. Adv. Model. Earth Syst., 12, e2019MS001916, https://doi.org/10.1029/2019MS001916, 2020. a, b
Dawson, A.: Windspharm: A high-level library for global wind field computations using spherical harmonics, J. Open Res. Softw., 4, e31, https://doi.org/10.5334/jors.129, 2016. a
Dee, D. P., Uppala, S. M., Simmons, A. J., Berrisford, P., Poli, P., Kobayashi, S., Andrae, U., Balmaseda, M. A., Balsamo, G., Bauer, P., Bechtold, P., Beljaars, A. C. M., van de Berg, L., Bidlot, J., Bormann, N., Delsol, C., Dragani, R., Fuentes, M., Geer, A. J., Haimberger, L., Healy, S. B., Hersbach, H., Hólm, E. V., Isaksen, L., Kållberg, P., Köhler, M., Matricardi, M., McNally, A. P., Monge-Sanz, B. M., Morcrette, J.-J., Park, B.-K., Peubey, C., de Rosnay, P., Tavolato, C., Thépaut, J.-N., and Vitart, F.: The ERA-Interim reanalysis: configuration and performance of the data assimilation system, Q. J. Roy. Meteorol. Soc., 137, 553–597, https://doi.org/10.1002/qj.828, 2011. a
Dima, I. M., Wallace, J. M., and Kraucunas, I.: Tropical Zonal Momentum Balance in the NCEP Reanalyses, J. Atmos. Sci., 62, 2499–2513, https://doi.org/10.1175/jas3486.1, 2005. a, b, c, d, e, f, g, h, i, j, k
DiNezio, P. N., Clement, A. C., Vecchi, G. A., Soden, B. J., Kirtman, B. P., and Lee, S.-K.: Climate response of the equatorial Pacific to global warming, J. Climate, 22, 4873–4892, https://doi.org/10.1175/2009JCLI2982.1, 2009. a, b, c
Dunkerton, T.: Evidence of meridional motion in the summer lower stratosphere adjacent to monsoon regions, J. Geophys. Res., 100, 16675–16688, https://doi.org/10.1029/95JD01263, 1995. a
Edmon, H., Hoskins, B., and McIntyre, M.: Eliassen-Palm cross sections for the troposphere, J. Atmos. Sci., 37, 2600–2616, 1980. a
Eliassen, A. and Palm, E.: On the transfer of energy in stationary mountain waves, Geofys. Publ., 22, 1–23, 1961. a
ESGF: CMIP6, https://esgf-node.llnl.gov/projects/cmip6/ (last access: June 2024), 2024a. a
ESGF: WCRP Coupled Model Intercomparison Project (Phase 6), https://esgf-node.ipsl.upmc.fr/projects/cmip6-ipsl/ (last access: June 2024), 2024b. a
Eyring, V., Bony, S., Meehl, G. A., Senior, C. A., Stevens, B., Stouffer, R. J., and Taylor, K. E.: Overview of the Coupled Model Intercomparison Project Phase 6 (CMIP6) experimental design and organization, Geosci. Model Dev., 9, 1937–1958, https://doi.org/10.5194/gmd-9-1937-2016, 2016. a, b
Fedorov, A., Dekens, P., McCarthy, M., Ravelo, A., DeMenocal, P., Barreiro, M., Pacanowski, R., and Philander, S.: The Pliocene paradox (mechanisms for a permanent El Niño), Science, 312, 1485–1489, https://doi.org/10.1126/science.1122666, 2006. a
Freitas, A. C. V. and Rao, V. B.: Global changes in propagation of stationary waves in a warming scenario, Q. J. Roy. Meteorol. Soc., 140, 364–383, 2014. a
Frierson, D. M. and Hwang, Y.-T.: Extratropical influence on ITCZ shifts in slab ocean simulations of global warming, J. Climate, 25, 720–733, 2012. a
Frierson, D. M., Lu, J., and Chen, G.: Width of the Hadley cell in simple and comprehensive general circulation models, Geophys. Res. Lett., 34, L18804, https://doi.org/10.1029/2007GL031115, 2007. a, b, c, d
Galanti, E., Raiter, D., Kaspi, Y., and Tziperman, E.: Spatial patterns of the tropical meridional circulation: Drivers and teleconnections, J. Geophys. Res.-Atmos., 127, e2021JD035531, https://doi.org/10.1029/2021JD035531, 2022. a, b
Gerber, E.: Stratospheric versus Tropospheric Control of the Strength and Structure of the Brewer–Dobson circulation, J. Atmos. Sci., 69, 2857–2877, https://doi.org/10.1175/JAS-D-11-0341.1, 2012. a
Gill, A. E.: Some simple solutions for heat-induced tropical circulation, Q. J. Roy. Meteorol. Soc., 106, 447–462, https://doi.org/10.1002/qj.49710644905, 1980. a
Goyal, R., Jucker, M., Sen Gupta, A., Hendon, H. H., and England, M. H.: Zonal wave 3 pattern in the Southern Hemisphere generated by tropical convection, Nat. Geosci., 14, 732–738, 2021. a
Hall, A.: Projecting regional change, Science, 346, 1461–1462, https://doi.org/10.1126/science.aaa0629, 2014. a
Hausfather, Z. and Peters, G. P.: Emissions – the `business as usual' story is misleading, Nature, 577, 618–620, 2020. a
Held, I. M.: Equatorial Superrotation in Earth-like Atmospheric Models, Bernhard Haurwitz Memorial Lecture, https://www.gfdl.noaa.gov/wp-content/uploads/files/user_files/ih/lectures/super.pdf (last access: June 2024), 1999. a
Held, I. M. and Soden, B. J.: Robust responses of the hydrological cycle to global warming, J. Climate, 19, 5686–5699, https://doi.org/10.1175/JCLI3990.1, 2006. a
Held, I. M., Ting, M., and Wang, H.: Northern winter stationary waves: Theory and modeling, J. Climate, 15, 2125–2144, https://doi.org/10.1175/1520-0442(2002)015<2125:NWSWTA>2.0.CO;2, 2002. a
Hersbach, H., Bell, B., Berrisford, P., Hirahara, S., Horányi, A., Muñoz-Sabater, J., Nicolas, J., Peubey, C., Radu, R., Schepers, D., Simmons, A., Soci, C., Abdalla, S., Abellan, X., Balsamo, G., Bechtold, P., Biavati, G., Bidlot, J., Bonavita, M., De Chiara, G., Dahlgren, P., Dee, D., Diamantakis, M., Dragani, R., Flemming, J., Forbes, R., Fuentes, M., Geer, A., Haimberger, L., Healy, S., Hogan, R.J., Hólm, E., Janisková, M., Keeley, S., Laloyaux, P., Lopez, P., Lupu, C., Radnoti, G., de Rosnay, P., Rozum, I., Vamborg, F., Villaume, S., and Thépaut, J.-N.: Complete ERA5 from 1940: Fifth generation of ECMWF atmospheric reanalyses of the global climate, Copernicus Climate Change Service (C3S) Data Store (CDS) [data set], https://doi.org/10.24381/cds.143582cf, 2017. a
Hersbach, H., Bell, B., Berrisford, P., Hirahara, S., Horányi, A., Muñoz-Sabater, J., Nicolas, J., Peubey, C., Radu, R., Schepers, D., Simmons, A., Soci, C., Abdalla, S., Abellan, X., Balsamo, G., Bechtold, P., Biavati, G., Bidlot, J., Bonavita, M., De Chiara, G., Dahlgren, P., Dee, D., Diamantakis, M., Dragani, R., Flemming, J., Forbes, R., Fuentes, M., Geer, A., Haimberger, L., Healy, S., Hogan, R. J., Hólm, E., Janisková, M., Keeley, S., Laloyaux, P., Lopez, P., Lupu, C., Radnoti, G., de Rosnay, P., Rozum, I., Vamborg, F., Villaume, S., and Thépaut, J.-N.: The ERA5 global reanalysis, Q. J. Roy. Meteorol. Soc., 146, 1999–2049, 2020. a, b
Hoskins, B. and Yang, G.-Y.: A Global Perspective on the Upper Branch of the Hadley Cell, J. Climate, 36, 6749–6762, https://doi.org/10.1175/JCLI-D-22-0537.1, 2023. a, b
Hoskins, B. J. and Yang, G.-Y.: The Detailed Dynamics of the Hadley Cell. Part II: December–February, J. Climate, 34, 805–823, https://doi.org/10.1175/JCLI-D-20-0504.1, 2021. a, b
Hoskins, B. J., Yang, G.-Y., and Fonseca, R. M.: The detailed dynamics of the June–August Hadley Cell, Q. J. Roy. Meteorol. Soc., 146, 557–575, https://doi.org/10.1002/qj.3702, 2020. a, b
Hsu, P.-c., Li, T., Luo, J.-J., Murakami, H., Kitoh, A., and Zhao, M.: Increase of global monsoon area and precipitation under global warming: a robust signal?, Geophys. Res. Lett., 39, L06701, https://doi.org/10.1029/2012GL051037, 2012. a, b
Hu, Y. and Fu, Q.: Observed poleward expansion of the Hadley circulation since 1979, Atmos. Chem. Phys., 7, 5229–5236, https://doi.org/10.5194/acp-7-5229-2007, 2007. a
Joseph, R., Ting, M., and Kushner, P. J.: The global stationary wave response to climate change in a coupled GCM, J. Climate, 17, 540–556, https://doi.org/10.1175/1520-0442(2004)017<0540:TGSWRT>2.0.CO;2, 2004. a, b
Kang, S. M.: Extratropical influence on the tropical rainfall distribution, Curr. Clim. Change Rep., 6, 24–36, 2020. a
Kang, S. M., Shin, Y., Kim, H., Xie, S.-P., and Hu, S.: Disentangling the mechanisms of equatorial Pacific climate change, Sci. Adv., 9, eadf5059, https://doi.org/10.1126/sciadv.adf5059, 2023. a, b
Karamperidou, C., Jin, F.-F., and Conroy, J. L.: The importance of ENSO nonlinearities in tropical pacific response to external forcing, Clim. Dynam., 49, 2695–2704, 2017. a
Kelly, P. and Mapes, B.: Zonal mean wind, the Indian monsoon, and July drying in the western Atlantic subtropics, J. Geophys. Res.-Atmos., 116, D00Q07, https://doi.org/10.1029/2010jd015405, 2011. a
Keyser, D., Schmidt, B. D., and Duffy, D. G.: A technique for representing three-dimensional vertical circulations in baroclinic disturbances, Mon. Weather Rev., 117, 2463–2494, 1989. a
Kim, D., Kim, H., Kang, S. M., Stuecker, M. F., and Merlis, T. M.: Weak Hadley cell intensity changes due to compensating effects of tropical and extratropical radiative forcing, npj Clim. Atmos. Sci., 5, 61, https://doi.org/10.1038/s41612-022-00287-x, 2022. a
Knutson, T. R. and Manabe, S.: Time-Mean Response over the Tropical Pacific to Increased Co22 in a Coupled Ocean-Atmosphere Model, J. Climate, 8, 2181–2199, https://doi.org/10.1175/1520-0442(1995)008<2181:TMROTT>2.0.CO;2, 1995. a
Kraucunas, I. and Hartmann, D. L.: Equatorial Superrotation and the Factors Controlling the Zonal-Mean Zonal Winds in the Tropical Upper Troposphere, J. Atmos. Sci., 62, 371–389, https://doi.org/10.1175/jas-3365.1, 2005. a, b, c, d
Kraucunas, I. and Hartmann, D. L.: Tropical Stationary Waves in a Nonlinear Shallow-Water Model with Realistic Basic States, J. Atmos. Sci., 64, 2540–2557, https://doi.org/10.1175/jas3920.1, 2007. a, b
Krishnamurti, T., Biswas, M. K., and Bhaskar Rao, D.: Vertical extension of the Tibetan high of the Asian summer monsoon, Tellus A, 60, 1038–1052, 2008. a
Lan, J., Yang, J., Hu, Y., Li, X., Guo, J., Lin, Q., Han, J., Zhang, J., Wang, S., and Nie, J.: Weak Equatorial Superrotation during the Past 250 Million Years, J. Atmos. Sci., 80, 1003–1023, 2023. a
Lau, W. K. and Kim, K.-M.: Robust Hadley circulation changes and increasing global dryness due to CO2 warming from CMIP5 model projections, P. Natl. Acad. Sci. USA, 112, 3630–3635, 2015. a
Lee, S.: Why Are the Climatological Zonal Winds Easterly in the Equatorial Upper Troposphere?, J. Atmos. Sci., 56, 1353–1363, https://doi.org/10.1175/1520-0469(1999)056<1353:WATCZW>2.0.CO;2, 1999. a, b, c, d, e, f, g, h, i, j, k
Lee, S., Feldstein, S., Pollard, D., and White, T.: Do planetary wave dynamics contribute to equable climates?, J. Climate, 24, 2391–2404, 2011. a
Lee, S., L'Heureux, M., Wittenberg, A. T., Seager, R., O'Gorman, P. A., and Johnson, N. C.: On the future zonal contrasts of equatorial Pacific climate: Perspectives from Observations, Simulations, and Theories, npj Clim. Atmos. Sci., 5, 82, https://doi.org/10.1038/s41612-022-00301-2, 2022. a, b
Levine, X. and Boos, W.: A Mechanism for the Response of the Zonally Asymmetric Subtropical Hydrologic Cycle to Global Warming, J. Climate, 29, 7851–7867, https://doi.org/10.1175/JCLI-D-15-0826.1, 2016. a, b, c
Levine, X. J. and Schneider, T.: Response of the Hadley circulation to climate change in an aquaplanet GCM coupled to a simple representation of ocean heat transport, J. Atmos. Sci., 68, 769–783, https://doi.org/10.1175/2010JAS3553.1, 2011. a
Levine, X. J. and Schneider, T.: Baroclinic eddies and the extent of the Hadley circulation: An idealized GCM study, J. Atmos. Sci., 72, 2744–2761, https://doi.org/10.1175/JAS-D-14-0152.1, 2015. a
Lin, J.-L., Mapes, B. E., and Han, W.: What are the sources of mechanical damping in Matsuno–Gill-type models?, J. Climate, 21, 165–179, https://doi.org/10.1175/2007JCLI1546.1, 2008. a, b
Lorenz, D. and DeWeaver, E.: Tropopause height and zonal wind response to global warming in the IPCC scenario integrations, J. Geophys. Res., 112, D10119, https://doi.org/10.1029/2006JD008087, 2007. a
Lu, J., Vecchi, G. A., and Reichler, T.: Expansion of the Hadley cell under global warming, Geophys. Res. Lett., 34, L06805, https://doi.org/10.1029/2006GL028443, 2007. a, b, c
Lu, J., Chen, G., and Frierson, D. M. W.: Response of the Zonal Mean Atmospheric Circulation to El Niño versus Global Warming, J. Climate, 21, 5835–5851, https://doi.org/10.1175/2008JCLI2200.1, 2008. a
Ma, J. and Yu, J.-Y.: Paradox in South Asian summer monsoon circulation change: Lower tropospheric strengthening and upper tropospheric weakening, Geophys. Res. Lett., 41, 2934–2940, 2014. a
Ma, J., Chadwick, R., Seo, K.-H., Dong, C., Huang, G., Foltz, G. R., and Jiang, J. H.: Responses of the tropical atmospheric circulation to climate change and connection to the hydrological cycle, Annu. Rev. Earth Planet. Sci., 46, 549–580, https://doi.org/10.1146/annurev-earth-082517-010102, 2018. a, b
Maloney, E. D., Adames, Á. F., and Bui, H. X.: Madden–Julian oscillation changes under anthropogenic warming, Nat. Clim. Change, 9, 26–33, https://doi.org/10.1038/s41558-018-0331-6, 2019. a
Matthews, A. J.: A multiscale framework for the origin and variability of the South Pacific Convergence Zone, Q. J. Roy. Meteorol. Soc., 138, 1165–1178, 2012. a
McLandress, C. and Shepherd, T. G.: Simulated anthropogenic changes in the Brewer–Dobson circulation, including its extension to high latitudes, J. Climate, 22, 1516–1540, 2009. a, b
Mitas, C. M. and Clement, A.: Recent behavior of the Hadley cell and tropical thermodynamics in climate models and reanalyses, Geophys. Res. Lett., 33, L01810, https://doi.org/10.1029/2005GL024406, 2006. a
Mitchell, D. M., Lo, Y. E., Seviour, W. J., Haimberger, L., and Polvani, L. M.: The vertical profile of recent tropical temperature trends: Persistent model biases in the context of internal variability, Environ. Res. Lett., 15, 1040b4, https://doi.org/10.1088/1748-9326/ab9af7, 2020. a
Nath, D., Chen, W., and Lan, X.: Long-term trend in potential vorticity intrusion events over the Pacific Ocean: Role of global mean temperature rise, J. Meteorol. Res., 31, 906–915, 2017. a, b
NCAR: Community Earth System Model 2 (CESM2), https://www.cesm.ucar.edu/models/cesm2 (last access: June 2024), 2024. a
Nguyen, H., Evans, A., Lucas, C., Smith, I., and Timbal, B.: The Hadley circulation in reanalyses: Climatology, variability, and change, J. Climate, 26, 3357–3376, https://doi.org/10.1175/JCLI-D-12-00224.1, 2013. a
Nguyen, H., Hendon, H., Lim, E. P., Boschat, G., Maloney, E., and Timbal, B.: Variability of the extent of the Hadley circulation in the Southern Hemisphere: A regional perspective, Clim. Dynam., 50, 129–142, 2018. a
Oberländer-Hayn, S., Gerber, E. P., Abalichin, J., Akiyoshi, H., Kerschbaumer, A., Kubin, A., Kunze, M., Langematz, U., Meul, S., Michou, M., Morgenstern, O., and Oman, L. D.: Is the Brewer–Dobson circulation increasing or moving upward?, Geophys. Res. Lett., 43, 1772–1779, 2016. a
O'Neill, B. C., Kriegler, E., Ebi, K. L., Kemp-Benedict, E., Riahi, K., Rothman, D. S., Van Ruijven, B. J., Van Vuuren, D. P., Birkmann, J., Kok, K., Levy, M., and Solecki, W.: The roads ahead: Narratives for shared socioeconomic pathways describing world futures in the 21st century, Global Environ. Change, 42, 169–180, 2017. a
Ortega, S., Webster, P. J., Toma, V., and Chang, H.-R.: The effect of potential vorticity fluxes on the circulation of the tropical upper troposphere, Q. J. Roy. Meteorol. Soc., 144, 848–860, 2018. a, b
PANGEO Gallery: CMIP6 Gallery, https://gallery.pangeo.io/repos/pangeo-gallery/cmip6/ (last access: June 2024), 2024. a
Peixoto, J. P. and Oort, A. H.: Physics of climate, in: vol. 520, Springer, ISBN 13.978-0883187128, 1992. a, b
Pierrehumbert, R. T.: Climate change and the tropical Pacific: The sleeping dragon wakes, P. Natl. Acad. Sci. USA, 97, 1355–1358, https://doi.org/10.1073/pnas.97.4.1355, 2000. a, b, c
Plumb, R. A.: On the three-dimensional propagation of stationary waves, J. Atmos. Sci., 42, 217–229, https://doi.org/10.1175/1520-0469(1985)042<0217:OTTDPO>2.0.CO;2, 1985. a, b, c
Postel, G. and Hitchmann, M.: A Climatology of Rossby Wave Breaking along the Subtropical Tropopause, J. Atmos. Sci., 56, 359–373, https://doi.org/10.1175/1520-0469(1999)056<0359:ACORWB>2.0.CO;2, 1999. a, b
Raiter, D., Galanti, E., and Kaspi, Y.: The tropical atmospheric conveyor belt: A coupled Eulerian-Lagrangian analysis of the large-scale tropical circulation, Geophys. Res. Lett., 47, e2019GL086437, https://doi.org/10.1029/2019GL086437, 2020. a, b
Randel, W. J. and Park, M.: Deep convective influence on the Asian summer monsoon anticyclone and associated tracer variability observed with Atmospheric Infrared Sounder (AIRS), J. Geophys. Res., 111, D12314, https://doi.org/10.1029/2005JD006490, 2006. a
Randel, W. J., Park, M., Emmons, L., Kinnison, D., Bernath, P., Walker, K. A., Boone, C., and Pumphrey, H.: Asian monsoon transport of pollution to the stratosphere, Science, 328, 611–613, 2010. a
Reichler, T., Dameris, M., and Sausen, R.: Determining the tropopause height from gridded data, Geophys. Res. Lett., 30, 2042, https://doi.org/10.1029/2003GL018240, 2003. a
Rodwell, M. J. and Hoskins, B. J.: Monsoons and the dynamics of deserts, Q. J. Roy. Meteorol. Soc., 122, 1385–1404, 1996. a
Rupp, P. and Haynes, P.: Zonal scale and temporal variability of the Asian monsoon anticyclone in an idealised numerical model, Weather Clim. Dynam., 2, 413–431, https://doi.org/10.5194/wcd-2-413-2021, 2021. a
Santer, B. D., Wigley, T. M. L., Mears, C., Wentz, F. J., Klein, S. A., Seidel, D. J., Taylor, K. E., Thorne, P. W., Wehner, M. F., Gleckler, P. J., Boyle, J. S., Collins, W. D., Dixon, K. W., Doutriaux, C., Free, M., Fu, Q., Hansen, J. E., Jones, G. S., Ruedy, R., Karl, T. R., Lanzante, J. R., Meehl, G. A., Ramaswamy, V., Russell, G., and Schmidt, G. A.: Amplification of surface temperature trends and variability in the tropical atmosphere, Science, 309, 1551–1556, 2005. a
Sardeshmukh, P. D. and Held, I. M.: The vorticity balance in the tropical upper troposphere of a general circulation model, J. Atmos. Sci., 41, 768–778, https://doi.org/10.1175/1520-0469(1984)041<0768:TVBITT>2.0.CO;2, 1984. a
Sardeshmukh, P. D. and Hoskins, B. J.: Vorticity balances in the tropics during the 1982–83 El Niñio-Southern oscillation event, Q. J. Roy. Meteorol. Soc., 111, 261–278, 1985. a
Schneider, T.: The general circulation of the atmosphere, Annu. Rev. Earth Planet. Sci., 34, 655–688, 2006. a
Schneider, T., O'Gorman, P. A., and Levine, X. J.: Water vapor and the dynamics of climate changes, Rev. Geophys., 48, RG3001, https://doi.org/10.1029/2009RG000302, 2010. a
Schwendike, J., Govekar, P., Reeder, M. J., Wardle, R., Berry, G. J., and Jakob, C.: Local partitioning of the overturning circulation in the tropics and the connection to the Hadley and Walker circulations, J. Geophys. Res.-Atmos., 119, 1322–1339, https://doi.org/10.1002/2013jd020742, 2014. a, b
Seager, R., Harnik, N., Kushnir, Y., Robinson, W., and Miller, J.: Mechanisms of hemispherically symmetric climate variability, J. Climate, 16, 2960–2978, 2003. a
Seager, R., Cane, M., Henderson, N., Lee, D.-E., Abernathey, R., and Zhang, H.: Strengthening tropical Pacific zonal sea surface temperature gradient consistent with rising greenhouse gases, Nat. Clim. Change, 9, 517–522, 2019. a, b
Seidel, D. J., Fu, Q., Randel, W. J., and Reichler, T. J.: Widening of the tropical belt in a changing climate, Nat. Geosci., 1, 21–24, https://doi.org/10.1038/ngeo.2007.38, 2008. a
Shaw, T. A.: On the Role of Planetary-Scale Waves in the Abrupt Seasonal Transition of the Northern Hemisphere General Circulation, J. Atmos. Sci., 71, 1724–1746, https://doi.org/10.1175/jas-d-13-0137.1, 2014. a
Shaw, T. A.: Mechanisms of future predicted changes in the zonal mean mid-latitude circulation, Curr. Clim. Change Rep., 5, 345–357, https://doi.org/10.1007/s40641-019-00145-8, 2019. a
Shepherd, T. and McLandress, C.: A Robust Mechanism for Strengthening of the Brewer–Dobson Circulation in Response to Climate Change: Critical-Layer Control of Subtropical Wave Breaking, J. Atmos. Sci., 68, 784–797, https://doi.org/10.1175/2010JAS3608.1, 2011. a
Shepherd, T. G.: Atmospheric circulation as a source of uncertainty in climate change projections, Nat. Geosci., 7, 703–708, 2014. a
Simpson, I. R., Seager, R., Ting, M., and Shaw, T. A.: Causes of change in Northern Hemisphere winter meridional winds and regional hydroclimate, Nat. Clim. Change, 6, 65–70, https://doi.org/10.1038/nclimate2783, 2016. a
Singh, M. S. and O'Gorman, P. A.: Upward shift of the atmospheric general circulation under global warming: Theory and simulations, J. Climate, 25, 8259–8276, 2012. a
Siu, L. W. and Bowman, K. P.: Unsteady vortex behavior in the Asian monsoon anticyclone, J. Atmos. Sci., 77, 4067–4088, 2020. a
Sooraj, K., Terray, P., and Mujumdar, M.: Global warming and the weakening of the Asian summer monsoon circulation: assessments from the CMIP5 models, Clim. Dynam., 45, 233–252, https://doi.org/10.1007/s00382-014-2257-7, 2015. a, b
Staten, P. W., Grise, K. M., Davis, S. M., Karnauskas, K., and Davis, N.: Regional widening of tropical overturning: Forced change, natural variability, and recent trends, J. Geophys. Res.-Atmos., 124, 6104–6119, 2019. a, b
Suarez, M. and Duffy, D.: Terrestrial Superrotation: A Bifurcation of the General Circulation, J. Atmos. Sci., 49, 1541–1554, https://doi.org/10.1175/1520-0469(1992)049<1541:TSABOT>2.0.CO;2, 1992. a
Sun, Y., Li, L. Z., Ramstein, G., Zhou, T., Tan, N., Kageyama, M., and Wang, S.: Regional meridional cells governing the interannual variability of the Hadley circulation in boreal winter, Clim. Dynam., 52, 831–853, https://doi.org/10.1007/s00382-018-4263-7, 2019. a, b
Tandon, N. F., Gerber, E. P., Sobel, A. H., and Polvani, L. M.: Understanding Hadley cell expansion versus contraction: Insights from simplified models and implications for recent observations, J. Climate, 26, 4304–4321, https://doi.org/10.1175/JCLI-D-12-00598.1, 2013. a
Tziperman, E. and Farrell, B.: Pliocene equatorial temperature: Lessons from atmospheric superrotation, Paleoceanography, 24, PA1101, https://doi.org/10.1029/2008PA001652, 2009. a, b, c
Ueda, H., Iwai, A., Kuwako, K., and Hori, M. E.: Impact of anthropogenic forcing on the Asian summer monsoon as simulated by eight GCMs, Geophys. Res. Lett., 33, L06703, https://doi.org/10.1029/2005GL025336, 2006. a, b
Vallis, G. K.: Atmospheric and Oceanic Fluid Dynamics: Fundamentals and Large-Scale Circulation, in: 2nd Edn., Cambridge University Press, Cambridge, UK, ISBN 9781107588417, https://doi.org/10.1017/9781107588417, 2017. a
Vallis, G. K., Zurita-Gotor, P., Cairns, C., and Kidston, J.: Response of the large-scale structure of the atmosphere to global warming, Q. J. Roy. Meteorol. Soc., 141, 1479–1501, https://doi.org/10.1002/qj.2456, 2015. a, b, c, d, e
Wang, B., Jin, C., and Liu, J.: Understanding future change of global monsoons projected by CMIP6 models, J. Climate, 33, 6471–6489, https://doi.org/10.1175/JCLI-D-19-0993.1, 2020. a
Wang, C., Zhang, L., Lee, S.-K., Wu, L., and Mechoso, C. R.: A global perspective on CMIP5 climate model biases, Nat. Clim. Change, 4, 201–205, 2014. a
Wang, L. and Kushner, P.: Diagnosing the stratosphere‐troposphere stationary wave response to climate change in a general circulation model, J. Geophys. Res., 116, D16113, https://doi.org/10.1029/2010JD015473, 2011. a
Wara, M. W., Ravelo, A. C., and Delaney, M. L.: Permanent El Niño-like conditions during the Pliocene warm period, Science, 309, 758–761, https://doi.org/10.1126/science.1112596, 2005. a
Watanabe, M., Dufresne, J.-L., Kosaka, Y., Mauritsen, T., and Tatebe, H.: Enhanced warming constrained by past trends in equatorial Pacific sea surface temperature gradient, Nat. Clim. Change, 11, 33–37, 2021. a, b
Waugh, D. and Polvani, L.: Climatology of Intrusions into the Tropical Upper Troposphere, Geophys. Res. Lett., 27, 3857–3860, https://doi.org/10.1029/2000GL012250, 2000. a, b
Waugh, D. W. and Funatsu, B. M.: Intrusions into the tropical upper troposphere: Three-dimensional structure and accompanying ozone and OLR distributions, J. Atmos. Sci., 60, 637–653, 2003. a
Webb, M. J., Andrews, T., Bodas-Salcedo, A., Bony, S., Bretherton, C. S., Chadwick, R., Chepfer, H., Douville, H., Good, P., Kay, J. E., Klein, S. A., Marchand, R., Medeiros, B., Siebesma, A. P., Skinner, C. B., Stevens, B., Tselioudis, G., Tsushima, Y., and Watanabe, M.: The Cloud Feedback Model Intercomparison Project (CFMIP) contribution to CMIP6, Geosci. Model Dev., 10, 359–384, https://doi.org/10.5194/gmd-10-359-2017, 2017. a, b
Wilks, D. S.: Statistical methods in the atmospheric sciences, in: vol. 100, Academic Press, ISBN 9780080456225, 2011. a
Wills, R. C., White, R. H., and Levine, X. J.: Northern hemisphere stationary waves in a changing climate, Curr. Clim. Change Rep., 5, 372–389, https://doi.org/10.1007/s40641-019-00147-6, 2019. a, b, c
Wu, Y. and Shaw, T. A.: The impact of the Asian summer monsoon circulation on the tropopause, J. Climate, 29, 8689–8701, https://doi.org/10.1175/JCLI-D-16-0204.1, 2016. a, b, c
Xie, S.-P., Deser, C., Vecchi, G. A., Ma, J., Teng, H., and Wittenberg, A. T.: Global warming pattern formation: Sea surface temperature and rainfall, J. Climate, 23, 966–986, 2010. a, b, c, d
Xie, S.-P., Deser, C., Vecchi, G. A., Collins, M., Delworth, T. L., Hall, A., Hawkins, E., Johnson, N. C., Cassou, C., Giannini, A., and Watanabe, M.: Towards predictive understanding of regional climate change, Nat. Clim. Change, 5, 921–930, https://doi.org/10.1038/nclimate2689, 2015. a
Yang, W., Seager, R., and Cane, M. A.: Zonal momentum balance in the tropical atmospheric circulation during the global monsoon mature months, J. Atmos. Sci., 70, 583–599, 2013. a, b
Zaplotnik, Ž., Pikovnik, M., and Boljka, L.: Recent Hadley circulation strengthening: a trend or multidecadal variability?, J. Climate, 35, 4157–4176, 2022. a
Zhang, C., McGauley, M., and Bond, N. A.: Shallow meridional circulation in the tropical eastern Pacific, J. Climate, 17, 133–139, https://doi.org/10.1175/2007JCLI1870.1, 2004. a
Zhang, G. and Wang, Z.: Interannual Variability of the Atlantic Hadley Circulation in Boreal Summer and Its Impacts on Tropical Cyclone Activity, J. Climate, 26, 8529–8544, https://doi.org/10.1175/jcli-d-12-00802.1, 2013. a, b
Zhang, P. and Lutsko, N. J.: Seasonal superrotation in Earth's troposphere, J. Atmos. Sci., 79, 3297–3314, 2022. a
Zurita-Gotor, P.: The Role of the Divergent Circulation for Large-Scale Eddy Momentum Transport in the Tropics. Part I: Observations, J. Atmos. Sci., 76, 1125–1144, https://doi.org/10.1175/jas-d-18-0297.1, 2019. a, b, c