the Creative Commons Attribution 4.0 License.
the Creative Commons Attribution 4.0 License.
 | 19 Jul 2024
Towards a process-oriented understanding of the impact of stochastic perturbations on the model climate
Moritz Deinhard
Christian M. Grams
Stochastic parametrisation techniques have been used by operational weather centres for decades to produce ensemble forecasts and to represent uncertainties in the forecast model. Their use has been demonstrated to be highly beneficial, as it increases the reliability of the forecasting system and reduces systematic biases. Despite the random nature of the perturbation techniques, the response of the model can be nonlinear, and the mean state of the model can change. In this study, we attempt to provide a process-based understanding of how stochastic model perturbations affect the model climate. Previous work has revealed sensitivities of the occurrence of diabatically driven, rapidly ascending airstreams to the stochastically perturbed parametrisation tendencies (SPPT) scheme. Such strongly ascending airstreams are linked to different weather phenomena, such as precipitation and upper-tropospheric ridge building in the midlatitudes, which raises the question of whether these processes are also influenced by stochastic perturbations.
First, we analyse if rapidly ascending airstreams also show sensitivities to a different perturbation technique – the stochastically perturbed parametrisations (SPP) scheme, which directly represents parameter uncertainty in parametrisations and has recently been developed at the European Centre for Medium-Range Weather Forecasts (ECMWF). By running a set of sensitivity experiments with the Integrated Forecasting System (IFS) and by employing a Lagrangian detection of ascending airstreams, we show that SPP results in a systematic increase in the occurrence of ascending air parcel trajectories compared to simulations with unperturbed model physics. This behaviour is very similar to that of SPPT, although some regional differences are apparent. The one-sided response to the stochastic forcing is also observed when only specific parametrisations are perturbed (only convection parametrisation and all parametrisations but convection), and we hypothesise that the effect cannot be attributed to a single process.
Thereafter, we link the frequency changes in ascending airstreams to closely related weather phenomena. While the signal of increased ascending motion is directly transmitted to global precipitation sums for all analysed schemes, changes to the amplitude of the upper-level Rossby wave pattern are more subtle. In agreement with the trajectory analysis, both SPPT and SPP increase the waviness of the upper-level flow and thereby reduce a systematic bias in the model, even though the magnitude is small.
Our study presents a coherent process chain that enables us to understand how stochastic perturbations systematically affect the model climate. We argue that weather systems which are characterised by threshold behaviour on the one hand and that serve as a dynamical hinge between spatial scales on the other hand can convert zero-mean perturbations into an asymmetric response and project it onto larger scales.
- Article
(3527 KB) - Full-text XML
- BibTeX
- EndNote


Ensemble prediction aims to represent forecast uncertainty by estimating the future probability density function of the atmospheric state (Leutbecher and Palmer, 2008). This is typically achieved by running multiple integrations of the forecast model with small perturbations which grow with forecast lead time due to the chaotic behaviour of the atmosphere and thereby represent different realisations of the evolution of the system. During the early years of ensemble prediction, probabilistic forecasts were generated with perturbations to the initial conditions only (Lewis, 2005). However, such forecasts are underdispersive and on average do not adequately capture the uncertainty in the forecast (e.g. Palmer et al., 2005). To further increase the dispersion of the ensemble members, techniques that represent uncertainty related to the forecast model have been developed and implemented into operational systems and are still in use today (Leutbecher et al., 2017).
Model errors are largely related to the spatial discretisation of numerical weather prediction (NWP) models, which requires the representation of processes on the sub-grid scale through parametrisations. A common approach to address model error is therefore to represent uncertainties in the parametrisation schemes. For example, the stochastically perturbed parametrisation tendencies (SPPT) scheme randomly perturbs the net tendencies from all parametrised processes (Leutbecher and Palmer, 2008) and has been operational at the European Centre for Medium-Range Weather Forecasts (ECMWF) since 1998 (Buizza et al., 1999). The incorporation of SPPT into the operational forecast chain has resulted in increased ensemble spread (mainly in the tropics but also in the extratropics) and has thereby led to a more reliable ensemble and improved probabilistic skill of the forecasting system (Leutbecher et al., 2017). Despite these undoubtedly advantageous properties, it has been shown that some of the basic assumptions of SPPT are not well justified, such as the coherency of the perturbations for different parametrisations or for different prognostic variables (Leutbecher et al., 2017; Christensen, 2020). Therefore, ECMWF developed the stochastically perturbed parametrisations (SPP) scheme, which perturbs individual parameters in the parametrisations instead of the net tendencies from all schemes and thereby overcomes some of the limitations of SPPT (Ollinaho et al., 2017; Lang et al., 2021).
Several studies have shown that the advantages of stochastic parametrisation exceed a simple increase in ensemble spread (e.g. Berner et al., 2012, 2017). The use of stochastic parametrisation can, for example, reduce systematic model errors and biases, as shown for tropical precipitation (Weisheimer et al., 2014; Subramanian et al., 2017; Strømmen et al., 2019), the El Niño–Southern Oscillation (ENSO) (Christensen et al., 2017; Yang et al., 2019), or tropical cyclones (Stockdale et al., 2018; Vidale et al., 2021). A recent study shows that stochastic model perturbations can be used to understand the pathways of error growth from the tropics to the extratropics (Straus et al., 2023). Even though such effects have mainly been reported for tropical regions, where stochastic parametrisations are most active due to large parametrisation tendencies (Leutbecher et al., 2017), positive impacts have also been found for the extratropics, albeit of a more subtle nature. For example, stochasticity has been shown to reduce biases in the extratropical flow (Berner et al., 2012), improve the representation of midlatitude circulation regimes in different model hierarchies (Dawson and Palmer, 2015; Christensen et al., 2015), improve the representation of extratropical teleconnection patterns (Strømmen et al., 2022), and influence atmospheric blocking (Berner et al., 2008; Davini et al., 2021).
In the literature, different pathways of how random perturbations affect the mean state of the model have been discussed. Changes in the characteristics of large-scale extratropical weather regimes due to perturbations are commonly attributed to “noise-induced” drifts resulting from multiplicative forcing in nonlinear systems (e.g. Sardeshmukh et al., 2001; Derbyshire et al., 2004; Birner and Williams, 2008; Berner et al., 2012). From a smaller-scale, process-oriented perspective, Tompkins and Berner (2008) show that positive humidity perturbations in the boundary layer are more effective at triggering convection than negative perturbations are at suppressing it. Likewise, Pickl et al. (2022) show that SPPT systematically increases the frequency of diabatically driven, rapidly ascending airstreams, and they suggest that zero-mean perturbations may result in a biased response when the system is characterised by a threshold behaviour.
Such rapidly ascending airstreams, usually related to tropical convection and slantwise ascent in the warm sector of extratropical cyclones (so-called warm conveyor belts (WCBs), Carlson, 1980), are closely linked to different phenomena in the atmosphere. For example, both tropical convection and WCBs are associated with large amounts of precipitation on synoptic timescales (Jiang and Zipser, 2010; Pfahl et al., 2014). In the extratropics, WCBs play an important role in shaping the large-scale circulation (e.g. Grams et al., 2011): the diabatically driven airstream transports lower-tropospheric air with low values of potential vorticity (PV) into the upper troposphere, where higher values of PV prevail climatologically (e.g. Madonna et al., 2014). This diabatically generated negative upper-level PV anomaly accelerates the upper-level jet by sharpening the PV gradient along the tropopause (Grams et al., 2013), deflects the tropopause poleward and upward, contributes to ridge building, and thereby amplifies the Rossby wave pattern (Pomroy and Thorpe, 2000; Grams and Archambault, 2016; Chagnon et al., 2013; Methven, 2015; Saffin et al., 2021). Eventually, this may lead to the formation and maintenance of blocking anticyclones (Pfahl et al., 2015; Steinfeld and Pfahl, 2019). As WCBs and their impact on the large-scale flow are sensitive to the conditions provided by the background flow (e.g. low-level moisture supply, Schäfler and Harnisch, 2015, or baroclinicity Grams et al., 2018), WCBs act as a dynamical hinge between the lower and upper troposphere and between the synoptic and large scale, which makes WCBs very relevant for the growth and propagation of forecast errors (Martínez-Alvarado et al., 2016; Berman and Torn, 2019; Maddison et al., 2019; Pickl et al., 2023).
Building on the findings from Pickl et al. (2022), who found a systematic increase in the occurrence frequencies of rapidly ascending airstreams with SPPT in ECMWF's ensemble prediction system, this study examines if the newly developed SPP scheme results in a behaviour similar to that of SPPT. Variants of SPP with perturbations to individual parametrisations are also considered. Subsequently, it is investigated if the observed sensitivities to the SPPT and SPP schemes are reflected in changes to related processes, i.e. precipitation and the waviness of the large-scale extratropical flow. To this end, we aim to provide a process-level understanding of how stochastic physics perturbations systematically affect the mean state of the forecast model and propose a coherent process chain.
The study is structured as follows: in Sect. 2.1, we give an overview of the experimental setup and the model uncertainty schemes that are investigated throughout the study. The approach for detecting rapidly ascending airstreams is outlined in Sect. 2.2, followed by a detailed description of how the amplitude of the upper-level Rossby wave pattern is assessed (Sect. 2.3). Additional data sets complementing the numerical experiments are described in Sect. 2.4. In the Results section, sensitivities of the occurrence frequencies of rapidly ascending airstreams to SPPT, SPP, and variants of SPP are discussed in Sect. 3.1. Thereafter, sensitivities of precipitation (Sect. 3.2.1) and of the Rossby wave amplitude (Sect. 3.2.2) to the schemes are shown. Finally, the results are discussed and summarised in Sects. 4 and 5.
2.1 IFS ensemble experiments
We analyse the impact of different model uncertainty schemes on the rapidly ascending airstreams and related processes using a set of numerical experiments with the Integrated Forecasting System (IFS) CY46R1 of ECMWF. In this study, the SPPT and SPP schemes are evaluated. The SPPT scheme is the operational model uncertainty scheme at ECMWF and has been used since 1998 (Buizza et al., 1999). It perturbs the model physics by multiplying the net tendencies from all parametrisations by a random field which evolves in space and time with prescribed autocorrelation scales (Leutbecher et al., 2017). Similarly to the SPPT scheme, SPP also perturbs the physical parametrisations. However, instead of the bulk approach of perturbing the net tendencies from all processes, a set of selected parameters considered uncertain in the parametrisations of turbulent diffusion, orographic drag, convection, cloud- and large-scale precipitation, and radiation is perturbed. For a detailed description of the SPP scheme, the reader is referred to Lang et al. (2021). Additionally, we investigate two further simulations with parameter perturbations in selected parametrisation schemes: only in the convection scheme (SPP-CONV-ONLY) and in all parametrisation schemes but the convection scheme (SPP-CONV-OFF).
The initial conditions of all experiments are perturbed with an ensemble of data assimilations (Buizza et al., 2008; Isaksen et al., 2010) and a singular-vector technique (Leutbecher and Palmer, 2008). Hence, the SPPT, SPP, SPP-CONV-ONLY, and SPP-CONV-OFF experiments all feature both initial conditions and model perturbations. To assess the impact of the perturbations, a reference experiment with only initial condition perturbations but without model perturbations is used (IC-ONLY). For each of these experiments, 32 ensemble forecasts with 20 perturbed members and initialisations every other day between 15 August and 15 October 2016 have been run at a resolution of TCo399 (average grid spacing of 29 km) and 91 vertical levels until a 12 d lead. The SPP sensitivity experiments (SPP-CONV-ONLY and SPP-CONV-OFF) have only been run for 11 initialisations during the same period. For post-processing, the data are retrieved 6-hourly on a regular 1×1° latitude–longitude grid.
2.2 Detection of rapidly ascending airstreams
We use the software tool LAGRANTO (Wernli and Davies, 1997; Sprenger and Wernli, 2015) to compute offline trajectories based on the three-dimensional wind field outputted by the forecast model. The trajectories are started 6-hourly on a global 100 km equidistant grid on 13 equally spaced pressure levels between 1000 and 700 hPa and computed forward in time until 48 h. Subsequently, only the trajectories that ascend by at least 600 hPa within 2 d are retained and regarded as “rapidly ascending” (see Pickl et al., 2022, for further information). We track the evolution of potential temperature along the trajectories, which allows us to compute the latent heating rate during the ascent of the air parcel.
2.3 Ridge and trough detection and Rossby wave amplitude
To assess the impact of the different model uncertainty schemes on the large-scale upper-level flow, we employ the technique from Gray et al. (2014) to classify each grid point on an isentropic surface into one of four different categories: “trough”, “ridge”, “polar vortex”, or “subtropics”. This approach is based on the potential temperature–potential vorticity (θ–PV) framework and uses the dynamical tropopause, in this work defined as the 2 PVU contour on an isentropic surface (PVtp), to determine the structure of the upper-level flow. The dynamical tropopause is used to derive the equivalent latitude (Φeq), which is defined as the perimeter of a circle centred on the pole that encloses the same area as the instantaneous 2 PVU contour on an isentropic surface (Butchart and Remsberg, 1986). This zonally symmetric background state encloses the same mass and circulation as the full instantaneous PV field (Methven and Berrisford, 2015) and can be interpreted as the hemispheric-mean latitude of the dynamical tropopause. To determine Φeq, the sum of the areas of every grid point exceeding PVtp is computed individually for each isentropic surface and valid time; the equivalent latitude is then obtained from the ratio of this area () to the area of the whole hemisphere (Ahem) by
For the classification procedure, the PV value of each grid point is at first compared to PVtp; subsequently, the latitude of the grid point (Φ) is compared to Φeq. A grid point in the Northern Hemisphere is then classified as
-
trough, when PV > PVtp and Φ<Φeq;
-
ridge, when PV < PVtp and Φ>Φeq.
When PV > PVtp and Φ>Φeq, the grid point is classified as polar vortex, and for PV < PVtp and Φ<Φeq, it is classified as subtropics. However, the two latter categories are not considered in this study and are only listed here for completeness. Note that we do not additionally consider cut-offs as done in Gray et al. (2014) but classify such features into the trough or ridge category. Figure 1 gives an illustration of the identification of upper-level troughs and ridges in a selected situation.
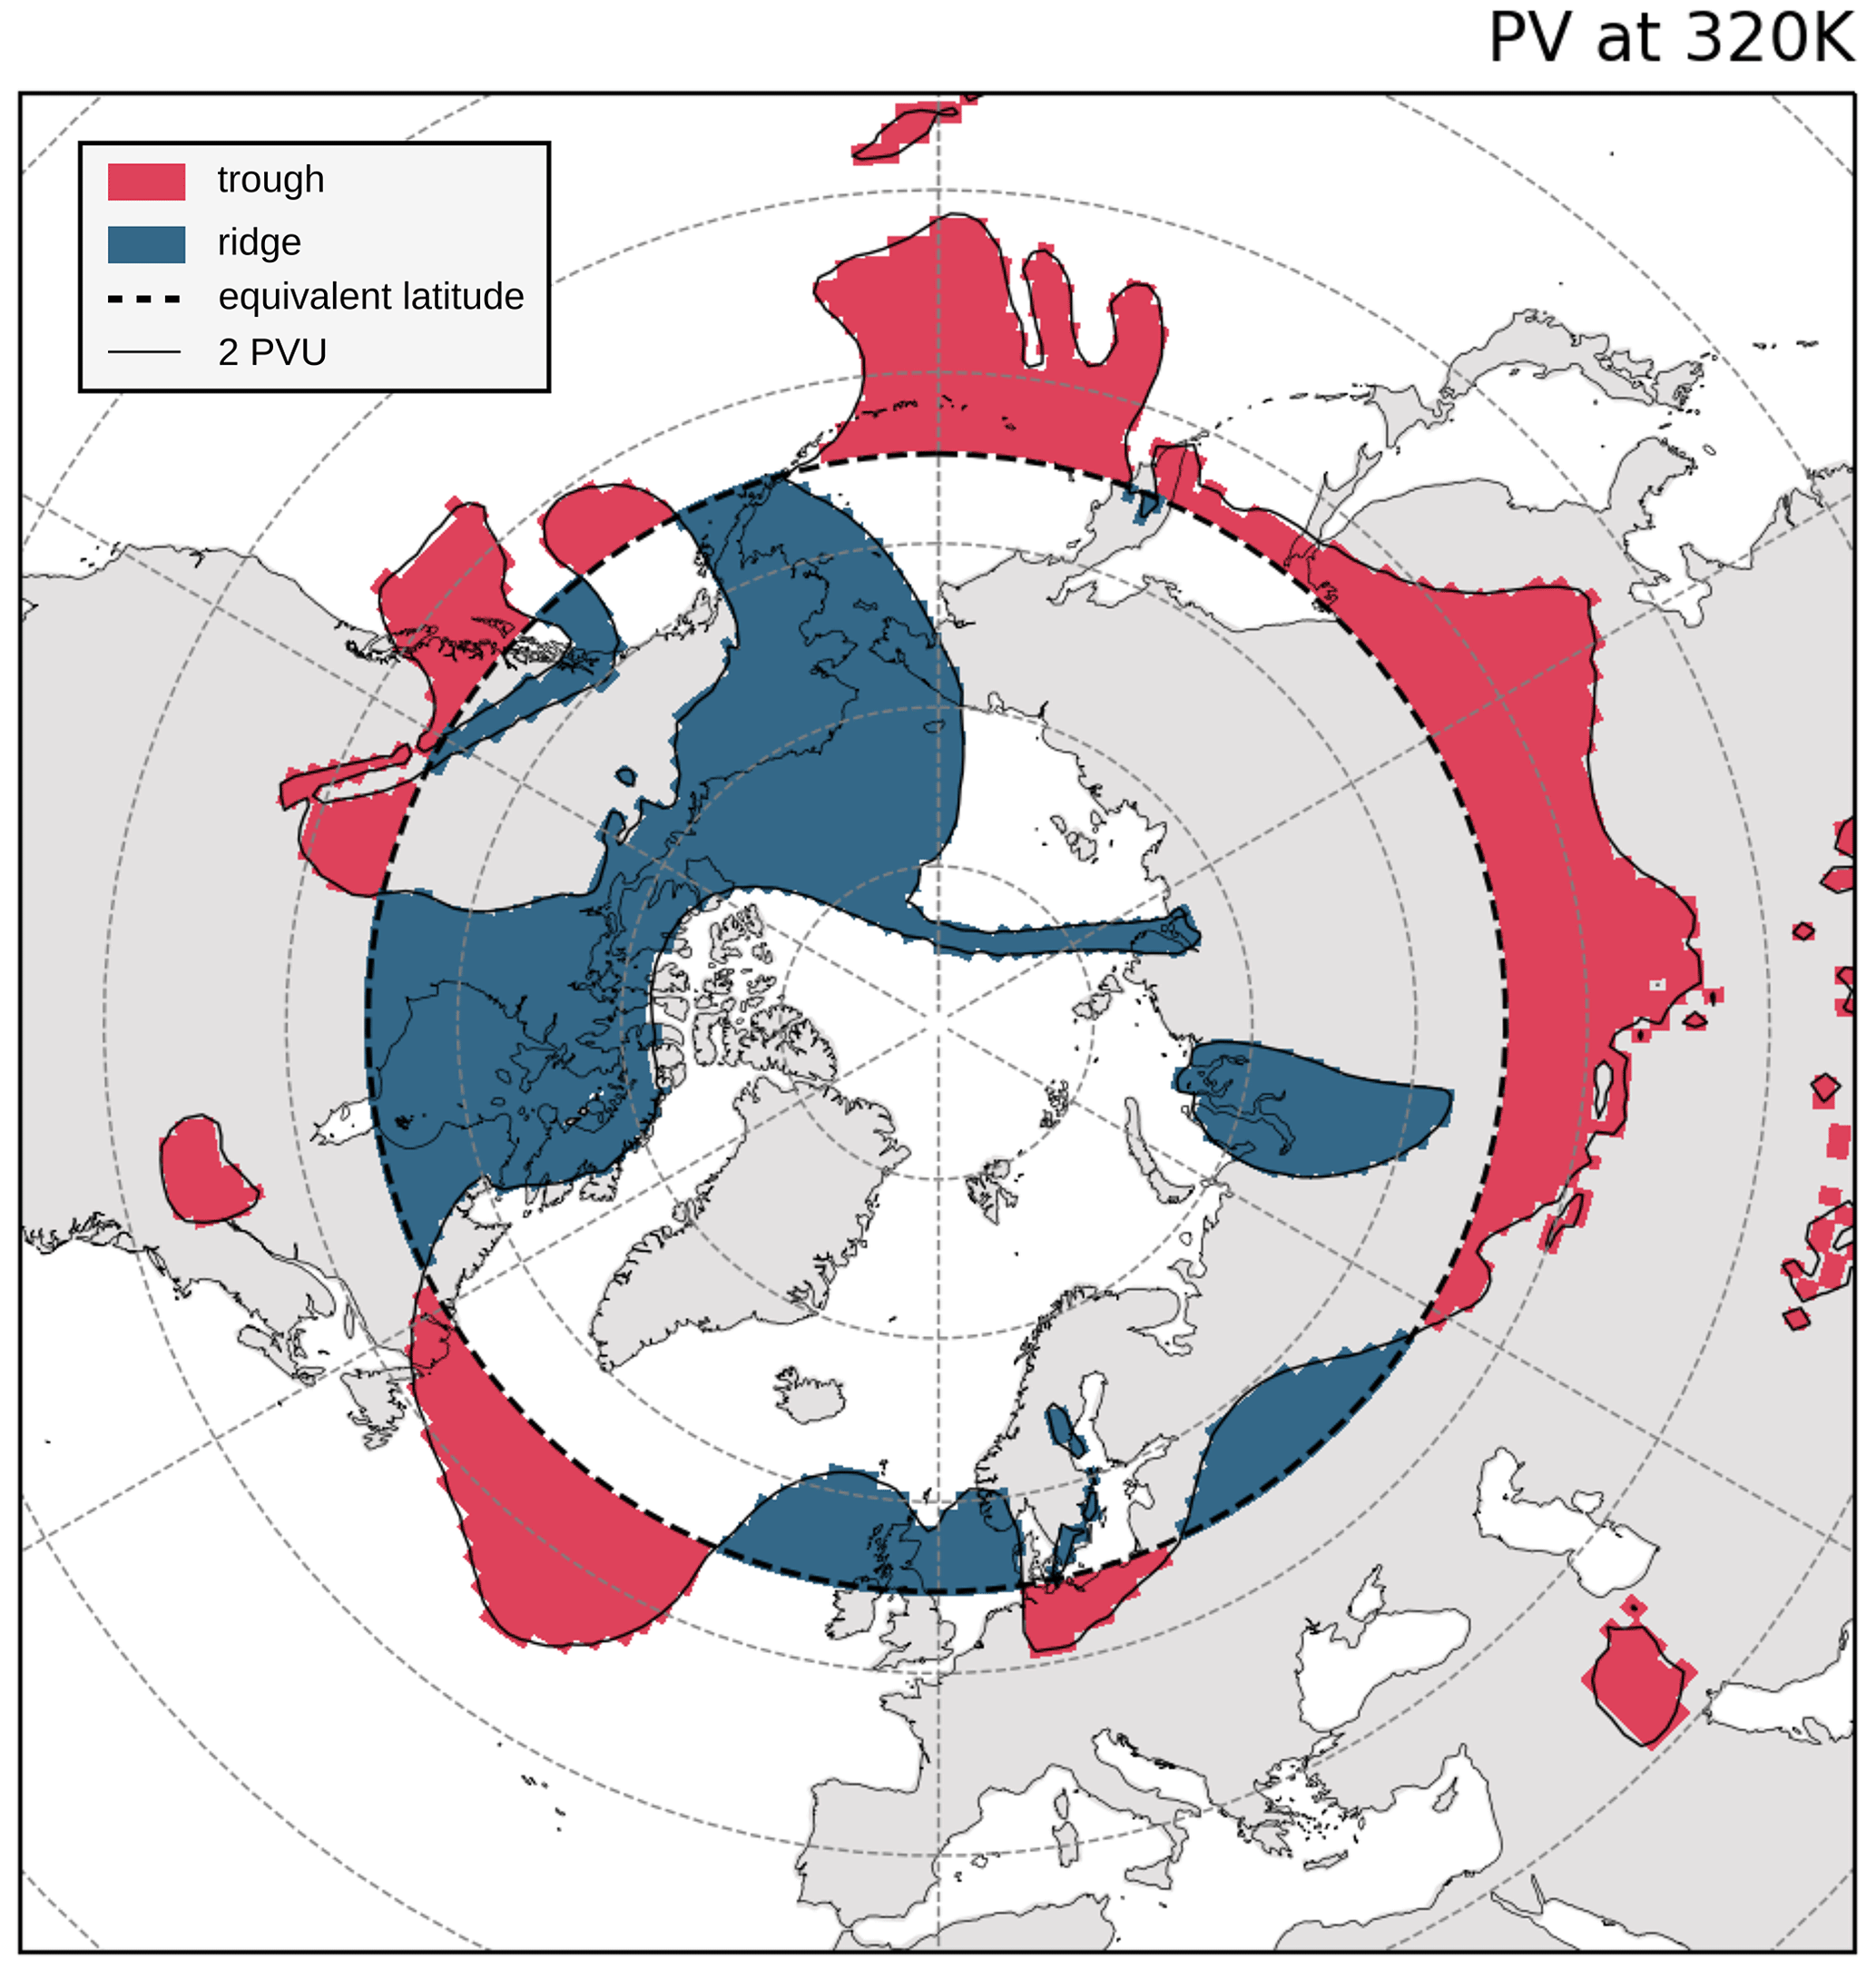
Figure 1Identification of troughs (red) and ridges (blue) on the 320 K isentrope based on the 2 PVU contour (black contour) in the SPPT experiment initialised on 26 September 2016 at 00:00 UTC at a forecast lead time of 7 d. The equivalent latitude Φeq is shown by the dashed black line.
Subsequently, the hemispheric sum of the ridge and trough areas is computed at each valid time for each ensemble member on different isentropic levels. We use this as a proxy metric for the amplitude of the upper-level Rossby wave pattern: large ridge and trough areas correspond to a flow configuration where the upper-level waveguide is characterised by meridional displacements. In turn, in a purely zonal flow configuration without any undulations of the waveguide, ridge and trough areas are minimised. Note that this technique does not provide any information about the depth (i.e. the strength of a PV anomaly) of the Rossby wave pattern and does not consider the asymmetry that is usually observed for troughs and ridges.
2.4 Complementary data sets
2.4.1 Verification data
For verification purposes, two different data sets are employed. The WCB trajectory data (see Sect. 2.2) of the experiments are compared against ECMWF's operational high-resolution analysis (Rabier et al., 2000) interpolated to the grid of the ensemble experiments (ECMWF, 2019). The ERA5 reanalysis data set (Hersbach et al., 2020) is employed as a reference for the ridge and trough areas.
2.4.2 Operational ensemble (re-)forecasts
To increase the sample size for the Rossby wave amplitude analysis, we use ECMWF reforecast data from the Subseasonal-to-Seasonal (S2S) Prediction Project database (Vitart et al., 2017) initialised twice weekly between 1997 and 2017 and compare the ridge and trough areas in the perturbed forecasts (SPPT + ICP) against the unperturbed control member. This is motivated by the insights from Pickl et al. (2022), who found that initial condition perturbations do not systematically affect the distribution of vertical velocities and the occurrence frequency of rapidly ascending airstreams. The comparison of the perturbed and unperturbed members can therefore be used to evaluate the effect of the SPPT scheme compared to unperturbed runs, which substantially increases the sample size. The reforecasts comprise 10 perturbed and 1 unperturbed member and are run at a spatial resolution of TCo639 (approx. 18 km). The data set only contains PV at 320 K such that the detection of ridges and troughs can only be done on one isentropic level. In total, we consider 3200 initialisations in winter (DJF; n=920), spring (MAM; n=1060), and autumn (SON; n=1040); summer is omitted, as the 320 K isentrope is not located in the upper troposphere but in the mid-troposphere and therefore does not adequately represent the Rossby wave structure.
The resolution of the archived reforecast data set is too coarse to compute trajectories as mentioned above. Therefore, we use an additional data set, consisting of operational ECMWF medium-range ensemble forecasts initialised twice daily (00:00 and 12:00 UTC) between December 2018 and November 2020 (2 years) and archived regionally in the North Atlantic domain (15–80° N, 130° W–80° E). For this data set, WCB trajectory data have been computed in the same way as described in Sect. 2.2. As for the Rossby wave amplitude, the unperturbed control member is compared against the 50 perturbed (SPPT + ICP) ensemble members. This data set will be consulted to determine seasonal differences in the effect of stochastic perturbations on the trajectories. Note that it is not possible to use this data set to compute the Rossby wave amplitude, as a hemispheric coverage of the data is required. Therefore, both the operational and the reforecast data sets have to be used in order to relate the trajectory analysis and the Rossby wave amplitude.
3.1 Sensitivities of rapidly ascending airstreams to different model uncertainty schemes
Following up on the results from Pickl et al. (2022), who for the first time show sensitivities of diabatically heated, rapidly ascending airstreams to the SPPT scheme, here we analyse whether other model uncertainty representations also result in a behaviour similar to that of SPPT. Figure 2 shows the distribution of the number of trajectories in different experiments (coloured bars) and in the verifying analysis (grey bars) in different regions. As reported in Pickl et al. (2022), the number of trajectories in the experiment with SPPT (red bars) is larger than in the experiment with initial conditions only (blue bars) in all regions, and this effect is more pronounced in the tropics than in the extratropics. Interestingly, the experiment with SPP (yellow bars) shows a behaviour very similar to the one with SPPT: the trajectory counts are higher than in IC-ONLY in all investigated regions. Comparing SPP to SPPT shows that the global trajectory count is slightly higher with SPP, which is predominantly driven by increased numbers in the tropics. In the North Atlantic and in the Northern Hemisphere extratropics, in contrast, the trajectory count is somewhat decreased in SPP compared to SPPT.
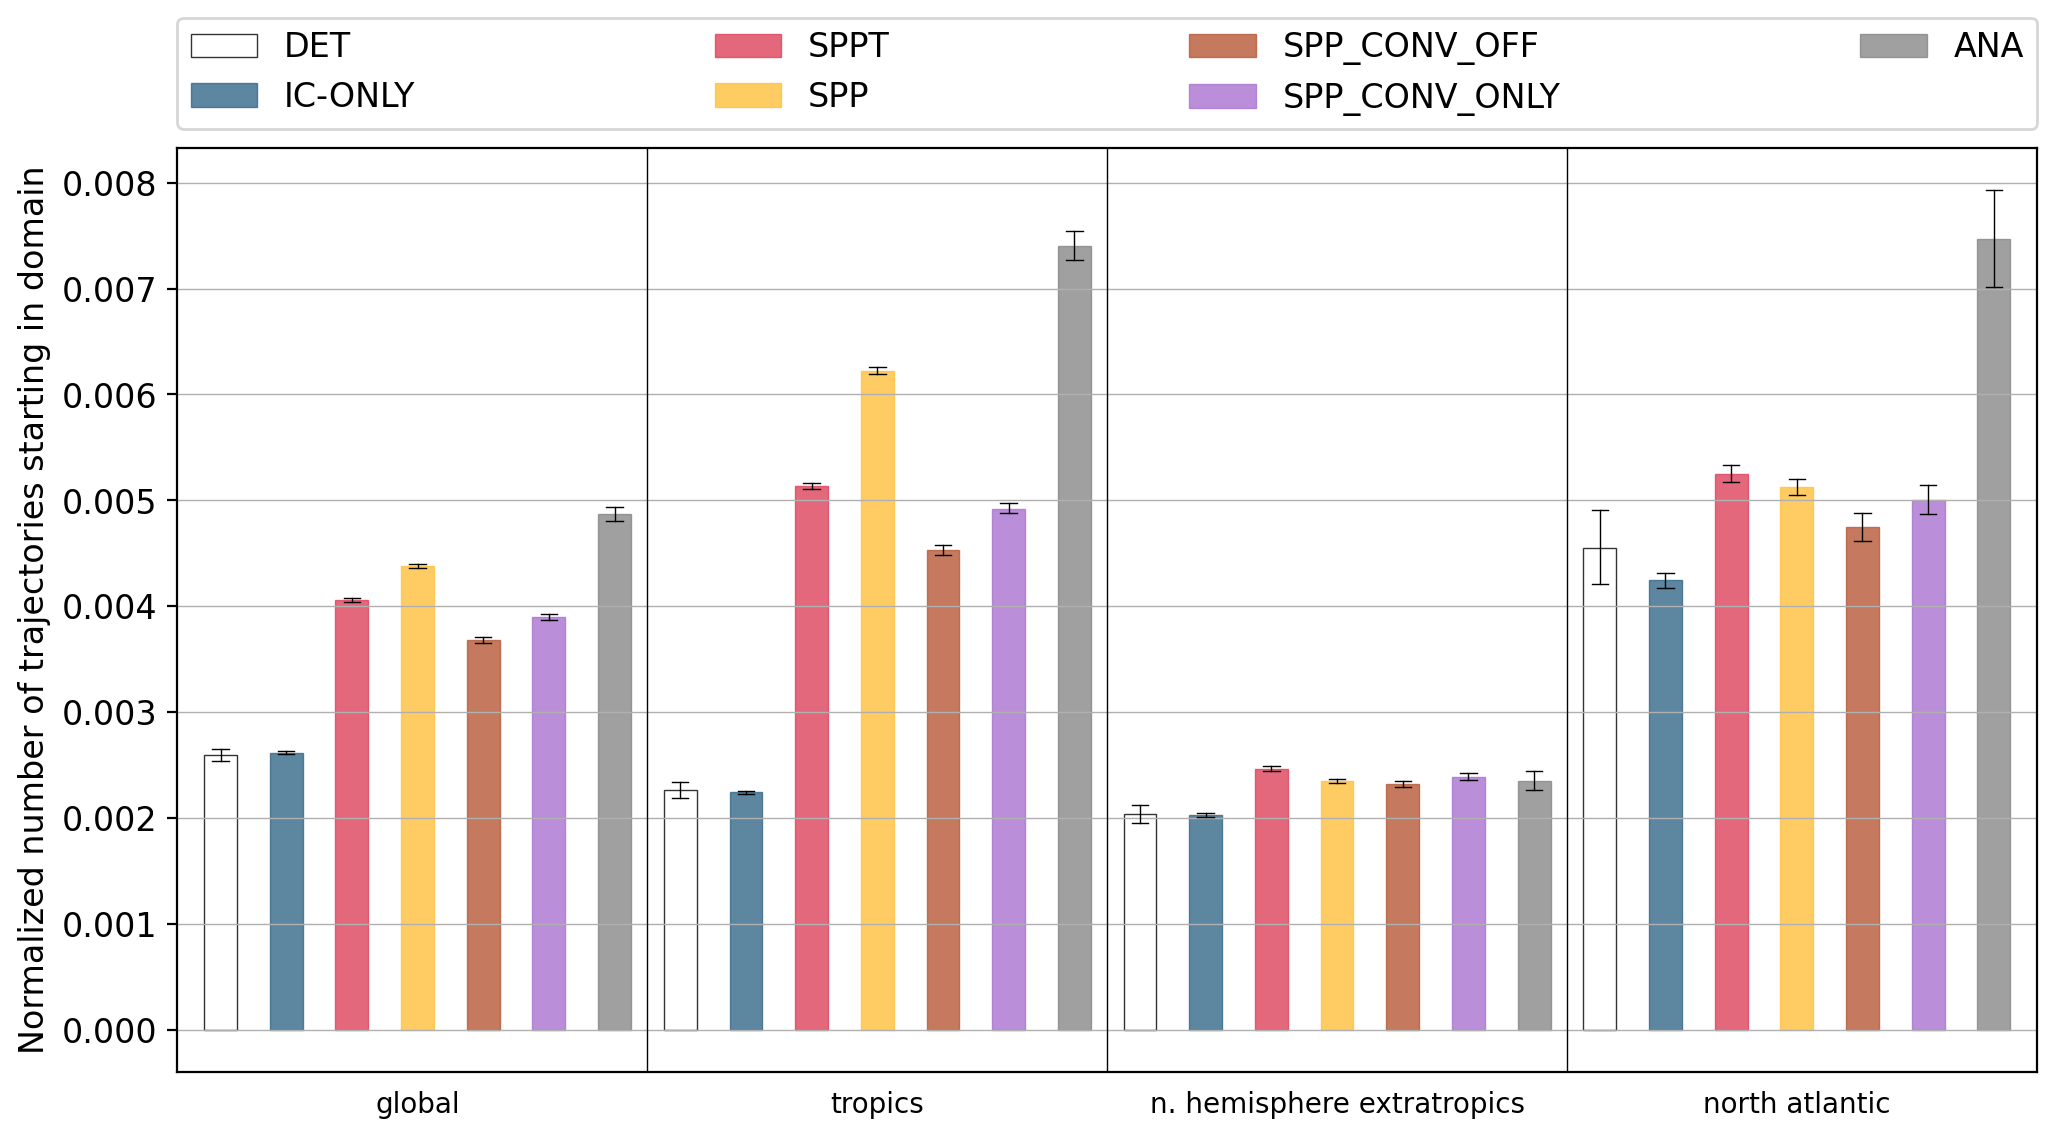
Figure 2Counts of trajectories classified as rapidly ascending, starting in the global domain, the tropics, the Northern Hemisphere extratropics, and the North Atlantic for the deterministic control run (DET; transparent bar), the experiment with initial condition perturbations only (IC-ONLY; blue), and the perturbed experiments (SPPT – red, SPP – yellow, SPP-CONV-OFF – brown, and SPP-CONV-ONLY – purple). Values of the verifying analysis (ANA) are shown by the grey bar. The counts are computed over all members (20), lead times (49), and initial times (11 for the SPP-CONV-ONLY and SPP-CONV-OFF experiments, 32 for all other experiments). Counts are normalised by the maximum number of trajectories in each domain. The bar height displays the mean, and the whiskers show the 95 % confidence interval estimated by a 10 000-sample bootstrapping technique.
The SPP-CONV-ONLY and SPP-CONV-OFF experiments also show higher frequencies of rapidly ascending airstreams than IC-ONLY in all regions; remarkably, the effect is larger in the experiment with perturbations only to the parameters in the convection parametrisations than in the experiment with perturbations to all parameters except for convection. This indicates that the perturbations in the convection scheme are more efficient at triggering rapidly ascending airstreams than perturbations to all other parametrisations. In the extratropics and the North Atlantic, the counts in SPP-CONV-ONLY are even larger than in SPP, pointing towards the dominant role of perturbations in the convection parametrisation. The added differences in the trajectory counts of the SPP-CONV-ONLY and SPP-CONV-OFF schemes from the IC-ONLY scheme are larger than the counts of SPP, indicating that the effects of the perturbations in different parametrisations are partly superimposed or cancel each other out.
Similarly to the results presented in Pickl et al. (2022), all experiments underestimate the number of rapidly ascending airstreams compared to the verifying analysis in all regions (except for the Northern Hemisphere extratropics), which is especially pronounced in the tropics. All experiments with perturbed model physics investigated here predict a higher number of rapidly ascending trajectories than the experiment with an unperturbed model. Hence, all investigated perturbations reduce the negative frequency bias in rapidly ascending airstreams and improve their forecast.
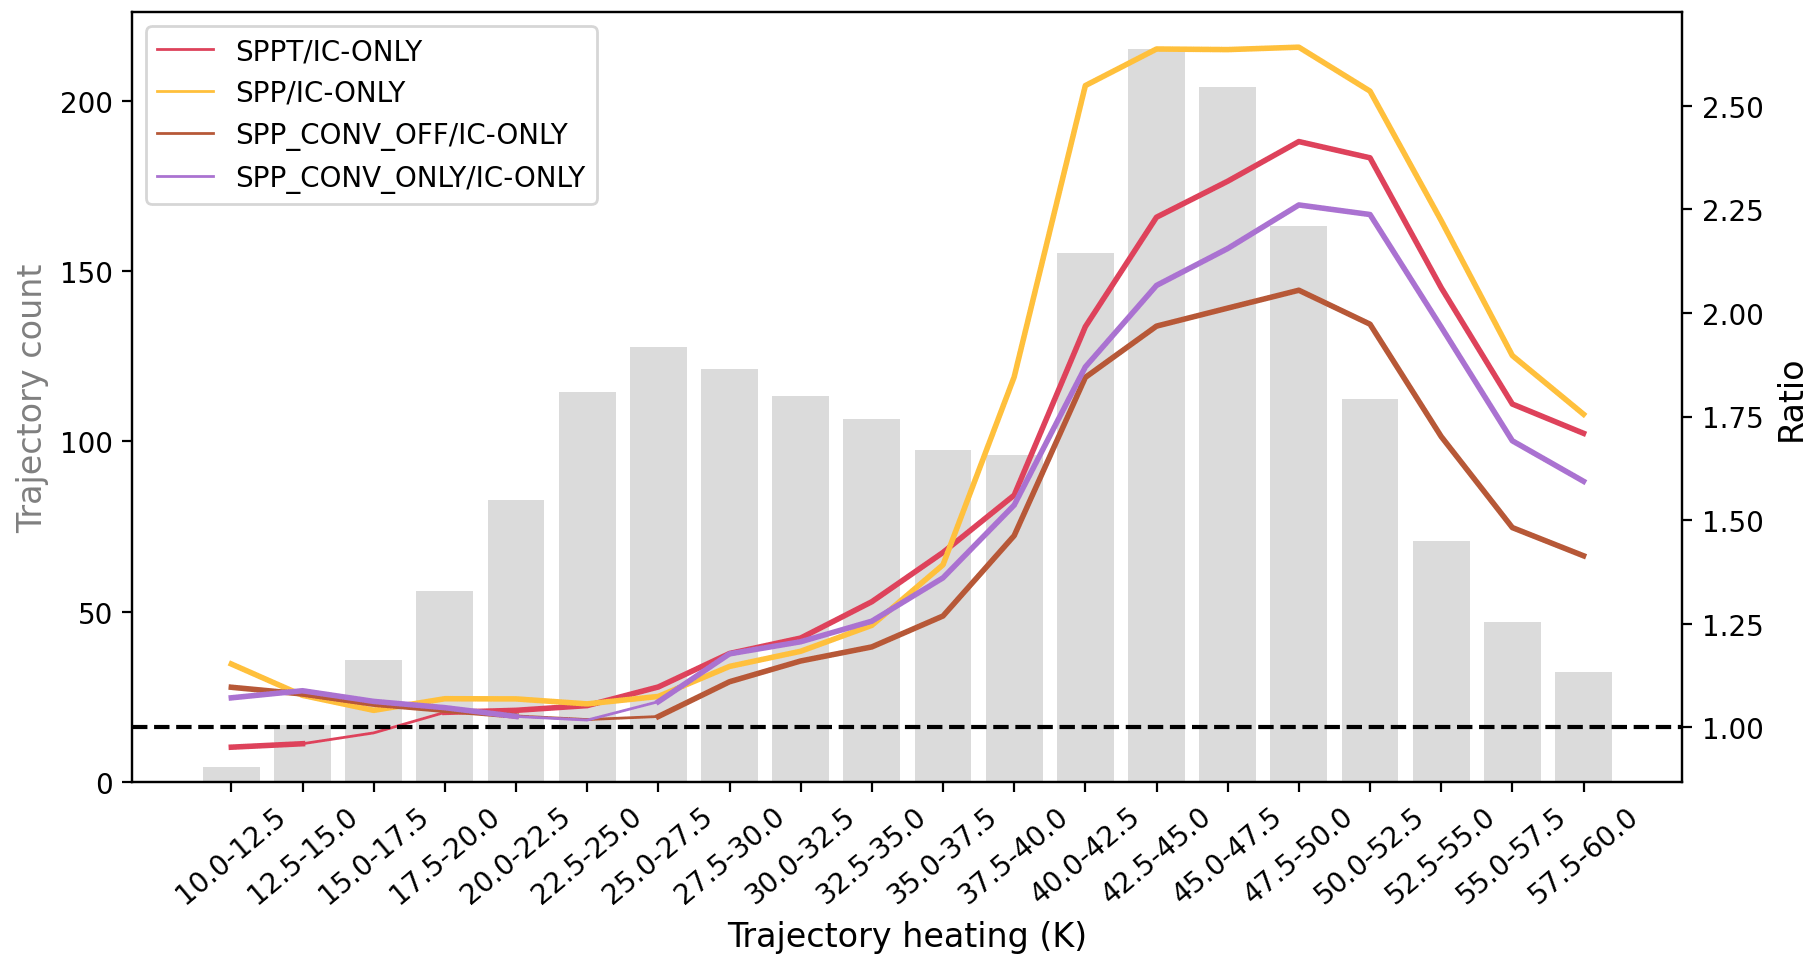
Figure 3Number of trajectories started globally per 6-hourly time step in the SPPT experiment per integrated heating rate (grey bars, left axis) and ratio of the trajectory counts in the SPPT (red), SPP (yellow), SPP-CONV-OFF (brown), and SPP-CONV-ONLY (purple) experiments and the unperturbed physics experiment IC-ONLY as a function of the integrated latent heating rate along the trajectories. The bin width is 2.5 K, and the ratios are only plotted for the heating rates that occur at least once per time step. Averaged over 11 forecasts. The thick lines denote ratios which are statistically significantly different from 1 at a confidence level of 95 % estimated with a 10 000-sample bootstrapping technique.
Next, we investigate the dependence of the trajectory frequency changes on the net latent heat release along the ascending air parcels. The net latent heating along the trajectory (i.e. difference between max and min potential temperature along the trajectory) is a commonly used proxy metric for the diabatic processes occurring along the ascent. Madonna et al. (2014) report average heating rates of around 20 K for wintertime WCBs, but depending on the season, they can reach up to 40 K. Figure 3 shows the ratio of the number of trajectories in the experiments with a perturbed model (coloured lines) to the experiment with initial conditions only as a function of the net diabatic heating rate along the trajectories (right axis). For additional orientation, the grey bars show the number of trajectories for each heating interval started globally (left axis). The bimodal structure clearly shows two heating regimes (see also Pickl et al., 2022), with peak occurrence frequencies in the heating range between 22.5–30 K (extratropical regime) and in the range between 40 and 50 K (tropical regime). All experiments feature an exponential growth in the relative trajectory count with increasing latent heat release: for heating rates between about 20 and 30 K, the ratios grow from about 1.05 to 1.25, with slightly larger values in SPPT compared to SPP (which is also reflected in the trajectory counts in the North Atlantic and the Northern Hemisphere). At the transition between the extratropical and tropical regimes, the ratios strongly increase and reach values larger than 2 for latent heating rates between 40 and 50 K. In the tropical regime, the ratio is larger for SPP than for SPPT, which is also reflected in Fig. 2. Both SPP-CONV-ONLY and SPP-CONV-OFF follow a similar exponential behaviour, but the ratios are generally smaller than for SPP (except for the range between 22.5 and 32.5 K, where the curve of SPP-CONV-ONLY is slightly higher than or similar to that of SPP). For all heating rates larger than 25 K, perturbations to only the convection scheme result in a larger increase in rapidly ascending trajectories than perturbations to all other parametrisations, which is most pronounced in the tropical regime. The curve of SPPT lies below 1 for the lowest heating rates, indicating an inverse effect of SPPT on the rapidly ascending airstreams, which becomes relevant for weakly heated warm conveyor belts in wintertime. In summary, the regional differences in the altered trajectory counts in the different experiments discussed in the previous section and Fig. 2 are largely controlled by the net latent heat release along the ascending airstream.
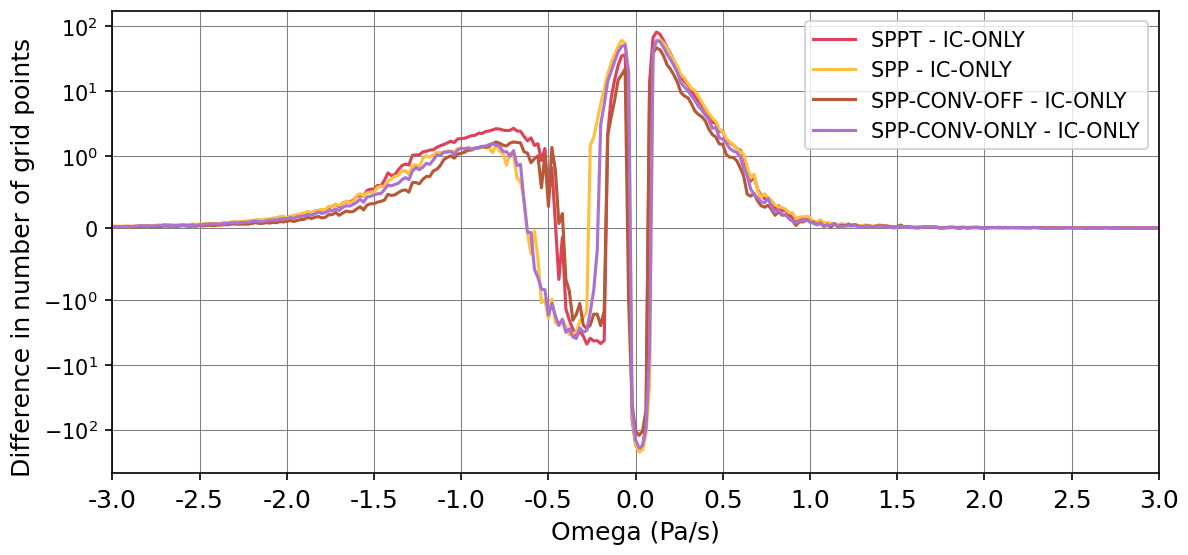
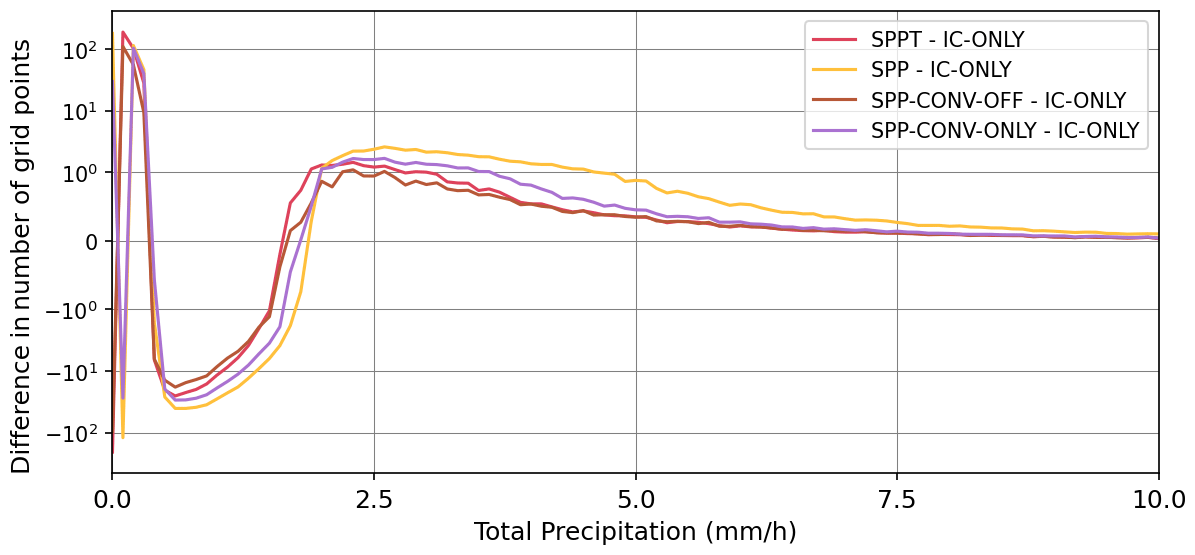
Figure 4Difference in the number of grid points of vertical velocities at 500 hPa between the SPPT (red), SPP (yellow), SPP-CONV-OFF (brown), and SPP-CONV-ONLY (purple) experiments and the experiment with unperturbed model physics, IC-ONLY. Averaged over 11 forecasts. The bin width is 0.02 Pa s−1. Note that the y axis has a linear scale between −1 and 1 and a logarithmic scale for values smaller than −1 and larger than 1.
The modified frequencies of rapidly ascending airstreams through stochastic model perturbations, derived from a Lagrangian perspective, can also be analysed in an Eulerian framework. Figure 4 shows the differences in the number of grid points (i.e. difference histograms) associated with values of vertical velocities (i.e. ω at 500 hPa) between the experiments with perturbed model physics and the experiment with an unperturbed model. The negative value range on the x axis corresponds to upward motion, whereas positive values represent downward motion. For all scales of vertical motion, model physics perturbations through SPPT and SPP result in very similar changes in the occurrence of vertical velocities: in the upward spectrum of the histogram, SPPT and SPP are characterised by a structure with two maxima in the regions of very rapid ascents (ω and Pa s−1, respectively) and very slow ascents ( ω and ω Pa s−1, respectively), showing that vertical motions in these value ranges occur more often with SPPT and SPP than without model perturbations. This increase is compensated for at the expense of moderate ascents (negative values in the range of ω Pa s−1 for SPPT and ω Pa s−1 for SPP) and very slow vertical velocities that are almost at rest ( ω <0 Pa s−1). On the downward side of the spectrum, vertical velocities are uniformly accelerated through both SPPT and SPP, as shown by the decreased number of grid points with slow downward motions (0< ω <0.1 Pa s−1) and an increased number of grid points with faster downward motions (ω >0.1 Pa s−1). Qualitatively, the vertical motions are altered similarly by perturbations to only convection and by perturbations to all other parametrisations, but in line with the trajectory diagnostics, the effect on the largest upward velocities is slightly weaker when the convection parametrisation remains unperturbed. Overall, the impact of the schemes on mid-tropospheric vertical velocities can be interpreted as an acceleration in two different regimes:
-
Fast updrafts are increased at the expense of moderate ascents (reflected in the increased number of rapidly ascending airstreams obtained from the Lagrangian approach).
-
Air parcels at rest (i.e. with very small or negligible up- and downward velocities) are accelerated.
Qualitatively, the increased upward mass flux is compensated for by a uniform acceleration of downward velocities. Overall, SPPT and SPP amplify the vertical circulation of the atmosphere.
Even though the histograms of SPPT and SPP are very similar, there are some minor differences in the detailed structure of the occurrence frequencies: in the regime of the very rapid ascents, SPPT results in a more pronounced acceleration, visible by the larger values and the broader range (x axis intersect at about −0.4 Pa s−1 for SPPT and −0.6 Pa s−1 for SPP). This also results in a shift in the velocity range in which the differences between the experiments with perturbed and unperturbed physics are negative. Nevertheless, the differences across the experiments with perturbed model physics are very small, indicating that the different perturbation techniques result in very similar changes to the vertical velocities. The good agreement between the responses of both the rapidly ascending airstreams detected by trajectory analysis and the vertical motions from an Eulerian perspective between SPPT and SPP suggests that the underlying mechanism through which the perturbations act is similar for the two schemes.
The results presented so far show that the investigated stochastic model uncertainty representations all result in a similar unidirectional response of the vertical velocities in the model (i.e. acceleration of vertical velocities in two regimes), even though the introduced perturbations are random and symmetric and have a zero mean (Leutbecher et al., 2017; Lang et al., 2021). Pickl et al. (2022) argue that such a one-sided response could result from meteorological processes, which are characterised by a distinct threshold behaviour and are more likely to be triggered by perturbations in one direction than to be suppressed by a perturbation of the same amplitude but of opposite sign. Examples of such processes are the triggering of atmospheric convection or the formation of clouds or precipitation. Therefore, Pickl et al. (2022) concluded that perturbation techniques other than SPPT could also result in similar effects. Both SPPT and SPP introduce perturbations that are the largest where parametrisations are active, for example in regions with cloud formation or precipitation (Leutbecher et al., 2017). Diabatically driven rapid ascents are mainly located in such regions, resulting in large perturbations that are likely to trigger more air parcels to rise than retain air parcels in the lower troposphere. At this point, it would be interesting to also investigate perturbation schemes that represent other types of model error unrelated to the model physics (e.g. perturbations to the dynamical core). Comparing such schemes in this context could advance the understanding of which properties of perturbation schemes result in a one-sided model response. This is, however, beyond the scope of this study.
3.2 Implications for the model climate
It was shown that stochastic perturbations in the forecast model have a systematic impact on rapidly ascending airstreams and on vertical velocities in general. Up- and downward motions are an important component of the atmospheric circulation and are linked to atmospheric phenomena on different spatio-temporal scales. Therefore, imprints of the modulations of vertical velocities should also be reflected in simulated weather activity that is directly or indirectly linked to vertical motions. In this section, we evaluate the impact of stochastic model uncertainty schemes on two such phenomena: precipitation (Sect. 3.2.1) and the representation of the upper-level Rossby wave amplitude (Sect. 3.2.2).
3.2.1 Precipitation
Following Pickl et al. (2022), who have investigated the impact of SPPT on global precipitation sums, we expand their analysis to SPP and its variants. In Fig. 5, the differences in the number of grid points of precipitation rates between the experiments with perturbed forecast models and IC-ONLY are shown. As for the previously discussed diagnostics, the experiments with model physics perturbations (SPPT and SPP) show a very similar pattern, with increased occurrence frequencies for precipitation rates below 0.5 mm h−1 and above 1.8 mm h−1 for SPPT and 2 mm h−1 for SPP, whereas the number of grid points with precipitation rates in between is decreased compared to IC-ONLY. The SPP sensitivity experiments qualitatively show a behaviour similar to that of SPP and SPPT, but perturbations only in the convection scheme result in a larger increase in the largest precipitation rates than perturbations to all other parametrisations. The patterns of all experiments strongly resemble the bimodal structure of the changed mid-tropospheric upward motions (see Fig. 4). Thus, the modulation of upward motion is consistent with and might control the modulation of the precipitation frequencies.
3.2.2 Large-scale extratropical circulation
Due to the large impact that rapidly ascending airstreams in the form of WCBs exert on the evolution of the large-scale flow through ridge amplification (e.g. Grams et al., 2011), the question arises whether the signal of the altered occurrence frequencies of WCBs through stochastic perturbations is propagated upscale and whether the upper-level Rossby wave pattern is amplified through model uncertainty schemes. We approach this question by comparing the sums of the areas of objectively detected upper-level ridges and troughs (i.e. the Rossby wave amplitude; see Sect. 2.3 and Fig. 1) in the experiments with and without model uncertainty representations. Due to the limited sample size of this diagnostic (i.e. only one value per forecast valid time), we omit the SPP-CONV-ONLY and SPP-CONV-OFF experiments with only 11 initial times.
Equivalent latitude
The classification of each grid point required to determine the Rossby wave amplitude depends on the data set which is used for the identification of the equivalent latitude Φeq. Prior to the analysis of the Rossby wave amplitude, we therefore investigate the behaviour of Φeq (i.e. the average latitude of the Rossby wave pattern) and its differences between the simulations. Figure 6 shows the mean evolution of Φeq in the different experiments (coloured lines) and in the reanalysis data set (grey line) with forecast lead times on different isentropic levels. Note that the drift of Φeq in ERA5 results from the investigation period that lies at the transition between late summer and autumn (see Sect. 2). The average Φeq on an isentropic surface follows the yearly temperature cycle and is located further poleward in the warm season than in the cold season, resulting in a southward shift of 2–3° during the considered 12 d lead time (Fig. 6). Note that the diurnal cycle present in both the reanalysis data set and the experiment data set is a result of temperature-induced fluctuations in PV in regions of high topography (e.g. over the Tibetan Plateau), where the isentropic surfaces intersect topography.
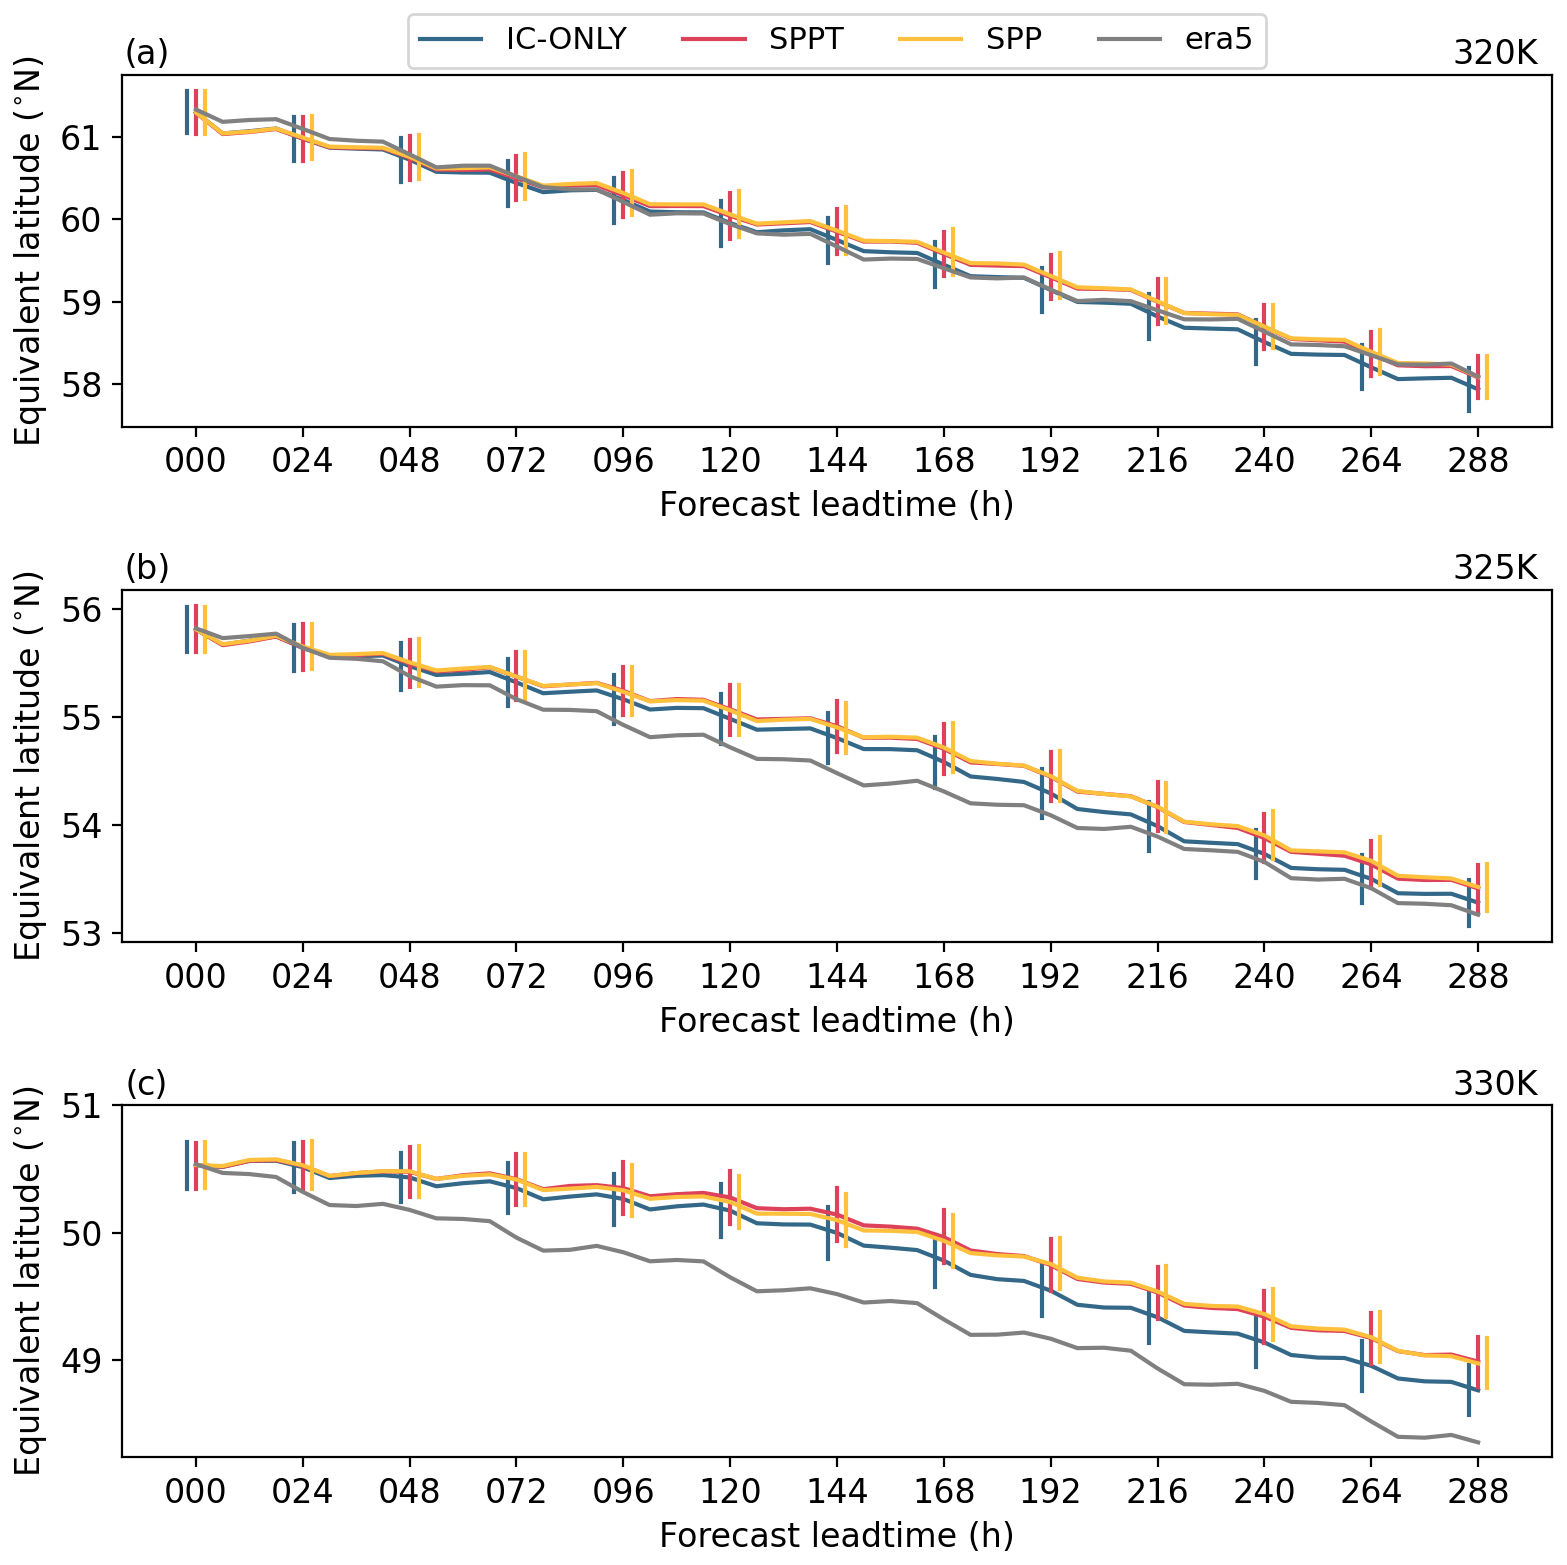
Figure 6Evolution of Φeq with forecast lead times in the experiments and in ERA5 at the (a) 320 K, (b) 325 K, and (c) 330 K isentropic levels. Averaged over 20 ensemble members and 32 initial times. The bars display the 10 %–90 % confidence interval for each experiment computed by sub-sampling the data set 10 000 times (shown only every 24 h).
Comparing the experiment SPPT to IC-ONLY shows that, despite identical initial conditions, the southward drift of Φeq is more pronounced in the experiment without model physics perturbations on all isentropes. This displacement of Φeq in SPPT with respect to IC-ONLY corresponds to a poleward and upward shift of the hemispheric tropopause with stochastic perturbations. Apart from 320 K, where the differences between the data sets are minor, Φeq decreases at a faster rate in the reanalysis data set than in the experiments. The representation of Φeq in IC-ONLY is therefore more consistent with reanalysis than in the experiment with SPPT. The evolution of Φeq in SPP largely follows SPPT.
Even though the differences between the experiments are very small (and statistically not significant), they have important implications for the determination of the Rossby wave amplitude, as the computations of the ridge and trough areas are based on the chosen Φeq. In our case, the choice of an independent Φeq (as done in Gray et al., 2014) results in biased ridge and trough areas, as the Rossby wave patterns are shifted relative to each other but are evaluated against an identical Φeq, which does not represent the corresponding dynamically coherent, hemispheric-mean background state. Therefore, instead of using Φeq of a reference data set, we use Φeq of each individual experiment and reanalysis for each ensemble member and valid time to detect the upper-level troughs and ridges in its respective model background. This approach results in balanced areas of ridges and troughs on a given isentropic surface.
Rossby wave amplitude
Figure 7 shows how the area of upper-level ridges and troughs (i.e. Rossby wave amplitude) evolves on average with forecast lead time on different isentropic levels. The analysed amplitude (ERA5, grey line) on the 325 K isentrope (panel b) amounts to 2.35–2.4 × 10⁷ km2, which corresponds to about 9 % of the area of the Northern Hemisphere. On 320 K (panel a), the amplitude increases with lead time, whereas it decreases on 330 K (panel c). This is again due to the experimentation period in the transition time from summer to autumn, when ridge and trough areas become larger on lower isentropes. Note that the cyclic behaviour, especially at 320 K, is due to the short data period with forecast initialisations every second day, resulting in auto-correlated time series and a distinct impact of single events. Analysing the evolution of the Rossby wave amplitude in the IC-ONLY experiment (blue lines in Fig 7) clearly indicates that the forecasts underestimate the waviness of the upper-level flow on all isentropes. On 320 and 325 K, the amplitude is only slightly underestimated until forecast day 6–7 (144–168 h). Afterwards, the difference from ERA5 becomes larger, ending up with a reduction in the amplitude of approximately 2.8 × 10⁶ km2 (11 %) at 320 K on forecast day 12 compared to ERA5. On the other isentropic levels, the underestimation is not as pronounced as on 320 K but still amounts to 8 % on 325 K and 4 % on 330 K with respect to ERA5. These results show that undulations of the upper-tropospheric waveguide become less pronounced with forecast lead time. This results in an overall too-zonal flow configuration on the hemispheric scale. The model drift to less amplified Rossby waves is a well-known systematic bias in NWP models: Gray et al. (2014) reported a systematic decrease in the ridge areas in the Northern Hemisphere in several winter seasons and in different models. They argued that erroneous representations of diabatic processes are a possible reason for these systematic errors, while Martínez-Alvarado et al. (2018) found that the decrease in the Rossby wave amplitude can partly be attributed to deficiencies in the dynamical core of forecast models. From a dynamical perspective this behaviour is related to a decrease in or an underestimation of the PV gradient along the dynamical tropopause (i.e. tropopause sharpness) with forecast lead time, which is another long-standing issue of NWP models (Gray et al., 2014; Saffin et al., 2017; Martínez-Alvarado et al., 2018; Schäfler et al., 2020). We have, however, omitted this aspect of Rossby wave dynamics in our study and focus on the amplitude only.
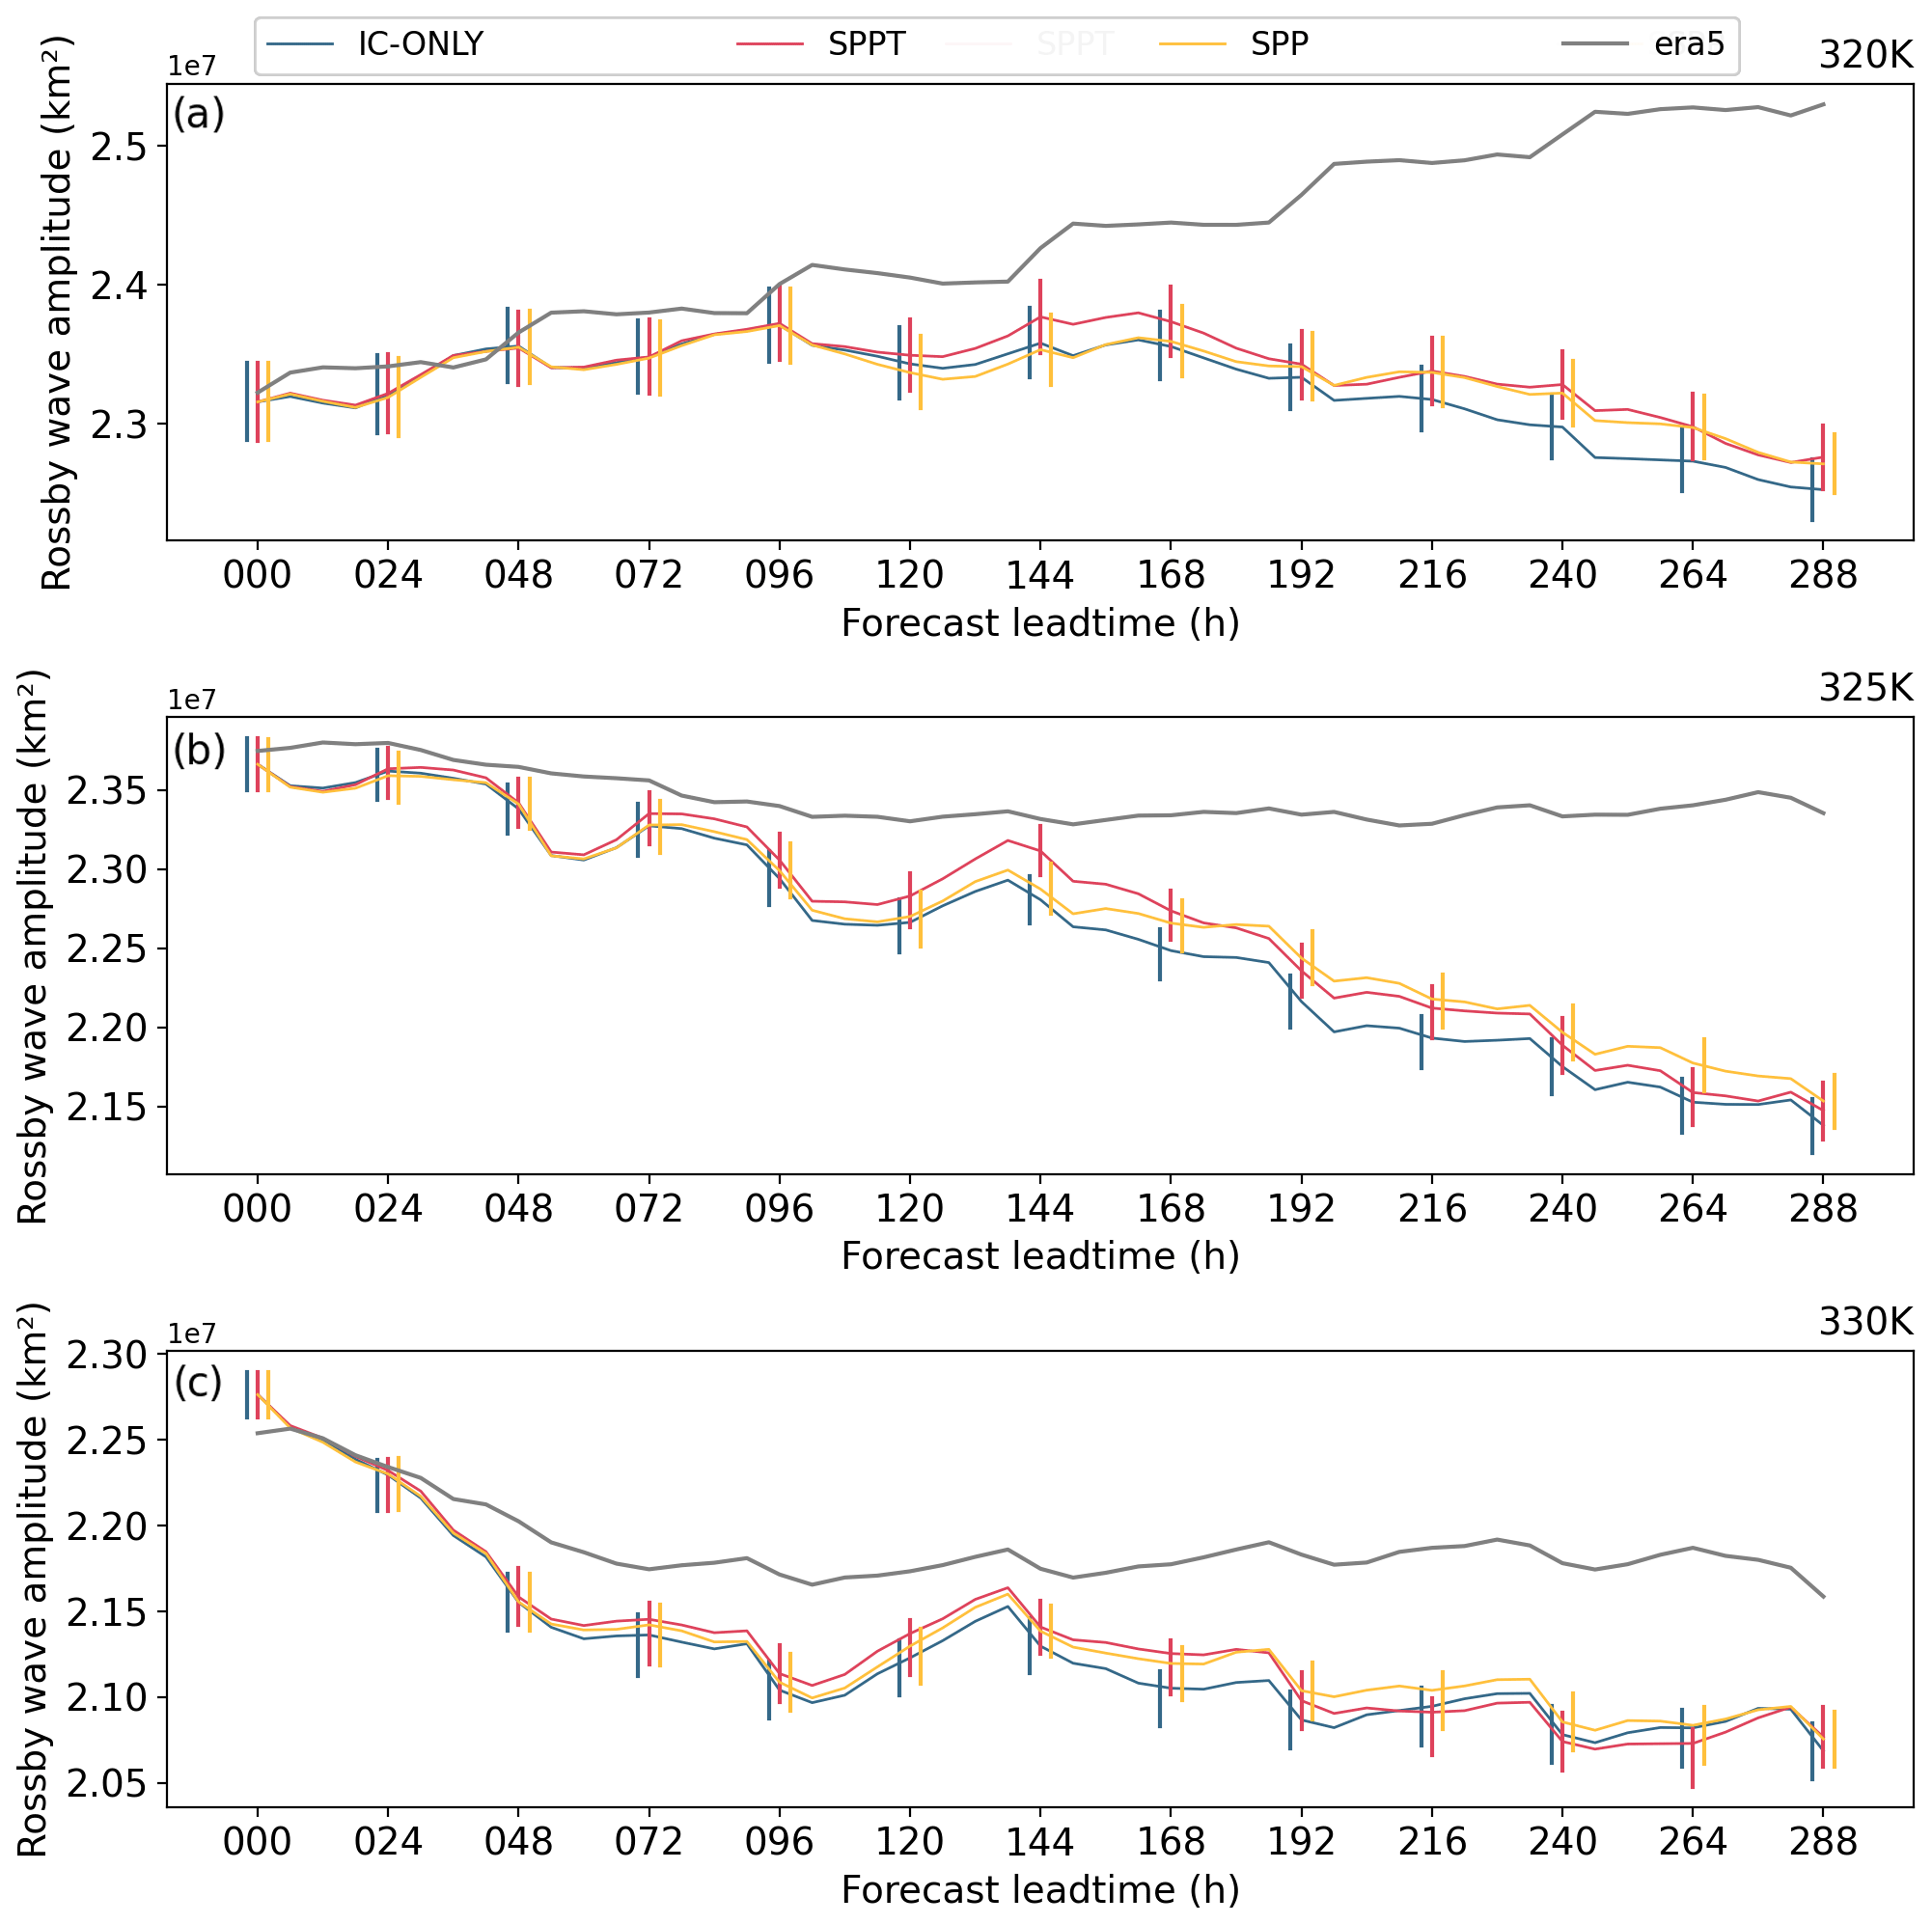
Figure 7The lines show the mean evolution of the Rossby wave amplitude with forecast lead time in the IC-ONLY (blue), SPPT (red), and SPP (yellow) experiments and in ERA5 (grey) on the (a) 320 K, (b) 325 K, and (c) 330 K isentropic levels. Averaged over all 32 forecasts and 20 members. The bars display the 10 %–90 % confidence interval for each experiment computed by sub-sampling the data set 10 000 times (shown only every 24 h). Note that the values on the y axis are in units of 107 km2.
Next, we analyse in more detail the effect of stochastic parametrisations on the Rossby wave amplitude in the model forecasts. In the experiment with SPPT, the amplitude is increased slightly compared to the experiment without model physics perturbations. The signal is, however, quite small, and the mostly overlapping confidence intervals of the experiments indicate that the differences lack statistical significance. At forecast initialisation, SPPT and IC-ONLY have identical values (both start at the same initial conditions), but the areas gradually decrease with forecast lead time in IC-ONLY compared to SPPT. This is especially visible at 320 K, where the amplitude on forecast day 12 in SPPT is increased by approximately 1 % (equivalent to an area of 2.3 × 10⁵ km2) compared to IC-ONLY. On 325 K, this behaviour is also apparent but less pronounced. On 330 K, the Rossby wave amplitude in SPPT is increased up to forecast day 8 (192 h) but is then very similar or even larger in IC-ONLY until the end of the forecast. Still, the general picture is that SPPT increases the amplitude of the upper-level Rossby wave pattern slightly compared to unperturbed physics, especially on 320 and 325 K. As the experiments generally underestimate the Rossby wave amplitude compared to reanalysis, the increase by SPPT results in an improvement in the representation of the waviness of the upper-level circulation. SPPT thereby helps to protect the upper-level ridge and trough areas against the systematic lead-time-dependent degeneration of the Rossby wave amplitude. Overall, the magnitude of the effect is quite small.
Similarly to the SPPT scheme, SPP also increases the amplitude of the upper-level Rossby wave pattern slightly compared to the reference simulation with unperturbed model physics; on 320 and 325 K in particular, the amplitude is larger with SPP than without model perturbations. Compared to SPPT, the effect is smaller, and the lines of IC-ONLY and SPP diverge at later lead times than those of IC-ONLY and SPPT.
Overall, we observe differences between the experiments with and without stochastic parametrisations, and the increased Rossby wave amplitude is consistent with the increased frequency of rapidly ascending airstreams in the extratropics. Nevertheless, the signals are rather small, and the differences lie within the confidence intervals of the experiments. To increase the confidence in our results, we analyse the Rossby wave amplitude in an additional data set in the subsequent section.
Inferences from operational (re-)forecasts
Due to the experimental setup consisting of only 32 forecasts and 20 ensemble members (i.e. 640 cases) and the fact that the ridge area diagnostic only yields 1 scalar number per valid time, the robustness of the previously discussed results of the lead-time-dependent evolution of the Rossby wave amplitude has to be demonstrated. We attempt to do this by making use of the findings from Pickl et al. (2022) and substantially enlarge the sample size by comparing the Rossby wave amplitudes in the unperturbed control member of operational ECMWF reforecasts to the perturbed members (SPPT + ICP). We analyse 3200 ensemble forecasts in total, initialised in winter, spring, and autumn between 1997 and 2017, which, additionally to increasing the sample size, allows us to investigate seasonal differences in the effect of stochastic parametrisations on the Rossby wave structure. Note that the perturbed forecasts have 10 members, while the unperturbed control member is a deterministic run, which results in different sample sizes of the two data sets (n=32 000 for the perturbed forecasts and 3200 for the unperturbed forecasts).
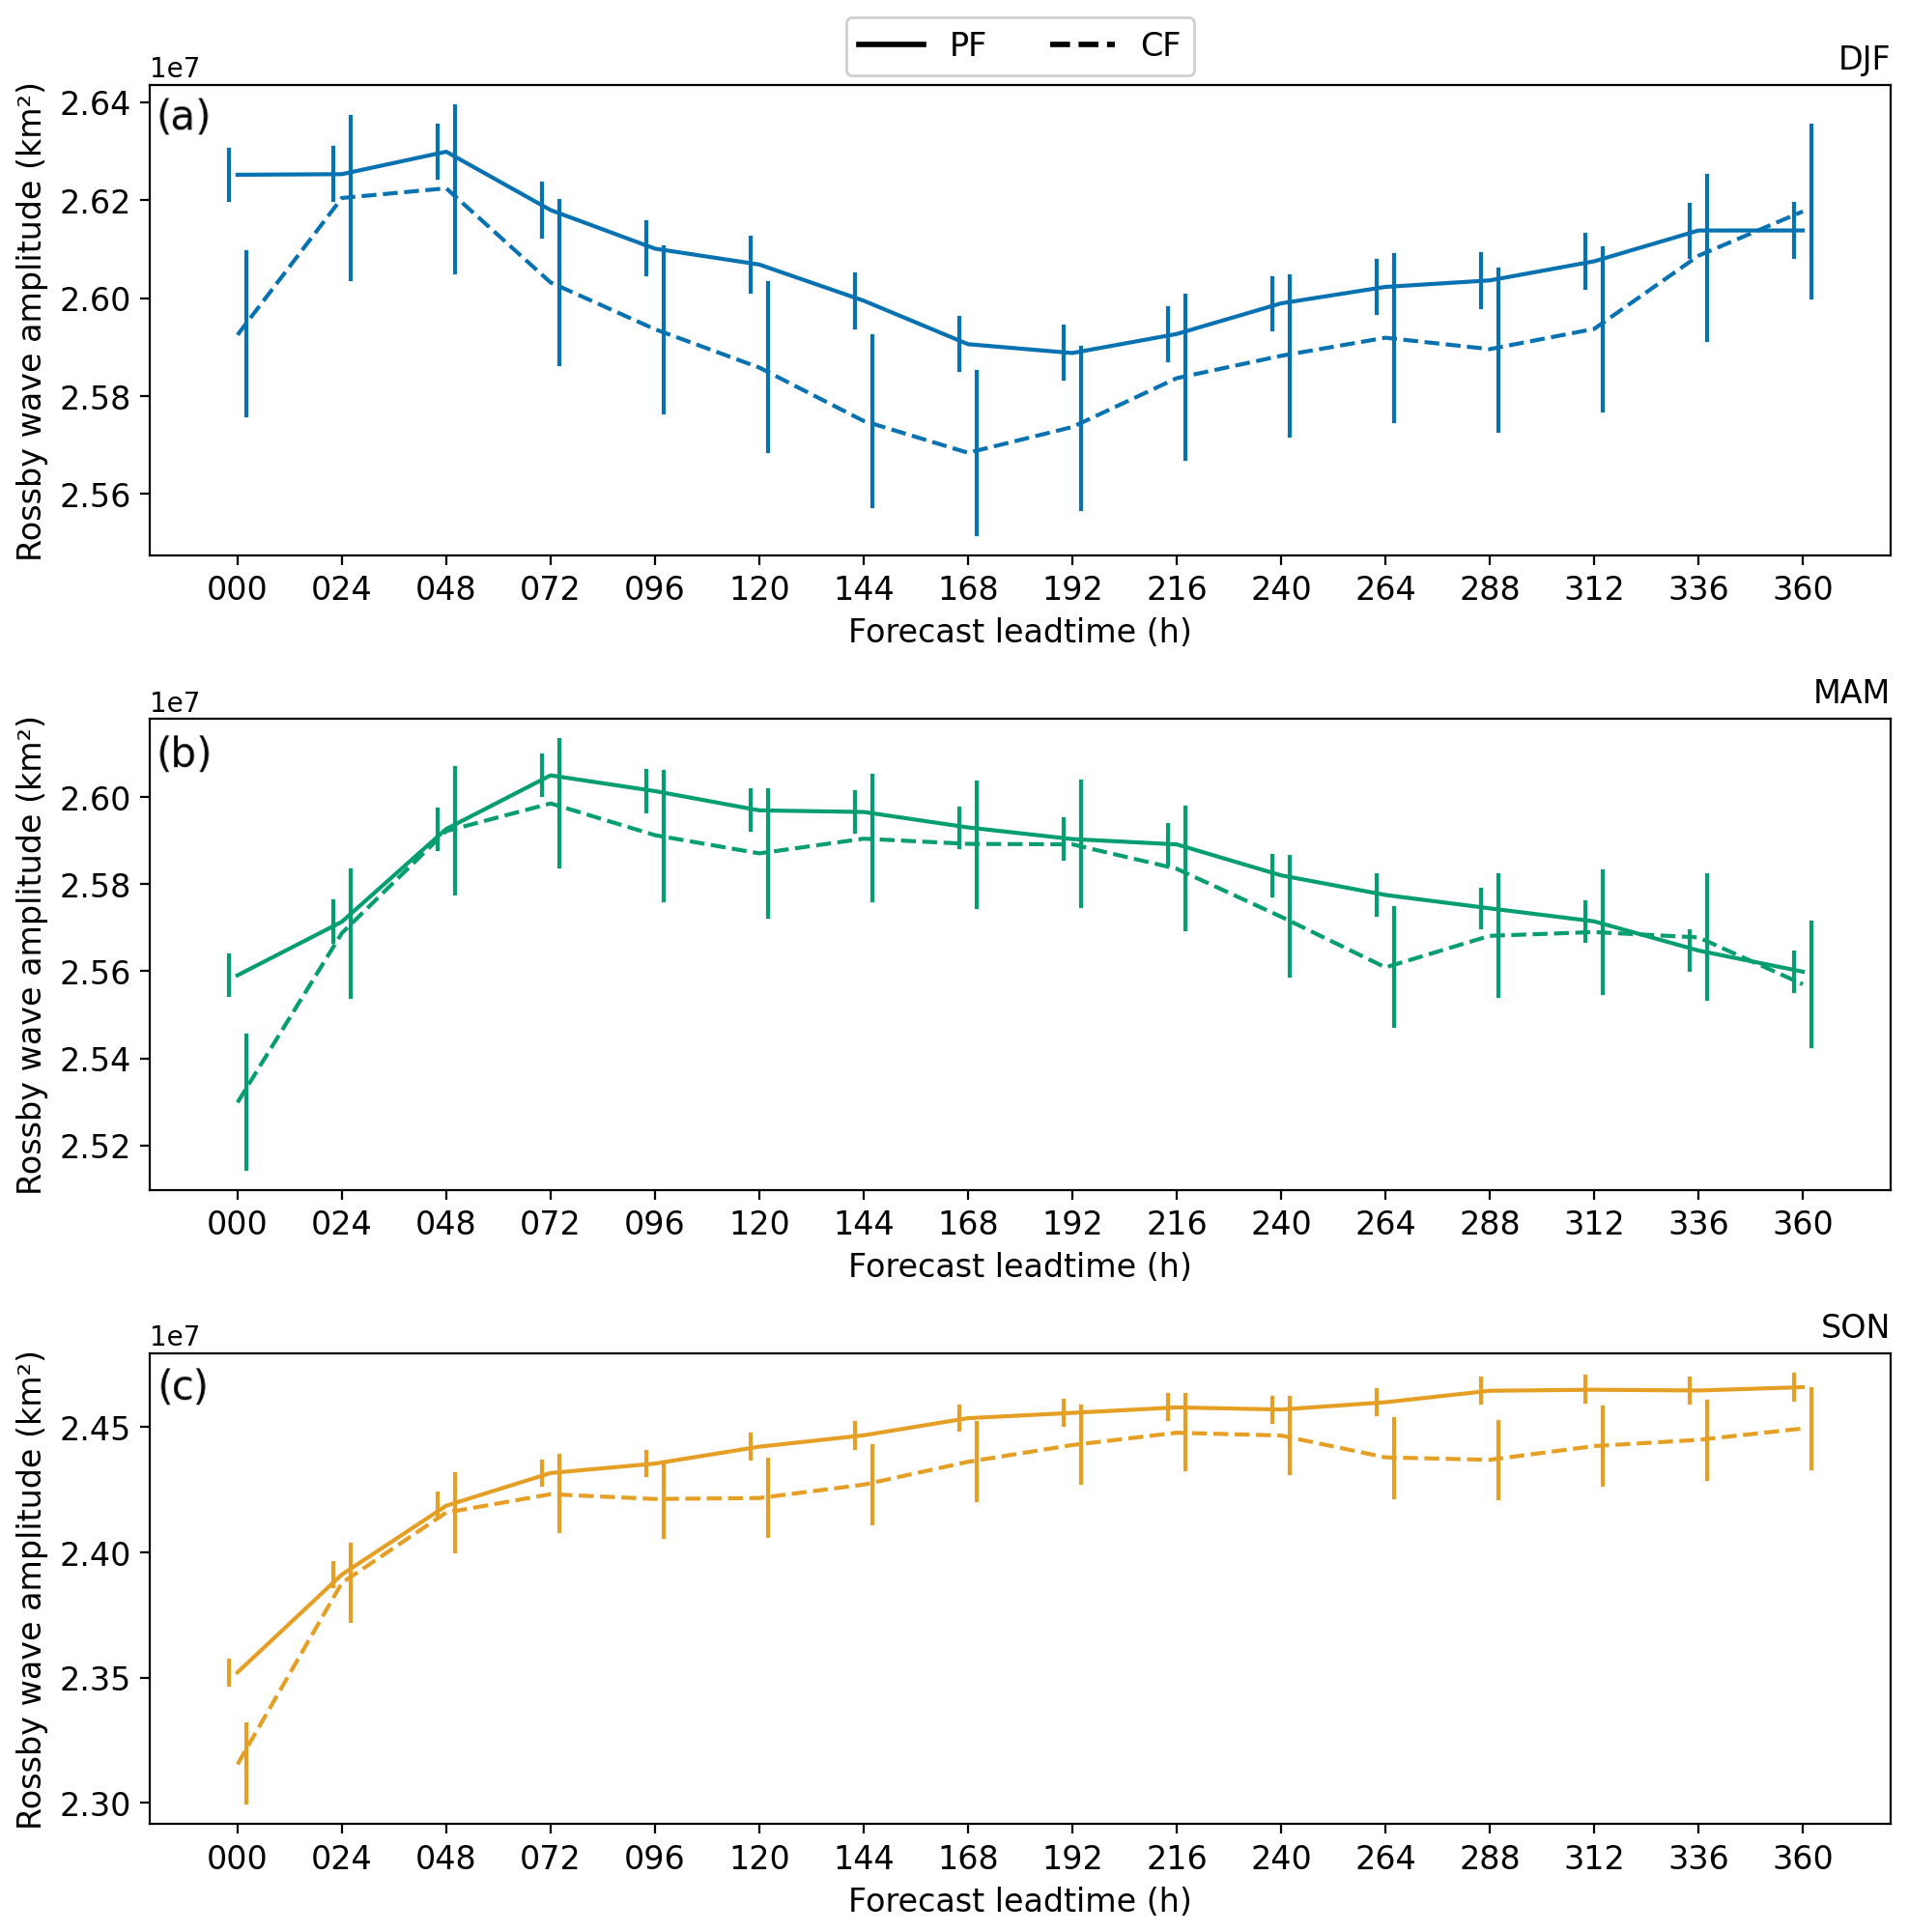
Figure 8Average evolution of the Rossby wave amplitude at 320 K, with the forecast lead time for perturbed (PF; solid lines) and unperturbed reforecasts (CF; dashed lines) initialised twice weekly between 1997 and 2017 in winter (a, blue), spring (b, turquoise), and autumn (c, orange). The bars display the 10 %–90 % confidence interval for the two data sets at each valid time, computed by resampling the data set 10 000 times. Note the different ranges of the y axis in each panel. Note that the values on the y axis are in units of 107 km2.
Figure 8 shows the mean evolution of the Rossby wave amplitude of the perturbed (solid) and unperturbed (dashed) members as a function of lead time for forecasts initialised in winter (a), spring (b), and autumn (c; note the different ranges of the y axes). In all seasons, the Rossby wave amplitude is on average larger in the perturbed forecasts than in the unperturbed forecasts, with the largest signal in autumn (on average 0.65 % difference), followed by winter (0.45 %) and spring (0.2 %). In winter (panel a), the differences between perturbed and unperturbed members are the largest until lead times of about 4–7 d (about 1 % difference). After that, the difference between the two data sets does not increase and even vanishes around forecast day 15. Perturbed forecasts initialised in spring (panel b) are characterised by only a slightly increased Rossby wave amplitude compared to the unperturbed forecasts (maximum of about 0.6 %–0.8 % at day 11, but mostly smaller values are present). In autumn, the difference in the Rossby wave amplitude between perturbed and unperturbed members is the largest and increases with forecast lead time, reaching differences of up to 0.8 %–1.2 % during lead times of 12–15 d. Surprisingly, the largest difference in all seasons is observed for the initial time. This shows that the initial condition perturbations strongly increase the waviness of the upper-level flow for the first few forecast hours.
The comparison of perturbed and unperturbed members of ECMWF reforecasts confirms the main findings from the sensitivity experiments in the previous section. Even though only one isentropic level (θ=320 K) and one scheme (SPPT) is investigated, the larger sample size allows for an assessment of the robustness of the observed patterns. In the experimentation period, which is mainly in the autumn of 2016, the amplitude of the upper-level wave pattern on 320 and 325 K is increased when perturbations through SPPT or SPP are active. In this analysis, a quantitatively very similar pattern is found for the reforecasts initialised in autumn, where the order of magnitude (𝒪(1 %)) of the observed effect is similar. This behaviour can therefore be considered to be robust, even though the sampling variability is mostly larger than the signal (see overlapping bars in Figs. 7 and 8). This uncertainty could most likely be reduced by further increasing the sample size, e.g. with a larger ensemble or more initial dates. On the other isentropic levels in the experiment data set and in seasons other than autumn in the reforecast data set, the signal is not as distinct as in autumn and on 320 K.
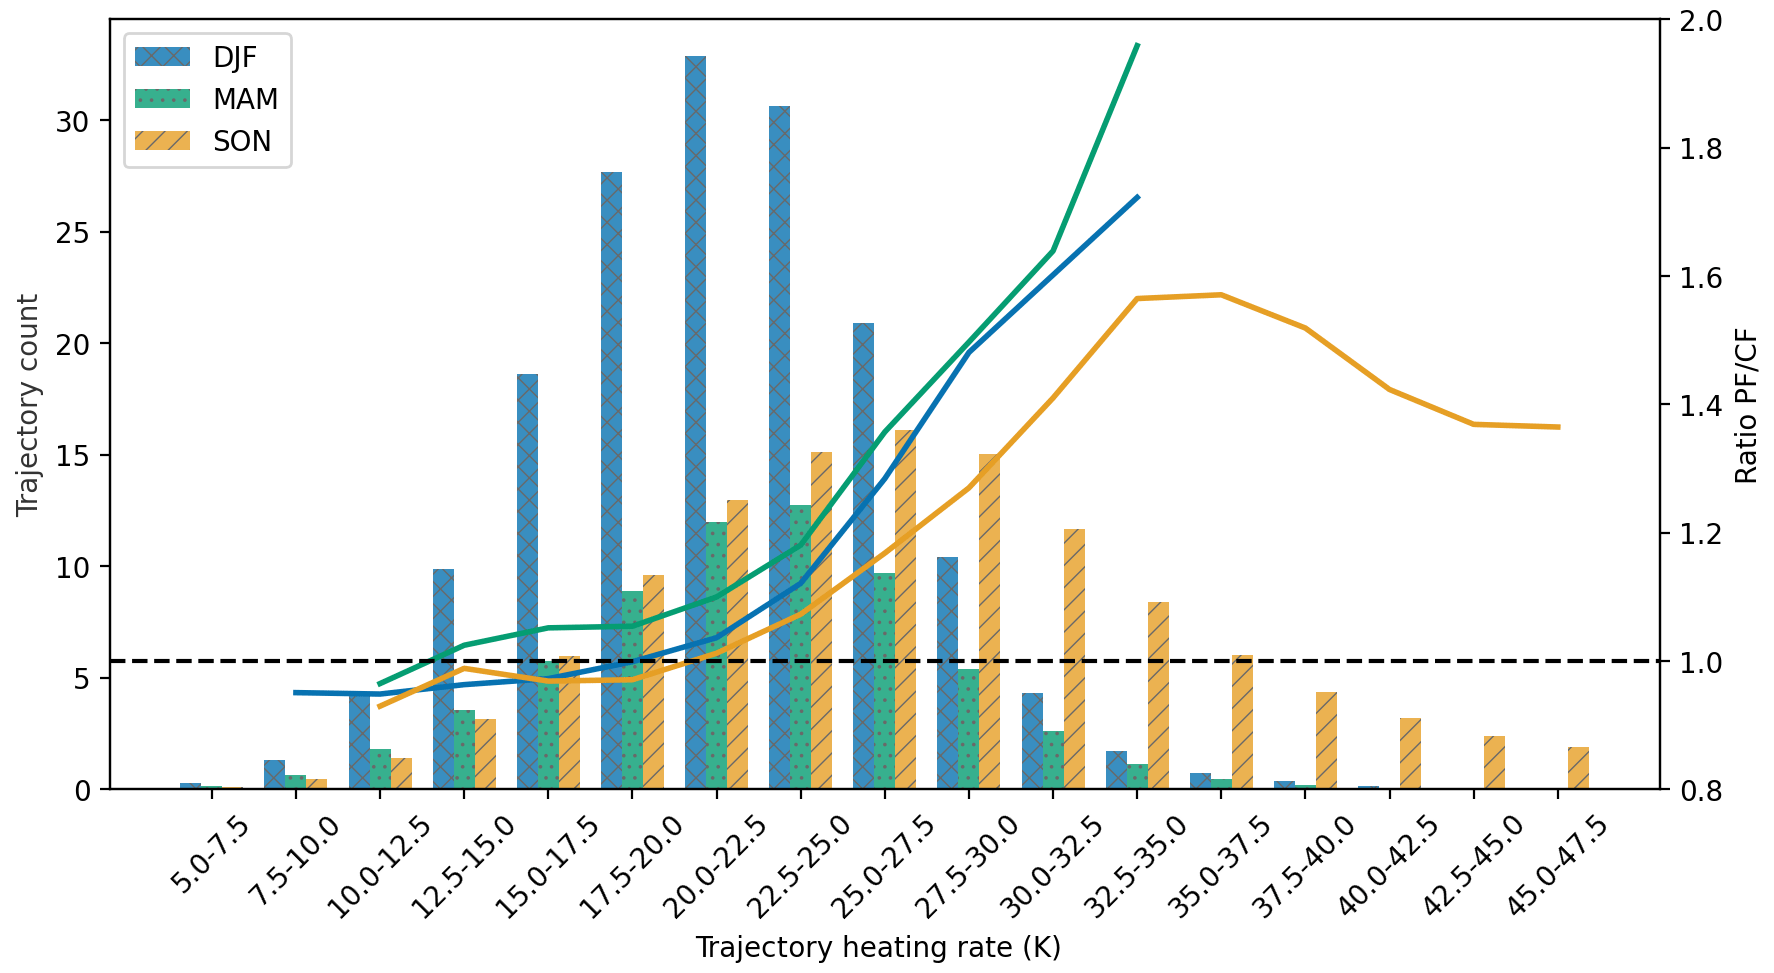
Figure 9WCB trajectory counts in perturbed members (left axis, coloured bars) and ratio of WCB trajectory numbers between operational medium-range forecasts with and without perturbations (right axis, coloured lines) initialised in winter (blue, cross hatching), spring (turquoise, dotted), and autumn (orange, line hatching) for operational ECMWF medium-range forecasts during the period from December 2018 to November 2021. The thick lines denote ratios which are statistically significantly different from 1 at a confidence level of 95 % estimated with a 1000-sample bootstrapping technique.
Due to the coarse resolution of the archived reforecast data set, it is not possible to detect ascending airstreams using trajectory analysis. We therefore make use of another data set that consists of 2 years of operational medium-range ensemble forecasts archived regionally for the North Atlantic domain, in which trajectory data are available (see Sect. 2.4). Thereby, we assess whether the inter-seasonal differences in the modulation of the amplitude of the upper-level flow through SPPT (Fig. 8) are in agreement with the impact of the model uncertainty schemes on rapidly ascending airstreams. By comparing WCB trajectories in the unperturbed and perturbed members, the seasonal differences in the effect of SPPT on the trajectory counts can be evaluated. Similarly to Fig. 3, Fig. 9 shows that the ratio of the number of rapidly ascending trajectories in the perturbed forecasts and in the unperturbed forecasts is largely controlled by the latent heating rate along the ascent. The inter-seasonal differences are in agreement with what has been observed for the seasonal differences in the impact of SPPT on the Rossby wave amplitude: in autumn, the latent heating rates along rapidly ascending airstreams are the highest, leading to the greatest increase in their frequency due to stochastic perturbations. Consequently, Rossby waves are also most strongly affected. In winter, the effect on the rapidly ascending airstreams is smaller than in autumn, as the latent heating rates are decreased, and the effect on the Rossby wave amplitude is consequently also smaller. In spring, the latent heating rates are comparable to those in winter, but the absolute frequency of WCBs is much smaller, and the diabatic influence on upper-level ridge building is not as pronounced as in winter and autumn, which is consistent with the weakest impact on the Rossby wave amplitude in spring. This joint sensitivity of the seasonal modulation of the rapidly ascending trajectories and the Rossby wave amplitude to SPPT is a strong indication that the two signals are linked to each other. This insight holds true even though two different data sets have been used, as the impact of SPPT on the occurrence frequency of ascending trajectories has been shown to be robust for different setups of the IFS (Pickl et al., 2022); therefore, we assume that the WCB modulation through SPPT is similar in the two data sets.
In this study, we investigate the influence of different model perturbation techniques in ECMWF's ensemble prediction system on rapidly ascending, diabatically driven airstreams and explore the impact of these sensitivities for the representation of weather phenomena that are related to ascending motions. This section discusses the presented results and aims to link the findings of the individual sections in order to develop a process-oriented understanding of how the stochastic perturbations result in the observed responses.
SPPT and SPP, which both represent model uncertainty related to physical parametrisations, have a very similar impact on rapidly ascending airstreams and systematically increase their occurrence frequencies. The impact of SPP is more pronounced in the tropics, whereas SPPT has a larger impact in the extratropical regions. This is in agreement with Leutbecher et al. (2017), who report similar regional differences for ensemble spread between SPPT and SPP. Similar sensitivities are evident when only parameters in the convection parametrisation scheme (SPP-CONV-ONLY) and in all parametrisation schemes but convection (SPP-CONV-OFF) are perturbed. This is an indication that the unilateral response of the model does not depend on how the perturbation is introduced (i.e. perturbation of the net tendencies or perturbation of the parameters) but where it is applied and if the perturbation is taken up by nonlinear processes. To demonstrate this beyond doubt, it would be necessary to conduct additional sensitivity experiments with other configurations of SPP (e.g. with perturbations only to the boundary layer scheme), which is beyond the capabilities of this study. Our results indicate that the local amplitude of the perturbations is a crucial factor in triggering a one-sided response in the system. For both SPPT and SPP, the amplitude of the perturbations is on average large in regions of rapidly ascending airstreams, as these are typically associated with large parametrisation tendencies (e.g. by the convection and microphysics schemes).
To determine whether the altered distributions of rapidly ascending motions have an impact on other processes in the forecast model, the response of precipitation and the large-scale flow to the different model uncertainty schemes has been analysed. The impact of the stochastic perturbation schemes on precipitation can be directly attributed to the altered vertical velocities, as the bimodal structure of the modifications of the upward motions with stochastic parametrisations is clearly reflected in the changes to precipitation.
The effect of the perturbations on the upper-level Rossby wave amplitude, measured by the hemispheric sum of the areas of upper-level ridges and troughs, and their connection to the altered occurrence frequencies of WCBs, are more complex. The initial hypothesis that the increased diabatic outflow from WCBs through stochastic model uncertainty schemes should result in a more amplified upper-level flow can be confirmed insofar that the ridge and trough areas are larger with than without model perturbations. In our study, we were able to show this by means of sensitivity experiments and by analysing operational reforecasts. The order of magnitude of the effect of SPPT and SPP on the rapidly ascending trajectories is, however, 1 order of magnitude larger than the effect on the upper-level troughs and ridges: with SPPT, for example, the counts of trajectories that are detected as WCBs are increased by approximately 10 %–20 % in the Northern Hemisphere extratropics (exact numbers depend on the season; see Figs. 2 and 9), while the ridge and trough areas are increased by only up to 1 %. However, comparing these two numbers with each other has to be done with caution because of the following considerations:
-
The divergent outflow of diabatically enhanced ascents is not the only process which contributes to the formation and amplification of upper-level ridges. For example, Teubler and Riemer (2021) highlight that barotropic wave dynamics at the tropopause, the interaction of baroclinic cyclones with the upper-level flow, and other diabatic processes (such as radiation and turbulence) influence troughs and ridges. Without the knowledge of how these processes are changed by stochastic perturbations, it is not possible to make a quantitative statement on the role of altered WCB frequencies in the ridge and trough areas. However, to the best of the authors' knowledge, there are no studies on the systematic effects of perturbations on these processes.
-
The trajectory count relies on the choice of a threshold (ascent of at least 600 hPa within 2 d). Airstreams that fail to fulfil this criterion (maybe by only a few hectopascals) are not considered in this diagnostic, even though they might exert a similar impact on the upper levels. Therefore, the trajectory count diagnostic might not quantitatively capture the net effect of the diabatically induced divergent outflow on the Rossby wave amplitude.
-
The dynamical response of the upper-level jet to the divergent outflow of WCBs depends on the distance of the outflow to the jet and on the outflow height relative to the tropopause level (Grams and Archambault, 2016). The tropopause height and the latitude of the 2 PVU line (i.e. Φeq) are both increased through the perturbations (see Fig. 6), which makes it more “difficult” for the WCB outflow to impinge on the jet stream and to initiate or amplify ridge building, assuming similar characteristics of the WCB outflow (e.g. outflow height and latitude) with and without perturbations.
From these aspects, it becomes clear that the modulated WCB frequencies do not directly correspond to the changes in the Rossby wave amplitude. Nevertheless, a causal relationship between the effect of stochastic perturbation schemes on the WCB occurrence and on the upper-level Rossby wave patterns is supported by the following considerations:
-
While stochastic perturbations affect the vertical velocities in the forecasts immediately after they have been applied (Pickl et al., 2022), the Rossby wave amplitude with and without model perturbations is identical at the beginning of the forecasts and diverges very slowly with forecast lead time. This points towards a weak yet constant forcing of the increased mass flux through the enhanced WCB activity on the upper-level ridges. The saturation of the process (i.e. the decreasing and vanishing differences in ridge and trough areas between perturbed and unperturbed forecasts; see Figs. 7 and 8) could arise from compensating effects of the model, without which the differences would constantly grow with forecast lead time.
-
SPP alters the vertical velocities and the frequency of WCB trajectories in a very similar way to SPPT, even though the perturbation techniques differ from each other.
-
The analysis of the (re-)forecast archives has shown that the trajectory counts and the Rossby wave amplitude are modulated similarly across the seasons, with the strongest impact in autumn and a weaker signal in winter and spring. This points towards a direct interrelation and a common underlying mechanism of the processes.
Our investigation adopts a novel, process-based perspective on the effects of stochastic perturbations on large-scale extratropical circulation. In previous studies, it has been shown that stochastic model perturbations improve the representation of Euro-Atlantic weather regimes across different model hierarchies (Dawson and Palmer, 2015; Christensen et al., 2015), especially for such regimes that are characterised by blocking anticyclones. In agreement with the presented results, the reported impacts on the large-scale circulation are mostly very subtle, especially in numerical models of high complexity (e.g. Davini et al., 2021; Dorrington, 2021). Christensen et al. (2015) argue that stochastic forcing enables a more realistic sampling of Lorenz-like attractors in models of reduced complexity, as the introduced noise helps to transition between stable states of the system (i.e. noise-induced regime transitions; Berner et al., 2015). Dorrington (2021) mentions that improved representations of the Atlantic ridge regime in fully coupled simulations with SPPT might be driven by improved tropical modes of variability (i.e. ENSO) whose signal is transferred to the extratropics via teleconnections. Martínez-Alvarado et al. (2018) state that differences in the sharpness of the tropospheric waveguide between perturbed and unperturbed forecasts are directly induced by vorticity perturbations along the large gradients at the dynamical tropopause. With our analysis, we contribute to the discussion and propose a coherent process chain of how the random perturbations affect the model climate: the distinct threshold behaviour in the dynamics of rapidly ascending, diabatically enhanced airstreams results in a one-sided response of the symmetric perturbations through SPPT or SPP. The increased occurrence frequency of the ascending airstreams, for example in the form of WCBs, is then projected to related weather phenomena, such as the upper-level Rossby wave pattern, which ultimately changes the model climate of the large-scale circulation.
With the presented analysis, we compare the effect of different model uncertainty schemes applied to ECMWF's ensemble prediction system on rapidly ascending airstreams and provide a coherent explanation of how stochastic perturbations can influence the mean state of the forecast model. We thereby contribute to the discussion about how the large-scale extratropical flow is modified through stochastic model perturbations on a process level. We argue that stochastic perturbation schemes change the distribution of precipitation and slightly amplify the upper-level Rossby wave pattern by modulating the occurrence frequency of vertical motions (especially of rapidly ascending, moist airstreams), which occurs due to the nonlinear nature of systems that are characterised by threshold behaviour (Pickl et al., 2022).
In order to further substantiate the causal relationship between the modulated ascending airstreams and the slightly increased Rossby wave amplitude, further sensitivity experiments have to be conducted. Apart from more ensemble members or forecast initialisations, which could yield a more robust signal, an experimental setup with perturbations confined to specific height layers of the troposphere (e.g. only in the upper troposphere) would shed light on whether the observed effect is caused locally or by a vertical propagation of the perturbations. Similarly, perturbations could be applied solely in pre-defined regions (e.g. only in the tropics) to determine if the signal originates from remote regions and is propagated by tropical–extratropical teleconnections. Further, a more quantitative framework that uses PV tendencies to evaluate barotropic, baroclinic, and divergent contributions to upper-level flow features (Teubler and Riemer, 2021) could be applied to ensemble experiments to gain further insights into how perturbations affect the model dynamics. However, all of these proposed approaches require a significant amount of resources with respect to experimental design, model implementations, and computational power and are therefore beyond the scope of this study.
The S2S reforecast data set is publicly available from http://apps.ecmwf.int/datasets/data/s2s (Vitart et al., 2017), and the ERA5 reanalysis data set can be downloaded from https://doi.org/10.24381/cds.bd0915c6 (Hersbach et al., 2023). The experiment data and the operational medium-range forecast data set are too large to upload and will be shared upon request.
MD conducted the numerical IFS experiments, performed all analyses presented in the paper, and wrote the paper. CMG downloaded the operational ECMWF forecasts, provided the original diagnostic framework to automatically compute trajectories in the ensemble forecasts, and gave important guidance and feedback during all stages of the project.
At least one of the (co-)authors is a member of the editorial board of Weather and Climate Dynamics. The peer-review process was guided by an independent editor, and the authors also have no other competing interests to declare.
Publisher’s note: Copernicus Publications remains neutral with regard to jurisdictional claims made in the text, published maps, institutional affiliations, or any other geographical representation in this paper. While Copernicus Publications makes every effort to include appropriate place names, the final responsibility lies with the authors.
We thank Antje Weisheimer and the anonymous reviewer for their valuable feedback on the study. ECMWF and Deutscher Wetterdienst are acknowledged for granting access to computing facilities and real-time operational ensemble forecast data. We are very grateful to Simon Lang from ECMWF, who significantly contributed to the design of the numerical IFS experiments and helped with the interpretation of the results. We thank Heini Wernli and Michael Sprenger for providing the LAGRANTO software. We are grateful to Martin Leutbecher and Sarah-Jane Lock from ECMWF and to the members of the Large-scale Dynamics and Predictability group at KIT for valuable discussions on this project.
This work was funded by the Helmholtz Association as part of the “Sub-seasonal Predictability: Understanding the Role of Diabatic Outflow” (SPREADOUT; grant VH-NG-1243) Young Investigator Group.
This paper was edited by Pedram Hassanzadeh and reviewed by Antje Weisheimer and one anonymous referee.
Berman, J. D. and Torn, R. D.: The impact of initial condition and warm conveyor belt forecast uncertainty on variability in the downstream waveguide in an ECWMF case study, Mon. Weather Rev., 147, 4071–4089, https://doi.org/10.1175/MWR-D-18-0333.1, 2019. a
Berner, J., Doblas-Reyes, F. J., Palmer, T. N., Shutts, G., and Weisheimer, A.: Impact of a quasi-stochastic cellular automaton backscatter scheme on the systematic error and seasonal prediction skill of a global climate model, Philos. T. R. Soc. A, 366, 2561–2577, https://doi.org/10.1098/rsta.2008.0033, 2008. a
Berner, J., Jung, T., and Palmer, T. N.: Systematic model error: The impact of increased horizontal resolution versus improved stochastic and deterministic parameterizations, J. Climate, 25, 4946–4962, https://doi.org/10.1175/JCLI-D-11-00297.1, 2012. a, b, c
Berner, J., Fossell, K. R., Ha, S. Y., Hacker, J. P., and Snyder, C.: Increasing the skill of probabilistic forecasts: Understanding performance improvements from model-error representations, Mon. Weather Rev., 143, 1295–1320, https://doi.org/10.1175/MWR-D-14-00091.1, 2015. a
Berner, J., Achatz, U., Batté, L., Bengtsson, L., De La Cámara, A., Christensen, H. M., Colangeli, M., Coleman, D. R., Crommelin, D., Dolaptchiev, S. I., Franzke, C. L., Friederichs, P., Imkeller, P., Järvinen, H., Juricke, S., Kitsios, V., Lott, F., Lucarini, V., Mahajaajaajan, S., Palmer, T. N., Penland, C., Sakradzijaja, M., Von Storch, J. S., Weisheimer, A., Weniger, M., Williams, P. D., and Yano, J. I.: Stochastic parameterization toward a new view of weather and climate models, B. Am. Meteorol. Soc., 98, 565–587, https://doi.org/10.1175/BAMS-D-15-00268.1, 2017. a
Birner, T. and Williams, P. D.: Sudden stratospheric warmings as noise-induced transitions, J. Atmos. Sci., 65, 3337–3343, https://doi.org/10.1175/2008JAS2770.1, 2008. a
Buizza, R., Miller, M., and Palmer, T. N.: Stochastic representation of model uncertainties in the ECMWF Ensemble Prediction System, Q. J. Roy. Meteor. Soc., 125, 2887–2908, https://doi.org/10.1256/smsqj.56005, 1999. a, b
Buizza, R., Leutbecher, M., and Isaksen, L.: Potential use of an ensemble of analyses in the ECMWF Ensemble Prediction System, Q. J. Roy. Meteor. Soc., 134, 2051–2066, https://doi.org/10.1002/qj.346, 2008. a
Butchart, N. and Remsberg, E. E.: The area of the stratospheric polar vortex as a diagnostic for tracer transport on an isentropic surface, J. Atmos. Sci., 43, 1319–1339, https://doi.org/10.1175/1520-0469(1986)043<1319:TAOTSP>2.0.CO;2, 1986. a
Carlson, T. N.: Airflow through midlatitude cyclones and the comma cloud pattern, Mon. Weather Rev., 108, 1498–1509, https://doi.org/10.1175/1520-0493(1980)108<1498:ATMCAT>2.0.CO;2, 1980. a
Chagnon, J. M., Gray, S. L., and Methven, J.: Diabatic processes modifying potential vorticity in a north atlantic cyclone, Q. J. Roy. Meteor. Soc., 139, 1270–1282, https://doi.org/10.1002/qj.2037, 2013. a
Christensen, H. M.: Constraining stochastic parametrisation schemes using high-resolution simulations, Q. J. Roy. Meteor. Soc., 146, 938–962, https://doi.org/10.1002/qj.3717, 2020. a
Christensen, H. M., Moroz, I. M., and Palmer, T. N.: Simulating weather regimes: impact of stochastic and perturbed parameter schemes in a simple atmospheric model, Clim. Dynam., 44, 2195–2214, https://doi.org/10.1007/s00382-014-2239-9, 2015. a, b, c
Christensen, H. M., Berner, J., Coleman, D. R., and Palmer, T. N.: Stochastic parameterization and El Niño-southern oscillation, J. Climate, 30, 17–38, https://doi.org/10.1175/JCLI-D-16-0122.1, 2017. a
Davini, P., Weisheimer, A., Balmaseda, M., Johnson, S. J., Molteni, F., Roberts, C. D., Senan, R., and Stockdale, T. N.: The representation of winter Northern Hemisphere atmospheric blocking in ECMWF seasonal prediction systems, Q. J. Roy. Meteor. Soc., 147, 1344–1363, https://doi.org/10.1002/qj.3974, 2021. a, b
Dawson, A. and Palmer, T. N.: Simulating weather regimes: impact of model resolution and stochastic parameterization, Clim. Dynam., 44, 2177–2193, https://doi.org/10.1007/s00382-014-2238-x, 2015. a, b
Derbyshire, S. H., Beau, I., Bechtold, P., Grandpeix, J. Y., Piriou, J. M., Redelsperger, J. L., and Soares, P. M.: Sensitivity of moist convection to environmental humidity, Q. J. Roy. Meteor. Soc., 130, 3055–3079, https://doi.org/10.1256/qj.03.130, 2004. a
Dorrington, J.: On the variability and forced response of atmospheric regime systems, PhD thesis, University of Oxford, https://ora.ox.ac.uk/objects/uuid:5567d432-e429-4b7c-838a-aea4014d2923 (last access: 12 July 2024), 2021. a, b
ECMWF: IFS Documentation CY46R1 – Part VI: Technical and Computational Procedures, in: IFS documentation CY46R1, 1–239, https://doi.org/10.21957/9abmxkfm1, 2019. a
Grams, C. M. and Archambault, H. M.: The key role of diabatic outflow in amplifying the midlatitude flow: A representative case study of weather systems surrounding western North Pacific extratropical transition, Mon. Weather Rev., 144, 3847–3869, https://doi.org/10.1175/MWR-D-15-0419.1, 2016. a, b
Grams, C. M., Wernli, H., Böttcher, M., Čampa, J., Corsmeier, U., Jones, S. C., Keller, J. H., Lenz, C. J., and Wiegand, L.: The key role of diabatic processes in modifying the upper-tropospheric wave guide: A North Atlantic case-study, Q. J. Roy. Meteor. Soc., 137, 2174–2193, https://doi.org/10.1002/qj.891, 2011. a, b
Grams, C. M., Jones, S. C., and Davis, C. A.: The impact of Typhoon Jangmi (2008) on the midlatitude flow. Part II: Downstream evolution, Q. J. Roy. Meteor. Soc., 139, 2165–2180, https://doi.org/10.1002/qj.2119, 2013. a
Grams, C. M., Magnusson, L., and Madonna, E.: An atmospheric dynamics perspective on the amplification and propagation of forecast error in numerical weather prediction models: A case study, Q. J. Roy. Meteor. Soc., 144, 2577–2591, https://doi.org/10.1002/qj.3353, 2018. a
Gray, S. L., Dunning, C. M., Methven, J., Masato, G., and Chagnon, J. M.: Systematic model forecast error in Rossby wave structure, Geophys. Res. Lett., 41, 2979–2987, https://doi.org/10.1002/2014GL059282, 2014. a, b, c, d, e
Hersbach, H., Bell, B., Berrisford, P., Hirahara, S., Horányi, A., Muñoz-Sabater, J., Nicolas, J., Peubey, C., Radu, R., Schepers, D., Simmons, A., Soci, C., Abdalla, S., Abellan, X., Balsamo, G., Bechtold, P., Biavati, G., Bidlot, J., Bonavita, M., De Chiara, G., Dahlgren, P., Dee, D., Diamantakis, M., Dragani, R., Flemming, J., Forbes, R., Fuentes, M., Geer, A., Haimberger, L., Healy, S., Hogan, R. J., Hólm, E., Janisková, M., Keeley, S., Laloyaux, P., Lopez, P., Lupu, C., Radnoti, G., de Rosnay, P., Rozum, I., Vamborg, F., Villaume, S., and Thépaut, J. N.: The ERA5 global reanalysis, Q. J. Roy. Meteor. Soc., 146, 1999–2049, https://doi.org/10.1002/qj.3803, 2020. a
Hersbach, H., Bell, B., Berrisford, P., Biavati, G., Horányi, A., Muñoz Sabater, J., Nicolas, J., Peubey, C., Radu, R., Rozum, I., Schepers, D., Simmons, A., Soci, C., Dee, D., and Thépaut, J.-N.: ERA5 hourly data on pressure levels from 1940 to present, Copernicus Climate Change Service (C3S) Climate Data Store (CDS) [data set], https://doi.org/10.24381/cds.bd0915c6, 2023. a
Isaksen, L., Bonavita, M., Buizza, R., Fisher, M., Haseler, J., Leutbecher, M., and Raynaud, L.: Ensemble of data assimilations at ECMWF, ECMWF Technical Memorandum, 636, 1–41, 2010. a
Jiang, H. and Zipser, E. J.: Contribution of Tropical Cyclones to the Global Precipitation from Eight Seasons of TRMM Data: Regional, Seasonal, and Interannual Variations, J. Climate, 23, 1526–1543, https://doi.org/10.1175/2009jcli3303.1, 2010. a
Lang, S. T., Lock, S. J., Leutbecher, M., Bechtold, P., and Forbes, R. M.: Revision of the Stochastically Perturbed Parametrisations model uncertainty scheme in the Integrated Forecasting System, Q. J. Roy. Meteor. Soc., 147, 1364–1381, https://doi.org/10.1002/qj.3978, 2021. a, b, c
Leutbecher, M. and Palmer, T. N.: Ensemble forecasting, J. Comput. Phys., 227, 3515–3539, https://doi.org/10.1016/j.jcp.2007.02.014, 2008. a, b, c
Leutbecher, M., Lock, S. J., Ollinaho, P., Lang, S. T., Balsamo, G., Bechtold, P., Bonavita, M., Christensen, H. M., Diamantakis, M., Dutra, E., English, S., Fisher, M., Forbes, R. M., Goddard, J., Haiden, T., Hogan, R. J., Juricke, S., Lawrence, H., MacLeod, D., Magnusson, L., Malardel, S., Massart, S., Sandu, I., Smolarkiewicz, P. K., Subramanian, A., Vitart, F., Wedi, N., and Weisheimer, A.: Stochastic representations of model uncertainties at ECMWF: state of the art and future vision, Q. J. Roy. Meteor. Soc., 143, 2315–2339, https://doi.org/10.1002/qj.3094, 2017. a, b, c, d, e, f, g, h
Lewis, J. M.: Roots of ensemble forecasting, Mon. Weather Rev., 133, 1865–1885, https://doi.org/10.1175/MWR2949.1, 2005. a
Maddison, J. W., Gray, S. L., Martínez-Alvarado, O., and Williams, K. D.: Upstream cyclone influence on the predictability of block onsets over the Euro-Atlantic region, Mon. Weather Rev., 147, 1277–1296, https://doi.org/10.1175/MWR-D-18-0226.1, 2019. a
Madonna, E., Wernli, H., Joos, H., and Martius, O.: Warm conveyor belts in the ERA-Interim Dataset (1979–2010). Part I: Climatology and potential vorticity evolution, J. Climate, 27, 3–26, https://doi.org/10.1175/JCLI-D-12-00720.1, 2014. a, b
Martínez-Alvarado, O., Madonna, E., Gray, S. L., and Joos, H.: A route to systematic error in forecasts of Rossby waves, Q. J. Roy. Meteor. Soc., 142, 196–210, https://doi.org/10.1002/qj.2645, 2016. a
Martínez-Alvarado, O., Maddison, J. W., Gray, S. L., and Williams, K. D.: Atmospheric blocking and upper-level Rossby-wave forecast skill dependence on model configuration, Q. J. Roy. Meteor. Soc., 144, 2165–2181, https://doi.org/10.1002/qj.3326, 2018. a, b, c
Methven, J.: Potential vorticity in warm conveyor belt outflow, Q. J. Roy. Meteor. Soc., 141, 1065–1071, https://doi.org/10.1002/qj.2393, 2015. a
Methven, J. and Berrisford, P.: The slowly evolving background state of the atmosphere, Q. J. Roy. Meteor. Soc., 141, 2237–2258, https://doi.org/10.1002/qj.2518, 2015. a
Ollinaho, P., Lock, S. J., Leutbecher, M., Bechtold, P., Beljaars, A., Bozzo, A., Forbes, R. M., Haiden, T., Hogan, R. J., and Sandu, I.: Towards process-level representation of model uncertainties: stochastically perturbed parametrizations in the ECMWF ensemble, Q. J. Roy. Meteor. Soc., 143, 408–422, https://doi.org/10.1002/qj.2931, 2017. a
Palmer, T. N., Shutts, G. J., Hagedorn, R., Doblas-Reyes, F. J., Jung, T., and Leutbecher, M.: Representing model uncertainty in weather and climate prediction, Annu. Rev. Earth Pl. Sc., 33, 163–193, https://doi.org/10.1146/annurev.earth.33.092203.122552, 2005. a
Pfahl, S., Madonna, E., Boettcher, M., Joos, H., and Wernli, H.: Warm conveyor belts in the ERA-Interim Dataset (1979–2010). Part II: Moisture origin and relevance for precipitation, J. Climate, 27, 27–40, https://doi.org/10.1175/JCLI-D-13-00223.1, 2014. a
Pfahl, S., Schwierz, C., Croci-Maspoli, M., Grams, C. M., and Wernli, H.: Importance of latent heat release in ascending air streams for atmospheric blocking, Nat. Geosci., 8, 610–614, https://doi.org/10.1038/ngeo2487, 2015. a
Pickl, M., Lang, S. T., Leutbecher, M., and Grams, C. M.: The effect of stochastically perturbed parametrisation tendencies (SPPT) on rapidly ascending air streams, Q. J. Roy. Meteor. Soc., 148, 1242–1261, https://doi.org/10.1002/qj.4257, 2022. a, b, c, d, e, f, g, h, i, j, k, l, m, n, o
Pickl, M., Quinting, J. F., and Grams, C. M.: Warm conveyor belts as amplifiers of forecast uncertainty, Q. J. Roy. Meteor. Soc., 149, 3064–3085, https://doi.org/10.1002/qj.4546, 2023. a
Pomroy, H. R. and Thorpe, A. J.: The evolution and dynamical role of reduced upper-tropospheric potential vorticity in intensive observing period one of FASTEX, Mon. Weather Rev., 128, 1817–1834, https://doi.org/10.1175/1520-0493(2000)128<1817:TEADRO>2.0.CO;2, 2000. a
Rabier, F., Järvinen, H., Klinker, E., Mahfouf, J. F., and Simmons, A.: The ECMWF operational implementation of four-dimensional variational assimilation. I: Experimental results with simplified physics, Q. J. Roy. Meteor. Soc., 126, 1143–1170, 2000. a
Saffin, L., Gray, S. L., Methven, J., and Williams, K. D.: Processes Maintaining Tropopause Sharpness in Numerical Models, J. Geophys. Res.-Atmos., 122, 9611–9627, https://doi.org/10.1002/2017JD026879, 2017. a
Saffin, L., Methven, J., Bland, J., Harvey, B., and Sanchez, C.: Circulation conservation in the outflow of warm conveyor belts and consequences for Rossby wave evolution, Q. J. Roy. Meteor. Soc., 147, 3587–3610, https://doi.org/10.1002/qj.4143, 2021. a
Sardeshmukh, P., Penland, C., and Newman, M.: Rossby waves in a stochastically fluctuating medium, in: Stochastic Climate Models, edited by Imkeller, P. and von Storch, J.-S., Birkhäuser Basel, Basel, 369–384, ISBN 978-3-0348-8287-3, https://doi.org/10.1007/978-3-0348-8287-3_17, 2001. a
Schäfler, A. and Harnisch, F.: Impact of the inflow moisture on the evolution of a warm conveyor belt, Q. J. Roy. Meteor. Soc., 141, 299–310, https://doi.org/10.1002/qj.2360, 2015. a
Schäfler, A., Harvey, B., Methven, J., Doyle, J. D., Rahm, S., Reitebuch, O., Weiler, F., and Witschas, B.: Observation of Jet Stream Winds during NAWDEX and Characterization of Systematic Meteorological Analysis Errors, Mon. Weather Rev., 148, 2889–2907, https://doi.org/10.1175/MWR-D-19-0229.1, 2020. a
Sprenger, M. and Wernli, H.: The LAGRANTO Lagrangian analysis tool – version 2.0, Geosci. Model Dev., 8, 2569–2586, https://doi.org/10.5194/gmd-8-2569-2015, 2015. a
Steinfeld, D. and Pfahl, S.: The role of latent heating in atmospheric blocking dynamics: a global climatology, Clim. Dynam., 53, 6159–6180, https://doi.org/10.1007/s00382-019-04919-6, 2019. a
Stockdale, T., Alonso-Balmaseda, M., Johnson, S., Ferranti, L., Molteni, F., Magnusson, L., Tietsche, S., Vitart, F., Decremer, D., Weisheimer, A., Roberts, C. D., Balsamo, G., Keeley, S., Mogensen, K., Zuo, H., Mayer, M., and Monge-Sanz, B. M.: SEAS5 and the future evolution of the long-range forecast system, ECMWF Technical Memorandum, 835, 1–81, https://doi.org/10.21957/z3e92di7y, 2018. a
Straus, D. M., Domeisen, D. I. V., Lock, S.-J., Molteni, F., and Yadav, P.: Intrinsic Predictability Limits arising from Indian Ocean MJO Heating: Effects on tropical and extratropical teleconnections, EGUsphere [preprint], https://doi.org/10.5194/egusphere-2023-493, 2023. a
Strommen, K., Christensen, H. M., MacLeod, D., Juricke, S., and Palmer, T. N.: Progress towards a probabilistic Earth system model: examining the impact of stochasticity in the atmosphere and land component of EC-Earth v3.2, Geosci. Model Dev., 12, 3099–3118, https://doi.org/10.5194/gmd-12-3099-2019, 2019. a
Strommen, K., Juricke, S., and Cooper, F.: Improved teleconnection between Arctic sea ice and the North Atlantic Oscillation through stochastic process representation, Weather Clim. Dynam., 3, 951–975, https://doi.org/10.5194/wcd-3-951-2022, 2022. a
Subramanian, A., Weisheimer, A., Palmer, T., Vitart, F., and Bechtold, P.: Impact of stochastic physics on tropical precipitation in the coupled ECMWF model, Q. J. Roy. Meteor. Soc., 143, 852–865, https://doi.org/10.1002/qj.2970, 2017. a
Teubler, F. and Riemer, M.: Potential-vorticity dynamics of troughs and ridges within Rossby wave packets during a 40-year reanalysis period, Weather Clim. Dynam., 2, 535–559, https://doi.org/10.5194/wcd-2-535-2021, 2021. a, b
Tompkins, A. M. and Berner, J.: A stochastic convective approach to account for model uncertainty due to unresolved humidity variability, J. Geophys. Res.-Atmos., 113, D18101, https://doi.org/10.1029/2007JD009284, 2008. a
Vidale, P. L., Hodges, K., Vannière, B., Davini, P., Roberts, M. J., Strømmen, K., Weisheimer, A., Plesca, E., and Corti, S.: Impact of stochastic physics and model resolution on the simulation of tropical cyclones in climate GCMs, J. Climate, 34, 4315–4341, https://doi.org/10.1175/JCLI-D-20-0507.1, 2021. a
Vitart, F., Ardilouze, C., Bonet, A., Brookshaw, A., Chen, M., Codorean, C., Déqué, M., Ferranti, L., Fucile, E., Fuentes, M., Hendon, H., Hodgson, J., Kang, H. S., Kumar, A., Lin, H., Liu, G., Liu, X., Malguzzi, P., Mallas, I., Manoussakis, M., Mastrangelo, D., MacLachlan, C., McLean, P., Minami, A., Mladek, R., Nakazawa, T., Najm, S., Nie, Y., Rixen, M., Robertson, A. W., Ruti, P., Sun, C., Takaya, Y., Tolstykh, M., Venuti, F., Waliser, D., Woolnough, S., Wu, T., Won, D. J., Xiao, H., Zaripov, R., and Zhang, L.: The subseasonal to seasonal (S2S) prediction project database, B. Am. Meteorol. Soc., 98, 163–173, https://doi.org/10.1175/BAMS-D-16-0017.1, 2017 (data available at: http://apps.ecmwf.int/datasets/data/s2s, last access: 17 July 2024). a, b
Weisheimer, A., Corti, S., Palmer, T., and Vitart, F.: Addressing model error through atmospheric stochastic physical parametrizations: Impact on the coupled ECMWF seasonal forecasting system, Philos. T. R. Soc. A, 372, 2018, https://doi.org/10.1098/rsta.2013.0290, 2014. a
Wernli, H. and Davies, H. C.: A Lagrangian-based analysis of extratropical cyclones. I: The method and some applications, Q. J. Roy. Meteor. Soc., 123, 467–489, https://doi.org/10.1256/smsqj.53810, 1997. a
Yang, C., Christensen, H. M., Corti, S., von Hardenberg, J., and Davini, P.: The impact of stochastic physics on the El Niño Southern Oscillation in the EC-Earth coupled model, Clim. Dynam., 53, 2843–2859, https://doi.org/10.1007/s00382-019-04660-0, 2019. a