the Creative Commons Attribution 4.0 License.
the Creative Commons Attribution 4.0 License.
 | 10 Nov 2025
The impacts of climate change on tropical-to-extratropical transitions in the North Atlantic Basin
Aude Garin
Francesco S. R. Pausata
Mathieu Boudreault
Roberto Ingrosso
As tropical cyclones migrate toward mid-latitudes, they can transform into extratropical cyclones, a process known as extratropical transition. In the North Atlantic Basin, nearly half of hurricanes undergo this transition. After transitioning, these storms can reintensify, posing significant threats to populations and infrastructure along the eastern coast of North America. While the impacts of climate change on hurricanes have been extensively studied, there remain uncertainties about its effects on extratropical transitions. This study aims to assess how climate change affects the frequency, location, intensity, and duration of these transitions. To achieve this, high-resolution regional simulations from an atmospheric regional climate model, based on the Representative Concentration Pathways 8.5 (RCP8.5) emissions scenario, were used to compare two 30-year periods: the present (1990–2019) and the end of the century (2071–2100). The results indicate a projected decrease in the number of tropical hurricanes, with no significant change in extratropical transition rates. September and October continue to be the primary months for extratropical transitions. However, the season's peak appears to have shifted from September to October, suggesting that large-scale environmental conditions may become more favourable for extratropical transitions in October in the future. Although a poleward shift in the maximum intensity of tropical hurricanes is detected, the average latitude of the transitions does not change. Our findings suggest that transitioning storms will be more intense in the future, despite a less baroclinic atmosphere, due to a stronger contribution from latent heat transfer. However, the risk of reintensification after transition is not expected to increase.
- Article
(2571 KB) - Full-text XML
- BibTeX
- EndNote


Tropical cyclones can transform into extratropical cyclones through a process called extratropical transition (ET), in particular when they encounter a baroclinic environment and experience cooler sea surface temperatures. These transitions occur rather frequently in the North Atlantic Basin, with approximately 50 % of hurricanes undergoing an ET (Bieli et al., 2019; Hart and Evans, 2001). Moreover, about 50 % of tropical cyclones that made landfall during this period were in the process of transitioning (Hart and Evans, 2001). Some of these cyclones can intensify after transitioning, resulting in significant harm to human lives and damage to infrastructures, as seen with Hurricane Floyd (1999) and Hurricane Sandy (2012). More recently, Hurricane Fiona in 2023 has set a new record for the lowest pressure ever recorded in Canada (Chedabucto Bay). The northeastern coast of the US and the Canadian Maritimes, which typically experience one to two of these storms per year, as well as western Europe, which faces them once every 2 years, are particularly vulnerable to these risks (Hart and Evans, 2001). Given the substantial financial losses these events can cause, there are growing concerns among economic stakeholders about the potential impact of climate change on the frequency and severity of these transitions.
The atmospheric mechanisms underlying extratropical transitions have been extensively studied in recent years. As a tropical cyclone moves poleward, it encounters several environmental changes, such as low sea surface temperature (SST), increased SST gradients, enhanced vertical wind shear, and a stronger Coriolis force (Jones et al., 2003). These changes may remarkably affect the tropical cyclone, resulting in a loss of intensity, a breakdown of its warm-core structure, and a loss of its axisymmetric structure (Jones et al., 2003). When a tropical cyclone encounters an existing extratropical system, typically a mid-tropospheric trough, the process of extratropical transition may be initiated (Arnott et al., 2004; Hart et al., 2006; Jones et al., 2003; Klein et al., 2000; Wood and Ritchie, 2014). The mid-tropospheric trough favours the advection of angular momentum – rather than heat advection – which drives the conversion of the cyclone's warm-core structure into a cold-core structure (Hart et al., 2006). This advection of angular momentum disturbs the classic structure of a tropical cyclone (TC), characterized by a decrease in wind strength with height and a warm core, thereby disturbing the thermal wind balance. To restore thermal wind balance, a secondary circulation is established: above the maximum of angular momentum advection, adiabatic descent causes warming, while below the maximum, adiabatic ascent leads to cooling, resulting in frontogenesis (Harr and Elsberry, 2000; Hart et al., 2006). During this transition, the storm's wind field expands and becomes asymmetric, shifting the location of maximum wind speeds (Evans and Hart, 2008). The timing of the transition from a warm-core to an asymmetric structure appears to be basin dependent: in the North Atlantic Basin, TCs seem to first acquire an asymmetric structure while maintaining a warm-core structure, whereas, in the eastern North Pacific, they first lose their warm-core structure while retaining their symmetry (Bieli et al., 2019; Wood and Ritchie, 2014).
Hence, the mid-latitude environment and weather systems play an essential role in a tropical cyclone's transition process. During and after the extratropical transition, the addition of baroclinic energy (Evans et al., 2017) and diabatic heating (Rantanen et al., 2020) may cause an intensification of post-transition tropical cyclones. The structure of the tropical cyclone may play a role in the reintensification process after ET (Arnott et al., 2004) as well as the presence of atmospheric rivers, which may speed up the process (Baatsen et al., 2015).
While the impact of climate change on tropical cyclones has been largely addressed in recent years, only a few studies have focused on the effects of a warmer climate on extratropical transition events. Regarding tropical cyclones, it is expected that their global frequency may decrease in a warmer environment, although the proportion of very intense hurricanes (especially Category 4 and 5 events) is likely to increase (Bender et al., 2010; Hill and Lackmann, 2011; Knutson et al., 2020; Mallard et al., 2013). Additionally, there may be a poleward expansion of tropical cyclone genesis (Garner et al., 2021) along with a poleward migration of the maximum intensity of tropical cyclones (Lee et al., 2020) due to higher SSTs and reduced wind shear at mid-latitudes. However, there remain uncertainties around this latter point (Knutson et al., 2020). In the mid-latitude environment, a decrease in vertical wind shear (Kossin et al., 2014) and a reduction in the frequency of extratropical systems during the summer season in the Northern Hemisphere (Lehmann et al., 2014) are anticipated. Consequently, storms might become more intense during extratropical transition due to the projected increase in the intensity of tropical cyclones. Furthermore, extratropical transitions may occur farther north. Warmer SSTs could enable tropical cyclones to maintain their tropical characteristics and strength further north, thereby increasing the likelihood of encountering a baroclinic zone necessary for extratropical transition (Hart and Evans, 2001). However, the potential projected decrease in extratropical systems during summer (Lehmann et al., 2014), along with the reduction in baroclinicity in the low troposphere, may hinder extratropical transitions.
Regarding extratropical transitions in a warmer environment, they are expected to be more intense, last longer, and be associated with heavier precipitation (Jung and Lackmann, 2019, 2021, 2023; Michaelis and Lackmann, 2019, 2021). However, post-transition storms are expected to be less intense (Jung and Lackmann, 2021, 2023). An increase in the frequency of extratropical transition events is anticipated in the central and eastern North Atlantic Basin (Baker et al., 2022; Liu et al., 2017), consistent with the projected poleward and eastward expansion of tropical cyclone genesis regions. This shift in the genesis location may likely lead to more storms hitting western Europe (Baatsen et al., 2015; Haarsma et al., 2013). However, there is still uncertainty about how extratropical transition events will evolve in a warmer environment.
Our study aims to determine the impacts of climate change on the frequency, location, duration, and intensity of extratropical transitions in the North Atlantic Basin by using high-resolution simulations from a regional atmospheric climate model that span two 30-year periods: 1990–2019 for present-day simulations and 2071–2100 for simulations of the future. Simulations of future climate are based on the Representative Concentration Pathways 8.5 (RCP8.5) scenario. The focus of the study is particularly on highly populated areas (US northeastern coast and Canadian Maritimes), where casualties and infrastructure damages can be significant.
This paper is organized as follows. Section 2 describes the data and methodology used to track tropical cyclones and extratropical transition events, as well as the key metrics used to assess the change in extratropical transitions. Section 3 presents the key findings on how climate change impacts the frequency, location, and intensity of ETs. Section 4 discusses these findings and provides conclusions.
2.1 Data experiments and model description
The two 30-year experiments used for this study are part of the set of simulations used in Ingrosso and Pausata (2024). These experiments encompass the present-day scenario (1990–2019) and the RCP8.5 future scenario (2071–2100). We chose to focus on the most extreme scenario to determine whether any significant impacts emerge, as scenarios with lower greenhouse gas emissions are less likely to produce a discernible signal.
These experiments were performed with the developmental version of the Canadian Regional Climate Model/Global Environmental Multiscale (CRCM5/GEM4.8) at a horizontal grid spacing of 0.12° and 57 vertical levels. The regional model, CRCM5, was driven using the data from the global simulations performed with GEM4.8 at 0.55° horizontal resolution and 73 vertical levels (further details can be found in Ingrosso and Pausata, 2024).
To evaluate the model's performance, the regional model was compared with observations from the Tropical Rainfall Measuring Mission (TRMM), the Climate Research Unit, and one reanalysis product (ERA5), focusing on the mean precipitation distribution from 2000 to 2019 (Ingrosso and Pausata, 2024). The regional model demonstrated its ability to align with the observations despite a persistent dry bias in the median and lower percentiles. Additionally, the regional model has shown good performance in reproducing the general diurnal cycle, although rainfall was underestimated compared to satellite observations. The precipitation comparison is a general evaluation of the model and indeed does not provide meaningful information in terms of the ability of the model to represent TC and ET climatology, which is discussed later in Sect. 2.8 and in Appendix A.
The regional area covered by the simulations extends from 3° S to 48° N and from 81° W to 52° E.
2.2 Storm-tracking algorithm
In this study, we employ a storm-tracking algorithm designed to detect both tropical cyclones (including tropical storms) and transitioning tropical cyclones. This algorithm is based on the methodology used in Dandoy et al. (2021) and follows a three-step procedure: storm identification, storm tracking, and storm lifetime, in line with previous studies (Gualdi et al., 2008; Scoccimarro et al., 2017). The algorithm uses 3 h outputs of the model for the period from June to December.
2.2.1 Storm identification
A storm is identified when several criteria are met. One of the key strengths of this algorithm is the double-filtering approach that prevents us from double-counting a tropical cyclone (TC) when there is a temporary decrease in intensity, followed by a restrengthening. Specifically, each storm center is categorized as either a weak center (if it meets only loose criteria) or a strong center (if it also meets strict criteria). The criteria used are as follows:
-
Surface pressure. The center's surface pressure must be lower than 1013 hPa (1005 hPa to be classified as a strong center) and represent a minimum within a 250 km radius. Additionally, the center must be a closed low-pressure system, with the minimum pressure difference between the center and a circle of grid points in small (400 km) and large (800 km) radii around the center exceeding 1 and 2 hPa, respectively (4 and 6 hPa to be considered a strong center).
-
Vorticity at 850 hPa. The maximum 850 hPa vorticity within a 200 km radius around the center must exceed 10−5 s−1 (10−4 s−1 to be considered a strong center).
-
Wind at 10 m. The maximum wind speed at 10 m within a 100 km radius around the center must exceed 8 m s−1 (17.5 m s−1 to be considered a strong center).
In this study, the criterion based on temperature anomalies was not used to reject centers, thus allowing for the detection of warm-core storms, such as transitioning tropical storms. However, the algorithm still applies a strict criterion for identifying strong centers. Specifically, this criterion requires that the sum of the temperature anomalies at 250, 500, and 700 hPa, defined as the difference between the maximum temperature and the mean temperature within a 200 km radius around the center, must exceed 2 °C.
2.2.2 Storm tracking
The purpose of this step is to assign each identified center to an existing storm or, if no existing storm can be linked to the detected center, to regard it as the origin of a new storm. Initially, centers that are more than 250 km apart are treated separately. If two centers are within this distance, only the center with the strongest vorticity is retained. Storms are tracked using the nearest-neighbour method, a technique also employed in various studies (Blender et al., 1997; Blender and Schubert, 2000; Schubert et al., 1998). For each existing storm, the algorithm predicts the potential location of the next center based on the historical trajectory of the previous two centers. A new center is then assigned to the storm whose predicted location is closest, with preference given to the nearest center.
2.2.3 Storm lifetime
For each determined track, the following final conditions must be met:
-
The lifetime of the storm must exceed 36 h.
-
The storm must have at least 12 strong centers.
-
The minimum travel distance must be at least 10° of combined latitude and longitude.
-
The number of strong centers must account for at least 77 % of the core trajectory, which is defined as the path between the first and the last strong center.
2.3 Detection of extratropical transitions (ETs)
The removal of the warm-core loose criterion enables the algorithm to detect both warm-core and cold-core centers. Simultaneously, the use of the warm-core strict criterion ensures that only storms that have experienced a tropical cyclone phase are detected.
ET events are identified using the cyclone phase space (CPS) methodology developed by Hart (2003) and have been widely employed in previous studies focusing on ETs (Baker et al., 2022; Hart et al., 2006; Jung and Lackmann, 2019, 2021, 2023; Liu et al., 2017). This methodology involves three parameters: the lower-tropospheric thermal axisymmetry of the cyclone (B), the lower-tropospheric () thermal wind, and the upper-tropospheric () thermal wind. These three parameters describe and differentiate the structure of tropical cyclones, characterized by a warm-core and vertically stacked structure, from that of extratropical cyclones, characterized by a cold-core and tilted structure.
The use of high-resolution data ensures reliable CPS diagnostics (Hart, 2003).
2.3.1 Cyclone thermal symmetry (B)
This parameter allows for identifying the frontal nature of the cyclone or the absence thereof. It is defined as the storm-motion-relative 900–600 hPa thickness asymmetry within a 500 km radius (Hart, 2003). For the Northern Hemisphere, B is defined as
where Z represents the geopotential height, R and L indicate the right and left sides of storm motions, and the overbar denotes the mean area over a semicircle with a radius of 500 km.
Very low values of B are associated with non-frontal storms such as TCs, while high values of B are associated with frontal storms such as extratropical cyclones. Hart (2003) suggests that a threshold of 10 m is appropriate for distinguishing non-frontal storms from frontal storms. This threshold has been widely utilized in other studies focusing on ET (Baker et al., 2022; Hart et al., 2006; Jung and Lackmann, 2019, 2021, 2023; Liu et al., 2017). However, Zarzycki et al. (2017) indicate that a threshold of 15 m is more appropriate when using high resolution.
To calculate the average speed of the 900–600 hPa layer, we considered four sub-layers: 900–850, 850–800, 800–700, and 700–600 hPa. The mean zonal and meridional speeds for each layer were computed as follows:
where D represents the 500 km radius circle around the center.
Then, the total mean zonal and meridional speeds are defined as the weighted average of the mean speeds calculated for each sub-layer:
where ωi represents the weight of the layer i. The weight of each layer is calculated as the ratio of the difference between the upper-bound pressure and the lower-bound pressure of the layer to the difference between the upper-bound pressure and the lower-bound pressure of the entire column.
The left layer comprises the points that satisfy the following criteria:
and the thickness of the layer is thus defined as
where NL is the number of points within the layer.
The same methodology is also applied to the right layer, which is defined as
2.3.2 Lower and upper thermal winds
Tropical cyclones are characterized by a decrease in height perturbation with increasing altitude. In contrast, for extratropical cyclones, the height perturbation decreases with height.
In this study, the height perturbation ΔZ is calculated as the difference between the maximum geopotential height and the minimum geopotential height within a 500 km radius circle (ΔZ = ) and is proportional to the magnitude of the geostrophic wind (Vg) (Hart, 2003):
where d represents the distance between the two geopotential extrema, f is the Coriolis parameter, and g is the gravity constant.
Scaled thermal winds can be defined as (Hart, 2003)
and
The lower troposphere corresponds to the 900–600 hPa layer, while the upper troposphere corresponds to the 600–300 hPa layer.
A positive value of (i.e. > 0) indicates a warm-core structure in the lower (i.e. upper) troposphere, while a negative value of (i.e. < 0) indicates a cold-core structure in the lower (i.e. upper) troposphere. During ET, the signs of and may differ.
As recommended by Hart (2003), we conducted a linear regression on the vertical profile of ΔZ to estimate the thermal wind parameters. The levels used for these regressions are 900, 850, 800, 700, 600, 500, 400, and 300 hPa.
2.3.3 Detection of ET events
To mitigate the variability in parameters caused by numerical noise, a 12 h smoothing window is applied, following the recommendations of Michaelis and Lackmann (2019), who employed a 24 h smoothing window. Additionally, a filtering algorithm was employed to exclude highly chaotic trajectories characterized by multiple transitions. The core principles of this algorithm are the following:
-
ET events occurring below 20° are excluded as ET events rarely occur below this threshold (Hart and Evans, 2001).
-
When multiple transitions occur, only the final transition is considered, provided that no reverse transition follows.
For this study, the onset of ET is detected when (Liu et al., 2017; Michaelis and Lackmann, 2019)
-
> 15 m or < 0.
Therefore, all TCs that have started an ET are included in our study, including instantly warm seclusions (Sarro and Evans, 2022), as well as transitioning storms that have not completed their transition within the regional domain. Additionally, the completion of ET is detected when both criteria are simultaneously met.
In other studies (Hart, 2003; Hart et al., 2006; Jung and Lackmann, 2021), the onset of ET was detected when B exceeded the threshold. However, Liu et al. (2017) argued that this methodology might be inadequate for capturing TCs that transition to cold-core systems before developing an asymmetric structure. Furthermore, this methodology may also lead to negative ET durations, as highlighted in Kitabatake (2011).
2.4 The Eady growth rate: an indicator of baroclinicity
The Eady growth rate (EGR) is a widely used indicator of the baroclinicity of the environment (Eady, 1949). ETs are more likely to occur in zones associated with high values of EGRs. It is defined as follows (Lindzen and Farrell, 1980):
where f is the Coriolis parameter, is the vertical wind shear, and N is the Brunt–Väisälä frequency:
where θ is the virtual potential temperature, and g is the gravity constant.
In this study, we mainly focused on mid-troposphere baroclinicity and, therefore, computed the EGR at 500 hPa with a forward difference scheme using geopotential heights, humidity, meridional and zonal wind speeds, and temperatures at 400 and 500 hPa.
To assess the baroclinicity in the upper troposphere, we computed the EGR at 200 hPa with a backward difference scheme using the 300 and 200 hPa values. A forward scheme in this case would have required using the 100 hPa values, introducing stratospheric influences, which we aimed to avoid.
2.5 Integrated kinetic energy: an indicator of storm intensity
The concept of integrated kinetic energy (IKE) was first introduced by Powell and Reinhold (2007), who demonstrated that this indicator might better assess a hurricane's destructive potential than the maximum sustained surface wind speed, as it accounts for storm size.
IKE is the integration of the 10 m kinetic energy per unit volume over a domain volume (V) centered around the storm's center. IKE is given by
where ρ is the air density, and U is the 10 m wind velocity.
Assuming an air density value of 1 kg m−3 and a volume height of 1 m, the expression can be simplified as follows (Cheung and Chu, 2023):
In this study, the area considered is a circle with a 500 km radius, centered around the TC center.
2.6 Minimal theoretical pressure of a TC
The minimal theoretical pressure allows us to estimate the minimum pressure a TC center can reach, based on the SST and the atmospheric profile (Bister and Emanuel, 2002). This critical pressure pc is given by the following equation:
where pa is the environmental pressure, Ts is the SST, T0 is the outflow layer temperature, Ck and CD are the enthalpy and momentum surface exchange coefficients, and Rd is the ideal gas constant for dry air. is the convective available potential energy of a saturated air parcel, and is the environmental convective available potential energy.
The minimum theoretical pressure was calculated with the pyPI package from Python (Gilford, 2021).
2.7 Statistical analysis
For the statistical assessment of the differences, the Mann–Whitney–Wilcoxon test was used to compare the distributions. This test is recommended when the normality assumption cannot be made.
A significance level of 10 % was considered.
2.8 Validation
The annual ET ratio, defined as the ratio of the yearly number of ET events to the yearly number of tropical cyclones, was computed for the 1990–2019 period of the present-day experiment. This frequency was then compared with observational data from the International Best Track Archive for Climate Stewardship (IBTrACS; Knapp et al., 2010) and with the ECMWF reanalysis data (ERA5; Hersbach et al., 2020), to which the tracking algorithm was applied within the same spatial domain as the present-day experiment.
The results demonstrate the current experiment's strong ability to reproduce the mean annual ET ratio despite exhibiting a lower distribution variability than ERA5 and IBTrACS (Fig. 1).
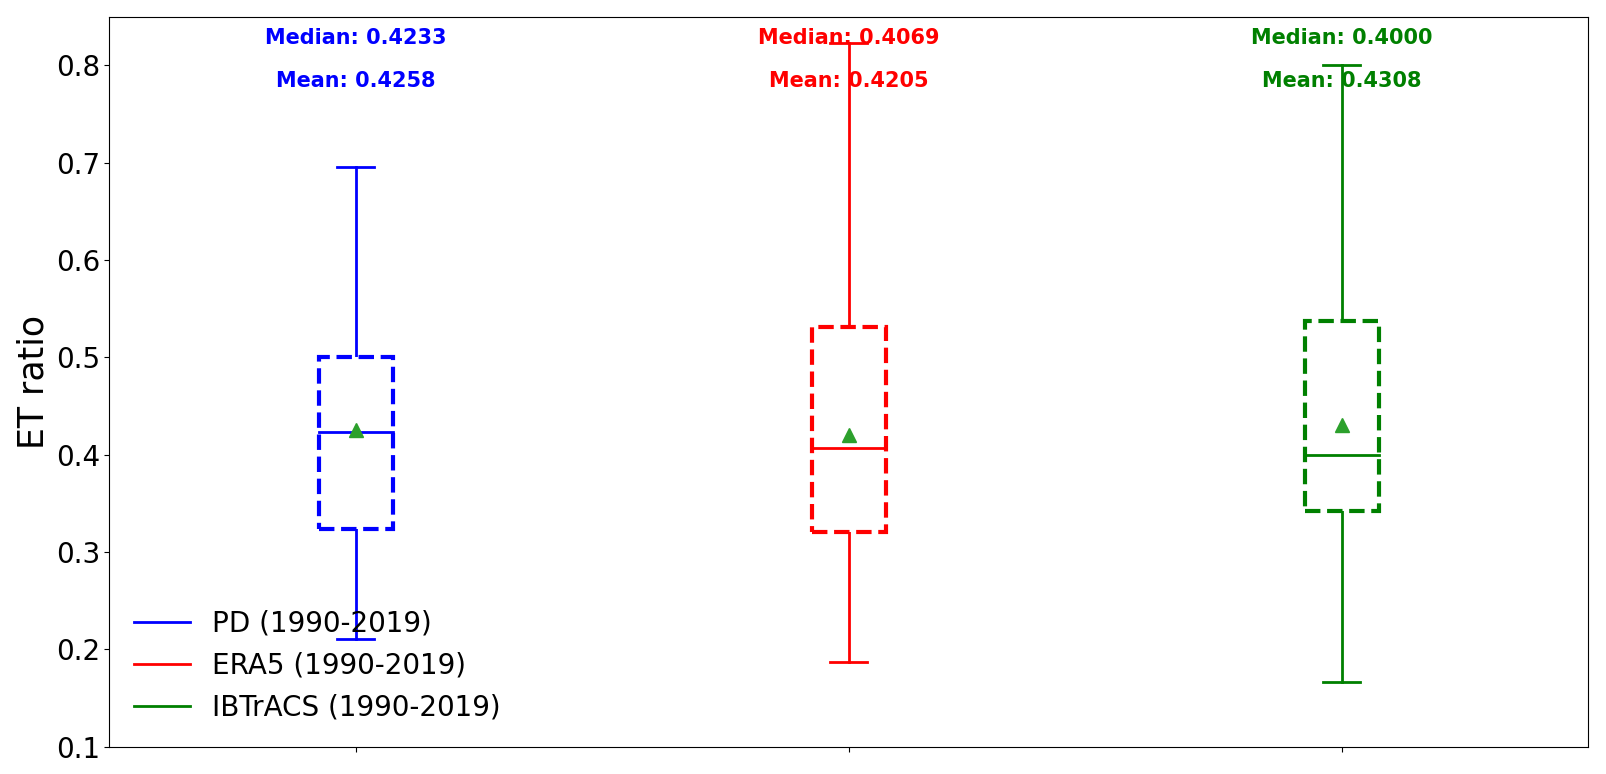
Figure 1Box plot of the ET ratio for the present-day simulation (blue), ERA5 (red), and IBTrACS (green). The box represents the interquartile range (IQR) containing 50 % of the data; the upper edge of the box represents the 75th percentile (upper quartile – UQ), while the lower edge is the 25th percentile (lower quartile – LQ). The horizontal line within the box indicates the median, while the green triangle indicates the mean. The whiskers extend to the smallest and largest data points within 1.5 times the IQR from the quartiles. Points beyond the whiskers are considered outliers.
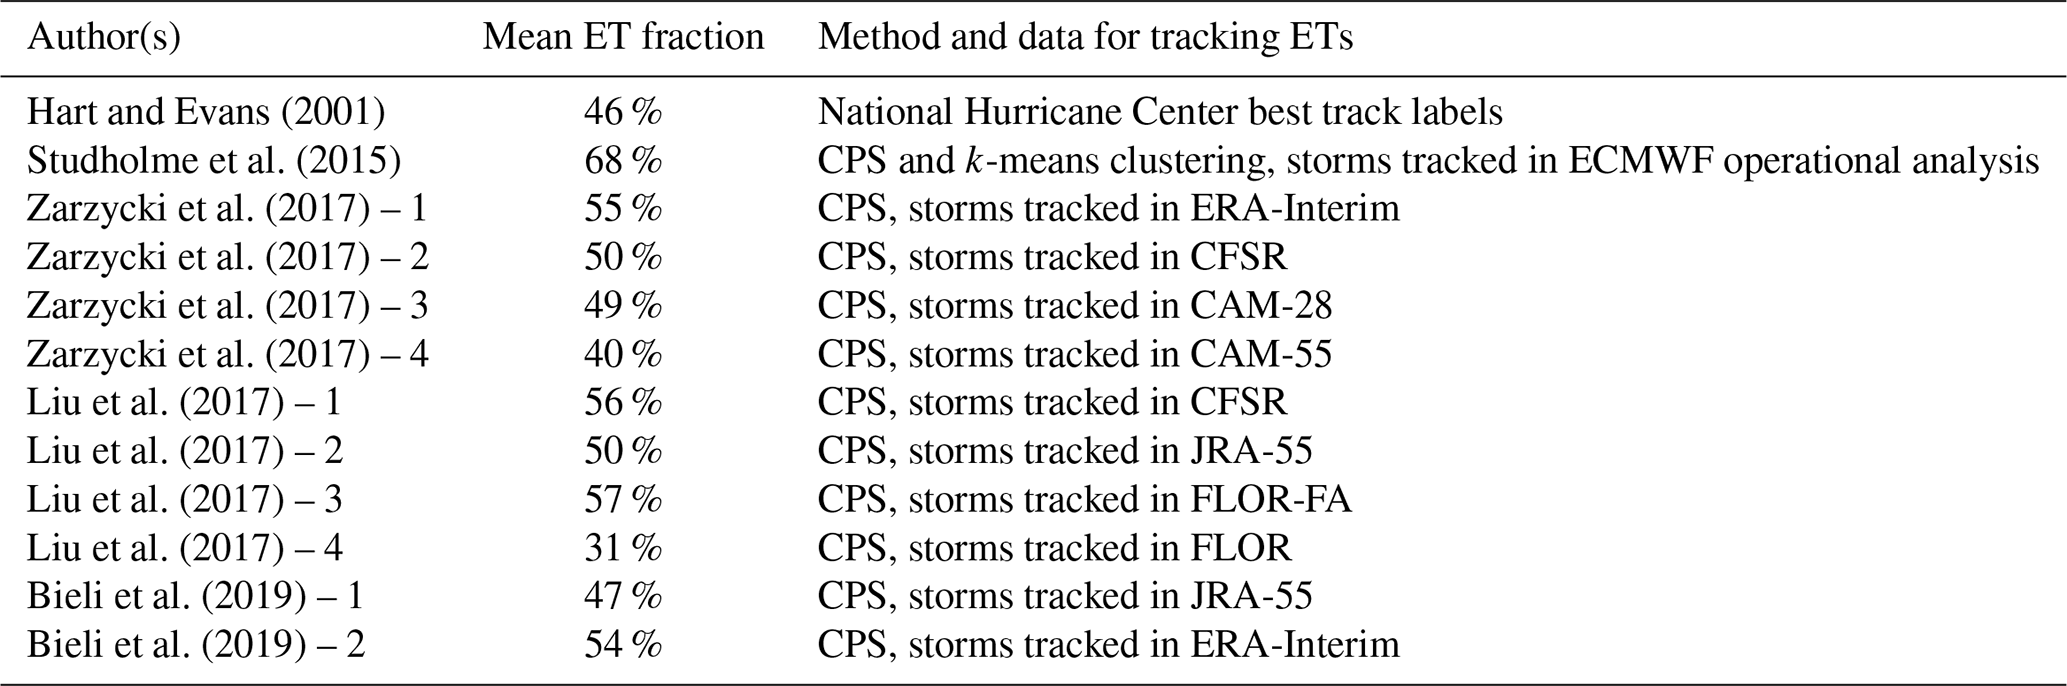
Several studies have explored the topic of ET ratio simulation in different basins over the past few years using the CPS methodology with different models, resolutions, or reanalyses.
Bieli et al. (2019) used JRA-55 and ERA-Interim, whereas Zarzycki et al. (2017) used two reanalysis products, ERA-Interim and CFSR, combined with two climate models, CAM-55 and CAM-28. This latter study highlights the importance of the resolution used, with a 9 % increase in the mean annual ET ratio with a higher resolution. Liu et al. (2017) used two reanalysis products, CFSR and JRA-55, combined with two climate models, FLOR and FLOR-FA, for which the SSTs are artificially corrected through flux adjustment. This correction leads to a better representation of the ET ratio. Studholme et al. (2015) found a very high mean annual ET ratio (68 %), with this finding being explained by the simulation of longer tracks, enabling the ET to occur.
Table 1 lists the mean annual ET ratios from previous studies. In our study, the ET ratio found in the present-day simulation is 42.7 %, placing it at the lower end of the range. However, this value accounts for the adjustments made to the CPS method, as detailed in Sect. 2.3. Indeed, we noticed that for certain tracks, some storms could begin to acquire extratropical characteristics (asymmetry or a cold core) before reverting to tropical cyclones. These “false” transitions were therefore excluded from the transitions. It is important to point out that if another transition occurs, the storm will be considered among the transitioning storms. Before correcting this, the transition rate was at 68.5 % (close to the findings of Studholme et al., 2015).
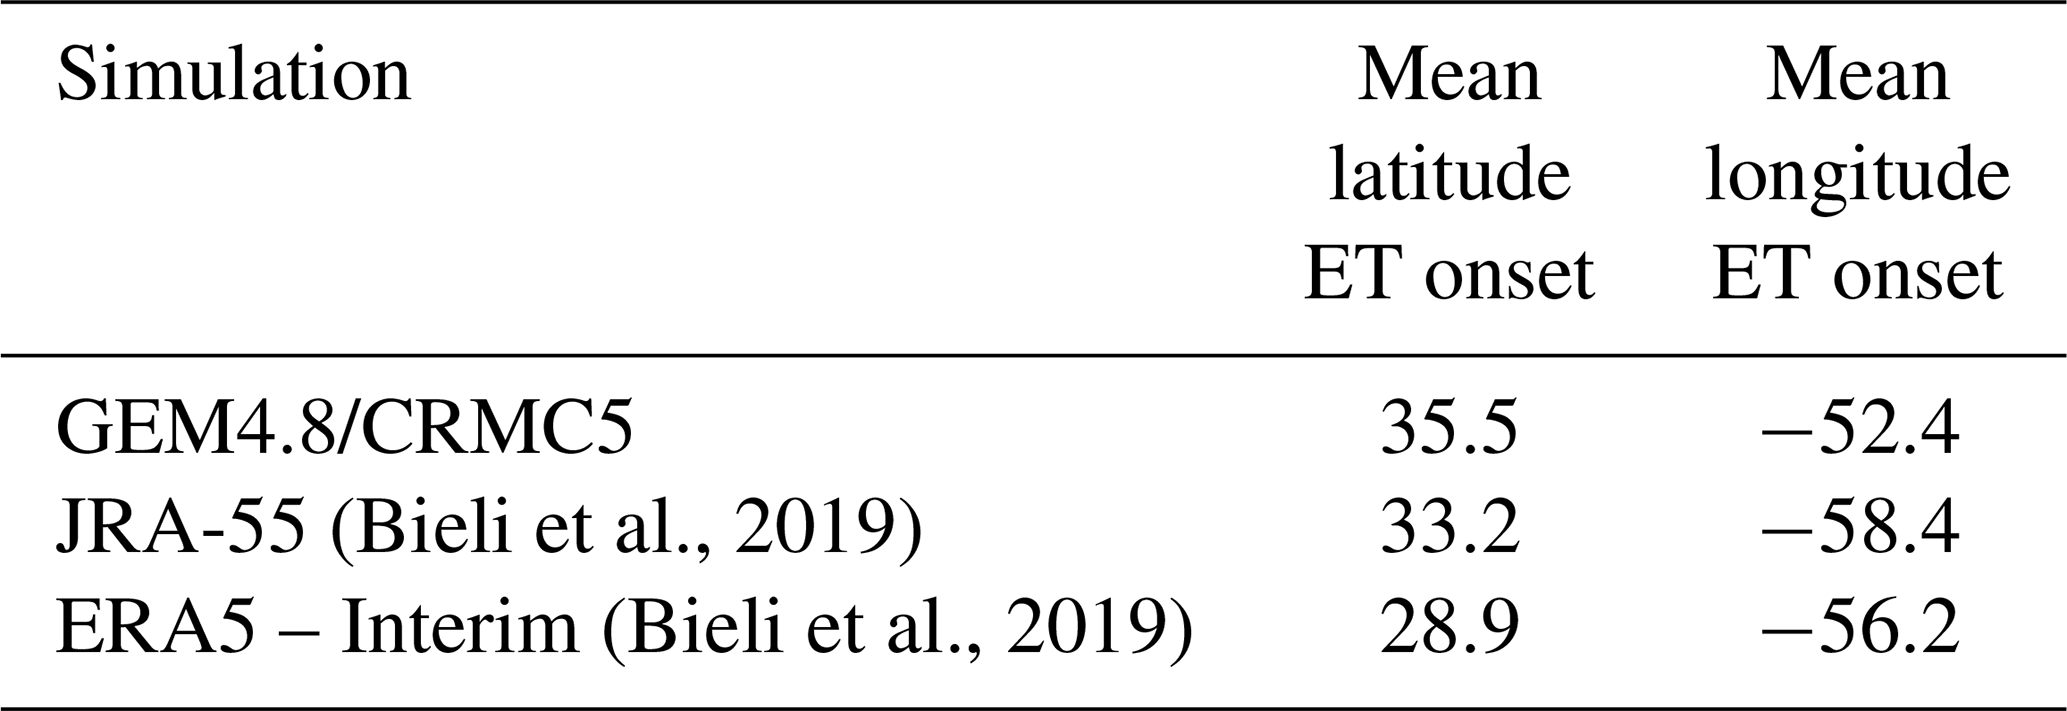
ET in IBTrACS is determined subjectively by various forecasters based on real-time observational data. In addition, IBTrACS phase transition occurs at an instantaneous point in space and time and provides no information about the path of ET (Zarzycki et al., 2017). To assess the ability of the model to spatially reproduce ET, we compare the latitude and the longitude of ET onset with the results of Bieli et al. (2019) in Table 2. The comparison shows a northward shift in our simulated ET onset latitude compared to Bieli et al. (2019). This difference may be explained by our methodology, which, in the case of multiple transitions, considers only the final transition.
3.1 Tropical cyclones in present-day simulations and future climate simulations
The annual average number of TCs, including tropical storms, is significantly lower (−3.7) in the future climate simulation (14.3) than in the present-day simulation (18). The season's peak remains in September for the future climate simulation (Fig. 2). These results are consistent with those of other studies indicating an overall decrease in TC frequency (Bender et al., 2010; Knutson et al., 2020; Mallard et al., 2013).
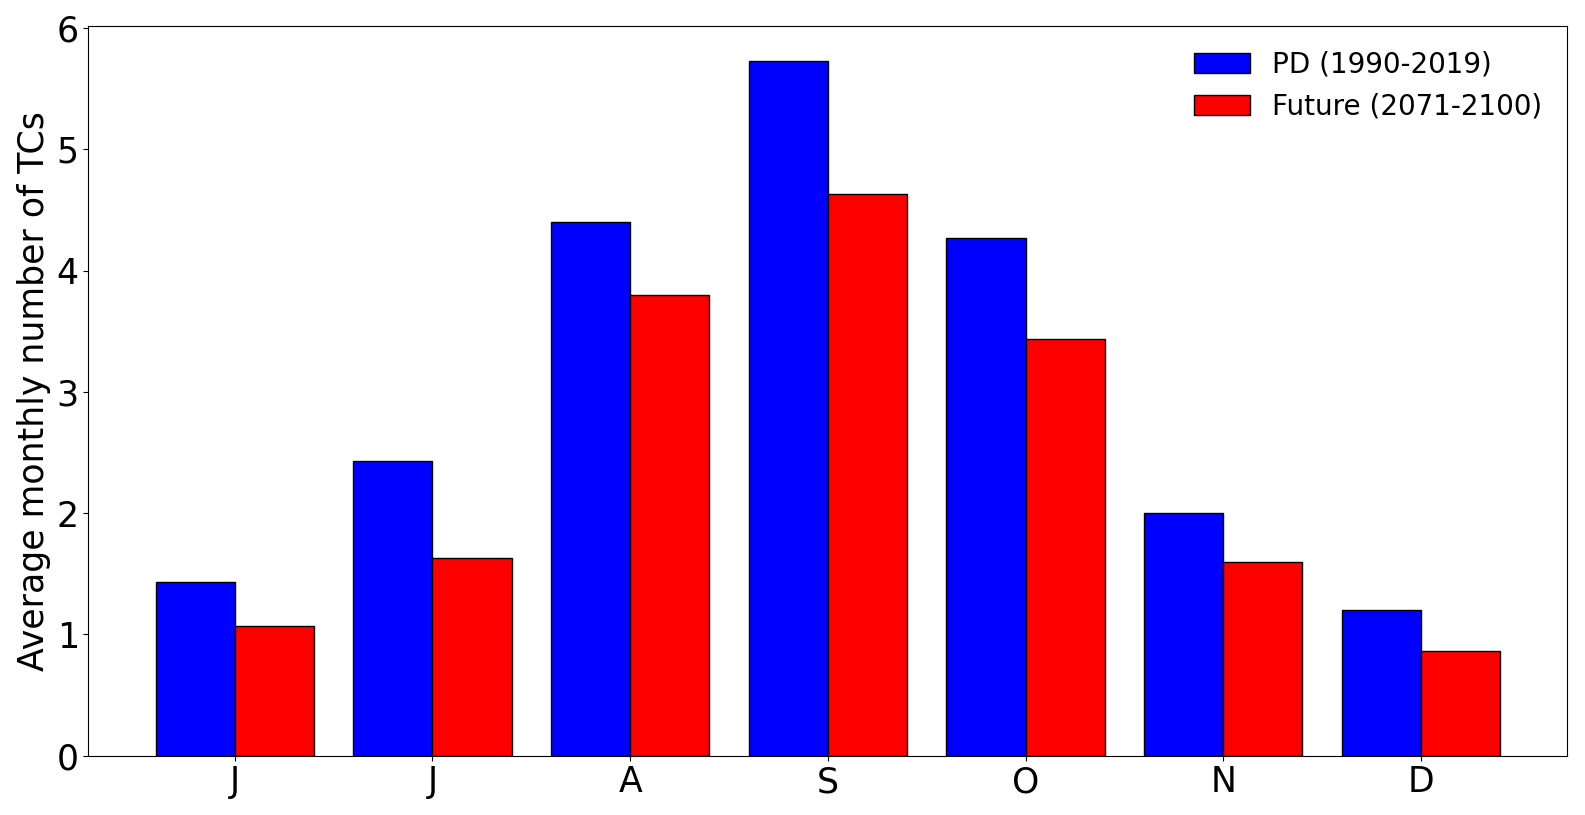
Figure 2Average number of monthly TCs for the present-day (blue) and the future climate simulations (red) from June to December.
For each tracked TC, the maximum intensity – defined here as the minimum pressure reached by the cyclone along its trajectory – was determined. Therefore, the latitude of the minimum pressure is not inherently dependent on ET: it can occur either before or after transition.
Consistent with previous studies (Hill and Lackmann, 2011; Knutson et al., 2020; Kossin et al., 2020), we found that there are more extreme events in the future climate simulation than in the present-day simulation (Fig. 3) and that the mean storm minimum pressure is deeper in the future climate simulation (−3 hPa).
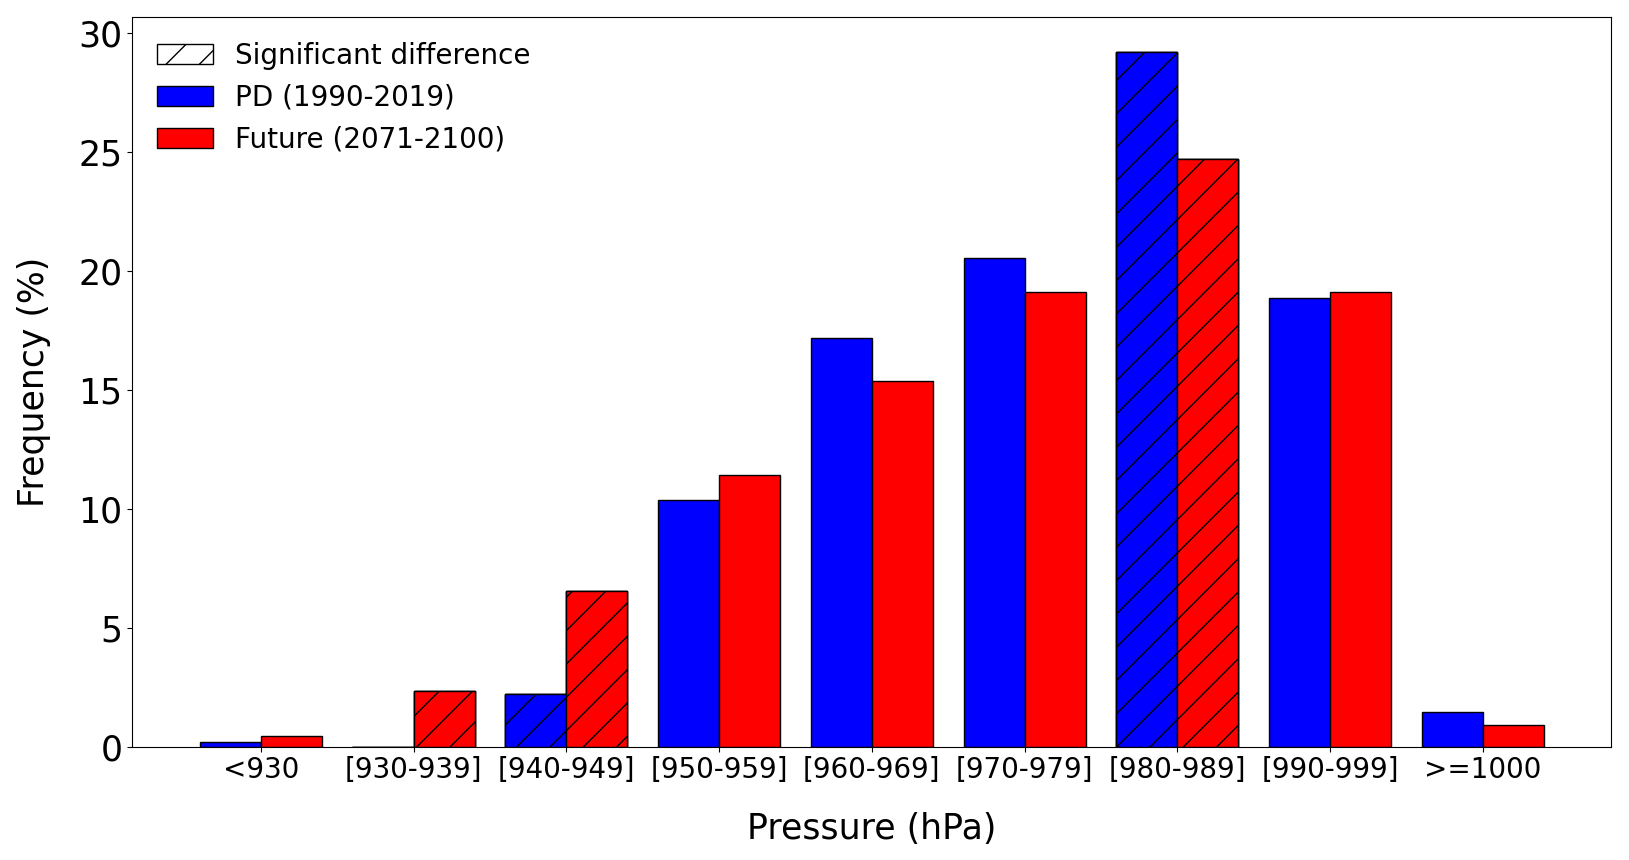
Figure 3Distribution of the maximum intensity for the present-day (blue) and the future climate simulations (red). The maximum intensity is defined as the minimum pressure reached at the TC center during its lifetime. The hatched bars correspond to the intensity ranges with a significant difference.
Consistent with other studies (Lee et al., 2020; Studholme et al., 2022), the median TC maximum intensity is slightly shifted northward of about 1.2° latitude (Fig. 4a) in a warmer climate because of higher SSTs that help TCs sustain their intensity at higher latitudes.
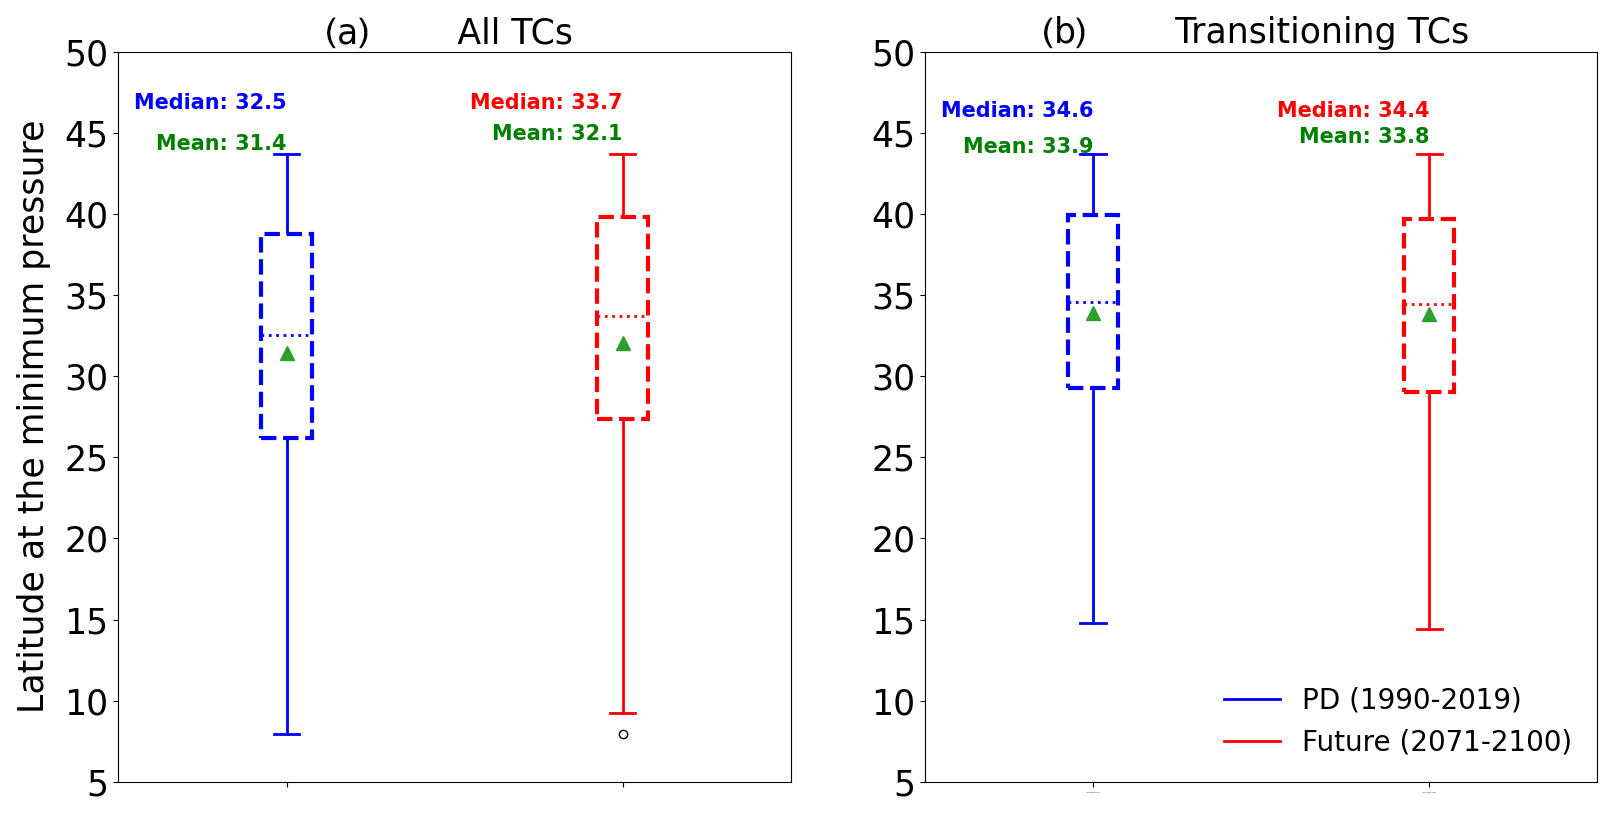
Figure 4Box plot of the latitude of the minimum pressure for the present-day (blue) and the future climate (red) simulations (a) for all TCs and (b) for transitioning TCs. The box represents the interquartile range (IQR) containing 50 % of the data; the upper edge of the box represents the 75th percentile (upper quartile – UQ), while the lower edge is the 25th percentile (lower quartile – LQ). The horizontal line within the box indicates the median, while the green triangle indicates the mean. The whiskers extend to the smallest and largest data points within 1.5 times the IQR from the quartiles. Points beyond the whiskers are considered outliers.
3.2 Change in atmospheric baroclinicity
As expected, the Eady growth rate in the future climate simulation is weaker than in the present-day simulation (Fig. 5a). This can be attributed to Arctic polar amplification, which reduces the thermal gradient between the high and tropical latitudes, resulting in a weaker baroclinic zone (Barnes and Polvani, 2015; Francis and Vavrus, 2012; Serreze et al., 2009). The difference is particularly pronounced at the mid-latitudes and on the western side of the North Atlantic Ocean, where most transitions usually occur.
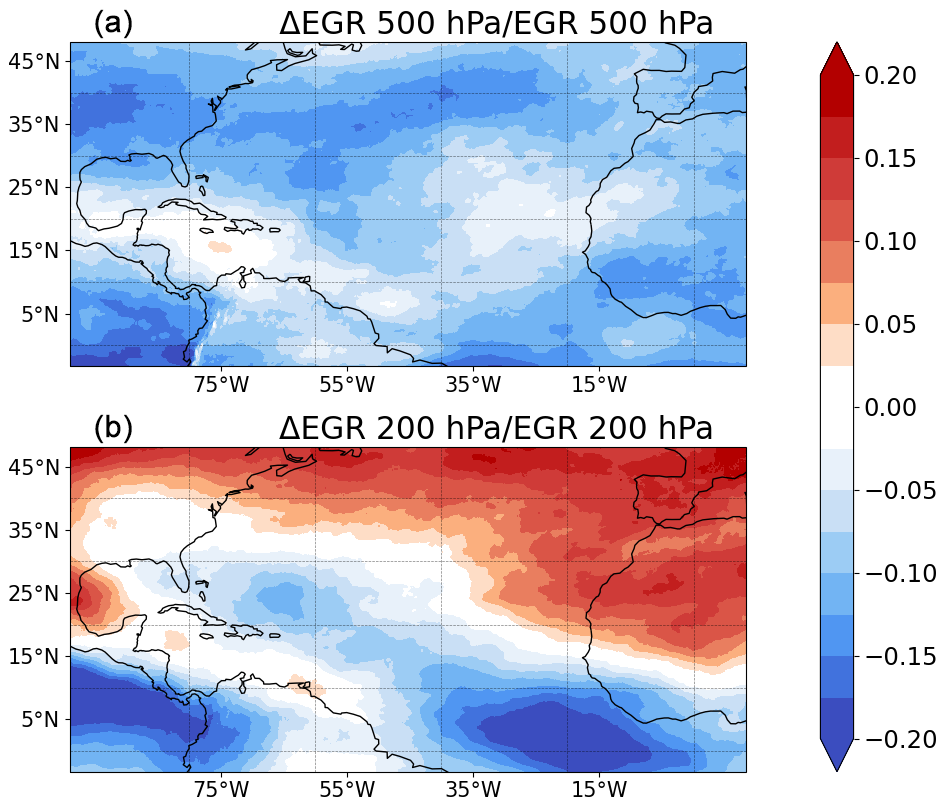
Figure 5(a) Relative difference in 500 hPa Eady growth rate between the future climate and the present-day simulations and (b) relative difference in 200 hPa Eady growth rate between the future climate and the present-day simulations.
Conversely, the upper-tropospheric Eady growth rate is slightly higher in the future climate simulation than in the present-day simulation (Fig. 5b). This is consistent with the tropical upper-troposphere warming effect, which increases the upper-tropospheric thermal gradient (Barnes and Polvani, 2015; Harvey et al., 2014; Lorenz and DeWeaver, 2007).
3.3 ET events and ET ratios
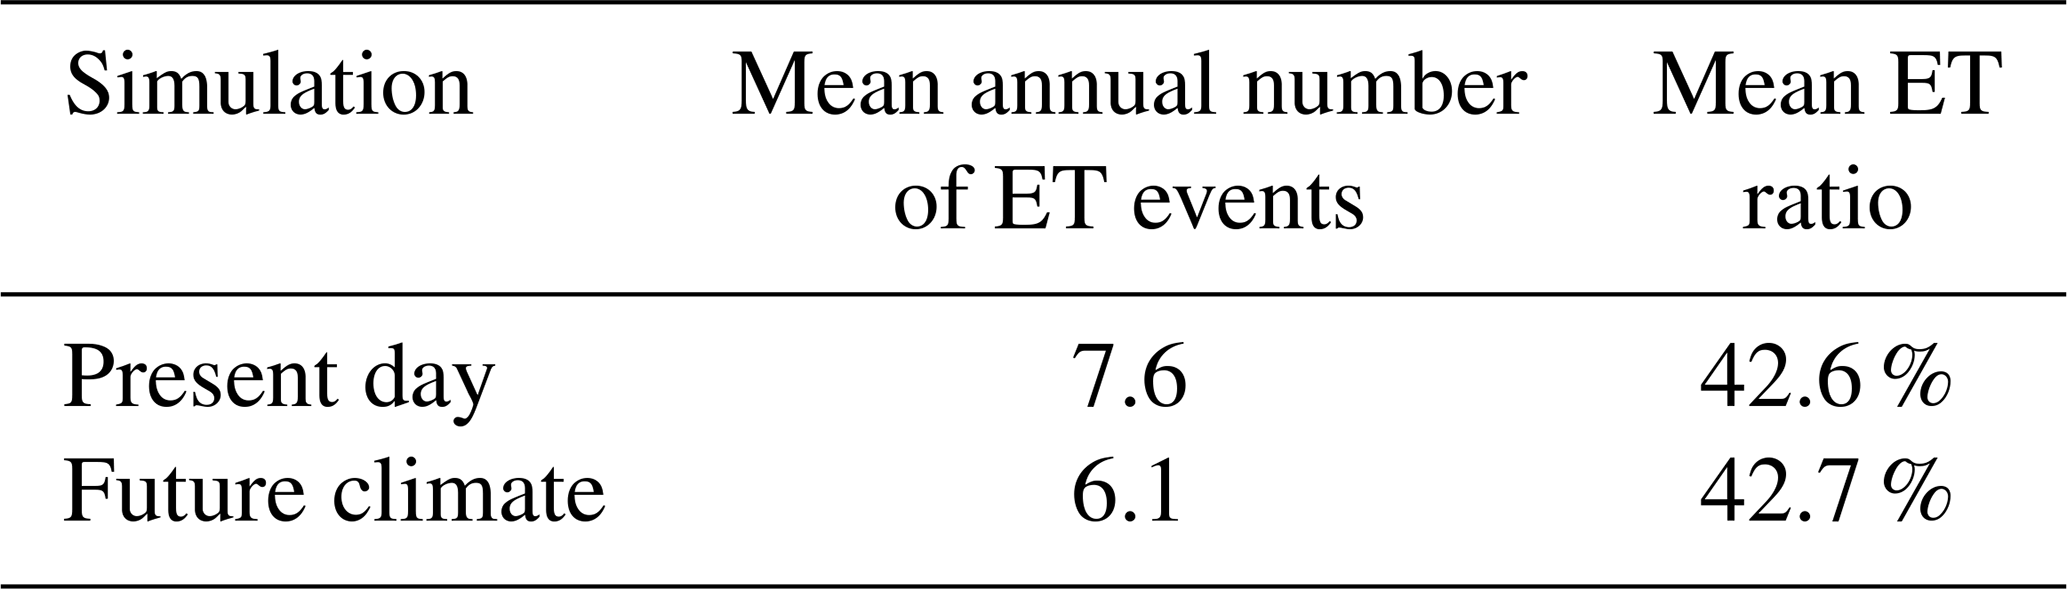
The mean annual number of ET events simulated in the future climate simulation (6.1) is significantly lower than that in the present-day simulation (7.6) (Table 3). The ET ratio, defined as the ratio of the number of ET events to the number of TCs, is almost identical in the future climate simulation (42.7 %) to that in the present-day simulation (42.6 %) (Table 3). Our results are consistent with Bieli et al. (2020), which did not reveal any statistically significant change in the ET rate in the North Atlantic. However, our findings contrast with the studies by Liu et al. (2017), Michaelis and Lackmann (2019), and Baker et al. (2022), which reported a slight increase in ET frequency in the North Atlantic Basin.
Hart and Evans (2001) highlighted that ET events are more likely to occur if TCs maintain a minimum level of intensity when they encounter a relatively strong baroclinic zone, enabling them to release the available potential energy of the atmosphere. This minimum intensity level generally corresponds to a theoretical minimum pressure of 960 hPa (Bister and Emanuel, 1998; Hart and Evans, 2001). Our findings indicate that the northward shift of the baroclinic zone (Fig. 6a) is balanced by a corresponding northward shift in the 960 hPa theoretical minimum pressure (Fig. 6b), thereby maintaining the relative position of this minimum intensity level with respect to the favourable baroclinic regions. As a result, these factors may help to partially explain why the probabilities of ET do not show significant differences.
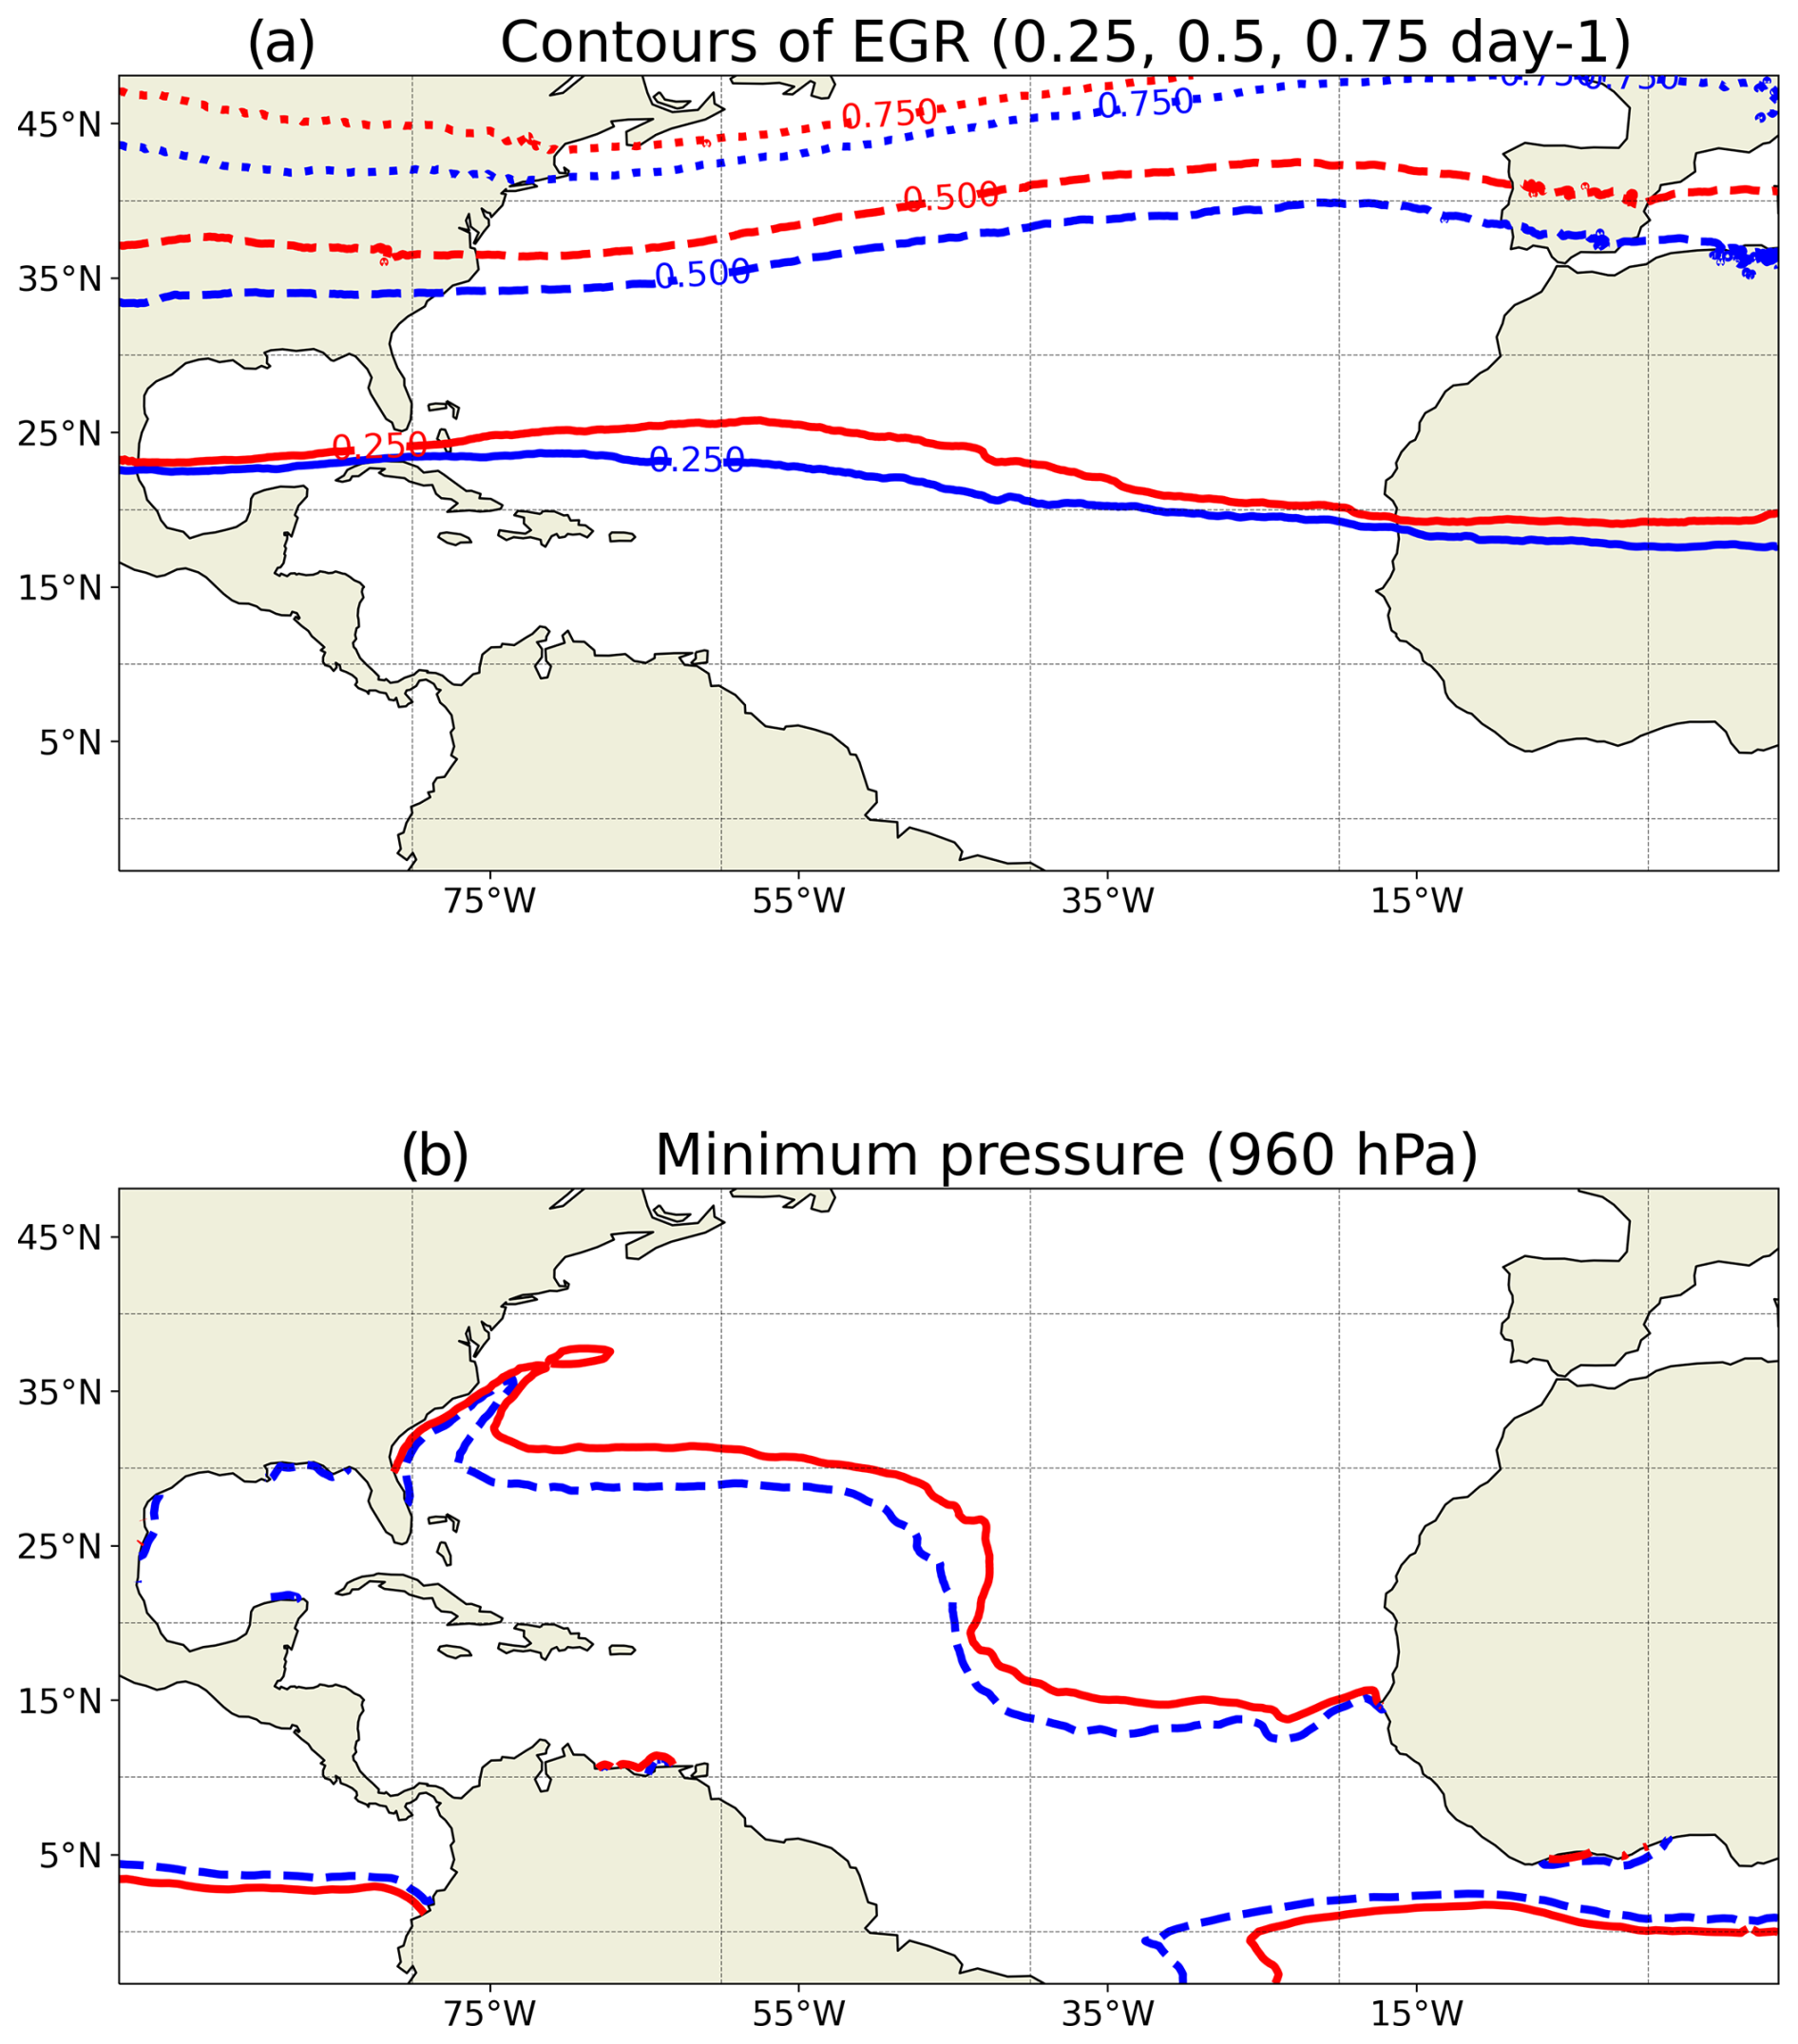
Figure 6(a) Contours of mean Eady growth rate for the present-day (blue) and the future climate (red) simulations. The solid lines represent the 0.25 d−1 level, the dashed lines represent the 0.5 d−1 level, and the dotted lines represent the 0.75 d−1 level. (b) Contours of the 960 hPa theoretical pressure for the present-day (dashed blue line) and the future climate (solid red line) simulations.
Table 3Mean annual ET numbers and mean annual ET ratio for present-day and future climate simulations.
3.4 ET seasonal cycle in future climate
To assess changes in the seasonality of ET events, the mean annual contribution of each month to the mean annual ET ratio was calculated. This indicator is calculated as follows: for each year, the ET ratio is the number of ET events divided by the total number of TCs and is then averaged over 30 years. This approach highlights the months when ET is most likely to occur, accounting for both the probability of TC occurrence and the conditional probability of ET.
In the present-day simulation, September and October are the most significant contributors to the annual ET ratio, as highlighted in Hart and Evans (2001). During these 2 months, the number of TCs and the baroclinic energy remain relatively high, providing favourable conditions for ET events. In the future climate simulation, September and October remain the months with the highest baroclinic energy levels. However, the ET season's peak appears to have shifted from September to October (Fig. 7). Indeed, in the future climate experiment, the simulated decrease in the October ET event mean number is less pronounced than the simulated decrease in the October mean number of TCs, suggesting a greater ET probability.
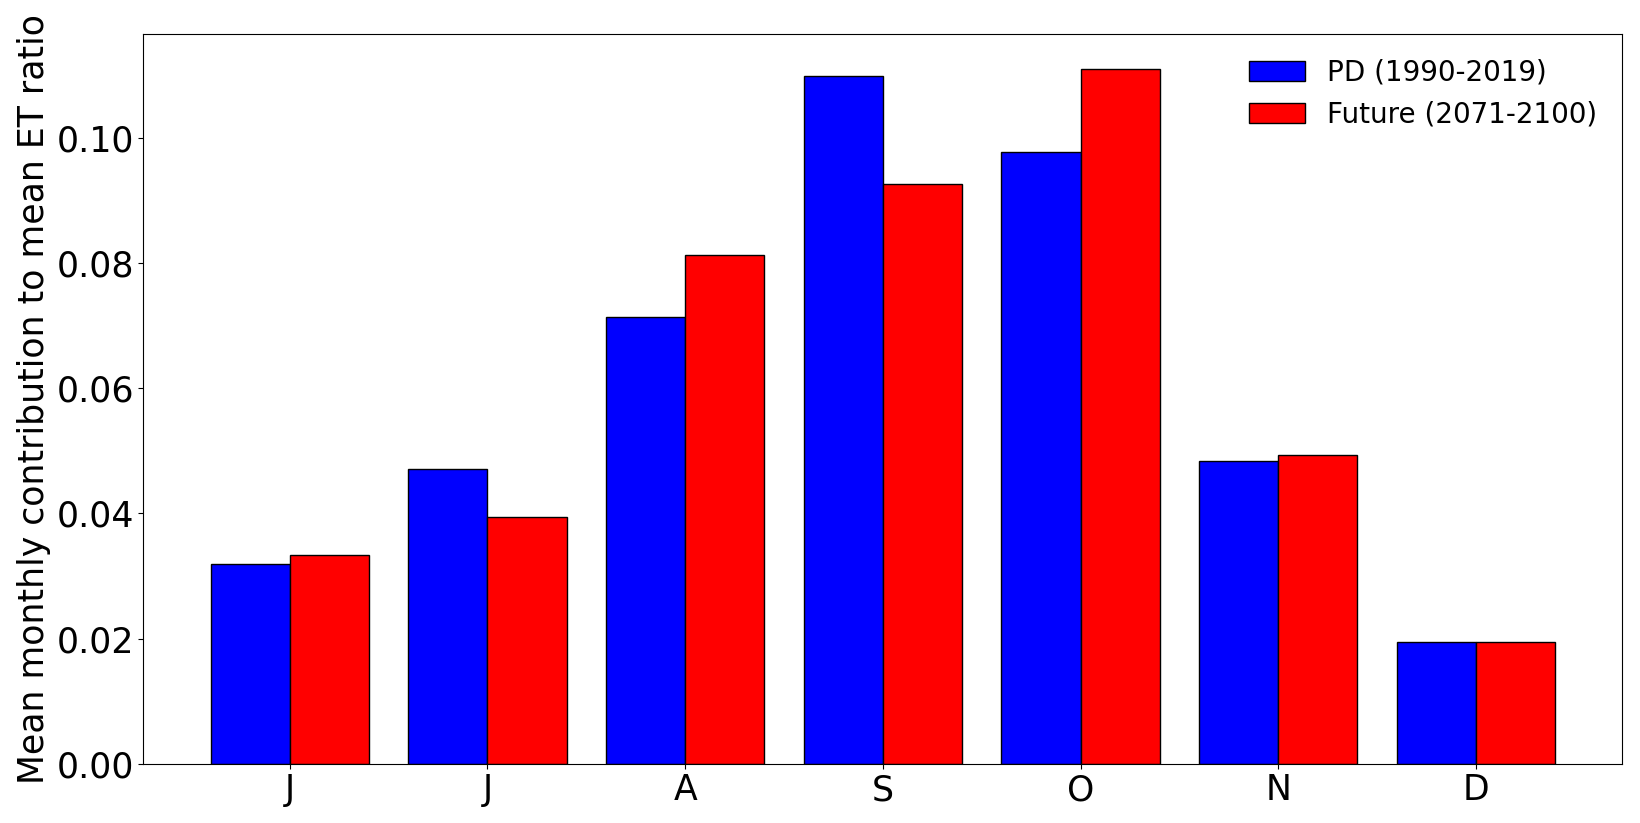
Figure 7Monthly contribution to mean annual ET ratio for the present-day (blue) and the future climate (red) simulations from June to December.
3.5 Location of ET onsets
In this section, we focus on the impacts of ET locations, particularly to assess the threats they may pose to the US and Canada coastal populations.
In both experiments, TCs that undergo ET reach their maximum intensity at higher latitudes compared to those that do not undergo ET (Fig. 4a and b). Indeed, TCs that are most likely to undergo ET need to sustain a minimum energy level at middle latitudes (Hart and Evans, 2001). However, no significant northward shift in the maximum intensity location for TCs undergoing ET is simulated (Fig. 4b). This finding partly explains why, despite the previously highlighted northward shift in the baroclinic zone in future climate simulations (Fig. 6a), transitions do not occur further north (Fig. 8a) in the future climate simulation. These observations indicate that the mean meridional displacement between the maximum intensity and the ET onset locations does not significantly change under climate change. Additionally, the results show no significant change in the mean longitude of ET onsets (Fig. 8b). Our results slightly contrast with those of Bieli et al. (2020), which show an equatorward migration of the ET onset latitude, with this shift being small in the North Atlantic Basin. The differences in the ET-tracking methodologies might explain this difference.
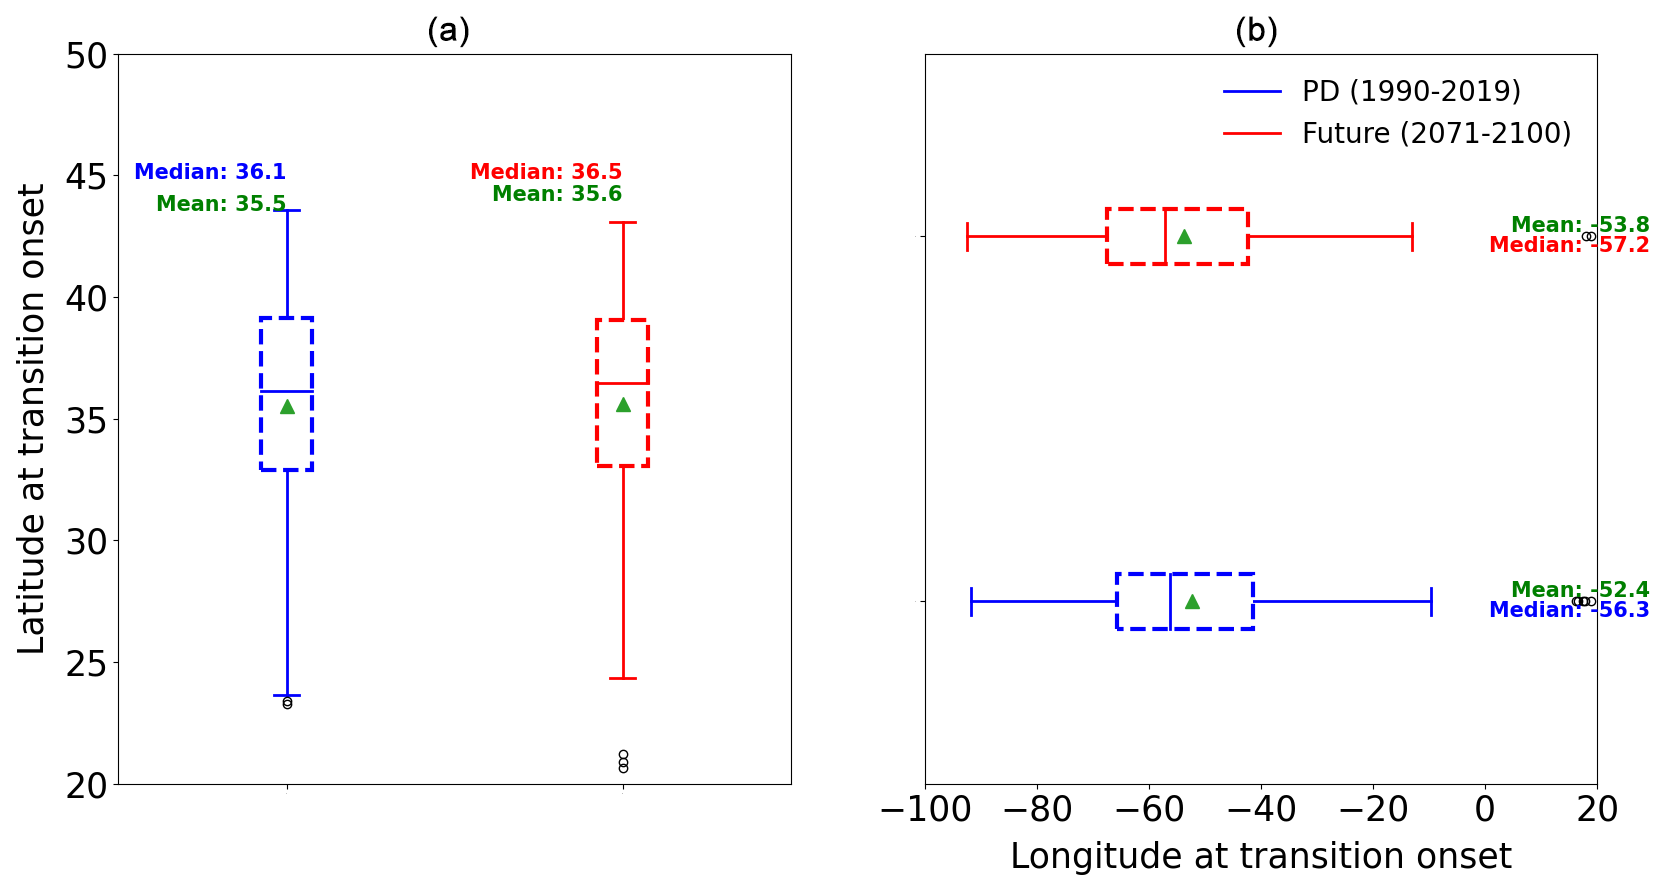
Figure 8Box plot of the (a) latitude of ET onset for the present-day (blue) and the future climate (red) simulations and (b) longitude of ET onset for the present-day (blue) and the future climate simulations (red). The box represents the interquartile range (IQR) containing 50 % of the data; the upper edge of the box represents the 75th percentile (upper quartile – UQ), while the lower edge is the 25th percentile (lower quartile – LQ). The horizontal line within the box indicates the median, while the green triangle indicates the mean. The whiskers extend to the smallest and largest data points within 1.5 times the IQR from the quartiles. Points beyond the whiskers are considered outliers.
The density map of ET onset, estimated with a Gaussian kernel, shows some differences (Fig. 9), with more ET onsets occurring near the US northeastern coast around 35 and 40° N. This region corresponds to the zone where a pronounced northward shift in the theoretical minimum pressure is simulated in the future climate simulation compared to the present-day experiment (Fig. 6b). This result does not agree with that of previous studies (Baker et al., 2022; Bieli et al., 2020; Liu et al., 2017; Michaelis and Lackmann, 2019), which reported more storms undergoing ET in the central and eastern North Atlantic, which leads to more storms with a tropical origin hitting western Europe (Baatsen et al., 2015; Haarsma et al., 2013).
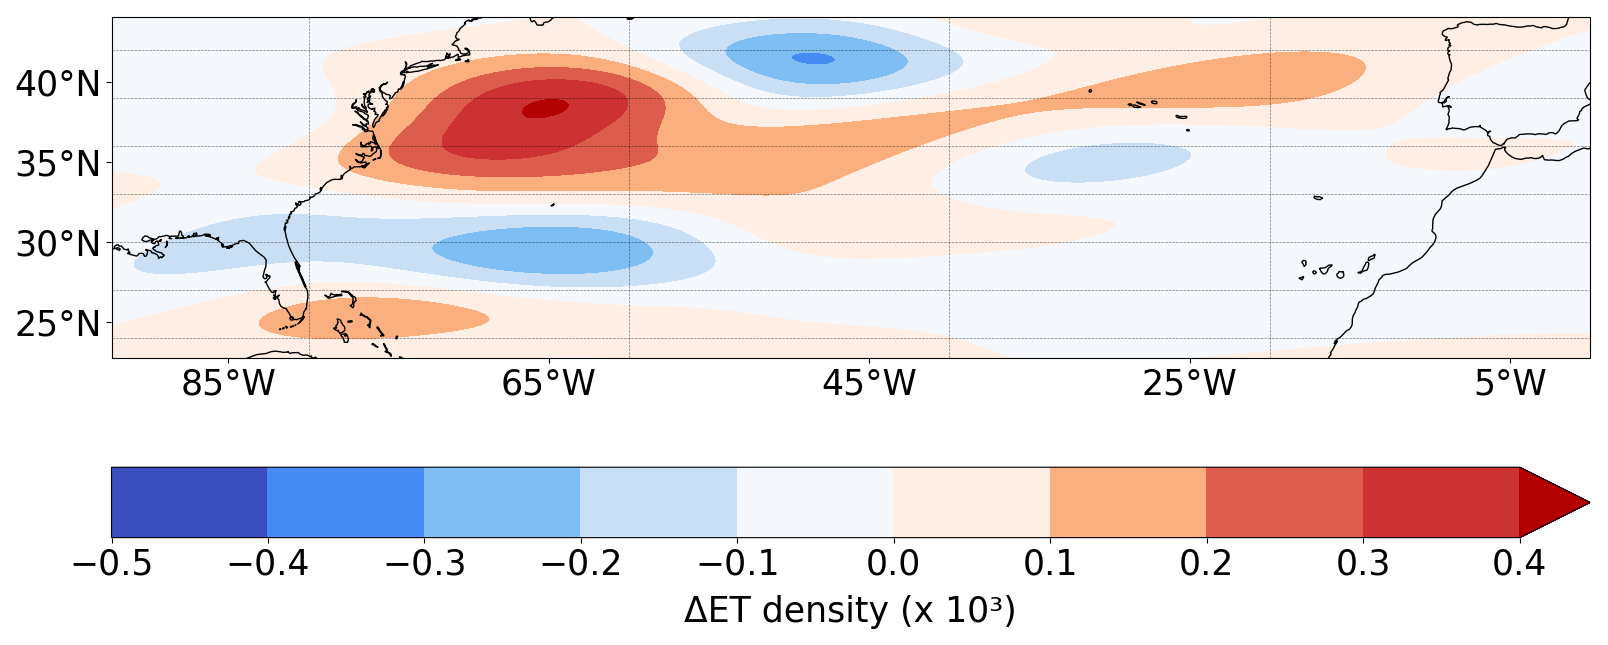
Figure 9Difference in onset ET density between the future climate and the present-day simulations.
The overall lack of change in the mean ET onset latitude in the future climate simulation might be explained by stronger tropical cyclones, which have a slightly deeper low pressure (982 hPa compared to 986 hPa today) at the time of ET onset, compensating for the weaker mid-tropospheric baroclinic zone that drives energy release. Additionally, the upper-tropospheric baroclinic zone becomes stronger, further offsetting the mid-tropospheric weakening. As a result, these factors balance out, preventing significant shifts in the average latitude of extratropical transition onset.
3.6 Duration of ET in future climate
Here we investigate a potential change in the duration of ET events as high SSTs have been associated with slowly transitioning storms, which are generally stronger than quickly transitioning storms (Hart et al., 2006). The ET duration is defined as the time difference between the ET onset and ET completion. For ET events that are not completed within the regional domain, the ET completion time is defined as the time when the storm reaches the upper boundary of the spatial area. The performance of the CPS methodology in calculating the ET duration was discussed by Kofron et al. (2010).
The analysis shows no significant change in the ET duration for the future climate simulation compared to the present-day experiment (Fig. 10a). This conclusion also holds for storms where the transition is completed within the regional domain (Fig. 10b). This result contrasts with the findings of Jung and Lackmann (2019), which revealed an extended ET period. However, this conclusion applies only to a specific storm, and the characteristics of its track may influence the results. Our findings are, nevertheless, consistent with the results of Michaelis and Lackmann (2021), who found no statistically significant difference in the ET duration time between present-day and future climate simulations.
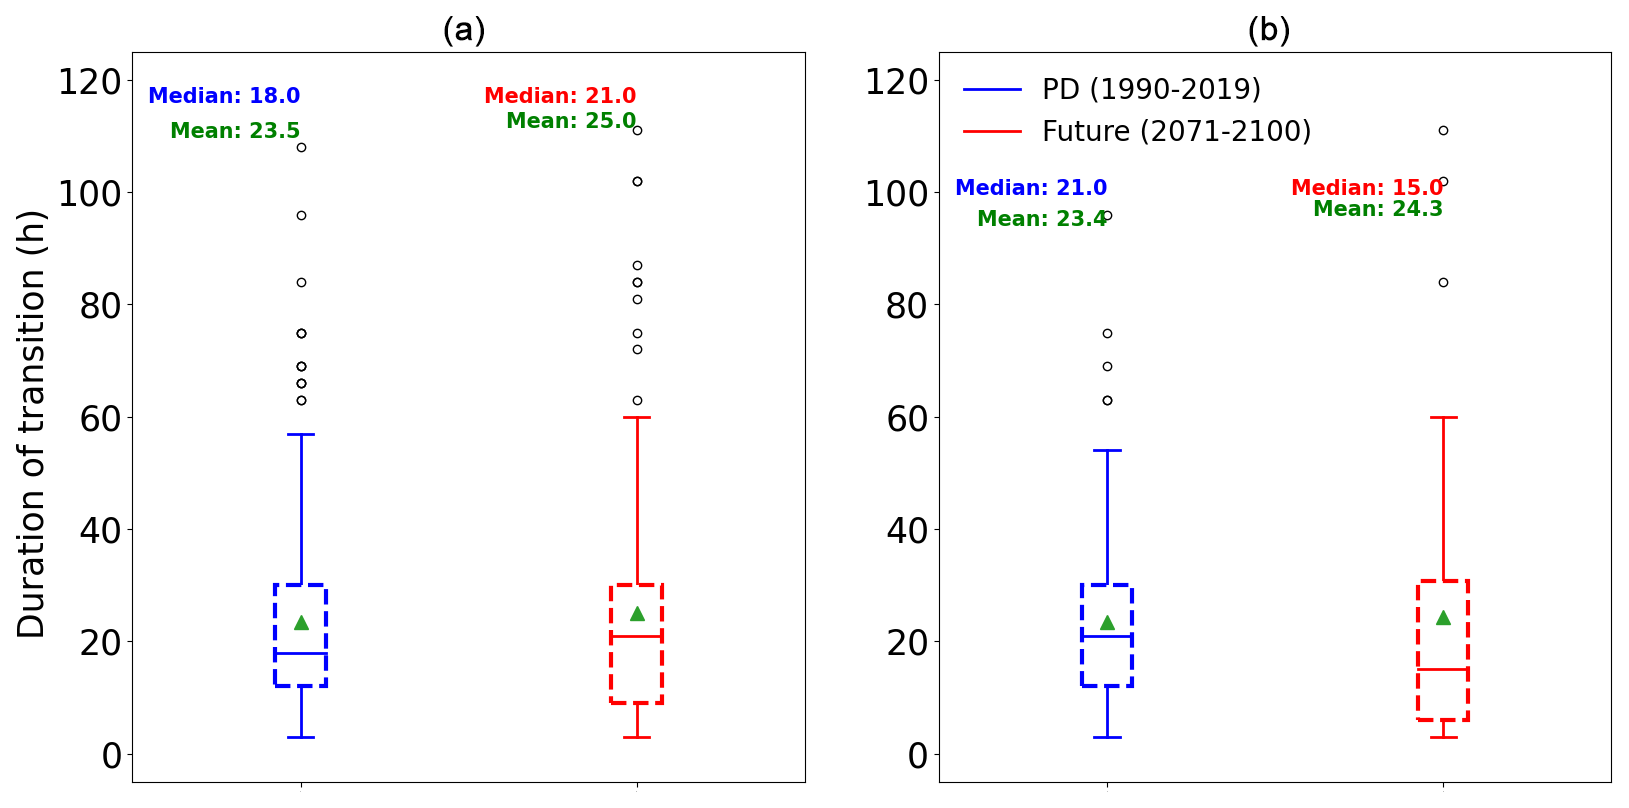
Figure 10Box plot of the transition duration (in hours) for the present-day experiment (blue) and the future climate simulation (red) for (a) all storms and (b) storms for which the transition is completed within the regional zone. The box represents the interquartile range (IQR) containing 50 % of the data; the upper edge of the box is the 75th percentile (upper quartile – UQ), while the lower edge is the 25th percentile (lower quartile – LQ). The horizontal line within the box indicates the median, while the green triangle indicates the mean. The whiskers extend to the smallest and largest data points within 1.5 times the IQR from the quartiles. Points beyond the whiskers are considered outliers.
3.7 Energetics of transitioning storms in future climate
This section explores the energetic changes in transitioning storms under future climate scenarios, focusing on how their destructive potential evolves and the factors contributing to these changes. The destructive potential of transitioning storms is notably higher (+20.5 %) in the future climate simulation relative to the present-day simulation. This increase is reflected in the cumulative IKE over the transition period, which is significantly higher in future climate simulations (Fig. 11). This increased destructive potential is partly attributed to a significantly higher latent heat flux (+17 %, Fig. 12a) in the future climate simulation during the transition, driven by higher SSTs. As expected, the Eady growth rate is significantly weaker in the future climate simulation (Fig. 12b), suggesting a reduction in baroclinic conversion.
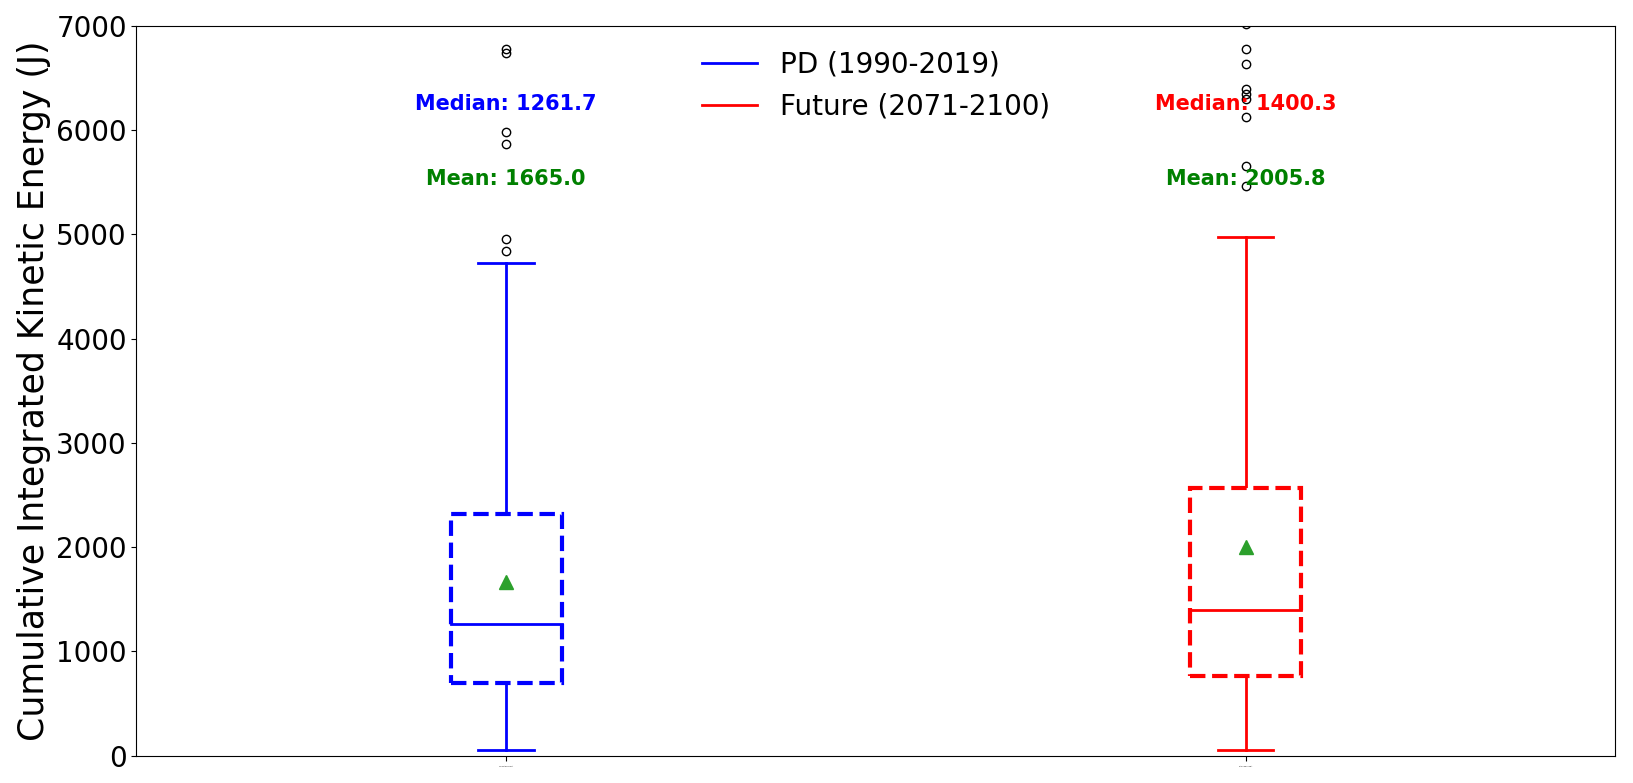
Figure 11Box plot of cumulative integrated kinetic energy (in joules) during the transition for the present-day experiment (left) and the future climate simulation (right). The box represents the interquartile range (IQR) containing 50 % of the data; the upper edge of the box represents the 75th percentile (upper quartile – UQ), while the lower edge is the 25th percentile (lower quartile – LQ). The horizontal line within the box indicates the median, while the green triangle indicates the mean. The whiskers extend to the smallest and largest data points within 1.5 times the IQR from the quartiles. Points beyond the whiskers are considered outliers.
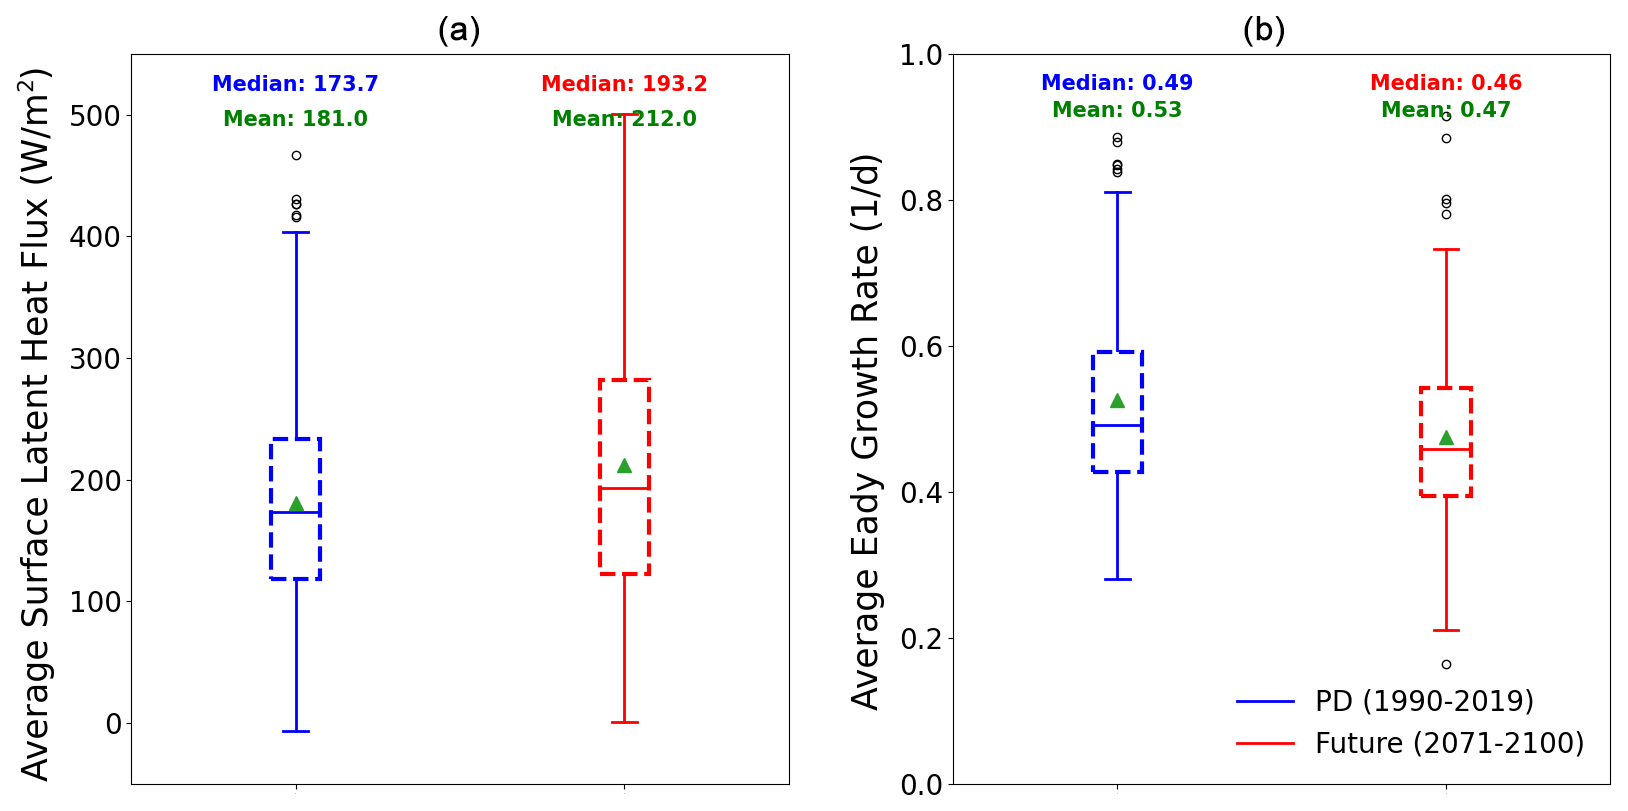
Figure 12Box plot for the present-day experiment (blue) and the future climate simulation (red) for (a) the surface latent heat flux and (b) the average 500 hPa Eady growth rate during the transition. The box represents the interquartile range (IQR) and contains 50 % of the data; the upper edge of the box represents the 75th percentile (upper quartile – UQ), while the lower edge is the 25th percentile (lower quartile – LQ). The horizontal line within the box indicates the median, while the green triangle indicates the mean. The whiskers extend to the smallest and largest data points within 1.5 times the IQR from the quartiles. Points beyond the whiskers are considered outliers.
Our findings align with those of previous studies (Cheung and Chu, 2023; Jung and Lackmann, 2021, 2023), which highlighted the increase in storm intensity during ET.
3.8 Reintensification during transition
Reintensification of storms during the ET phase is a critical aspect to evaluate as it influences the overall impact and longevity of transitioning storms. Reintensification during the transition phase is assessed using pressure differences and changes in IKE. The analysis reveals that storms, on average, do not intensify during the transition, with no significant difference in the pressure change (Fig. 13a). On average, there is a slight increase in pressure for both experiments: +3.5 hPa for the present-day simulation and +4.5 hPa for the future climate simulation. Additionally, the relative difference in IKE also shows no significant variation between the present-day and the future climate simulations (Fig. 13b). Despite the increase in storm central pressure, there is a modest rise in IKE during the transition for both climate states (+6.6 % for the present-day experiment and +7.5 % for the future climate simulation), potentially driven by the increase in storm size during the transition (Kozar and Misra, 2014).
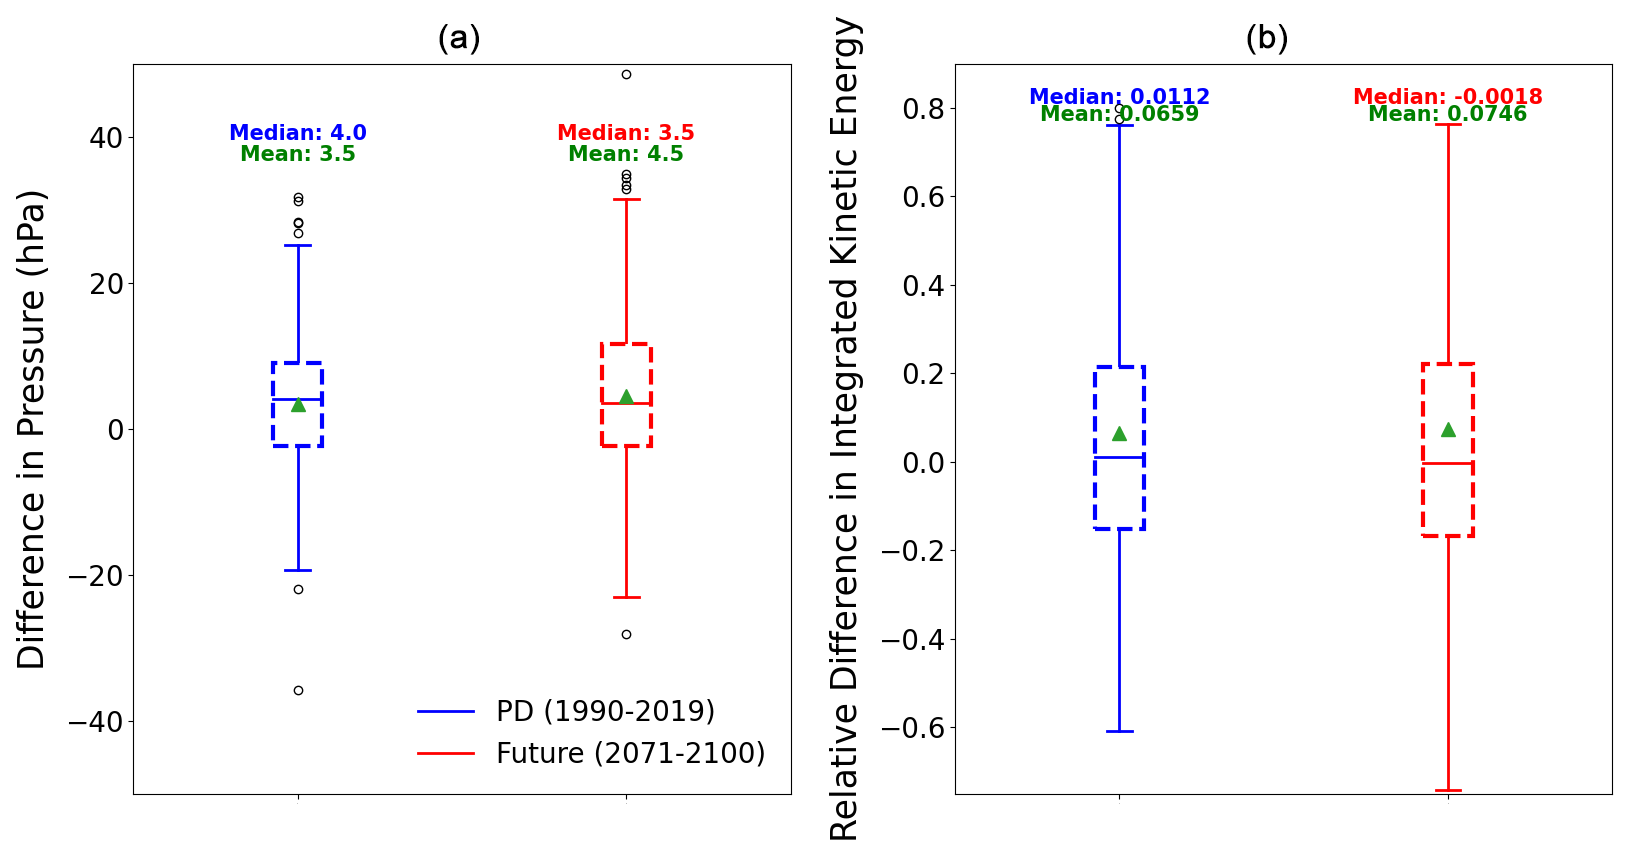
Figure 13(a) Box plot showing the difference in pressure at the storm center during the transition for the present-day (blue) and the future climate (red) simulations and (b) box plot showing the relative difference in integrated kinetic energy for present-day simulations (blue) and future climate simulations (red) during the transition. The box represents the interquartile range (IQR) containing 50 % of the data; the upper edge of the box represents the 75th percentile (upper quartile – UQ), while the lower edge is the 25th percentile (lower quartile – LQ). The horizontal line within the box indicates the median, while the green triangle indicates the mean. The whiskers extend to the smallest and largest data points within 1.5 times the IQR from the quartiles. Points beyond the whiskers are considered outliers.
The enhanced latent heat release has also been showed by Jung and Lackmann (2019) in a case study of the projection of Hurricane Irene (2011) in a warming environment. This has been interpreted as the primary cause of the intensification of the future transitioning storm Irene. Jung and Lackmann (2023) also highlighted a smaller risk of reintensification linked to a reduced baroclinic conversion. However, they focused on the post-ET intensification, while our study investigates the intensification during ET.
This study investigates how extratropical transitions (ETs) in the North Atlantic Basin might change by the end of the century under the RCP8.5 climate scenario, using high-resolution climate simulations. While we found no significant difference in ET frequency, with the ET ratio (42.7 %) in the future climate simulation being nearly identical to that in the present-day simulation (42.6 %), our results indicate that transitioning storms in the future have greater potential destructiveness. Specifically, the integrated kinetic energy associated with transitioning storms is significantly higher in the future climate simulation, driven largely by increased surface latent flux rather than enhanced baroclinic energy. This result aligns with the findings by Cheung and Chu (2023), which also reported an increase in the potential destructiveness of ETs.
While our findings on ET frequency contrast with those of Liu et al. (2017) and Baker et al. (2022), which reported a slight increase in ET frequency in the North Atlantic Basin, our results are consistent with those of Bieli et al. (2020), which did not report any significant change in the ET frequency, and with previous research indicating that TCs will become less frequent but more intense in the future (Bender et al., 2010; Knutson et al., 2020; Mallard et al., 2013). Our simulations also confirm a poleward migration of the maximum intensity of TCs (Lee et al., 2020), aligning with the expansion of TC cyclogenesis regions.
The findings indicate that the future climate simulation shows a weakening and northward shift in the mid-tropospheric baroclinic zone, driven by polar amplification, along with a slight increase in the upper-tropospheric baroclinic zone due to warming in the tropical upper troposphere. This weakening of the baroclinic zone, along with the decrease in the number of TCs, explains the decrease in the number of ET events, which ultimately leads to the stability of the ET frequency.
Additionally, our results do not show a significant change in ET seasonality, with September and October remaining the primary months for ET events. However, the peak's season seems to have shifted from September to October, suggesting that large-scale environmental conditions may become more favourable for ET in October in the future climate simulation.
No significant shift in the latitude of ET onsets is simulated in the future climate simulation, although there is a slight increase in ET occurrences near the US northeastern coast. This could be due to more intense TCs reaching favourable baroclinic zones, which contrasts with Baker et al. (2022), who reported a decrease in ET occurrences in this region, mainly explained by the poleward and eastward expansion of the cyclogenesis region. Our findings also contrast with those of Bieli et al. (2020), who reported a slight equatorward shift.
Previous studies (Jung and Lackmann, 2019) have suggested that the duration of ETs might be longer in the future due to higher SSTs, an empirical indicator of slowly transitioning storms (Hart et al., 2006), and due to a reduced meridional SST gradient, which inhibits baroclinic conversion. However, despite an environment that is less baroclinic during ET, no significant difference in duration is simulated, as shown in Michaelis and Lackmann (2021). There could be some biases in our findings as some storms have not completed their transition within the spatial domain, even though no significant difference in ET has been found for storms that have completed their transition. Indeed, Kitabatake (2011) and Kofron et al. (2010) highlighted the limitations of the cyclone phase space in the detection of ET duration. In addition, the inability of the cyclone phase space to resolve the cyclone's inner-core structure (Evans et al., 2017) may contribute to this finding.
Within the spatial zone considered, our study suggests that transitioning storms do not necessarily reintensify more in a warming environment, consistent with the findings of Jung and Lackmann (2023), due to a reduction in baroclinic conversion. However, our study mainly focused on reintensification during transition. Further work would be needed to investigate the potential reintensification post-ET.
In conclusion, our study suggests that extratropical transitions will pose a greater risk for populations in the US northeastern coast and the Canadian Maritimes. However, uncertainties remain regarding the impact of global warming on ET frequencies and the spatial and temporal distribution of ET events. Further research is needed to address these uncertainties.
Future studies should investigate the large-scale environmental conditions affecting the Northern Hemisphere, including the East Pacific and North America. Hart et al. (2006) emphasized that storms are more likely to intensify after interacting with a negatively tilted rather than a positively tilted trough. Therefore, a better understanding of how climate change will impact the occurrence of negatively tilted versus positively tilted troughs will be crucial for grasping future ET dynamics.
Additionally, the structure of post-transition storms warrants further exploration. Hart et al. (2006) noted that warm-seclusion cyclones, which are more likely to cause damage, should be examined in the context of global warming. Assessing how global warming affects the post-transition structures of storms will enhance our understanding of future risks associated with ETs.
Hart and Evans (2001) also mentioned that 50 % of tropical cyclones making landfall between 1950 and 1996 were transitioning storms. Investigating the impact of global warming on the spatial pattern of transitioning storms that make landfall will be important for anticipating future damages.
Finally, the simulations used in our study were atmospheric-only experiments with prescribed SST. Baker et al. (2022) demonstrated that high-resolution fully coupled simulations may yield different outcomes compared to atmospheric-only simulations. For instance, while atmospheric-only simulations showed an equatorward shift in the completion latitude, fully coupled simulations detected a poleward shift. Previous studies have highlighted the necessity of considering the impact of the ocean's negative feedback mechanism on tropical cyclones (Schade and Emanuel, 1999; Emanuel et al., 2004). The winds associated with tropical cyclones induce upwelling of cold waters, which cools the sea surface temperature and inhibits the intensification of tropical cyclones (Schade and Emanuel, 1999; Emanuel et al., 2004). The overestimation of the maximum wind can reach up to 25 m s−1 (Emanuel et al., 2004). Scoccimarro et al. (2017) demonstrated that a high coupling frequency could significantly reduce this bias. In the context of climate change, Huang et al. (2015) showed that this ocean feedback is expected to strengthen due to the increased ocean stratification, which could enhance the ocean's negative effect and reduce the expected intensification of tropical cyclones in certain regions of the North Atlantic. Therefore, further investigations using fully coupled models are needed to reconcile these discrepancies and build a comprehensive understanding of the impacts of climate change on extratropical transitions.
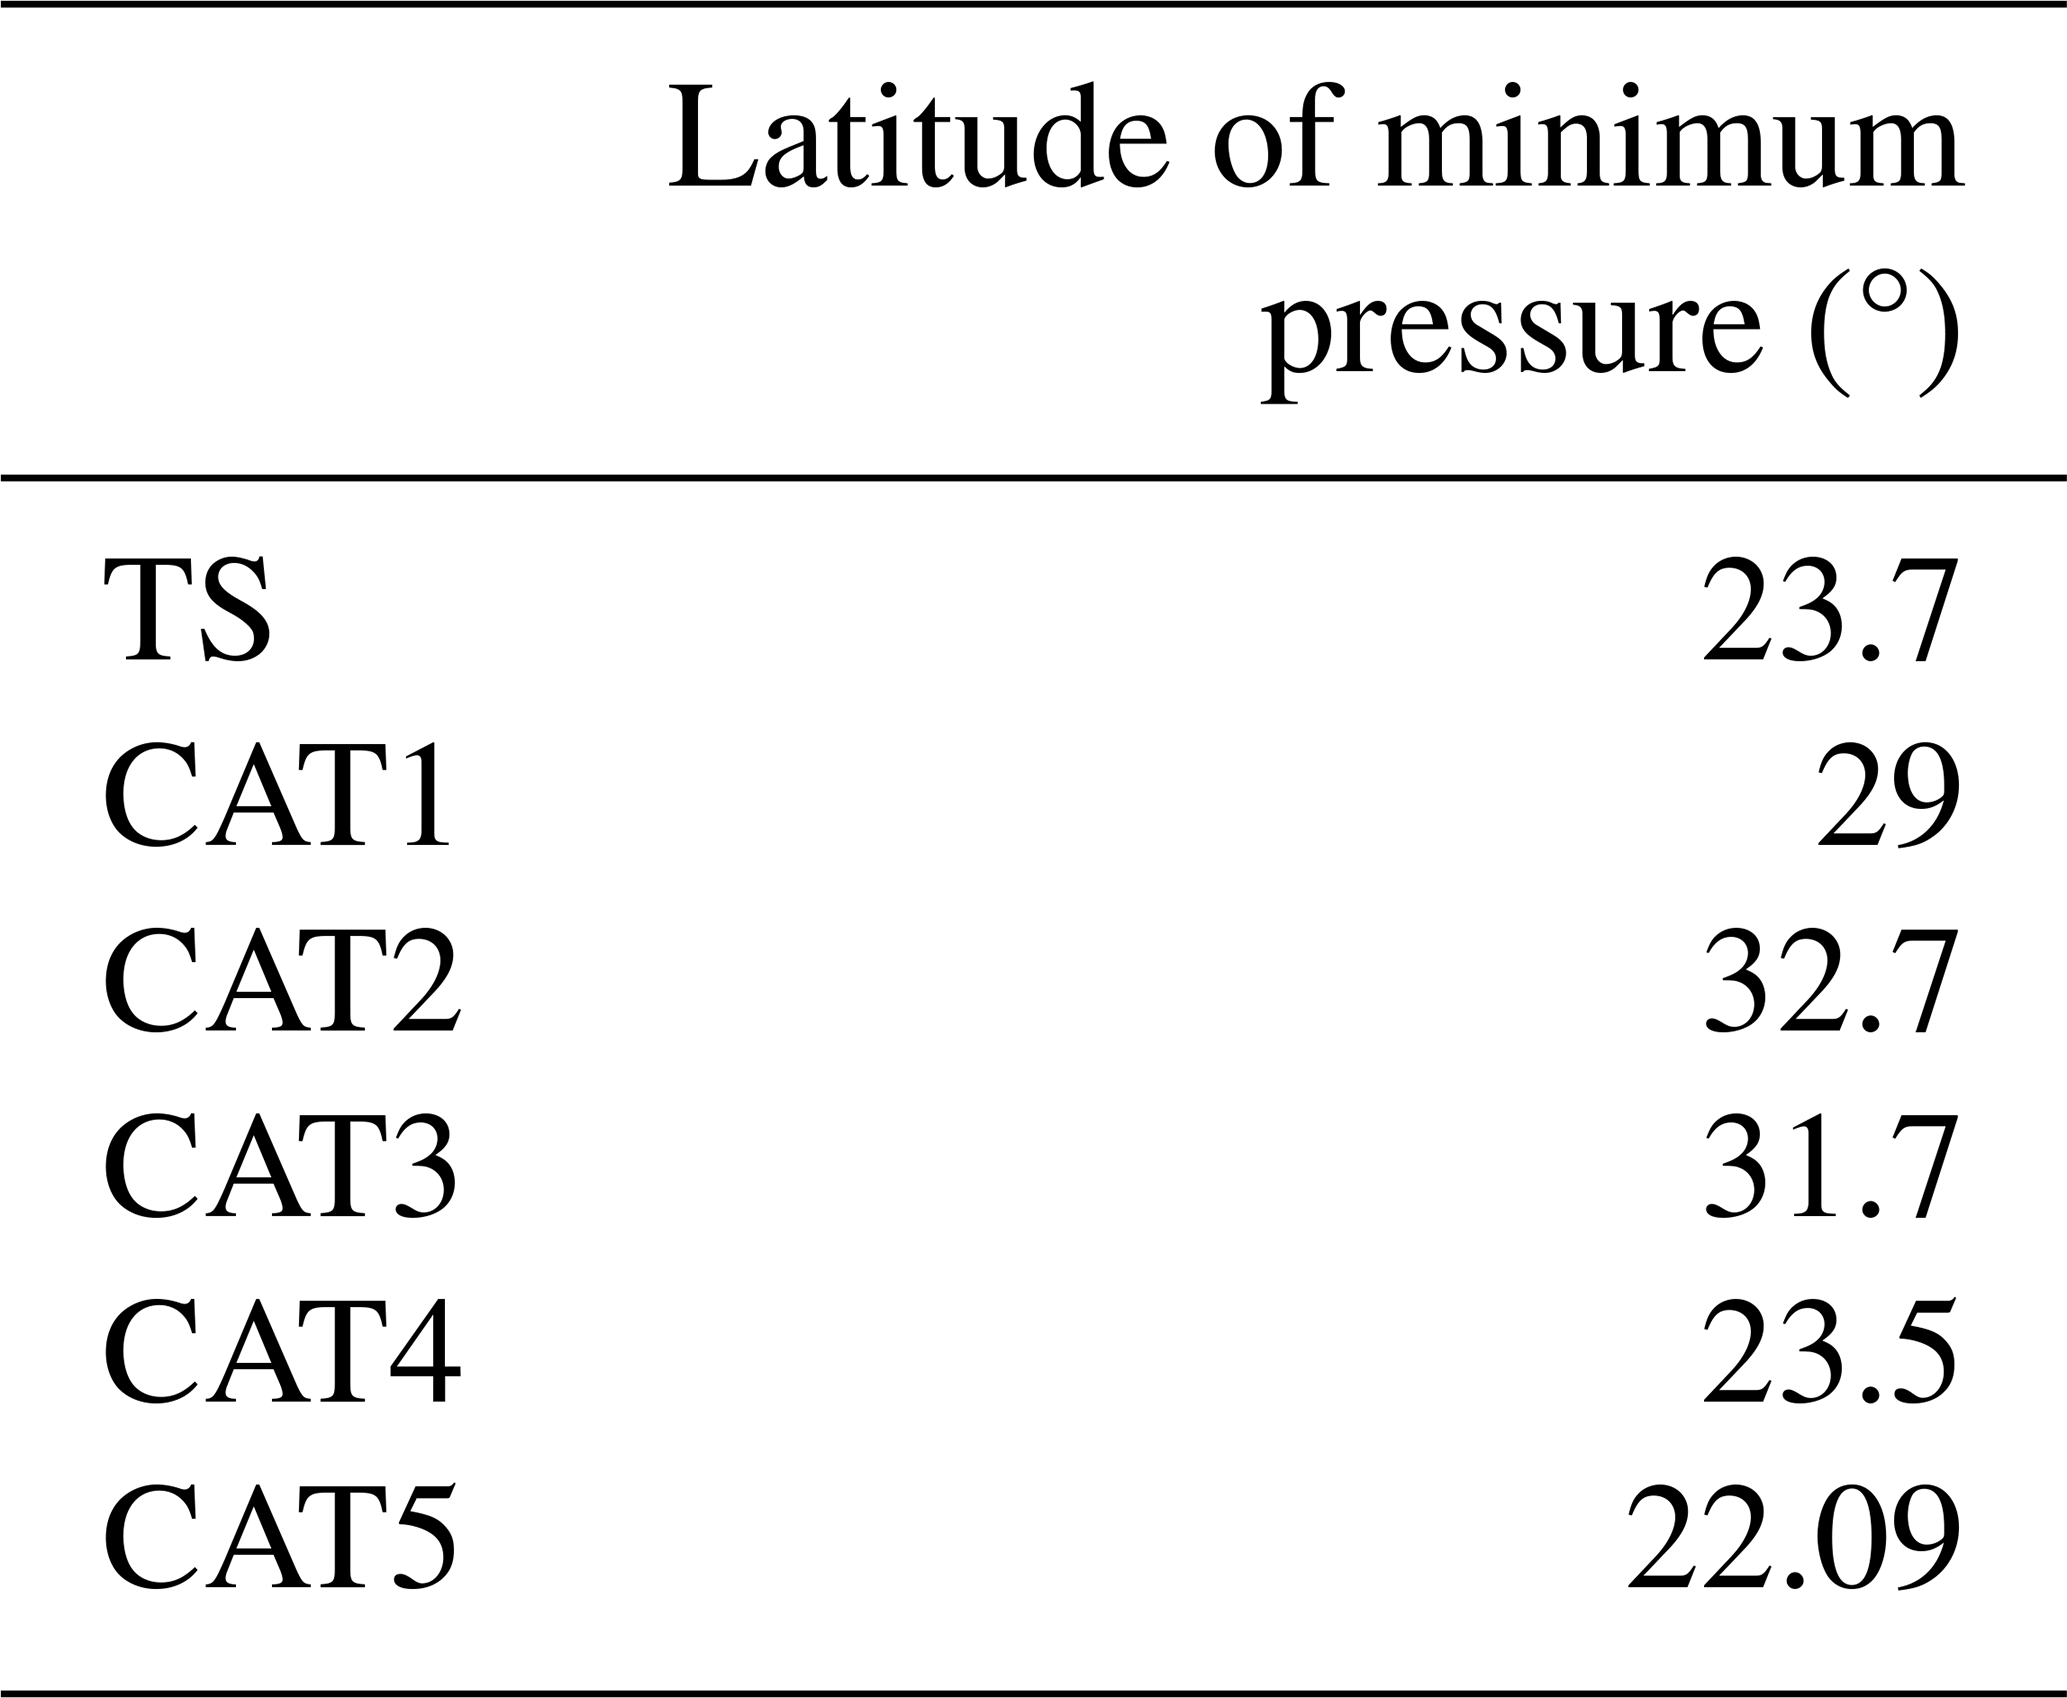
In this appendix, we further compare the model simulations with IBTrACS. Our results indicate an overestimation (+2.2) of the average yearly number of TCs compared to observations (Fig. A1). However, the distribution of storms per month is only slightly affected, although there is an underestimation in September and an overestimation in November and December (Fig. A2). The definition of the different categories based on minimum pressure and the climatological mean latitude of the minimum pressure is provided in Tables A1 and A2, respectively).
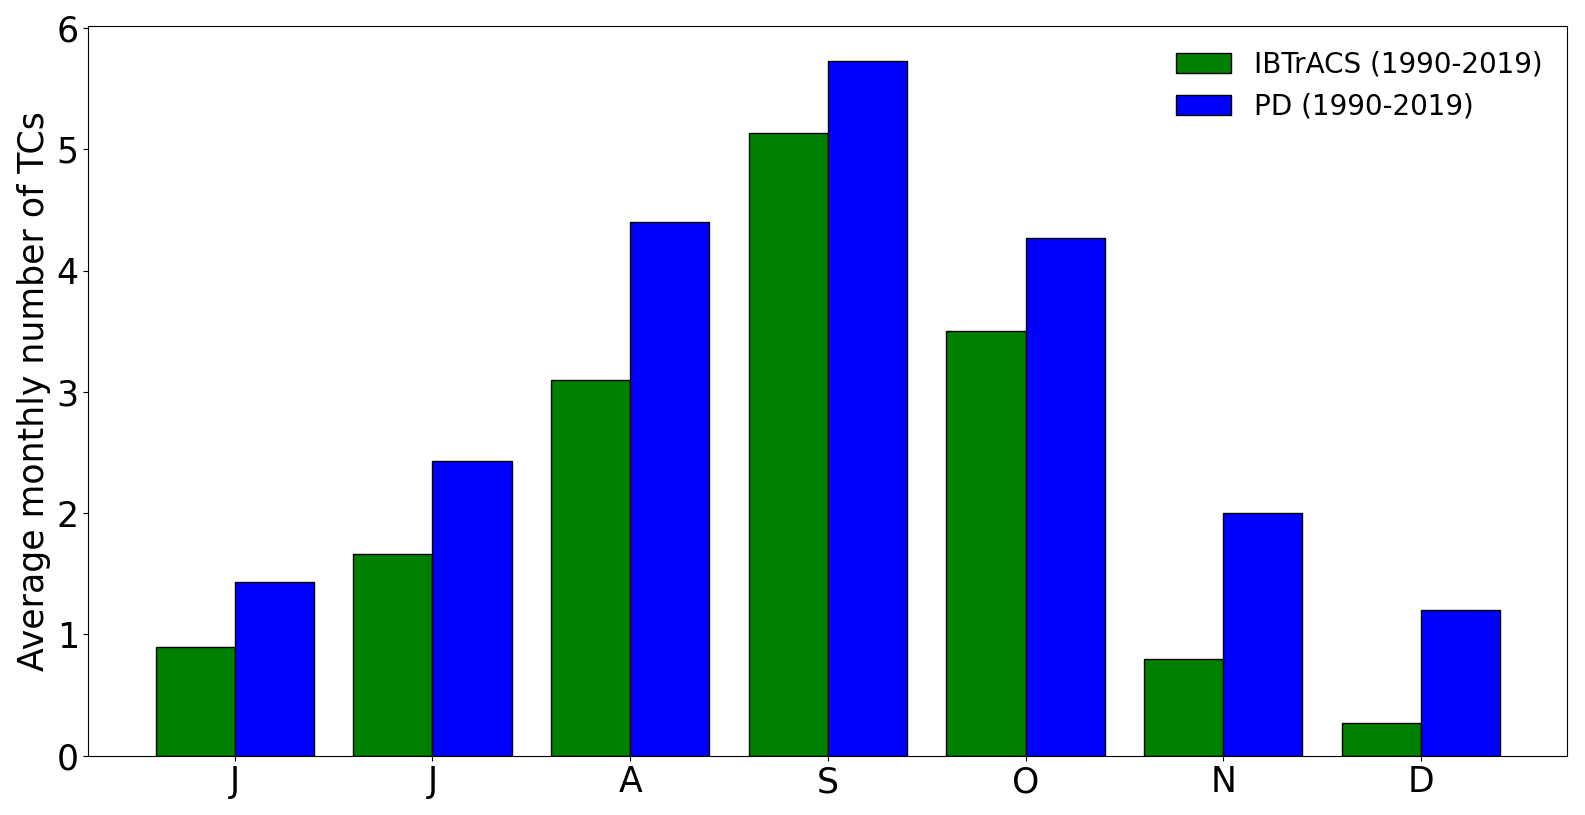
Figure A1Average monthly number of TCs for IBTrACS (green) and the present-day simulation (blue).
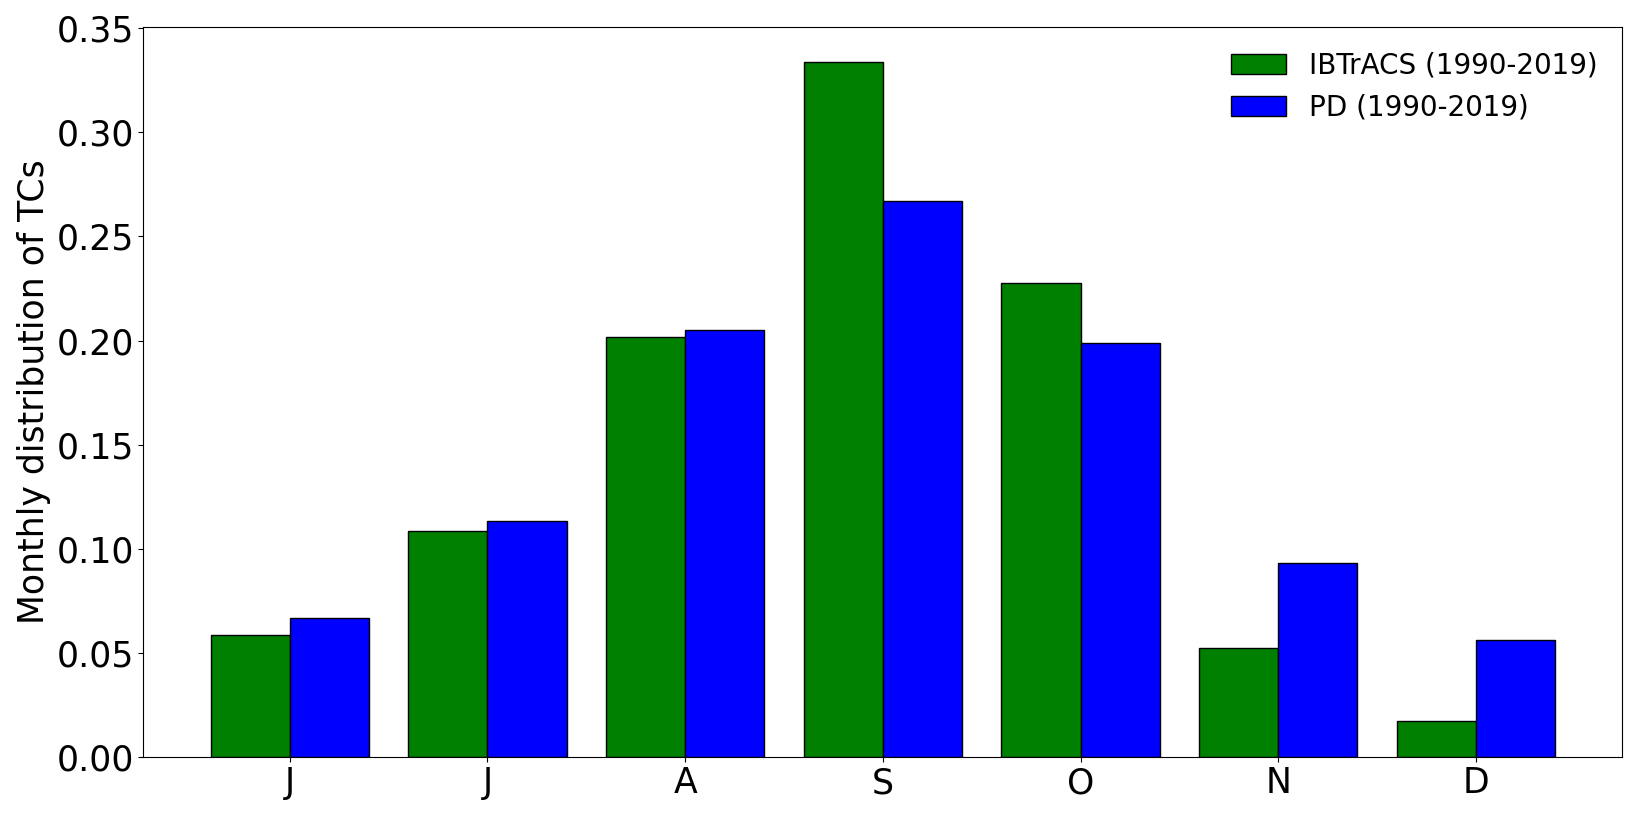
Figure A2Monthly distribution of TCs for IBTrACS (green) and the present-day simulation (blue).
Our results highlight challenges in accurately reproducing the most intense cyclones (CAT4 and CAT5). Tropical storms are also underestimated, while CAT1, CAT2, and CAT3 tend to be overestimated (Fig. A3). The storm categories are based on the minimum pressure, as detailed in Table A1.
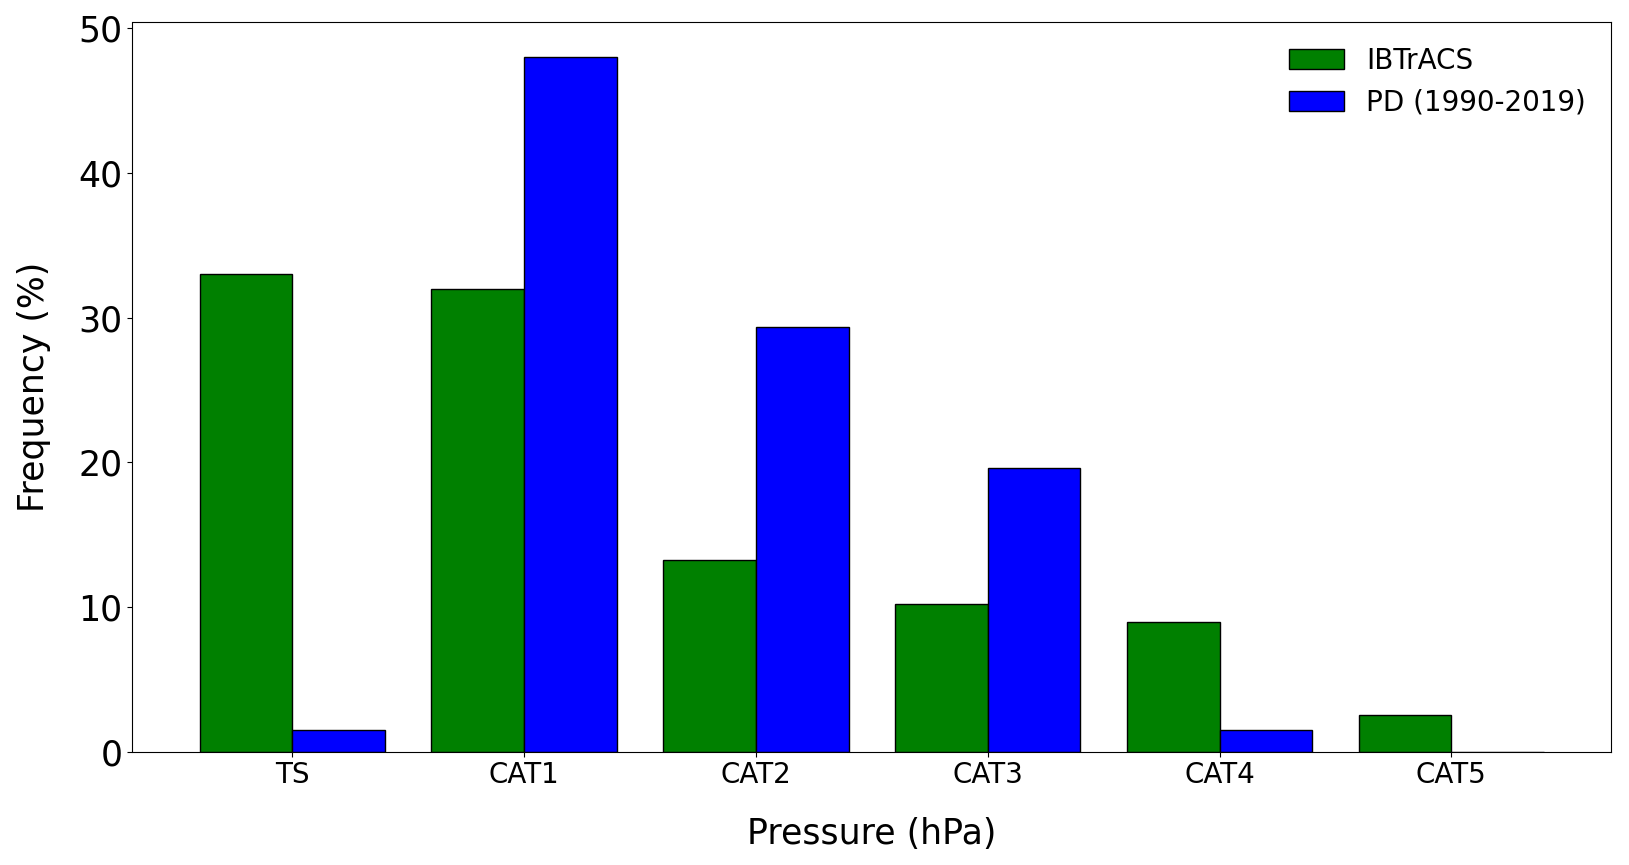
Figure A3Distribution of tropical storms per category for IBTrACS (green) and the present-day simulation (blue).
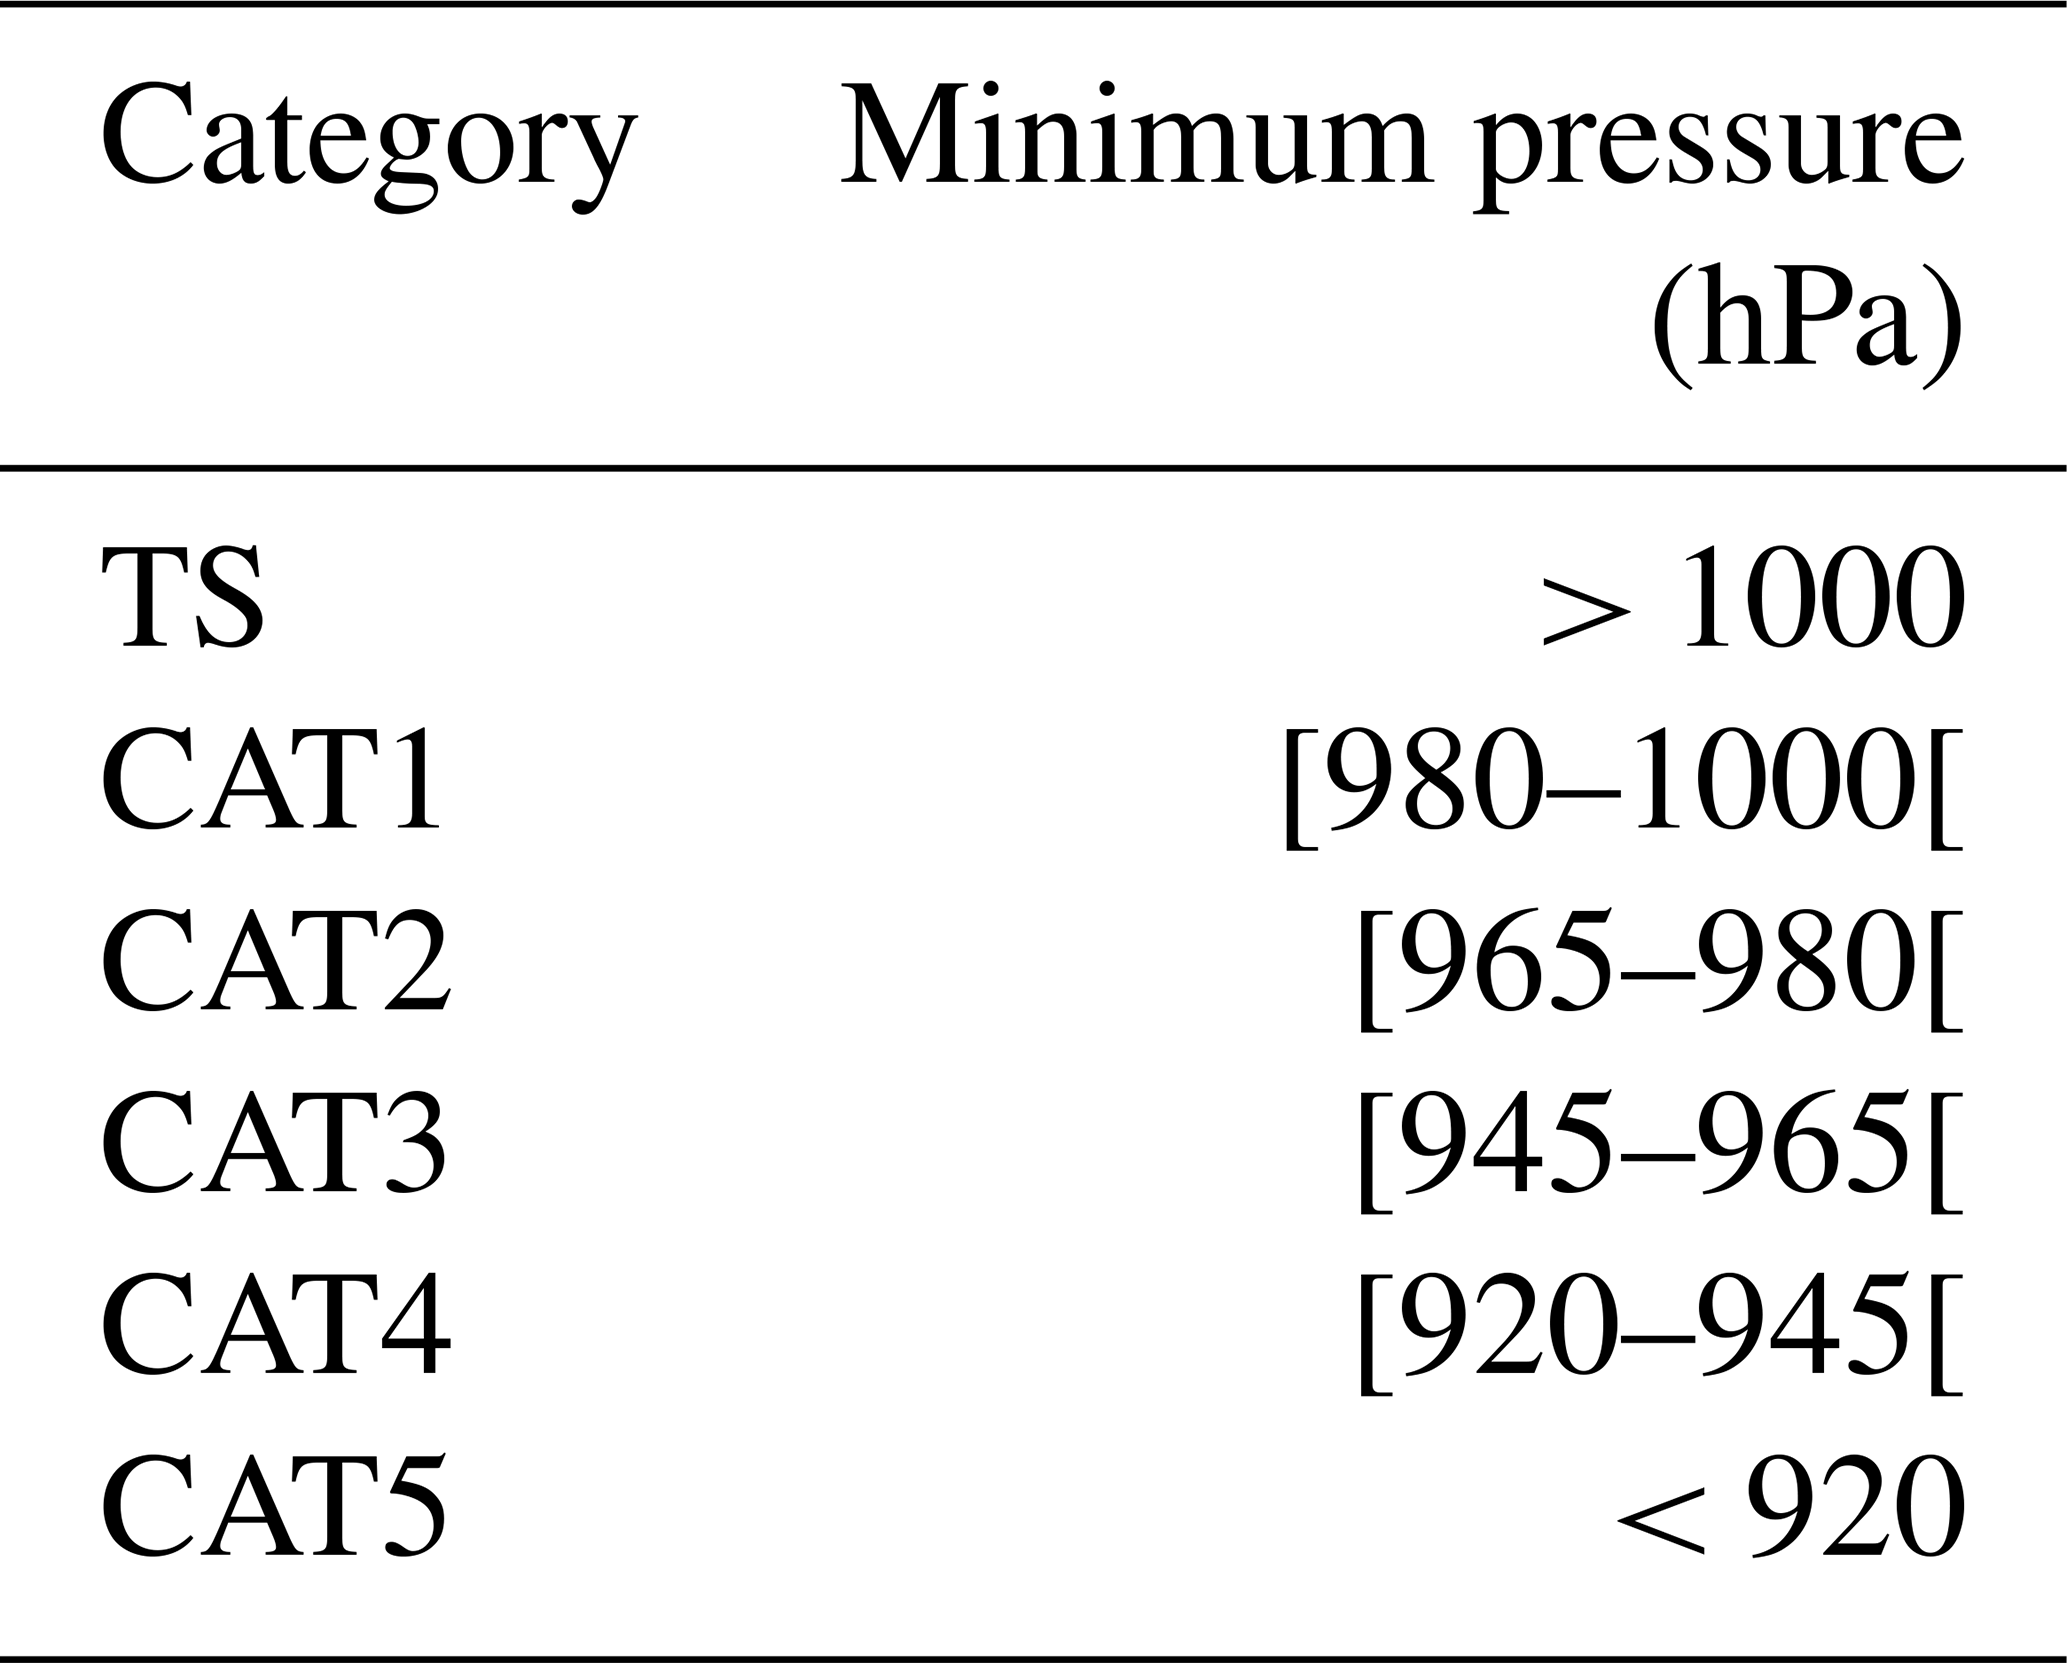
A northward shift in the minimum pressure latitude is also present. Indeed, the average latitude is 31.4° for the present-day experiment and 27.4° for the observations (Fig A4). This northward shift is mainly explained by the overestimation of CAT1, CAT2, and CAT3, whose minimum pressure latitudes are the highest (Table A2).
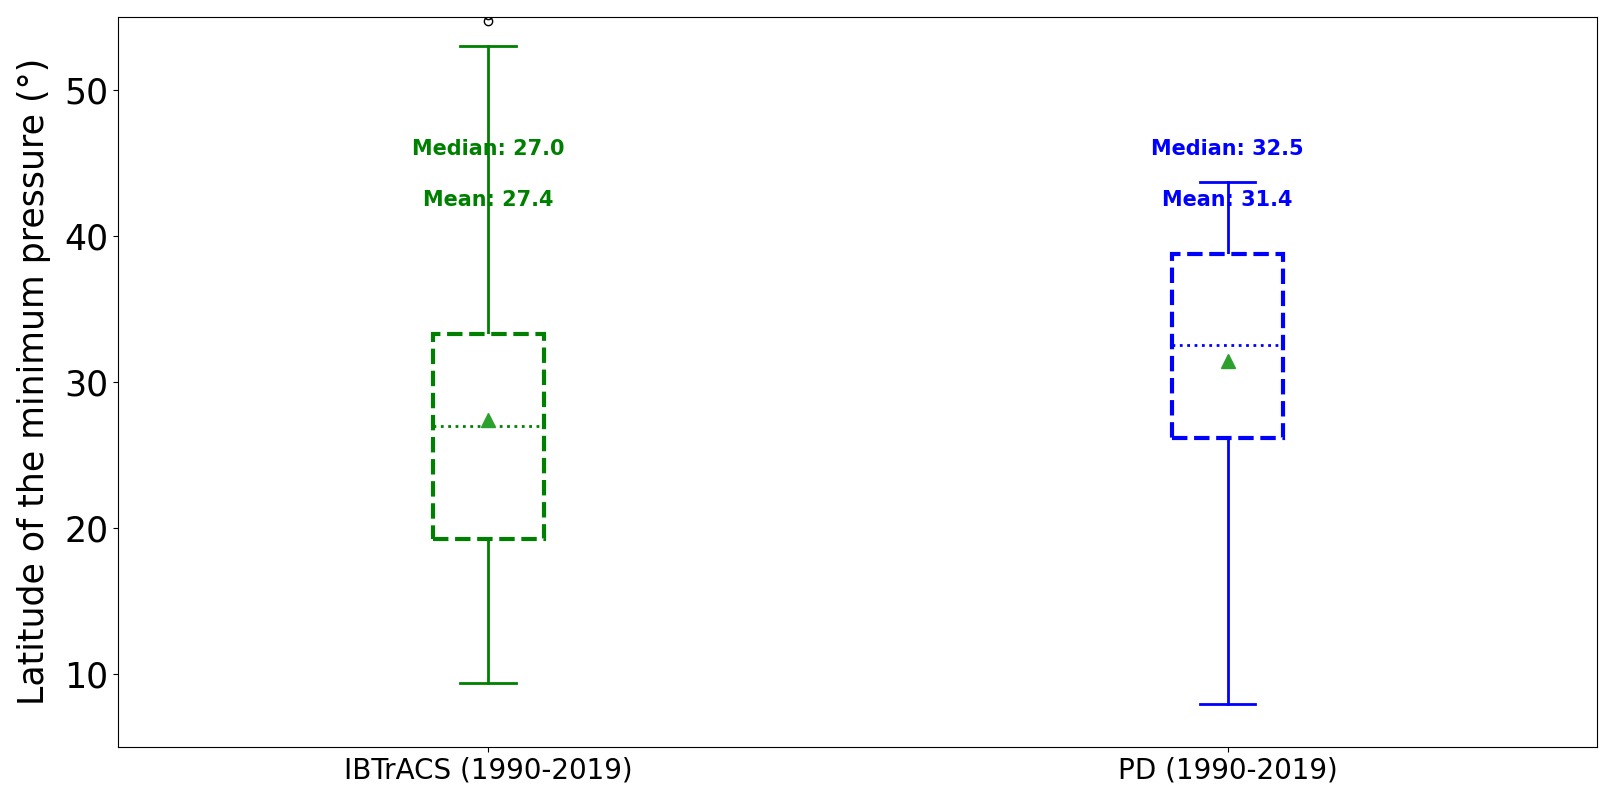
Figure A4Latitude of the minimum pressure for IBTrACS (green) and the present-day experiment (blue).
Table A2Latitude of the minimum pressure for IBTrACS (1990–2019).
Overall, the model satisfactorily reproduces the TC density in the North Atlantic. However, some differences should be noted (Fig. A5): the TC density is overestimated in the western North Atlantic (around 55° W), while it is underestimated near the US East Coast and the Gulf of Mexico. Additionally, TC density is underestimated in the central North Atlantic between 10 and 15° N.
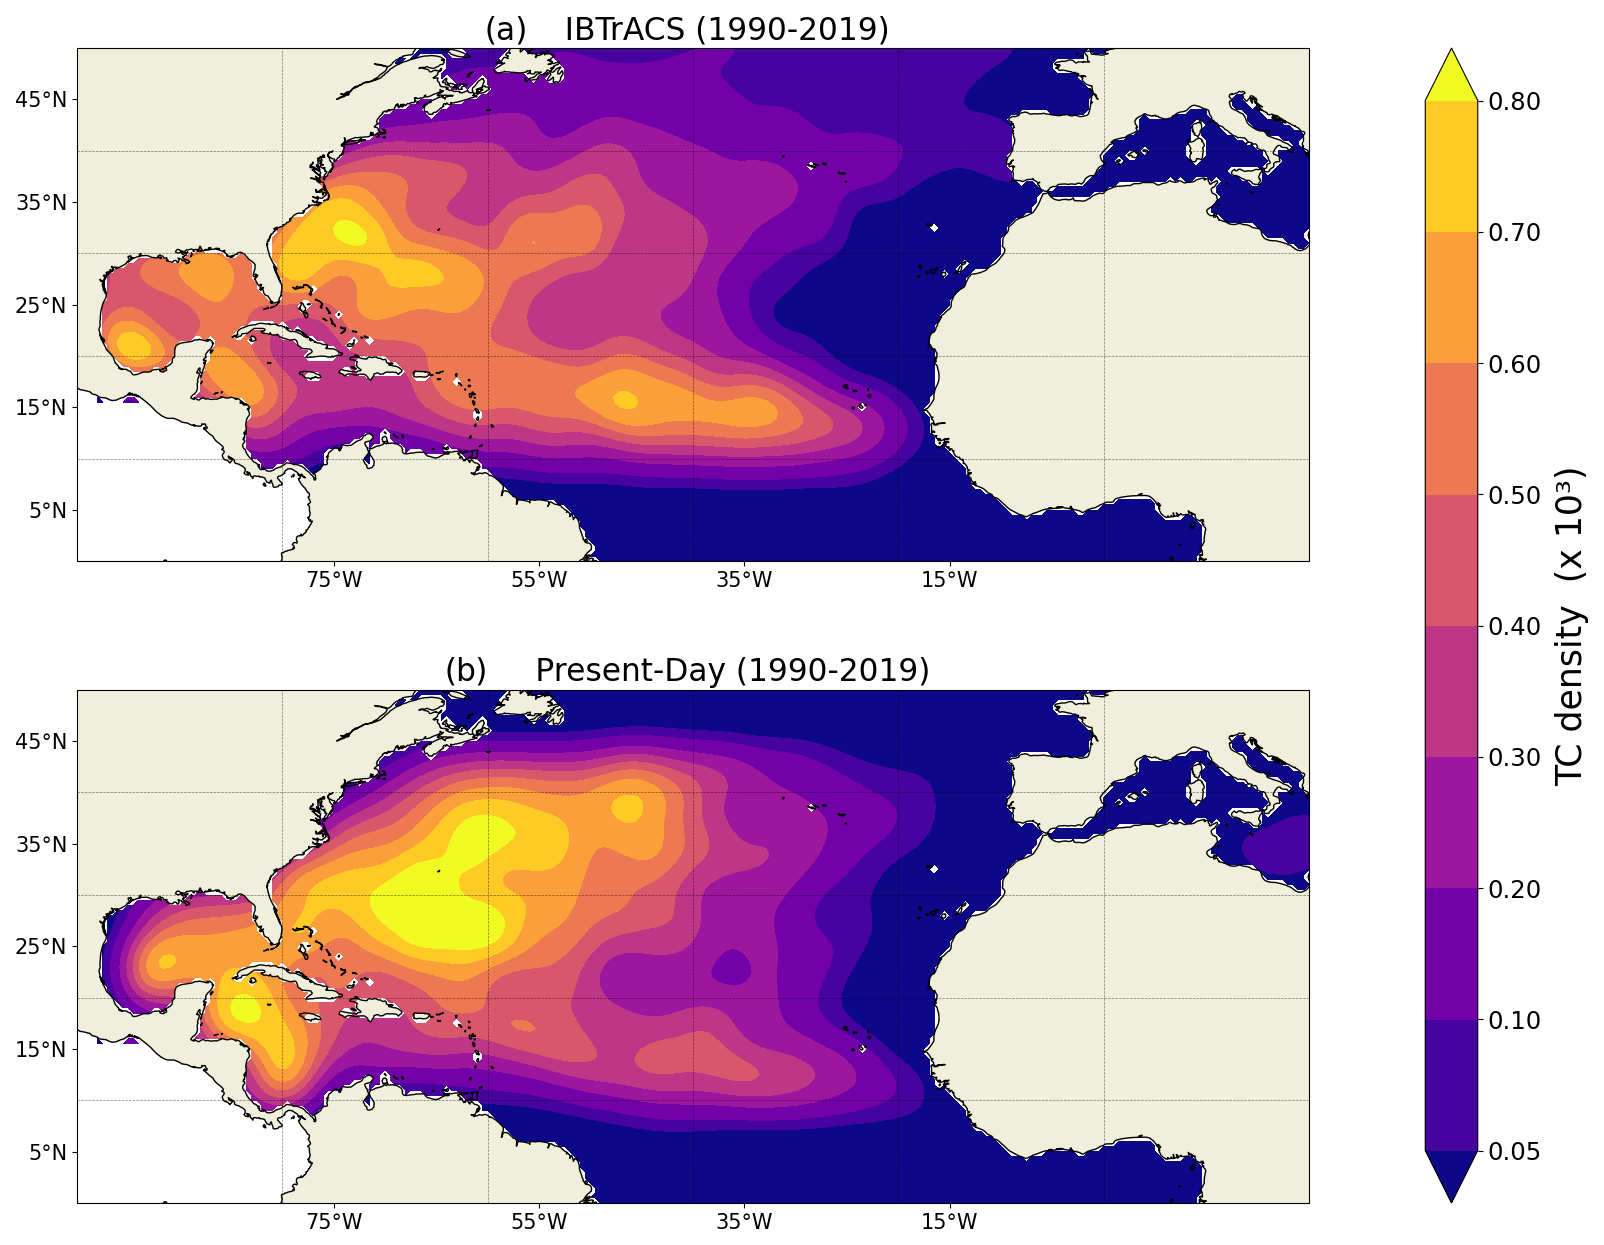
Figure A5TC density for IBTrACS and the present-day experiment. The TC density maps are estimated using a Gaussian kernel.
The codes used for most figures are available at https://doi.org/10.5281/zenodo.15098012 (Garin, 2025a).
The TC tracks are available at https://doi.org/10.5281/zenodo.15097961 (Garin, 2025b). The processed data are available at https://doi.org/10.5281/zenodo.15098012 (Garin, 2025a).
AG: methodology, software, validation, formal analysis, investigation, writing – original draft, visualization. FSRP: conceptualization, methodology, formal analysis, investigation, resources, writing – review and editing, visualization, supervision. MB: conceptualization, formal analysis, investigation, resources, writing – review and editing, visualization, supervision. RI: model simulations, software, validation, writing – review and editing.
The contact author has declared that none of the authors has any competing interests.
Publisher’s note: Copernicus Publications remains neutral with regard to jurisdictional claims made in the text, published maps, institutional affiliations, or any other geographical representation in this paper. While Copernicus Publications makes every effort to include appropriate place names, the final responsibility lies with the authors.
The authors would like to thank Katja Winger for the help in developing the algorithms and Frédérik Toupin and Yassine Hammadi for technical support. The authors would like to thank the Recherche en Prevision Numérique (RPN), the Meteorological Research Branch (MRB), and the Canadian Meteorological Centre (CMC) for the permission to use the GEM model as basis for our CRCM5 regional climate model. This research was enabled in part by support provided by Calcul Quebec (https://www.calculq uebec.ca/, last access: 1 July 2023) and the Digital Research Alliance of Canada (https://alliancecan.ca/en, last access: 1 July 2023).
Aude Garin, Francesco S. R. Pausata, and Roberto Ingrosso have been financially supported by the Natural Sciences and Engineering Research Council of Canada (NSERC; grant no. RGPIN-2018-04981) and the NOVA Program (FRQNT-NSERC: https://doi.org/10.69777/324826).
This paper was edited by Stephan Pfahl and reviewed by two anonymous referees.
Arnott, J. M., Evans, J. L., and Chiaromonte, F.: Characterization of Extratropical Transition Using Cluster Analysis, Mon. Weather Rev., 132, 2916–2937, https://doi.org/10.1175/MWR2836.1, 2004.
Baatsen, M., Haarsma, R. J., Van Delden, A. J., and de Vries, H.: Severe Autumn storms in future Western Europe with a warmer Atlantic Ocean, Clim. Dynam., 45, 949–964, https://doi.org/10.1007/s00382-014-2329-8, 2015.
Baker, A. J., Roberts, M. J., Vidale, P. L., Hodges, K. I., Seddon, J., Vannière, B., Haarsma, R. J., Schiemann, R., Kapetanakis, D., Tourigny, E., Lohmann, K., Roberts, C. D., and Terray, L.: Extratropical Transition of Tropical Cyclones in a Multiresolution Ensemble of Atmosphere-Only and Fully Coupled Global Climate Models, J. Climate, 35, 5283–5306, https://doi.org/10.1175/JCLI-D-21-0801.1, 2022.
Barnes, E. A. and Polvani, L. M.: CMIP5 Projections of Arctic Amplification, of the North American/North Atlantic Circulation, and of Their Relationship, J. Climate, 28, 5254–5271, https://doi.org/10.1175/JCLI-D-14-00589.1, 2015.
Bender, M. A., Knutson, T. R., Tuleya, R. E., Sirutis, J. J., Vecchi, G. A., Garner, S. T., and Held, I. M.: Modeled Impact of Anthropogenic Warming on the Frequency of Intense Atlantic Hurricanes, Science, 327, 454–458, https://doi.org/10.1126/science.1180568, 2010.
Bieli, M., Camargo, S. J., Sobel, A. H., Evans, J. L., and Hall, T.: A Global Climatology of Extratropical Transition. Part I: Characteristics across Basins, J. Climate, 32, 3557–3582, https://doi.org/10.1175/JCLI-D-17-0518.1, 2019.
Bieli, M., Sobel, A. H., Camargo, S. J., Murakami, H., and Vecchi, G. A.: Application of the Cyclone Phase Space to Extratropical Transition in a Global Climate Model, J. Adv. Model. Earth Sy., 12, e2019MS001878, https://doi.org/10.1029/2019MS001878, 2020.
Bister, M. and Emanuel, K. A.: Dissipative heating and hurricane intensity, Meteorol. Atmos. Phys., 65, 233–240, https://doi.org/10.1007/BF01030791, 1998.
Bister, M. and Emanuel, K. A.: Low frequency variability of tropical cyclone potential intensity 1. Interannual to interdecadal variability, J. Geophys. Res., 107, ACL 26-1–ACL 26-15, https://doi.org/10.1029/2001JD000776, 2002.
Blender, R. and Schubert, M.: Cyclone Tracking in Different Spatial and Temporal Resolutions, Mon. Weather Rev., 128, 377–384, https://doi.org/10.1175/1520-0493(2000)128<0377:CTIDSA>2.0.CO;2, 2000.
Blender, R., Fraedrich, K., and Lunkeit, F.: Identification of cyclone-track regimes in the North Atlantic, Q. J. Roy. Meteor. Soc., 123, 727–741, https://doi.org/10.1002/qj.49712353910, 1997.
Cheung, H. M. and Chu, J.-E.: Global increase in destructive potential of extratropical transition events in response to greenhouse warming, npj Clim. Atmos. Sci., 6, 137, https://doi.org/10.1038/s41612-023-00470-8, 2023.
Dandoy, S., Pausata, F. S. R., Camargo, S. J., Laprise, R., Winger, K., and Emanuel, K.: Atlantic hurricane response to Saharan greening and reduced dust emissions during the mid-Holocene, Clim. Past, 17, 675–701, https://doi.org/10.5194/cp-17-675-2021, 2021.
Eady, E. T.: Long Waves and Cyclone Waves, Tellus, 1, 33–52, https://doi.org/10.1111/j.2153-3490.1949.tb01265.x, 1949.
Emanuel, K., DesAutels, C., Holloway, C., and Korty, R.: Environmental Control of Tropical Cyclone Intensity, J. Atmos. Sci., 61, 843–858, https://doi.org/10.1175/1520-0469(2004)061<0843:ECOTCI>2.0.CO;2, 2004.
Evans, C. and Hart, R. E.: Analysis of the Wind Field Evolution Associated with the Extratropical Transition of Bonnie (1998), Mon. Weather Rev., 136, 2047–2065, https://doi.org/10.1175/2007MWR2051.1, 2008.
Evans, C., Wood, K. M., Aberson, S. D., Archambault, H. M., Milrad, S. M., Bosart, L. F., Corbosiero, K. L., Davis, C. A., Dias Pinto, J. R., Doyle, J., Fogarty, C., Galarneau, T. J., Grams, C. M., Griffin, K. S., Gyakum, J., Hart, R. E., Kitabatake, N., Lentink, H. S., McTaggart-Cowan, R., Perrie, W., Quinting, J. F. D., Reynolds, C. A., Riemer, M., Ritchie, E. A., Sun, Y., and Zhang, F.: The Extratropical Transition of Tropical Cyclones. Part I: Cyclone Evolution and Direct Impacts, Mon. Weather Rev., 145, 4317–4344, https://doi.org/10.1175/MWR-D-17-0027.1, 2017.
Francis, J. A. and Vavrus, S. J.: Evidence linking Arctic amplification to extreme weather in mid-latitudes, Geophys. Res. Lett., 39, L06801, https://doi.org/10.1029/2012GL051000, 2012.
Garin, A.: Figures codes and data, Version v1, Zenodo [code/data set], https://doi.org/10.5281/zenodo.15098012, 2025a.
Garin, A.: TC tracks, Version v1, Zenodo [data set], https://doi.org/10.5281/zenodo.15097961, 2025b.
Garner, A. J., Kopp, R. E., and Horton, B. P.: Evolving Tropical Cyclone Tracks in the North Atlantic in a Warming Climate, Earth's Future, 9, e2021EF002326, https://doi.org/10.1029/2021EF002326, 2021.
Gilford, D. M.: pyPI (v1.3): Tropical Cyclone Potential Intensity Calculations in Python, Geosci. Model Dev., 14, 2351–2369, https://doi.org/10.5194/gmd-14-2351-2021, 2021.
Gualdi, S., Scoccimarro, E., and Navarra, A.: Changes in Tropical Cyclone Activity due to Global Warming: Results from a High-Resolution Coupled General Circulation Model, J. Climate, 21, 5204–5228, https://doi.org/10.1175/2008JCLI1921.1, 2008.
Haarsma, R. J., Hazeleger, W., Severijns, C., de Vries, H., Sterl, A., Bintanja, R., van Oldenborgh, G. J., and van den Brink, H. W.: More hurricanes to hit western Europe due to global warming, Geophys. Res. Lett., 40, 1783–1788, https://doi.org/10.1002/grl.50360, 2013.
Harr, P. A. and Elsberry, R. L.: Extratropical Transition of Tropical Cyclones over the Western North Pacific. Part I: Evolution of Structural Characteristics during the Transition Process, Mon. Weather Rev., 128, 2613–2633, https://doi.org/10.1175/1520-0493(2000)128<2613:ETOTCO>2.0.CO;2, 2000.
Hart, R. E.: A Cyclone Phase Space Derived from Thermal Wind and Thermal Asymmetry, Mon. Weather Rev., 131, 585–616, https://doi.org/10.1175/1520-0493(2003)131<0585:ACPSDF>2.0.CO;2, 2003.
Hart, R. E. and Evans, J. L.: A Climatology of the Extratropical Transition of Atlantic Tropical Cyclones, J. Climate, 14, 546–564, https://doi.org/10.1175/1520-0442(2001)014<0546:ACOTET>2.0.CO;2, 2001.
Hart, R. E., Evans, J. L., and Evans, C.: Synoptic Composites of the Extratropical Transition Life Cycle of North Atlantic Tropical Cyclones: Factors Determining Posttransition Evolution, Mon. Weather Rev., 134, 553–578, https://doi.org/10.1175/MWR3082.1, 2006.
Harvey, B. J., Shaffrey, L. C., and Woollings, T. J.: Equator-to-pole temperature differences and the extra-tropical storm track responses of the CMIP5 climate models, Clim. Dynam., 43, 1171–1182, https://doi.org/10.1007/s00382-013-1883-9, 2014.
Hersbach, H., Bell, B., Berrisford, P., Hirahara, S., Horányi, A., Muñoz-Sabater, J., Nicolas, J., Peubey, C., Radu, R., Schepers, D., Simmons, A., Soci, C., Abdalla, S., Abellan, X., Balsamo, G., Bechtold, P., Biavati, G., Bidlot, J., Bonavita, M., De Chiara, G., Dahlgren, P., Dee, D., Diamantakis, M., Dragani, R., Flemming, J., Forbes, R., Fuentes, M., Geer, A., Haimberger, L., Healy, S., Hogan, R. J., Hólm, E., Janisková, M., Keeley, S., Laloyaux, P., Lopez, P., Lupu, C., Radnoti, G., De Rosnay, P., Rozum, I., Vamborg, F., Villaume, S., and Thépaut, J.: The ERA5 global reanalysis, Q. J. Roy. Meteor. Soc., 146, 1999–2049, https://doi.org/10.1002/qj.3803, 2020.
Hill, K. A. and Lackmann, G. M.: The Impact of Future Climate Change on TC Intensity and Structure: A Downscaling Approach, J. Climate, 24, 4644–4661, https://doi.org/10.1175/2011JCLI3761.1, 2011.
Huang, P., Lin, I.-I., Chou, C., and Huang, R.-H.: Change in ocean subsurface environment to suppress tropical cyclone intensification under global warming, Nat. Commun., 6, 7188, https://doi.org/10.1038/ncomms8188, 2015.
Ingrosso, R. and Pausata, F. S. R.: Contrasting consequences of the Great Green Wall: Easing aridity while increasing heat extremes, One Earth, 7, 455–472, https://doi.org/10.1016/j.oneear.2024.01.017, 2024.
Jones, S. C., Harr, P. A., Abraham, J., Bosart, L. F., Bowyer, P. J., Evans, J. L., Hanley, D. E., Hanstrum, B. N., Hart, R. E., Lalaurette, F., Sinclair, M. R., Smith, R. K., and Thorncroft, C.: The Extratropical Transition of Tropical Cyclones: Forecast Challenges, Current Understanding, and Future Directions, Weather Forecast., 18, 1052–1092, https://doi.org/10.1175/1520-0434(2003)018<1052:TETOTC>2.0.CO;2, 2003.
Jung, C. and Lackmann, G. M.: Extratropical Transition of Hurricane Irene (2011) in a Changing Climate, J. Climate, 32, 4847–4871, https://doi.org/10.1175/JCLI-D-18-0558.1, 2019.
Jung, C. and Lackmann, G. M.: The Response of Extratropical Transition of Tropical Cyclones to Climate Change: Quasi-Idealized Numerical Experiments, J. Climate, 34, 4361–4381, https://doi.org/10.1175/JCLI-D-20-0543.1, 2021.
Jung, C. and Lackmann, G. M.: Changes in Tropical Cyclones Undergoing Extratropical Transition in a Warming Climate: Quasi-Idealized Numerical Experiments of North Atlantic Landfalling Events, Geophys. Res. Lett., 50, e2022GL101963, https://doi.org/10.1029/2022GL101963, 2023.
Kitabatake, N.: Climatology of Extratropical Transition of Tropical Cyclones in the Western North Pacific Defined by Using Cyclone Phase Space, J. Meteorol. Soc. Jpn., 89, 309–325, https://doi.org/10.2151/jmsj.2011-402, 2011.
Klein, P. M., Harr, P. A., and Elsberry, R. L.: Extratropical Transition of Western North Pacific Tropical Cyclones: An Overview and Conceptual Model of the Transformation Stage, Weather Forecast., 15, 373–395, https://doi.org/10.1175/1520-0434(2000)015<0373:ETOWNP>2.0.CO;2, 2000.
Knapp, K. R., Kruk, M. C., Levinson, D. H., Diamond, H. J., and Neumann, C. J.: The International Best Track Archive for Climate Stewardship (IBTrACS): Unifying Tropical Cyclone Data, B. Am. Meteorol. Soc., 91, 363–376, https://doi.org/10.1175/2009BAMS2755.1, 2010.
Knutson, T., Camargo, S. J., Chan, J. C. L., Emanuel, K., Ho, C.-H., Kossin, J., Mohapatra, M., Satoh, M., Sugi, M., Walsh, K., and Wu, L.: Tropical Cyclones and Climate Change Assessment: Part II: Projected Response to Anthropogenic Warming, B. Am. Meteorol. Soc., 101, E303–E322, https://doi.org/10.1175/BAMS-D-18-0194.1, 2020.
Kofron, D. E., Ritchie, E. A., and Tyo, J. S.: Determination of a Consistent Time for the Extratropical Transition of Tropical Cyclones. Part I: Examination of Existing Methods for Finding “ET Time”, Mon. Weather Rev., 138, 4328–4343, https://doi.org/10.1175/2010MWR3180.1, 2010.
Kossin, J. P., Emanuel, K. A., and Vecchi, G. A.: The poleward migration of the location of tropical cyclone maximum intensity, Nature, 509, 349–352, https://doi.org/10.1038/nature13278, 2014.
Kossin, J. P., Knapp, K. R., Olander, T. L., and Velden, C. S.: Global increase in major tropical cyclone exceedance probability over the past four decades, P. Natl. Acad. Sci. USA, 117, 11975–11980, https://doi.org/10.1073/pnas.1920849117, 2020.
Kozar, M. E. and Misra, V.: Statistical Prediction of Integrated Kinetic Energy in North Atlantic Tropical Cyclones, Mon. Weather Rev., 142, 4646–4657, https://doi.org/10.1175/MWR-D-14-00117.1, 2014.
Lee, C.-Y., Camargo, S. J., Sobel, A. H., and Tippett, M. K.: Statistical–Dynamical Downscaling Projections of Tropical Cyclone Activity in a Warming Climate: Two Diverging Genesis Scenarios, J. Climate, 33, 4815–4834, https://doi.org/10.1175/JCLI-D-19-0452.1, 2020.
Lehmann, J., Coumou, D., Frieler, K., Eliseev, A. V., and Levermann, A.: Future changes in extratropical storm tracks and baroclinicity under climate change, Environ. Res. Lett., 9, 084002, https://doi.org/10.1088/1748-9326/9/8/084002, 2014.
Lindzen, R. S. and Farrell, B.: A Simple Approximate Result for the Maximum Growth Rate of Baroclinic Instabilities, J. Atmos. Sci., 37, 1648–1654, https://doi.org/10.1175/1520-0469(1980)037<1648:ASARFT>2.0.CO;2, 1980.
Liu, M., Vecchi, G. A., Smith, J. A., and Murakami, H.: The Present-Day Simulation and Twenty-First-Century Projection of the Climatology of Extratropical Transition in the North Atlantic, J. Climate, 30, 2739–2756, https://doi.org/10.1175/JCLI-D-16-0352.1, 2017.
Lorenz, D. J. and DeWeaver, E. T.: Tropopause height and zonal wind response to global warming in the IPCC scenario integrations, J. Geophys. Res., 112, 2006JD008087, https://doi.org/10.1029/2006JD008087, 2007.
Mallard, M. S., Lackmann, G. M., and Aiyyer, A.: Atlantic Hurricanes and Climate Change. Part II: Role of Thermodynamic Changes in Decreased Hurricane Frequency, J. Climate, 26, 8513–8528, https://doi.org/10.1175/JCLI-D-12-00183.1, 2013.
Michaelis, A. C. and Lackmann, G. M.: Climatological Changes in the Extratropical Transition of Tropical Cyclones in High-Resolution Global Simulations, J. Climate, 32, 8733–8753, https://doi.org/10.1175/JCLI-D-19-0259.1, 2019.
Michaelis, A. C. and Lackmann, G. M.: Storm-Scale Dynamical Changes of Extratropical Transition Events in Present-Day and Future High-Resolution Global Simulations, J. Climate, 34, 5037–5062, https://doi.org/10.1175/JCLI-D-20-0472.1, 2021.
Powell, M. D. and Reinhold, T. A.: Tropical Cyclone Destructive Potential by Integrated Kinetic Energy, B. Am. Meteorol. Soc., 88, 513–526, https://doi.org/10.1175/BAMS-88-4-513, 2007.
Rantanen, M., Räisänen, J., Sinclair, V. A., and Lento, J.: The extratropical transition of Hurricane Ophelia (2017) as diagnosed with a generalized omega equation and vorticity equation, Tellus A, 72, 1721215, https://doi.org/10.1080/16000870.2020.1721215, 2020.
Sarro, G. and Evans, C.: An Updated Investigation of Post-Transformation Intensity, Structural, and Duration Extremes for Extratropically Transitioning North Atlantic Tropical Cyclones, Mon. Weather Rev., 150, 2911–2933, https://doi.org/10.1175/MWR-D-22-0088.1, 2022.
Schade, L. R. and Emanuel, K. A.: The Ocean's Effect on the Intensity of Tropical Cyclones: Results from a Simple Coupled Atmosphere–Ocean Model, J. Atmos. Sci., 56, 642–651, https://doi.org/10.1175/1520-0469(1999)056<0642:TOSEOT>2.0.CO;2, 1999.
Schubert, M., Perlwitz, J., Blender, R., Fraedrich, K., and Lunkeit, F.: North Atlantic cyclones in CO2-induced warm climate simulations: frequency, intensity, and tracks, Clim. Dynam., 14, 827–838, https://doi.org/10.1007/s003820050258, 1998.
Scoccimarro, E., Fogli, P. G., Reed, K. A., Gualdi, S., Masina, S., and Navarra, A.: Tropical Cyclone Interaction with the Ocean: The Role of High-Frequency (Subdaily) Coupled Processes, J. Climate, 30, 145–162, https://doi.org/10.1175/JCLI-D-16-0292.1, 2017.
Serreze, M. C., Barrett, A. P., Stroeve, J. C., Kindig, D. N., and Holland, M. M.: The emergence of surface-based Arctic amplification, The Cryosphere, 3, 11–19, https://doi.org/10.5194/tc-3-11-2009, 2009.
Studholme, J., Hodges, K. I., and Brierley, C. M.: Objective determination of the extratropical transition of tropical cyclones in the Northern Hemisphere, Tellus A, 67, 24474, https://doi.org/10.3402/tellusa.v67.24474, 2015.
Studholme, J., Fedorov, A. V., Gulev, S. K., Emanuel, K., and Hodges, K.: Poleward expansion of tropical cyclone latitudes in warming climates, Nat. Geosci., 15, 14–28, https://doi.org/10.1038/s41561-021-00859-1, 2022.
Wood, K. M. and Ritchie, E. A.: A 40-Year Climatology of Extratropical Transition in the Eastern North Pacific, J. Climate, 27, 5999–6015, https://doi.org/10.1175/JCLI-D-13-00645.1, 2014.
Zarzycki, C. M., Thatcher, D. R., and Jablonowski, C.: Objective tropical cyclone extratropical transition detection in high-resolution reanalysis and climate model data, J. Adv. Model. Earth Sy., 9, 130–148, https://doi.org/10.1002/2016MS000775, 2017.