the Creative Commons Attribution 4.0 License.
the Creative Commons Attribution 4.0 License.
 | 27 Jun 2025
Environments and lifting mechanisms of cold-frontal convective cells during the warm season in Germany
Stephan Pfahl
Lisa Schielicke
Convection often initiates in proximity to cold fronts during the warm season, but how various processes favour convective initiation at different regions relative to the front is still not well-understood. By combining automatic front detection methods and a convective-cell tracking and detection dataset, the environments and availability of different lifting mechanisms are analysed. Our results indicate that pre-surface-frontal cells form in the environments with the highest surface dew points and convective available potential energy (CAPE). Behind the surface front, cells form in environments with lower CAPE and surface dew points, though they are still significantly higher than regions without cells. Mid-level relative humidity discriminates particularly well between post-frontal cell locations and regions without cells. Pre-surface-frontal cells form in environments with the strongest synoptic-scale lifting at 700 hPa and also with the strongest convective inhibition. We also observe the importance of post-frontal synoptic-scale lifting, particularly at 500 hPa. Observational sunshine duration data indicate less sunshine before cell initiation compared to regions without cells in most front-relative regions, which highlights that solar heating may not be responsible for the majority of cold-frontal cell initiation. The results in this study are an important step towards a deeper understanding of the drivers of cold-frontal convection at different regions relative to the front.
- Article
(3670 KB) - Full-text XML
-
Supplement
(1461 KB) - BibTeX
- EndNote


What exactly drives convective cells to develop in time and space is not currently well-understood. There has been improvement in recent times in the representation of convective initiation in numerical models, primarily due to convection-permitting models (CPMs) at increased resolution. However, biases regarding the positioning, timing and intensity of convection still remain (e.g. Kain et al., 2008; Klasa et al., 2018). What is clear is the necessity of three primary ingredients for facilitating deep moist convection: moisture, lift and instability (Doswell et al., 1996). Vertical wind shear is also required to allow for convective-storm organisation (Markowski and Richardson, 2010). Moisture, instability and wind shear can be directly measured in the storm's environment using vertical profiles. Traditionally, this was done using observational proximity soundings (e.g. Brooks et al., 1994; Púčik et al., 2015; Kolendowicz et al., 2017; Taszarek et al., 2017). However, the advent of ERA5 reanalysis data on a global scale with a spatial and temporal resolution of 0.25° and 1 h, respectively, has enabled more localised studies where observational soundings are lacking (e.g. Taszarek et al., 2020; Calvo-Sancho et al., 2022; Poręba et al., 2022; León-Cruz et al., 2023). The precursor, ERA-Interim, also allowed for the analysis of convective-storm environments (e.g. Taszarek et al., 2018), albeit at a coarser spatial and time resolution.
Most previous studies have sought to better understand the environments in which convective storms form by analysing quantities such as mid- and low-level moisture, instability, and wind shear. However, few studies have analysed the availability of individual lifting mechanisms. Determining whether air parcels will be lifted to their level of free convection (LFC) is essential for convective initiation and is often difficult to forecast. It is worth mentioning that moist air parcels reaching their LFC is not a guarantee of deep moist convection due to the possibility of entrainment (Morrison et al., 2022). Anticipating the spatiotemporal onset of convective cells is also essential for the accurate prediction of convective hazards such as hail, strong winds and tornadoes. This is because if parcels are not lifted to their LFC and thus no convective available potential energy (CAPE) is released, then there is no convective cell and no possibility of severe convective storms (SCSs). This is regardless of whether there is a seemingly favourable environment for SCSs (e.g. high CAPE and high vertical wind shear). Indeed, warm-season forecast failures for severe convective storms are often related to difficulties in anticipating convective initiation (Markowski and Richardson, 2010). Despite this, the environments in which SCSs form have arguably attracted more attention in previous literature than convective initiation.
Individual lifting (triggering) mechanisms such as sea breezes, orography, outflow boundaries and quasi-geostrophic (QG) forcing for ascent cannot be directly sampled in environmental vertical profiles. The latter is thought to be particularly relevant in proximity to cold fronts. QG forcing for ascent or descent (i.e. synoptic-scale lifting or descent) is typically of the order of centimetres per second. For this reason, it is unlikely sufficient to allow air parcels to reach their LFC (Chap. 5.2 in Trapp, 2013). Nevertheless, mesoscale ascent at frontal boundaries can be an order of magnitude larger (e.g. Sanders, 1955; Koch, 1984) and synoptic-scale ascent can still steepen lapse rates due to adiabatic cooling and thus increase CAPE (Fig. 5.2 in Trapp, 2013). Previous literature has alluded to the role of solar heating combined with frontal lift in ultimately determining where and when convection occurs at cold fronts (e.g. Doswell, 2001). Behind the front, where there is generally synoptic-scale descending motion, solar heating seems to carry more importance (e.g. Weusthoff and Hauf, 2008; Pacey et al., 2023). However, when convection occurs the synoptic-scale descent may be weaker than climatology or more localised areas of ascending motion may aid the development of convective cells. Due to the weaker horizontal temperature gradients, synoptic-scale lifting is typically weaker during the warm season. The literature would benefit from studies quantifying the relevance of synoptic-scale lifting at different regions relative to the front, especially during the warm season. Topography can also influence cell initiation in proximity to cold fronts. Convergence zones due to flow splitting and channelling were observed during the Convective and Orographically-induced Precipitation Study (COPS) in south-western Germany and eastern France (Wulfmeyer et al., 2011). Topographic influences are not addressed in this study as they were already briefly explored in Pacey et al. (2023). The study showed that while overall in Germany cells are most frequent in southern Germany close to higher elevation, post-frontal cells are most frequent in north-western Germany near the coast. Finally, vertical wind shear may positively or negatively affect the transition from shallow to deep convection (Peters et al., 2022). Moist updraughts in sheared environments have been shown in simulations to have lower terminus heights than their non-sheared counterparts (e.g. Peters et al., 2019). On the other hand, updraughts are typically wider in sheared environments and so may be less susceptible to entrainment.
In this study, individual lifting mechanisms such as solar heating and quasi-geostrophic forcing for ascent as well as the environments of cold-frontal convective cells are analysed. Here, a special focus is placed on the variation in the environment and lifting mechanisms depending on the region relative to the front. Pacey et al. (2023) already showed large differences in the cell frequency and characteristics depending on the cell location relative to the front in Germany. Namely, cells are much more frequently pre-surface-frontal than post-frontal. Furthermore, pre-surface-frontal cells are most likely to be associated with 55 dBZ convective cores. In this study, we also seek to better understand the differences observed in the climatology of Pacey et al. (2023) by delving into the environments and lifting mechanisms of cold-frontal convective cells. Rather than only focusing on convective-cell environments (i.e. ERA5 grid points associated with convective cells), grid points not associated with convective cells are also considered. This allows for analysis of how well certain variables can distinguish between grid points where convective cells did and did not develop. The separation into categories will be explained in Sect. 2.3. The primary research questions addressed in this study are as follows:
- Q1
How do convective-cell environments vary across the front?
- Q2
What is the relevance of quasi-geostrophic forcing for ascent (descent) and solar heating at different regions relative to the front?
- Q3
By analysing the environments and lifting mechanisms, can we explain the cell frequency at different front-relative regions?
This paper is organised as follows. Section 2 introduces the datasets and methods used in this study. Section 3 performs a statistical comparison of the environments and lifting mechanisms of convective cells depending on the region relative to the front. Section 4 puts the results in the context of the cell frequency at different front-relative regions (as shown in Pacey et al., 2023).
A convective-cell detection and tracking dataset (KONRAD, KONvektionsentwicklung in RADarprodukten; Wapler and James, 2015) and ERA5 data (Hersbach et al., 2020) are combined between 2007 and 2016 for the months April–September in the German radar domain. An automatic front detection algorithm is applied to ERA5 (Sect. 2.1) to build a time series of cold fronts. Cell environments and lifting mechanisms are analysed not only using ERA5 data but also using sunshine duration station data (Sect. 2.4.3). To understand the differences in the environment and lifting mechanisms at different regions relative to the front, the distance in kilometres between the front and ERA5 grid points is derived. Grid points on the warm and cold side of the front are assigned a positive and negative distance, respectively.
2.1 Front detection
Since the same methodology is used to detect fronts as described in Pacey et al. (2023) (their Sect. 2.1), the methods are only briefly reintroduced here. The front detection method is based on the thermal front parameter (TFP) equation.
The TFP denotes the rate of change in a thermodynamic variable (τ; e.g. potential temperature or equivalent potential temperature) projected in the thermal gradient's direction.
A projection of the horizontal wind (v) onto the frontal line is enabled using Eq. (2) (Hewson, 1998).
The term vf is the horizontal wind (v) projected in the direction of the TFP gradient. The criteria used to detect cold fronts in this study are summarised below:
The equivalent potential temperature is denoted by θe and the along-front length by L. The overlap of the θe gradient threshold (condition 1A) and velocity threshold (condition 1B) is the front contour. As in Pacey et al. (2023), only synoptic fronts (∼ 1000 km) are of interest. Therefore, fronts with an along-front length (L) less than 1000 km are not included in the analysis (condition 1C). The frontal line is identified at the maximum of the equivalent potential temperature gradient by applying the following condition:
The latitude and longitude of where TFP = 0 is determined using interpolation. The distance between each adjacent point is calculated and summed across the whole line to give the front length (L). The four aforementioned criteria are applied to smoothed θe and horizontal wind fields at 700 hPa in ERA5. A smoothing function is applied to the fields, whereby the nearest four neighbours of a grid point are averaged. The process is repeated 30 times to remove any local-scale features. There is no universal approach to select the degree of smoothing since it is dataset dependent. Here, it was chosen subjectively by varying the degree of smoothing for different case studies and ensuring only synoptic-scale air mass boundaries remained. The fronts are detected on the 700 hPa pressure level to avoid interaction with orography, which is a common issue in central Europe (Sect. 4.4 in Jenkner et al., 2010). Furthermore, the 700 hPa level is further above the turbulent boundary layer.
The thresholds (conditions 1A, 1B and 1C) are stricter than some previous studies. For example, Schemm et al. (2016) tested 300 and 500 km front length criteria. Looser thresholds may increase the number of erroneously detected fronts. On the other hand, higher thresholds generally reduce the number of fronts in the dataset but limit the dataset to synoptic-scale cold fronts. Overall, a dataset with a lower front count and higher percentage of correctly detected fronts is prioritised. Cold fronts are detected in a subsection of the European domain ([40–70° N and 20° W–20° E]). Examples of the detected cold-frontal lines in Germany are shown in Fig. 1. A total of four time steps are shown across different days and years.
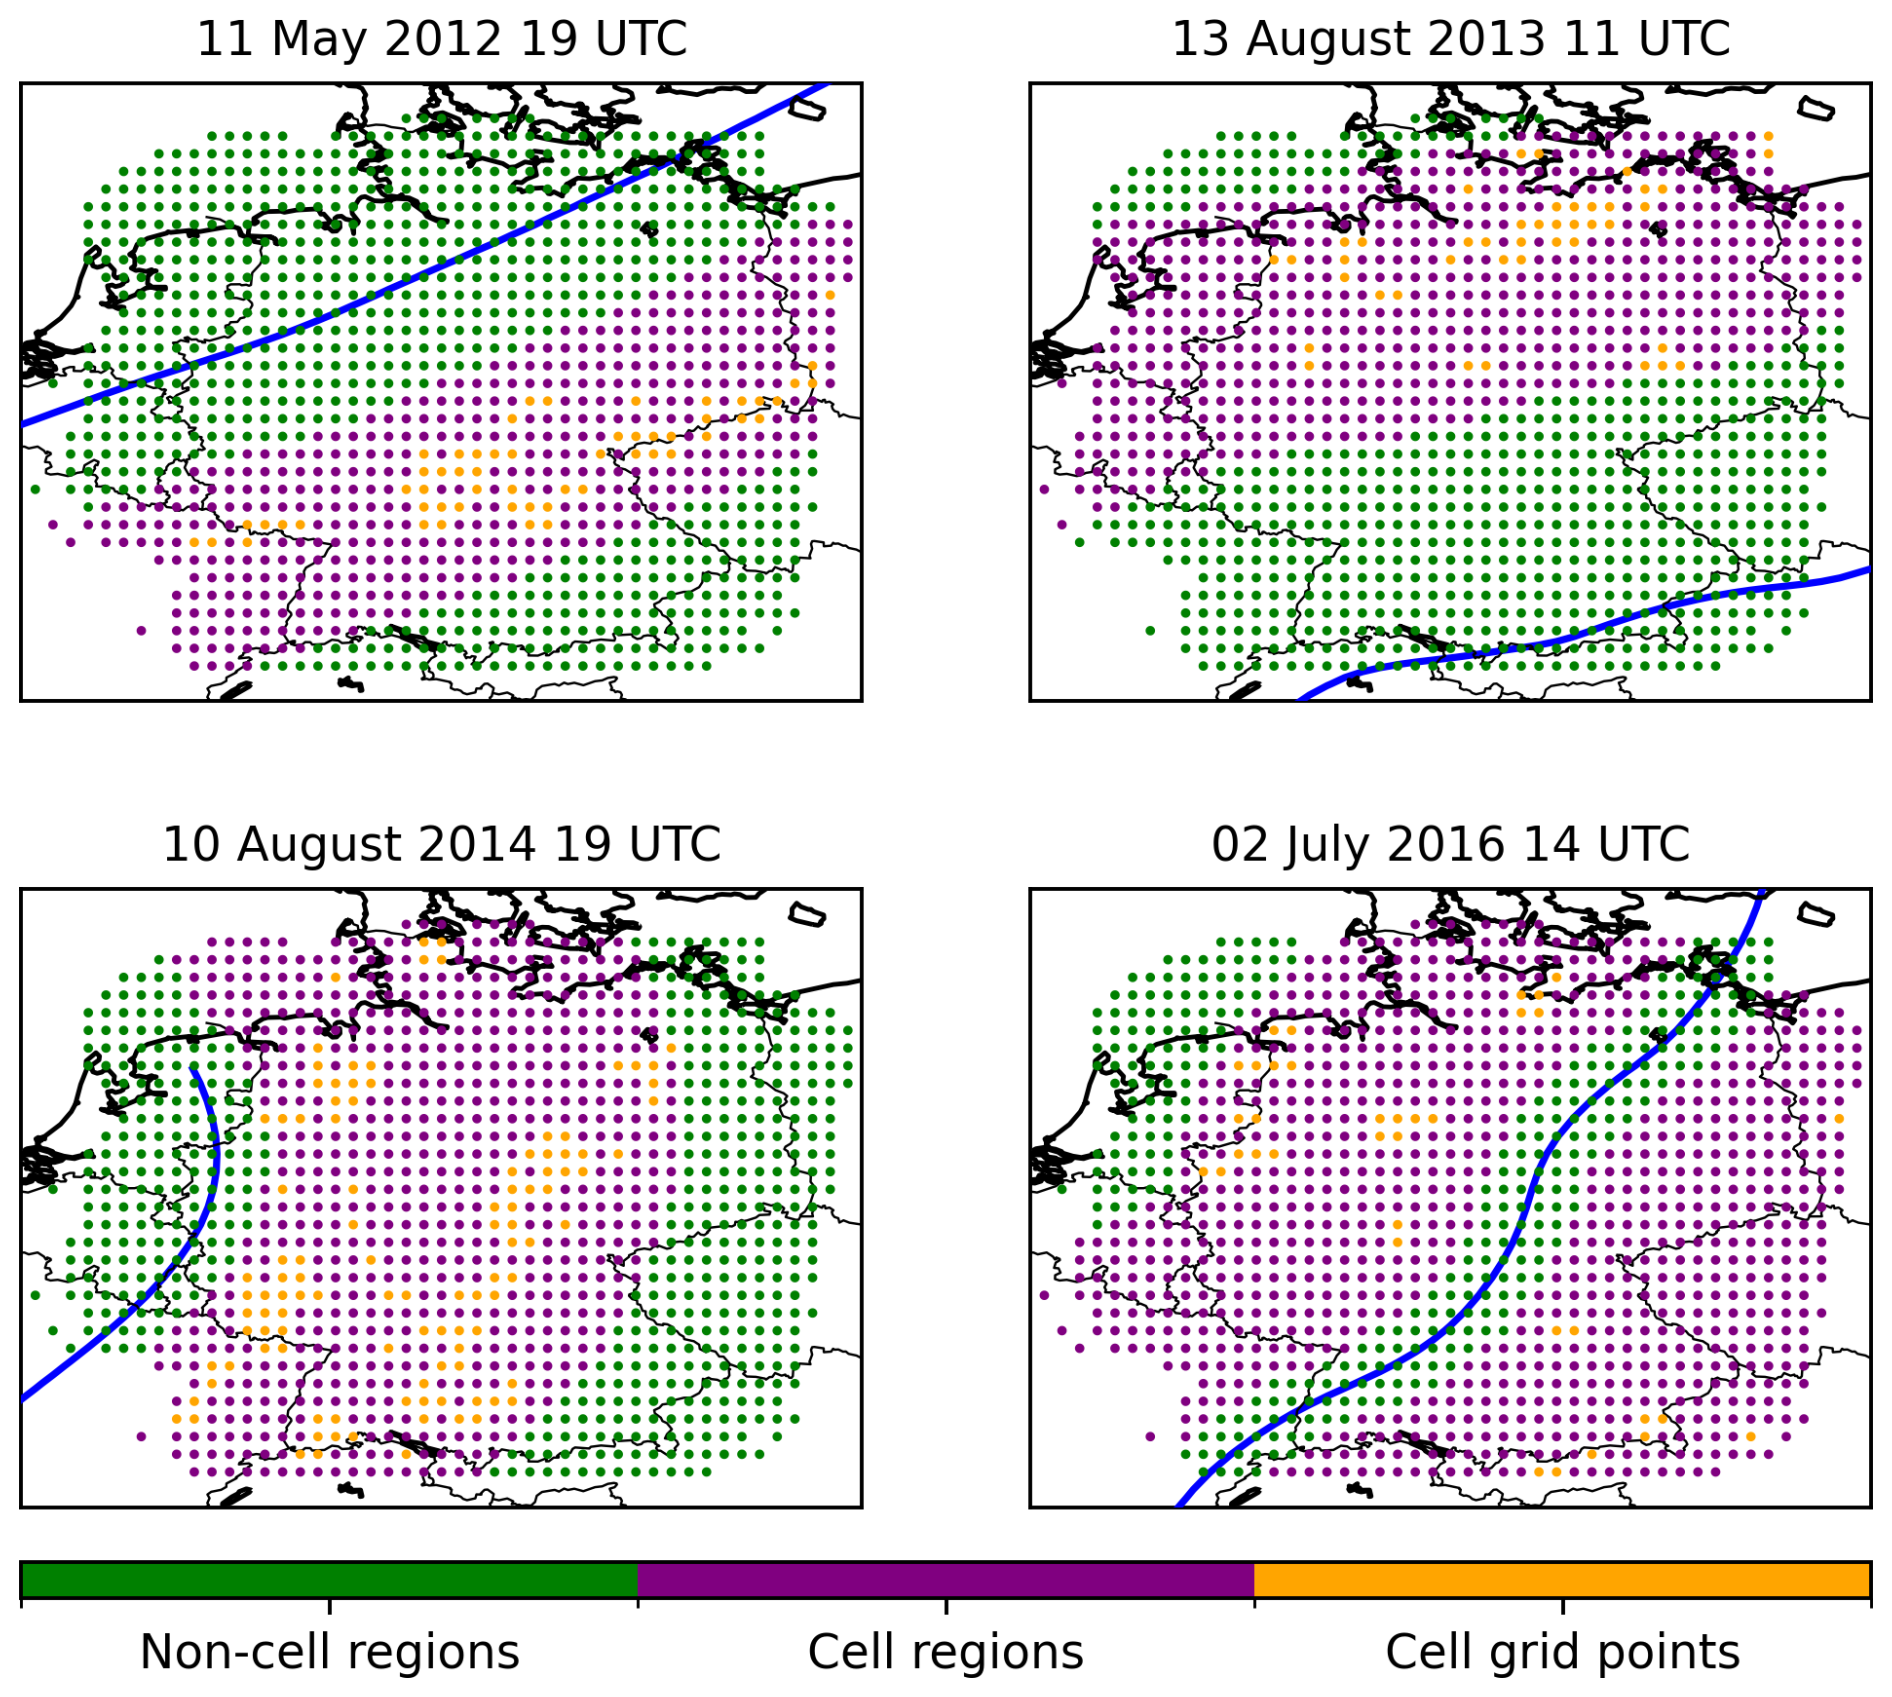
Figure 1Visualisation of how cell grid points (yellow), cell regions (purple) and non-cell regions (green) are defined for four time steps on different days. The 700 hPa frontal line is shown by the blue line and was detected using the methods defined in Sect. 2.1.
Surface front relative to the 700 hPa front
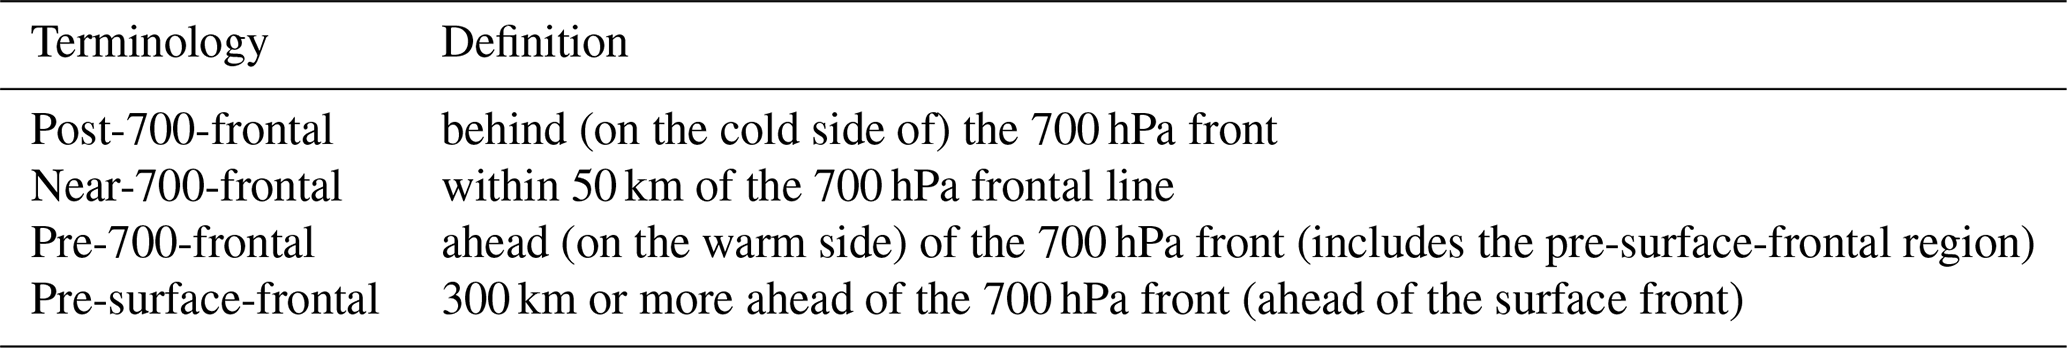
Due to the rearward slope of cold fronts with height, using a single pressure level to detect fronts (700 hPa in this case) requires some special consideration. The 700 hPa level is approximately 3 km above the surface, and cold fronts have a mean slope of ∼ 1:100 (Bott, 2023). This means that the surface front would be on average 300 km horizontally displaced ahead of the 700 hPa front. By taking an average of convergence over ERA5 grid points at different distances relative to the front, the maximum at the surface is indeed 300 km ahead of the 700 hPa front (Fig. 3 in Pacey et al., 2023). This supports the aforementioned geometry-based assumption. While the slope of the front and corresponding surface front location relative to the 700 hPa front are likely to vary per case study, we proceed assuming the climatological location of the surface front (hereafter surface front) is 300 km ahead of the 700 hPa front and use it as a reference point for this study. A full list of terminologies is shown in Table 1.
2.2 KONRAD convective-cell detection and tracking algorithm
KONRAD (KONvektionsentwicklung in RADarprodukten, convection evolution in radar products) is a convective-cell detection and tracking algorithm originally applied to 2D radar data in the German radar domain (Wapler and James, 2015). KONRAD is run operationally by the German Weather Service (DWD) with a spatial and time resolution of 1 km and 5 min, respectively. A convective cell is defined as an area with 15 px (condition 2A) or more exceeding 46 dBZ (condition 2B). As the spatial resolution of KONRAD is 1 km, 1 px is equal to 1 km2. The cell centre as well as the maximum north, south, west and east extent of the cell are provided. Further details are available in Pacey et al. (2023) (their Sect. 2.2). Unlike Pacey et al. (2023), additional definitions such as the number of pixels exceeding 55 dBZ, lightning strike count and mesocyclone intensity are not used in this study. Here, the convective-cell definition is solely based on the criteria below:
2.3 Defining non-cell regions, cell regions and cell grid points
Rather than solely focusing on where cells occurred (cell grid points), the surrounding regions are also assessed (cell regions), as well as regions where no cells occurred (non-cell regions). This comprehensive approach allows us to understand how well certain variables can distinguish between grid points where convective cells did and did not develop. First, cell grid points must be defined. The KONRAD dataset (Sect. 2.2) has a spatial and temporal resolution of 1 km and 5 min, respectively. ERA5 has a 0.25° spatial resolution and a 1-hourly temporal resolution, respectively. Spatially, ERA5 grid points within the maximum north, south, west and east extent of the cell area are labelled as convective-cell grid points. Taking into account the different spatial resolutions of the datasets and the fact that some cells are smaller than the ERA5 grid box size, the cell boundaries are extended by 0.125° in each direction. Applying this approach ensures that the area where the convection is occurring is labelled as a convective-cell grid point. Temporally, cells are associated with the time step before the first cell detection time. For example, a cell first detected between 14:00 and 14:59 UTC is assigned to the 14:00 UTC time step. This is to avoid sampling the post-convective environment, which is particularly important for thermodynamic variables such as convective available potential energy (CAPE).
To define the regions, bins are first created at different front-relative distances. Following the approach from Pacey et al. (2023), we only consider grid points within 750 km of the 700 hPa front. Using 100 km intervals there are a total of 15 bins. Each ERA5 grid point within 750 km of a 700 hPa front detected between 2007–2016 and April–September is associated with one of these bins. If a convective-cell grid point is present within one of the 100 km bins at the current time step but not at the given grid point, then this grid point is labelled a cell region. If no convective-cell grid point is present within the 100 km bin at the current time step, then this grid point is labelled a non-cell region. The number of grid points associated with each category at different distances from the front is shown in Fig. 2. The total number of grid points in each bin varies since pre-frontal regions occur more often than post-frontal ones in Germany. This can be explained by cold fronts reaching southern parts of Germany less frequently, which then allows for a larger number of post-frontal grid points to be sampled. Grid points in each category are visualised in Fig. 1 for four independent time steps. In the first example (Fig. 1a) most grid points are labelled non-cell regions (green). Cells were only detected in the 300–400 and 400–500 km bins; therefore most grid points in this region are labelled cell regions (purple). Grid points where convective cells occurred (cell grid points) are in yellow. Only time steps with cells occurring in proximity to the front are shown in Fig. 1; however time steps with no cells are also included in the analysis. In this case, all grid points would be assigned the non-cell region category (green).
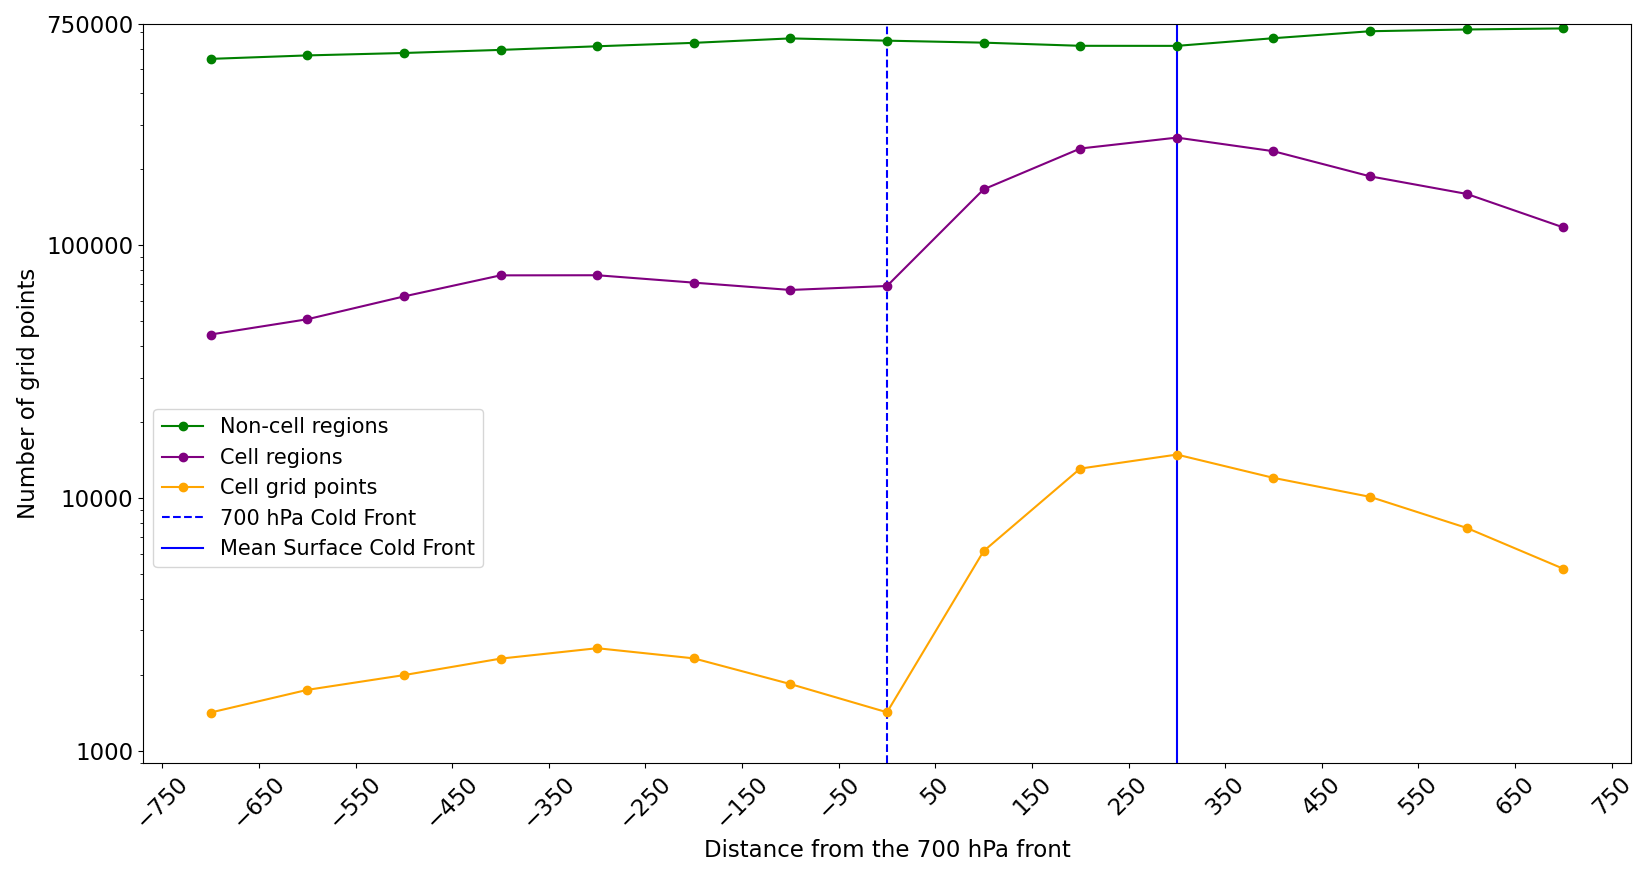
Figure 2Number of grid points in each category (non-cell regions, cell regions and cell grid points) depending on the distance from the 700 hPa front. Note the logarithmic y axis.
2.4 Variables
The variables analysed in this study broadly follow the ingredients-based methodology proposed by Doswell et al. (1996): moisture, lift and instability. Wind shear is also considered as it may also positively or negatively affect convective initiation (e.g. Peters et al., 2022) and is related to the organisation of convective cells (e.g. Markowski and Richardson, 2010). Large-scale and convective precipitation are analysed to see how ERA5 represents precipitation amounts across the front. A full list of the variables analysed in this study is shown in Table 2.
Table 2A list of variables analysed in this study and the associated level and dataset.
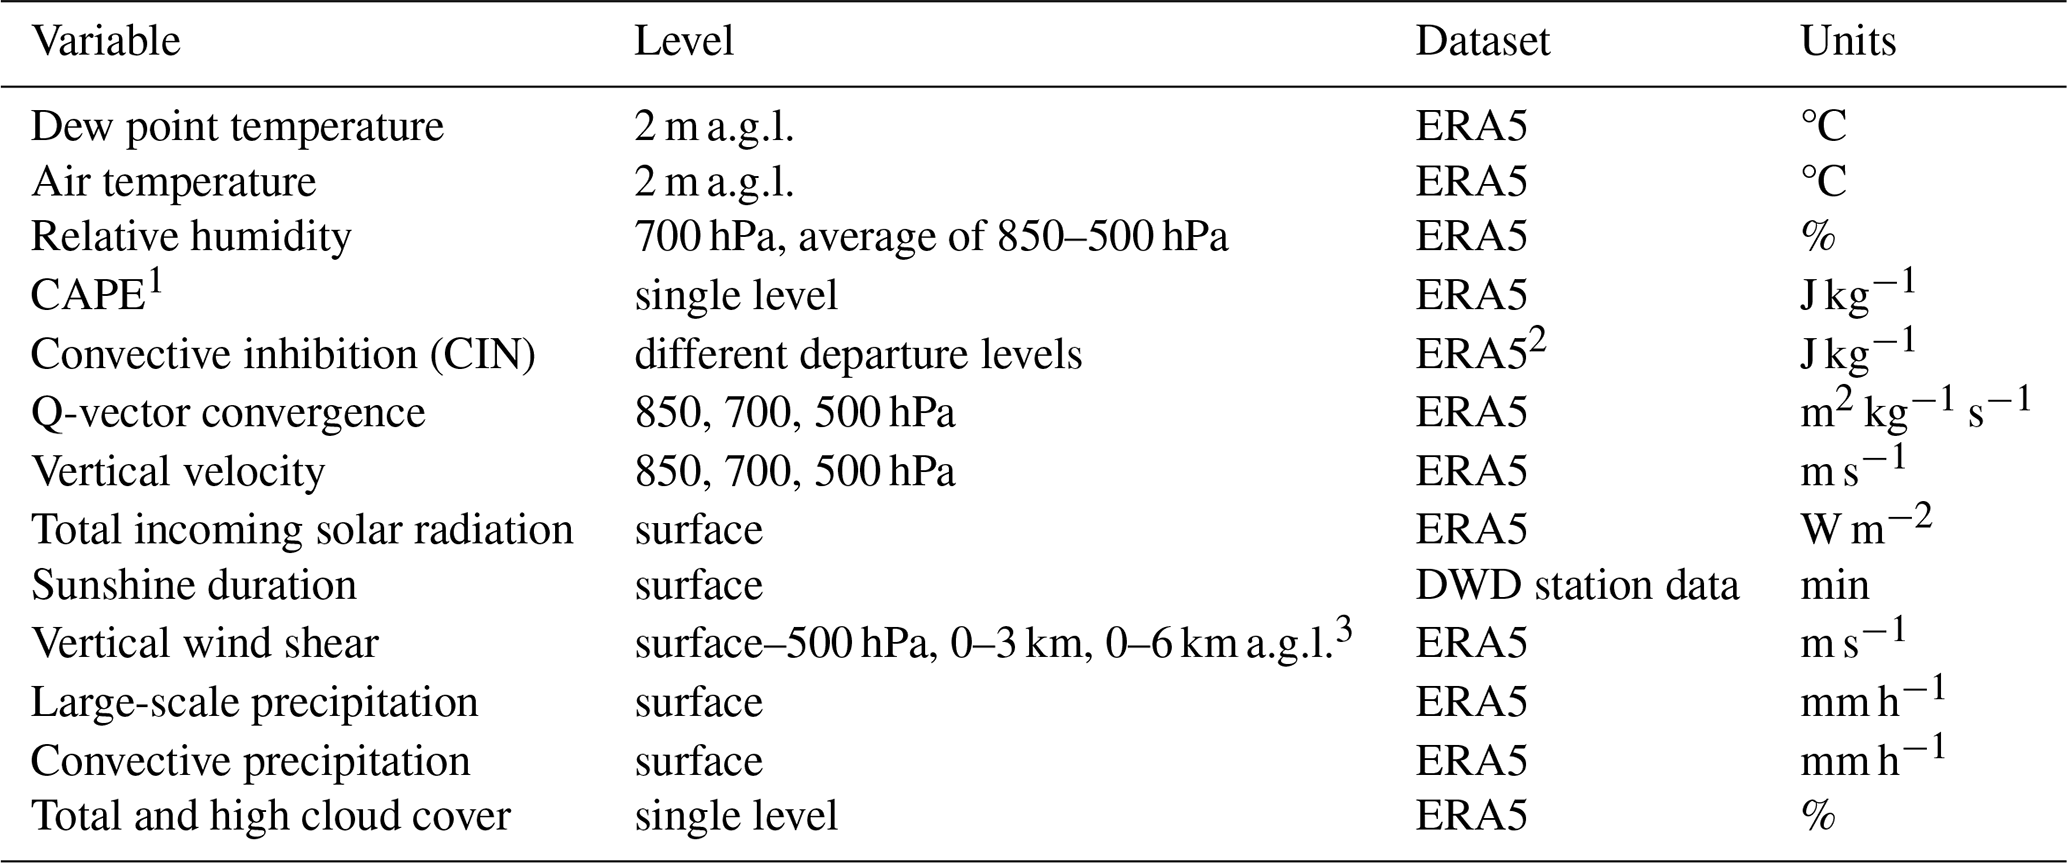
1 The ERA5 CAPE parameter downloaded from the Copernicus Climate Data Store (Hersbach et al., 2018) is used. CAPE is derived considering parcels departing from different model levels below the 350 hPa level, and the departure level with the highest CAPE is retained. In essence, the ERA5 CAPE parameter is the most unstable CAPE (MUCAPE). 2 The data source and methods to calculate CIN are shown in Sect. 2.4.1. 3 Above ground level (a.g.l.).
2.4.1 Convective inhibition dataset
The convective inhibition (CIN) parameter available from the Climate Data Store assigns a missing value if CIN exceeds 1000 J kg−1 or if there is no cloud base present (Hersbach et al., 2018). To ensure that a CIN value is present for all grid points, CIN is obtained from an alternative data source (thundeR, Taszarek et al., 2023). CIN is derived in thundeR using ERA5 model level data. Three model parcel departure levels are considered: most unstable CIN (MUCIN), mixed-layer CIN (MLCIN) and surface-based CIN (SBCIN). The CIN parameters are calculated by integrating negative parcel buoyancy between the parcel initialisation height and the LFC. The most unstable parcel refers to the parcel with the highest equivalent potential temperature between the surface and 3 km above ground level (a.g.l.). The mixed-layer parcel is calculated by averaging the potential temperature and mixing ratio between the surface and 500 m a.g.l. and initialising it from the surface. The surface-based parcel is the parcel nearest to the surface.
2.4.2 Q vectors
The quasi-geostrophic forcing for ascending and descending motion can be expressed using the Q-vector convergence derived from the quasi-geostrophic omega equation (Hoskins et al., 1978). Q vectors are derived using the Python package MetPy (May et al., 2022), which derives Q vectors in the following way (Eq. 3):
where Qi is the x component of the Q vector, Qj is the y component of the Q vector, R is the gas constant for dry air, σ is the static stability parameter, p is pressure, ug is the u component of geostrophic wind, vg is the v component of geostrophic wind and T is air temperature.
The u and v components of the geostrophic wind are derived from the geopotential height field. The geopotential height fields are first smoothed using a simple smoothing function, whereby the nearest four neighbours of a grid point are averaged. The process is repeated 50 times. The air temperature field (T) is also smoothed 50 times. The smoothing is required to filter out local-scale features to be left with the large-scale circulation. Smoothing values between 10 and 100 were tested, and 50 was selected as it showed a realistic and smooth frontal circulation with Q-vector convergence ahead of the front and divergence behind the front. With the smoothing of fields in Sect. 2.1, the choice is ultimately subjective and there is no universal approach to select the degree of smoothing.
The Q-vector convergence is analysed at three pressure levels. The 850 hPa level is the typical height of the boundary layer during the daytime and the location of the strongest capping inversion. Rising air parcels must overcome this inversion to reach the LFC. The 700 and 500 hPa levels are also analysed to understand the importance of mid-level quasi-geostrophic forcing for ascent. As discussed in the Introduction, mid-level synoptic-scale lifting can increase lapse rates and increase CAPE.
2.4.3 DWD sunshine hour station data
In Sect. 3.6 solar heating is analysed using total incoming solar radiation from ERA5. Observational sunshine duration data from the German Weather Service (DWD) are also analysed to see if the two datasets are in agreement. The data were downloaded from the Open Data Server (Kaspar et al., 2019). The 10 min station observations of sunshine duration Deutscher Wetterdienst, 2024 are used for the years 2010–2016 between 09:00 and 18:00 UTC. Only ERA5 grid points within 15 km of a DWD station are considered as solar radiation can vary on small spatial scales.
The environments and lifting mechanisms of cold-frontal cells are analysed at different regions relative to the front. A comparison is also made to cell regions and non-cell regions (see definitions in Sect. 2.3). The mean and median of each variable are taken across each 100 km front-relative bin for each category (i.e. cell grid points, cell regions and non-cell regions; Fig. 2). Plots with additional markers for the 25th and 75th quartiles of the distributions are shown in the Supplement.
3.1 Moisture
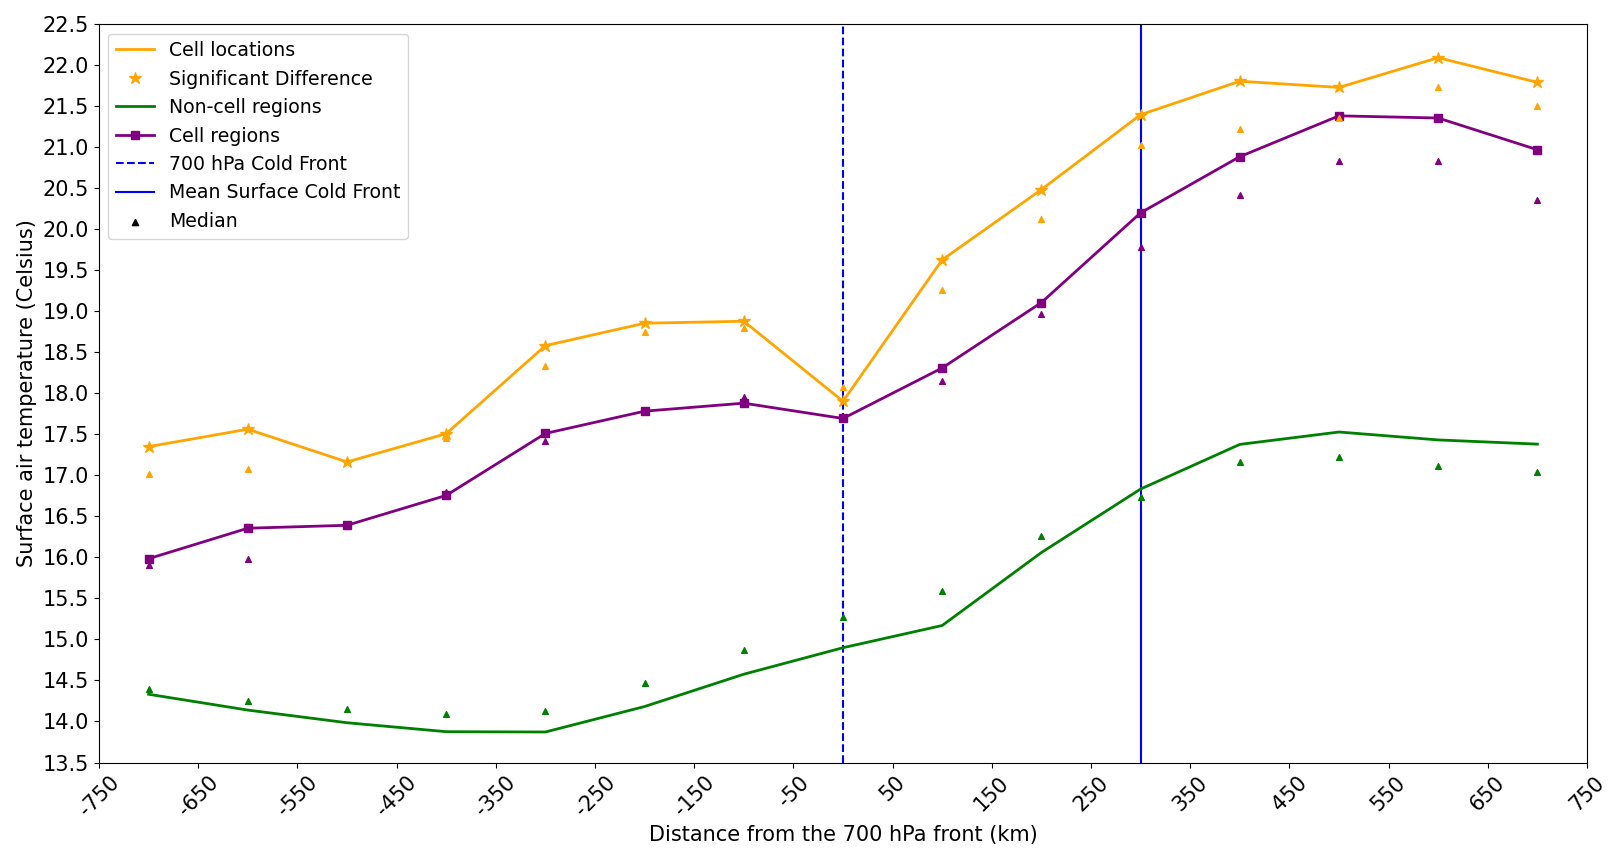
Surface dew points (2 m a.g.l. in this case) are a measure of moisture availability at the surface. While sufficient moisture directly at the surface is not essential for convective initiation since convection can be elevated (e.g. Corfidi et al., 2008), surface dew points are a tool commonly used by forecasters. Air with a lower dew point generally requires more lifting to reach the lifting condensation level (LCL). Figure 3 shows that pre-700-frontal cells develop in environments with a surface dew point of around 15–16 °C on average. Cells 450–550 km ahead of the 700 hPa front have the highest mean dew points. Post-700-frontal cells formed in environments with lower surface dew points ranging between 12 and 14 °C. Dew points at cell grid points are around 1 °C higher than at cell region grid points on average. The difference in the mean between cell grid points and non-cell region grid points is significant at all distances relative to the front. The difference between the cell grid point mean and non-cell region mean ranges between 3 and 4 °C. A similar result is found for the surface air temperature (Fig. A1).
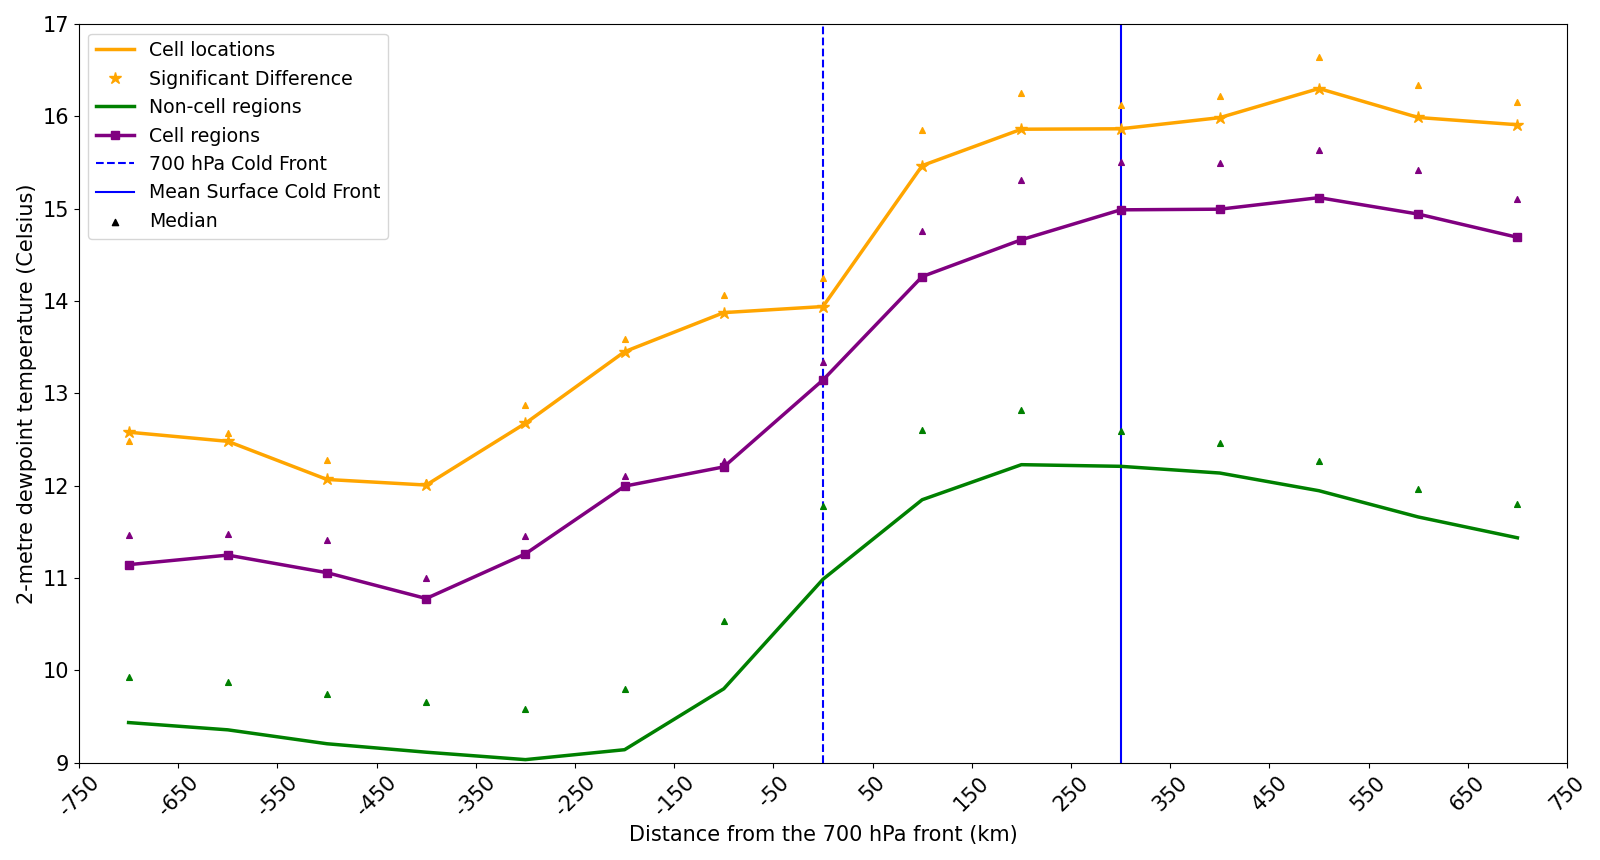
Figure 3The 2 m dew point temperature (Celsius) depending on distance from the 700 hPa front (km) for cell grid points (orange), cell region grid points (purple) and non-cell region grid points (green). Stars indicate that the convective-cell grid point mean is significantly different from the non-cell region grid point mean at the 95 % confidence level based on Welch's t test, which does not assume equal population variance. The triangle represents the median of each distribution. The dashed vertical line and solid vertical line represent the 700 hPa front and mean surface front location (see “Surface front relative to the 700 hPa front”), respectively.
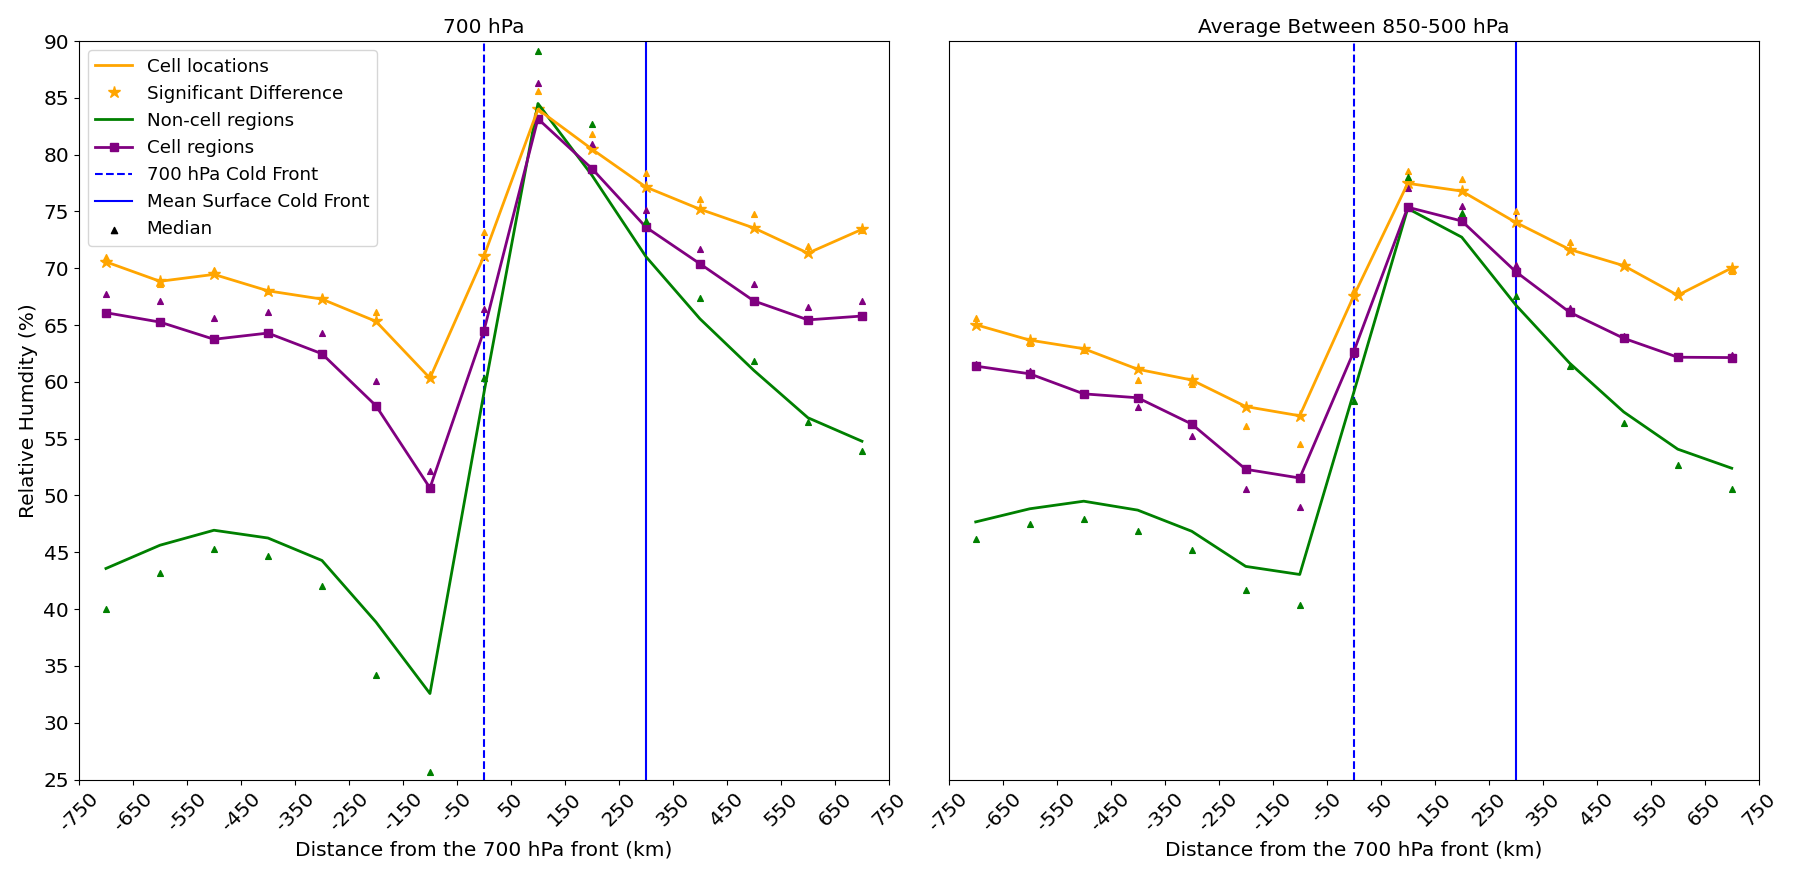
Mid-level moisture is also relevant to the initiation of deep moist convection since entrainment of dry environmental air can lead to updraught dilution, hence influencing updraught buoyancy. Recent work has shown that how susceptible the updraught is to dry environmental air is dependent on the updraught width below the LFC (Morrison et al., 2022). However, the updraught, which occurs on the storm scale, will not be looked at in this study. The relative humidity (RH) is analysed at 700 hPa (hereafter RH700) as parcels have typically already passed the LFC at this level, so entrainment is important in determining whether updraughts can reach upper levels of the atmosphere.
Cells form in environments with a mean RH700 of between 60 % and 70 % for the post-700-frontal and 70 %–85 % for the pre-700-frontal type (Fig. 4). Cells have the largest RH between 50 and 250 km ahead of the 700 hPa front, which is also the case for cell regions and non-cell regions. The RH700 at cell grid points is significantly higher than non-cell regions at all distances from the front except in the region 50–150 km ahead of the 700 hPa front. A larger difference exists between cell grid points and non-cell region grid points for the post-700-frontal (up to a 30 % difference) compared to the pre-700-frontal type (up to a 10 % difference). This indicates that a larger enhancement of RH700 humidity is required to facilitate the development of post-700-frontal cells. On the other hand, the warm sector typically has high mid-level moisture content. Excluding the 50–250 km region, cell regions have slightly lower RH than cell grid points but are above non-cell region grid points. These results are consistent with environment studies of lightning in Europe which found that lightning is less favourable when mid-level relative humidity is low (Westermayer et al., 2017) and that 75 % of lightning cases in Poland had an RH700 of 65 % or higher (Fig. 11 in Poręba et al., 2022). The average RH between 850 and 500 hPa (Fig. 4) shows a result very similar to RH700.
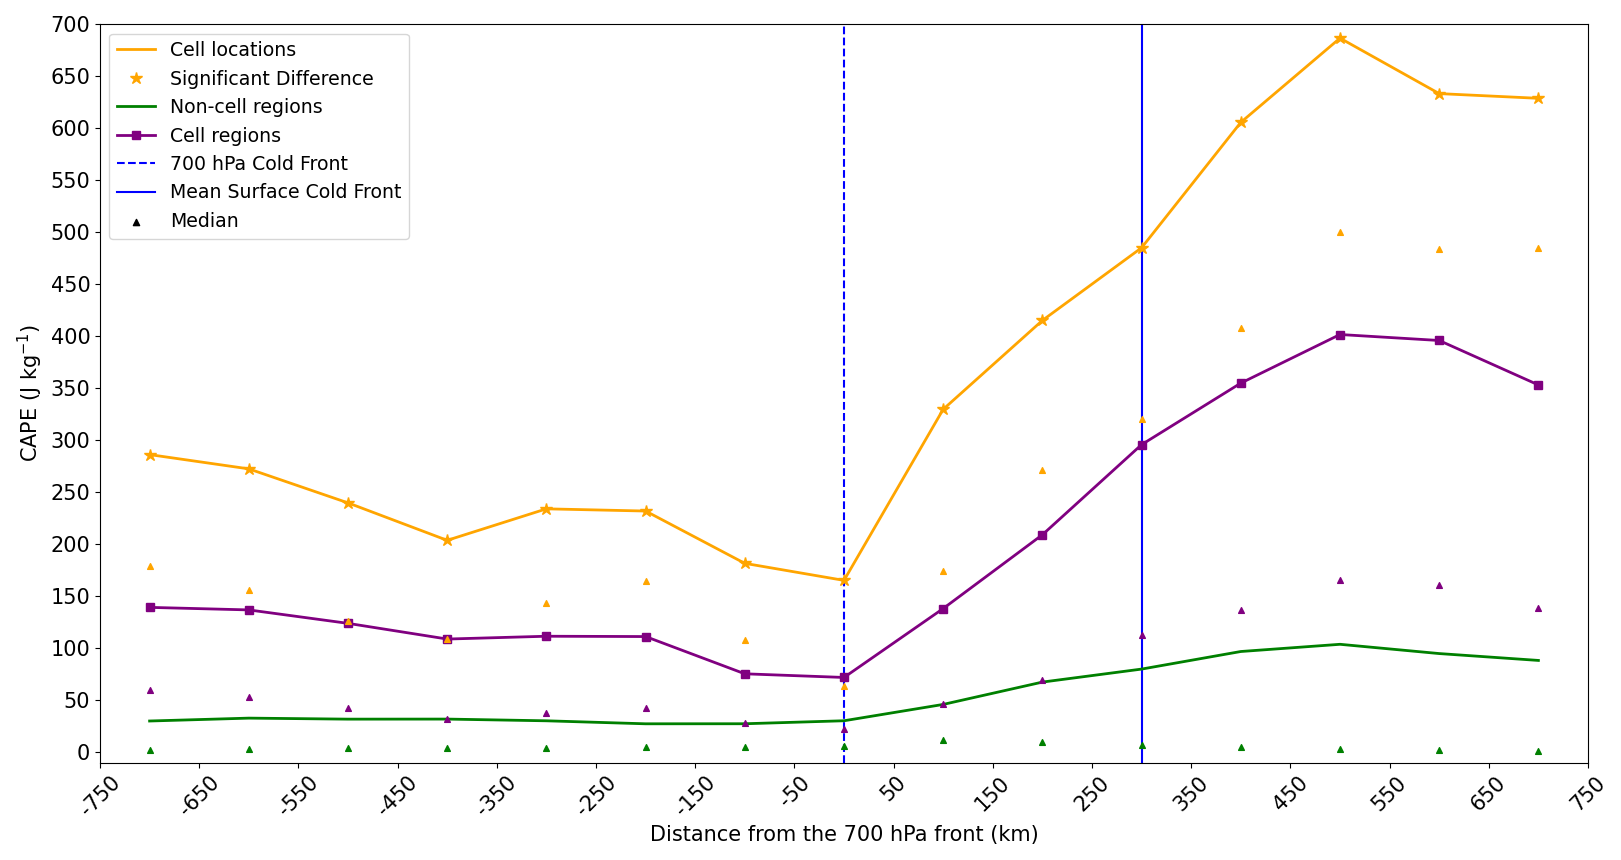
3.2 Instability
CAPE is a measure of atmospheric instability – a prerequisite for deep moist convection (Doswell et al., 1996). It is also a very commonly used parameter in severe convective-storm forecasting. Since there are numerous ways to derive CAPE, e.g. using different departures levels and (not) applying the virtual temperature correction (Doswell and Rasmussen, 1994), we do not compare our CAPE values with other studies. Rather we look at CAPE differences across the cold front using the same consistent definition of CAPE (MUCAPE; see the caption of Table 2). Figure 5 shows that pre-surface-frontal cells have the highest mean CAPE, up to around 650 J kg−1 450–550 km ahead of the 700 hPa front. In comparison, post-700-frontal cells occur in environments of lower CAPE, between 200 and 300 J kg−1 on average. The mean CAPE at convective-cell grid points is between 5 and 8 times higher than that of non-cell regions depending on the front-relative region and is significant at the 95 % confidence level. The difference between cell grid points and non-cell regions is a particularly large pre-surface-frontal instance. In the 650 and 750 km bin, the 25th percentile of cell grid points is around 170 J kg−1 higher than the 75th percentile of non-cell regions (Fig. S3 in the Supplement), indicating a large separation between the two distributions. Like the moisture variables the cell region means are between the non-cell region and cell grid point means.
3.3 Convective inhibition
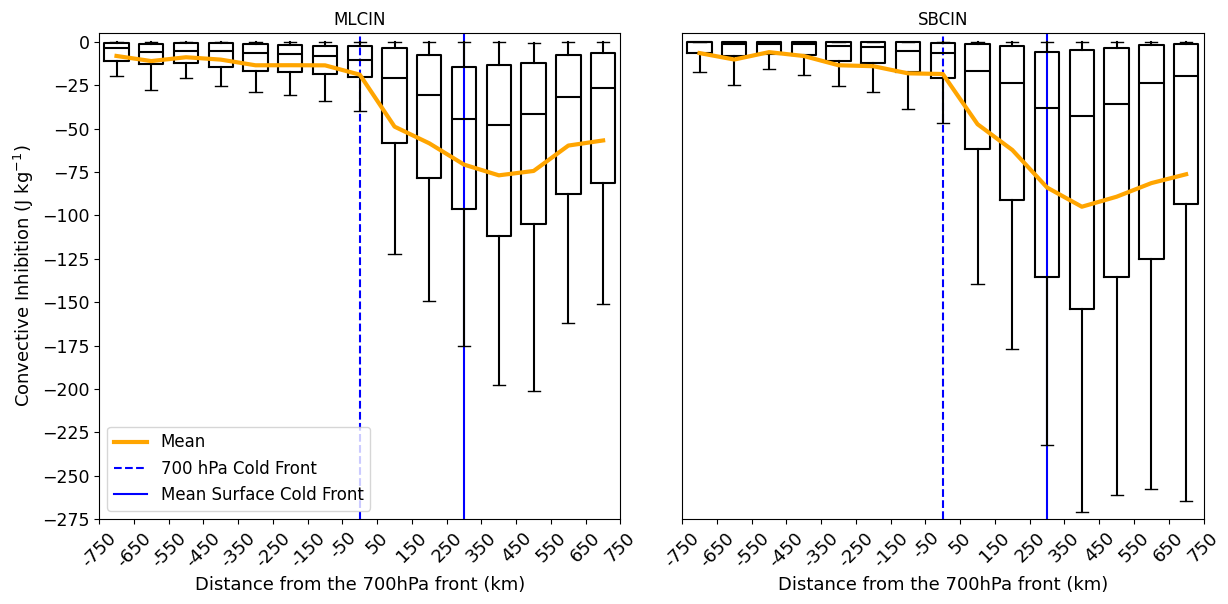
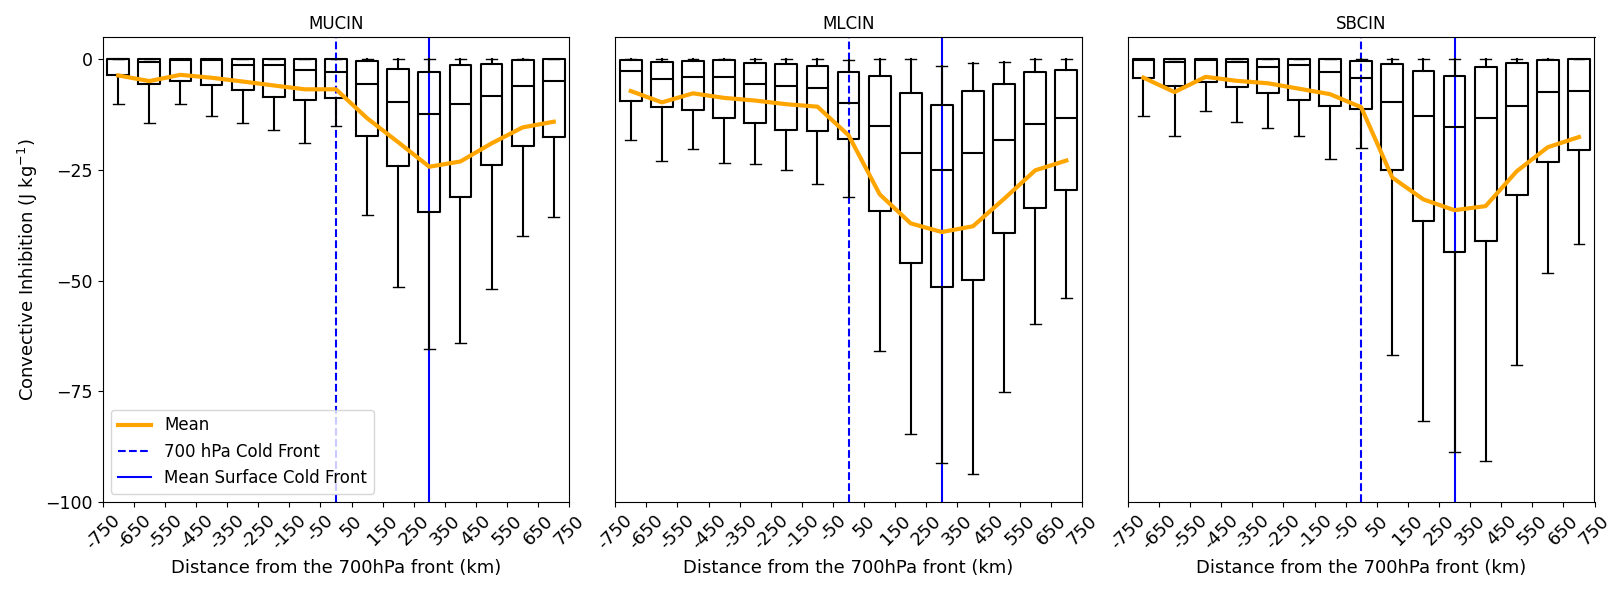
Environments with high convective inhibition (CIN) require stronger lifting so that parcels can reach their LFC. CIN is considered using parcels with different departure levels: most unstable parcel (MUCIN), mixed-layer parcel (MLCIN) and surface-based parcel (SBCIN). Only CIN at convective-cell grid points is available for analysis; the reader is referred to Sect. 2.4.1 for further details. Pre-surface-frontal cells form in environments with the strongest CIN with −38 J kg−1 of MUCIN on average (Fig. 6). Environments of post-700-frontal cells had weaker CIN in comparison. The same result applies for MLCIN and SBCIN, albeit with stronger CIN overall (Fig. A2). Therefore, more CIN must be overcome to initiate convective cells in the pre-surface-frontal region compared to the post-700-frontal region. However, the stronger pre-surface-frontal CIN may be advantageous for large CAPE build-up (see Fig. 5) since convection will not be initiated prematurely (Ludlam, 1980). MUCIN is weaker than MLCIN and SBCIN for pre-700-frontal cells, which could be explained by surface inversions (mostly at night and in the early morning) leading to stronger CIN for parcels departing closer to the surface. MUCIN, MLCIN and SBCIN are shown again using daytime cells only (09:00–18:00 UTC) (Fig. A3), showing that daytime post-700-frontal and pre-surface-frontal cells formed in environments with a mean of −5 and −20 J kg−1 of SBCIN, respectively. A similar result was found for MLCIN and MUCIN. While overall cells formed in environments with weaker CIN during the daytime, pre-surface-frontal cell environments still have stronger CIN than the post-700-frontal type during the daytime.
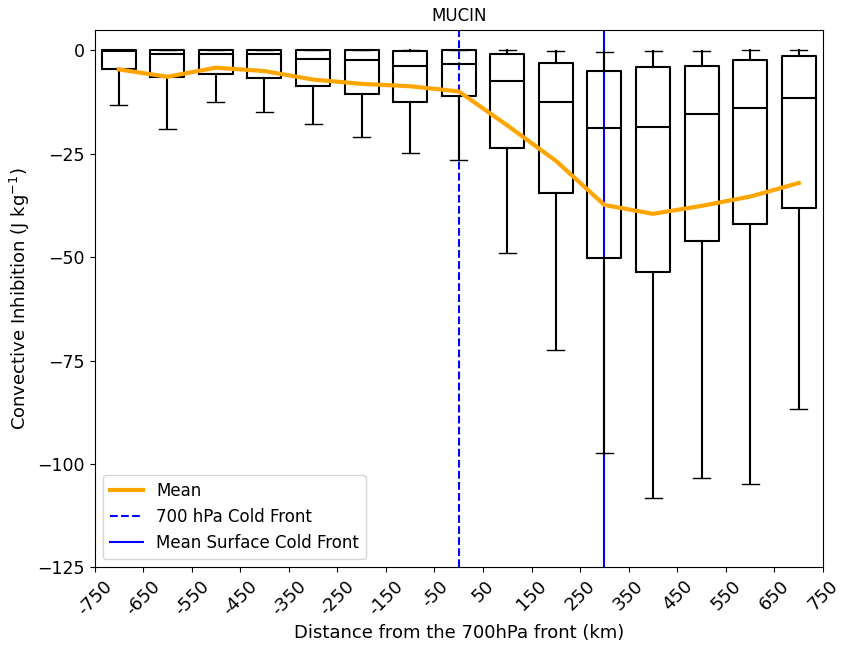
Figure 6Most unstable CIN (MUCIN) for convective-cell grid points only. The whiskers represent the 10th and 90th percentiles, the median is represented by the horizontal black line and the mean is represented by the orange line.
3.4 Quasi-geostrophic forcing for ascent
Q-vector convergence is a diagnostic commonly used by forecasters to highlight areas of geostrophic forcing for ascent or descent. Q vectors are derived from the quasi-geostrophic equations (Hoskins et al., 1978). The reader is referred to Sect. 2.4.2 for further details on how Q vectors are calculated and the choice of pressure levels. Figure 7 shows that cells near the surface front have the strongest convergence of the Q vector at 850 hPa (hereafter QVEC850). The strongest QVEC850 convergence of non-cell region grid points is at the mean surface front location. The strongest QVEC850 divergence, which is linked to descending motion, is the near-700-frontal type for all categories. However, for the near-700-frontal type the QVEC850 divergence is weaker at cell grid points compared to cell region grid points and non-cell regions. QVEC700 convergence shows a result similar to QVEC850 with slightly weaker mean convergence and divergence. The regions of strongest ascent and descent shift towards the left (cold side) of the plots with increasing height going from 850 to 500 hPa due to the rearward slope of cold fronts with height.
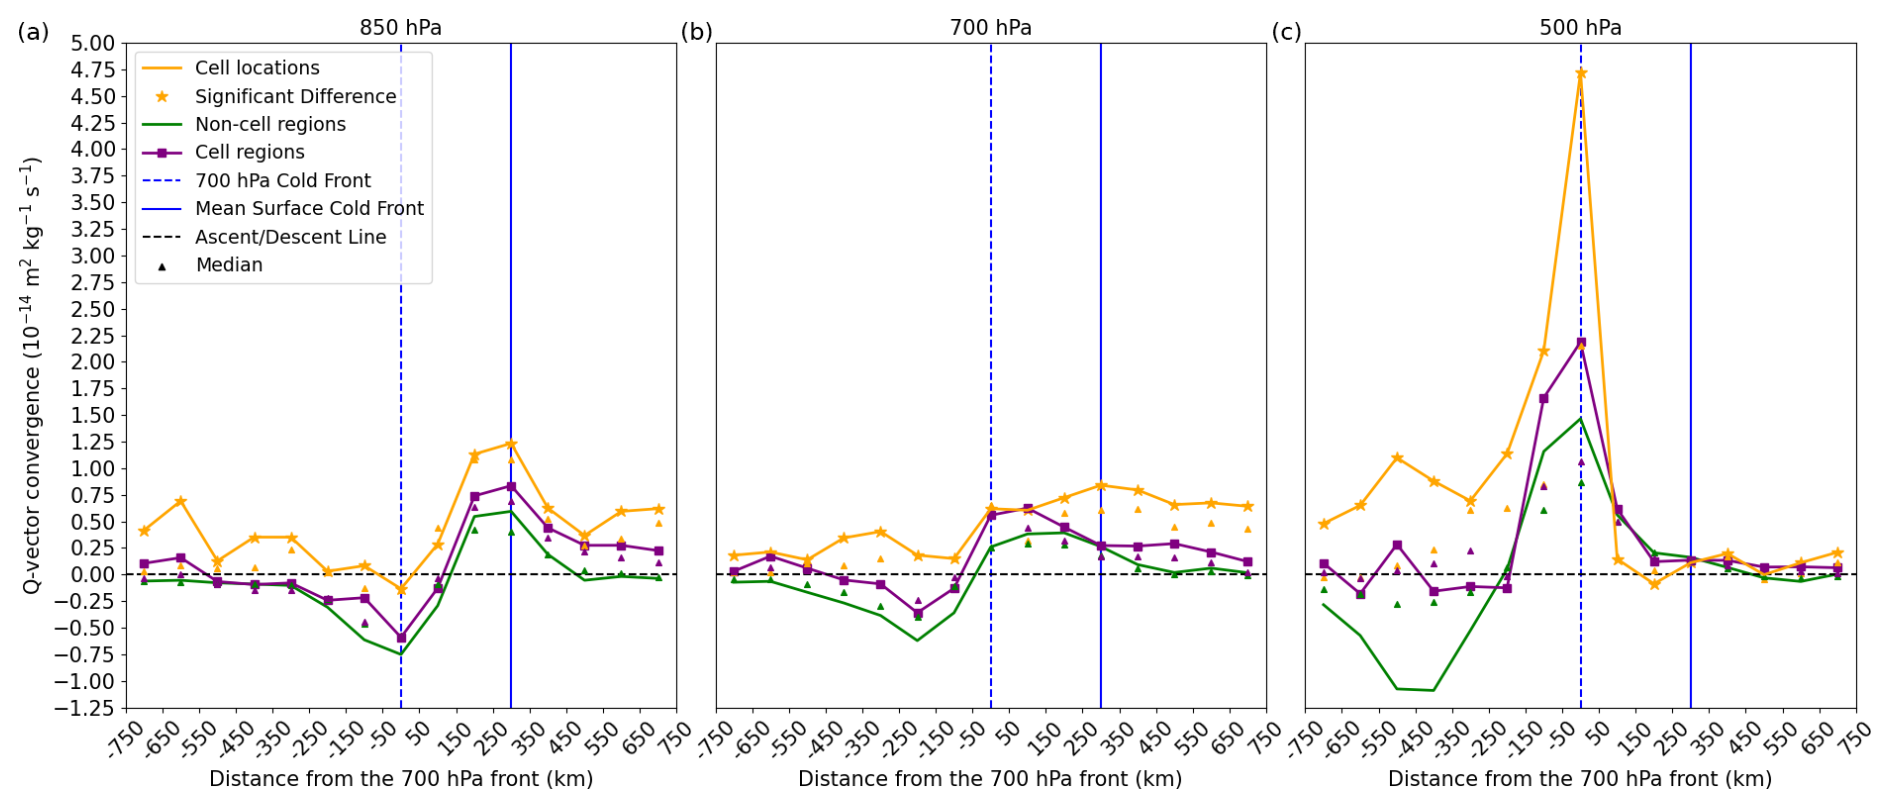
Q-vector convergence at 500 hPa (hereafter QVEC500 convergence) is strongest for the near-700-frontal type across all three categories (Fig. 7). QVEC500 convergence at cell grid points for the near-700-frontal type (−50 to 50 km) is over 3 times stronger compared to non-cell regions and around 5 times stronger compared to the maximum cell grid point means at 700 and 850 hPa. Non-cell regions for the post-700-frontal type have mean QVEC500 divergence, but cell regions and cell grid points have convergence of QVEC500. This result highlights the importance of upper-level forcing on the development of convective cells for the near-700-frontal and post-700-frontal type. The forcing for ascent could be linked to a post-frontal trough or may also act to destabilise upper layers and hence increase CAPE.
3.5 Vertical velocity
The vertical velocity at 850, 700 and 500 hPa is shown from left to right in Fig. 8. Like Q-vector convergence, the variable can be used to highlight areas of ascending and descending motion. However, the vertical velocity is not solely linked to vertical motion due to quasi-geostrophic forcing for ascent or descent. Additional sources of ascending motion such as areas of convection may also show a signal in the vertical velocity variable in ERA5. At all levels the cell region and non-cell region grid point means are similar to the Q vector in terms of where ascending and descending motion are present (Fig. 7). However, there is a difference at cell grid points as there is mean ascending motion at all locations relative to the front at all three vertical levels. The strong anomaly of the near-700-frontal type which was seen for QVEC500 convergence is not seen in the vertical velocity at 500 hPa. Ahead of the 700 hPa front, vertical motion is maximised at 500 hPa, which is consistent with observations of quasi-geostrophic vertical motion being maximised around 500 hPa (Holton and Hakim, 2013). The highest vertical velocity is at 500 hPa at cell grid points between the 700 hPa front and surface front (around 0.06–0.07 m s−1). This ascent rate is around 2 orders of magnitude lower than what has been seen in observations and numerical models of convective-cell updraughts (e.g. Weisman and Klemp, 1982). While the mean vertical velocity ascent rates are not representative of convective updraughts, it is possible that the parameterised convection could interact with the vertical velocity field. Once the convection parameterisation scheme is triggered, the convection may feed back on the vertical velocity field due to cloud formation and latent heat release (and hence further ascent). It is not trivial to disentangle the contribution of the background synoptic-scale lifting and contributions from convection on the vertical velocity. We will revisit this topic in Sect. 3.8.
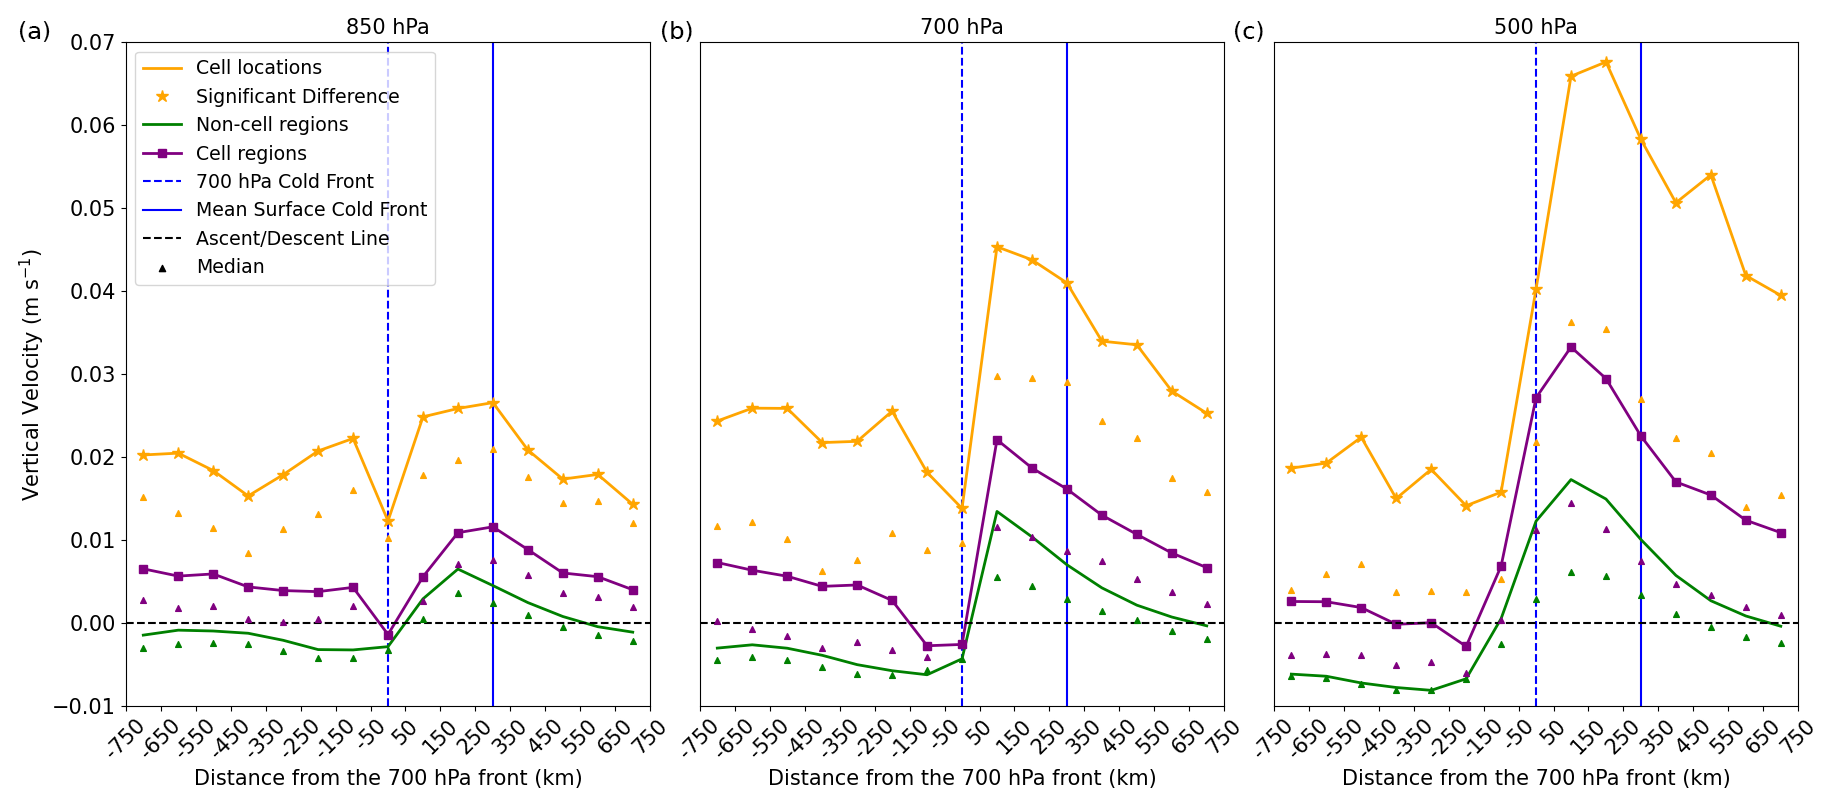
Figure 8As Fig. 3 but for vertical velocity at (a) 850, (b) 700, and (c) 500 hPa. Positive and negative values indicate ascending and descending motion, respectively.
At non-cell region grid points, the convective parameterisation scheme is less likely to be triggered, so this should primarily be vertical motion of the background flow. The non-cell region means suggest that the lifting from the front at 850, 700 and 500 hPa is typically maximised between the surface front and the 700 hPa front.
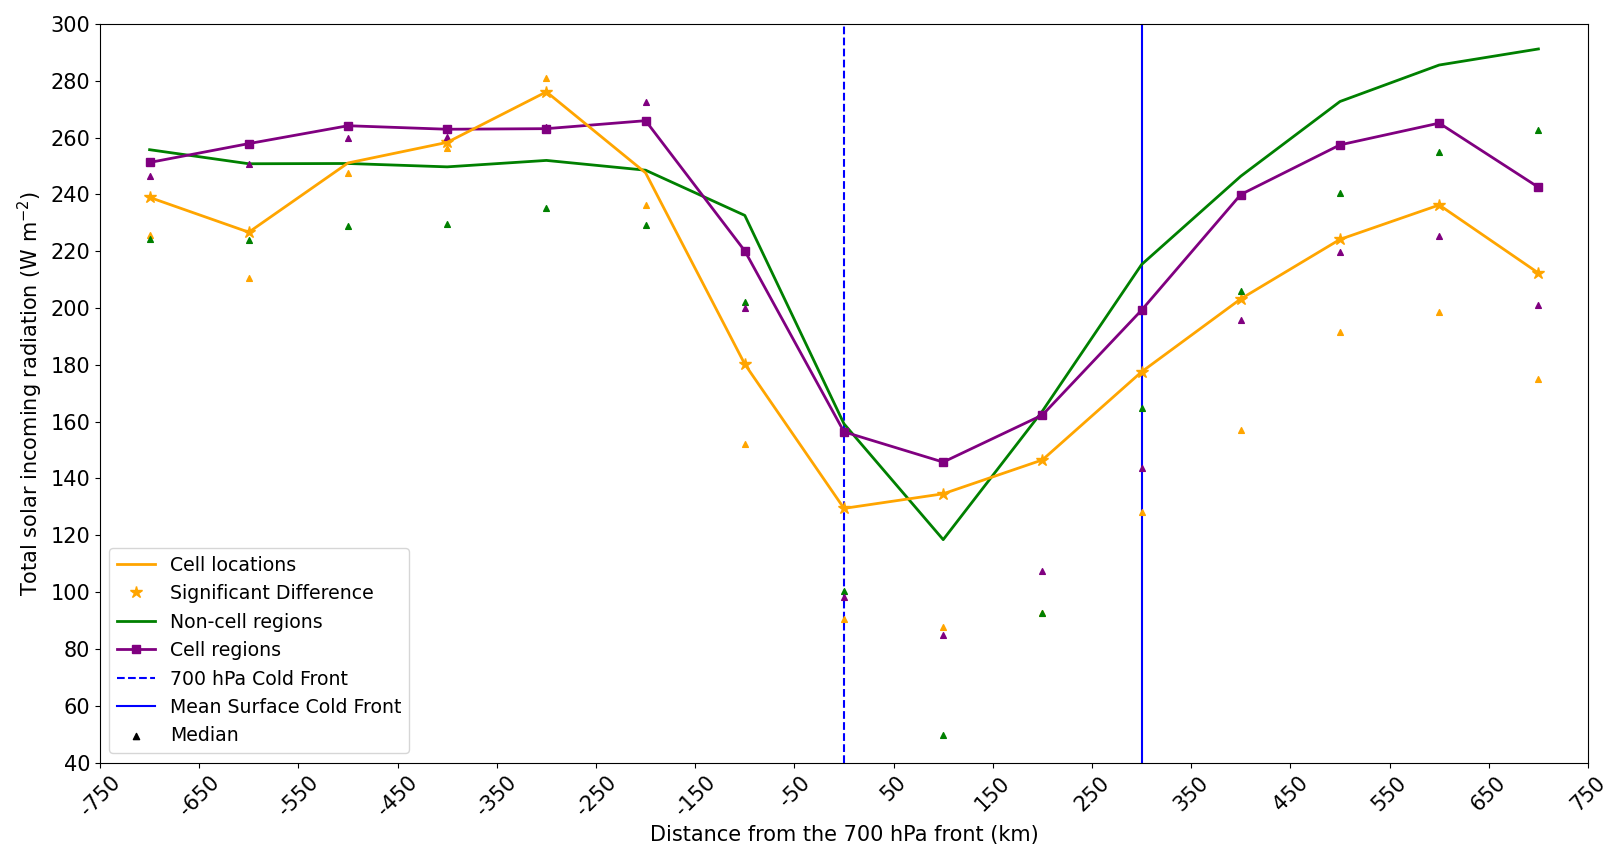
3.6 Solar heating
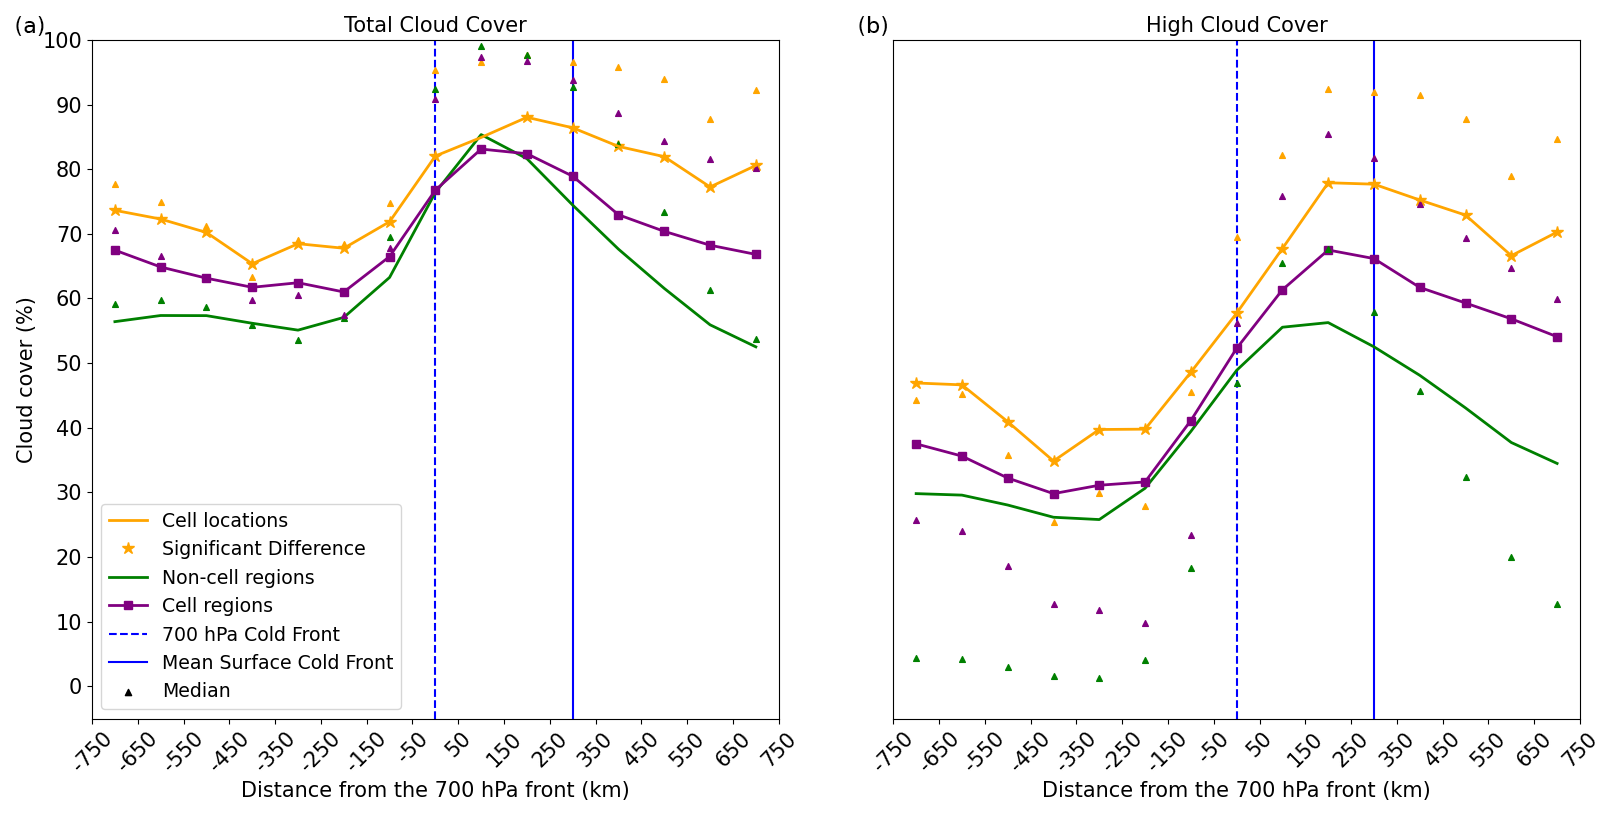
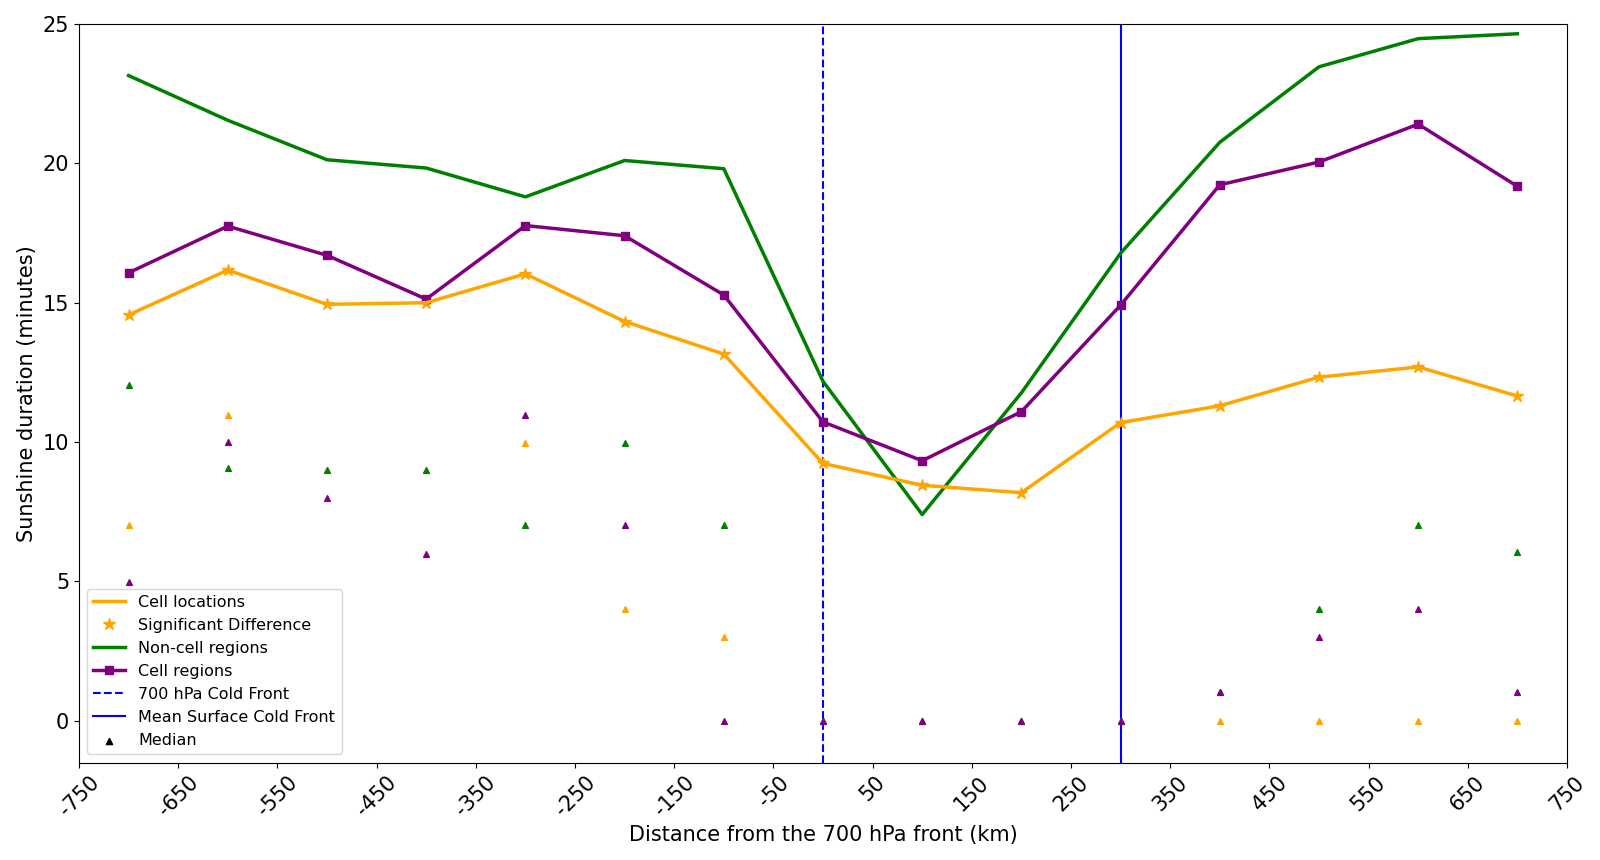
Solar heating (insolation) is linked to increased surface temperatures, which contributes towards atmospheric instability (Fig. 7.9c in Markowski and Richardson, 2010). Solar heating also gives parcels positive buoyancy near the surface, which can help parcels to be lifted to their LFC. The total incoming solar radiation (hereafter solar radiation) is shown in Fig. 9. Only time steps between 09:00 and 18:00 UTC are used since solar radiation is weaker during the early hours of the morning and the late evening and is not possible during the night. The variable refers to the radiation accumulated during the hour prior to the ERA5 time step, thus before convective-cell detection. Post-700-frontal cells develop with the largest solar incoming radiation (around 250 W m−2). The lowest solar radiation is ahead of the 700 hPa front but behind the surface front (50–150 km region), consistent with where the total cloud cover is highest (Fig. A4) and vertical velocity at non-cell regions is highest (Fig. 8). Solar radiation at cell grid points between −250 to 50 km and a pre-surface-frontal instance is lower than at non-cell regions. The result may seem counterintuitive as solar radiation is thought to be a driver of convective initiation, so higher solar radiation would be expected before cell initiation. The result could indicate that ERA5 struggles with the timing of convective initiation and thus produces convective clouds before the actual convective initiation. Nevertheless, upon consultation of observational station data from the DWD (see Sect. 2.4.3), the same negative anomaly was observed for sunshine minutes (Fig. A5). The negative anomaly is particularly strong for the pre-surface-frontal type. One explanation for the negative anomaly in solar radiation (ERA5) and sunshine duration (observational data) could be attributed to cloud cover from pre-existing convective cells. The importance of cold pools (outflow boundaries) on convective initiation has already been highlighted in previous literature. For example, Hirt et al. (2020) showed using high-resolution model simulations for case studies that up to 50 % of convective initiation is at the edge of cold pools. At the edge of cold pools it is likely to be cloudy and convection may not be directly triggered by solar heating. This is especially true in the case of a mesoscale convective system (MCS), where several new cells could initiate inside the pre-existing cloud system due to cell recycling.
3.7 Vertical wind shear
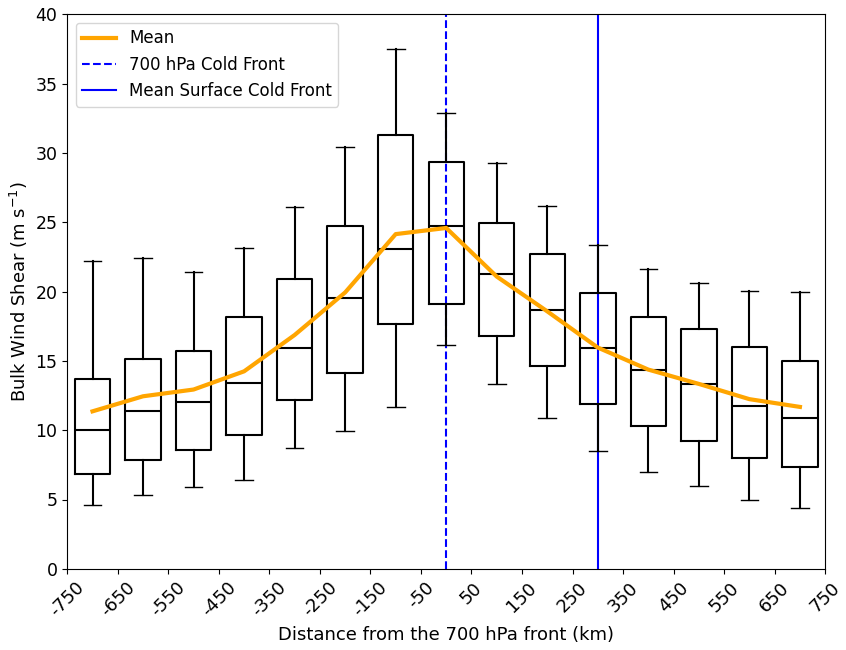
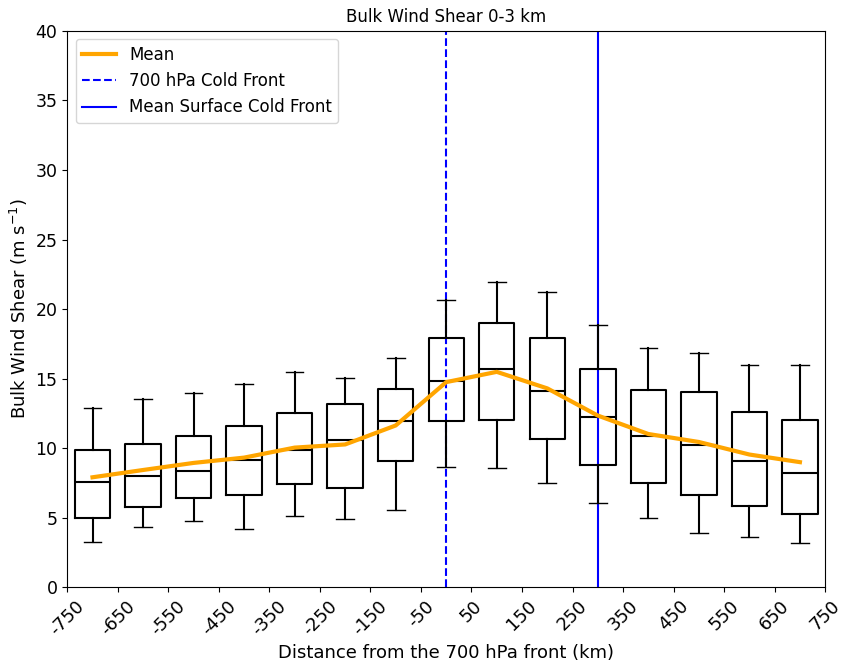
Vertical wind shear is related to storm organisation (e.g. Markowski and Richardson, 2010) and can potentially both positively or negatively affect convective initiation (Peters et al., 2022). The bulk wind shear between the surface and 500 hPa is highest for convective-cell grid points of the near-700-frontal type with around 13 m s−1 on average (Fig. 10). The wind shear of the near-700-frontal type is also higher than non-cell region grid points by around 1 m s−1. There is less difference between cell regions and cell grid points of the near-700-frontal type. The wind shear decreases at increasing distance away from the 700 hPa front. At a certain distance behind the 700 hPa front, wind shear is lower at cell regions and cell grid points compared to non-cell region grid points. While there is some asymmetry around the maximum, post-700-frontal cells generally form in environments with comparable wind shear compared to pre-surface-frontal cells.
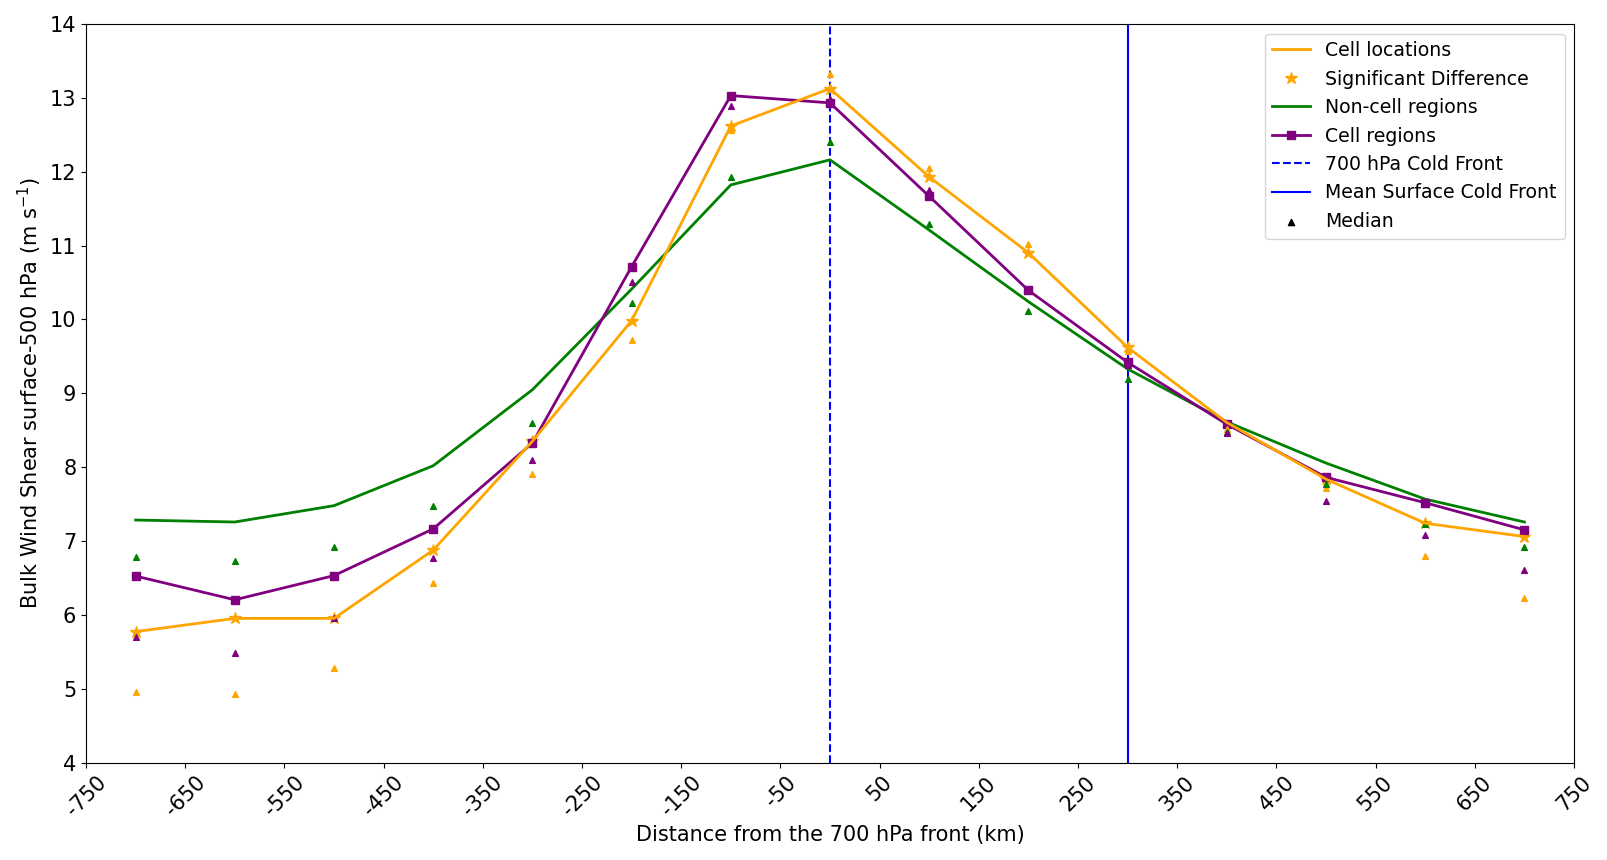
Calculating the bulk wind shear between the surface and 500 hPa (as Fig. 10) will lead to a lower vertical distance being sampled for grid points at higher elevation. For this reason, the bulk wind shear between the surface and 6 km a.g.l. is sometimes used instead of the surface–500 hPa wind shear. To check that this does not have a major effect on our results, the surface–6 km a.g.l. wind shear is analysed at cell grid points using ERA5 model level data (Taszarek et al., 2023). Even though there are differences in the magnitude of the wind shear between the bulk wind shear at the surface–500 hPa (Fig. 10) and 0–6 km a.g.l. (Fig. 11) level, the regions of maximum and minimum wind shear around the front are very comparable. Cells near the 700 hPa front have a particularly high 0–6 km a.g.l. mean wind shear of around 24 m s−1. Supercells have been shown in several studies to form in environments with around 20 m s−1 of 0–6 km a.g.l. of shear (e.g. Doswell and Evans, 2003).
3.8 Precipitation
To see how precipitation is represented in ERA5 across the front, large-scale and convective precipitation are shown in Fig. 12. In Sect. 3.5, we previously mentioned that convection might interact with the vertical velocity field, which if true should show a similar signal in the precipitation fields. We do not seek to validate ERA5 rainfall amounts for which a comparison with a combined radar and rain gauge product would be more suitable.
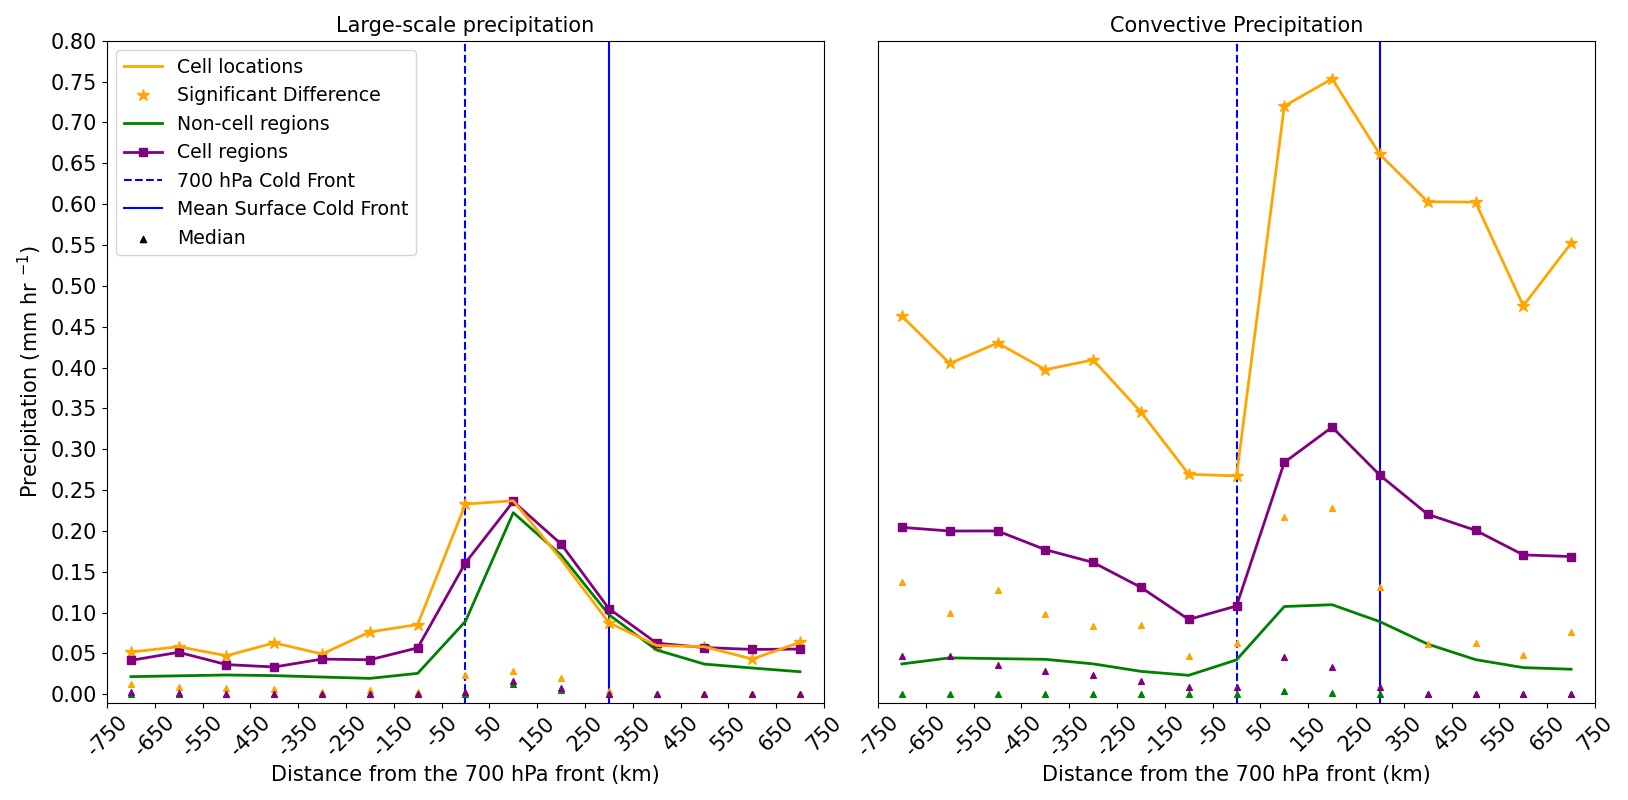
The large-scale precipitation is highest for all three categories between the 700 hPa and surface front. This is in agreement with the classical conceptual model of an ana-cold front where the primary precipitation region associated with a cold front is behind the surface front (Browning, 1990; EUMeTrain, 2012). In this case, the primary precipitation region refers to mostly stratiform precipitation that results from cloud formation in the ascending warm conveyor belt (Browning, 1986). Figure 9 also shows that the lowest solar radiation is at this location relative to the front. Total cloud cover, high cloud cover and vertical velocity for non-cell regions are also highest at this location (Figs. A4 and 8). This suggests that convective cells between the 700 hPa front and surface front are mostly embedded in stratiform precipitation regions (e.g. Oertel et al., 2020). At most regions relative to the front the large-scale precipitation is higher at cell grid points compared to non-cell regions.
Convective precipitation is maximum in the region 150–250 km ahead of the 700 hPa front for all three categories. This maximum is around 150 km behind the convective-cell maximum found in Pacey et al. (2023) (see Fig. 13). The differences could relate to weaker precipitation than the 46 dBZ threshold being more frequently closer to the front or ERA5 struggling to resolve the location of convection relative to the front. The minimum convective precipitation is 50–150 km behind the 700 hPa front (again for all three categories) before increasing slightly further behind the front. The increase behind the 700 hPa front is consistent with the slight increase seen in the convective-cell climatology (Fig. 13). Convective precipitation at cell grid points is significantly higher compared to non-cell region grid points and shows a trend similar to the vertical velocity fields (Fig. 8). This corroborates the hypothesis that the vertical velocity signal in Fig. 8 comes from the convective parameterisation scheme being triggered in the correct time and place in some cases. Indeed, 50.5 % of all convective-cell grid points have convective precipitation greater than 0.1 mm h−1.
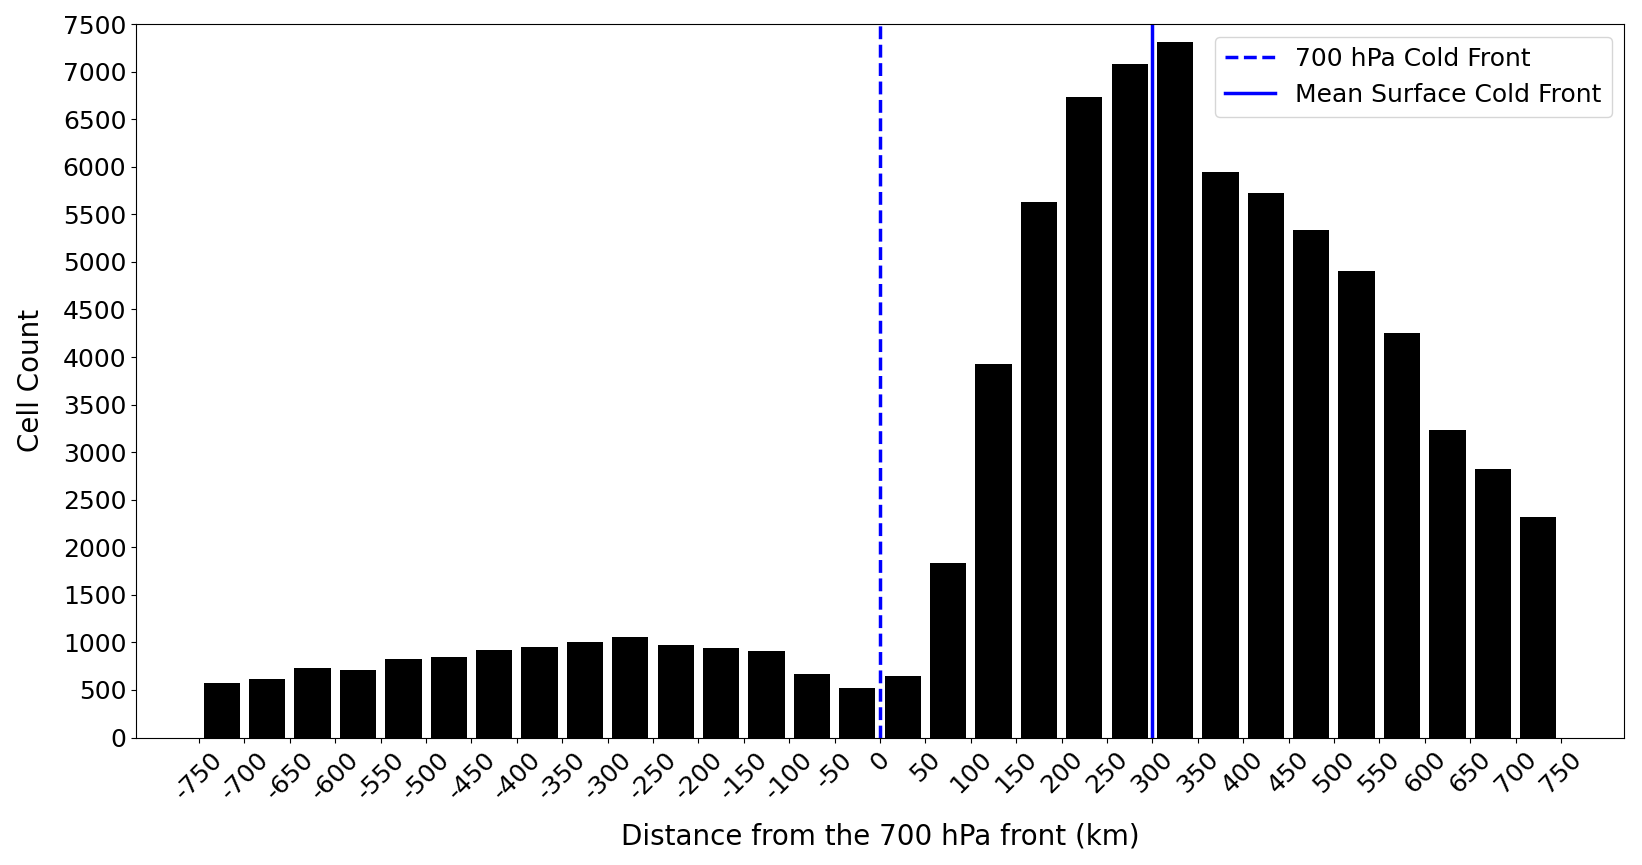
Figure 13Convective-cell frequency depending on the distance from the 700 hPa front (adapted from Fig. 5a in Pacey et al., 2023).
A statistical comparison between cell grid points, cell regions and non-cell regions (Sect. 2.3) depending on the region relative to the front has been made in Sect. 3. The purpose of this section is to relate the results to the cell climatology shown in Pacey et al. (2023) and address our third research question (Q3). Figure 5a from Pacey et al. (2023) is shown here again as Fig. 13. In this discussion, three front-relative regions are focused on pre-surface-frontal (300–750 km ahead of the 700 hPa front), near-700-frontal (−50 to 50 km from the 700 hPa front) and post-700-frontal cells (−750 to −50 km from the 700 hPa front).
4.1 Pre-surface-frontal cells
Cells are more frequently pre-surface-frontal than post-700-frontal and near-700-frontal (Fig. 13). A key result from this study is that while the environment quickly becomes unfavourable for cells behind the surface front, this is not the case in the other direction ahead of the front. For example, 750 km ahead of the 700 hPa front (around 450 km ahead of the surface front), Q vectors remain convergent at 850 hPa (Fig. 7). On the other hand, 300 km behind the surface front (near-700-frontal), Q vectors at 850 hPa are divergent at non-cell regions and cell regions. Similar results are found for CAPE, surface dew points and solar radiation with the mean values generally remaining higher ahead of the surface front compared to the same distance behind the surface front. These results can explain the differences in the cell frequency between pre-surface-frontal and post-frontal, despite CIN also being higher for pre-surface-frontal cells (Fig. 6). The presence of pre-surface-frontal convergence lines (Dahl and Fischer, 2016) is one possible source of lift that may aid parcels in overcoming this CIN.
4.2 Near-700-frontal cells
Convection is least frequent surrounding the 700 hPa frontal line location (Fig. 13). At 850 hPa, divergence of the Q vector is typically found at this region relative to the front (Fig. 7). This is also supported by the minimum vertical velocity at 850 hPa (Fig. 8). Furthermore, the mean solar radiation is also lower and CAPE is lower than other regions relative to the front. The high wind shear (Figs. 10 and 11) may also contribute towards the low cell frequency since deep moist convection may struggle to initiate when initial updraught width is low and shear is high (Morrison et al., 2022; Peters et al., 2022).
4.3 Post-700-frontal cells
Post-700-frontal cells are associated with lower cell frequency than pre-700-frontal cells (Fig. 13) and almost always occur during the daytime (Fig. 6 in Pacey et al., 2023). Generally Q vectors are divergent at 850, 700 and 500 hPa, which would act to hinder the development of convective cells. Figure 4 shows that mid-level post-700-frontal relative humidity is generally low (50 % or lower). Owing to the lower CIN (Fig. 6), less lifting would generally be required to allow for post-700-frontal cell initiation. However, parcels may be more susceptible to entrainment (Morrison et al., 2022) due to the combined effects of a dry mid-troposphere and wind shear thus not being able to reach the threshold of a convective cell (46 dBZ in this study). These results can explain the overall low cell frequency of the post-700-frontal type. The higher cell frequency compared to near-700-frontal cells can be explained by solar radiation possibly acting as a source of lift and increasing instability (Figs. 9 and A5).
In this study, the environments and lifting mechanisms associated with warm-season cold-frontal convective cells were analysed by combining automatic front detection and cell detection methods. Previous studies had primarily focused on the storm's environment looking at parameters such as mid- and low-level moisture, instability, and wind shear with less consideration for different lifting (triggering) mechanisms. Furthermore, variation in the environment and lifting mechanisms in different front-relative regions had not been considered in any detail. Here, a comprehensive set of variables relevant to convective initiation were considered, including synoptic-scale lifting, solar heating, CIN, CAPE, relative humidity and dew points. A strong focus was placed on differences in the convective-cell environments and lifting mechanisms depending on the region relative to the front. How well each variable discriminates between regions where cells did and did not occur was also assessed. The primary findings of this study are highlighted below, and a shorter overview is visualised in Fig. 14.
-
Pre-surface-frontal cells form in the environments with the highest dew points and CAPE, around 16 °C (Fig. 3) and 600–700 J kg−1 (Fig. 5) on average. These cells are associated with the strongest CIN (Fig. 6) and also the strongest Q-vector convergence (synoptic-scale lifting) at 700 hPa (Fig. 7). However, synoptic-scale lifting at 500 hPa is less relevant to pre-surface-frontal cells.
-
Between the surface and 700 hPa front, cells form in environments with the highest mid-tropospheric relative humidity (Fig. 4), which is linked to the frontal cloud band (Figs. 9 and A4).
-
Near the 700 hPa frontal line, strong synoptic-scale lifting at 500 hPa is key for cell initiation (Fig. 7). The lifting may not be (only) relevant to maintaining positive buoyancy of updraughts but rather (also) steepening lapse rates and increasing CAPE through adiabatic cooling.
-
Post-700-frontal non-cell regions have mean divergence of the Q vector at 850, 700 and 500 hPa, whereas weaker divergence or even convergence of the Q vectors is found at cell locations (Fig. 7). Post-700-frontal cells have relative humidity at 700 hPa of around 20 %–30 % higher than non-cell regions (Fig. 4), highlighting the importance of higher-than-average relative humidity allowing for cell development and reducing the likelihood of entrainment.
-
At all front-relative regions, there is a positive anomaly for ascending motion in the vertical velocity which is not present for Q-vector convergence at all pressure levels (Figs. 8 and 7). Furthermore, solar radiation (ERA5) and sunshine duration (observational data) before cell initiation are generally lower at cell locations compared to non-cell regions. While solar heating may be relevant to the first cell initiation, we speculate other factors (e.g. outflow boundaries) are more relevant to the majority of cold-frontal cell initiation.
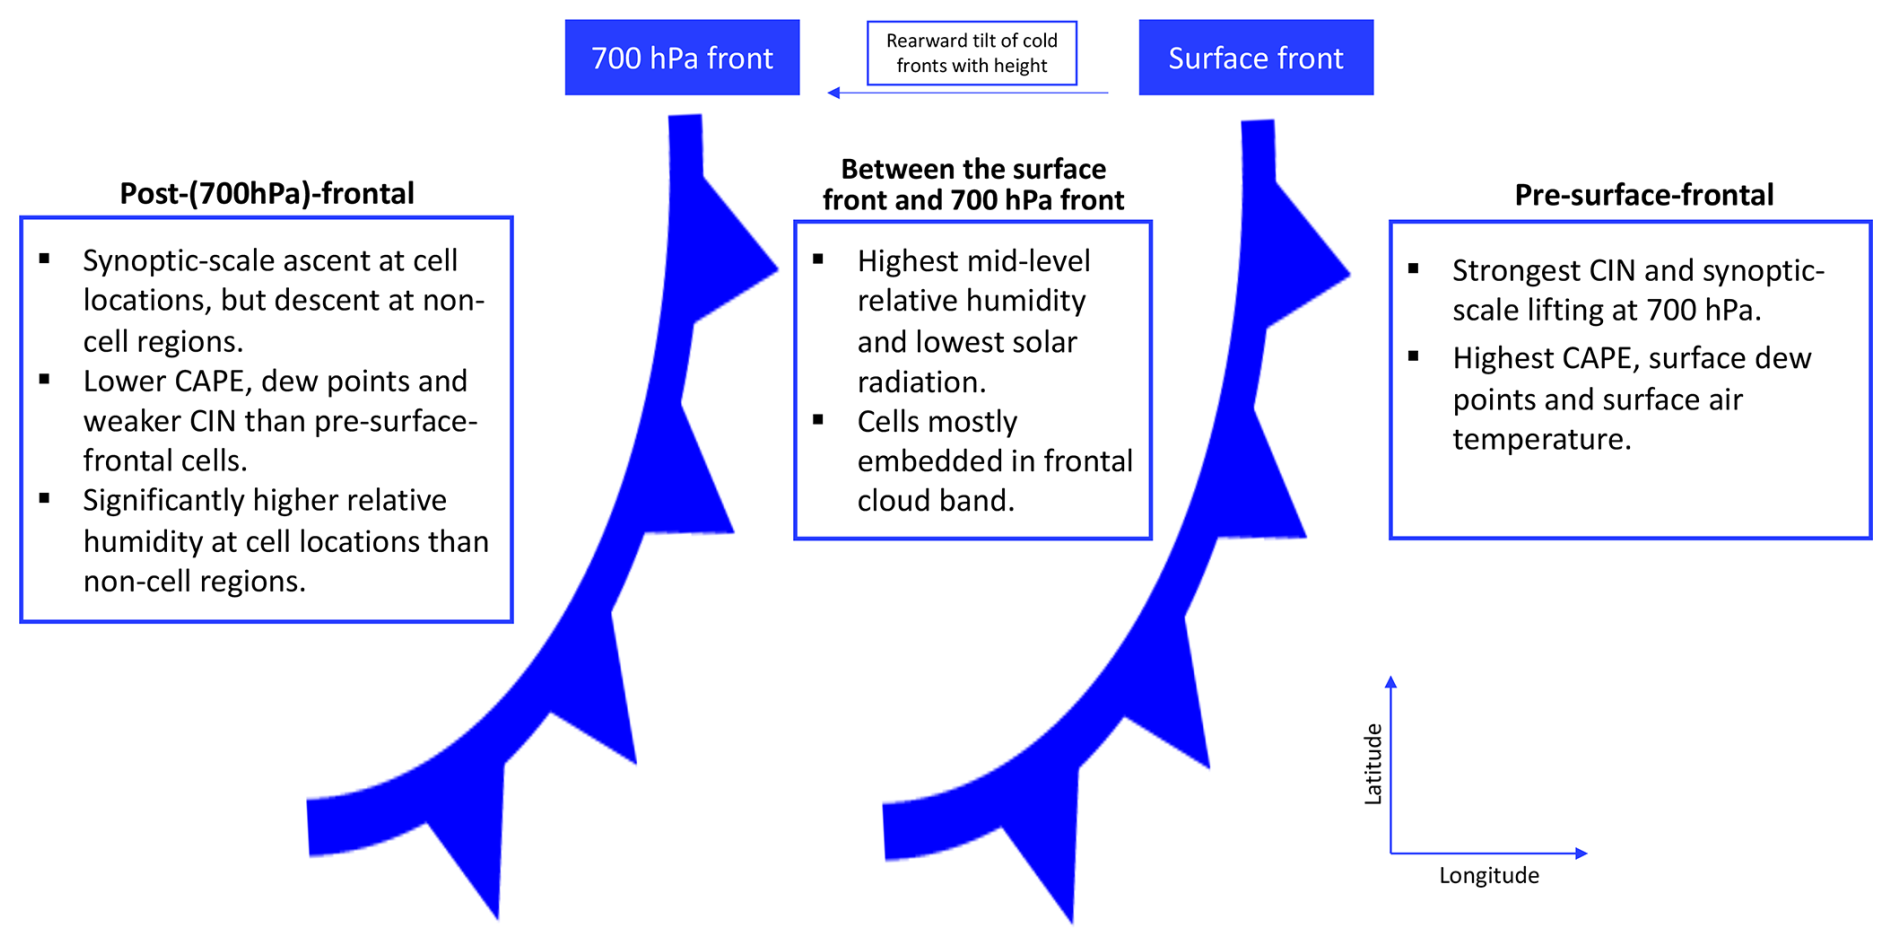
Figure 14Overview of convective-cell environments and lifting mechanisms at three front-relative regions: post-700-frontal, between the 700 hPa and surface front, and pre-surface-frontal.
These results advance understanding of the environments in which cold-frontal convective cells form and the importance of different lifting mechanisms on cell development depending on the region relative to the front, addressing our first and second research questions (Q1 and Q2). In Sect. 4, explanations for the differences in cell frequency at different front-relative regions are provided, addressing our third research question (Q3). The results from this study have a direct forecasting application since a forecaster can better understand in which environments to expect convective-cell initiation depending on the region relative to the front.
Furthermore, the results leave several interesting open questions for future work. For example, is the lifting at 500 hPa generally more important for increasing instability through adiabatic cooling or also relevant to maintaining positive buoyancy of updraughts? The positive vertical velocity anomaly at cell grid points which is not present in the Q-vector fields at all pressure levels raises questions on how well ERA5 represents convection. The positive anomaly in the vertical velocity may come from the convective parameterisation scheme being triggered at the right place and time in some cases and the convection then feeding back on the vertical velocity field.
Finally, we remark that each variable was considered individually in this study, but when forecasting convection, moisture, lifting mechanisms and instability must be considered in tandem. While we show significant differences between the cell grid point and non-cell region means for most variables, there is some overlap of the distributions for most variables (see the Supplement). Future studies seeking to better understand the importance of different lifting mechanisms may benefit from only considering grid points where there is sufficient moisture and instability.
ERA5 data can be downloaded from the Copernicus servers (Hersbach et al., 2020). KONRAD is available for research purposes on request (contact kundenservice@dwd.de). Code for front detection and plotting is available on request from the corresponding author.
The supplement related to this article is available online at https://doi.org/10.5194/wcd-6-695-2025-supplement.
GP carried out the data analysis and wrote all sections of the manuscript. SP and LS provided comments and support during the data analysis and writing process. SP and LS wrote the original research proposal.
At least one of the (co-)authors is a member of the editorial board of Weather and Climate Dynamics. The peer-review process was guided by an independent editor, and the authors also have no other competing interests to declare.
Publisher's note: Copernicus Publications remains neutral with regard to jurisdictional claims made in the text, published maps, institutional affiliations, or any other geographical representation in this paper. While Copernicus Publications makes every effort to include appropriate place names, the final responsibility lies with the authors.
This research has been funded by Deutsche Forschungsgemeinschaft (DFG) through a grant for project C06 “Multi-scale structure of atmospheric vortices” of CRC 1114 “Scaling Cascades in Complex Systems” (project number 235221301). We thank the German Weather Service (DWD) for providing the KONRAD cell detection and tracking dataset. The Open Data Server from the DWD also allowed sunshine duration data to be downloaded. We thank Johannes Dahl for useful discussions and insights as well as Mateusz Taszarek for providing convective parameter data which were used in Sect. 3.3 and 3.7. Finally, we would like to thank two anonymous reviewers whose comments helped to improve the quality of the paper.
This research has been supported by the Deutsche Forschungsgemeinschaft (grant no. 235221301).
The article processing charges for this open-access publication were covered by the Freie Universität Berlin.
This paper was edited by Juerg Schmidli and reviewed by two anonymous referees.
Bott, A.: Fronten und Frontalzonen, in: Synoptische Meteorologie, Springer Berlin Heidelberg, Berlin, Heidelberg, p. 368, https://doi.org/10.1007/978-3-662-67217-4_11, ISBN 978-3-662-67217-4, 2023. a
Brooks, H. E., Doswell, C. A., and Cooper, J.: On the Environments of Tornadic and Nontornadic Mesocyclones, Weather Forecast., 9, 606–618, https://doi.org/10.1175/1520-0434(1994)009<0606:OTEOTA>2.0.CO;2, 1994. a
Browning, K. A.: Conceptual Models of Precipitation Systems, Weather Forecast., 1, 23–41, https://doi.org/10.1175/1520-0434(1986)001<0023:CMOPS>2.0.CO;2, 1986. a
Browning, K. A.: Organization of Clouds and Precipitation in Extratropical Cyclones, in: Extratropical Cyclones, American Meteorological Society, Boston, MA, 129–153, https://doi.org/10.1007/978-1-944970-33-8_8, ISBN 978-1-944970-33-8, 1990. a
Calvo-Sancho, C., Díaz-Fernández, J., Martín, Y., Bolgiani, P., Sastre, M., González-Alemán, J. J., Santos-Muñoz, D., Farrán, J. I., and Martín, M. L.: Supercell convective environments in Spain based on ERA5: hail and non-hail differences, Weather Clim. Dynam., 3, 1021–1036, https://doi.org/10.5194/wcd-3-1021-2022, 2022. a
Corfidi, S. F., Corfidi, S. J., and Schultz, D. M.: Elevated Convection and Castellanus: Ambiguities, Significance, and Questions, Weather Forecast., 23, 1280–1303, https://doi.org/10.1175/2008WAF2222118.1, 2008. a
Dahl, J. M. L. and Fischer, J.: The Origin of Western European Warm-Season Prefrontal Convergence Lines, Weather Forecast., 31, 1417–1431, https://doi.org/10.1175/WAF-D-15-0161.1, 2016. a
Deutscher Wetterdienst: 10-minute station observations of solar and sunshine for Germany, Version v24.03, Description of Solar Radiation Data, German Weather Service, https://opendata.dwd.de/climate_environment/CDC/observations_germany/climate/10_minutes/solar/DESCRIPTION_obsgermany_climate_10min_solar_en.pdf (last access: 15 February 2024), 2024. a
Doswell III, C. A.: Severe Convective Storms – An Overview, Meteor. Mon., 28, 1–26, https://doi.org/10.1175/0065-9401-28.50.1, 2001. a
Doswell III, C. A. and Evans, J. S.: Proximity sounding analysis for derechos and supercells: an assessment of similarities and differences, Atmos. Res., 67–68, 117–133, https://doi.org/10.1016/S0169-8095(03)00047-4, 2003. a
Doswell III, C. A. and Rasmussen, E. N.: The Effect of Neglecting the Virtual Temperature Correction on CAPE Calculations, Weather Forecast., 9, 625–629, https://doi.org/10.1175/1520-0434(1994)009<0625:TEONTV>2.0.CO;2, 1994. a
Doswell III, C. A., Brooks, H. E., and Maddox, R. A.: Flash Flood Forecasting: An Ingredients-Based Methodology, Weather Forecast., 11, 560–581, https://doi.org/10.1175/1520-0434(1996)011<0560:FFFAIB>2.0.CO;2, 1996. a, b, c
EUMeTrain: EUMeTrain - Satellite Meteorology: Cloud Formation, https://resources.eumetrain.org/satmanu/CMs/Cf/navmenu.php?page=2.0.0 (last access: January 2024), 2012. a
Hersbach, H., Bell, B., Berrisford, P., Biavati, G., Horányi, A., Muñoz Sabater, J., Nicolas, J., Peubey, C., Radu, R., Rozum, I., Schepers, D., Simmons, A., Soci, C., Dee, D., and Thépaut, J.-N.: ERA5 hourly data on single levels from 1959 to present, Copernicus Climate Change Service (C3S) Climate Data Store (CDS) [data set], https://doi.org/10.24381/cds.bd0915c6, 2018. a, b
Hersbach, H., Bell, B., Berrisford, P., Hirahara, S., Horányi, A., Muñoz-Sabater, J., Nicolas, J., Peubey, C., Radu, R., Schepers, D., Simmons, A., Soci, C., Abdalla, S., Abellan, X., Balsamo, G., Bechtold, P., Biavati, G., Bidlot, J., Bonavita, M., De Chiara, G., Dahlgren, P., Dee, D., Diamantakis, M., Dragani, R., Flemming, J., Forbes, R., Fuentes, M., Geer, A., Haimberger, L., Healy, S., Hogan, R. J., Hólm, E., Janisková, M., Keeley, S., Laloyaux, P., Lopez, P., Lupu, C., Radnoti, G., de Rosnay, P., Rozum, I., Vamborg, F., Villaume, S., and Thépaut, J.-N.: The ERA5 global reanalysis, Q. J. Roy. Meteorol. Soc., 146, 1999–2049, https://doi.org/10.1002/qj.3803, 2020. a, b
Hewson, T. D.: Objective fronts, Meteorol. Appl., 5, 37–65, https://doi.org/10.1017/S1350482798000553, 1998. a
Hirt, M., Craig, G. C., Schäfer, S. A. K., Savre, J., and Heinze, R.: Cold-pool-driven convective initiation: using causal graph analysis to determine what convection-permitting models are missing, Q. J. Roy. Meteor. Soc., 146, 2205–2227, https://doi.org/10.1002/qj.3788, 2020. a
Holton, J. R. and Hakim, G. J.: Chapter 6 - Quasi-geostrophic Analysis, in: An Introduction to Dynamic Meteorology, 5th edn., edited by: Holton, J. R. and Hakim, G. J., Academic Press, Boston, 171–211, https://doi.org/10.1016/B978-0-12-384866-6.00006-4, ISBN 978-0-12-384866-6, 2013. a
Hoskins, B. J., Draghici, I., and Davies, H. C.: A new look at the ω-equation, Q. J. Roy. Meteor. Soc., 104, 31–38, https://doi.org/10.1002/qj.49710443903, 1978. a, b
Jenkner, J., Sprenger, M., Schwenk, I., Schwierz, C., Dierer, S., and Leuenberger, D.: Detection and climatology of fronts in a high-resolution model reanalysis over the Alps, Meteorol. Appl., 17, 1–18, https://doi.org/10.1002/met.142, 2010. a
Kain, J. S., Weiss, S. J., Bright, D. R., Baldwin, M. E., Levit, J. J., Carbin, G. W., Schwartz, C. S., Weisman, M. L., Droegemeier, K. K., Weber, D. B., and Thomas, K. W.: Some Practical Considerations Regarding Horizontal Resolution in the First Generation of Operational Convection-Allowing NWP, Weather Forecast., 23, 931–952, https://doi.org/10.1175/WAF2007106.1, 2008. a
Kaspar, F., Kratzenstein, F., and Kaiser-Weiss, A. K.: Interactive open access to climate observations from Germany, Adv. Sci. Res., 16, 75–83, https://doi.org/10.5194/asr-16-75-2019, 2019. a
Klasa, C., Arpagaus, M., Walser, A., and Wernli, H.: An evaluation of the convection-permitting ensemble COSMO-E for three contrasting precipitation events in Switzerland, Q. J. Roy. Meteor. Soc., 144, 744–764, https://doi.org/10.1002/qj.3245, 2018. a
Koch, S. E.: The Role of an Apparent Mesoscale Frontogenetic Circulation in Squall Line Initiation, Mon. Weather Rev., 112, 2090–2111, https://doi.org/10.1175/1520-0493(1984)112<2090:TROAAM>2.0.CO;2, 1984. a
Kolendowicz, L., Taszarek, M., and Czernecki, B.: Atmospheric circulation and sounding-derived parameters associated with thunderstorm occurrence in Central Europe, Atmos. Res., 191, 101–114, https://doi.org/10.1016/j.atmosres.2017.03.009, 2017. a
León-Cruz, J. F., Caetano, E., Cortés-Ramos, J., Dominguez, C., and Méndez-Pérez, J. M.: Thunderstorm and hailstorm environments in Mexico, Int. J. Climatol., 43, 4379–4395, https://doi.org/10.1002/joc.8093, 2023. a
Ludlam, F. H.: Clouds and Storms: The Behavior and Effect of Water in the Atmosphere, ISBN 10: 0271005157/ISBN 13: 9780271005157, 1980. a
Markowski, P. and Richardson, Y.: Mesoscale Meteorology in Midlatitudes, in: Advancing weather and climate science, Vol. 2, 1st edn., Wiley, Somerset, ISBN 0470742135, 2010. a, b, c, d, e
May, R. M., Goebbert, K. H., Thielen, J. E., Leeman, J. R., Camron, M. D., Bruick, Z., Bruning, E. C., Manser, R. P., Arms, S. C., and Marsh, P. T.: MetPy: A Meteorological Python Library for Data Analysis and Visualization, B. Am. Meteorol. Soc., 103, E2273–E2284, https://doi.org/10.1175/BAMS-D-21-0125.1, 2022. a
Morrison, H., Peters, J. M., Chandrakar, K. K., and Sherwood, S. C.: Influences of Environmental Relative Humidity and Horizontal Scale of Subcloud Ascent on Deep Convective Initiation, J. Atmos. Sci., 79, 337– 359, https://doi.org/10.1175/JAS-D-21-0056.1, 2022. a, b, c, d
Oertel, A., Boettcher, M., Joos, H., Sprenger, M., and Wernli, H.: Potential vorticity structure of embedded convection in a warm conveyor belt and its relevance for large-scale dynamics, Weather Clim. Dynam., 1, 127–153, https://doi.org/10.5194/wcd-1-127-2020, 2020. a
Pacey, G., Pfahl, S., Schielicke, L., and Wapler, K.: The climatology and nature of warm-season convective cells in cold-frontal environments over Germany, Nat. Hazards Earth Syst. Sci., 23, 3703–3721, https://doi.org/10.5194/nhess-23-3703-2023, 2023. a, b, c, d, e, f, g, h, i, j, k, l, m, n, o, p
Peters, J. M., Hannah, W., and Morrison, H.: The Influence of Vertical Wind Shear on Moist Thermals, J. Atmos. Sci., 76, 1645–1659, https://doi.org/10.1175/JAS-D-18-0296.1, 2019. a
Peters, J. M., Morrison, H., Nelson, T. C., Marquis, J. N., Mulholland, J. P., and Nowotarski, C. J.: The Influence of Shear on Deep Convection Initiation. Part I: Theory, J. Atmos. Sci., 79, 1669–1690, https://doi.org/10.1175/JAS-D-21-0145.1, 2022. a, b, c, d
Poręba, S., Taszarek, M., and Ustrnul, Z.: Diurnal and Seasonal Variability of ERA5 Convective Parameters in Relation to Lightning Flash Rates in Poland, Weather Forecast., 37, 1447–1470, https://doi.org/10.1175/WAF-D-21-0099.1, 2022. a, b
Púčik, T., Groenemeijer, P., Rýva, D., and Kolář, M.: Proximity Soundings of Severe and Nonsevere Thunderstorms in Central Europe, Mon. Weather Rev., 143, 4805–4821, https://doi.org/10.1175/MWR-D-15-0104.1, 2015. a
Sanders, F.: AN INVESTIGATION OF THE STRUCTURE AND DYNAMICS OF AN INTENSE SURFACE FRONTAL ZONE, J. Atmos. Sci., 12, 542–552, https://doi.org/10.1175/1520-0469(1955)012<0542:AIOTSA>2.0.CO;2, 1955. a
Schemm, S., Nisi, L., Martinov, A., Leuenberger, D., and Martius, O.: On the link between cold fronts and hail in Switzerland, Atmos. Sci. Lett., 17, 315–325, 2016. a
Taszarek, M., Brooks, H. E., and Czernecki, B.: Sounding-Derived Parameters Associated with Convective Hazards in Europe, Mon. Weather Rev., 145, 1511–1528, https://doi.org/10.1175/MWR-D-16-0384.1, 2017. a
Taszarek, M., Brooks, H. E., Czernecki, B., Szuster, P., and Fortuniak, K.: Climatological Aspects of Convective Parameters over Europe: A Comparison of ERA-Interim and Sounding Data, J. Climate, 31, 4281–4308, https://doi.org/10.1175/JCLI-D-17-0596.1, 2018. a
Taszarek, M., Allen, J. T., Púčik, T., Hoogewind, K. A., and Brooks, H. E.: Severe Convective Storms across Europe and the United States. Part II: ERA5 Environments Associated with Lightning, Large Hail, Severe Wind, and Tornadoes, J. Climate, 33, 10263–10286, https://doi.org/10.1175/JCLI-D-20-0346.1, 2020. a
Taszarek, M., Czernecki, B., and Szuster, P.: thundeR - a rawinsonde package for processing convective parameters and visualizing atmospheric profiles, 11th European Conference on Severe Storms, Bucharest, Romania, 8–12 May 2023, ECSS2023-28, https://doi.org/10.5194/ecss2023-28, 2023. a, b
Trapp, R. J.: The Initiation of Deep Convective Clouds, in: Mesoscale-Convective Processes in the Atmosphere, Cambridge University Press, Cambridge, 121–161, https://doi.org/10.1017/CBO9781139047241.006, 2013. a, b
Wapler, K. and James, P.: Thunderstorm occurrence and characteristics in Central Europe under different synoptic conditions, Atmos. Res., 158–159, 231–244, https://doi.org/10.1016/j.atmosres.2014.07.011, 2015. a, b
Weisman, M. L. and Klemp, J. B.: The Dependence of Numerically Simulated Convective Storms on Vertical Wind Shear and Buoyancy, Mon. Weather Rev., 110, 504–520, https://doi.org/10.1175/1520-0493(1982)110<0504:TDONSC>2.0.CO;2, 1982. a
Westermayer, A. T., Groenemeijer, P., Pistotnik, G., Sausen, R., and Faust, E.: Identification of favorable environments for thunderstorms in reanalysis data, Meteorol. Z., 26, 59–70, https://doi.org/10.1127/metz/2016/0754, 2017. a
Weusthoff, T. and Hauf, T.: The life cycle of convective‐shower cells under post‐frontal condition, Q. J. Roy. Meteor. Soc., 134, 841–857, https://doi.org/10.1002/qj.260, 2008. a
Wulfmeyer, V., Behrendt, A., Kottmeier, C., Corsmeier, U., Barthlott, C., Craig, G. C., Hagen, M., Althausen, D., Aoshima, F., Arpagaus, M., Bauer, H.-S., Bennett, L., Blyth, A., Brandau, C., Champollion, C., Crewell, S., Dick, G., Di Girolamo, P., Dorninger, M., Dufournet, Y., Eigenmann, R., Engelmann, R., Flamant, C., Foken, T., Gorgas, T., Grzeschik, M., Handwerker, J., Hauck, C., Höller, H., Junkermann, W., Kalthoff, N., Kiemle, C., Klink, S., König, M., Krauss, L., Long, C. N., Madonna, F., Mobbs, S., Neininger, B., Pal, S., Peters, G., Pigeon, G., Richard, E., Rotach, M. W., Russchenberg, H., Schwitalla, T., Smith, V., Steinacker, R., Trentmann, J., Turner, D. D., van Baelen, J., Vogt, S., Volkert, H., Weckwerth, T., Wernli, H., Wieser, A., and Wirth, M.: The Convective and Orographically-induced Precipitation Study (COPS): the scientific strategy, the field phase, and research highlights, Q. J. Roy. Meteor. Soc., 137, 3–30, https://doi.org/10.1002/qj.752, 2011. a