the Creative Commons Attribution 4.0 License.
the Creative Commons Attribution 4.0 License.
 | 23 Sep 2025
A poleward storm track shift reduces mid-latitude heatwave frequency: insights from an idealized atmospheric model
Emmanuele Russo
Daniela I. V. Domeisen
Recent decades have seen a global increase in hot extremes, yet the role of changes in the atmospheric circulation in driving this trend remains unclear. While previous studies focused on the amplitude of planetary and synoptic-scale waves for explaining the frequency and persistence of temperature extremes, we here investigate the influence of the storm track position. Specifically, we conduct a suite of idealized model experiments with the dry dynamical core of the ICON model, where thermal forcing in the tropics or the polar regions alters the characteristics of the extratropical storm track. In these simulations, the storm track is associated with a mid-latitude minimum in the frequency of persistent temperature extremes. The underlying relationship between the zonal phase speed of synoptic-scale waves and storm track characteristics is assessed through spectral analysis of upper-tropospheric meridional wind. A poleward-shifted storm track is associated with a strengthened eddy-driven jet, an increase in phase speed, and a reduction in heatwave frequency. Reanalysis data for the Southern Hemisphere, where ozone depletion and greenhouse gas emissions have caused a poleward storm track shift, reveals a mid-latitude minimum in heatwave frequency reminiscent of the idealized model. While the phase speed of synoptic-scale waves has continuously increased from the 1980s to the present, we cannot find evidence that this development has influenced the persistence of Southern Hemisphere mid-latitude temperature extremes, potentially due to differences in the climatological-mean spectrum between the idealized model and reanalysis. The mechanism may, on the other hand, be relevant for the future evolution of extreme events in the Northern Hemisphere under the joint influence of Arctic amplification and the expansion of the tropics.
- Article
(6438 KB) - Full-text XML
-
Supplement
(4619 KB) - BibTeX
- EndNote


Persistent heat poses a severe hazard to human health (e.g., Ebi et al., 2021). The observed increase in the frequency and intensity of hot extremes in most regions of the world (e.g., Seneviratne et al., 2021; Russo and Domeisen, 2023), therefore, causes great concern and calls for a better understanding of the different drivers of this change. A range of physical processes has likely contributed to the increase in hot extreme weather in response to anthropogenic climate change (Domeisen et al., 2023; Barriopedro et al., 2023). Foremost, there is the greenhouse effect, which is responsible for the general warming trend and contributes to extreme events (Schär et al., 2004; Fischer and Knutti, 2015). The general warming trend is also linked to an increase in the average saturation vapor pressure (O'Gorman and Muller, 2010), which has various implications for temperature extremes. In a warmer climate, the feedback between low soil moisture and anomalously high air temperature (Miralles et al., 2014; Hauser et al., 2016) is becoming more effective because moisture deficits can build faster (Dai et al., 2018). Furthermore, as more moisture becomes available for cloud condensation (Joos et al., 2023), upstream latent heat release can contribute more effectively to blocking formation and a stable stratification that is characteristic of extreme heat near the surface (Zschenderlein et al., 2019; Papritz and Röthlisberger, 2023). These processes and their impact on weather extremes are studied using complex earth system models (e.g., Wehrli et al., 2019).
In addition to the above thermodynamic effects, it has been hypothesized that changes in the atmospheric circulation might contribute to the tendency in extreme events, most prominently in the context of Arctic amplification (Francis and Vavrus, 2012; Cohen et al., 2014; Coumou et al., 2015; Pfleiderer et al., 2019). As Arctic temperatures are rising twice to four times as fast as the global mean (Rantanen et al., 2022; Screen and Simmonds, 2010a, b), a reduced equator-to-pole temperature gradient is expected to be seen near the surface and a weakened westerly jet stream at height (Harvey et al., 2020). These changes in the zonal mean are believed to influence mid-latitude temperature extremes by altering the strength and the size of the perturbations to the zonally averaged circulation (Geen et al., 2023). Geometry based metrics predict an increase in waviness and, related to potentially more persistent jet meanders, more extreme mid-latitude weather (Francis and Vavrus, 2012; Cohen et al., 2014). Intensity or kinetic energy based metrics predict a weakening; but based on the hypothesis that a weakened circulation will increase persistence, the consequence is again an increase in warm temperature extremes (Coumou et al., 2015; Pfleiderer et al., 2019).
While the near-surface temperature gradient is reducing due to sea ice loss and changing cloud radiative properties in the Arctic, an increased latent heat release in the tropics is strengthening the upper-tropospheric temperature gradient (Shaw et al., 2016). The associated circulation response is described as a poleward expansion of the Hadley cells (Lu et al., 2007; Grise et al., 2019; Grise and Davis, 2020), which is associated with a poleward shift of the extratropical storm tracks and strengthened mid-latitude jet streams (Butler et al., 2010; Chang et al., 2012; Barnes and Polvani, 2013). In the Southern Hemisphere, polar stratospheric cooling due to ozone depletion caused by anthropogenic emissions reinforces the greenhouse gas-related signal associated with tropical upper-tropospheric warming (Arblaster and Meehl, 2006; Thompson et al., 2011). Consequentially, a significant positive trend in the Southern Annular Mode (SAM) was observed, particularly during the 1980s and 1990s (Thompson et al., 2000; Marshall, 2003). While the ozone-related trend shows signs of having paused (Banerjee et al., 2020), the greenhouse gas-related signal is expected to grow stronger (Shindell and Schmidt, 2004; Arblaster et al., 2011; Watt-Meyer et al., 2019). Moreover, a relationship between tropical mid-tropospheric geopotential height and the interannual variability of the SAM (Ding et al., 2014) builds confidence in the projected change. In the Northern Hemisphere, on the other hand, slowly emerging trends are often regional and strongly dependent on season (Shaw et al., 2024). While reanalysis data points towards a dominance of the tropical warming over Arctic amplification resulting in a poleward shift of the jet (Woollings et al., 2023), open questions about the strength of certain feedbacks remain (Screen et al., 2022).
Reducing uncertainties in the projection of the strength and position of the mid-latitude storm track constitutes a formidable task for complex coupled climate models. Idealized models, on the other hand, are well suited to build process understanding. Here, we use a simple general circulation model to explore a mechanism that relates the frequency of hot extremes to the spectral properties of large-scale atmospheric waves for the two scenarios of Arctic amplification and tropical expansion. Specifically, we focus on heatwaves, defined by a minimum number of consecutive hot days at a given location (e.g., Perkins and Alexander, 2013), and link them to the zonal phase speed of upper-tropospheric disturbances (Fragkoulidis and Wirth, 2020). The phase speed of upper-tropospheric disturbances, or Rossby waves, is used here as a persistence metric for dynamically forced subsidence and temperature advection (Wicker et al., 2024). Global coupled climate models project a decrease in the dominant zonal wavenumber in eddy kinetic energy spectra (Chemke and Ming, 2020) and an increase in phase speed in eddy momentum flux spectra (Chen and Held, 2007) in response to anthropogenic climate change. However, we still lack full understanding of these projections.
For the first part of this study (Sect. 3), we follow the modeling setup by Butler et al. (2010) and perform a suite of experiments that produce a wide range of wave characteristics in a dry dynamical model (see Sect. 2.1) to shed new light on the relation between heatwaves and the strength and position of the storm track. Heatwaves in a dry dynamical model are driven primarily by adiabatic warming due to subsidence and warm air advection (Jiménez-Esteve and Domeisen, 2022), whereas cloud radiative effects and thermodynamic feedbacks are explicitly not simulated. These idealized experiments are therefore well suited to isolate the role of atmospheric dynamics. In the second part of this study (Sect. 4), we compare the idealized modeling results to reanalysis data for the Southern Hemisphere to assess the importance of dry dynamics in the real world. While the Southern Hemisphere mid-latitudes feature a significant positive phase trend and a distribution of hot day persistence similar to idealized experiments, we also discuss limitations of our model and relate them to differences in the climatological-mean spectrum between the model and reanalysis.
2.1 Idealized experiments
Our model experiments are based on the Held and Suarez (1994) configuration of the ICOsahedral Nonhydrostatic atmospheric model (ICON version 2.6.4; Zängl et al., 2015; Giorgetta et al., 2018; Russo et al., 2025) and run for 50 years of 360 d each with six-hourly output after discarding one year of spin-up. Specifically, we use the R2B4 grid configuration, corresponding to a horizontal resolution of approximately 160 km, and we use 47 vertical levels. In the reference simulation, the atmospheric flow is forced by relaxation to an equilibrium temperature profile and damped by linear friction in the lower troposphere as well as horizontal diffusion of temperature and momentum (Held and Suarez, 1994). Note, in particular, that the model forcing is zonally symmetric and features no seasonal or diurnal cycle.
Following the approach by Butler et al. (2010), we conduct a range of sensitivity experiments where we impose circulation changes by forcing the temperature balance with an additional localized, but zonally symmetric heat source (see Appendix A for details). Mathematically, this is equivalent to adjusting the equilibrium temperature profile towards which the circulation is relaxed. First we compare the reference simulation to two selected sensitivity experiments (i.e., exp9 and exp4, Table A1) with either a tropical upper-tropospheric heat source or an Arctic surface-intensified heat source that produce a 4° N poleward or equatorward storm track shift, respectively (Fig. 1d). To assess potential non-linear effects, we then compare ten additional experiments with combined tropical and Arctic heat sources or sinks. Finally, we compare the model results to ERA5 reanalysis data (Hersbach et al., 2020) for the satellite era from 1979 to 2022. For computational efficiency, upper-tropospheric meridional wind from ERA5 is regridded to a horizontal resolution of 2°×2° and daily-maximum 2 m temperature is regridded to a resolution of 0.5°×0.5°.
2.2 Diagnostics
Throughout this study, we define heatwaves as events of at least three consecutive hot days. As our numerical model has no seasonal cycle, diurnal cycle, or topography, we can define hot days in the model based on a grid point-dependent but otherwise fixed 90th percentile threshold for daily mean temperature at 1000 hPa. For each experiment, the temperature threshold is set separately. By definition, each model grid point experiences on average 36 hot days per year. The frequency and duration of heatwaves are, therefore, solely a function of hot day persistence. In ERA5 data, we define hot days based on a seasonally varying 90th percentile threshold of daily maximum 2 m temperature for a 31 d multi-year rolling window (see, e.g., Russo and Domeisen, 2023; Brunner and Voigt, 2024). The number of hot days per year at any grid point varies significantly between the first and the second half of the time series because we do not detrend the ERA5 temperature data before estimating the 90th percentile from the data from 1979 to 2022.
A key diagnostic to characterize the atmospheric circulation is vertically integrated kinetic energy for 10 d high-pass filtered horizontal wind anomalies obtained by convolution with a 30 d Lanczos kernel. The maximum of zonal-mean eddy kinetic energy can be referred to as the mid-latitude storm track (e.g., Shaw et al., 2016), not to be confused with extratropical cyclone tracks from tracking algorithms of pressure minima (e.g., Sprenger et al., 2017). The spectral properties of Rossby waves are assessed based on power spectra of meridional wind anomalies at 250 hPa in coordinates of zonal wavenumber and phase speed following the methodology of Randel and Held (1991). For the idealized model experiments presented in Sect. 3 we compute the climatological mean for the entire time series of 1285 individual spectra for 14 d tapered windows. The choice of the window length is a trade-off between temporal and phase speed resolution (Wicker et al., 2024). The spectra for ERA5 data presented in Sect. 4 are computed as the climatological mean of 1144 spectra, where meridional wind anomalies are computed with respect to a seasonally varying climatology of 14 d multi-year windows. The wave packet diagnostic in Figs. 4 and 8 is based on the Hilbert transform of composite-mean temperature anomalies that are zonally filtered in Fourier space for zonal wavenumbers 3–15 (Zimin et al., 2003).
3.1 Storm track latitude and phase speed
The first step in this study is to compare our model simulations to the benchmark by Butler et al. (2010). The zonally symmetric forcing (Held and Suarez, 1994) generates a potential temperature profile in our reference simulation that approximates equinox conditions (Fig. 1a). Zonal-mean potential temperature is symmetric around the equator, increases from the surface to the model top, and features a pronounced meridional gradient in the mid-latitudes. Butler et al. (2011) advocate a simple eddy-diffusive model to understand circulation changes based on changes in baroclinicity, an expression for the slope between surfaces of constant potential temperature and surfaces of constant pressure. The sensitivity experiment with tropical forcing shows a zonally symmetric warming that is largely confined to the tropical upper troposphere (Fig. 1b), enhancing both the meridional potential temperature gradient in the mid-latitudes and vertical stratification in the tropics and subtropics. The response to the tropical forcing is, therefore, a dipole of reduced baroclinicity in the subtropics and enhanced baroclinicity further poleward (Butler et al., 2011). The sensitivity experiment with Arctic forcing shows a surface-intensified warming at the boreal high latitudes reducing stratification and the meridional gradient (Fig. 1c). Mid-latitude eddy heat fluxes are tightly linked to these changes in baroclinicity. The eddy heat flux response to tropical forcing (black contours in Fig. 1b), in particular, mirrors the dipole response of baroclinicity and indicates a poleward shift of the mid-latitude heat flux maximum. The response in eddy heat flux to Arctic forcing, on the other hand, shows an equatorward shift but also a clear weakening of the heat flux maximum (black contours in Fig. 1c). These results obtained with the ICON model generally agree with the benchmark from the Colorado State University general circulation model (Butler et al., 2010). To achieve a quantitative agreement, however, we have reduced the amplitude of the tropical forcing, increased the amplitude of the Arctic forcing, and modified its vertical profile (see Appendix A).
A comparison of the three experiments in terms of eddy kinetic energy and zonal-mean zonal wind delivers measurable insight into the mid-latitude circulation. The eddy kinetic energy response to individual forcings (Fig. 1d) resembles the response in the eddy heat flux with a poleward shift in response to tropical heating and an equatorward shift combined with a weakening for the case of Arctic heating. A sensitivity experiment with combined forcing (exp8, Table A1) shows a weakening in maximum eddy kinetic energy but no meridional shift (red line in Fig. 1d) indicating that the circulation response is approximately additive. The zonal wind response to thermal forcing is strongly dependent on altitude (Butler et al., 2010). Here, we use the mass-weighted vertical average of zonal-mean zonal wind (Fig. 1e) that is determined mostly by the lower troposphere as a proxy for the eddy-driven jet that arises from the stirring of the mid-latitude potential vorticity contrast (Kidston and Vallis, 2012). The location of the eddy-driven jet is closely linked to the mid-latitude storm track. In particular, we find that the maximum of the vertically averaged zonal wind shifts poleward or equatorward by 5° N in response to tropical or polar heating, respectively (Fig. 1e). In addition, we find that the poleward shifted jet is strengthened to 18.3 ± 0.3 m s−1 compared to the reference of 17.6 ± 0.2 m s−1 while the equatorward shifted jet is weakened to 16.9 ± 0.2 m s−1. This finding confirms a previously reported relationship between the latitude and the speed of the eddy-driven jet (Kidston and Vallis, 2012). The strength of the eddies, on the other hand, appears less important for the strength of the eddy-driven jet, as indicated by the experiment with the combined forcing (red line in Fig. 1e) where the magnitude of eddy kinetic energy is reduced while the location of its maximum and the strength of the jet are largely unchanged.
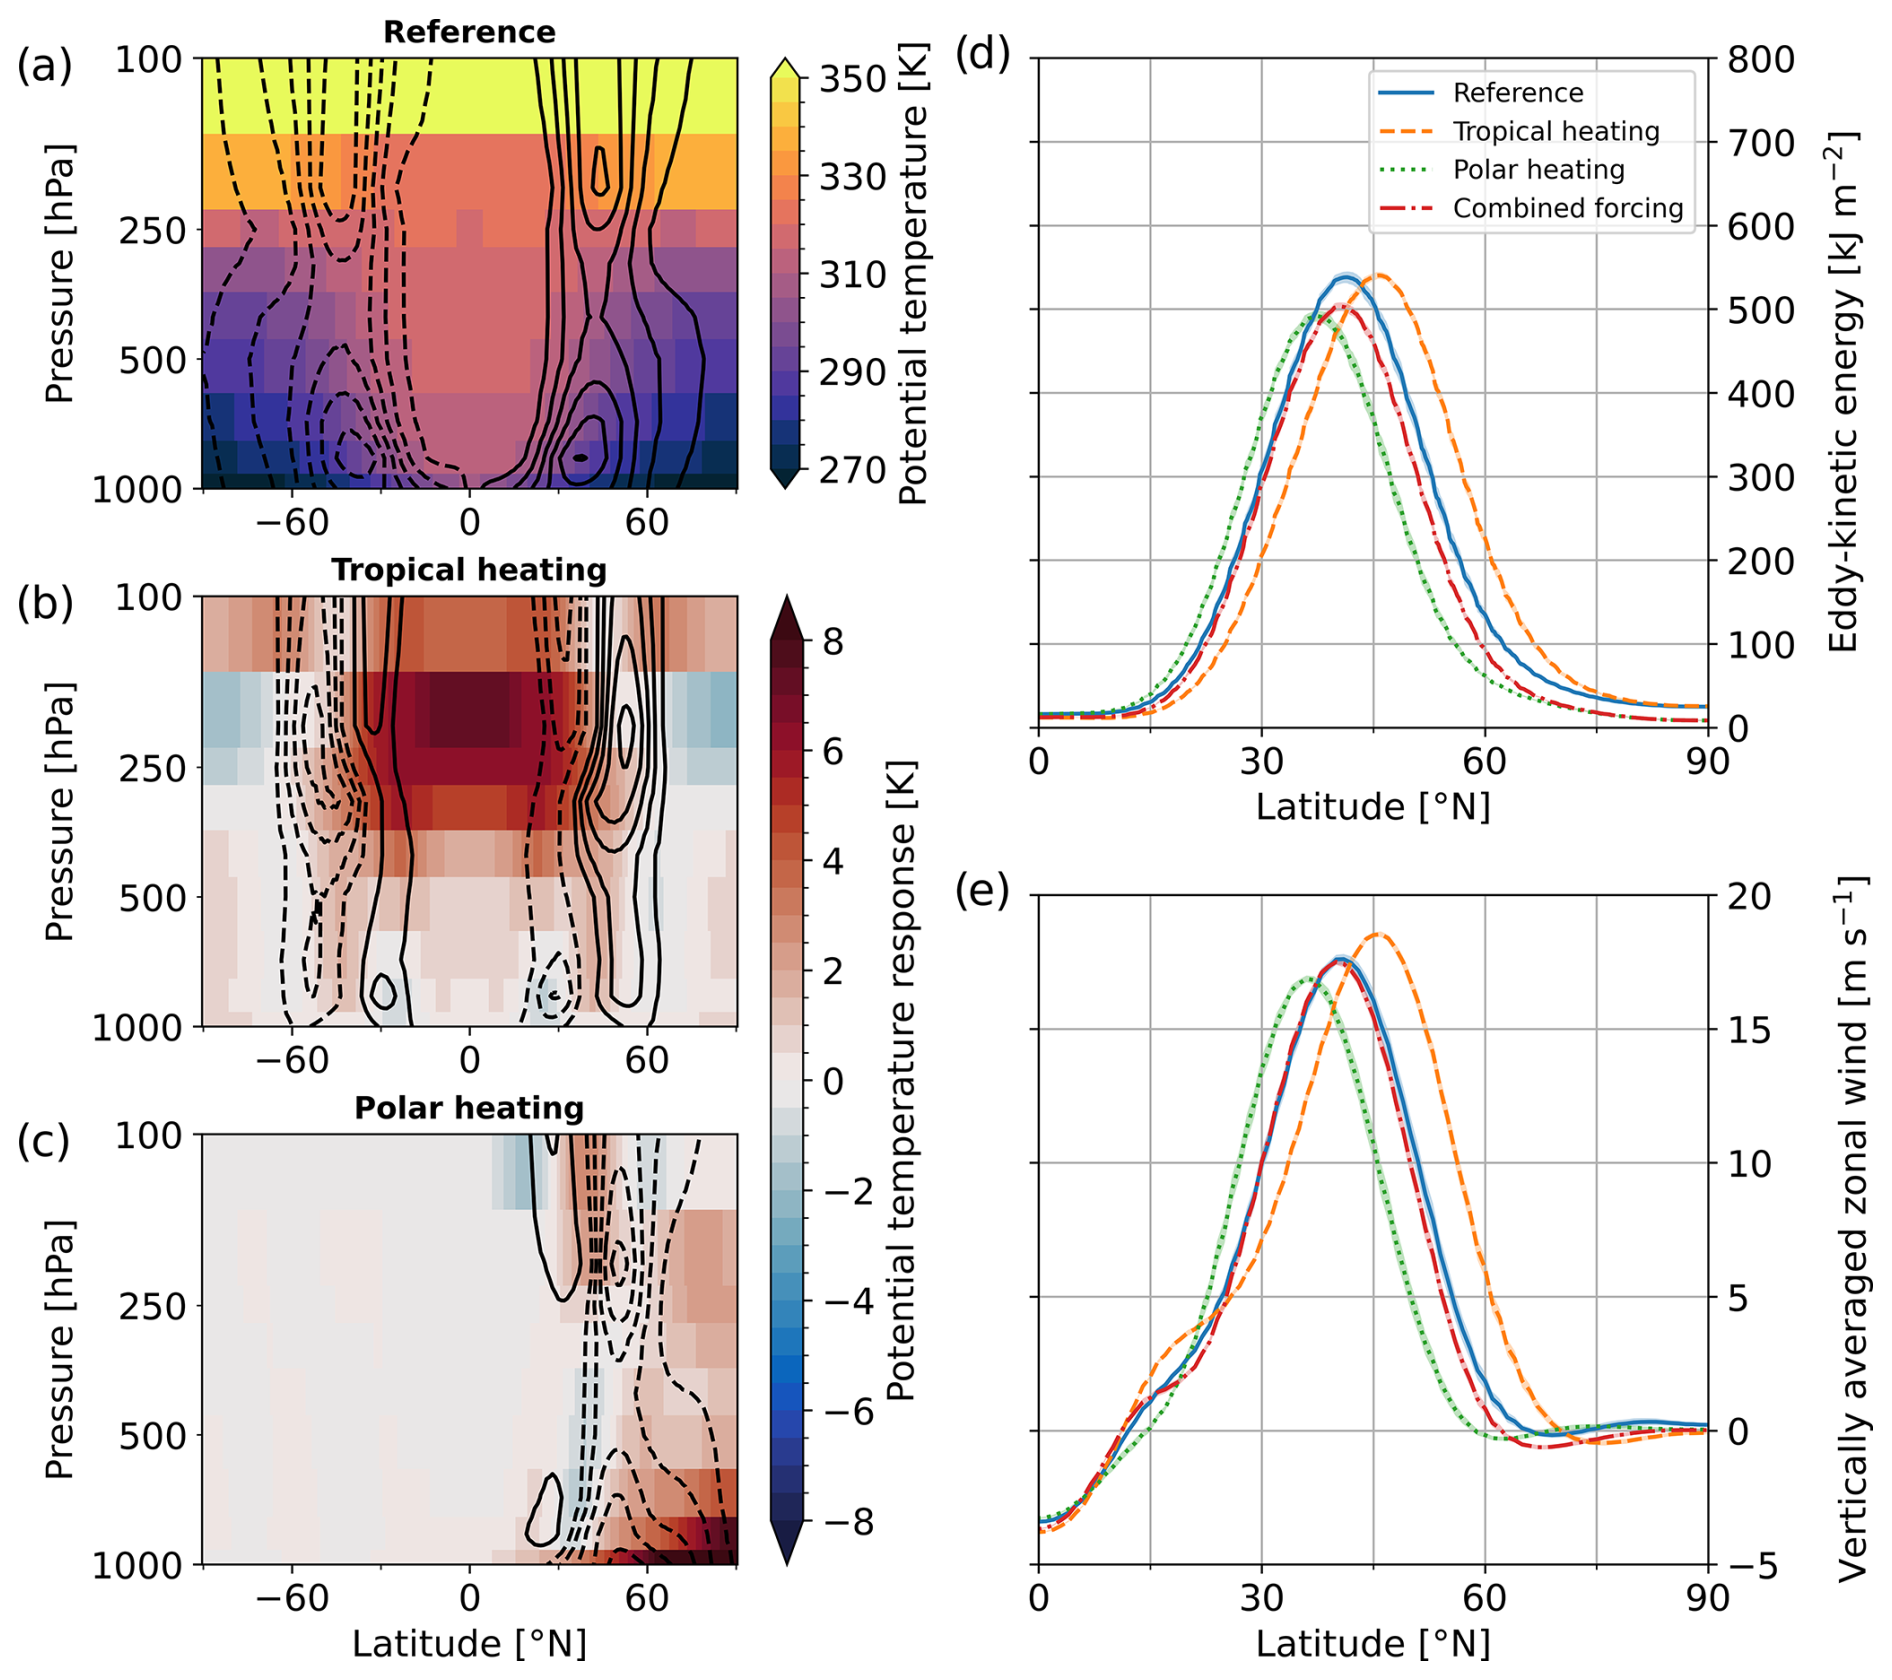
Figure 1(a) Zonal-mean potential temperature (shading) and mean meridional eddy heat flux (black contours with spacing of 3 K m s−1, negative values dashed) in the reference simulation and (b)–(c) the response in and (contour spacing of 1 K m s−1) in the sensitivity experiments exp9 and exp4 with a tropical and a polar heat source, respectively. Lines of (d) vertically integrated eddy kinetic energy and (e) mass-weighted vertically averaged, zonal-mean zonal wind for the reference simulation, the two experiments with a single forcing, and experiment exp8 with combined tropical and polar forcing with a color shading that indicates the 95 % confidence interval based on a bootstrapping of annual means.
In the following, we discuss a relationship between the storm track latitude and the zonal phase speed of synoptic-scale disturbances in the upper troposphere. The Hayashi spectra in Fig. 2a–c depict the phase speed spectrum of meridional wind variance as a function of zonal wavenumber. In general, the spectra show high variance for wavenumbers 5 to 8 and an increasingly eastward phase speed for increasing zonal wavenumber from less than 0 to roughly 10 m s−1. The spectral information can be summarized by the centroid (the “center of mass”) of the spectrum indicated by black markers in Fig. 2a–c. For the reference simulation, the centroid lies at a phase speed of 4.3 ± 0.1 m s−1 and zonal wavenumber 6.26 ± 0.03 (black circle). Tropical and polar forcing cause statistically significant, dipole-shaped differences in power spectral density (Fig. 2b, c) in the respective sensitivity experiments. The centroid is shifted to a higher phase speed of 5.2 ± 0.1 m s−1 and a lower wavenumber of 5.88 ± 0.02 in association with a poleward storm track shift (black cross in Fig. 2b), whereas the centroid is shifted to a lower phase speed of 3.1 ± 0.1 m s−1 and higher wavenumber of 6.62 ± 0.02 for the equatorward shifted storm track (black cross in Fig. 2c). A baseline for understanding how the phase speed of upper-tropospheric disturbances might be related to the storm track latitude is given by the Rossby wave dispersion relation from linear theory. More specifically, the zonal phase speed cp of barotropic Rossby waves can be expressed as a function of mean zonal wind , the meridional planetary vorticity gradient β, and the zonal and meridional wavenumber k and l.
Both the mean zonal wind and the meridional planetary vorticity gradient β are functions of latitude. Therefore, in Fig. 2d–e, we plot the centroid of the Hayashi spectra averaged over smaller meridional bands of 5° N width, compared to the broad meridional range of 35 to 65° N used for the spectra in Fig. 2a–c, against latitude. A local maximum in phase speed around the core of the storm track (Fig. 2d) and a rapid decrease in zonal wavenumber towards higher latitudes (Fig. 2e) are clearly visible. Comparing the experiments with tropical and polar heating, phase speed is increased or decreased over the entire range of latitudes as the storm track is shifted poleward or equatorward, respectively. Based on Eq. (1), this could be explained by a lower β at higher latitudes. More plausibly, however, the relationship between phase speed and storm track latitude is explained by the strength of the vertically averaged zonal-mean zonal wind or eddy-driven jet (Fig. 1e). In particular, we find that the responses in phase speed and jet strength to thermal forcing conform within the limits of uncertainty (Table S1 in the Supplement). Following the reasoning of Kidston and Vallis (2012), the relationship between latitude and strength of the eddy-driven jet, in turn, is explained by the inverse proportionality between the eddy stirring efficiency and the meridional absolute vorticity gradient β*. The zonal wavenumber is affected by the thermal forcing mostly equatorward of 50° N (Fig. 2e).
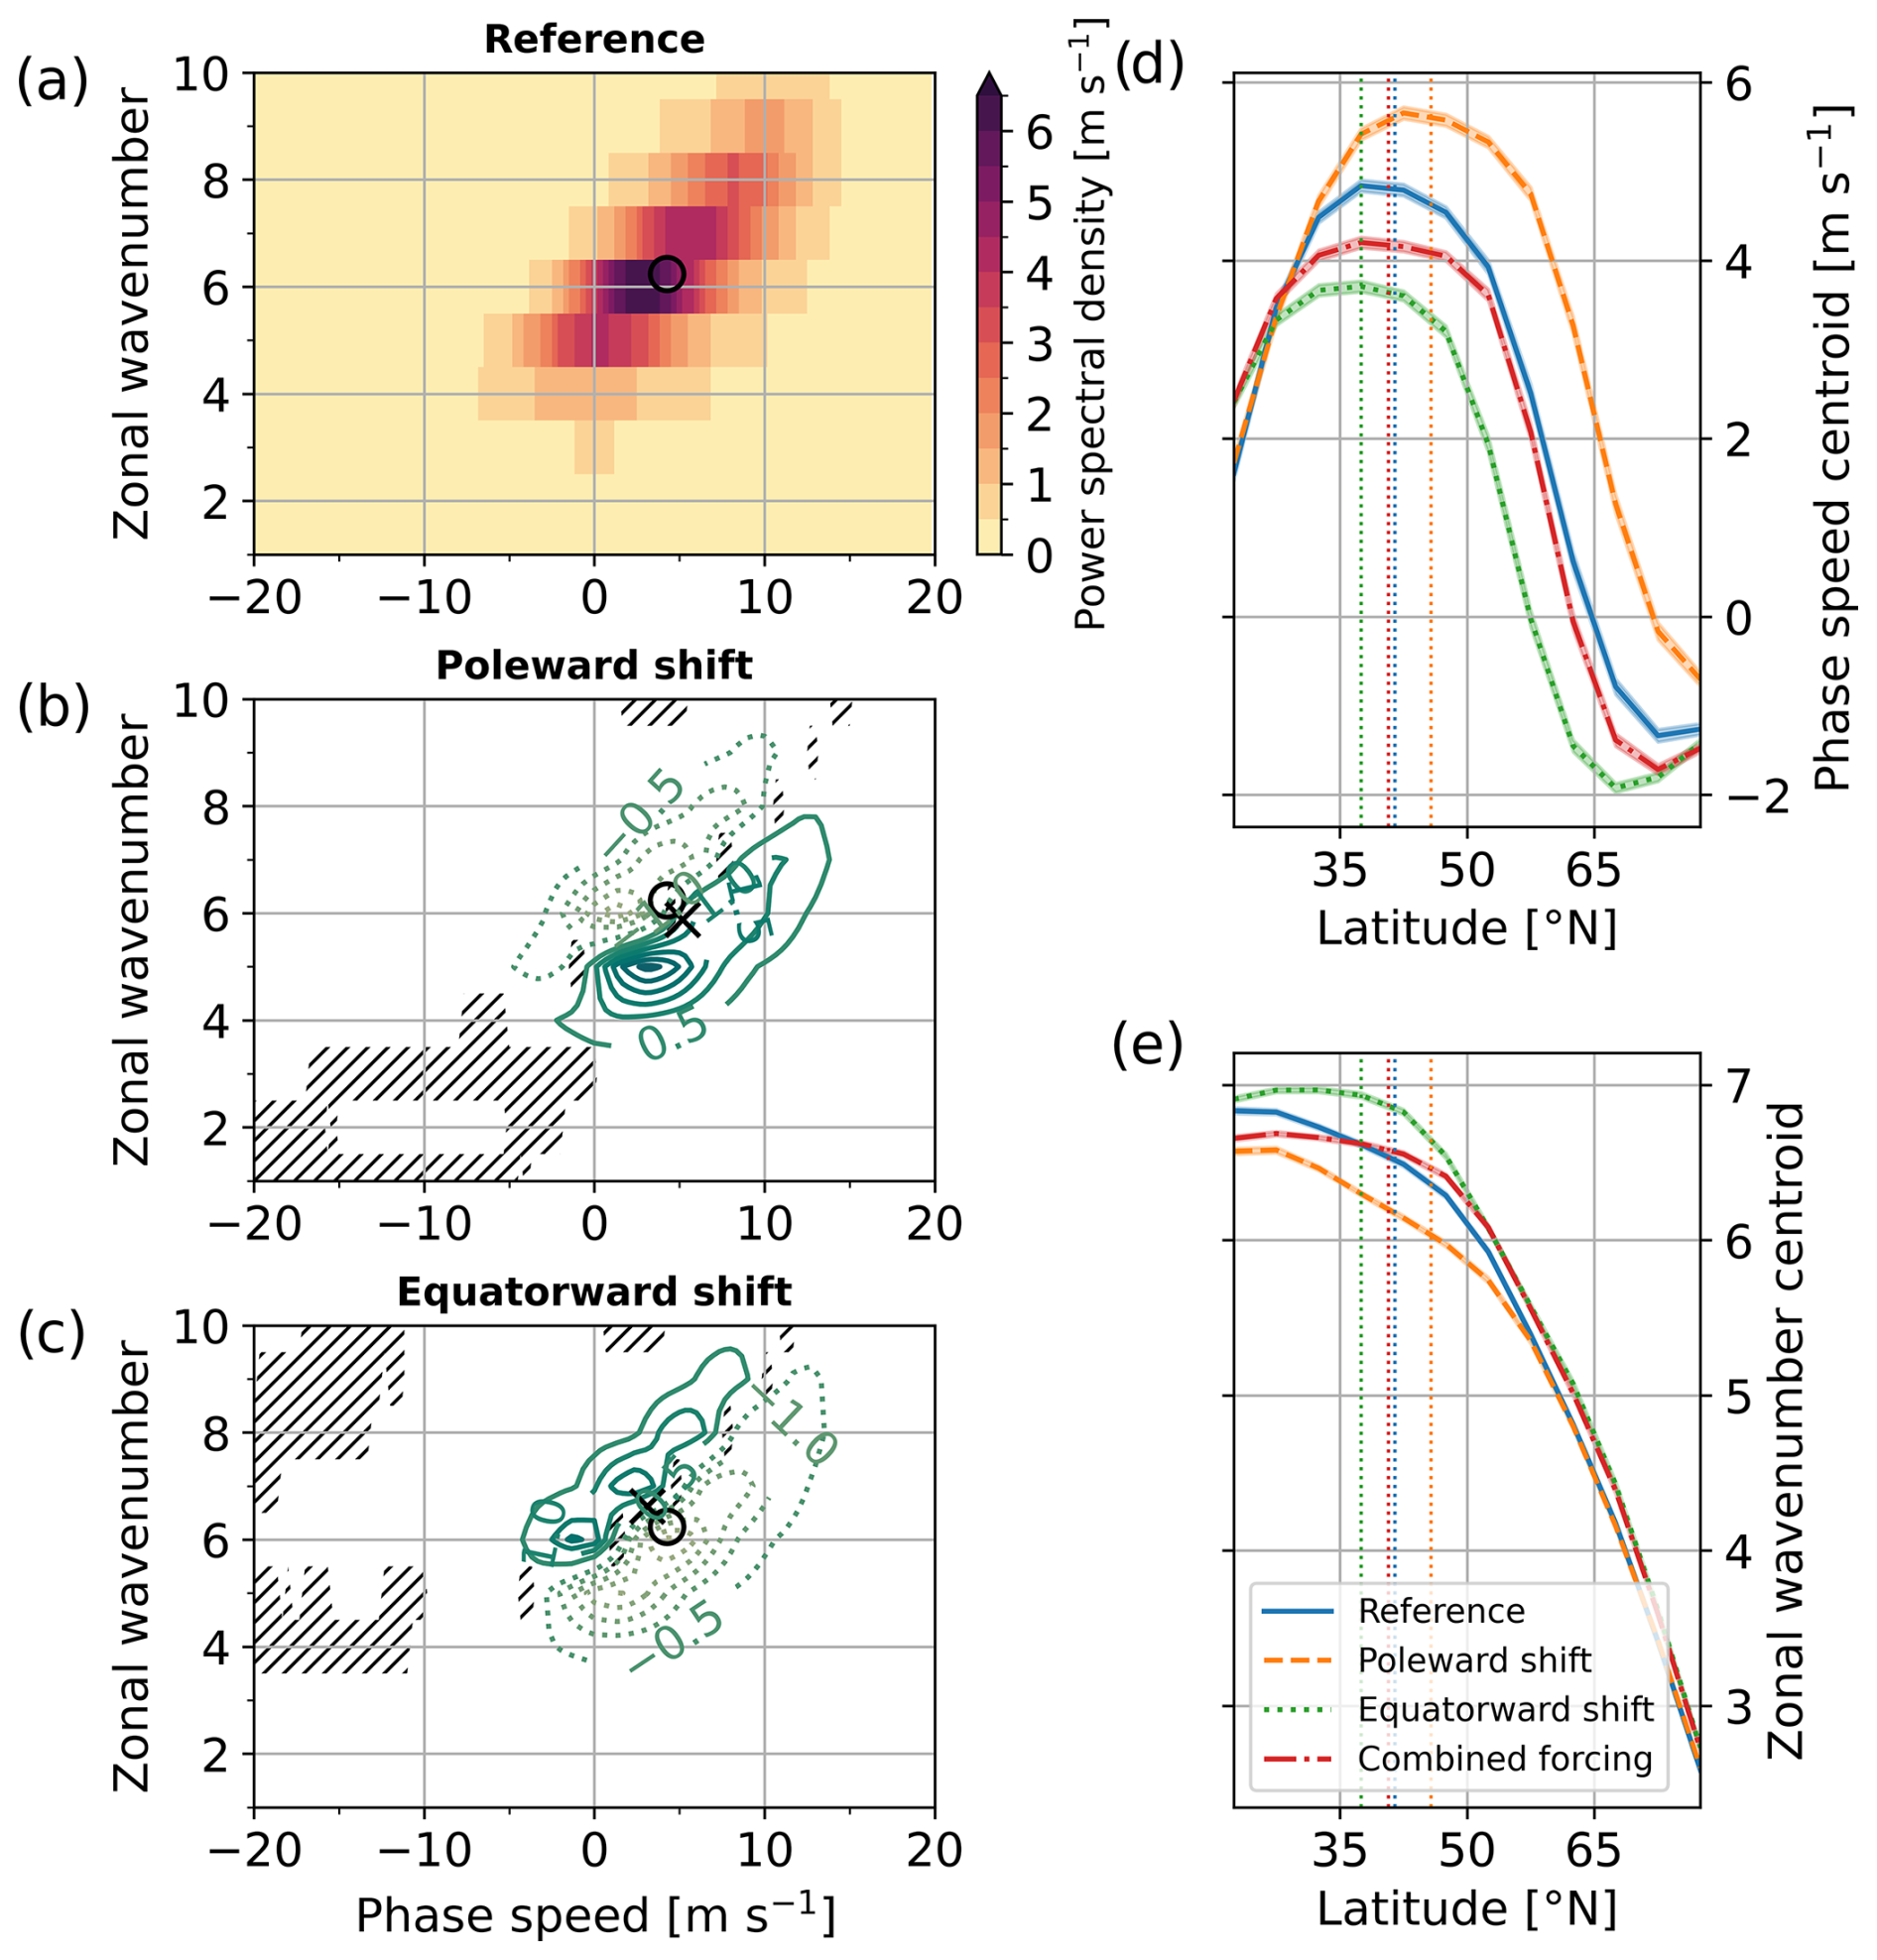
Figure 2Climatological-mean meridional-mean (35 to 65° N) power spectral density of meridional wind at 250 hPa for (a) the reference simulation and (b)–(c) the difference in the sensitivity experiments exp9 and exp4 with a poleward or an equatorward storm track shift, respectively. The circle indicates the centroid of the meridional-mean spectrum for the reference simulation, the “x” markers indicate the centroid for the respective sensitivity experiment. Hatching indicates where the spectrum of the reference simulation and the sensitivity experiment are not significantly different at the 99.9 % confidence level based on a parametric bootstrap of 14 d windows. The centroid of (d) phase speed spectra and (e) zonal wavenumber spectra averaged over smaller 5° N latitude band widths is plotted as a function of central latitude with the 95 % confidence interval (shading). The dotted vertical lines in (d)–(e) indicate the location of the maximum eddy kinetic energy.
3.2 Persistent temperature extremes
Next, we assess the response in persistent temperature extremes to the idealized thermal forcing. A climatological heatwave frequency has, according to the definition employed in Sect. 2.2, an upper bound of 36 d yr−1. In this case, every hot day that exceeds the 90th percentile threshold for near-surface temperature forms part of a heatwave. Our reference simulation shows a heatwave frequency above 30 d yr−1 in the low and high latitudes close to the theoretical maximum (Fig. 3a). In the mid-latitudes, however, about 5° N poleward of the EKE maximum, heatwave frequency reduces to approximately 14 d yr−1. There, less than 40 % of the hot days form part of a heatwave with a minimum duration of 3 d. The strongest response in heatwave frequency to the idealized forcing is seen between 45 and 65° N (Fig. 3a). The sensitivity experiment with polar heating shows an increase, whereas the experiment with tropical heating shows a decrease in heatwave frequency. An alternative way to summarize the results is to say that the mid-latitude heatwave frequency minimum shifts in coherence with the EKE maximum between 43 and 52° N. The magnitude of minimum heatwave frequency is reduced or increased for a poleward or an equatorward shift of the EKE maximum, respectively.
A mid-latitude minimum, similar to the one for heatwave frequency, is also seen for heatwave duration (Fig. 3b). This mid-latitude minimum shifts meridionally in a similar fashion as the frequency minimum. Its magnitude, however, does not change significantly with values for the meridional minimum of mean heatwave duration between 3.71 and 3.77 d. For a better understanding of the different responses in heatwave frequency and duration, we plot the distribution in hot day persistence as a function of latitude in Fig. 3c–d: The black contours depict the frequency density of consecutive hot days that form part of a set with a given length for the reference simulation. Integrating the frequency density over length from one to infinity yields 36 d yr−1, whereas integrating the density above the magenta grid lines (i.e., days with a persistence longer than 2 d) yields the heatwave frequency plotted in Fig. 3a. The distribution of hot day persistence is strongly skewed (black contours in Fig. 3c and d). While, in exceptional cases, the duration of a heatwave can reach two weeks or more, most mid-latitude heatwaves last only as long as the minimum duration of 3 consecutive days. The color shading in Fig. 3c–d shows the frequency density difference between the sensitivity experiments and the reference simulation. Integrating that density difference at a given latitude over length yields 0 d yr−1. In areas where the pivot point between a positive and a negative hot day density response associated with the storm track shift lies at a length between 2 and 3 d, any change in hot day persistence imprints strongly on heatwave frequency.
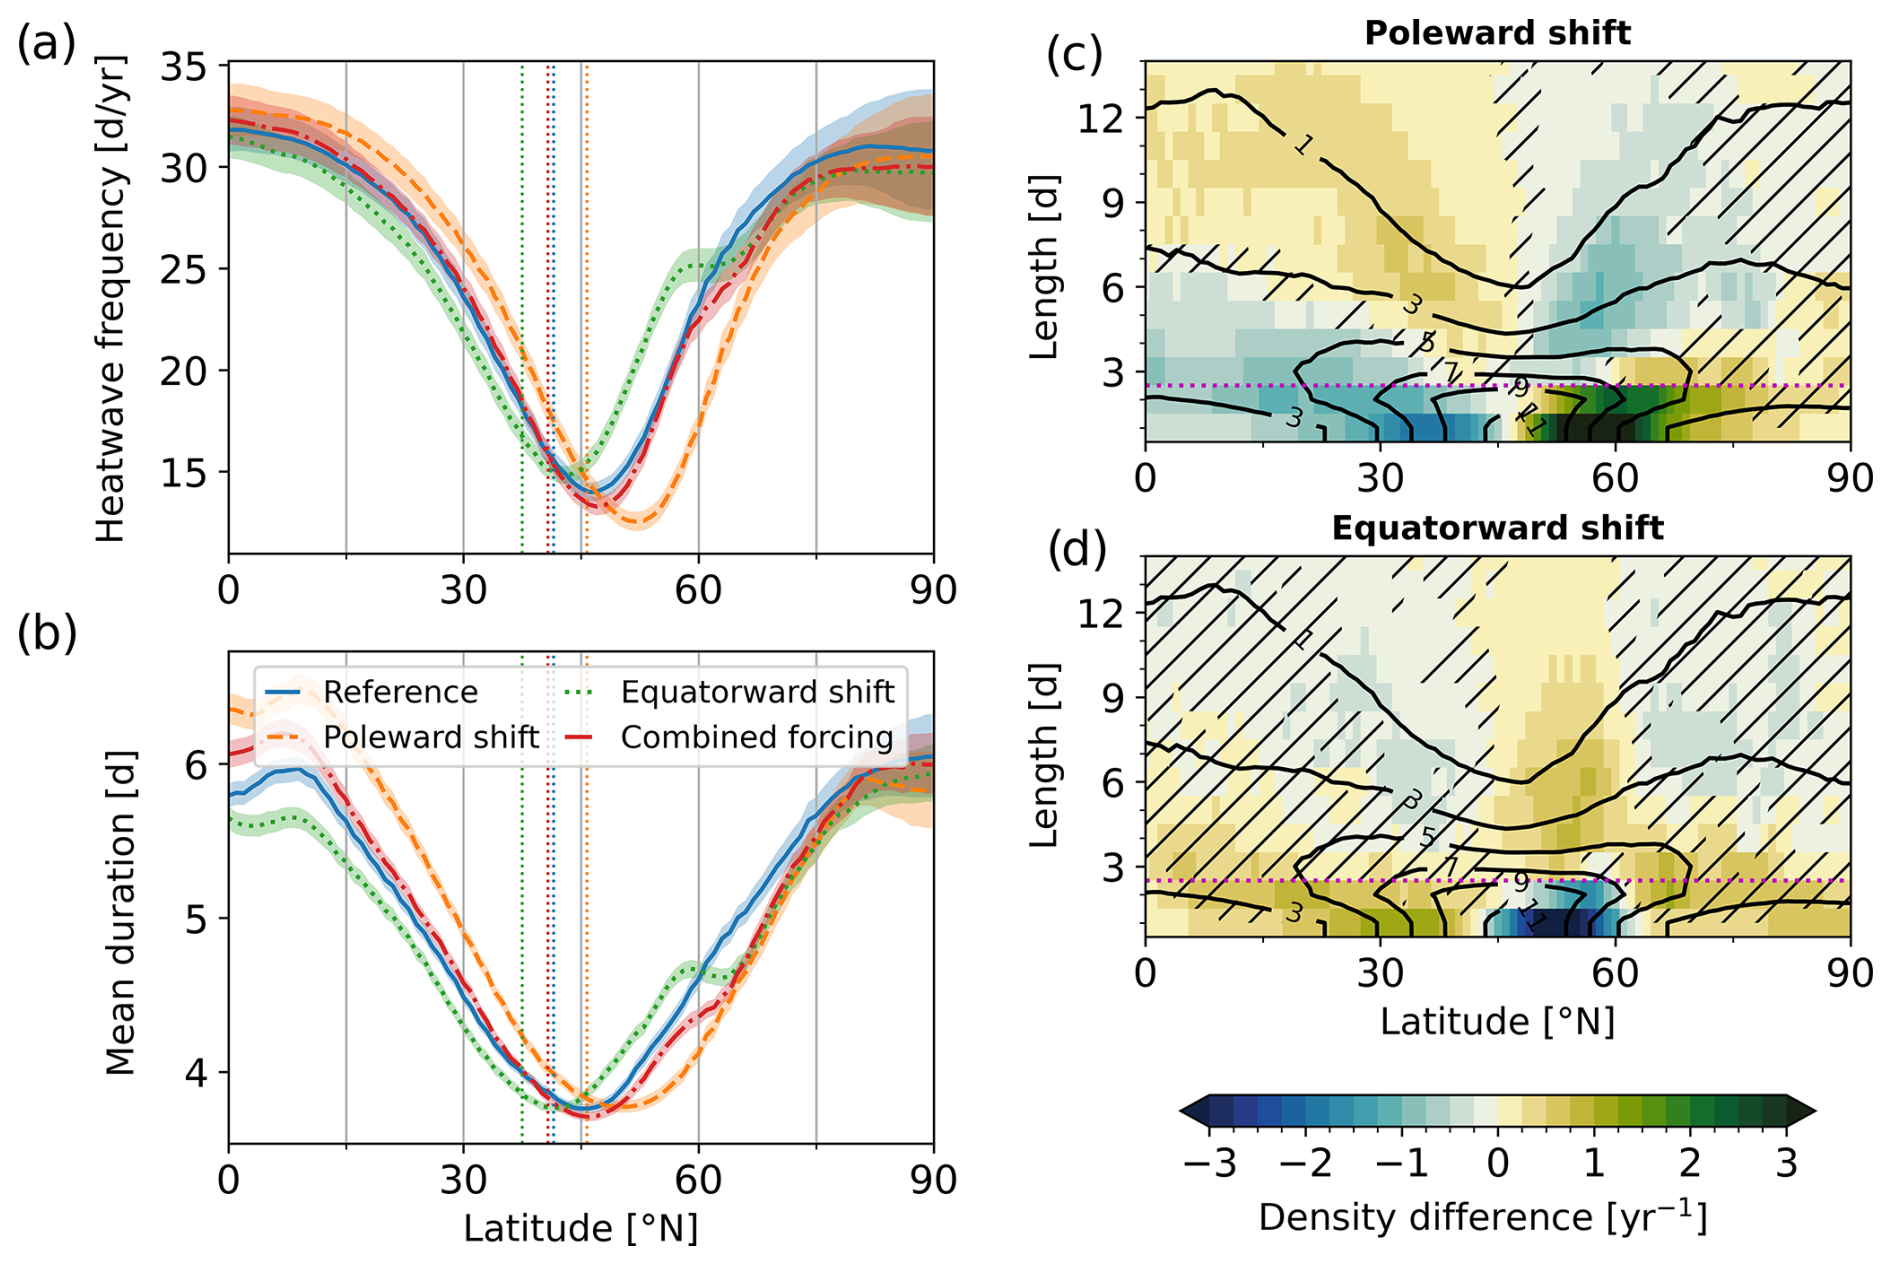
Figure 3Zonal mean of (a) heatwave frequency and (b) mean heatwave duration. The color shading indicates the 95 % confidence intervals. The storm track location in terms of the maximum eddy kinetic energy is indicated by dotted vertical lines for the reference simulation and the three sensitivity experiments. Changes in zonal-mean hot day frequency density with respect to the reference run as a function of latitude for (c) experiment exp9 with a poleward storm track shift and (d) experiment exp4 with an equatorward storm track shift. Hatching indicates where the frequency density in the respective sensitivity experiment is not significantly different from the reference simulation at the 95 % confidence level and black contours indicate the frequency density in the reference simulation in units of yr−1. The magenta line indicates the minimum length to be classified as part of a heatwave.
Locally amplified Rossby wave packets are known to generate mid-latitude heatwaves (Jiménez-Esteve and Domeisen, 2022; Fragkoulidis et al., 2018). Based on the analysis in Sect. 3.1, we hypothesize that the mid-latitude minima in heatwave frequency and duration are linked to the mid-latitude phase speed maximum associated with the storm track. Hence, we seek to assess to what extent the phase speed response applies for heatwave-generating Rossby waves and how phase speed affects heatwave characteristics. Figure 4a–b depict composite-mean temperature anomalies with respect to the 90th percentile in coordinates of time and longitude relative to a heatwave onset, our proxy for the heatwave-generating Rossby wave. Positive anomalies at the center of the Hovmöller plot indicate the occurrence of hot days. Negative anomalies with respect to the 90th percentile in the upper-left and lower-right quadrants of the plot indicate close-to-climatological conditions. The key feature in these Hovmöller plots is, however, the succession of more and less negative anomalies indicating the eastward group propagation (solid black line) of a wave packet (amplitude in white contours) as time progresses. Propagating at a much lower pace than the wave packet envelope, closed contours of more or less negative temperature anomalies (blue color shading) represent the cold and warm phases of the wave packet before and after a local amplification that facilitates the occurrence of hot days. Comparing the Hovmöller plots of the two experiments with tropical and polar forcing at 50° N, we note that, first of all, the amplitude of the wave packet depends strongly on the distance to the storm track maximum (see Figs. S1 and S2 in the Supplement for a comparison at 45 and 55° N). But given our interest in the persistence of temperature extremes, we highlight the difference in phase speed and wavelength (slope and spacing of dotted lines) in Fig. 4c. In agreement with the differences shown by the Hayashi spectra of upper-tropospheric meridional wind (Fig. 2), the experiment with a poleward storm track shift shows faster phase propagation and higher wavelength than the experiment with an equatorward storm track shift. In other words, the response observed in climatological-mean phase speed spectra also applies for heatwave-generating Rossby wave packets.
To better understand how phase speed influences heatwave frequency, we now focus on the positive anomalies in the center of Fig. 4a–b where the composite mean exceeds the hot day threshold. One mechanism to limit the duration of a heatwave is the succession by an amplified cold phase of the wave packet. This would be the case for rapid phase propagation when the period of the carrier wave does not support a longer heatwave. A second mechanism is the gradual diminution of anomalies as the duration of wave packet amplification is limited by the width of the wave packet and its group velocity. In our model, mid-latitude heatwave duration is limited by the second mechanism: Most heatwaves last for only 3 d, whereas half a period of the carrier wave amounts to approximately 4.5 and 6.5 d. The similarity in group velocity (thin solid contour in Fig. 4c) for both sensitivity experiments might therefore explain the lack of a significant difference in the minimum of mean heatwave duration (Fig. 3b). Heatwave frequency, however, is limited by phase speed rather than group velocity. This can be seen from the stronger tilt of the hot phase (blue thick solid contour in Fig. 4c) for the case of a poleward storm track shift compared to the case of an equatorward storm track shift, which increases the longitudinal extent of positive temperature anomalies with respect to the 90th percentile. In other words, a faster phase propagation creates additional hot days upstream and downstream of the central longitude. However, there the occurrence of a warm phase is not synchronized with the amplification of the wave packet. The additional hot days upstream and downstream do not occur in a set of consecutive days that is long enough to be classified as a heatwave, but they are preceded or followed by an amplified cold phase of a wave packet. Since the number of hot days is by definition limited to 10 % of the time series, these isolated hot days lead to a reduction of heatwave frequency overall.
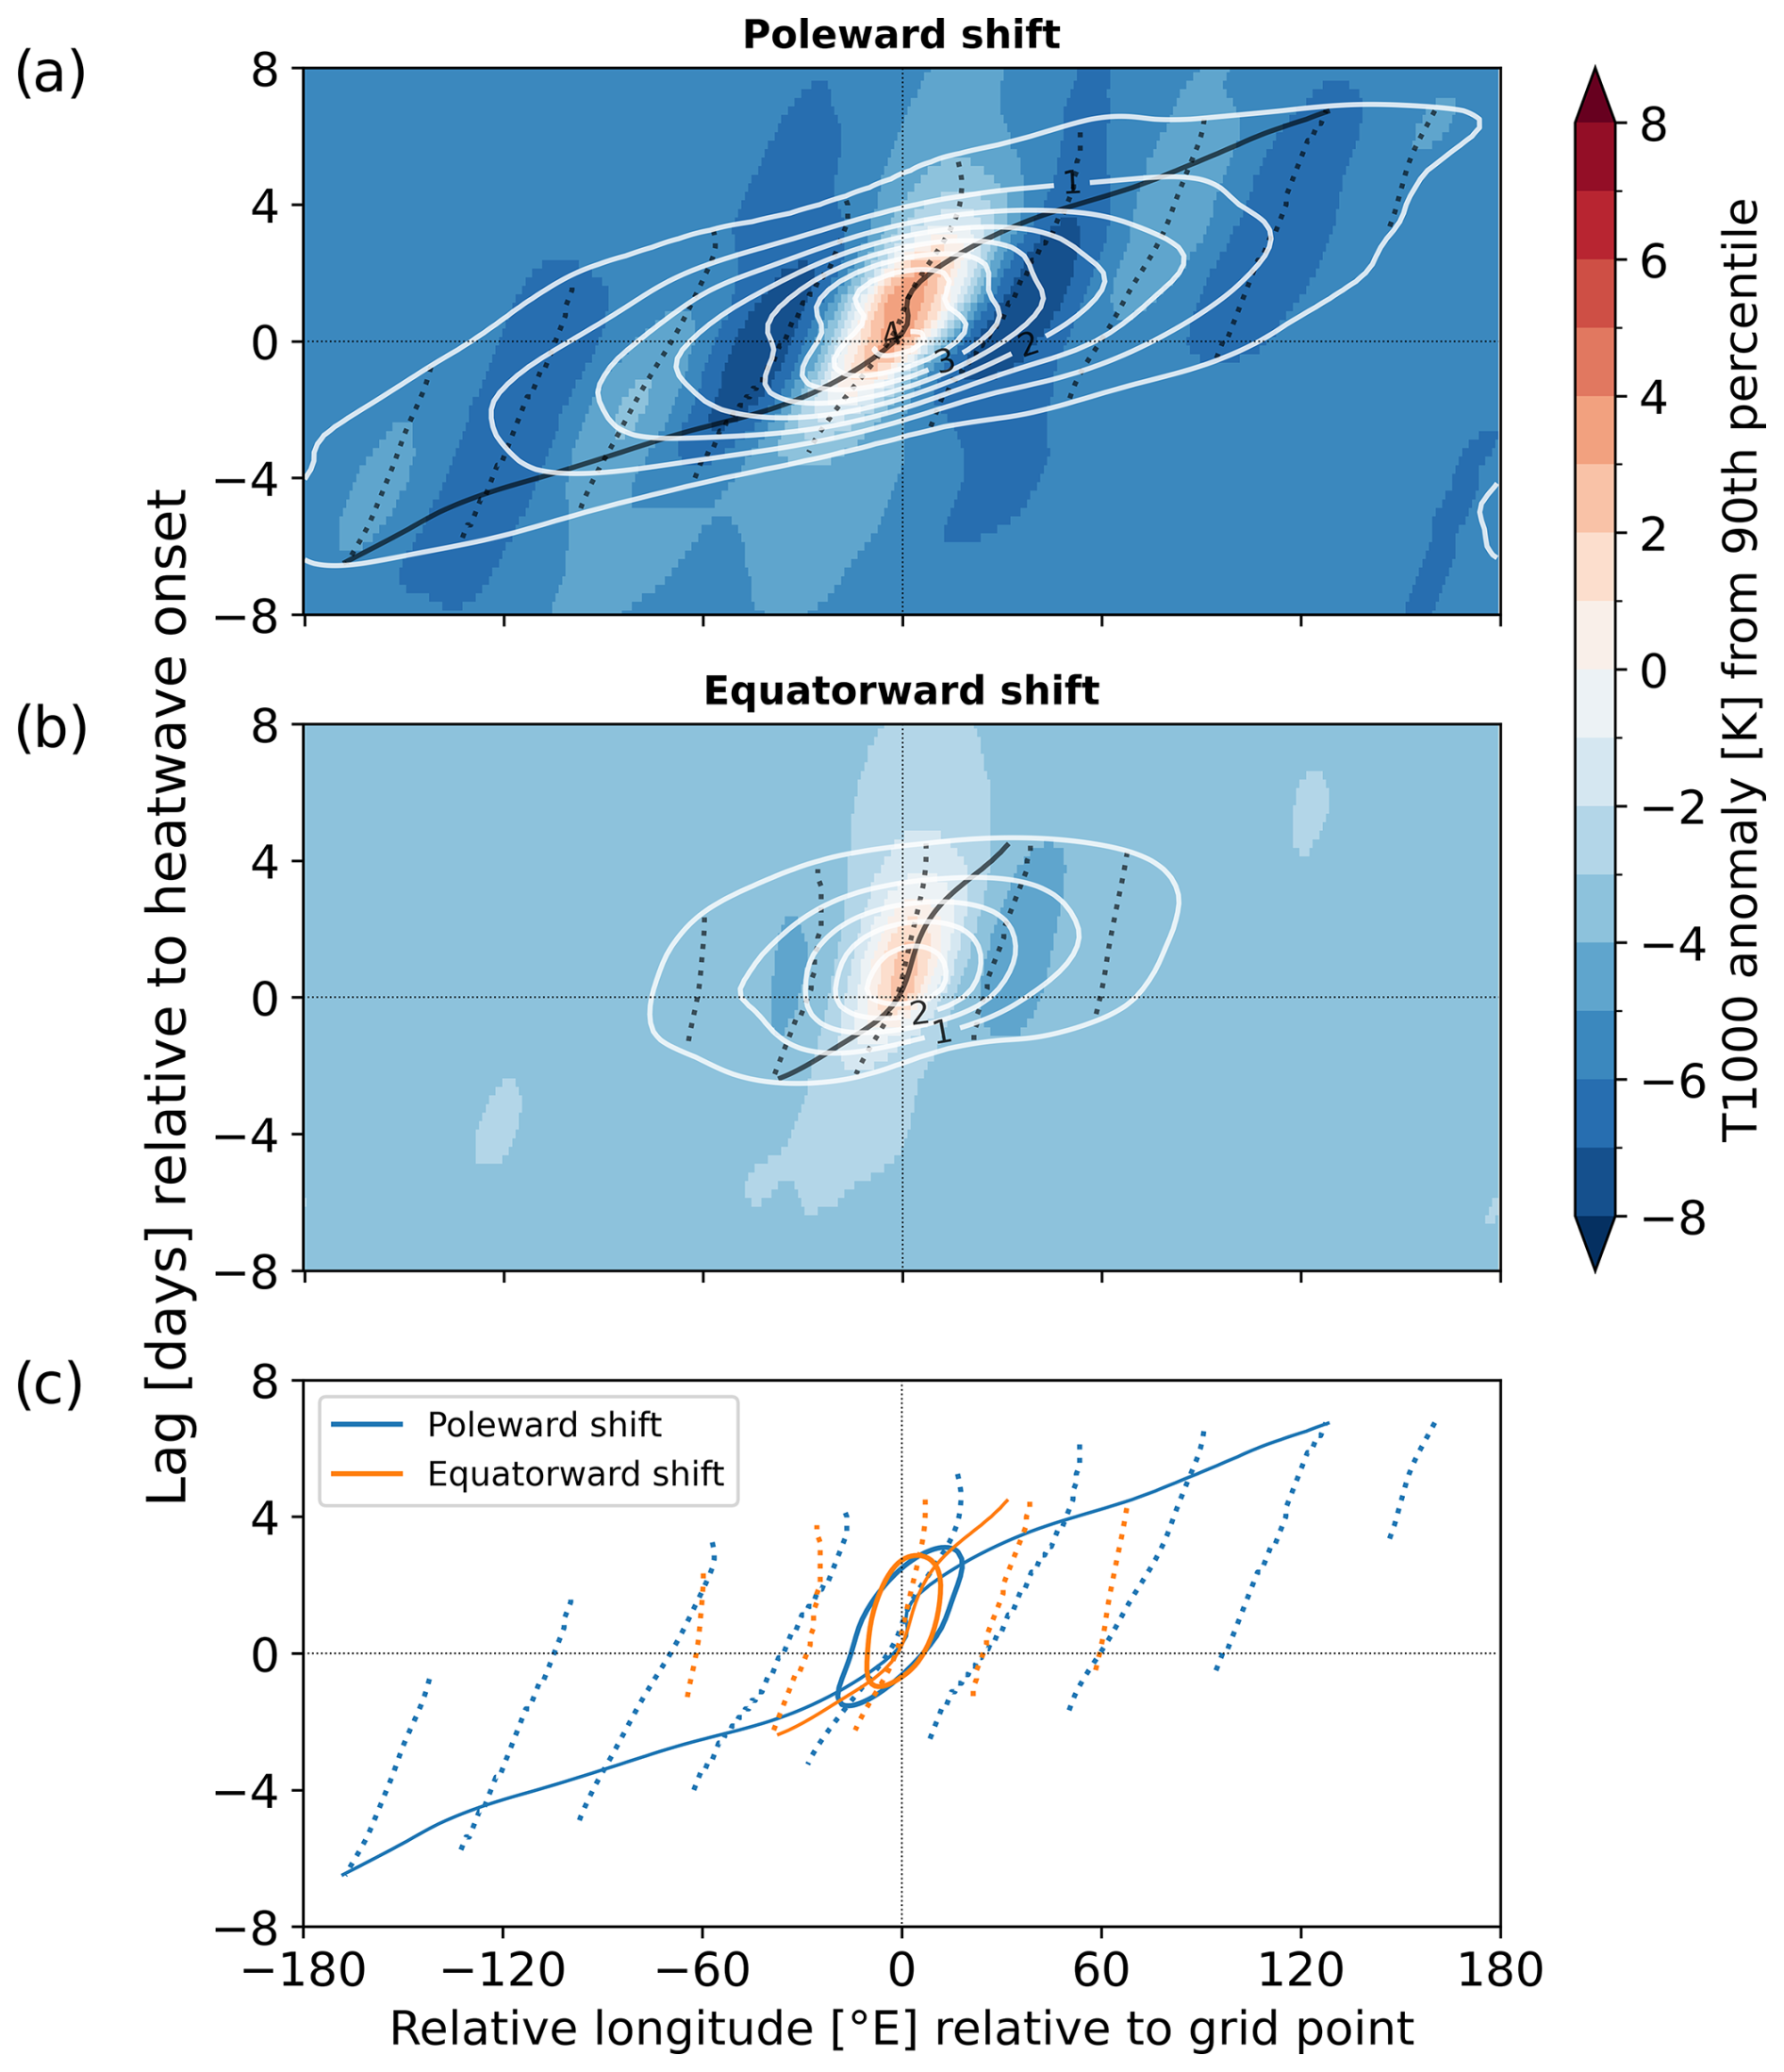
Figure 4Composite-mean temperature anomaly at 1000 hPa with respect to the 90th percentile at 50° N for heatwaves (a) in experiment exp9 with a poleward storm track shift and (b) in experiment exp4 with an equatorward storm track shift in days relative to the heatwave onset (y-axis) and longitude relative to the grid point where the heatwave is identified (x-axis). White contours indicate the strength of the wave packet envelope in units of K. Dashed black lines indicate contours of zero phase angle for the carrier wave, while the solid black lines indicate a constant phase angle of the wave packet envelope. The lines of constant phase angle for both experiments shown in (a) and (b) are plotted for comparison in (c) with the solid contour of 0 K composite-mean temperature anomaly.
3.3 Position overrules strength of mid-latitude eddies
In the previous Section, we explored a mechanism that relates a mid-latitude minimum in heatwave frequency to a phase speed maximum and the position of the extratropical storm track. The final step in this first part of our study is to evaluate this mechanism over a broader range of circulation changes. The strong linear relationship between the storm track position, the eddy-driven jet strength, and the phase speed of upper-tropospheric disturbances across all the 13 performed experiments is confirmed and illustrated by Table S1 and Fig. S3. Summarizing the mid-latitude heatwave signature by the position (Fig. 5a, b) and the value (Fig. 5c, d) of minimum heatwave frequency, we find a linear behavior over a range of storm track positions from approximately 35 to 47° N and storm track magnitudes from approximately 460 to 540 kJ m−2. Two experiments, where the storm track is either shifted far poleward to 51° N by strong tropical warming (exp1) or enhanced to 576 kJ m−2 by Arctic cooling (exp11), form outliers from that linear behavior.
A very high correlation of R=0.98 between the position of the heatwave frequency minimum and that of the storm track maximum confirms the above-reported behavior across all 13 experiments (Fig. 5a). On average, the latitude of the heatwave frequency minimum lies 5.8° N poleward of the storm track maximum. A significant negative correlation of is found between the minimum value of heatwave frequency and the position of the EKE maximum (Fig. 5c). Specifically, the minimum heatwave frequency is reduced by d yr−1 for every degree of poleward storm track shift. Removing the two positive outliers, the correlation strengthens to and the slope steepens to d yr−1 per degree. Fitting a linear model for the logarithm of minimum frequency yields a 2 % reduction per degree of poleward shift (Fig. S3c). When averaging heatwave frequency meridionally between 45 and 65° N, the correlation with the storm track position is strengthened to (Fig. S3d). In comparison, the maximum value of EKE energy has no significant predictive power, neither for the position nor for the value of minimum heatwave frequency (Fig. 5b, d).
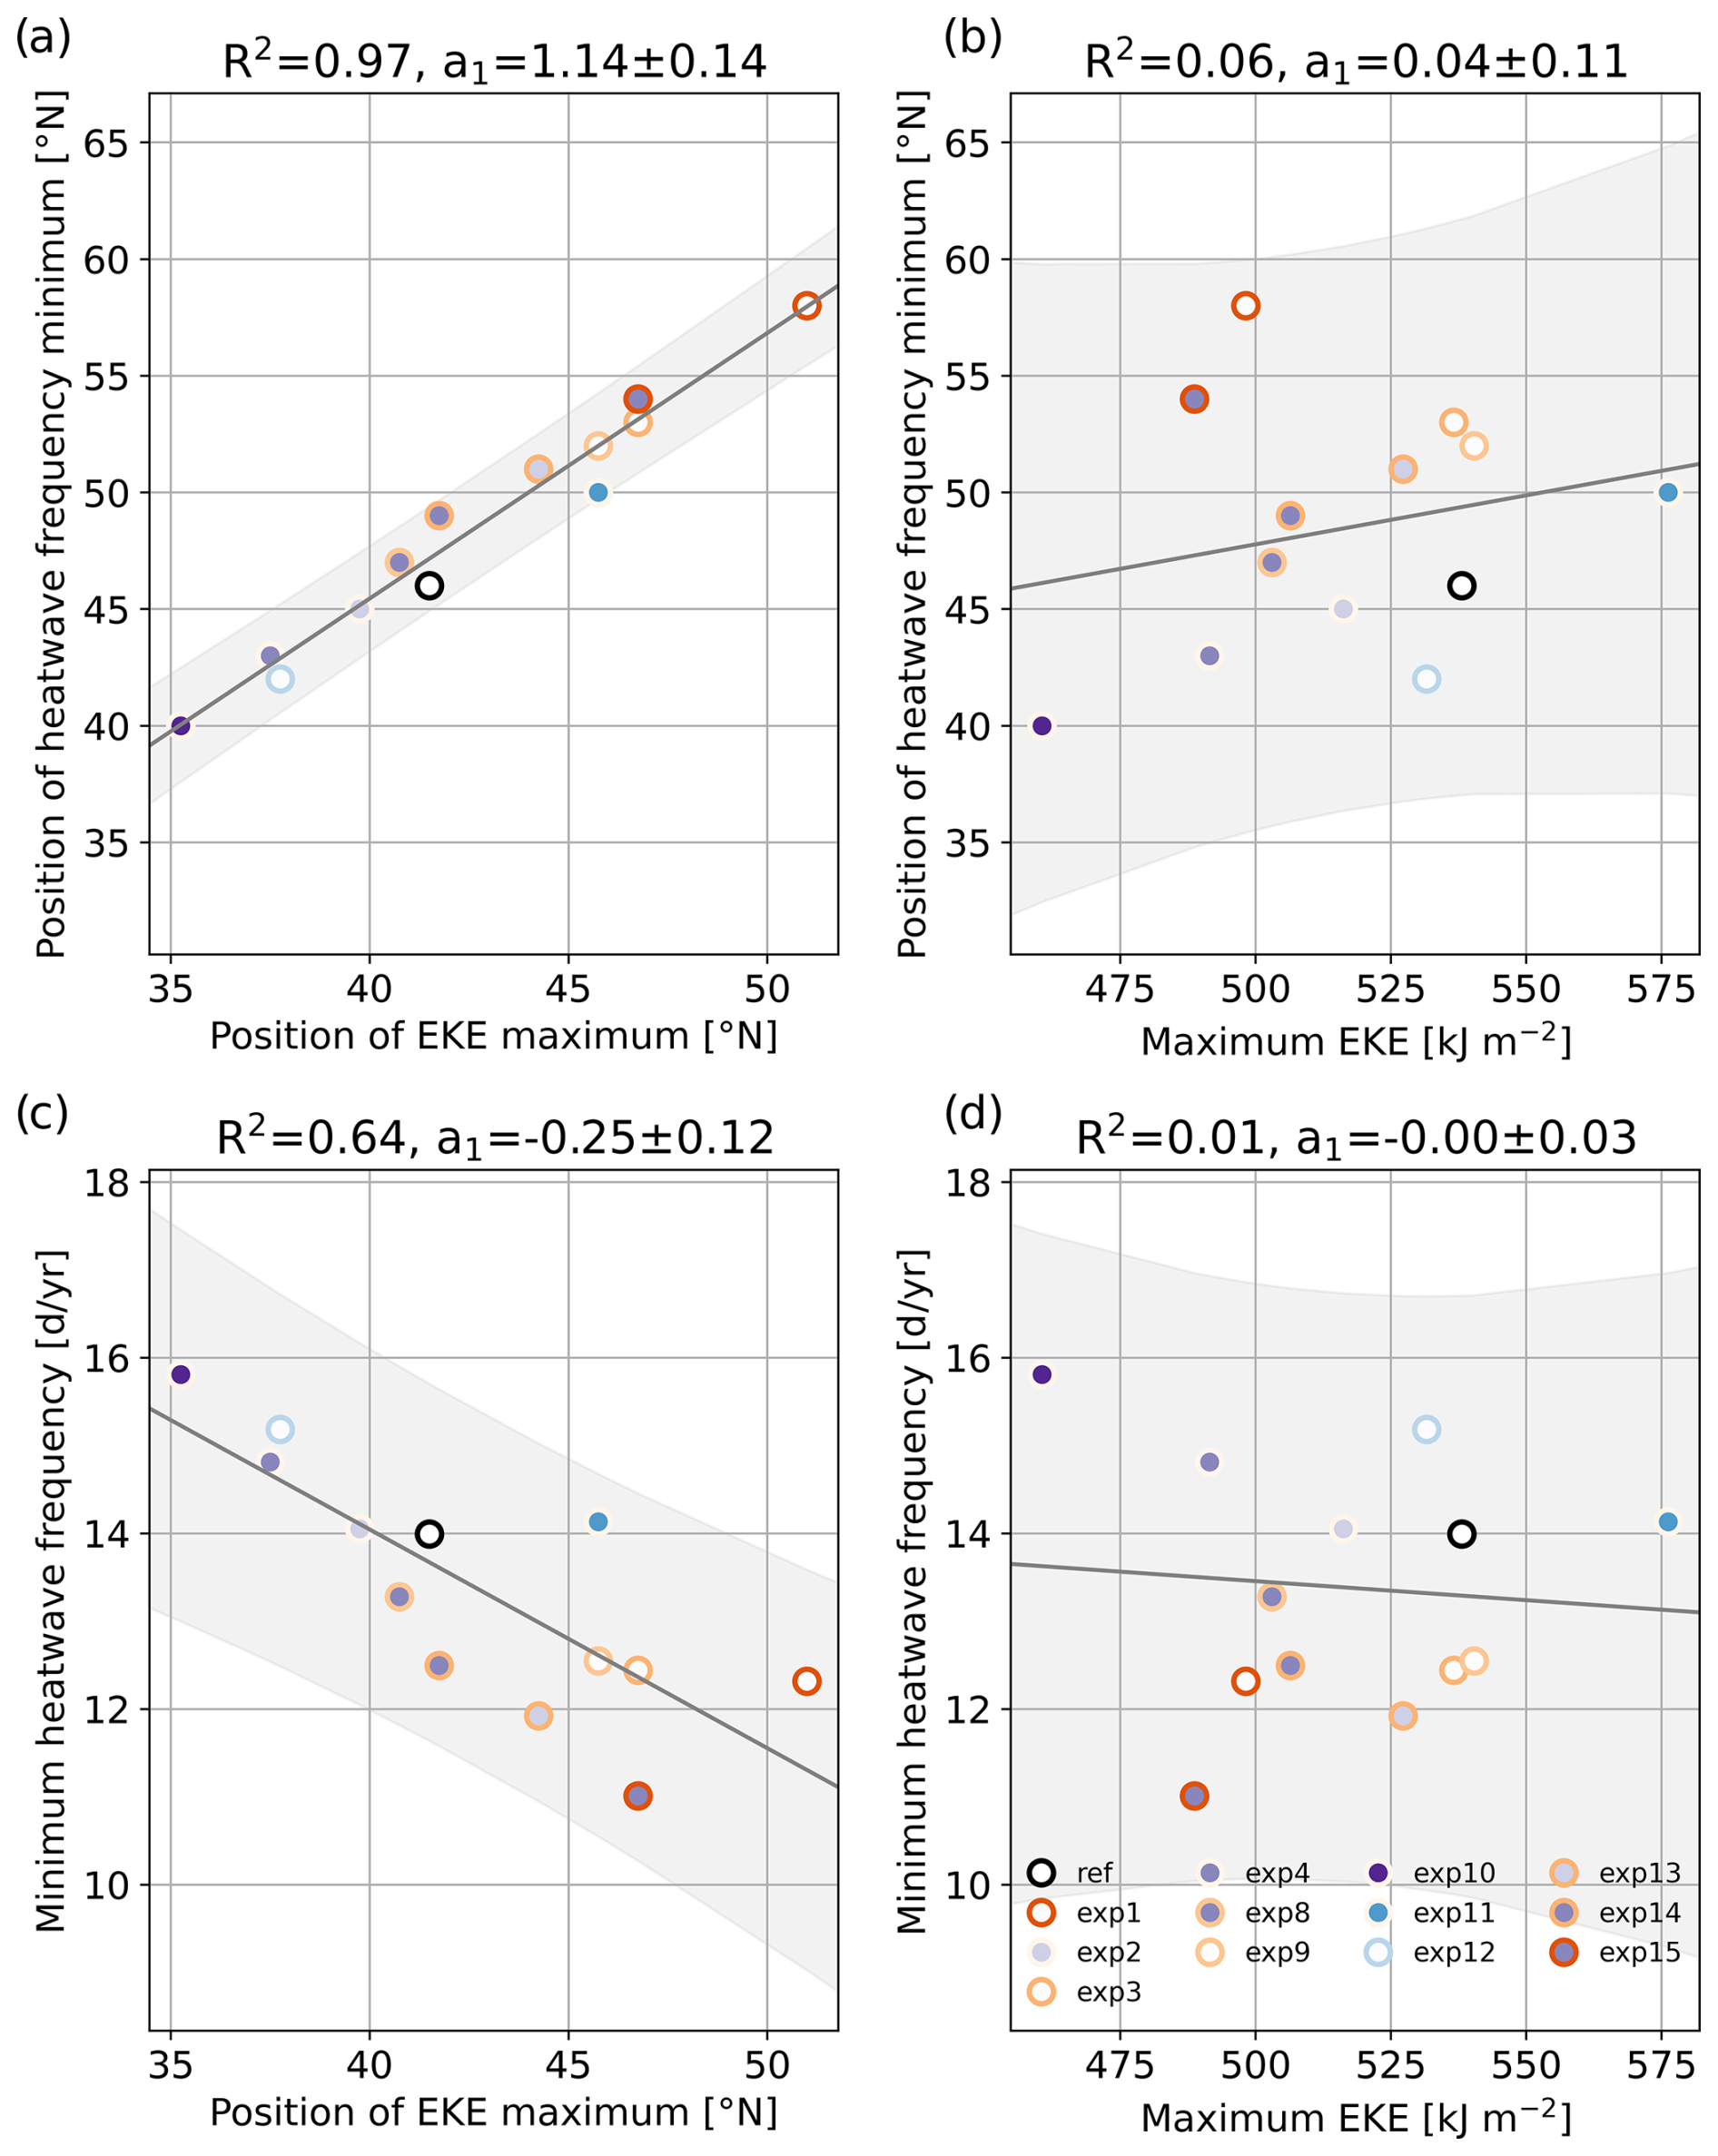
Figure 5Position of (a, b) the heatwave frequency minimum and (c, d) the minimum value of heatwave frequency plotted as a function of (a, c) the position of the EKE maximum and (b, d) the maximum value of EKE with a least-square linear model fit for 13 model experiments with different heating profiles. The orange color saturation of the marker edge encodes the strength of tropical heating while the purple color saturation of the marker edge encodes the strength of Arctic heating. The coefficient of determination and the slope of the regression line with its 95 % confidence interval is shown for each model fit in the title of the respective subplot and the 95 % confidence interval of the response variable is indicated by a grey color shading.
Over the past 50 years, the Southern Hemisphere has experienced a positive trend in the Southern Annular Mode (SAM, e.g., Marshall, 2003) connected to a poleward storm track shift (e.g., Chang et al., 2012). Based on the relationship explored above, we can expect a phase speed increase connected to the observed circulation changes. Indeed, the Hayashi spectra for the Southern Hemisphere mid-latitude upper troposphere from ERA5 (Fig. 6a) share the principal characteristics with those from our idealized simulations: a predominantly eastward phase propagation, an increase in phase speed with wavenumber, and a broad peak in power spectral density for synoptic-scale waves. This peak, however, is located at a slightly lower wavenumber and a clearly higher phase speed compared to the ICON reference simulation. In addition, the spectrum for reanalysis is broader than the modeled spectrum, covering a wider range of phase speeds up to almost 20 m s−1. Despite these differences between the model and reanalysis, the observed phase speed trend meets the expectation for a poleward storm track shift: The linear trend in power spectral density from 1979–2022 (Fig. 6b) forms a dipole similar to the response in the experiment with tropical heating (Fig. 2b). The centroid of the meridional-mean spectrum is shifted from zonal wavenumber 5.64 and a phase speed of 8.26 m s−1 in the 1980s to zonal wavenumber 5.60 and a phase speed of 8.61 m s−1 in the 2010s. The phase speed and wavenumber centroids for the four decades from 1980–2019 displayed as a function of latitude (Fig. 6c) reveal that phase speed increases over time everywhere between 40 and 65° S, while its meridional maximum is not noticeably shifted. Differences in zonal wavenumber over time are very small compared to its meridional variations. We also note that the increase in phase speed for meridional wind variance is qualitatively in line with trends in eddy flux covariance spectra (Chen and Held, 2007) or Rossby wave packet diagnostics (Fragkoulidis, 2022), and that the increase is not limited to the years of strong ozone depletion in the 1980s and 1990s (Fig. 6c).
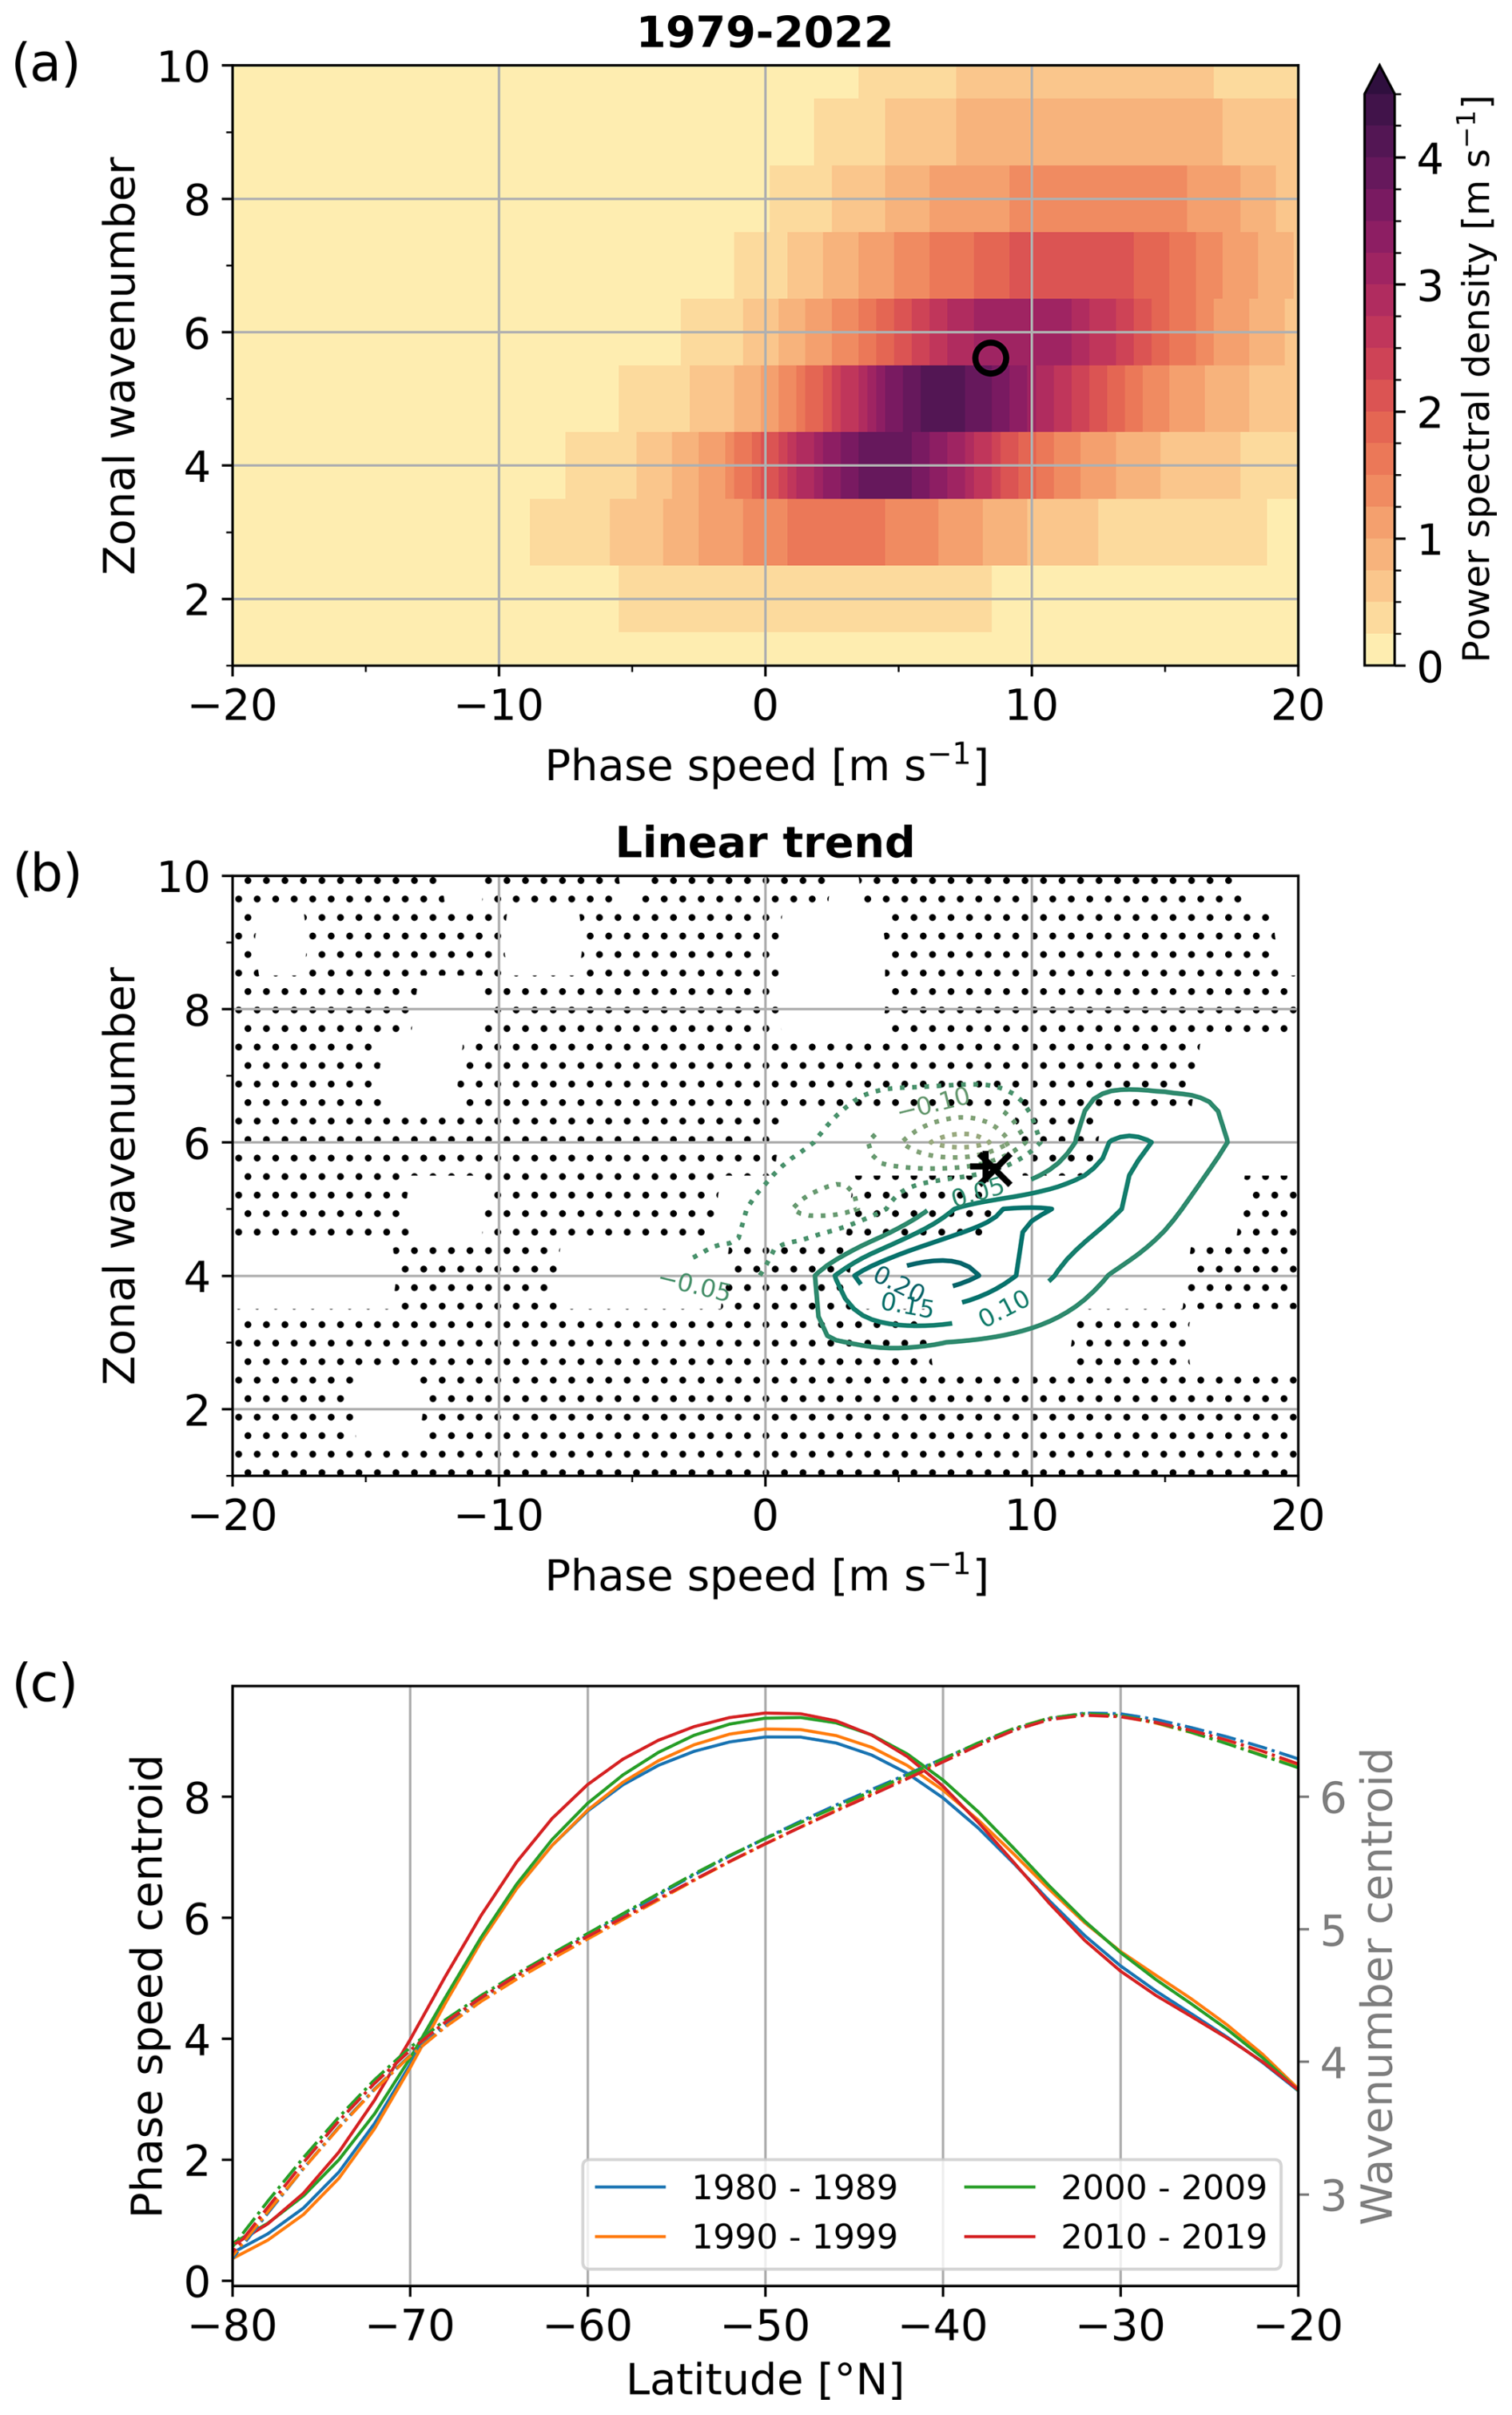
Figure 6(a) Climatological-mean, meridional-mean (35–65° S) power spectral density of meridional wind at 250 hPa and (b) the linear trend in units of m s−1 decade−1 for the ERA5 time series from 1979–2022. Stippling indicates that the linear trend is not significant at a 95 % confidence level based on a Monte-Carlo test (i.e., shuffling the predictor time series). The circular marker indicates the centroid of the climatological-mean meridional-mean spectrum (a). The “+” marker indicates the centroid for 1980–1989 (b), whereas the “x” marks the centroid for 2010–2019. (c) The zonal phase speed (solid lines) and the wavenumber (dashed lines) of the centroid of 10 year mean meridional wind variance spectra without meridional averaging are shown as functions of latitude.
Given this phase speed increase over time, we wonder how circulation changes have affected heatwave frequency and hot day persistence in the Southern Hemisphere mid-latitudes. To address this question, we start by comparing trends in year-round zonal-mean heatwave frequency in ERA5 from 1979 to 2022 between the Northern Hemisphere extratropics, the tropics, and the Southern Hemisphere extratropics (Fig. 7a). Poleward of about 20° N, the Northern Hemisphere has experienced a gradual increase in heatwave frequency from an average of 9 d yr−1 in the 1980s to around 25 d yr−1 in the 2010s. The tropics are marked by pronounced interannual variability where extrema in 1983, 1987, 1998, 2010, 2015–2016, and 2019–2021 are associated with El Niño events in the tropical Pacific (e.g., McPhaden et al., 2006). The Southern Hemisphere, on the other hand, shows a broad mid-latitude minimum in heatwave frequency, where more than 70 % of hot days occur isolated or as a set of two consecutive days, and a poleward migration of this minimum by about 12° S from the 1980s to the 2010s (Fig. 7a). While the mid-latitude minimum bears strong resemblance to the idealized experiments, its strong poleward migration exceeds the expectation from the model.
Related to the observed positive trend in the SAM, sea surface temperatures in the Southern Ocean have experienced opposing trends on either side of the Antarctic Circumpolar Current with a cooling around Antarctica related to anomalous Ekman transport in the surface ocean (Ferreira et al., 2015; Armour et al., 2016). The opposing trends in sea surface temperatures have most likely left their mark in the dipole-shaped hot day density trends (Fig. 7b). Equatorward to 60° S we see an increase in hot day frequency, while the decrease in hot day frequency poleward to 60° S is in line with the reported mean cooling south of the Antarctic Circumpolar Current. This dipole-shaped density trend differs strongly from the quadrupole-shaped response to thermal forcing in the model (Fig. 3c) and provides little evidence for a change in hot day persistence. Therefore, we conclude that the mean temperature trend and ocean processes contribute more strongly to the evolution of the Southern Hemisphere heatwave frequency minimum than the change in phase speed of upper-tropospheric disturbances.
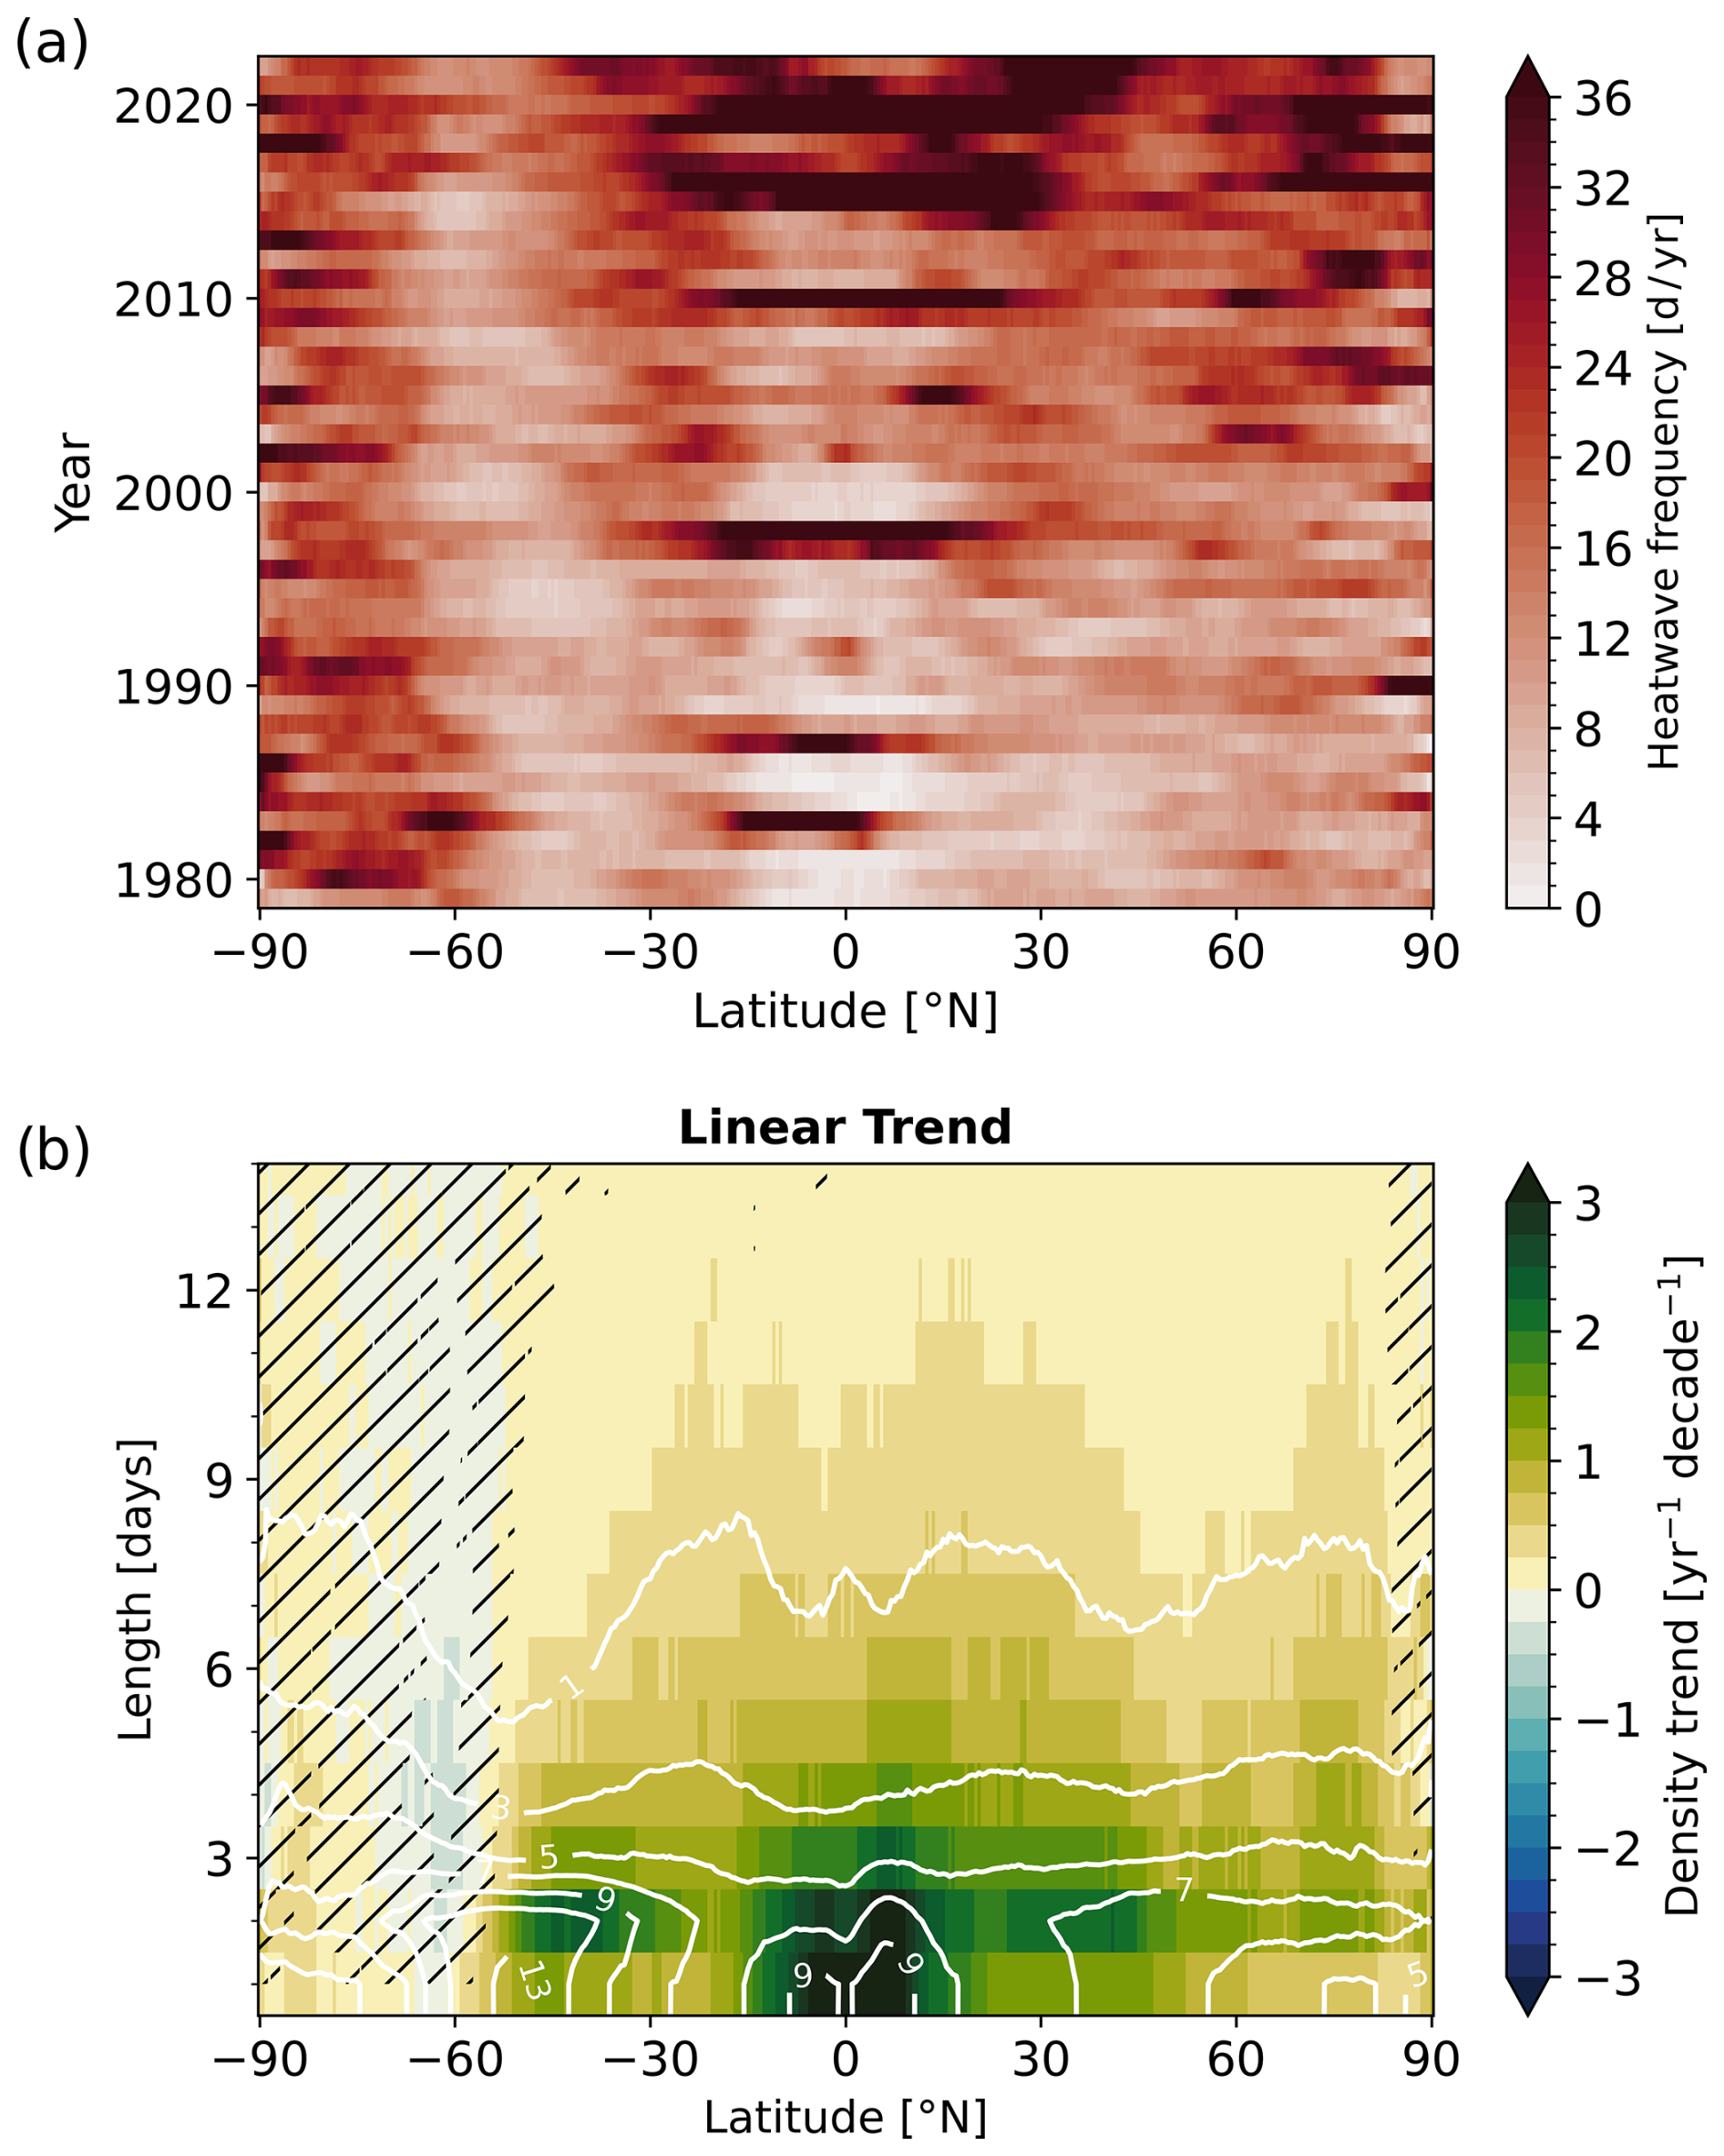
Figure 7(a) Zonal-mean heatwave frequency in the ERA5 dataset and (b) the linear trend in hot day persistence from 1979–2022. Hatching indicates where the linear trend is not significant at a 95 % confidence level based on a Monte-Carlo technique (i.e., shuffling the predictor time series). White contours indicate the hot day density averaged over the entire time series in units of yr−1.
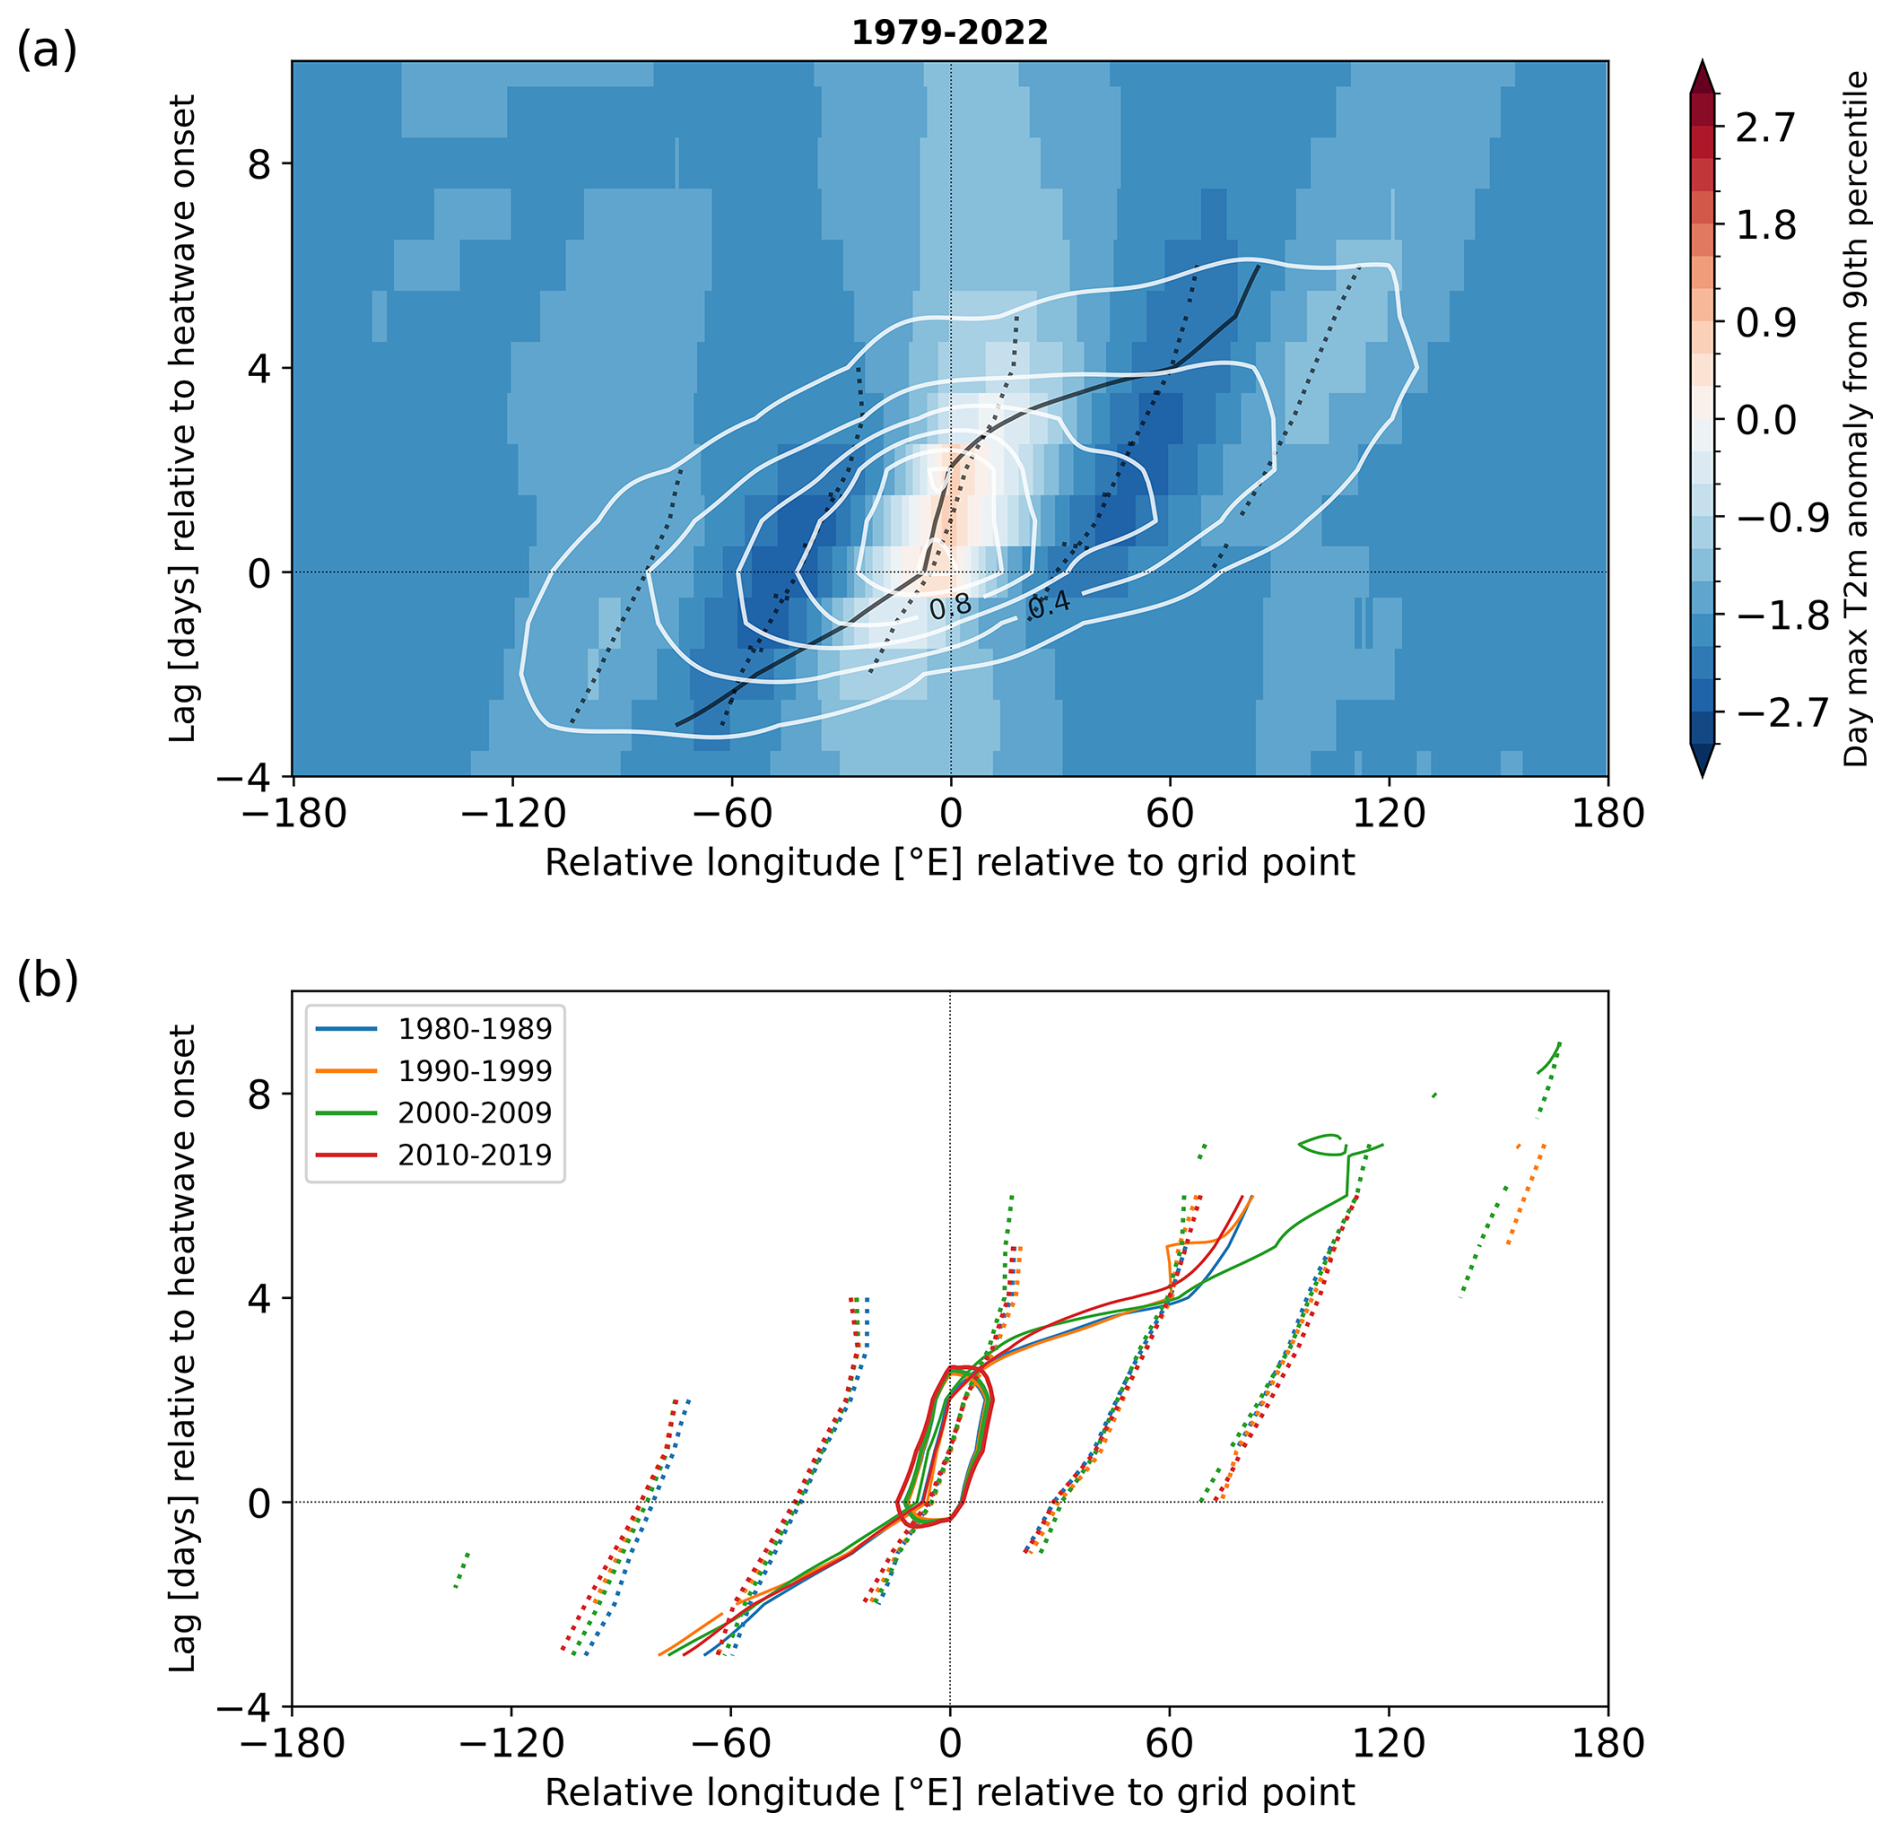
Figure 8(a) Composite-mean daily-maximum 2 m temperature anomalies with respect to the 90th percentile as in Fig. 4a for heatwaves at 50° S from the ERA5 dataset. (b) Contour lines of zero phase angle for the carrier wave (dotted lines) and the wave packet envelope (thin solid lines) with thick solid contours of 0 K composite-mean temperature anomaly as in Fig. 4c for the four decades 1980–2019 in ERA5.
In order to understand the discrepancy between model and reanalysis, we turn again to composite-mean temperature anomalies relative to the grid point and the onset of a heatwave (Fig. 8) and seek to assess whether the above-noted phase speed difference is reflected in heatwave-generating Rossby waves. Similar to the composite mean from model data (Fig. 4), the downstream development of a wave packet is clearly visible. The eastward propagation of the wave envelope (Fig. 8a, black solid lines) is faster than the propagation of individual warm and cold phases (dashed lines). Positive composite-mean anomalies at the central longitude last for the minimum heatwave duration of 3 d, as it is the case in the model. The tilt and the spacing of individual warm and cold phases express the phase speed and the wavelength of the heatwave-generating wave packet. Comparing the four decades from 1980–2019 (dashed lines in Fig. 8b), we find that the phase speed and the wavelength of the heatwave-generating wave packet have barely changed. The absence of change marks a notable contrast to the idealized model experiments. To explain the absence of change, we would like to point to the climatological phase speed spectra and the differences between model and reanalysis noted above. The centroid of the climatological-mean spectrum in reanalysis at 50° S corresponds to a period of only 5.7 d compared to 11.5 d for the ICON reference simulation at 50° N. The anticyclonic phase of a typical wave in the upper troposphere in reanalysis is not long enough to sustain a 3 d heatwave near the surface. The observed phase speed change affects the climatological-mean spectrum but cannot influence the characteristics of the heatwave-generating Rossby wave packets that, by definition, require a minimum persistence. In the Northern Hemisphere, for reference, the centroid of the mean spectrum at 50° N corresponds to 8.7 d year-round (Fig. S4) and 11.0 d during boreal summer (Wicker et al., 2024).
In this study, we explore a mechanism that relates the persistence of mid-latitude temperature extremes to storm track characteristics in the context of anthropogenic climate change. Similar to the setup of Butler et al. (2010), we conduct a series of idealized experiments with a dry dynamical general circulation model subject to thermal forcing that approximates the effect of Arctic amplification and the expansion of the Tropics. In these experiments, we identify a pronounced heatwave frequency minimum approximately 6° poleward of the mid-latitude EKE maximum, our proxy for the extratropical storm track. The primary model response to the idealized forcing in terms of temperature extremes is a meridional shift of the heatwave frequency minimum. The magnitude of EKE, a measure of the strength of the storm track, does not show a significant relationship with heatwave frequency or duration. In contrast, we find the latitudinal position of the storm track to be a strong predictor for heatwave characteristics. The experiments with tropical heating show a coherent poleward shift of the storm track maximum and the heatwave frequency minimum, whereas the experiments with polar heating show a coherent equatorward shift in both cases. The second important model response is a 2 % reduction of minimum heatwave frequency per degree of poleward storm track shift. We find a significant negative correlation of between the minimum heatwave frequency and the storm track position over the broad range of different storm track characteristics in our 13 idealized experiments.
The heatwave frequency reduction in response to a poleward storm track shift can be explained by a significant relationship between the zonal phase speed and the latitudinal position of synoptic-scale waves. Specifically, a poleward-shifted storm track by 4° N is linked to an increase in phase speed by approximately 1 m s−1 and a reduction of the dominant zonal wavenumber by 0.4. We hypothesize that this relationship is caused by the previously known connection between the strength and the location of the eddy-driven jet (Kidston and Vallis, 2012). A composite analysis of Hovmöller plots shows that the spectral changes in terms of phase speed and wavenumber apply not only for synoptic-scale waves in a climatological sense but also for heatwave-generating Rossby wave packets. The Hovmöller plots illustrate how an increase in phase speed creates isolated hot days upstream and downstream of a heatwave. These additional hot days, however, do not occur in a set long enough to be classified as a heatwave themselves, and thereby reduce heatwave frequency or hot day persistence overall.
Finally, we assess the relevance of the above-presented mechanism for observed circulation changes in reanalysis data. Over the satellite era from 1979 to the present, the Southern Hemisphere has experienced a significant trend in the Southern Annular mode and a poleward storm track shift (e.g., Marshall, 2003; Chang et al., 2012). In agreement with an analysis of eddy momentum flux spectra (Chen and Held, 2007) and Rossby wave packet diagnostics (Fragkoulidis, 2022), we find a phase speed increase of upper-tropospheric meridional wind variance in reanalysis data that resembles the model response associated with a poleward storm track shift. Similar to the dry dynamical model, the Southern Hemisphere mid-latitudes display a pronounced heatwave frequency minimum and a marked poleward migration of this minimum over time. However, despite this resemblance we have to conclude that the phase speed increase over time did not reduce the persistence of Southern Hemisphere mid-latitude hot extremes. The climatological spectrum in the Southern Hemisphere is shifted to a higher phase speed compared to the idealized model. The observed phase speed change can, thus, not affect the heatwave generating Rossby wave packets that require a minimum persistence. The Northern Hemisphere, on the other hand, features a spectrum more similar to the model. While we see no clear phase speed trend in the Northern Hemisphere yet, a future phase speed change may very well apply for heatwave-generating weather systems and influence the persistence of hot extremes in the Northern Hemisphere mid-latitudes. If indeed a poleward storm track shift materializes (Woollings et al., 2023), we can expect a phase speed increase contributing towards a reduced persistence of mid-latitude hot extremes in the Northern Hemisphere.
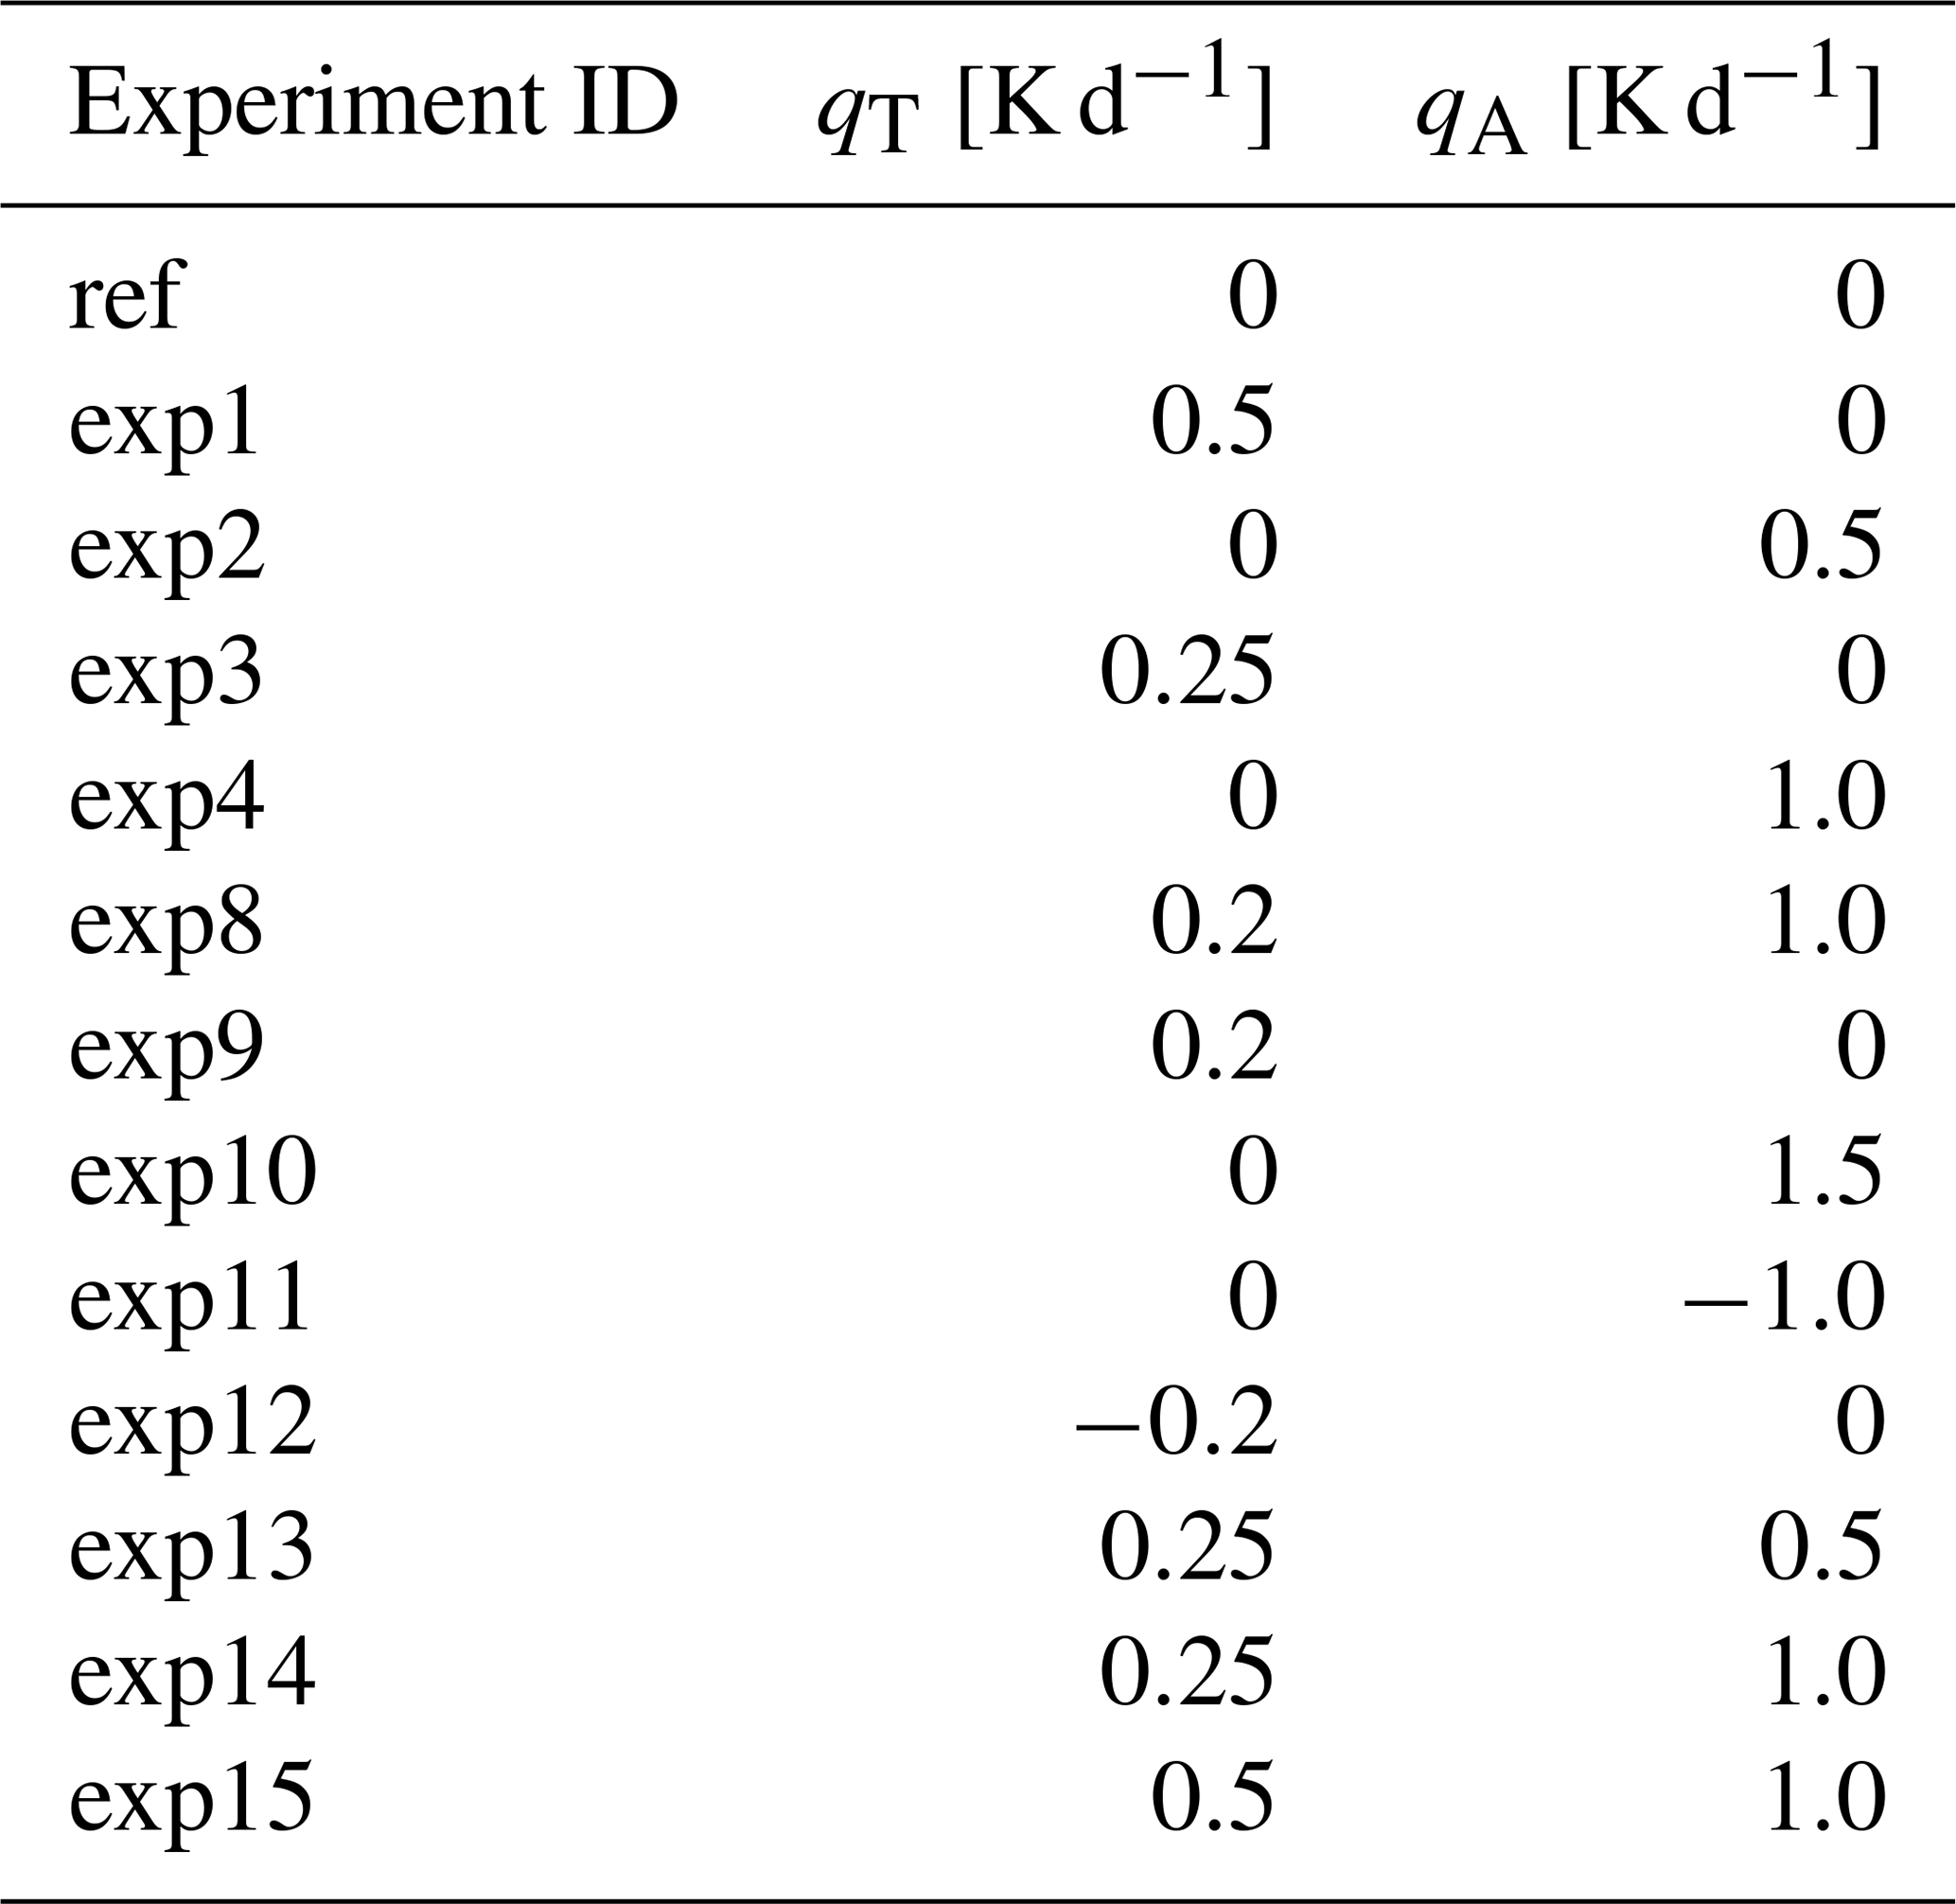
The profiles of the tropical and Arctic heat source QT and QA are zonally symmetric functions of latitude ϕ and the vertical coordinate σ. Note that the Arctic heating profile is slightly modified compared to Butler et al. (2010). The different experiments are defined by the respective heating amplitudes qT and qA.
Table A1The heating amplitudes for the reference and twelve sensitivity experiments.
The ERA5 reanalysis data can be downloaded from the Copernicus Climate Data Store (https://doi.org/10.24381/cds.bd0915c6, Hersbach et al., 2023). The ICON model output is available from the authors upon request. A code repository for the data analysis is available under a BSD license from https://doi.org/10.5281/zenodo.16778931 (Wicker, 2025).
The supplement related to this article is available online at https://doi.org/10.5194/wcd-6-965-2025-supplement.
WW and DD have jointly designed the study. ER has performed the model runs. WW preformed the data analysis, made the figures, and wrote the original draft. All authors contributed to editing the manuscript.
At least one of the (co-)authors is a member of the editorial board of Weather and Climate Dynamics. The peer-review process was guided by an independent editor, and the authors also have no other competing interests to declare.
Publisher’s note: Copernicus Publications remains neutral with regard to jurisdictional claims made in the text, published maps, institutional affiliations, or any other geographical representation in this paper. While Copernicus Publications makes every effort to include appropriate place names, the final responsibility lies with the authors. Also, please note that this paper has not received English language copy-editing.
The authors would like to thank two anonymous reviewers whose comments led to a significant improvement of this manuscript. The authors would also like to thank Andries de Vries and Hilla Afargan-Gerstman for many fruitful discussions. This project has received funding from the European Research Council (ERC) under the European Union's Horizon 2020 research and innovation programme (grant agreement No. 847456). This work was supported by a grant from the Swiss National Supercomputing Centre (CSCS) under project ID s1144.
This research has been supported by the European Research Council H2020 (grant no. 847456) and the Centro Svizzero di Calcolo Scientifico (grant no. s1144).
This paper was edited by Silvio Davolio and reviewed by two anonymous referees.
Arblaster, J. M. and Meehl, G. A.: Contributions of external forcings to southern annular mode trends, Journal of Climate, 19, 2896–2905, 2006. a
Arblaster, J. M., Meehl, G. A., and Karoly, D. J.: Future climate change in the Southern Hemisphere: Competing effects of ozone and greenhouse gases, Geophysical Research Letters, 38, L02701, https://doi.org/10.1029/2010GL045384, 2011. a
Armour, K. C., Marshall, J., Scott, J. R., Donohoe, A., and Newsom, E. R.: Southern Ocean warming delayed by circumpolar upwelling and equatorward transport, Nature Geoscience, 9, 549–554, 2016. a
Banerjee, A., Fyfe, J. C., Polvani, L. M., Waugh, D., and Chang, K.-L.: A pause in Southern Hemisphere circulation trends due to the Montreal Protocol, Nature, 579, 544–548, 2020. a
Barnes, E. A. and Polvani, L.: Response of the midlatitude jets, and of their variability, to increased greenhouse gases in the CMIP5 models, Journal of Climate, 26, 7117–7135, 2013. a
Barriopedro, D., García-Herrera, R., Ordóñez, C., Miralles, D., and Salcedo-Sanz, S.: Heat waves: Physical understanding and scientific challenges, Reviews of Geophysics, 61, e2022RG000780, https://doi.org/10.1029/2022RG000780, 2023. a
Brunner, L. and Voigt, A.: Pitfalls in diagnosing temperature extremes, Nature Communications, 15, 2087, https://doi.org/10.1038/s41467-024-46349-x, 2024. a
Butler, A. H., Thompson, D. W., and Heikes, R.: The steady-state atmospheric circulation response to climate change–like thermal forcings in a simple general circulation model, Journal of Climate, 23, 3474–3496, 2010. a, b, c, d, e, f, g, h
Butler, A. H., Thompson, D. W., and Birner, T.: Isentropic slopes, downgradient eddy fluxes, and the extratropical atmospheric circulation response to tropical tropospheric heating, Journal of the Atmospheric Sciences, 68, 2292–2305, 2011. a, b
Chang, E. K., Guo, Y., and Xia, X.: CMIP5 multimodel ensemble projection of storm track change under global warming, Journal of Geophysical Research: Atmospheres, 117, D23118, https://doi.org/10.1029/2012JD018578, 2012. a, b, c
Chemke, R. and Ming, Y.: Large atmospheric waves will get stronger, while small waves will get weaker by the end of the 21st century, Geophysical Research Letters, 47, e2020GL090441, https://doi.org/10.1029/2020GL090441, 2020. a
Chen, G. and Held, I. M.: Phase speed spectra and the recent poleward shift of Southern Hemisphere surface westerlies, Geophysical Research Letters, 34, L21805, https://doi.org/10.1029/2007GL031200, 2007. a, b, c
Cohen, J., Screen, J. A., Furtado, J. C., Barlow, M., Whittleston, D., Coumou, D., Francis, J., Dethloff, K., Entekhabi, D., Overland, J., and Jones, J.: Recent Arctic amplification and extreme mid-latitude weather, Nature Geoscience, 7, 627–637, 2014. a, b
Coumou, D., Lehmann, J., and Beckmann, J.: The weakening summer circulation in the Northern Hemisphere mid-latitudes, Science, 348, 324–327, 2015. a, b
Dai, A., Zhao, T., and Chen, J.: Climate change and drought: a precipitation and evaporation perspective, Current Climate Change Reports, 4, 301–312, 2018. a
Ding, H., Greatbatch, R. J., and Gollan, G.: Tropical influence independent of ENSO on the austral summer Southern Annular Mode, Geophysical Research Letters, 41, 3643–3648, 2014. a
Domeisen, D. I., Eltahir, E. A., Fischer, E. M., Knutti, R., Perkins-Kirkpatrick, S. E., Schär, C., Seneviratne, S. I., Weisheimer, A., and Wernli, H.: Prediction and projection of heatwaves, Nature Reviews Earth & Environment, 4, 36–50, 2023. a
Ebi, K. L., Capon, A., Berry, P., Broderick, C., de Dear, R., Havenith, G., Honda, Y., Kovats, R. S., Ma, W., Malik, A., Morris, N. B., Nybo, L., Seneviratne, S. I., Vanos J., and Jay, O.: Hot weather and heat extremes: health risks, The Lancet, 398, 698–708, 2021. a
Ferreira, D., Marshall, J., Bitz, C. M., Solomon, S., and Plumb, A.: Antarctic Ocean and sea ice response to ozone depletion: A two-time-scale problem, Journal of Climate, 28, 1206–1226, 2015. a
Fischer, E. M. and Knutti, R.: Anthropogenic contribution to global occurrence of heavy-precipitation and high-temperature extremes, Nature Climate Change, 5, 560–564, 2015. a
Fragkoulidis, G.: Decadal variability and trends in extratropical Rossby wave packet amplitude, phase, and phase speed, Weather Clim. Dynam., 3, 1381–1398, https://doi.org/10.5194/wcd-3-1381-2022, 2022. a, b
Fragkoulidis, G. and Wirth, V.: Local rossby wave packet amplitude, phase speed, and group velocity: Seasonal variability and their role in temperature extremes, Journal of Climate, 33, 8767–8787, 2020. a
Fragkoulidis, G., Wirth, V., Bossmann, P., and Fink, A.: Linking Northern Hemisphere temperature extremes to Rossby wave packets, Quarterly Journal of the Royal Meteorological Society, 144, 553–566, 2018. a
Francis, J. A. and Vavrus, S. J.: Evidence linking Arctic amplification to extreme weather in mid-latitudes, Geophysical Research Letters, 39, L06801, https://doi.org/10.1029/2012GL051000, 2012. a, b
Geen, R., Thomson, S. I., Screen, J. A., Blackport, R., Lewis, N. T., Mudhar, R., Seviour, W. J., and Vallis, G. K.: An Explanation for the Metric Dependence of the Midlatitude Jet-Waviness Change in Response to Polar Warming, Geophysical Research Letters, 50, e2023GL105132, https://doi.org/10.1029/2023GL105132, 2023. a
Giorgetta, M. A., Brokopf, R., Crueger, T., Esch, M., Fiedler, S., Helmert, J., Hohenegger, C., Kornblueh, L., Köhler, M., Manzini, E., Mauritsen, T., Nam, C., Raddatz, T., Rast, S., Reinert, D., Sakradzija, M., Schmidt, H., Schneck, R., Schnur, R., Silvers, L., Wan, H., Zängl, G., and Stevens, B.: ICON-A, the atmosphere component of the ICON earth system model: I. Model description, Journal of Advances in Modeling Earth Systems, 10, 1613–1637, 2018. a
Grise, K. M. and Davis, S. M.: Hadley cell expansion in CMIP6 models, Atmos. Chem. Phys., 20, 5249–5268, https://doi.org/10.5194/acp-20-5249-2020, 2020. a
Grise, K. M., Davis, S. M., Simpson, I. R., Waugh, D. W., Fu, Q., Allen, R. J., Rosenlof, K. H., Ummenhofer, C. C., Karnauskas, K. B., Maycock, A. C., Quan, X.-W., Birner, T., and Staten, P. W.: Recent tropical expansion: natural variability or forced response?, Journal of Climate, 32, 1551–1571, 2019. a
Harvey, B., Cook, P., Shaffrey, L., and Schiemann, R.: The response of the northern hemisphere storm tracks and jet streams to climate change in the CMIP3, CMIP5, and CMIP6 climate models, Journal of Geophysical Research: Atmospheres, 125, e2020JD032701, https://doi.org/10.1029/2020JD032701, 2020. a
Hauser, M., Orth, R., and Seneviratne, S. I.: Role of soil moisture versus recent climate change for the 2010 heat wave in western Russia, Geophysical Research Letters, 43, 2819–2826, 2016. a
Held, I. M. and Suarez, M. J.: A proposal for the intercomparison of the dynamical cores of atmospheric general circulation models, Bulletin of the American Meteorological society, 75, 1825–1830, 1994. a, b, c
Hersbach, H., Bell, B., Berrisford, P., Biavati, G., Horányi, A., Muñoz Sabater, J., Nicolas, J., Peubey, C., Radu, R., Rozum, I., Schepers, D., Simmons, A., Soci, C., Dee, D., and Thépaut, JN.: ERA5 hourly data on pressure levels from 1940 to present, Copernicus Climate Change Service (C3S) Climate Data Store (CDS) [dataset], https://doi.org/10.24381/cds.bd0915c6, 2023. a
Hersbach, H., Bell, B., Berrisford, P., Hirahara, S., Horányi, A., Muñoz-Sabater, J., Nicolas, J., Peubey, C., Radu, R., Schepers, D., Simmons, A., Soci, C., Abdalla, S., Abellan, X., Balsamo, G., Bechtold, P., Biavati, G., Bidlot, J., Bonavita, M., De Chiara, G., Dahlgren, P., Dee, D., Diamantakis, M., Dragani, R., Flemming, J., Forbes, R., Fuentes, M., Geer, A., Haimberger, L., Healy, S., Hogan, R. J., Hólm, E., Janisková, M., Keeley, S., Laloyeaux, P., Lopez, P., Lupu, C., Radnoti, G., de Rosnay, P., Rozum, I., Vamborg, F., Villaume, S., and Thépaut, J.-N.: The ERA5 global reanalysis, Quarterly Journal of the Royal Meteorological Society, 146, 1999–2049, 2020. a
Jiménez-Esteve, B. and Domeisen, D. I.: The role of atmospheric dynamics and large-scale topography in driving heatwaves, Quarterly Journal of the Royal Meteorological Society, 148, 2344–2367, 2022. a, b
Joos, H., Sprenger, M., Binder, H., Beyerle, U., and Wernli, H.: Warm conveyor belts in present-day and future climate simulations – Part 1: Climatology and impacts, Weather Clim. Dynam., 4, 133–155, https://doi.org/10.5194/wcd-4-133-2023, 2023. a
Kidston, J. and Vallis, G.: The relationship between the speed and the latitude of an eddy-driven jet in a stirred barotropic model, Journal of the Atmospheric Sciences, 69, 3251–3263, 2012. a, b, c, d
Lu, J., Vecchi, G. A., and Reichler, T.: Expansion of the Hadley cell under global warming, Geophysical Research Letters, 34, L06805, https://doi.org/10.1029/2006GL028443, 2007. a
Marshall, G. J.: Trends in the Southern Annular Mode from observations and reanalyses, Journal of Climate, 16, 4134–4143, 2003. a, b, c
McPhaden, M. J., Zebiak, S. E., and Glantz, M. H.: ENSO as an integrating concept in earth science, Science, 314, 1740–1745, 2006. a
Miralles, D. G., Teuling, A. J., Van Heerwaarden, C. C., and Vilà-Guerau de Arellano, J.: Mega-heatwave temperatures due to combined soil desiccation and atmospheric heat accumulation, Nature Geoscience, 7, 345–349, 2014. a
O'Gorman, P. and Muller, C. J.: How closely do changes in surface and column water vapor follow Clausius–Clapeyron scaling in climate change simulations?, Environmental Research Letters, 5, 025207, https://doi.org/10.1088/1748-9326/5/2/025207, 2010. a
Papritz, L. and Röthlisberger, M.: A novel temperature anomaly source diagnostic: method and application to the 2021 heatwave in the Pacific Northwest, Geophysical Research Letters, 50, e2023GL105641, https://doi.org/10.1029/2023GL105641, 2023. a
Perkins, S. E. and Alexander, L. V.: On the measurement of heat waves, Journal of Climate, 26, 4500–4517, 2013. a
Pfleiderer, P., Schleussner, C.-F., Kornhuber, K., and Coumou, D.: Summer weather becomes more persistent in a 2 C world, Nature Climate Change, 9, 666–671, 2019. a, b
Randel, W. J. and Held, I. M.: Phase speed spectra of transient eddy fluxes and critical layer absorption, Journal of the Atmospheric Sciences, 48, 688–697, 1991. a
Rantanen, M., Karpechko, A. Y., Lipponen, A., Nordling, K., Hyvärinen, O., Ruosteenoja, K., Vihma, T., and Laaksonen, A.: The Arctic has warmed nearly four times faster than the globe since 1979, Communications Earth & Environment, 3, 168, https://doi.org/10.1038/s43247-022-00498-3, 2022. a
Russo, E. and Domeisen, D. I.: Increasing intensity of extreme heatwaves: the crucial role of metrics, Geophysical Research Letters, 50, e2023GL103540, https://doi.org/10.1029/2023GL103540, 2023. a, b
Russo, E., Wicker, W., Folini, D., and Domeisen, D.: The role of boundary-layer friction in modulating midlatitude heatwaves, Quarterly Journal of the Royal Meteorological Society, 151, e4932, https://doi.org/10.1002/qj.4932, 2025. a
Schär, C., Vidale, P. L., Lüthi, D., Frei, C., Häberli, C., Liniger, M. A., and Appenzeller, C.: The role of increasing temperature variability in European summer heatwaves, Nature, 427, 332–336, 2004. a
Screen, J. A. and Simmonds, I.: The central role of diminishing sea ice in recent Arctic temperature amplification, Nature, 464, 1334–1337, 2010a. a
Screen, J. A. and Simmonds, I.: Increasing fall-winter energy loss from the Arctic Ocean and its role in Arctic temperature amplification, Geophysical Research Letters, 37, L16707, https://doi.org/10.1029/2010GL044136, 2010b. a
Screen, J. A., Eade, R., Smith, D. M., Thomson, S., and Yu, H.: Net equatorward shift of the jet streams when the contribution from sea-ice loss is constrained by observed eddy feedback, Geophysical Research Letters, 49, e2022GL100523, https://doi.org/10.1029/2022GL100523, 2022. a
Seneviratne, S. I., Zhang, X., Adnan, M., Badi, W., Dereczynski, C., Luca, A. D., Ghosh, S., Iskandar, I., Kossin, J., Lewis, S., Otto, F., Pinto, I., Satoh, M., Vicente-Serrano, S. M., Wehner, M., and Zhou, B.: Weather and climate extreme events in a changing climate, in: Climate Change 2021: The Physical Science Basis. Contribution of Working Group I to the Sixth Assessment Report of the Intergovernmental Panel on Climate Change, edited by: Masson-Delmotte, V., Zhai, P., Pirani, A., Connors, S., Péan, C., Berger, S., Caud, N., Chen, Y., Goldfarb, L., Gomis, M., Huang, M., Leitzell, K., Lonnoy, E., Matthews, J., Maycock, T., Waterfield, T., Yelekçi, O., Yu, R., and Zhou, B., Cambridge University Press, 1513–1766, https://doi.org/10.1017/9781009157896.013, 2021. a
Shaw, T., Baldwin, M., Barnes, E. A., Caballero, R., Garfinkel, C., Hwang, Y.-T., Li, C., O'Gorman, P., Riviére, G., Simpson, I., and Voigt, A.: Storm track processes and the opposing influences of climate change, Nature Geoscience, 9, 656–664, 2016. a, b
Shaw, T. A., Arblaster, J. M., Birner, T., Butler, A. H., Domeisen, D., Garfinkel, C. I., Garny, H., Grise, K. M., and Karpechko, A. Y.: Emerging climate change signals in atmospheric circulation, AGU Advances, 5, e2024AV001297, https://doi.org/10.1029/2024AV001297, 2024. a
Shindell, D. T. and Schmidt, G. A.: Southern Hemisphere climate response to ozone changes and greenhouse gas increases, Geophysical Research Letters, 31, L18209, https://doi.org/10.1029/2004GL020724, 2004. a
Sprenger, M., Fragkoulidis, G., Binder, H., Croci-Maspoli, M., Graf, P., Grams, C. M., Knippertz, P., Madonna, E., Schemm, S., Škerlak, B., and Wernli, H. : Global climatologies of Eulerian and Lagrangian flow features based on ERA-Interim, Bulletin of the American Meteorological Society, 98, 1739–1748, 2017. a
Thompson, D. W., Wallace, J. M., and Hegerl, G. C.: Annular modes in the extratropical circulation. Part II: Trends, Journal of Climate, 13, 1018–1036, 2000. a
Thompson, D. W., Solomon, S., Kushner, P. J., England, M. H., Grise, K. M., and Karoly, D. J.: Signatures of the Antarctic ozone hole in Southern Hemisphere surface climate change, Nature Geoscience, 4, 741–749, 2011. a
Watt-Meyer, O., Frierson, D., and Fu, Q.: Hemispheric asymmetry of tropical expansion under CO2 forcing, Geophysical Research Letters, 46, 9231–9240, 2019. a
Wehrli, K., Guillod, B. P., Hauser, M., Leclair, M., and Seneviratne, S. I.: Identifying key driving processes of major recent heat waves, Journal of Geophysical Research: Atmospheres, 124, 11746–11765, 2019. a
Wicker, W., Harnik, N., Pyrina, M., and Domeisen, D. I.: Heatwave location changes in relation to Rossby wave phase speed, Geophysical Research Letters, 51, e2024GL108159, https://doi.org/10.1029/2024GL108159, 2024. a, b, c
Wicker, W.: wwicker/idealized_ICON_heatwaves: Revised release (V1.1), Zenodo [code], https://doi.org/10.5281/zenodo.16778931, 2025. a
Woollings, T., Drouard, M., O’Reilly, C. H., Sexton, D. M., and McSweeney, C.: Trends in the atmospheric jet streams are emerging in observations and could be linked to tropical warming, Communications Earth & Environment, 4, 125, https://doi.org/10.1038/s43247-023-00792-8, 2023. a, b
Zängl, G., Reinert, D., Rípodas, P., and Baldauf, M.: The ICON (ICOsahedral Non-hydrostatic) modelling framework of DWD and MPI-M: Description of the non-hydrostatic dynamical core, Quarterly Journal of the Royal Meteorological Society, 141, 563–579, 2015. a
Zimin, A. V., Szunyogh, I., Patil, D., Hunt, B. R., and Ott, E.: Extracting envelopes of Rossby wave packets, Monthly Weather Review, 131, 1011–1017, 2003. a
Zschenderlein, P., Fink, A. H., Pfahl, S., and Wernli, H.: Processes determining heat waves across different European climates, Quarterly Journal of the Royal Meteorological Society, 145, 2973–2989, 2019. a