
the Creative Commons Attribution 4.0 License.
the Creative Commons Attribution 4.0 License.
 | 07 Jul 2026
The October 2024 extreme precipitation event over Valencia: storyline attribution of the synoptic-scale thermodynamic drivers
Katherine Grayson
Ramiro I. Saurral
Sebastian Beyer
Amal John
Matías Olmo
Francisco Doblas-Reyes
In late October 2024, the western Mediterranean (WMed) region experienced an extreme precipitation event (EPE) centred over Valencia, southeastern Spain, associated with a quasi-stationary cut-off low (COL), producing record rainfall, flash floods, and severe societal impacts. The COL generated an atmospheric-river-like moisture plume from northwestern Africa, while additional moisture originated from the warm Mediterranean Sea. Interaction with regional orography under a highly unstable environment, favoured deep convection and intense local rainfall. To assess the influence of anthropogenic climate change on the synoptic-scale thermodynamic evolution of the event, we analyse high-resolution (∼ 9 km) storyline simulations from the European Union's Destination Earth initiative, using the coupled IFS-FESOM model spectrally nudged with ERA5. Two climate scenarios are compared: Factual (present-day) and Counterfactual (∼ 1950), isolating thermodynamic responses while preserving the observed large-scale circulation. Long-term IFS-FESOM and ERA5 datasets provide a climatological reference for event extremeness using percentile-based thresholds of selected key variables. Results show that the synoptic configuration alone was sufficient to produce extreme rainfall, but human-induced warming substantially enhanced its magnitude. Moisture content and transport increased by 18 %–24 %, convective instability by ∼ 25 %, and precipitation over Valencia increased by ∼ 20 % in the Factual scenario. Sea surface temperatures in the Western Mediterranean were ∼ 2 °C warmer, amplifying evaporation. Peak precipitation rates exhibited nonlinear amplification, on 29 October were about 36 % higher in the Factual scenario, exceeding the Clausius–Clapeyron scaling expected from the mean warming between scenarios. These findings indicate that anthropogenic warming can intensify EPEs in the WMed even when synoptic drivers alone would generate extreme rainfall, highlighting thermodynamic amplification as a key mechanism in Mediterranean flood events. High-resolution, physically consistent storyline simulations offer a robust framework for event-based attribution and improve understanding of future climate risks in vulnerable coastal regions.
- Article
(8955 KB) - Full-text XML
-
Supplement
(8405 KB) - BibTeX
- EndNote


The Western Mediterranean (WMed) has been identified as a prominent climate change hotspot characterised by rapid warming (Campos et al., 2025; Cos et al., 2022; Giorgi, 2006; Lionello and Scarascia, 2020; Tuel and Eltahir, 2020) and increasing risk of extreme precipitation events (EPEs; Lionello and Scarascia, 2020; Olmo et al., 2025; Ribes et al., 2019; Tramblay and Somot, 2018; Zittis et al., 2021). In late October 2024, an episode of exceptionally heavy rainfall impacted the southeastern Iberian Peninsula, with the Valencia region experiencing catastrophic flooding where some locations recorded more than 600 mm of precipitation within a few hours (AEMET, 2024). The event resulted in more than 200 fatalities and billions of euros in damages (Llasat, 2024; Martin-Moreno et al., 2025). At the synoptic scale, the event was associated with a quasi-stationary cut-off low (COL, locally referred to as a DANA) interacting with a warm moisture-rich Mediterranean environment (Huang et al., 2025; Saurral et al., 2026), a configuration widely recognised as conducive to extreme precipitation in the region (Nieto Ferreira, 2021; Porcù et al., 2007; Saurral et al., 2025). Given the strong thermodynamic influence of atmospheric moisture on Mediterranean EPEs, the Valencia EPE has become a prominent case study for investigating how anthropogenic climate change may have modified the physical environment supporting extreme precipitation.
Recent attribution studies of the October 2024 Valencia EPE have applied a range of methodological approaches, leading to partly differing, but complementary, conclusions regarding the influence of anthropogenic climate change. Probabilistic attribution approaches, for example, are particularly valuable for quantifying changes in event likelihood and intensity across a class of similarly defined events, irrespective of their specific circulation drivers. However, their application to highly exceptional precipitation events can be constrained by limited sampling of comparable events and by sensitivity to the event definition. Applying this framework, WWA (2024) estimated that precipitation extremes similar to those observed during the Valencia EPE were approximately 12 % more intense and about twice as likely under present-day warming conditions relative to a 1.3 °C cooler counterfactual climate. By contrast, Barriopedro et al. (2025), using a broadly comparable probabilistic method and counterfactual definition, reported only weak and statistically non-significant changes in probability and intensity. Other studies adopted circulation-conditioned attribution frameworks to separate thermodynamic and dynamic contributions to the event, which is particularly useful for contextualising an EPE under similar circulation patterns in a counterfactual (usually mid-20th century) climate. Using circulation analogues, Faranda et al. (2024) and Barriopedro et al. (2025) (who applied several attribution methods for the same event), reported modest increases in precipitation and atmospheric moisture under present-day conditions, although with substantial uncertainty and limited statistical significance. Similarly, Oldham-Dorrington and Messori (2026), found no robust changes in either the frequency of the atmospheric pattern associated with the event or its relationship with extreme precipitation.
Other studies have applied event-based storyline approaches (Shepherd et al., 2018) to investigate how anthropogenic climate change modified the thermodynamic characteristics of the Valencia EPE. In contrast to probabilistic approaches, these methods focus less on changes in the event likelihood and more on how present-day warming altered the physical environment associated with the event. Similar to circulation-analogue approaches, they assess changes in event characteristics under constrained dynamical conditions. Using a pseudo-global-warming storyline approach (in which thermodynamic climate-change signals are imposed on regional simulations) and high-resolution modelling, Calvo-Sancho et al. (2026) focused on the convective storm affecting Valencia on 29 October, examining how climate change modified local thermodynamic and convective processes. Their results showed increases of approximately 12 % in precipitable water and 22 % in convective instability under present-day climate conditions relative to a pre-industrial climate, leading to rainfall intensification rates exceeding Clausius–Clapeyron (CC) scaling. Similarly, Barriopedro et al. (2025), using AI-based weather forecasts combined with a pseudo-global-warming storyline method, investigated how anthropogenic warming modified the regional-scale thermodynamic drivers during the peak of the Valencia EPE. Their results indicated precipitation increases of up to 20 %, together with enhanced low-level moisture transport under present-day climate conditions. Taken together, these studies consistently point toward substantial thermodynamic amplification of the event under present-day warming conditions.
While previous studies using the storyline approach have primarily examined the local and regional thermodynamic amplification of precipitation during the peak of the Valencia EPE, important uncertainties remain regarding how anthropogenic warming modified the associated broader synoptic-scale thermodynamic environment. In particular, the role of climate change in shaping the evolution of large-scale moisture transport, atmospheric instability, and Mediterranean thermodynamic preconditioning prior to the most intense rainfall remains unexplored. This aspect is particularly relevant for EPEs associated with COLs, whose precipitation intensity is strongly conditioned by the interaction between upper-level cold-air and the transport of warm, moist air beneath the upper-level low (Barrett et al., 2016; Bozkurt et al., 2016; Insua-Costa et al., 2019; Muñoz and Schultz, 2021; Tsuji and Takayabu, 2019; Valenzuela et al., 2022). Moreover, in the WMed, these processes can be further amplified by anomalously warm sea surface temperatures (Saurral et al., 2026). Understanding how climate change modifies these large-scale thermodynamic and moisture transport processes therefore requires attribution frameworks capable of preserving the observed dynamical configuration of the event while isolating the thermodynamic influence of anthropogenic warming.
Spectral nudging has emerged as a particularly useful technique for reproducing dynamically consistent storylines in both regional and global climate models (Feser and Shepherd, 2025; Van Garderen et al., 2021). By constraining the large-scale atmospheric circulation toward reanalysis data while allowing thermodynamic processes and mesoscale variability to freely evolve, spectral nudging provides a suitable framework for investigating how anthropogenic warming modifies the evolution of specific EPEs. Within the European Union's Destination Earth initiative (DestinE ClimateDT; Doblas-Reyes et al., 2026; Hoffmann et al., 2023; Wedi et al., 2022), kilometre-scale coupled global storyline simulations using the IFS-FESOM model (Rackow et al., 2025) are available as continuous factual and counterfactual scenarios from 2017 onward using spectral nudging toward ERA5 data (John et al., 2026). Unlike the storyline using the pseudo-global-warming approach, the DestinE ClimateDT global storyline simulations enable the study of the large-scale thermodynamic evolution associated with EPEs within a dynamically consistent framework beyond region-specific or event-specific experimental setups. Moreover, the coupled atmosphere-ocean configuration allows interactive air-sea feedbacks and evolving ocean conditions, rather than relying on prescribed sea surface temperatures. In addition, the kilometre-scale resolution allows both the synoptic-scale drivers and the regional-to-local precipitation evolution to be examined within a unified modelling framework. Despite this potential, such global kilometre-scale storyline simulations have not yet been systematically explored in extreme event attribution studies (e.g., Grayson et al., 2026).
In this paper, we investigate the influence of anthropogenic climate change on the synoptic-scale thermodynamic environment associated with the October 2024 Valencia EPE, with a particular focus on the spatiotemporal evolution of atmospheric moisture, moisture transport, and instability before and during the event. To this end, we analyse spectrally nudged kilometre-scale global storyline simulations from DestinE ClimateDT under Factual (present-day) and Counterfactual (∼ 1950s) climate conditions using the coupled IFS-FESOM model nudged with ERA5 reanalysis data. Our study complements previous statistically-derived and regional-to-local storyline attribution analyses by being the first to focus on the evolution of the synoptic-scale thermodynamic conditions associated with the event, several days before and during the rainfall peak, using global km-scale model simulations. More broadly, this work contributes to the growing recognition that robust extreme event attribution benefits from the combination of multiple methodological approaches addressing complementary aspects of the climate system and the event under investigation (Thompson et al., 2025; Van Garderen and León-FonFay, 2026). Section 2 describes the data and methods used in the study. Section 3 presents the analysis results. Finally, in Sect. 4, the main results are discussed, and questions for future studies are raised.
2.1 Model data
In this work, we analyse the spectrally-nudged storyline simulations conducted with the coupled global climate model IFS-FESOM from the DestinE ClimateDT initiative. This modelling framework couples the Integrated Forecasting System (IFS, cycle 48r1; ECMWF, 2023), developed by ECMWF, for the atmosphere, land, and waves, with the Finite volumE Sea Ice-Ocean Model (FESOM2, version 2.5) from the Alfred Wegener Institute. The setup used corresponds to the ClimateDT configuration (Rackow et al., 2025). The atmospheric component has a horizontal resolution of roughly 9 km (TCo1279 spectral resolution) with 137 vertical levels. The ocean component has 70 vertical levels and uses a horizontal resolution (unstructured NG5 mesh) that smoothly transitions from about 12 km in the tropics to 4.5 km in dynamically active regions and polar areas (Danilov et al., 2017; Scholz et al., 2019).
The spectral nudging scheme used to constrain the large-scale circulation towards the observations in the simulations was made following the methodology of Sánchez-Benítez et al. (2022). This approach relaxes large-scale vorticity and divergence in the model towards ERA5 reanalysis data between 700 and 100 hPa up to wavenumber T60. Additionally, a 1 h e-folding was employed to maintain consistency with the observed large-scale flow, while allowing the model to simulate small-scale processes freely (John et al., 2026). In this way, the large-scale flow above 700 hPa remains consistent with ERA5, allowing changes in the nudged simulations to be mainly attributed to thermodynamic features and small-scale dynamics.
Two climate scenarios are considered in this study: Factual (present-day climate) and Counterfactual (cooler ∼ 1950s climate). The scenarios differ in their ocean initial states and boundary conditions (i.e., external climate forcing and background climate state), allowing the evaluation of how identical meteorological events would evolve under different climate states:
-
Counterfactual (cooler ∼ 1950s) – representing an early-industrial-like state based on 1950 boundary conditions with CMIP6-historical radiative forcing. In this experiment, the forcing is held fixed at its 1950 values for the entire 2017–2024 simulation period.
-
Factual (present-day) – representing current conditions (2017–2024) forced with the SSP3-7.0 scenario. In this case, the external forcing is transient and evolves year by year.
These scenarios were driven by the same spectrally-nudged large-scale circulation and initial atmospheric conditions (1 January 2017 ERA5) and were run until 31 December 2024.
For each simulation, a 5-year ocean spin-up was performed using stand-alone FESOM2 integrations (1945–1949 for the Counterfactual and 2012–2016 for the Factual). For details, please refer to John et al. (2026).
To ensure robustness in the differences between the Factual and Counterfactual experiments, we use four additional ensemble members for each variable, branched from the main simulation. Following the lag-based ensemble approach of Brenowitz et al. (2025), spectral nudging is temporarily disabled at the beginning of the simulation period for different durations in each member before being reactivated using the July 2024 restart files. Specifically, nudging is switched off from 1 July 2024 for 1 d in member #1, 2 d in member #2, 3 d in member #3, and 4 d in member #4, after which nudging is re-enabled for the remainder of the simulation period. This procedure allows the model to evolve freely for a short period, creating slightly different atmospheric states that stabilise during the subsequent nudged period and provide a representation of internal variability. The limited ensemble size is primarily due to the high computational cost of conducting global km-scale simulations.
2.2 Synoptic variables
For our analyses, we use hourly model output from 00:00 UTC on 24 October 2024 to 23Z on 31 October 2024, covering the domain 35° W–20° E and 10–60° N. The variables considered include the zonal and meridional wind components (u, v), vertical velocity (ω), specific humidity (q), and geopotential height, at the following pressure levels: 1000, 925, 850, 700, 600, 500, 400, 300, 250, 150, 100, and 70 hPa. Additionally, we analysed precipitation rate, mean sea level pressure (MSLP), 2 m air temperature, total column water vapour (TCWV), sea surface temperature (SST), and evaporation. From these variables, we further derived the Most Unstable Convective Available Potential Energy (hereafter called CAPE) using the MetPy Python library (May et al., 2022) and Integrated Water Vapour Transport (IVT) using Eq. (1),
where g is the acceleration of gravity, V = (u,v) is the wind components, and dp is the depth of atmospheric layers in terms of pressure.
To disentangle the dynamic and thermodynamic contributions to surface evaporation, we diagnosed wind stress and saturation deficit as independent controlling factors (Zhang, 1997). The dynamic component was represented by the surface wind stress, computed as
were ρ is air density, CD is the drag coefficient, and V2 is the 10 m wind speed. The thermodynamic contribution was quantified through the saturation deficit, defined as the difference between the saturation specific humidity at sea surface temperature and the near-surface specific humidity (Δq = qs−qa). By analysing these two terms separately, we isolate the relative roles of dynamical forcing and thermodynamic gradients in shaping evaporation evolution.
To provide observational and reanalysis context, we also obtained the same set of atmospheric variables from ERA5 via the Copernicus Climate Data Store (Copernicus Climate Change Service, 2018). Daily SSTs were taken from the NOAA OISSTv2 database (Huang et al., 2021). Daily precipitation was derived from the Multi-Source Weighted-Ensemble Precipitation (MSWEP, Beck et al., 2019) and E-OBS (Cornes et al., 2018) datasets, as well as from ground-based observations provided by the Spanish Meteorological Agency (Agencia Estatal de Meteorología, AEMET) and the Valencian Meteorological Association (Associació Valenciana de Meteorologia, AVAMET). The full list of stations is provided in Table S1 in the Supplement.
To analyse the pathways of air parcels reaching Valencia on the day of the event, and to support the definition of regions of interest for the subsequent attribution analysis, we used the online version of the HYSPLIT model (Stein et al., 2015), available through the NOAA Air Resources Laboratory website. An analysis of 72 h backward trajectories was performed for air parcels arriving at Valencia (39.47° N, 0.37° E) at 12Z on 29 October, at four different arrival heights: 250, 1000, 2000, and 3000 m above sea level (a.s.l.). The trajectories were computed using data from the NCEP Global Data Assimilation System (GDAS). For each arrival height, an ensemble of 27 members was generated to account for trajectory uncertainty. The resulting trajectory patterns were used to identify the main transport pathways feeding the event, which guided the selection of the regions used in the attribution framework.
2.3 Long-term simulation
To assess the magnitude and uniqueness of the event, we placed it into a long-term climatological context. For this purpose, we used an extended IFS-FESOM reference climate simulation (hereafter referred to as IFS-FESOM) covering the period 1950–2014, obtained from the European Eddy RIch Earth System Models (EERIE) project (Ghosh et al., 2025). Unlike the spectrally-nudged simulations described above, this experiment was performed without spectral nudging, allowing the model to freely evolve. Apart from this difference, all other aspects of the experimental setup remained identical, including the atmospheric and oceanic components, parameterisations, and horizontal and vertical resolutions (Rackow et al., 2025). This consistency allows the IFS-FESOM simulation to be used as a physically coherent climatology to contextualise the storyline scenarios. To reduce storage and computational costs, the output data were regridded onto a regular 0.25° × 0.25° grid.
For the present analysis, daily values of selected key variables during the Valencia EPE were compared with their corresponding October–November daily values from the 1950–2014 IFS-FESOM simulation, as well as from ERA5 over the same reference period. Percentile-based thresholds (e.g., 5th or 95th percentiles) were calculated from the October–November daily values over the reference period, separately for IFS-FESOM and ERA5. This percentile-based comparison with a long reference simulation follows the climatological framing used in Van Garderen et al. (2021) to contextualise event extremeness. In our case, we use a bi-monthly climatology because including September (i.e., using the SON season) would incorporate markedly warmer and drier conditions that might not be representative of the late-October environment in which the event developed (e.g., Fig. 3 in Campos et al., 2025). For precipitation, the maximum daily precipitation index (Rx1day) was computed as the highest daily precipitation amount within each month, following the Expert Team on Climate Change Detection and Indices (ETCCDI; Zhang et al., 2011) definition, over Valencia. This Rx1day was then compared with the 95th percentile from the same reference period.
2.4 Event attribution
To assess the influence of climate change on the variables that influenced the Valencia EPE, we compared the Factual and Counterfactual scenarios by subtracting the latter from the former. We then calculated the relative changes following Eq. (3), which quantifies the percentage difference between the Factual (present-climate) and Counterfactual (colder-climate) values, normalised by the Counterfactual state.
To assess whether the differences between scenarios lie outside the range of internal variability, we applied a signal-to-noise approach following the methodology of Van Garderen et al. (2021). The method uses all possible pairwise combinations of ensemble members to compute differences both within and between scenarios. The inter-scenario differences (Factual − Counterfactual) represent the signal, while the intra-scenario differences (Factual − Factual and Counterfactual − Counterfactual) represent the noise. Following Van Garderen et al. (2021), a significant signal-to-noise ratio is identified when the median of the signal distribution lies outside the inter-quartile range of the noise.
3.1 Event description and model validation
The devastating EPE in Valencia (represented by the red dot in Fig. 1a) occurred on 29 October 2024. In this section, the event is described based on the Factual simulation from the DestinE ClimateDT model, which provides the main reference for the analysis. ERA5 is included for intercomparison purposes and is shown in the Supplement.
On this day, in the Factual scenario (Fig. 1), an upper-level COL is located over the southwestern Iberian Peninsula, centred near 35° N, 5° W. This configuration persisted for several days (not shown), with the COL drifting slightly southwestward from the central Iberian Peninsula between 27 and 29 October, thereby maintaining its quasi-stationary character. This persistent evolution is consistent with that found in ERA5, as expected given the spectral nudging applied in the simulation (Fig. S1 in the Supplement).
Over the Mediterranean coast of Spain, TCWV (shaded colours in Fig. 1b) exceeds 30 kg m−2, enhanced by a plume of moisture transported from the subtropical Atlantic across northwestern Africa in an atmospheric-river-like (AR-like) structure. This plume, located along the eastern flank of the COL, exhibits local IVT magnitudes exceeding 500 kg m−1 s−1 (Fig. 1b). The moisture flux reaches the Valencian coast almost perpendicularly, favouring moisture convergence and orographic lifting as the low-level flow interacts with the local topography (Fig. 1c; see Fig. S2 for the model's topography). This moist environment off the Valencian coast is also unstable, with CAPE values exceeding 1500 J kg−1 (Fig. 1d).
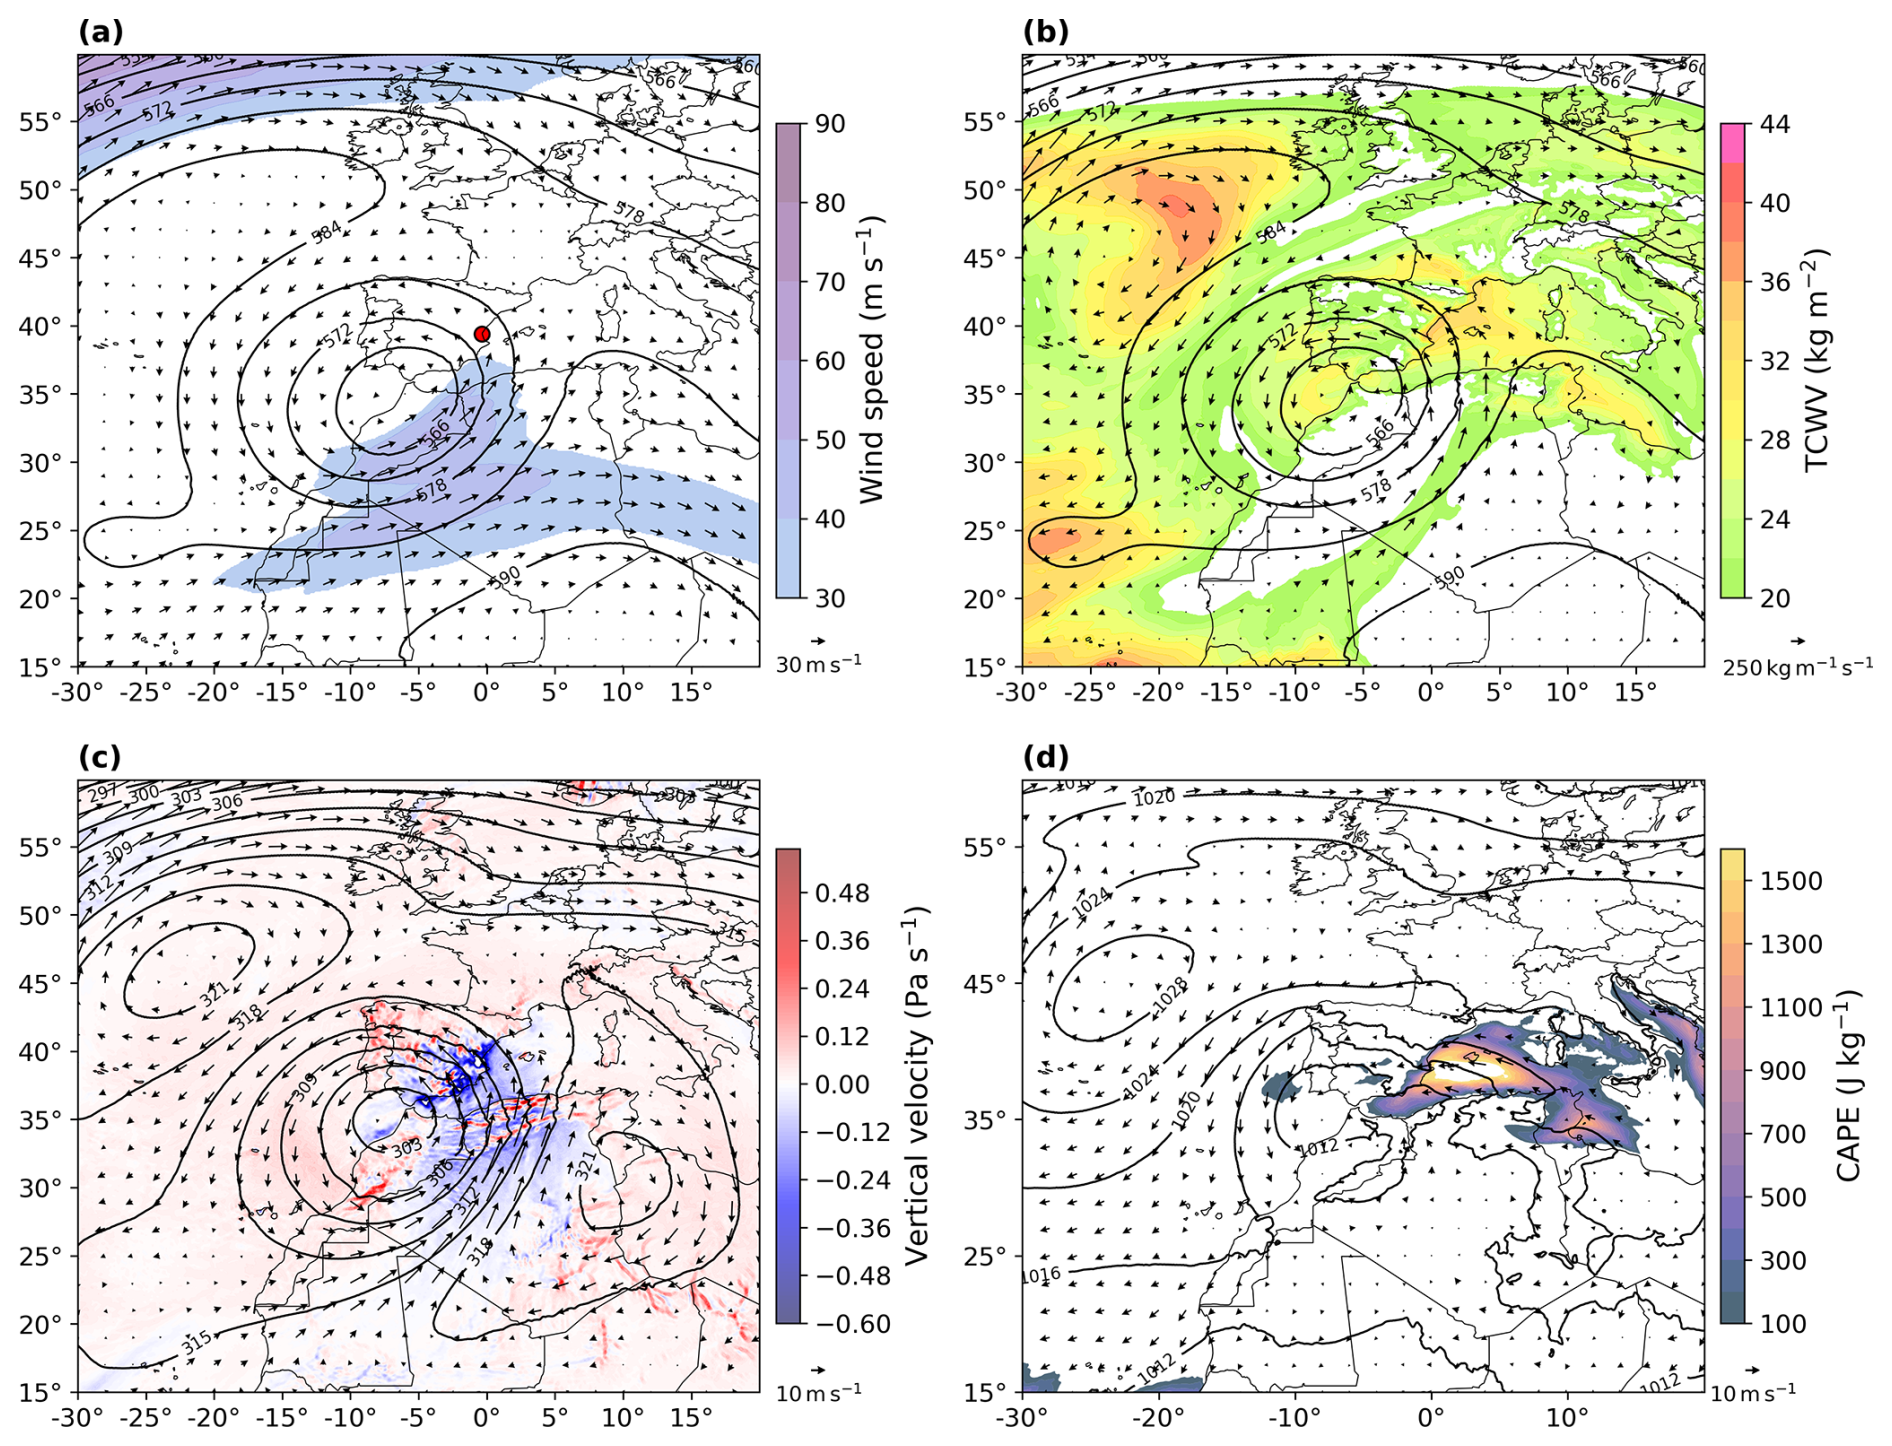
Figure 1Daily composite for 29 October 2024 from the main Factual scenario simulation for (a) 500 hPa geopotential height (contours, dam), 300 hPa wind (arrows, m s−1) and 300 hPa wind speed (colours, m s−1), (b) 500 hPa geopotential height (contours, dam), integrated water vapour transport (IVT, arrows, kg m−1 s−1) and total column water vapour (TCWV, colours, kg m−2), (c) 700 hPa geopotential height (contours, dam), 700 hPa wind (arrows, m s−1) and vertically-averaged vertical velocity (colours, Pa s−1), and (d) mean sea level pressure (MSLP, contours, hPa), 1000 hPa wind (arrows, m s−1) and most unstable convective available potential energy (CAPE, colours, J kg−1). The red dot on panel (a) shows the approximate location of Valencia.
The synoptic configuration in the Factual scenario shows good agreement with ERA5, not only for the nudged dynamical fields, such as geopotential height, but also for thermodynamic variables like TCWV (Fig. S3). The main discrepancy arises from an underestimation of CAPE over land in the Factual scenario compared to ERA5. This difference might be related to the coarser vertical resolution used to compute CAPE in the simulation (11 levels in the Factual scenario versus 27 levels in ERA5).
Two main air parcel pathways can be identified reaching the Valencia area on the 29th. The first pathway, associated with the AR-like structure, originates over the subtropical Atlantic, crosses northwestern Africa at mid-tropospheric levels (approximately 2000–3000 m a.s.l.), and arrives over Valencia at a similar altitude. In contrast, the second pathway travels at low levels (around 500 m a.s.l.) across the Mediterranean Sea, reaching Valencia near the surface (Fig. 2a). The relatively warm SSTs over the Mediterranean (around 24 °C during the week of the event, Fig. 2a) favour the high values of TCWV and CAPE observed in the region (Fig. 1b–d). To further investigate the role of these two moisture pathways on the precipitation in Valencia, and how they differ across climate scenarios, we define two regions: the Northwestern Africa region (NWA; 33.45–35.45° N; 0.20° W–4.50° E) and the Mediterranean region (MED; 37.05–41.05° N; 6.50–8.50° E), as shown in red boxes in Fig. 2a.
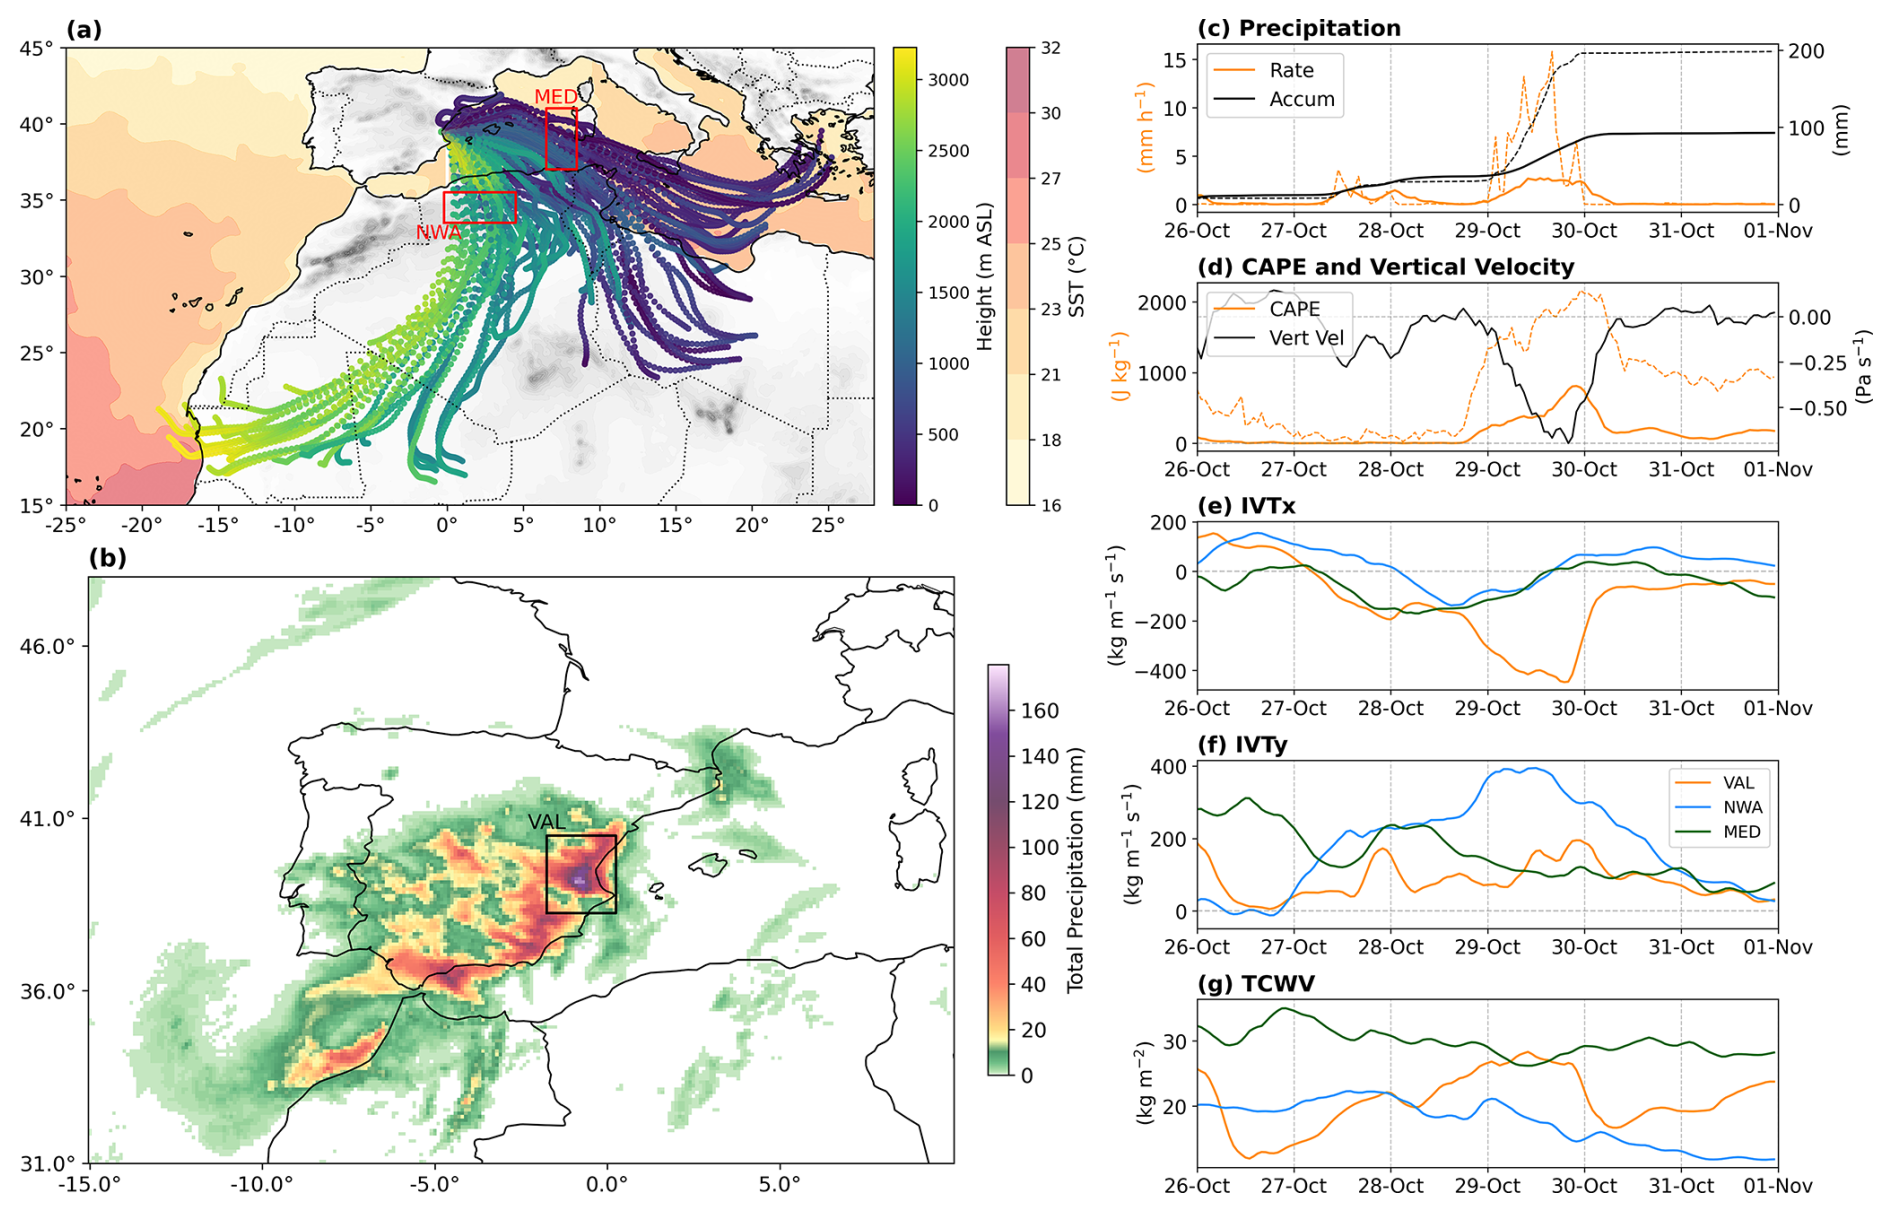
Figure 2(a) 72 h backward trajectories from the HYSPLIT model for air parcels arriving in Valencia at 12Z on 29 October, and 7 d mean (24–30 October) SSTs (°C) from NOAA OISSTv2. Red boxes indicate the Mediterranean (MED) and Northwestern Africa (NWA) boxes. (b) 24 h accumulated precipitation on 29 October from the main Factual scenario simulation, with the Valencia (VAL) box shown in black. (c) Hourly precipitation rate (orange) and accumulated precipitation (black) over the Valencia box. Solid lines indicate the box mean, and dashed lines indicate the grid cell with the highest accumulation. Accumulated precipitation is computed starting at 00:00 UTC on 24 October. (d) Vertically-averaged vertical velocity (black) and CAPE (orange) over the Valencia box. Solid lines show the box mean, and the orange dashed line indicates the highest hourly CAPE within the box. (e) Hourly mean zonal IVT (IVTx) over VAL (orange), NWA (blue), and MED (green). (f) As in (e), but for meridional IVT (IVTy). (g) As in (f), but for TCWV.
The spatial precipitation pattern on 29 October in the Factual scenario is shown in Fig. 2b. A broad area over southern Iberia experiences rainfall during the day, with the highest amounts concentrated over the Valencia region, where a local maximum of approximately 180 mm is simulated. This pattern closely resembles that from ERA5, although the higher horizontal resolution of the Factual simulation provides greater spatial detail, particularly in capturing the influence of topography on precipitation. In contrast, E-OBS and MSWEP display a more homogeneous spatial distribution (Fig. S4). Despite the realistic spatial distribution, the Factual simulation underestimates total precipitation compared to local ground stations in the Valencia region, which recorded more than 600 mm in 24 h (Table S1 and Fig. S5 in the Supplement). Therefore, in this study, we focus on the synoptic environment and the regional characteristics of precipitation over Valencia, and define the Valencia box, VAL (38.25–40.50° N; 1.75° W–0.25° E, black box in Fig. 2c) for further analysis.
Between 24 and 31 October, the Valencia region (VAL) accumulated an average of approximately 100 mm of precipitation, with local maxima reaching around 200 mm. Most of this rainfall occurred on 29 October, when the highest precipitation rates were simulated, with mean values of about 2 mm h−1, and local peaks exceeding 10 mm h−1 (Fig. 2c). The precipitation maximum on 29 October coincides with a period of enhanced atmospheric instability over VAL (Fig. S7), characterised by mean CAPE values near 600 J kg−1, local maxima close to 2000 J kg−1, and a (negative) peak in vertical velocity (Fig. 2d).
These precipitation and instability peaks are closely linked to the evolution of the IVT and TCWV over the region. The westward (negative) zonal component of the IVT over VAL gradually increases with time, reaching a maximum of about 400 kg m−1 s−1 on 29 October (Fig. 2e). At the same time, the northward (positive) meridional component (IVTy) over the northwestern Africa region (NWA) also peaks near 400 kg m−1 s−1, associated with the AR-like moisture plume (Fig. 2f). The biggest contribution from the Mediterranean region (MED) appears to occur 1 to 2 d earlier, when the IVT reaches its maximum with a southeasterly orientation (Fig. 2e–f). The maximum TCWV over VAL is observed on 29 October, with values close to 30 kg m−2, followed by a rapid decrease associated with the dissipation of the NWA moisture inflow and the peak in precipitation on the same day (Fig. 2g). In contrast, TCWV over the MED remains relatively steady through time, suggesting it is mainly governed by local processes rather than remote moisture transport (Fig. 2g).
3.2 Long-term perspective
We now analyse the key variables associated with the Valencia EPE, described in Sect. 3.1, within a climatological context. For this purpose, we used the long IFS-FESOM simulation and ERA5 reanalysis over the 1950–2014 period as reference datasets; ERA5 provides an observational reference, while the long IFS-FESOM run offers a model-consistent climatology for the storyline framework. The extremeness of the event was assessed using the maximum daily precipitation index (Rx1day) over the VAL region (Fig. 3a). During the Valencia EPE, the spatially averaged daily precipitation in the Factual scenario reached nearly 44 mm (red dashed line in Fig. 3a), exceeding the 95th percentile of the Rx1day distribution in the long IFS-FESOM simulation (∼ 28 mm; thin light blue line in Fig. 3a). In statistical terms, this indicates that the Valencia EPE qualifies as an extreme event. A similar conclusion is obtained from ERA5, although in this case, the event magnitude exceeds the 95th percentile of ERA5 by a smaller margin than in the IFS-FESOM world (black dashed and grey lines in Fig. 3a).
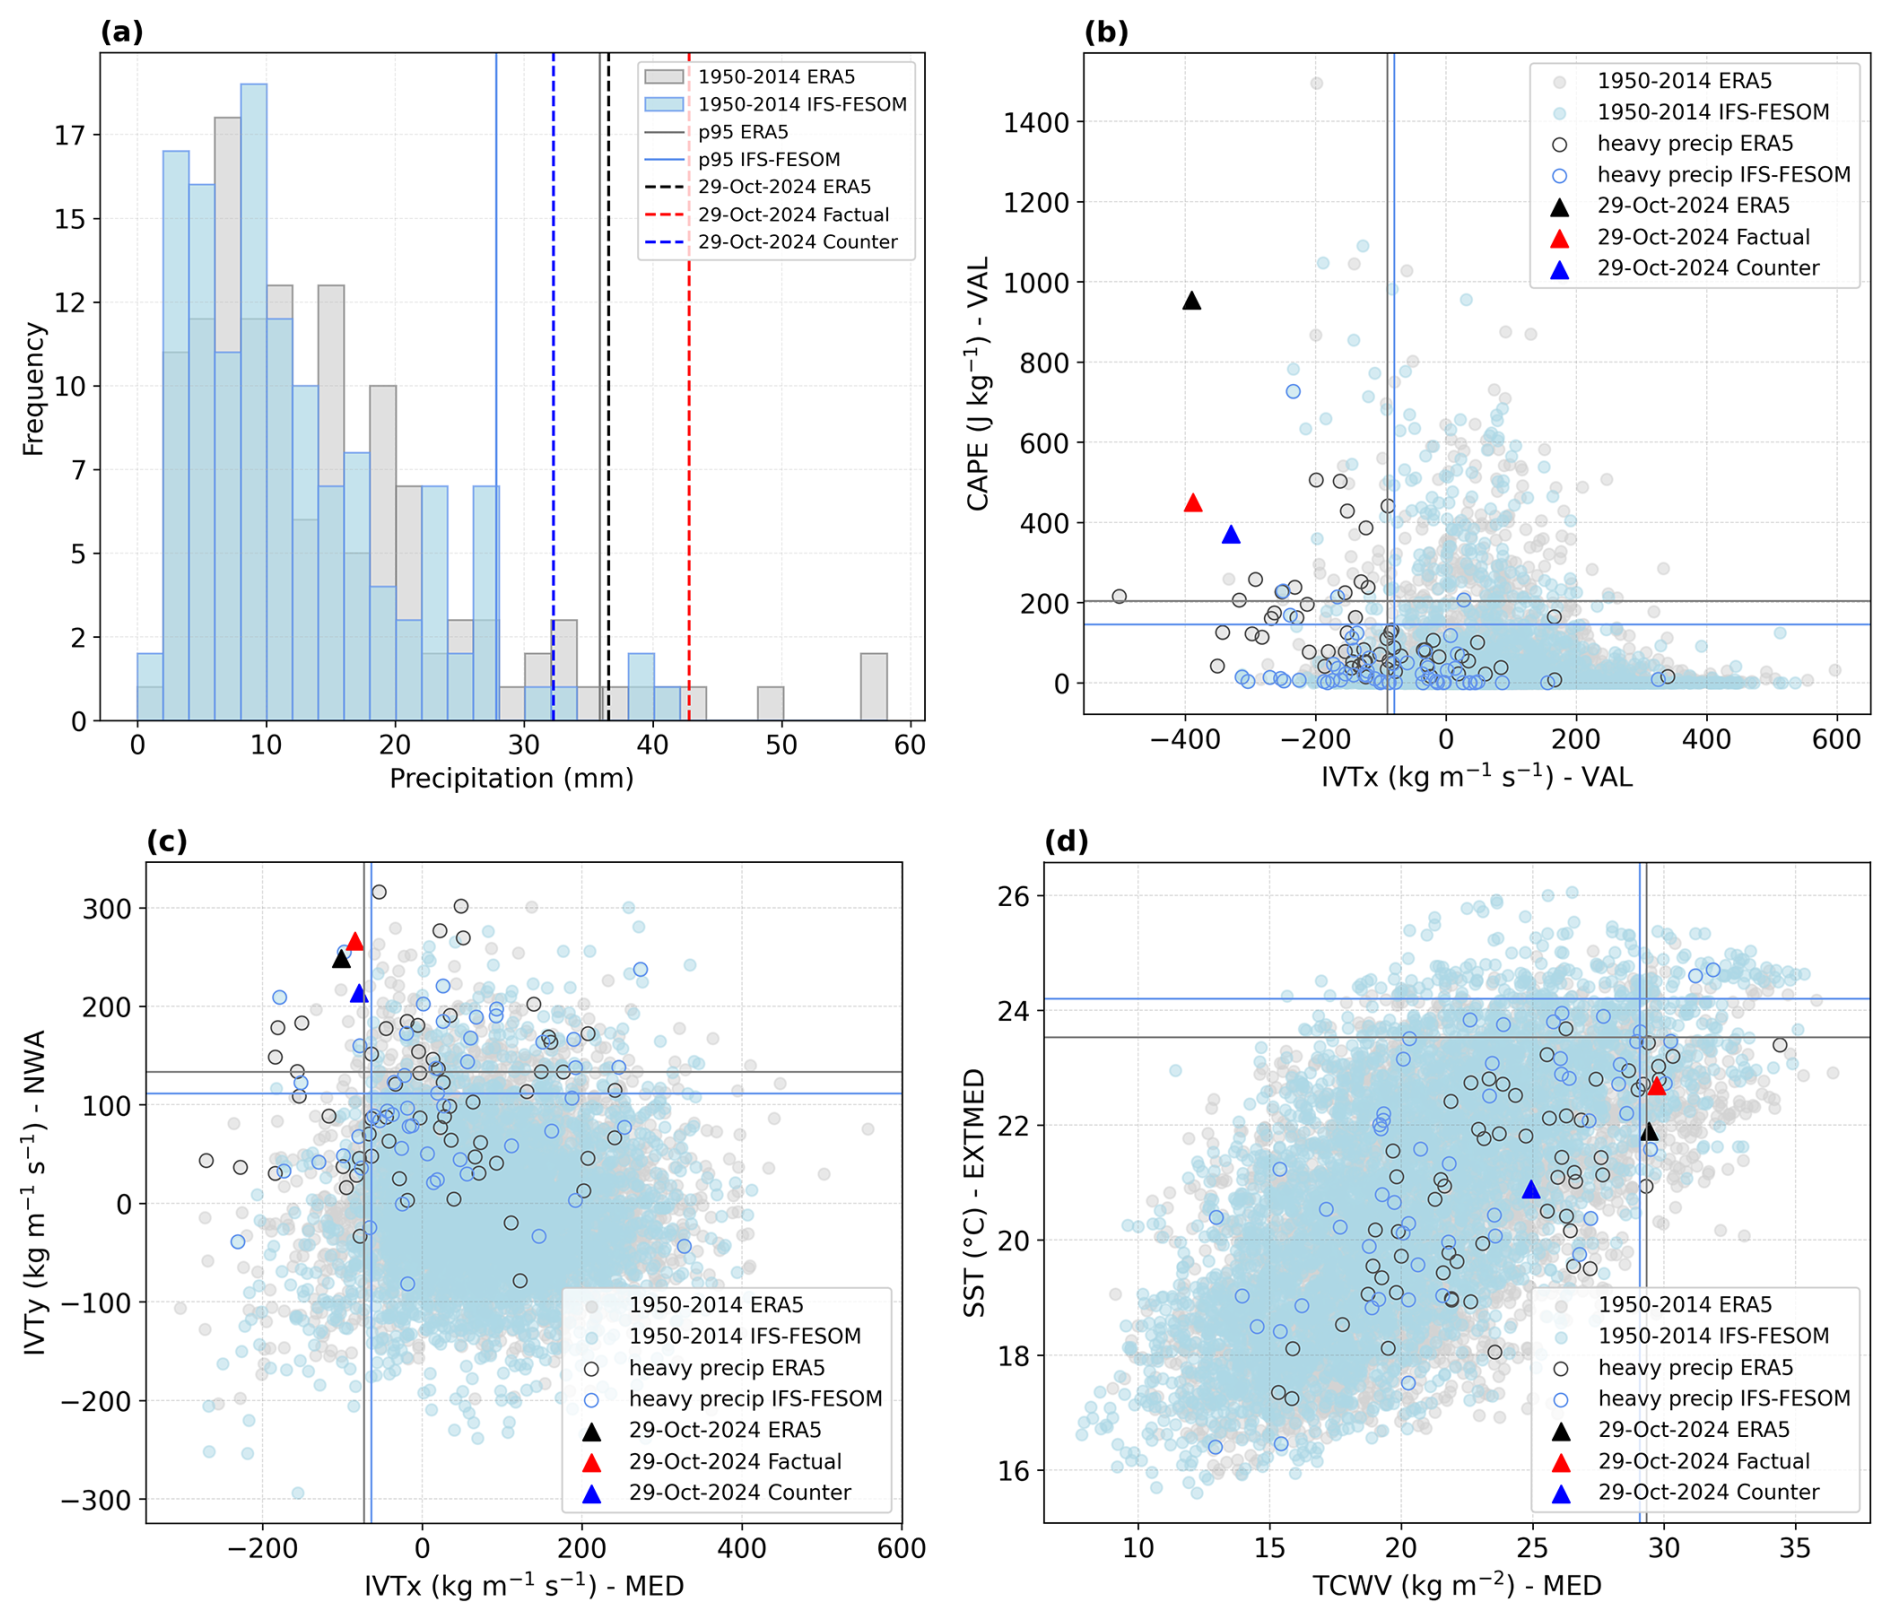
Figure 3(a) Distribution of maximum daily precipitation (Rx1day) in Valencia (VAL box) for October–November during 1950–2014 in ERA5 (light grey bars) and IFS-FESOM (light blue bars). (b) Daily mean IVTx and CAPE values spatially averaged over VAL for October–November during 1950–2014 in ERA5 (light grey circles) and IFS-FESOM (light blue circles). (c) As in (b), but for the 3 d mean IVTx values spatially averaged over the Mediterranean box (MED) and IVTy over northwestern Africa box (NWA). (d) As in (c), but for TCWV over MED and SST over an extended Mediterranean box (EXTMED; 36.5–40.5° N; 0.0–8.5° E). Thin vertical lines (light grey for ERA5, light blue for IFS-FESOM) indicate the 5th or 95th percentiles of the 1950–2014 reference period, as appropriate. (a) Dashed vertical lines and (b–d) triangles denote the values on 29 October for ERA5 (black) and for the Factual (red) and Counterfactual (blue) scenarios. (b) Bordered circles indicate days with heavy precipitation in VAL (defined as exceeding the 75th percentile). (c, d) Bordered circles indicate heavy-precipitation days based on the last day of the 3 d period.
If we now apply this analysis as an approximation for a statistical attribution assessment, following a strategy similar to Van Garderen et al. (2021), we can compare the Factual and Counterfactual scenarios within a climatological context. For Rx1day in VAL, both scenarios exceed the 95th percentile, although the Counterfactual scenario exhibits a lower magnitude (see red and blue dashed lines in Fig. 3a). This suggests that the event would also have been extreme under a colder climate, although less intense.
Following the same approach, but now focusing on a combination of variables associated with the extreme precipitation over VAL, we analysed the daily IVTx and CAPE spatially averaged over this region (Fig. 3b). On the day of the event, a situation characterised by high CAPE and strongly negative IVTx values is observed (black and red triangles in Fig. 3b). Heavy precipitation events in VAL tend to occur under negative IVTx conditions, i.e., an easterly moisture flux from the Mediterranean Sea toward the region, which effectively transports humid air and contributes to convective development; however, CAPE does not appear to be a determining factor in these heavy precipitation events (bordered circles in Fig. 3b). On 29 October, both variables exceeded their respective thresholds for statistical extremeness in both the ERA5 and IFS-FESOM datasets. Furthermore, both the Factual and Counterfactual scenarios exceed the 95th percentile, suggesting that the intense zonal moisture flux and atmospheric instability observed on 29 October would have been considered extreme even in the absence of anthropogenic climate change (Fig. 3b).
In a similar way, we examine the extremeness of the moisture transport contributions from both NWA and MED. As these regions are distant from VAL and the maximum IVT does not necessarily coincide with the day of heavy precipitation there (see Fig. 2c–g), we use 3 d mean values for each variable. Figure 3c shows the 3 d mean IVTx over MED and IVTy over NWA. During the event, a strong positive IVTy over NWA, typically associated with heavy precipitation in VAL (see bordered circles in Fig. 3c), acts in combination with a strong negative IVTx over MED (Fig. 3c). Both variables reach extreme values, with those in the Factual scenario exceeding the thresholds derived from the long IFS-FESOM simulation, particularly for IVTy in NWA. The same result is obtained when using ERA5 data (Fig. 3c). For both variables, the Counterfactual closely follows the Factual, with values remaining above the extreme threshold. This indicates that the moisture transport from the NWA and MED regions would also have been extreme in a colder climate (Fig. 3c).
The final set of variables examined from a long-term perspective are TCWV and SST over the Mediterranean Sea, given their relatively high values during the event (Fig. 2). For TCWV, we use the same MED region defined previously, while for SST, we extend the MED box towards the Valencian coast, defining a new region: the extended Mediterranean box (EXTMED; 36.5–40.5° N, 0.0° W–8.5° E, see Fig. 5a). This extension is made because, unlike in the analysis of moisture transport (where independence from the NWA box was needed), for SST and evaporation it is more relevant to encompass the marine area directly influencing the Valencia EPE. For both variables, 3 d mean values are used to place their magnitudes in the context of the 1950–2014 reference period, using both IFS-FESOM and ERA5 datasets (Fig. 3d). Most heavy precipitation days in VAL do not exceed the 95th percentiles of TCWV and SST over the MED region, suggesting that these are not necessary conditions for extreme precipitation in VAL (see bordered circles in Fig. 3d). During the Valencia EPE of October 2024, TCWV over MED slightly exceeded the 95th percentile of the reference period in both the IFS-FESOM Factual scenario and ERA5, whereas SST over the EXTMED region did not (Fig. 3d). Interestingly, TCWV over MED is not extreme in the Counterfactual scenario, indicating that anthropogenic climate change substantially contributed to the unusually high moisture content over MED during the 29 October event (Fig. 3d).
3.3 Factual–Counterfactual comparison
In this section, we analyse the role of climate change in shaping the synoptic environment and precipitation over Valencia during the event by comparing the Factual and Counterfactual scenarios. On 29 October, positive TCWV anomalies are found across the entire domain, particularly within the AR-like moisture plume along the eastern flank of the COL circulation (Fig. 4). In this region, TCWV exceeds the Counterfactual values by more than 8 kg m−2, and IVT increases by over 100 kg m−1 s−1 in the Factual scenario (Fig. 4a). We use here the geopotential height from the Factual scenario to depict the COL circulation, as no displacement in the COL position is found between scenarios due to the spectral nudging applied in the simulations. Nevertheless, we observe an increase in the COL 1000–500 hPa thickness from the Counterfactual to the Factual scenario, consistent with the thermodynamic response to anthropogenic global warming (Figs. S6 and S7b; IPCC, 2023; Santer et al., 2017).
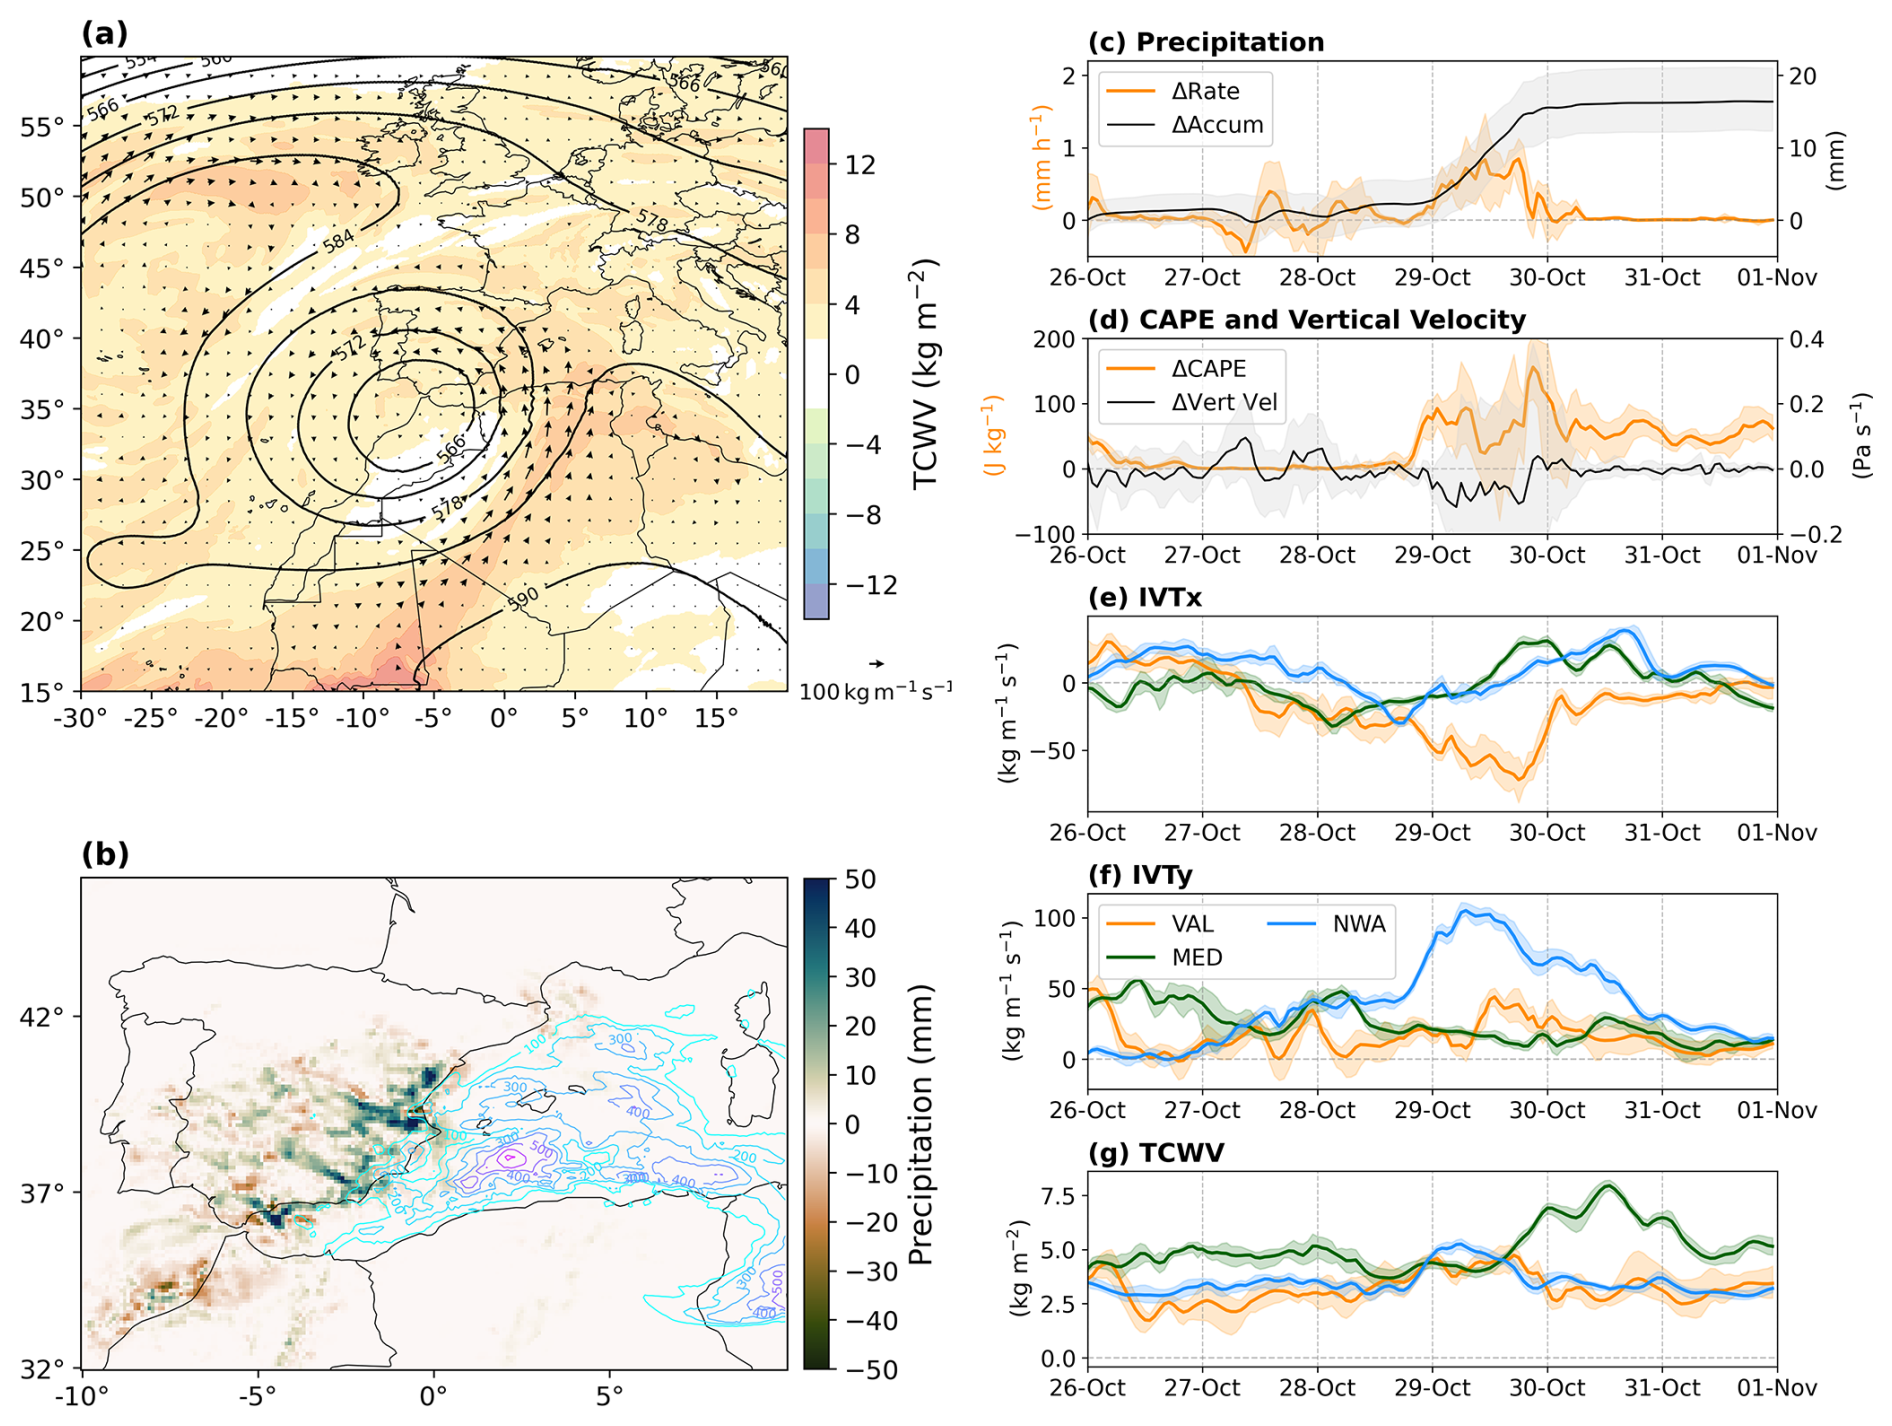
Figure 4(a) Composite of mean daily differences (Factual – Counterfactual) on 29 October for IVT (arrows) and TCWV (shading). Contours show the daily mean 500 hPa geopotential height (dam) in the Factual scenario (as in Fig. 1a–b). (b) Mean daily precipitation differences (shading, mm) and CAPE (contours, J kg−1) on 29 October. For CAPE, only positive differences above 100 J kg−1 are shown. (c) Hourly differences in precipitation rate (orange) and accumulated precipitation (black) over VAL. Solid lines indicate the mean difference, and shading shows the minimum–maximum range. Accumulated precipitation is computed starting at 00:00 UTC on 24 October. (d) As in (c), but for CAPE (orange) and vertically-averaged vertical velocity (black). (e) As in (d), but for hourly differences in IVTx over VAL (orange), NWA (blue), and MED (green). (f) As in (e), but for IVTy. (g) As in (f), but for TCWV. The shading in panels (c) to (g) shows the minimum-maximum range obtained using all the ensemble members.
The enhancement of the AR-like moisture plume reaches its maximum on 29 October, with a southerly IVTy component over NWA increasing by about 100 kg m−1 s−1 (Fig. 4f). This intensified moisture transport subsequently impacts VAL, where IVTx increases by nearly 70 kg m−1 s−1 (Fig. 4e), consistent with an increase in lower-level moisture availability (Fig. S7b). The IVT originating from the Mediterranean also strengthens in the Factual scenario, although to a lesser extent (Fig. 4e–f). In addition, the TCWV shows higher values across all regions due to climate change (Fig. 4g), indicating a general increase in moisture availability and transport.
This enhanced moisture supply has a direct effect on precipitation. On 29 October, precipitation increases markedly along the southeastern coast of Spain, with local maxima exceeding 40–50 mm over the VAL area (Fig. 4b). The higher precipitation rate throughout the day results in an additional 15–20 mm of rainfall accumulation over VAL during the event (from 24 to 31 October, Fig. 4c). In parallel, atmospheric instability intensifies over the Mediterranean Sea, with local CAPE differences reaching ∼ 500 J kg−1 (Fig. 4b). Although the CAPE increase is less pronounced over land, values exceeding 100 J kg−1 are observed over VAL on 29 October (Fig. 4d). The vertically-averaged vertical velocity exhibits a tendency toward enhanced upward motion over VAL across scenarios on 29 October; however, this signal shows substantial inter-ensemble spread (Fig. 4d), preventing a robust separation across scenarios. This behaviour is consistent with changes being primarily confined to the mid- to upper-tropospheric levels (approximately 600–300 hPa), while the low-level flow and its interaction with the regional topography remain broadly similar across scenarios (Fig. 5a).
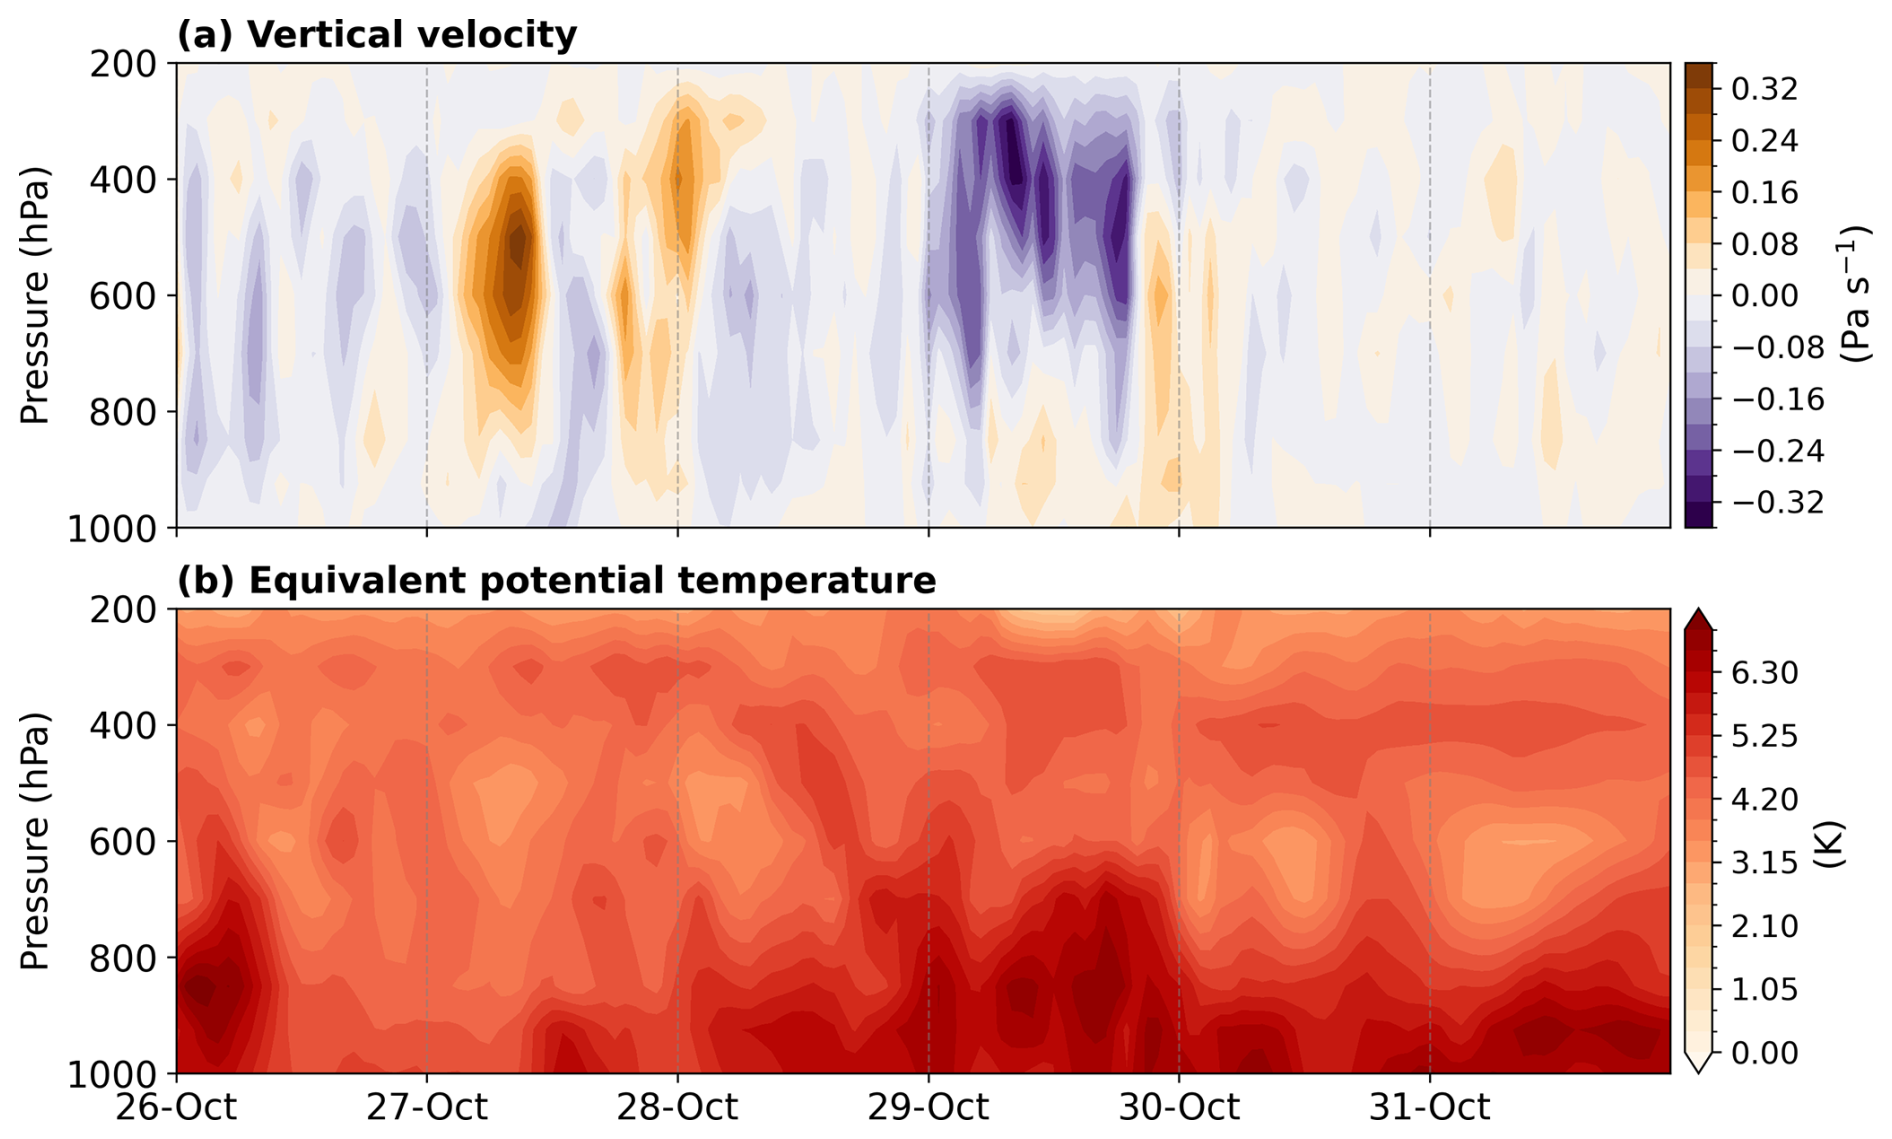
Figure 5Time-pressure evolution of Factual – Counterfactual differences in (a) vertical velocity (Omega, in Pa s−1) and (b) equivalent potential temperature (θe, in K) over the VAL region.
On 29 October, the Factual–Counterfactual differences in equivalent potential temperature (θe) are maximised in the lower troposphere, with the strongest anomalies below 600–700 hPa (Fig. 5b). These enhanced low-level θe differences coincide with the period of strongest mid-tropospheric ascent and with a marked increase in near-surface dew point temperature (Fig. S7), suggesting a strengthened coupling between low-level moist instability and upward motion during the peak of the event.
Table 1 summarises the relative changes between the Factual and Counterfactual scenarios (Eq. 2) over the main regions and variables discussed above. Overall, the results indicate a coherent thermodynamic response to global warming, with consistent increases across all variables. The largest relative change is observed in precipitation rate over VAL, with a mean increase of 36 % and a range of 14 % to 57 % across ensemble members. Accumulated precipitation over the 24–29 October period also increases by 20 % on average. CAPE exhibits a substantial rise of about 25 %, indicating enhanced atmospheric instability under warmer conditions. The moisture-related variables (TCWV and IVT) show more moderate but spatially consistent increases of 15 %–25 % across the three regions, with the strongest relative changes in TCWV and IVT over NWA, reflecting the intensified subtropical moisture inflow that feeds the AR-like structure.
Table 1Relative changes between the Factual and Counterfactual scenarios. The maximum–minimum range is estimated across all ensemble members.
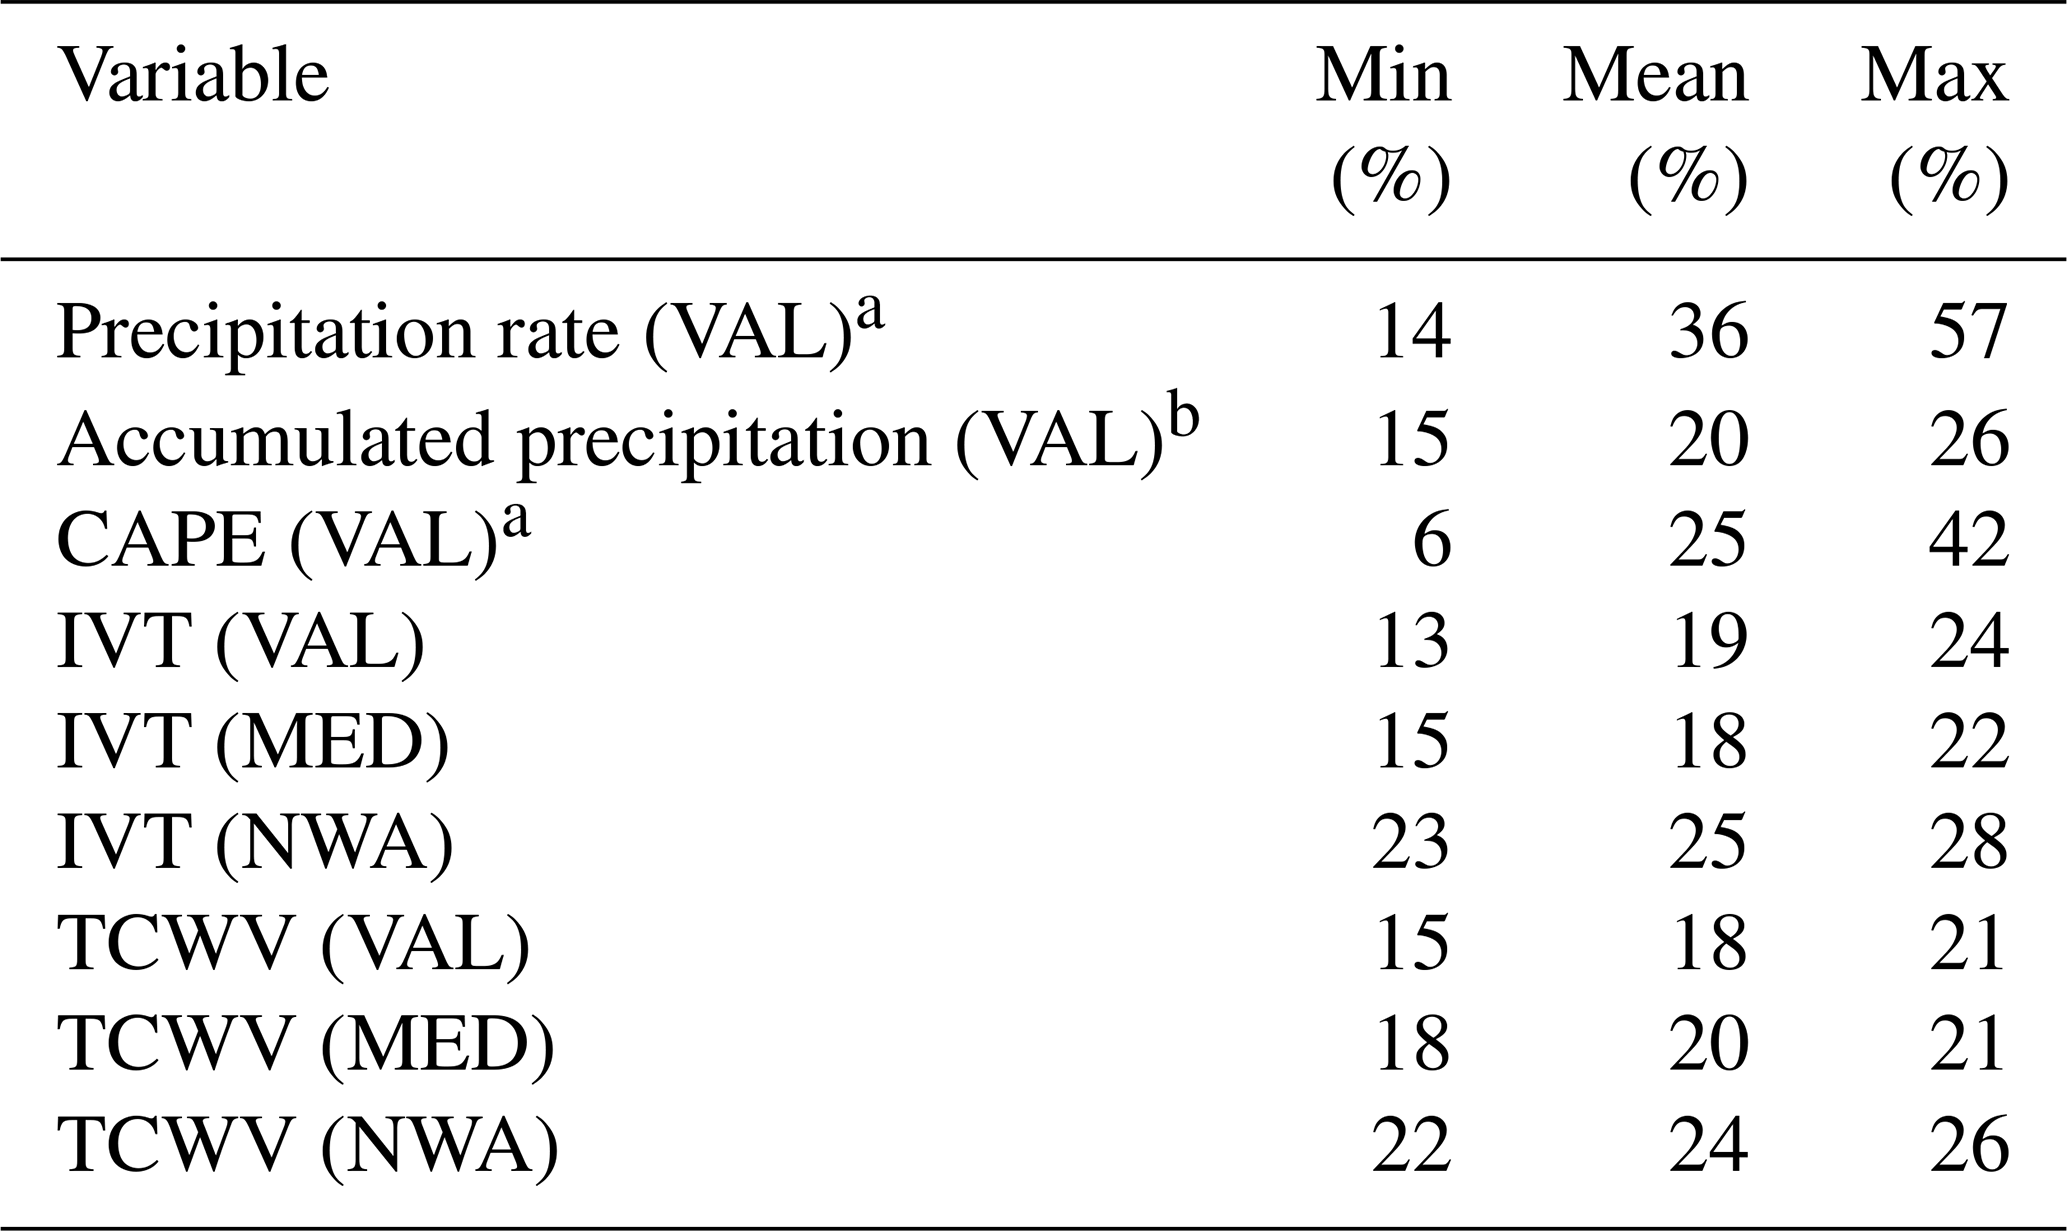
a For precipitation rate and CAPE, only 29 October is considered. b Accumulated precipitation corresponds to the period from 24–29 October.
The SST over the Mediterranean Sea is higher in the Factual scenario, with an average increase of nearly 2 °C and localised areas exceeding 3 °C of increase (Fig. 6a). In the EXTMED region, the mean SST in the Factual scenario is about 22.5–23 °C, compared to ∼ 21 °C in the Counterfactual scenario (Fig. 3d). These warmer SSTs are associated with enhanced evaporation, contributing to a moister environment near the coast of Valencia. In the days preceding 29 October, evaporation shows a maximum in both scenarios, associated with the advection of cold and dry air over the EXTMED linked to the COL. During this period, evaporation is notably higher in the Factual scenario than in the Counterfactual; primarily driven by differences in the thermodynamic component, while differences in wind stress are negligible (Fig. 6). On 29 October, surface winds contribute to relative increases in evaporation, but the differences in evaporation between scenarios remain negligible (Fig. 6). The limited dynamical differences between scenarios may partly reflect the spectrally nudged configuration of the simulations, which constrains the large-scale circulation above 700 hPa and thereby emphasises thermodynamic contrasts between climate states. The overall relative change in evaporation is 5.5 % (range: 4.5 %–6 %). These findings suggest that climate change may have played a significant role in increasing moisture availability and thereby creating favourable conditions for the intense precipitation observed during the event.
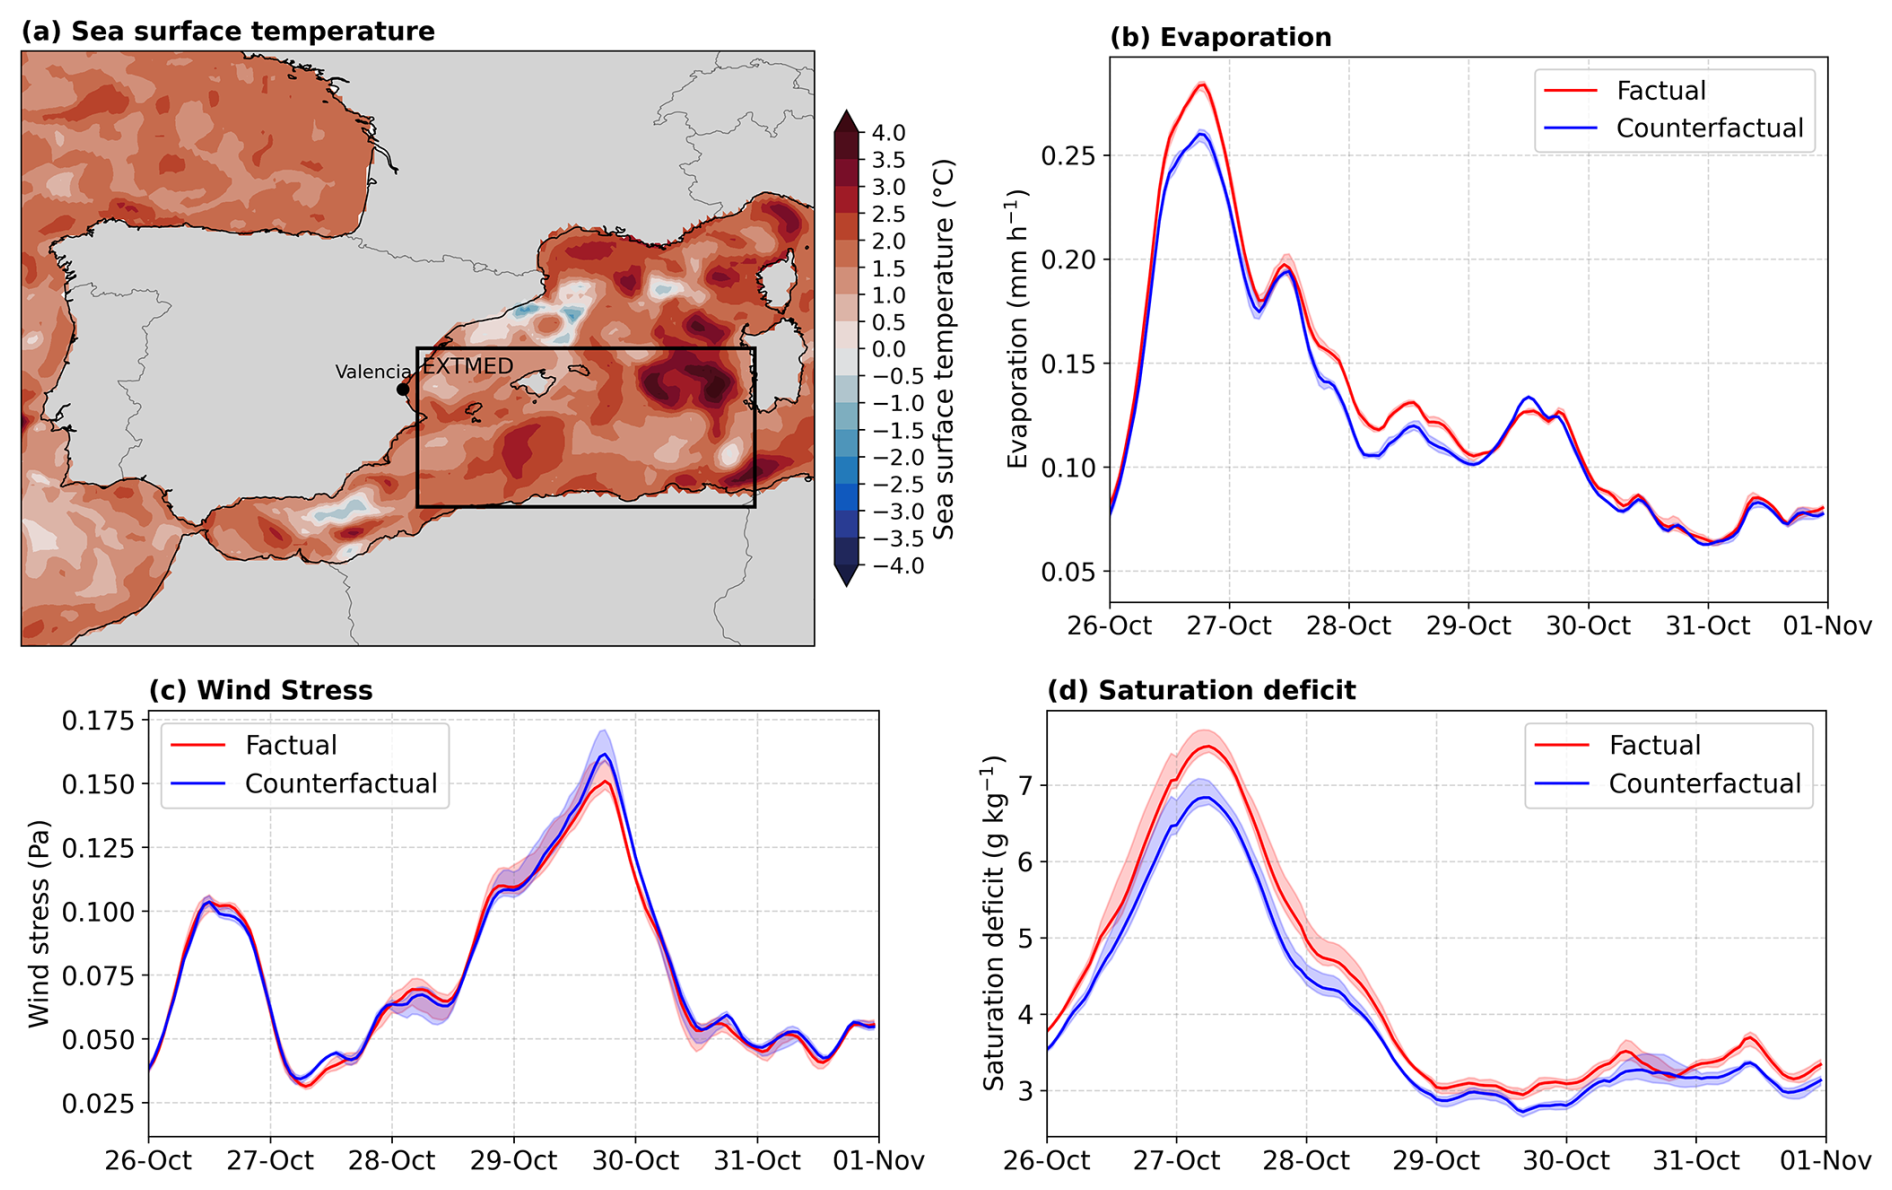
Figure 6(a) Mean SST difference between the Factual and Counterfactual scenarios, averaged over 24–31 October. Hourly evolution of (a) evaporation (mm h−1), (b) wind stress (Pa), and (c) saturation deficit (g kg−1) over the extended Mediterranean (EXTMED; box in panel a) for the Factual (red) and Counterfactual (blue) scenarios. Shading shows all the ensemble members.
3.4 Signal-to-noise ratio analysis
To strengthen the robustness of the findings presented in the previous section, we apply a signal-to-noise ratio approach to disentangle the climate change signal from internal variability. Specifically, we test whether the differences between ensemble members of the Factual and Counterfactual scenarios are statistically distinguishable from the variability observed within each scenario.
In general, the climate change signal is detectable across all variables. The intra-scenario distributions (for the Counterfactual, Count–Count, and the Factual, Fact–Fact) show median values and interquartile ranges centred around zero, whereas the inter-scenario distributions (Fact–Count) exhibit positive median values and interquartile ranges (Fig. 7). For the moisture-related variables, TCWV and IVT, the climate change signal clearly emerges from the noise, as the median and the 25th percentile of the inter-scenario distribution exceed the 75th percentile of the intra-scenario distributions in all regions (Fig. 7d–e). This separation is particularly pronounced for TCWV, where even the 5th percentile of the inter-scenario distribution lies above the 95th percentile of the intra-scenario distributions. Similar results are observed for SST, while for evaporation, the signal is less pronounced (Fig. S8).
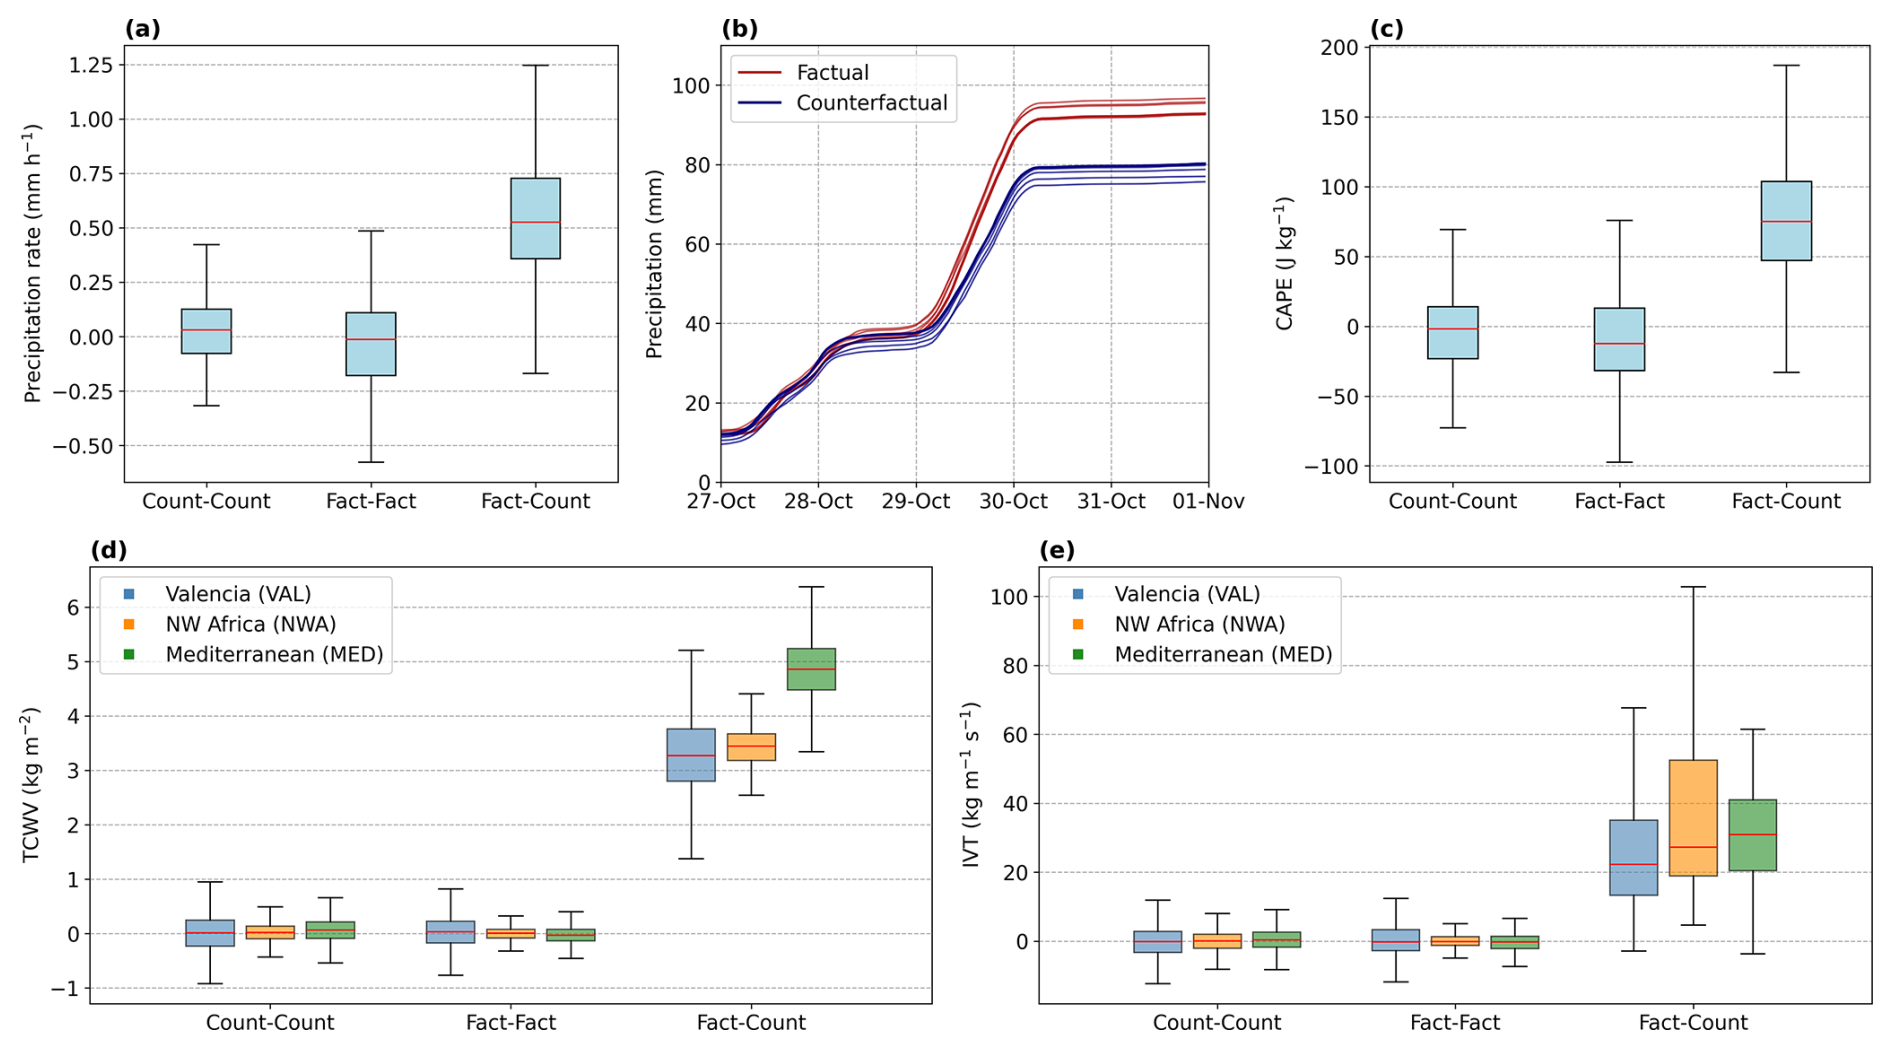
Figure 7Distribution of hourly differences between ensemble members for the Counterfactual scenario (Count–Count), the Factual scenario (Fact–Fact), and between scenarios (Fact–Count) for (a) precipitation rate over VAL on 29 October, (c) as in (a) but for CAPE, (d) TCWV over VAL (blue), NWA (orange), and MED (green) for the 24–31 October period, and (e) as in (d) but for IVT. (b) Accumulated precipitation over VAL for ensemble members of the Factual (red) and Counterfactual (blue) scenarios. Bold lines indicate the main run. Accumulation is calculated from 24 October. The boxes show the interquartile range of the distribution (25th–75th percentiles), the red line the median (50th percentile), and the vertical bars the 5th–95th percentile range. Outliers have been removed.
For the precipitation rate, a significant climate change signal is detected on 29 October (Fig. 7a). In contrast, no clear separation between scenarios is observed for the rainfall of the preceding days. The accumulated precipitation from 24 to 28 October is indistinguishable across ensemble members of both scenarios, with totals around 40 mm. On 29 October, however, the ensemble curves start to diverge markedly, leading to a clear difference in total accumulated rainfall by the end of the period (Fig. 7b). The analysis for CAPE is similarly restricted to 29 October, as this is when the most distinct signal emerges (Fig. 7c).
These results suggest that the influence of climate change on precipitation becomes evident only beyond a certain intensity threshold. Moderate and light rainfall events remain within the range of internal variability, while heavier precipitation shows a clear positive response to the additional warming. A similar behaviour is observed outside the VAL region, particularly over southern Spain, where the exceedance probabilities between scenarios start to diverge for rates exceeding ∼ 5 mm h−1 (Fig. S9).
Recent attribution studies of the October 2024 Valencia extreme precipitation event (EPE) have reported differing estimates of the influence of anthropogenic climate change depending on the methodological framework employed. Probabilistic and circulation-conditioned approaches have yielded mixed results regarding changes in event probability and precipitation intensity, ranging from substantial increases under present-day warming conditions (WWA, 2024) to weak or statistically non-significant changes (Barriopedro et al., 2025; Oldham-Dorrington and Messori, 2026). Studies using regional-to-local storylines under the pseudo-global warming approach consistently identify a robust thermodynamic amplification of the event under present-day climate conditions (Barriopedro et al., 2025; Calvo-Sancho et al., 2026). These contrasting results highlight the difficulty of attributing highly complex precipitation extremes using probabilistic approaches alone, motivating complementary frameworks that explicitly examine the physical processes through which anthropogenic warming influences the event (Van Garderen and León-FonFay, 2026).
Building on previous attribution studies, we analyse the spatiotemporal evolution of the synoptic-scale thermodynamic drivers of the event using kilometre-scale spectrally nudged global simulations from the DestinE ClimateDT initiative (Doblas-Reyes et al., 2026), in which the observed large-scale evolution of the Valencia EPE is preserved across Factual (present-day) and Counterfactual (∼ 1950s) climate scenarios within a coupled modelling framework (John et al., 2026). Our analysis particularly addresses the moisture transport and atmosphere-ocean preconditioning associated with the cut-off low (COL) over the WMed in late October 2024. The present study shows that anthropogenic climate change significantly contributed to enhanced atmospheric moisture availability, moisture transport, and instability, leading to a significant increase in the precipitation over Valencia. At the same time, we show that both precipitation and its thermodynamic drivers were also extreme under Counterfactual conditions during the event. Together, these results suggest that the Valencia EPE emerged from the combination of a favourable synoptic configuration and a substantial thermodynamic amplification associated with anthropogenic warming.
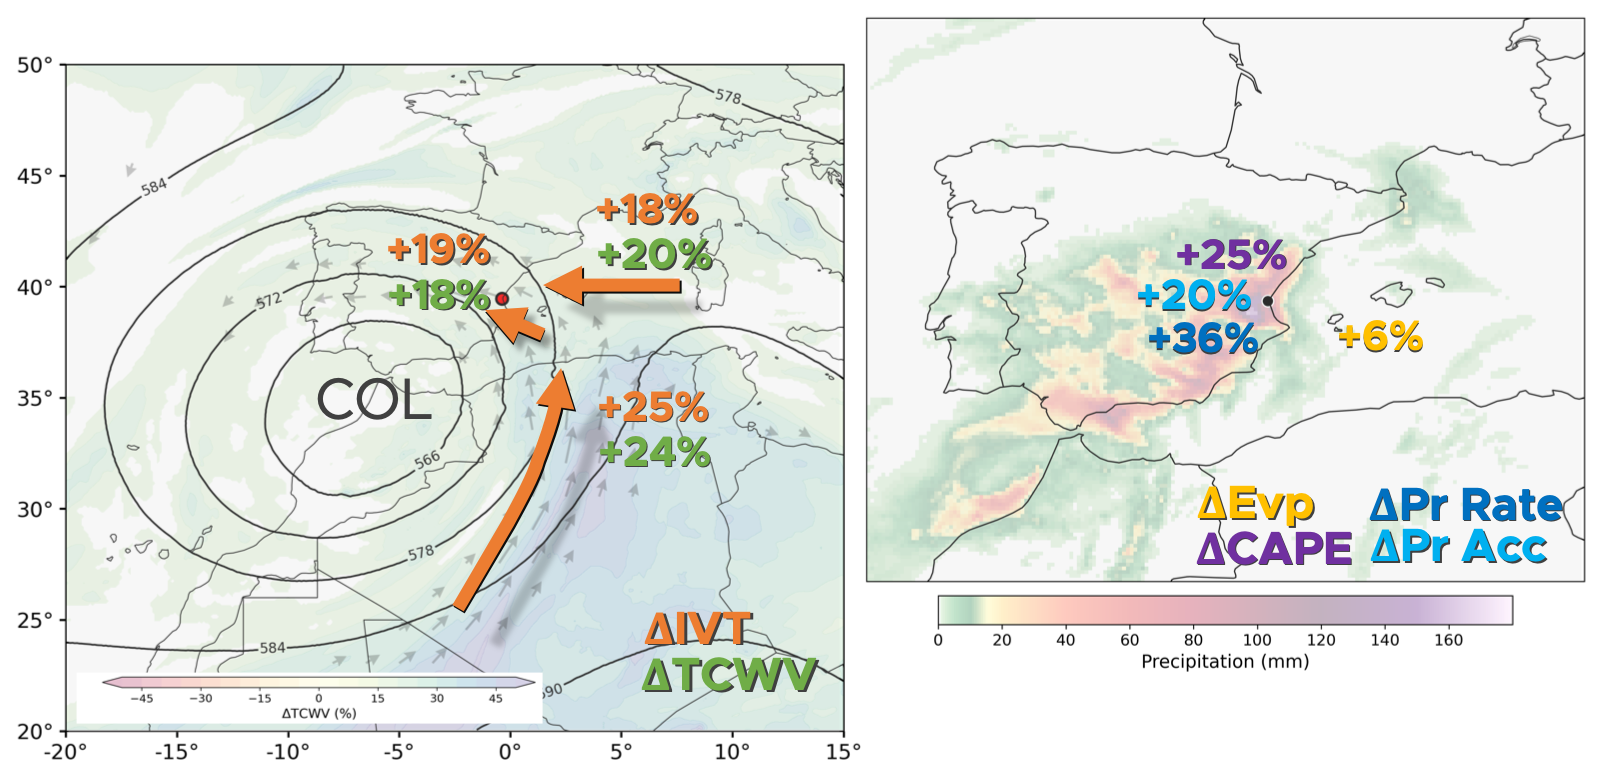
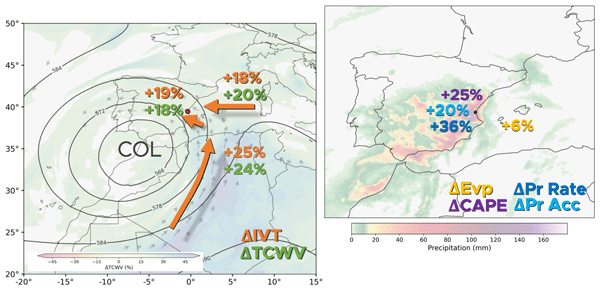
Figure 8Schematic figure of the relative changes between Factual and Counterfactual scenarios. Total column water vapour (ΔTCWV, in green) and integrated water vapour transport (ΔIVT, in orange) on the left. Precipitation rate (ΔPr Rate, in dark blue), accumulated precipitation (ΔPr Acc, in light blue), evaporation (ΔEvp, in yellow) and most unstable convective available potential energy (ΔCAPE, in purple) on the right. Orange arrows schematically indicate the main moisture transport pathways inferred from the IVT and TCWV analysis and are not quantitatively scaled.
In particular, we estimate that the atmospheric moisture content and transport increased by approximately 20 % under present-climate conditions (Fig. 8), which is physically consistent with the Clausius–Clapeyron (CC) relationship (Held and Soden, 2006), given the ∼ 2.2 °C surface temperature difference between scenarios in our simulations (based on the 8-year mean 2 m air temperature over the 30–60° N, 50° W–10° E domain; not shown). Previous estimates also point to a climate-change-induced moistening of the event, although the magnitude of the response differs depending on the variable, spatio-temporal scale, and counterfactual definition considered. Barriopedro et al. (2025) reported an approximately 5 % increase in specific humidity at 850 hPa, together with an intensification of warm and moist low-level air advection from the Mediterranean Sea toward the Valencia region during the peak of the event. At a more local scale, Calvo-Sancho et al. (2026) reported increases of about 12 % in precipitable water and 8.5 % in water vapour flux into the storm over Valencia. Together, these findings support the interpretation that climate change amplified the thermodynamic environment of the Valencia EPE, consistent with previous studies highlighting the role of warming-induced moisture increases in enhancing the potential for extreme precipitation (O'Gorman and Muller, 2010; Schneider et al., 2010).
Beyond this broad moistening signal, our results show that the thermodynamic amplification was not spatially homogeneous, but was more pronounced along the atmospheric river-like (AR-like) moisture plume extending from northwestern Africa toward the Iberian Peninsula. In this structure, atmospheric moisture content and transport increased by up to ∼ 25 % under present-climate conditions (Fig. 8). This synoptic-scale perspective complements previous regional and storm-scale studies by showing where the additional moisture was organised and transported before reaching the Valencia region. In addition, we show that Mediterranean Sea surface temperatures were significantly warmer under present-climate conditions, favouring enhanced evaporation and low-level moisture availability prior to the peak of the event. Similarly, Calvo-Sancho et al. (2026) previously reported an increase in evaporation near the Valencian coast. However, our results extend this local perspective by showing that enhanced evaporation was not limited to the immediate coastal area, but was also evident over a broader Mediterranean region during the days preceding the precipitation peak. This provides a physical link between anthropogenic warming and the warm Mediterranean conditions previously identified as an important contributor to the event (Saurral et al., 2026).
The thermodynamic amplification of the synoptic environment translated into a substantial and highly nonlinear increase in precipitation intensity over the Valencia region. Under 1950s climate conditions, the same synoptic configuration produced approximately 20 % less precipitation over Valencia than under present-day conditions (Fig. 8). This apparently modest change translates into a non-linear response in the spatial extent of extreme rainfall. For instance, the area exceeding the 90th percentile of daily precipitation doubled under present-day conditions, while the area exceeding the 99th percentile increased nearly fivefold (not shown). These estimates are in close agreement with previous attribution studies. In particular, Barriopedro et al. (2025) reported an approximately 20 % increase in accumulated precipitation, while Calvo-Sancho et al. (2026) found a comparable expansion of the area affected by extreme rainfall. The convergence of these results across distinct process-based attribution approaches strengthens the evidence for a robust thermodynamic contribution of anthropogenic warming to the precipitation response of the Valencia EPE.
The strongest precipitation amplification occurred on the peak of the event, on 29 October, when precipitation rates in the Factual scenario were approximately 36 % higher than under 1950s climate conditions (Fig. 8). This increase substantially exceeds the thermodynamic scaling expected from the mean warming signal alone and is consistent with previous studies showing that short-duration and convective precipitation extremes can intensify beyond CC scaling (Formayer and Fritz, 2017; Fowler et al., 2021; Guerreiro et al., 2018). Several processes likely contributed to this super-CC behaviour, including enhanced moisture transport and convergence on 29 October partly driven by the AR-like structure, consistent with previous studies highlighting the key role of large-scale moisture fluxes in modulating precipitation intensity (Gimeno-Sotelo and Gimeno, 2023; Prein et al., 2017). Additionally, the largest inter-scenario differences in mid-tropospheric vertical velocity and low-level equivalent potential temperature occurred on 29 October, when near-surface dew point temperatures also increased substantially. These results suggest that, beyond the increased moisture availability, a non-linear dynamical response contributed to the extreme precipitation, with latent heat release likely intensifying the updrafts as previously documented for this and other convective events (Calvo-Sancho et al., 2026; Fowler et al., 2021; Lenderink et al., 2017; Molnar et al., 2015; Singleton and Toumi, 2013).
The simulations used in this study, developed within the DestinE ClimateDT initiative (Doblas-Reyes et al., 2026), provide a novel opportunity for systematic event-based storyline attribution at the global scale. Their continuous, coupled, kilometre-scale configuration enables the thermodynamic influence of climate change to be assessed for extreme events occurring worldwide from 2018 onward within a common modelling framework (John et al., 2026). Compared with limited-area regional experiments, the global domain allows the large-scale circulation to be analysed consistently across climate scenarios, while still retaining kilometre-scale resolution to link synoptic-scale drivers to local precipitation responses, as illustrated here for the Valencia EPE. This represents an important step for the attribution community, as it allows physically consistent comparisons between factual and counterfactual climate states beyond region-specific or event-specific experimental setups.
Several limitations should be acknowledged. First, the use of spectral nudging constrains the large-scale atmospheric circulation, limiting the ability of the simulated dynamics to fully adjust to thermodynamic changes in temperature and moisture; the implications of this limitation for the attribution of extreme events should be further investigated to quantify potential under- or overestimations. This design is well suited to isolating thermodynamic effects under a prescribed synoptic evolution, but it also means that potential climate-change influences on the dynamics of the event itself, such as changes in the trajectory or location of the circulation pattern, are not directly assessed. Second, the Counterfactual scenario represents a cooler 1950-like climate state rather than a fully pre-industrial world (John et al., 2026). This choice, which follows the experimental design of the DestinE ClimateDT storyline simulations, introduces additional uncertainty when interpreting the results as an anthropogenic climate-change signal, although it may also be useful for impact-oriented storylines in cases where the mid-twentieth century provides a meaningful reference period for exposure and vulnerability. Finally, the 9 km horizontal resolution remains insufficient to fully resolve local-scale precipitation extremes in complex coastal and mountainous regions such as Valencia, where even convection-permitting regional climate models often struggle to reproduce the observed intensity and spatial variability (Calvo-Sancho et al., 2026).
Future work could extend this analysis in several directions. A key open question concerns the possible influence of anthropogenic climate change on the dynamical component of the event, including whether the frequency, persistence, or preferred location of quasi-stationary COLs over the western Mediterranean has changed or may change in the future. Future studies could also move beyond meteorological attribution toward impact attribution (Noy et al., 2024), using hydrological and flood-modelling approaches to translate changes in precipitation intensity, spatial extent, and timing into changes in runoff, and flood severity (e.g., Vertegaal et al., 2026). Coupling climate attribution with exposure and vulnerability analyses would be particularly important for assessing how climate change, land-use change, urban development, and flood-management infrastructure jointly shaped the observed impacts. In this sense, the present study should be viewed as one line of evidence within a broader multi-method attribution framework.
| AEMET | Spanish Meteorological Agency (Agencia Estatal de Meteorología) |
| AR | Atmospheric river |
| a.s.l. | Above sea level |
| AVAMET | Valencian Meteorological Association (Associació Valenciana de Meteorologia) |
| CAPE | Convective available potential energy |
| CC | Clausius–Clapeyron |
| ClimateDT | Digital Twins for climate adaptation |
| COL | Cut-off low |
| DANA | Upper-level isolated depression (Depresión Aislada en Niveles Altos) |
| DestinE | Destination Earth |
| EERIE | European Eddy RIch Earth System Models |
| EPE | Extreme precipitation event |
| ERA5 | ECMWF reanalysis version 5 |
| ETCCDI | Expert team on climate change detection and indices |
| EXTMED | Extended Mediterranean box |
| FESOM | Finite volumE Sea Ice-Ocean Model |
| GDAS | Global Data Assimilation System |
| HYSPLIT | HYbrid Single Particle Lagrangian Integrated Trajectory model |
| IFS | Integrated Forecasting System |
| IVT | Integrated water vapour transport |
| MED | Mediterranean box |
| MSLP | Mean sea level pressure |
| MSWEP | Multi-Source Weighted-Ensemble Precipitation |
| NOAA | National Oceanic and Atmospheric Administration |
| NWA | Northwestern Africa box |
| OISST | Optimum Interpolation Sea Surface Temperature |
| Rx1day | Maximum daily precipitation index |
| SST | Sea surface temperature |
| TCWV | Total column water vapour |
| UTC | Coordinated Universal Time |
| VAL | Valencia box |
| WMed | Western Mediterranean |
All the Jupyter Notebooks and codes used for the analysis are available in a GitLab repository (https://gitlab.earth.bsc.es/dcampos/storyline_attribution_dana, last access: 29 June 2026).
Data from the IFS-FESOM storyline runs are available through the DestinE DESP platform https://destine-data-lake-docs.data.destination-earth.eu/en/latest/introduction/introduction.html (last access: 30 September 2025). Data from the long IFS-FESOM run is available through the World Data Center for Climate platform https://www.wdc-climate.de/ui/entry?acronym=EERIE_FESOM_hist_v1 (last access: 30 September 2025). ERA5 reanalysis and E-OBS data are accessible via the Copernicus Climate Data Store https://cds.climate.copernicus.eu/datasets (last access: 30 September 2025). MSWEP data is accessible via the NCAR Climate Data Guide https://climatedataguide.ucar.edu/climate-data/global-high-resolution-precipitation-mswep (last access: 30 September 2025). NOAA OISSTv2 dataset is available on the NOAA Physical Sciences Laboratory webpage https://psl.noaa.gov/data/gridded/data.noaa.oisst.v2.highres.html (last access: 30 September 2025). Daily precipitation data from AEMET is available here https://opendata.aemet.es/centrodedescargas/productosAEMET (last access: 30 September 2025). Daily precipitation data from AVAMET are available here https://www.avamet.org/mx-meteoxarxa.php (last access: 30 September 2025). The HYSPLIT model can be run at the NOAA Air Resources Laboratory portal https://www.ready.noaa.gov/HYSPLIT.php (last access: 30 September 2025).
The supplement related to this article is available online at https://doi.org/10.5194/wcd-7-1153-2026-supplement.
DC, KG and RS designed the methodology for the study. SB and AJ prepared and ran the storyline simulations. DC conducted the analyses, produced the visualisations, and wrote the paper. MO and FDR supervised. All the authors contributed to the review and editing process.
The contact author has declared that none of the authors has any competing interests.
Publisher's note: Copernicus Publications remains neutral with regard to jurisdictional claims made in the text, published maps, institutional affiliations, or any other geographical representation in this paper. The authors bear the ultimate responsibility for providing appropriate place names. Views expressed in the text are those of the authors and do not necessarily reflect the views of the publisher.
We would like to acknowledge the European Commission Destination Earth Program and the GLORIA project funded by the Spanish MICIU/AEI and by the European Union NextGenerationEU/PRTR. We also acknowledge the EERIE project. The authors would like to thank the editor and the three anonymous reviewers for their comments and suggestions, which contributed to the improvement of this study.
RIS and MO are funded by the AI4Science PN070500 fellowship within the “Generación D” initiative, Red.es, Ministerio para la Transformación Digital y de la Funión Pública, for talent attraction (C005/24-ED CV1). Funded by the European Union NextGenerationEU funds, through PRTR.
This paper was edited by Shira Raveh-Rubin and reviewed by three anonymous referees.
AEMET: Estudio sobre la situación de lluvias intensas, localmente torrenciales y persistentes, en la Península Ibérica y Baleares entre los días 28 de octubre y 4 de noviembre de 2024, Agencia Estatal de Meteorología, https://www.aemet.es/es/conocermas/recursos_en_linea/publicac iones_y_estudios/estudios/detalles/episodio_dana_oct_nov24/ (last access: 20 May 2026), 2024.
Barrett, B. S., Campos, D. A., Veloso, J. V., and Rondanelli, R.: Extreme temperature and precipitation events in March 2015 in central and northern Chile, J. Geophys. Res.-Atmos., 121, 4563–4580, https://doi.org/10.1002/2016JD024835, 2016.
Barriopedro, D., Jiménez-Esteve, B., Collazo, S., Garrido-Perez, J. M., Johnson, J. E., and García-Herrera, R.: A multi-method attribution analysis of the Spain's 2024 extreme precipitation event, B. Am. Meteorol. Soc., 106, E2440–E2460, https://doi.org/10.1175/BAMS-D-25-0049.1, 2025.
Beck, H. E., Wood, E. F., Pan, M., Fisher, C. K., Miralles, D. G., Van Dijk, A. I. J. M., McVicar, T. R., and Adler, R. F.: MSWEP V2 Global 3-Hourly 0.1° Precipitation: Methodology and Quantitative Assessment, B. Am. Meteorol. Soc., 100, 473–500, https://doi.org/10.1175/BAMS-D-17-0138.1, 2019.
Bozkurt, D., Rondanelli, R., Garreaud, R., and Arriagada, A.: Impact of warmer eastern tropical Pacific SST on the March 2015 Atacama floods, Mon. Weather Rev., 144, 4441–4460, https://doi.org/10.1175/MWR-D-16-0041.1, 2016.
Brenowitz, N. D., Cohen, Y., Pathak, J., Mahesh, A., Bonev, B., Kurth, T., Durran, D. R., Harrington, P., and Pritchard, M. S.: A Practical Probabilistic Benchmark for AI Weather Models, Geophys. Res. Lett., 52, e2024GL113656, https://doi.org/10.1029/2024GL113656, 2025.
Calvo-Sancho, C., Díaz-Fernández, J., González-Alemán, J. J., Halifa-Marín, A., Miglietta, M. M., Azorin-Molina, C., Prein, A. F., Montoro-Mendoza, A., Bolgiani, P., Morata, A., and Martín, M. L.: Human-induced climate change amplification on storm dynamics in Valencia's 2024 catastrophic flash flood, Nat. Commun., 17, 1492, https://doi.org/10.1038/s41467-026-68929-9, 2026.
Campos, D. A., Olmo, M. E., Cos, P., Muñoz, Á. G., and Doblas-Reyes, F. J.: Regional Aspects of Observed Temperature and Precipitation Trends in the Western Mediterranean: Insights from a Timescale Decomposition Analysis, J. Geophys. Res.-Atmos., 130, e2024JD042637, https://doi.org/10.1029/2024JD042637, 2025.
Copernicus Climate Change Service: ERA5 hourly data on pressure levels from 1940 to present, Copernicus Climate Change Service (C3S) Climate Data Store (CDS) [data set], https://doi.org/10.24381/CDS.BD0915C6, 2018.
Cornes, R. C., Van Der Schrier, G., Van Den Besselaar, E. J. M., and Jones, P. D.: An Ensemble Version of the E-OBS Temperature and Precipitation Data Sets, J. Geophys. Res.-Atmos., 123, 9391–9409, https://doi.org/10.1029/2017JD028200, 2018.
Cos, J., Doblas-Reyes, F., Jury, M., Marcos, R., Bretonnière, P.-A., and Samsó, M.: The Mediterranean climate change hotspot in the CMIP5 and CMIP6 projections, Earth Syst. Dynam., 13, 321–340, https://doi.org/10.5194/esd-13-321-2022, 2022.
Danilov, S., Sidorenko, D., Wang, Q., and Jung, T.: The Finite-volumE Sea ice–Ocean Model (FESOM2), Geosci. Model Dev., 10, 765–789, https://doi.org/10.5194/gmd-10-765-2017, 2017.
Doblas-Reyes, F. J., Kontkanen, J., Sandu, I., Acosta, M., Al Turjmam, M. H., Alsina-Ferrer, I., Andrés-Martínez, M., Anerdi, C., Arriola, L., Axness, M., Batlle Martín, M., Bauer, P., Becker, T., Beltrán, D., Beyer, S., Bockelmann, H., Bretonnière, P.-A., Cabaniols, S., Caprioli, S., Castrillo, M., Chandrasekar, A., Cheedela, S., Correal, V., Danovaro, E., Davini, P., Enkovaara, J., Frauen, C., Früh, B., Gaya Àvila, A., Ghinassi, P., Ghosh, R., Ghosh, S., González, I., Grayson, K., Griffith, M., Hadade, I., Haine, C., Hartick, C., Haus, U.-U., Hearne, S., Järvinen, H., Jiménez, B., John, A., Juchem, M., Jung, T., Kegel, J., Kelbling, M., Keller, K., Kinoshita, B., Kiszler, T., Klocke, D., Kluft, L., Koldunov, N., Kölling, T., Kolstela, J., Kornblueh, L., Kosukhin, S., Lacima-Nadolnik, A., Leal Rojas, J. J., Lehtiranta, J., Lunttila, T., Luoma, A., Manninen, P., Medvedev, A., Milinski, S., Mohammed, A., Müller, S., Naryanappa, D., Nazarova, N., Niemelä, S., Niraula, B., Nortamo, H., Nummelin, A., Nurisso, M., Ortega, P., Paronuzzi, S., Pedruzo-Bagazgoitia, X., Pelletier, C., Peña, C., Polade, S., Pradhan, H. K., Quintanilla, R., Quintino, T., Rackow, T., Räisänen, J., Rajput, M. M., Redler, R., Reuter, B., Rocha Monteiro, N., Roura-Adserias, F., Ruppert, S., Sayed, S., Schnur, R., Sharma, T., Sidorenko, D., Sievi-Korte, O., Soret, A., Steger, C., Stevens, B., Streffing, J., Sunny, J., Tenorio, L., Thober, S., Tigerstedt, U., Tinto, O., Tonttila, J., Tuomenvirta, H., Tuppi, L., Van Thielen, G., Vitali, E., von Hardenberg, J., Wagner, I., Wedi, N., Wehner, J., Willner, S., Yepes-Arbós, X., Ziemen, F., and Zimmermann, J.: The Destination Earth digital twin for climate change adaptation, Geosci. Model Dev., 19, 2821–2848, https://doi.org/10.5194/gmd-19-2821-2026, 2026.
ECMWF: ECMWF Newsletter 176: IFS upgrade brings many improvements and unifies medium-range resolutions, https://www.ecmwf.int/en/newsletter/176/earth-system-science/ifs-upgrade-brings-many-improvements-and-unifies-medium (last access: 20 May 2026), 2023.
Faranda, D., Alvarez-Castro, M. C., Ginesta, M., Coppola, E., and Pons, F. M. E.: Heavy precipitations in October 2024 South-Eastern Spain DANA mostly strengthened by human-driven climate change, ClimaMeter, Institut Pierre Simon Laplace, CNRS, https://doi.org/10.5281/ZENODO.14052041, 2024.
Feser, F. and Shepherd, T. G.: The concept of spectrally nudged storylines for extreme event attribution, Commun. Earth Environ., 6, 677, https://doi.org/10.1038/s43247-025-02659-6, 2025.
Formayer, H. and Fritz, A.: Temperature dependency of hourly precipitation intensities – surface versus cloud layer temperature, Int. J. Climatol., 37, 1–10, https://doi.org/10.1002/joc.4678, 2017.
Fowler, H. J., Lenderink, G., Prein, A. F., Westra, S., Allan, R. P., Ban, N., Barbero, R., Berg, P., Blenkinsop, S., Do, H. X., Guerreiro, S., Haerter, J. O., Kendon, E. J., Lewis, E., Schaer, C., Sharma, A., Villarini, G., Wasko, C., and Zhang, X.: Anthropogenic intensification of short-duration rainfall extremes, Nat. Rev. Earth Environ., 2, 107–122, https://doi.org/10.1038/s43017-020-00128-6, 2021.
Ghosh, R., Cheedela, S. K., Wickramage, C., Wachsmann, F., Beyer, S., Aengenheyster, M., Becker, T., Rackow, T., Koldunov, N., Sidorenko, D., and Jung, T.: EERIE: Ocean Eddy-rich Kilometer-scale Climate Simulation with Integrated Forecasting System (IFS) - Finite volumE Sea Ice-Ocean Model (FESOM2.5): historical simulation (Version 1), World Data Center for Climate (WDCC) at DKRZ [data set], https://doi.org/10.26050/WDCC/EERIE_FESOM_HIST_V1, 2025.
Gimeno-Sotelo, L. and Gimeno, L.: Where does the link between atmospheric moisture transport and extreme precipitation matter?, Weather Clim. Extrem., 39, 100536, https://doi.org/10.1016/j.wace.2022.100536, 2023.
Giorgi, F.: Climate change hot-spots, Geophys. Res. Lett., 33, L08707, https://doi.org/10.1029/2006GL025734, 2006.
Grayson, K., Campos, D., Beyer, S., John, A., Versteeg, G., Kelbling, M., Chandrasekar, A., Thober, S., and Doblas-Reyes, F. J.: Reconstructing storm Gloria in a changing climate using physical storylines, npj Nat. Hazards, 3, 14, https://doi.org/10.1038/s44304-026-00174-y, 2026.
Guerreiro, S. B., Fowler, H. J., Barbero, R., Westra, S., Lenderink, G., Blenkinsop, S., Lewis, E., and Li, X.-F.: Detection of continental-scale intensification of hourly rainfall extremes, Nat. Clim. Change, 8, 803–807, https://doi.org/10.1038/s41558-018-0245-3, 2018.
Held, I. M. and Soden, B. J.: Robust responses of the hydrological cycle to global warming, J. Climate, 19, 5686–5699, https://doi.org/10.1175/JCLI3990.1, 2006.
Hoffmann, J., Bauer, P., Sandu, I., Wedi, N., Geenen, T., and Thiemert, D.: Destination Earth – A digital twin in support of climate services, Clim. Serv., 30, 100394, https://doi.org/10.1016/j.cliser.2023.100394, 2023.
Huang, B., Liu, C., Banzon, V., Freeman, E., Graham, G., Hankins, B., Smith, T., and Zhang, H.-M.: Improvements of the Daily Optimum Interpolation Sea Surface Temperature (DOISST) Version 2.1, J. Climate, 34, 2923–2939, https://doi.org/10.1175/JCLI-D-20-0166.1, 2021.
Huang, T., Fu, S., Li, X., Dong, Y., Zhang, Y., and Sun, J.: Synoptic background conditions and moisture transport for producing the extreme heavy rainfall event in Valencia in 2024, Atmospheric Ocean. Sci. Lett., 18, 100666, https://doi.org/10.1016/j.aosl.2025.100666, 2025.
Insua-Costa, D., Miguez-Macho, G., and Llasat, M. C.: Local and remote moisture sources for extreme precipitation: a study of the two catastrophic 1982 western Mediterranean episodes, Hydrol. Earth Syst. Sci., 23, 3885–3900, https://doi.org/10.5194/hess-23-3885-2019, 2019.
IPCC: Climate Change 2021 – The Physical Science Basis: Working Group I Contribution to the Sixth Assessment Report of the Intergovernmental Panel on Climate Change, 1st edn., Cambridge University Press, https://doi.org/10.1017/9781009157896, 2023.
John, A., Beyer, S., Athanase, M., Sánchez-Benítez, A., Goessling, H. F., Hossain, A., Aguridan, R., Andrés-Martínez, M., Gaya-Àvila, A., Cheedela, S. K., Geier, P., Ghosh, R., Hadade, I., Koldunov, N., Milinski, S., Nurisso, M., Pedruzo-Bagazgoitia, X., Rackow, T., Sandu, I., Sidorenko, D., Streffing, J., Vitali, E., and Jung, T.: Global Kilometer-Scale Climate Storylines Using Spectral Nudging, J. Adv. Model. Earth Sy., 18, e2025MS005326, https://doi.org/10.1029/2025MS005326, 2026.
Lenderink, G., Barbero, R., Loriaux, J. M., and Fowler, H. J.: Super-Clausius–Clapeyron Scaling of Extreme Hourly Convective Precipitation and Its Relation to Large-Scale Atmospheric Conditions, J. Climate, 30, 6037–6052, https://doi.org/10.1175/JCLI-D-16-0808.1, 2017.
Lionello, P. and Scarascia, L.: The relation of climate extremes with global warming in the Mediterranean region and its north versus south contrast, Reg. Environ. Change, 20, 31, https://doi.org/10.1007/s10113-020-01610-z, 2020.
Llasat, M. C.: Spain's flash floods reveal a desperate need for improved mitigation efforts, Nature, 635, 787–787, https://doi.org/10.1038/d41586-024-03825-0, 2024.
Martin-Moreno, J. M., Garcia-Lopez, E., Guerrero-Fernandez, M., Alfonso-Sanchez, J. L., and Barach, P.: Devastating “DANA” Floods in Valencia: Insights on Resilience, Challenges, and Strategies Addressing Future Disasters, Public Health Rev., 46, 1608297, https://doi.org/10.3389/phrs.2025.1608297, 2025.
May, R. M., Goebbert, K. H., Thielen, J. E., Leeman, J. R., Camron, M. D., Bruick, Z., Bruning, E. C., Manser, R. P., Arms, S. C., and Marsh, P. T.: MetPy: A Meteorological Python Library for Data Analysis and Visualization, B. Am. Meteorol. Soc., 103, E2273–E2284, https://doi.org/10.1175/BAMS-D-21-0125.1, 2022.
Molnar, P., Fatichi, S., Gaál, L., Szolgay, J., and Burlando, P.: Storm type effects on super Clausius–Clapeyron scaling of intense rainstorm properties with air temperature, Hydrol. Earth Syst. Sci., 19, 1753–1766, https://doi.org/10.5194/hess-19-1753-2015, 2015.
Muñoz, C. and Schultz, D. M.: Cutoff Lows, Moisture Plumes, and Their Influence on Extreme-Precipitation Days in Central Chile, J. Appl. Meteorol. Clim., 60, 437–454, https://doi.org/10.1175/JAMC-D-20-0135.1, 2021.
Nieto Ferreira, R.: Cut-Off Lows and Extreme Precipitation in Eastern Spain: Current and Future Climate, Atmosphere, 12, 835, https://doi.org/10.3390/atmos12070835, 2021.
Noy, I., Stone, D., and Uher, T.: Extreme events impact attribution: A state of the art, Cell Rep. Sustain., 1, 100101, https://doi.org/10.1016/j.crsus.2024.100101, 2024.
O'Gorman, P. A. and Muller, C. J.: How closely do changes in surface and column water vapor follow Clausius–Clapeyron scaling in climate change simulations?, Environ. Res. Lett., 5, 025207, https://doi.org/10.1088/1748-9326/5/2/025207, 2010.
Oldham-Dorrington, J. and Messori, G.: Dynamically-Informed Extreme Event Attribution Using Circulation Imprints, Geophys. Res. Lett., 53, e2025GL116869, https://doi.org/10.1029/2025GL116869, 2026.
Olmo, M. E., Cos, P., Campos, D., Muñoz, A. G., Altava-Ortiz, V., Barrera-Escoda, A., Jury, M., Loosveldt-Tomas, S., Bretonniere, P. A., Doblas-Reyes, F., and Soret, A.: Filtering CMIP6 models in the Euro-Mediterranean based on a circulation patterns approach, Weather Clim. Extrem., 48, 100765, https://doi.org/10.1016/j.wace.2025.100765, 2025.
Porcù, F., Carrassi, A., Medaglia, C. M., Prodi, F., and Mugnai, A.: A study on cut-off low vertical structure and precipitation in the Mediterranean region, Meteorol. Atmospheric Phys., 96, 121–140, https://doi.org/10.1007/s00703-006-0224-5, 2007.
Prein, A. F., Rasmussen, R. M., Ikeda, K., Liu, C., Clark, M. P., and Holland, G. J.: The future intensification of hourly precipitation extremes, Nat. Clim. Change, 7, 48–52, https://doi.org/10.1038/nclimate3168, 2017.
Rackow, T., Pedruzo-Bagazgoitia, X., Becker, T., Milinski, S., Sandu, I., Aguridan, R., Bechtold, P., Beyer, S., Bidlot, J., Boussetta, S., Deconinck, W., Diamantakis, M., Dueben, P., Dutra, E., Forbes, R., Ghosh, R., Goessling, H. F., Hadade, I., Hegewald, J., Jung, T., Keeley, S., Kluft, L., Koldunov, N., Koldunov, A., Kölling, T., Kousal, J., Kühnlein, C., Maciel, P., Mogensen, K., Quintino, T., Polichtchouk, I., Reuter, B., Sármány, D., Scholz, P., Sidorenko, D., Streffing, J., Sützl, B., Takasuka, D., Tietsche, S., Valentini, M., Vannière, B., Wedi, N., Zampieri, L., and Ziemen, F.: Multi-year simulations at kilometre scale with the Integrated Forecasting System coupled to FESOM2.5 and NEMOv3.4, Geosci. Model Dev., 18, 33–69, https://doi.org/10.5194/gmd-18-33-2025, 2025.
Ribes, A., Thao, S., Vautard, R., Dubuisson, B., Somot, S., Colin, J., Planton, S., and Soubeyroux, J.-M.: Observed increase in extreme daily rainfall in the French Mediterranean, Clim. Dynam., 52, 1095–1114, https://doi.org/10.1007/s00382-018-4179-2, 2019.
Sánchez-Benítez, A., Goessling, H., Pithan, F., Semmler, T., and Jung, T.: The July 2019 European Heat Wave in a Warmer Climate: Storyline Scenarios with a Coupled Model Using Spectral Nudging, J. Climate, 35, 2373–2390, https://doi.org/10.1175/JCLI-D-21-0573.1, 2022.
Santer, B. D., Solomon, S., Pallotta, G., Mears, C., Po-Chedley, S., Fu, Q., Wentz, F., Zou, C.-Z., Painter, J., Cvijanovic, I., and Bonfils, C.: Comparing Tropospheric Warming in Climate Models and Satellite Data, J. Clima, 30, 373–392, https://doi.org/10.1175/JCLI-D-16-0333.1, 2017.
Saurral, R. I., Doblas-Reyes, F. J., Screen, J. A., Catto, J. L., Hay, S., and Yu, H.: Western Mediterranean Droughts Fostered by Arctic Sea Ice Loss, J. Climate, 38, 3005–3014, https://doi.org/10.1175/JCLI-D-25-0066.1, 2025.
Saurral, R. I., Campos, D. A., Grayson, K., Lapin, V., Trascasa-Castro, P., Tourigny, E., Donat, M. G., Materia, S., Ferrer, E., and Doblas-Reyes, F. J.: The key role of Mediterranean and North Atlantic sea surface temperatures on the 2024 record-breaking Valencia precipitation event, Weather Clim. Extrem., 52, 100877, https://doi.org/10.1016/j.wace.2026.100877, 2026.
Schneider, T., O'Gorman, P. A., and Levine, X. J.: Water Vapor and the Dynamics of Climate Changes, Rev. Geophys., 48, RG3001, https://doi.org/10.1029/2009RG000302, 2010.
Scholz, P., Sidorenko, D., Gurses, O., Danilov, S., Koldunov, N., Wang, Q., Sein, D., Smolentseva, M., Rakowsky, N., and Jung, T.: Assessment of the Finite-volumE Sea ice-Ocean Model (FESOM2.0) – Part 1: Description of selected key model elements and comparison to its predecessor version, Geosci. Model Dev., 12, 4875–4899, https://doi.org/10.5194/gmd-12-4875-2019, 2019.
Shepherd, T. G., Boyd, E., Calel, R. A., Chapman, S. C., Dessai, S., Dima-West, I. M., Fowler, H. J., James, R., Maraun, D., Martius, O., Senior, C. A., Sobel, A. H., Stainforth, D. A., Tett, S. F. B., Trenberth, K. E., Van Den Hurk, B. J. J. M., Watkins, N. W., Wilby, R. L., and Zenghelis, D. A.: Storylines: an alternative approach to representing uncertainty in physical aspects of climate change, Climatic Change, 151, 555–571, https://doi.org/10.1007/s10584-018-2317-9, 2018.
Singleton, A. and Toumi, R.: Super-Clausius–Clapeyron scaling of rainfall in a model squall line, Q. J. Roy. Meteor. Soc., 139, 334–339, https://doi.org/10.1002/qj.1919, 2013.
Stein, A. F., Draxler, R. R., Rolph, G. D., Stunder, B. J. B., Cohen, M. D., and Ngan, F.: NOAA's HYSPLIT Atmospheric Transport and Dispersion Modeling System, B. Am. Meteorol. Soc., 96, 2059–2077, https://doi.org/10.1175/BAMS-D-14-00110.1, 2015.
Thompson, V., Ermis, S., and Athanase, M.: The need for multi-method extreme event attribution, Weather, 81, 40–45, https://doi.org/10.1002/wea.7779, 2025.
Tramblay, Y. and Somot, S.: Future evolution of extreme precipitation in the Mediterranean, Climatic Change, 151, 289–302, https://doi.org/10.1007/s10584-018-2300-5, 2018.
Tsuji, H. and Takayabu, Y. N.: Precipitation Enhancement via the Interplay between Atmospheric Rivers and Cutoff Lows, Mon. Weather Rev., 147, 2451–2466, https://doi.org/10.1175/MWR-D-18-0358.1, 2019.
Tuel, A. and Eltahir, E. A. B.: Why Is the Mediterranean a Climate Change Hot Spot?, J. Climate, 33, https://doi.org/10.1175/JCLI-D-19-0910.1, 2020.
Valenzuela, R., Garreaud, R., Vergara, I., Campos, D., Viale, M., and Rondanelli, R.: An extraordinary dry season precipitation event in the subtropical Andes: Drivers, impacts and predictability, Weather Clim. Extrem., 37, 100472, https://doi.org/10.1016/j.wace.2022.100472, 2022.
van Garderen, L. and León-FonFay, D.: The essential role of conditional attribution in understanding complex extreme weather, Nat. Commun., 17, 1539, https://doi.org/10.1038/s41467-026-69056-1, 2026.
van Garderen, L., Feser, F., and Shepherd, T. G.: A methodology for attributing the role of climate change in extreme events: a global spectrally nudged storyline, Nat. Hazards Earth Syst. Sci., 21, 171–186, https://doi.org/10.5194/nhess-21-171-2021, 2021.
Vertegaal, D. M., van den Hurk, B. J. J. M., Couasnon, A., Aleksandrova, N., Bovenschen, T., Gradiyanto, F., Leijnse, T. W. B., Goulart, H. M. D., and Muis, S.: Climate and impact attribution of compound flooding induced by tropical cyclone Idai in Mozambique, Nat. Hazards Earth Syst. Sci., 26, 1417–1433, https://doi.org/10.5194/nhess-26-1417-2026, 2026.
Wedi, N., Bauer, P., Sandu, I., Hoffmann, J., Sheridan, S., Cereceda, R., Quintino, T., Thiemert, D., and Geenen, T.: Destination Earth: High-Performance Computing for Weather and Climate, Comput. Sci. Eng., 24, 29–37, https://doi.org/10.1109/MCSE.2023.3260519, 2022.
WWA: Extreme downpours increasing in southeastern Spain as fossil fuel emissions heat the climate, https://www.worldweatherattribution.org/extreme-downpours- increasing-in-southern-spain-as-fossil-fuel-emissions-heat-the-climate/ (last access: 20 May 2026), 2024.
Zhang, G. J.: A Further Study on Estimating Surface Evaporation Using Monthly Mean Data: Comparison of Bulk Formulations, J. Climate, 10, 1592–1600, https://doi.org/10.1175/1520-0442(1997)010<1592:AFSOES>2.0.CO;2, 1997.
Zhang, X., Alexander, L., Hegerl, G. C., Jones, P., Tank, A. K., Peterson, T. C., Trewin, B., and Zwiers, F. W.: Indices for monitoring changes in extremes based on daily temperature and precipitation data, WIREs Clim. Change, 2, 851–870, https://doi.org/10.1002/wcc.147, 2011.
Zittis, G., Bruggeman, A., and Lelieveld, J.: Revisiting future extreme precipitation trends in the Mediterranean, Weather Clim. Extrem., 34, 100380, https://doi.org/10.1016/j.wace.2021.100380, 2021.