
the Creative Commons Attribution 4.0 License.
the Creative Commons Attribution 4.0 License.
 | 19 Aug 2026
Synoptic drivers of the August 2024 record-breaking rainfall in the Chadian Sahara: dynamics, thermodynamics, and socio-economic consequences
Claudin Wamba Tchinda
Fréderic Saha
Alain Tchio Tamoffo
This study examines the synoptic atmospheric mechanisms behind the extreme rainfall event of August 2024 in northern Chad and their devastating socio-economic impacts. Based on the CHIRPS, TAMSAT, and ERA5 datasets (1983–2024), Theil-Sen and Mann-Kendall analyses reveal significant increases, over several decades, in precipitation and integrated water vapor transport. Crucially, a transition phase in the early 2000s shifted the regional baseline from persistent late-20th-century deficits into a moister “new normal,” thereby culminating in the record-breaking August 2024 anomaly.
During this month, unprecedented accumulations reached 100–400 mm over the Tibesti, Borkou, and Ennedi massifs, representing parametric return periods of 124.5 years in CHIRPS and 451.4 years in TAMSAT, with standardized anomalies exceeding +8σ (locally > +12σ). Our analysis of lower-tropospheric convergence, specific humidity, vertical velocity (ω), and moist static energy (MSE) reveals a major shift from the typical West African monsoon regime, validated via a 1000-iteration grid-point Monte Carlo permutation test (p ≤ 0.05). In August 2024, the Intertropical Front (ITF) defined by the 15 °C dew point isodrosotherm at 925 hPa shifted abnormally northward, reaching 20–22° N, which allowed moist air to penetrate deep into the Saharan zone. This shift was driven by strengthened convergence at 850 hPa, anomalous cyclonic vorticity, and a significant increase in low-level humidity, where specific humidity and Total Column Water Vapor (TCWV) reached their absolute historical records (97.67th empirical percentile). Furthermore, negative ω anomalies throughout the troposphere indicate a northward extension of the monsoon's upward branch. Strong positive MSE anomalies and equivalent potential temperature exceeding the 2σ statistical threshold over desert regions further highlight a thermodynamic enrichment of the atmospheric column. Together, these signals point to a highly effective dynamic-thermodynamic coupling that fueled intense convective systems. The synchronization between these atmospheric conditions and the synoptic forcing of African Easterly Waves (AEWs) between 10 and 14 August generated extreme local rainfall anomalies, redefining the hydrological balance between aquifer recharge and increased risks of flash flooding.
This hydroclimatic shift caused devastating impacts: nationwide, floods affected 2 million people and caused 576 fatalities. Regionally, impacts were severe and heterogeneous, affecting 67 613 individuals in Borkou with 23 174 houses destroyed, and claiming 60 lives in Tibesti. Beyond livestock, crop, and gold-mining infrastructure losses, the floods unearthed thousands of conflict-era landmines, creating a grave secondary hazard. These findings underscore hyper-arid zones' vulnerability to extreme hydrological events, highlighting the urgent need to transition from reactive disaster relief to proactive climate adaptation.
- Article
(7532 KB) - Full-text XML
- BibTeX
- EndNote


Extreme precipitation episodes constitute one of the most critical manifestations of contemporary climate variability, posing a growing challenge to the resilience of human societies (Seneviratne et al., 2021). Their impact is particularly devastating in arid and semi-arid regions, where structural water scarcity renders natural and socio-economic systems extremely vulnerable to hydrometeorological anomalies (Saha et al., 2020). Under global warming, the intensification of hydrological cycle has led to a documented increase in the frequency and magnitude of these events, often exceeding local adaptive capacities (Allan and Soden, 2008; Trenberth et al., 2015; Ehtasham et al., 2024; Adeyeri, 2025). Specifically, surpassing critical warming thresholds could increase intense precipitation in Central Africa by up to 25 %, exacerbating flooding risks and population exposure (Zakariahou et al., 2024; Tamoffo et al., 2024a). This vulnerability is especially concerning for the Lake Chad Basin, where projections indicate a resurgence of rainfall extremes alongside an extension of dry spells (Adeyeri et al., 2019).
The Sahara and its southern margins operate under a climatic regime traditionally governed by tropospheric subsidence and erratic rainfall. In this environment, intense rain events arise from exceptional atmospheric configurations linked to the dynamics of the Saharan Heat Low (SHL) and regional moisture convergence (Selami et al., 2021). This dynamics is part of the rainfall recovery observed since the end of the 20th century, driven by oceanic warming and a strengthened monsoon moisture budget (Sindikubwabo et al., 2018; Biasutti, 2019; Tamoffo et al., 2026a). However, paleoclimatic records serve as a reminder that this system is prone to non-linear and abrupt responses; the history of “Lake Mega-Chad” demonstrates that transitions between aridity and “African Humid Periods” can be sudden (Simon et al., 2015; Pausata et al., 2017; Pausata et al., 2020).
Northern Chad, a confluence point between the central Sahara and the Sahel, represents a highly sensitive climatic transition zone where the balance between water resources and agro-pastoral activities is precarious (Raimond et al., 2014; Nour et al., 2017). Rainfall distribution is strictly governed by the latitudinal position of the Intertropical Front (ITF), the surface expression of the Intertropical Convergence Zone (ITCZ) marking the boundary between the dry harmattan and the moist monsoon (Nicholson, 2013). An anomalous northward migration of the ITF allows for the injection of Atlantic moisture into the heart of the Sahara, triggering deep convection (Sultan and Janicot, 2003; Parker et al., 2005). This dynamics is further modulated by intra-seasonal oscillations (ISO), which influence water vapor transport and moist static energy (MSE) fluxes (Siwe et al., 2025; Wamba Tchinda et al., 2023; Tchinda et al., 2026; Tamoffo et al., 2024b) and is often exacerbated by synoptic perturbations, such as African Easterly Waves (AEW) (Kiladis et al., 2006; Lafore et al., 2017).
Beyond dynamics, thermodynamic and radiative factors are decisive. MSE offers a diagnostic framework integrating temperature, humidity, and the vertical structure of the atmosphere (Neelin and Held, 1987; Holloway and Neelin, 2009). High MSE values indicate a warmer and moister boundary layer, which directly enhances the convective available potential energy while simultaneously reducing convective inhibition, facilitating the organization of mesoscale convective systems responsible for extreme accumulations (Romps, 2015). Recent studies demonstrate that these events result from a synergy between thermodynamic instability, radiative flux anomalies, and dynamic forcings such as moist enthalpy advection and potential vorticity anomalies (Kenfack et al., 2024, 2025; Tchana et al., 2025). Simultaneously, vertical velocity characterizes the strength of updraft, where negative ω anomalies represent the classic signature of organized convection in West Africa (Taylor et al., 2017).
At the global scale, 2024 was characterized by unprecedented warming and a surge in hydrometeorological extremes (Zhang et al., 2025). In August 2024, exceptionally intense rainfall hit the Saharan regions of Chad and the Lake Chad Basin, leading to catastrophic socio-economic impacts, including unusual flooding, infrastructure collapse, agricultural losses, and widespread population displacement (OCHA, 2024). This crisis highlighted the acute vulnerability of local socio-ecosystems, which are historically adapted to a hyper-arid regime with low mean annual rainfall. In such environments, even a minor absolute increase in precipitation represents a severe hydrometeorological hazard, triggering disproportionate societal disruptions due to the lack of infrastructure designed for torrential rain. While the 2024 anomaly aligns with a broader Sahelian trend associated with an anomalously northward ITCZ (Zhang et al., 2025; Nicholson, 2013), the specific atmospheric mechanisms driving rainfall in the true Saharan desert remain insufficiently documented. Most existing literature focuses on the Sahelian and Sudanian belts, leaving a gap in our understanding of the joint dynamic and thermodynamic processes and their socio-economic consequences within the hyper-arid Sahara and the Lake Chad Basin.
This study aims to fill this gap by characterizing the forcings behind the August 2024 extreme event through an integrated analysis of moisture convergence, remote moisture advection, vertical velocity, and MSE. By linking these physical mechanisms to field observations of socio-economic impacts, this work provides critical insights for climate adaptation and risk management in the Sahara and Lake Chad Basin (Biasutti, 2019; Vizy and Cook, 2022). The article is structured as follows: Sect. 2 details the study area, data and methodology; Sect. 3.1 characterizes the extreme rainfall event and its spatial-temporal evolution, while the rest of Sect. 3 explores the underlying dynamic and thermodynamic physical mechanisms; Sect. 4 details the associated socio-economic impacts and local vulnerabilities; and Sect. 5 concludes the study.
2.1 Study Area
This study focuses on northern Chad, extending 16–24° N, 13–25° E, an area administratively comprising the regions of Tibesti, Borkou, Ennedi West, and Ennedi East (Fig. 1). The landscape is dominated by vast sandy plains and longitudinal dune systems. The regional climate is hyper-arid, characterized by high diurnal and seasonal thermal ranges and a mean annual precipitation below 50 mm (UNESCO, 1977; Nicholson, 2011). Despite its harsh environment, the Saharan sector of Chad accounts for approximately 13 % of the national population (approx. 2.73 million inhabitants; INSEED-Chad). Economic subsistence is primarily linked to oasis-based agriculture, specifically date palm cultivation, and nomadic pastoralism centered on camel herding. The primary urban centers include Faya-Largeau (pop. 100 000), Fada (pop. 50 000), Bardaï (pop. 30 000) and Amdjarass (pop. 2000). These cities, like all inhabited localities, are established in oases to take advantage of the meager water resources available, given the hyper-arid environment.
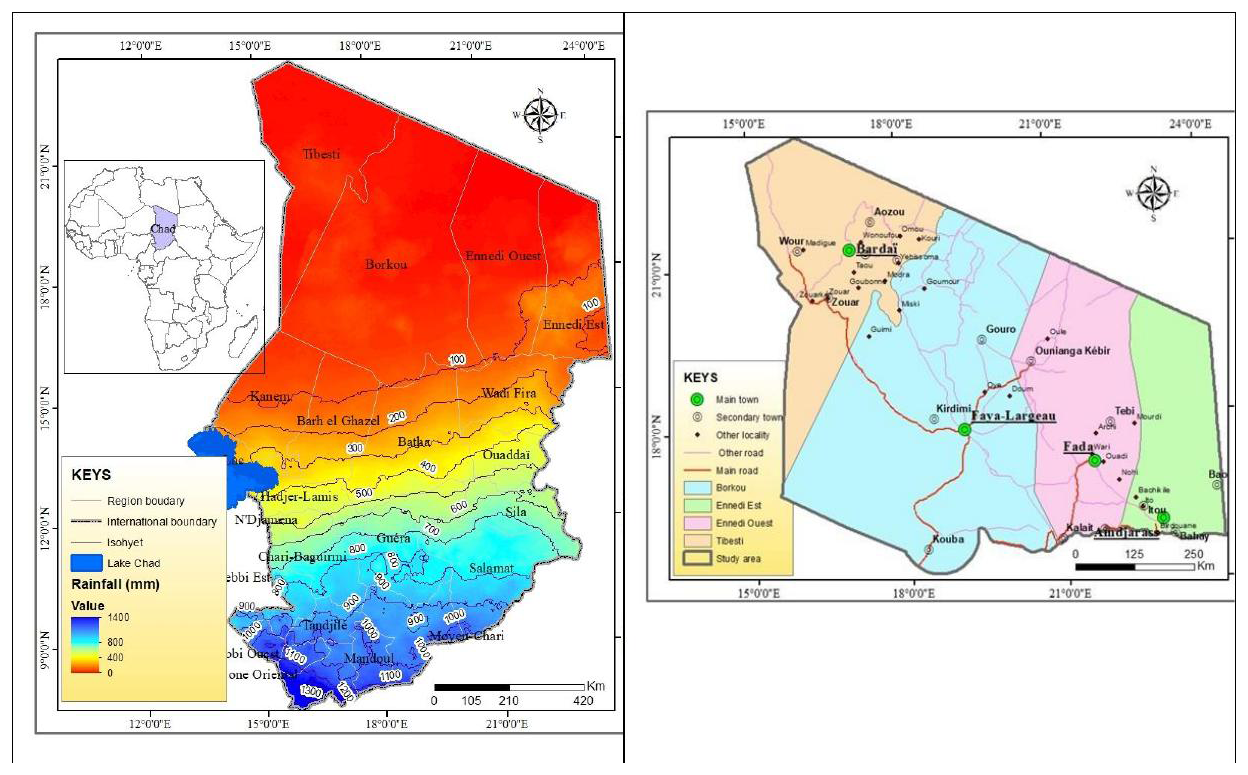
Figure 1Study area in Chad. The left panel shows that this predominantly desert area is bordered to the south by the 100 mm isohyet. The right panel presents the four administrative provinces whose socioeconomic losses from the August 2024 floods were analyzed. It is worth noting that despite the desert environment, numerous settlements are located there, generally in oases.
2.2 Data sources
2.2.1 Satellite Precipitation Estimates
To analyze the long-term interannual variability, monotonic trends, and the specific magnitude of the August 2024 rainfall event, monthly precipitation datasets spanning the 1983–2024 period were gathered from two distinct high-resolution satellite-based products: the Tropical Applications of Meteorology using SATellite Data v.3.1 (TAMSAT; Maidment et al., 2017) and the Climate Hazards Group InfraRed Precipitation with Station data v.2.0 (CHIRPS; Funk et al., 2015).
A critical constraint in the hyper-arid Borkou-Ennedi-Tibesti (BET) region of northern Chad is the severe scarcity or total absence of operational, continuous in-situ rain gauges. Consequently, hydro-climatic monitoring relies exclusively on satellite remote sensing. CHIRPS blends global satellite infrared imagery (0.05° × 0.05° resolution) with available station observations to generate long-term gridded time series, which is highly effective for drought and trend monitoring (Funk et al., 2015). The dataset was accessed from the Climate Hazards Group (https://www.chc.ucsb.edu/data, last access: 31 January 2026). Concurrently, TAMSAT estimations are derived from Meteosat Thermal Infrared (TIR) imagery, using a Cold Cloud Duration (CCD) threshold approach calibrated against regional ground-based gauges (Maidment et al., 2017). TAMSAT features a high spatial resolution of 0.0375° (∼ 4 km), which is optimized for capturing convective rainfall distributions across complex Saharan topography (Wainwright et al., 2021). Relying on both products is necessary to address structural uncertainties inherent to satellite retrieval algorithms over hyper-arid terrains where direct gauge validation is unavailable.
2.2.2 Atmospheric Reanalysis (ERA5)
Atmospheric dynamics, vertical coupling, and moisture transport patterns were analyzed using the ERA5 reanalysis, the fifth-generation global atmospheric climate dataset developed by the European Centre for Medium-Range Weather Forecasts (ECMWF) (Hersbach et al., 2020). ERA5 employs a multi-decadal advanced data assimilation scheme, ensuring a physically consistent co-dependence between dynamic and thermodynamic variables across data-sparse regions such as the Sahara desert (Tarek et al., 2020; Ssenyunzi et al., 2020). Previous climate assessments have confirmed that ERA5 accurately reproduces monsoon circulation, moisture influxes, and synoptic-scale waves over the Sahelian and Saharan belts (Johannsen et al., 2019; Cook and Vizy, 2021).
For this study, data were extracted at a horizontal resolution of 0.25° × 0.25° on standard pressure levels spanning from the lower troposphere to the upper troposphere (850 hPa to 200 hPa). The monthly variables retrieved include the horizontal components of wind (u, v), vertical velocity (ω), horizontal wind divergence (d), geopotential height (z), temperature (T), and specific humidity (q). The analysis focuses on the month of August from 1983 to 2024. While the total 42-year period is utilized for interannual trend estimations, the 1983–2023 window (N = 41 years) is strictly designated as the standard climatological baseline mean from which the exceptional structural anomalies of August 2024 are evaluated.
2.2.3 Data on flood losses
Due to Chad's fragile socioeconomic and security context, systematic disaster recording is primarily facilitated by international humanitarian organizations and United Nations agencies in collaboration with the Chadian government. For the 2024 flood event, impact data were obtained from the United Nations Office for the Coordination of Humanitarian Affairs (OCHA), which synthesizes inter-agency field reports. These data are validated by the Ministry of Territorial Administration and Decentralization, alongside the Ministry of Social Action, Solidarity, and Humanitarian Affairs.
The dataset includes standardized metrics on:
-
Human casualties (mortality and injury rates);
-
Displaced populations and affected households;
-
Agricultural losses (hectares of devastated cropland);
-
Infrastructure damage (destruction of homes and commercial facilities);
-
Livestock mortality.
While national summaries typically emphasize the southern and central provinces due to their higher absolute population densities (e.g., Mayo-Kebbi Est, Lac, and Tandjilé), this study specifically isolates data for the northern Saharan provinces. Although the absolute number of victims in these arid regions is lower compared to the south, the relative impact, defined as the ratio of affected individuals to the total provincial population, is among the highest recorded in 2024. This relative approach is essential for assessing the exceptional nature of climate extremes in sparsely populated hyper-arid zones. Data was accessed via the OCHA Chad humanitarian portal (https://www.unocha.org/chad, last access: 25 January 2026).
2.3 Methodological Framework and Statistical Metrics
To diagnose the physical mechanisms driving the exceptional rainfall of August 2024, a suite of diagnostic variables was employed. The methodological framework distinguishes between thermodynamic precursors (the energy and moisture required for convection) and dynamic forcing (the atmospheric mechanisms triggering vertical motion).
2.3.1 Climatological Anomalies and Spatial Significance
To highlight the physical anomalies driving the extreme event of August 2024, monthly climatological anomalies at each grid point were computed as the direct departure of the observed August 2024 values from the long-term historical mean, which was established over a strict 41-year reference baseline period spanning from 1983 to 2023.
To assess whether these spatial anomalies represent a statistically significant departure from the background noise or are merely a product of random internal climate variability, a non-parametric Monte Carlo permutation test was systematically applied to the anomaly fields. This approach is highly suitable for atmospheric dynamics over hyper-arid zones because it does not rely on parametric assumptions of normal probability distributions (Livezey and Chen, 1983). For each variable, the historical time series (1983–2024) was randomly shuffled 1000 times to empirically reconstruct a local null distribution of climatological anomalies at each grid point. The true observed August 2024 anomaly was then positioned within this empirical distribution. Anomalies falling outside the 2.5th and 97.5th percentiles of the permuted distribution (p ≤ 0.05, two-tailed test) were diagnosed as statistically significant at the 95 % confidence level. These structurally robust grid points are explicitly highlighted via stippling on the corresponding spatial maps.
2.3.2 Long-Term Trend Analysis
The long-term monotonic trajectories of regional precipitation and column-integrated moisture transport over the 42 years (1983–2024) were quantified using the non-parametric Theil-Sen estimator, while trend significance was evaluated using the Mann-Kendall test. The Sen's slope represents the median of all slopes calculated between all possible pairs of data points in the time series, ensuring structural immunity to extreme outliers such as the August 2024 anomaly itself (Sen, 1968). To contextualize the physical magnitude of these trends, the relative change (Δrel, expressed in %) was calculated by multiplying the Sen's slope by the total length of the time series (Δt=42 years), normalized by the long-term climatological mean () obtained from the 1983–2023 baseline
2.3.3 Extreme hydro-climatic quantified diagnostics
To quantify the exact recurrence interval and rarity of the August 2024 precipitation, a parametric framework was implemented. Because precipitation over Saharan environments is highly intermittent, strictly non-negative, and positively skewed, standard Gaussian frameworks are physically invalid. Instead, a continuous two-parameter Gamma probability density function (f(x)) was fitted to the multi-decadal historical August series:
Where α > 0 is the shape parameter, β > 0 is the scale parameter, and Γ(α) represents the standard Gamma function. These parameters were optimized via maximum likelihood estimation (MLE), providing asymptotically unbiased and numerically robust estimators for meteorological series (Husak et al., 2006). Once the cumulative distribution function (F(x)) was solved, the return period (Tr, in years) for the August 2024 rainfall magnitude (X2024) was derived as the inverse of its exceedance probability:
To evaluate the severity of the low-tropospheric moisture anomalies without assuming a parametric background distribution, the historical specific humidity and total column water vapor values were ranked against the 42-year record using the non-parametric Weibull plotting position formula:
where “m” represents the ascending rank of the observed value (with m=42 for the absolute historical maximum) and Ntotal=42 is the total number of years in the 1983–2024 series. The corresponding percentile rank is expressed as , allowing an objective determination of the rarity of the thermodynamic preconditioning. Following Makkonen (2006), this specific formulation represents the only mathematically consistent plotting rule for extreme value analysis, preventing the overestimation of return periods often induced by alternative empirical plotting positions and providing a realistic assessment of weather-related risks in hyper-arid environments.
2.4 Atmospheric Circulation and Thermodynamic Indicators
2.4.1 Intertropical Front (ITF) Position
The ITF serves as a critical diagnostic for monitoring the northward penetration of the West African Monsoon (WAM) into the Saharan heat low. In this study, the latitudinal position of the ITF is identified using the 15 °C isodrosotherm (dew point temperature Td=15 °C) at the 925 hPa level, following the criteria established by Nicholson (2013). This boundary marks the interface between the moist south-westerly monsoon flow and the dry north-easterly Harmattan winds.
2.4.2 Integrated Vapor Transport (IVT)
To capture the horizontal moisture streams fueling the convective anomalies over northern Chad, the time series of monthly mean interannual vertically Integrated Vapor Transport (IVT) magnitude was computed. Originally conceptualized to distinguish concentrated filamentary moisture fluxes from broader background fields (Zhu and Newell, 1998), the analysis of IVT magnitudes has become a robust standard for diagnosing synoptic-scale moisture transport and associated hydrometeorological extremes (Gimeno et al., 2014). The zonal (IVTu) and meridional (IVTv) mass-weighted components (kg m−1 s−1) were obtained by integrating the product of the specific humidity (q) and horizontal wind components (u, v) across the active tropospheric column (Ferreira et al., 2025):
where g is the standard gravitational acceleration (9.81 m s−2), q (kg kg−1), u and v (m s−1), and dp is the pressure increment (Pa). Vertical integration bounds were restricted from Psurf=1000 hPa to Ptop=200 hPa. This configuration captures the full structural depth of the monsoon circulation, including the coupled lower-tropospheric moisture surges preconditioned by the Saharan heat low, the horizontal shear zones along the African Easterly Jet (AEJ), and upper-level transitions near the Tropical Easterly Jet (TEJ) (Gimeno et al., 2016; Awoleye et al., 2025). The total IVT magnitude (IVTmag) was then derived as:
In the context of the African monsoon belt, evaluating IVTmag is critical as vertically coupled moisture fluxes exceeding specific synoptic thresholds have been directly linked to enhanced organized convection, intense spatially focused precipitation events, and regional aerosol scavenging dynamics (Awoleye et al., 2025).
2.4.3 Low-Tropospheric Convergence and Vertical Velocity
The dynamic mechanisms forcing local vertical ascent were diagnosed using two structural fields: low-tropospheric horizontal wind convergence and tropospheric vertical velocity (ω). Wind convergence (−∇V) was extracted directly at the 850 hPa level from the native ECMWF spectral model divergence archive (d) to prevent numerical truncation errors arising from post-processing finite-difference schemes. Concurrently, the vertical velocity (ω, expressed in Pa s−1) was examined across multiple pressure levels to assess the deep vertical coupling of the column. Negative values (ω<0) represent strong updrafts and synoptic-scale convective ascent (Taylor et al., 2017; Tchana et al., 2025).
2.4.4 Thermodynamic Columns and Convective Instability
To evaluate the thermodynamic structure and convective potential governing the anomalous August 2024 event, we analyze two complementary conserved thermodynamic tracers: Moist Static Energy (MSE) and equivalent potential temperature (θe). Moist Static Energy (MSE) is used to evaluate the convective potential and stability of the atmosphere (Neelin and Held, 1987; Kenfack et al., 2025). It integrates sensible heat, potential energy, and latent heat. It also quantifies the total energy content of an air parcel by integrating sensible heat, potential energy, and latent heat, and is defined as:
Where: Cp is the specific heat of dry air at constant pressure (1004 J kg−1 K−1); T is the absolute temperature (K), Lv is the latent heat of vaporization, z is the geopotential height (m). By examining MSE anomalies, we can establish if the August 2024 extremes were driven by an unusual amount of moisture (latent heat) or intense localised surface heating (sensible heat).
In parallel, the equivalent potential temperature θe (K), which dictates the absolute temperature a water-vapor-saturated air parcel would attain if all its moisture condensed pseudo-adiabatically, was calculated following Bolton (1980)'s formulation:
Where θ is the dry potential temperature and TL is the temperature at the lifted condensation level. In the tropical troposphere, MSE and Cpθe are tightly coupled and approximately linearly related (MSE≃Cpθe), as both conserve total energy during moist moist-adiabatic processes (Neelin and Held, 1987).
From a diagnostic standpoint, an increase in low-level MSE (and thus θe) operates via a critical dual thermodynamic mechanism: it enhances the thermal buoyancy of a lifted air parcel, thereby expanding the convective available potential energy aloft, while simultaneously eroding the convective inhibition barrier at the base of the atmospheric profile, facilitating spontaneous and deep convective triggering.
3.1 Multi-Decadal Rainfall Trends, IVT Evolution, and the Hydro-Climatic Transition
The interannual variation in August rainfall over the northern Chadian Sahara (16–24° N, 13–25° E) characterizes a hyper-arid hydro-climatic regime defined by extreme scarcity and inherent high interannual variability. Historically, monthly totals over this region hover around a very low climatological baseline, with a long-term mean of 12.7 mm for TAMSAT and 9.6 mm for CHIRPS. This hyper-arid dynamic is intrinsically governed by the Saharo-Sahelian transition zone, where precipitation depends strictly on the erratic northward excursions of the Intertropical Front (ITF) and the seasonal migration of the West African Monsoon (WAM) (Nicholson, 2013; Nicholson et al., 2018). An analysis of the 42-year time series (1983–2024), comparing the TAMSAT (Fig. 2a) and CHIRPS (Fig. 2b) satellite products reveal a remarkable structural consistency in capturing regional climate variability. Both independent datasets accurately identify historical dry cycles such as the severe drought years of 1984, 1990, and 2000, as well as past wet episodes like 1988, 1999, and the 2018–2020 corridor. Although a systematic magnitude offset exists between the two products due to their distinct retrieval algorithms, their long-term climate trajectories are perfectly synchronized.
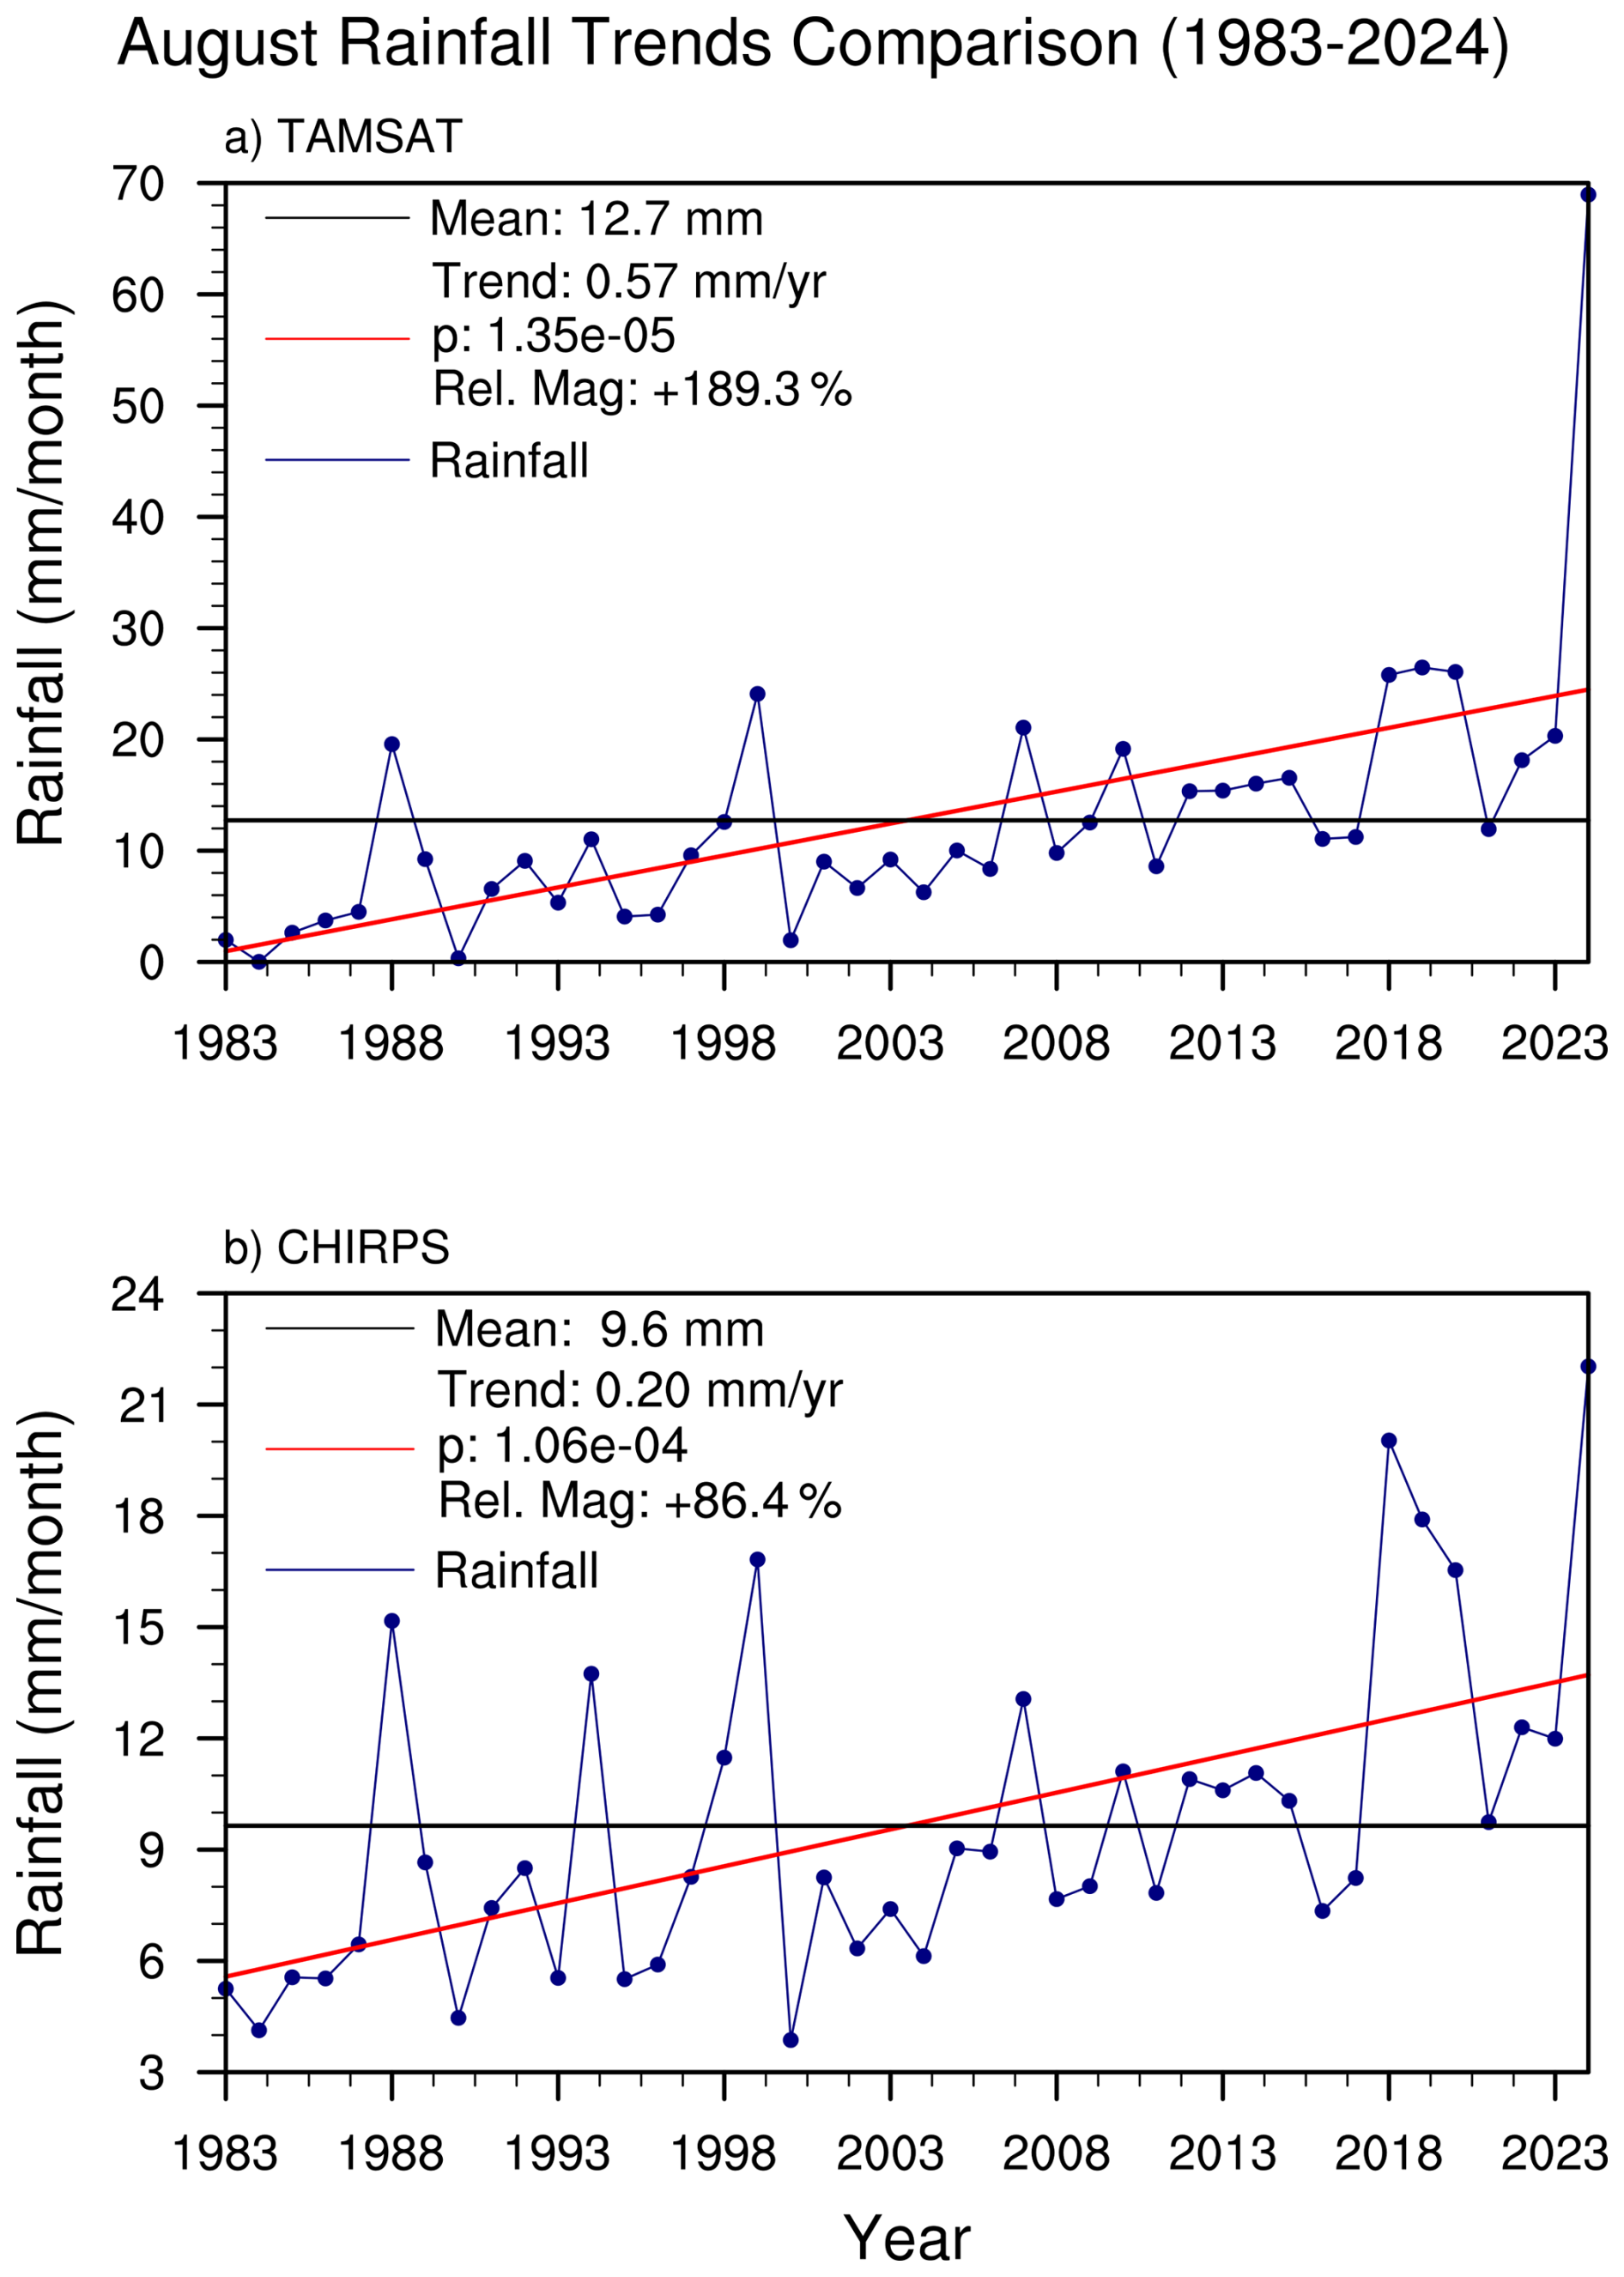
Figure 2August precipitation trends and patterns (solid blue line) averaged over Northern Chad (16–24° N, 13–25° E) from 1983 to 2024. Panels display (a) TAMSAT and (b) CHIRPS satellite series. The solid red line represents the monotonic linear Sen's slope; the solid black line marks the long-term climatological mean.
Both datasets exhibit a robust, continuous, and statistically significant monotonic upward trend over the entire 1983–2024 period, with exceptionally high confidence levels ( for TAMSAT and for CHIRPS). Rather than an abrupt structural regime shift or a statistical break in the trend line itself, the year 2003 marks a climatological transition period corresponding to the chronological midpoint. This year represents the exact chronological midpoint where the long-term linear Sen's slope intersects the historical baseline mean. Before 2003, the regional signal was heavily weighted by the extreme aridity and persistent rainfall deficits of the late 20th-century drought, with the vast majority of years falling well below the long-term average. After 2003, due to a sustained humidification trend, a profound transition occurred. The frequency of extreme dry years drops sharply, replaced by a dense clustering of positive anomalies and closely spaced rainfall peaks (notably post-2017), establishing a moister “new normal” background state over the Chadian Sahara.
This multi-decadal evolution is quantified by a positive Sen's slope of +0.44 mm yr−1 for TAMSAT and +0.17 mm yr−1 for CHIRPS, corresponding to substantial relative magnitudes of +145.1 % and +74.4 % over the 42-year record, respectively. This long-term wetting trend over Northern Chad aligns with the wider “greening” and hydrometeorological intensification signals documented across the central Sahel (Brandt et al., 2015).
To establish a clear physical connection between this long-term precipitation trend and large-scale atmospheric drivers, a multi-decadal time series of the Integrated Vapor Transport (IVT) during August was analyzed over the same domain (Fig. 3). As an integrated indicator of lower-tropospheric moisture supply and wind convergence, the IVT exhibits an exceptional, statistically significant co-variability with the satellite rainfall series.
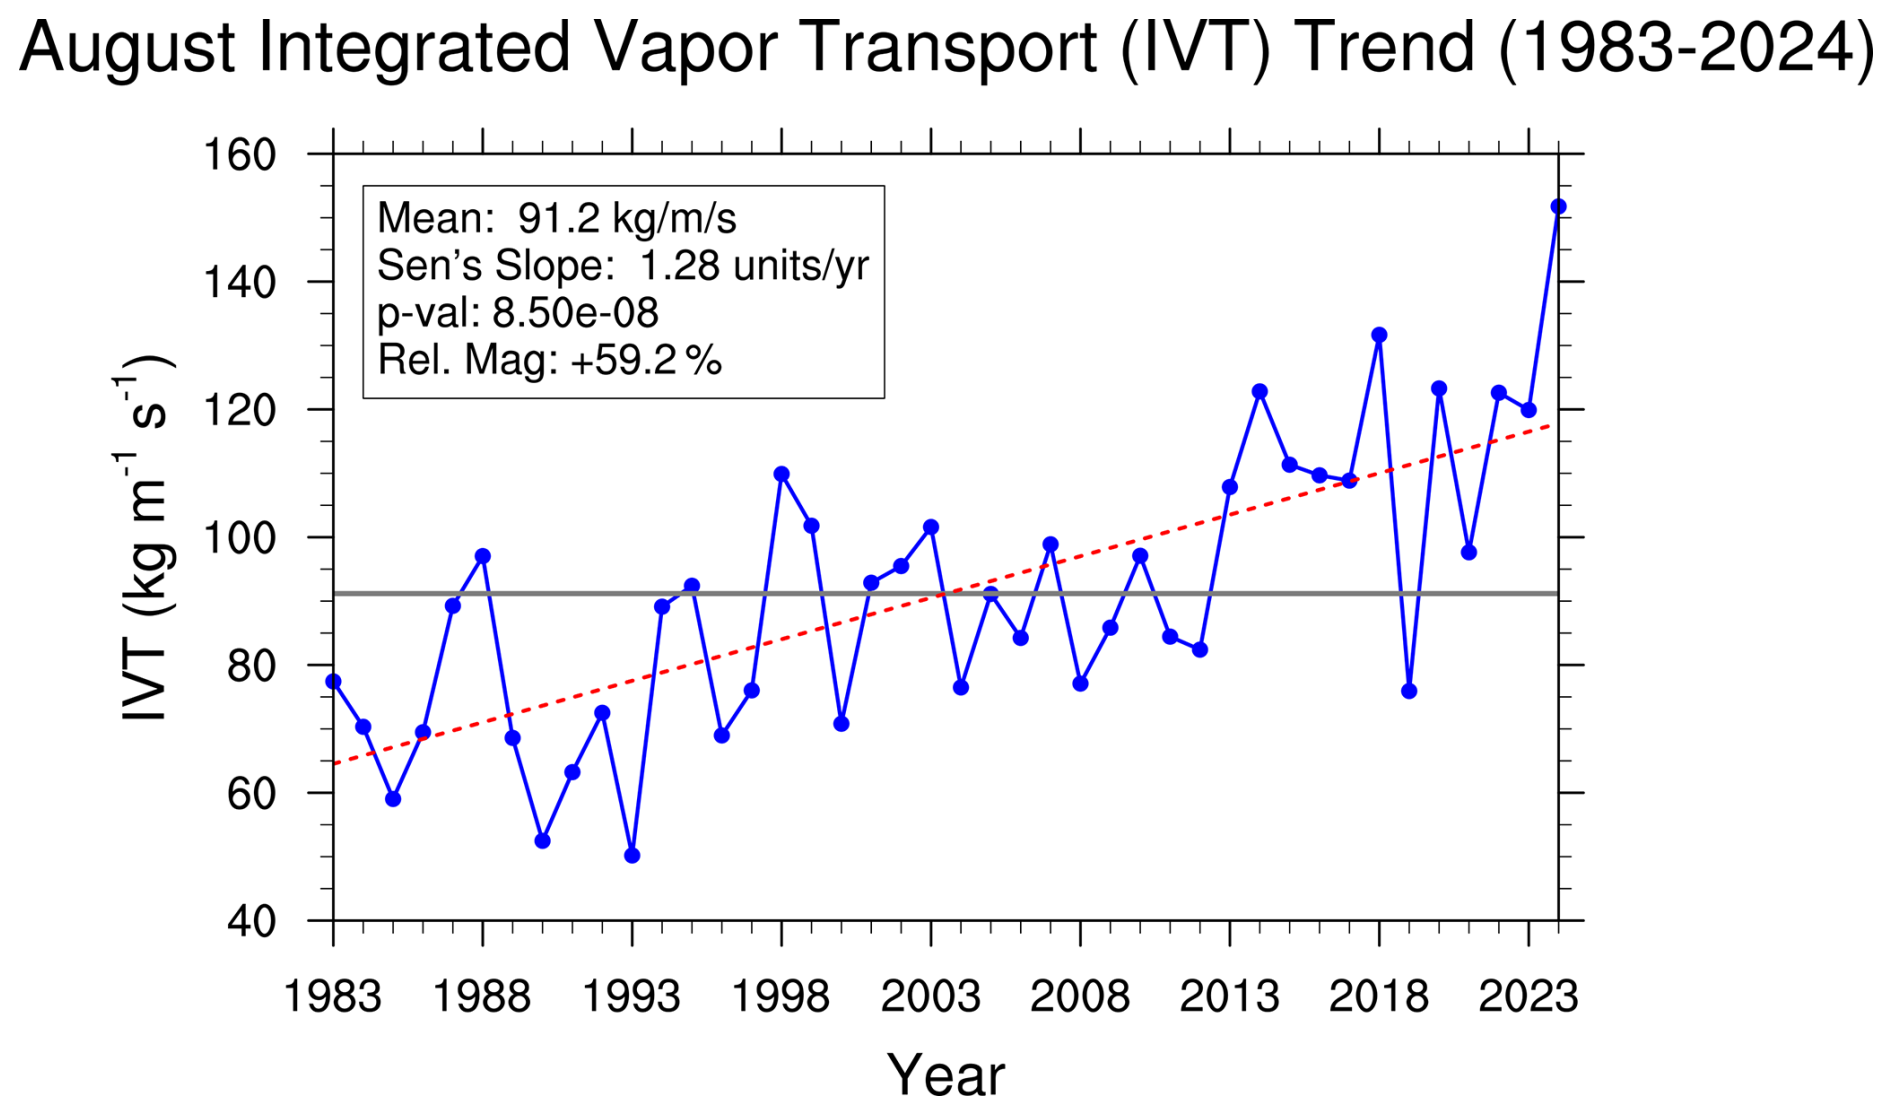
Figure 3Same as in Fig. 2, but for Integrated Vapor Transport (IVT, kg m−1 s−1). The dashed red line represents the Sen's slope; the solid black line marks the historical mean (91.2 kg m−1 s−1).
The IVT time series confirms a robust atmospheric moisture-loading trend, featuring a highly significant Sen's slope of +1.28 units yr−1 () and a relative magnitude increase of +59.2 %. More specifically, the IVT reproduces exactly the same physical behavior as the precipitation data:
-
Late 20th-century suppressed state: Persistent negative IVT anomalies dominate the 1980s and 1990s, indicating a severely restricted moisture supply to the region.
-
The early-2000s hydro-climatic transition: The IVT line permanently crosses its historical climatological mean (91.2 kg m−1 s−1) around 2003, transitioning the regional atmosphere into a consistently heightened moisture-loading baseline.
-
The 2024 Extreme Manifestation: The record-breaking event of August 2024 sits at the absolute tail end of this multi-decadal trend, where the IVT reaches an unprecedented historical peak exceeding 150 kg m−1 s−1.
The record-breaking precipitation anomaly of August 2024, which reached an unprecedented regional average of 69.71 mm per month in TAMSAT and 22.35 mm per month in CHIRPS, represents the absolute extreme manifestation of this long-term hydro-climatic transition. Rather than occurring as an isolated, random synoptic anomaly, the exceptional magnitude of the 2024 event was fundamentally favored by this altered, post-2003 moister background state. The long-term intensification of the atmospheric moisture transport background state effectively maximized the regional susceptibility to extreme monsoonal rainfall. This setup allowed contemporary dynamic and thermodynamic forces to trigger an unprecedented northward penetration of the WAM, shifting the regional risk paradigm from perpetual hyper-aridity to acute flash flood hazards.
This multi-decadal shift toward a structurally moister baseline suggests that the Chadian Sahara has transitioned into a hydroclimatic regime that is fundamentally more susceptible to intense convective forcing. Within this altered background state, the exceptional event of August 2024 does not emerge as an isolated, uncoupled anomaly but rather as the absolute tail-end expression of a long-term intensification in regional moisture loading. To fully understand how this large-scale climatological transition manifests on a local scale, it is necessary to move beyond domain-averaged time series and dissect the explicit spatial architecture, structural magnitude, and statistical return periods of the August 2024 anomalies across the hyper-arid core.
3.2 Magnitude and Statistical Significance of the August 2024 Rainfall Anomalies
In response to the long-term hydroclimatic transition and the regional-scale intensification of Integrated Vapor Transport (IVT), the August 2024 event manifested as a highly intense and spatially heterogeneous deployment, which had been masked until now by domain-averaged metrics. Examining fine-scale spatial structures thus becomes essential to map how this historical anomaly is distributed across the core hyper-arid northern sector of Chad. To evaluate this spatial architecture and the exceptional severity of the August 2024 rainfall within this hyper-arid zone, we examine the distribution of monthly accumulated precipitation alongside probabilistic Z-scores. Figure 4 illustrates the monthly accumulated rainfall and corresponding standardized anomalies over northern Chad, compared against the 41-year historical baseline climatology (1983–2023).
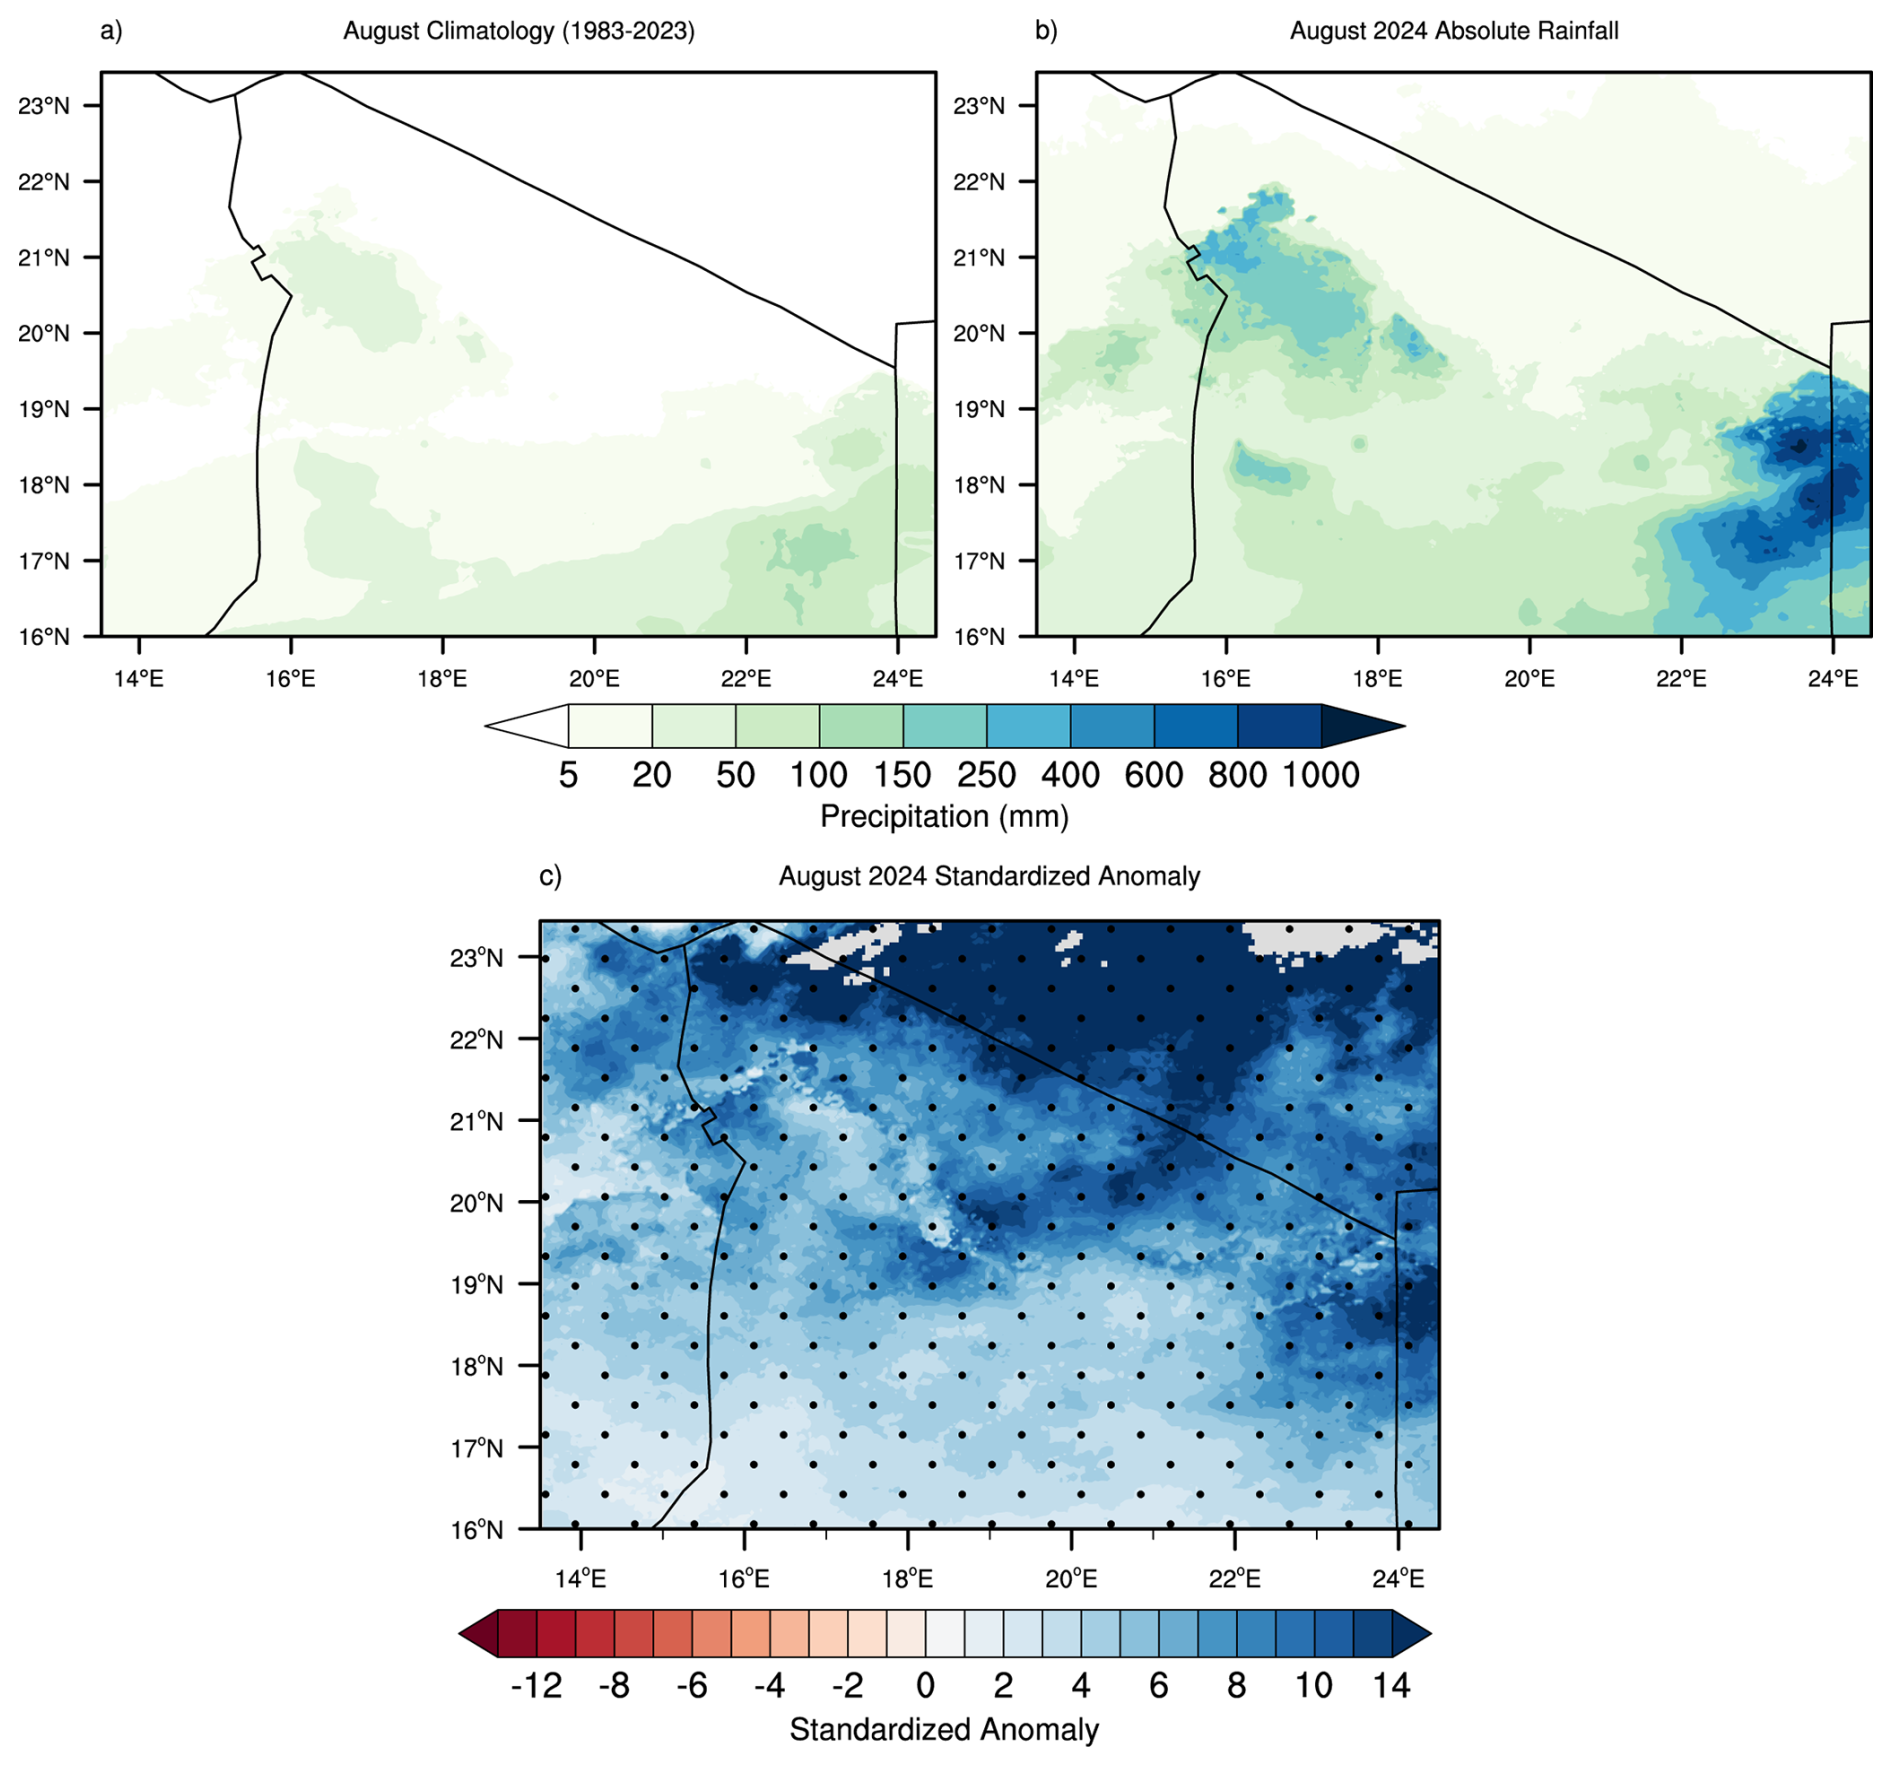
Figure 4Spatial distribution, magnitude, and statistical significance of August precipitation over Northern Chad derived from the TAMSAT product. Panels display (a) the multi-decadal baseline climatology (1983–2023), (b) absolute monthly rainfall accumulations for August 2024, and (c) the corresponding standardized anomalies (Z-score). Stippling in panel (c) denotes statistically significant anomalies (p ≤ 0.05) derived from a grid-point-wise Monte Carlo simulation.
Although the preceding regional temporal analysis (Sect. 3.1) demonstrated a remarkable synchronization between the TAMSAT and CHIRPS datasets, the spatial characterization presented here (Fig. 4) relies exclusively on the TAMSAT product. This methodological choice is motivated by TAMSAT's algorithmic design optimized for tracking African convective systems in arid zones. Furthermore, since the analysis critically depends on the calculation of standardized anomalies (Z-scores), the systematic magnitude offset observed between the two satellite products is mathematically normalized. This ensures that the spatial structure and statistical significance of the 2024 rainfall plume remain robust and independent of the selected product.
The baseline climatology (Fig. 4a) highlights the extreme and uniform aridity that typically characterizes the region. Within the central Saharan sectors encompassing the massifs and plateaux of the Tibesti, Borkou, and Ennedi, mean August accumulations are nearly non-existent and remain strictly below 5 mm.
In contrast to this baseline state, the spatial structure of the August 2024 rainfall (Fig. 4b) exhibits a remarkable northward thrust of precipitation well beyond the 20° N parallel. This rainfall activity was organized around two primary, well-defined core nodes:
-
The first developed over the rugged topography of the Ennedi and extended westward into the Borkou region, generating unprecedented absolute accumulations ranging from 150 to 400 mm.
-
The second manifested further to the northwest, directly impinging on the volcanic massifs of the Tibesti region, with totals ranging from 100 to 250 mm.
The standardized anomaly field (Fig. 4c) provides a mathematical context for the extraordinary magnitude of this event. Localized departures from the historical mean are exceptional, with Z-scores systematically exceeding , and localized peaks transcending within the Borkou and Ennedi sectors. Such values underscore the profound statistical deviation of this event from regional historical observations.
Finally, to ensure that this signal is reliable and does not result from random variability, a grid-point-wise statistical Monte Carlo significance test was applied. The resulting empirically derived significance mask (represented by the stippling in Fig. 4c) completely envelopes the Tibesti, Borkou, and Ennedi regions. The spatial continuity of this mask confirms that the northward advance of the monsoon and the associated hyper-arid precipitation constitute a statistically significant anomaly (p ≤ 0.05) that is unprecedented since the beginning of the satellite era, indicative of an exceptional displacement of the West African Monsoon (WAM) boundaries during this period.
While the spatial architecture of Fig. 4 illustrates the geographic extent of this event along the Tibesti-Borkou-Ennedi corridor, it raises, above all, the question of its statistical return period and the underlying atmospheric conditions that allowed such anomalies to persist. To place the extreme nature of this plume within a historical context spanning several decades, we employ a combined diagnostic framework that links parametric return periods of precipitation to nonparametric empirical ranks of tropospheric moisture content. To quantify the historical rarity of this event, a rigorous dual-probabilistic diagnostics framework was applied to the core convective zone (16–24° N, 13–25° E).
Table 1Parametric Return Periods and Non-Parametric Thermodynamic Percentile Ranks for the August 2024 Extreme Event based on spatial averages over the Northern Chad study domain (16–24° N, 13–25° E). Rainfall metrics are based on a Gamma distribution fitted via Maximum Likelihood Estimation (MLE) over the 1983–2024 baseline. Specific humidity (q) and Total Column Water Vapor (TCWV) metrics represent empirical ranks and percentile ranks calculated using the Weibull formula over the same climatological period (N = 42 years).
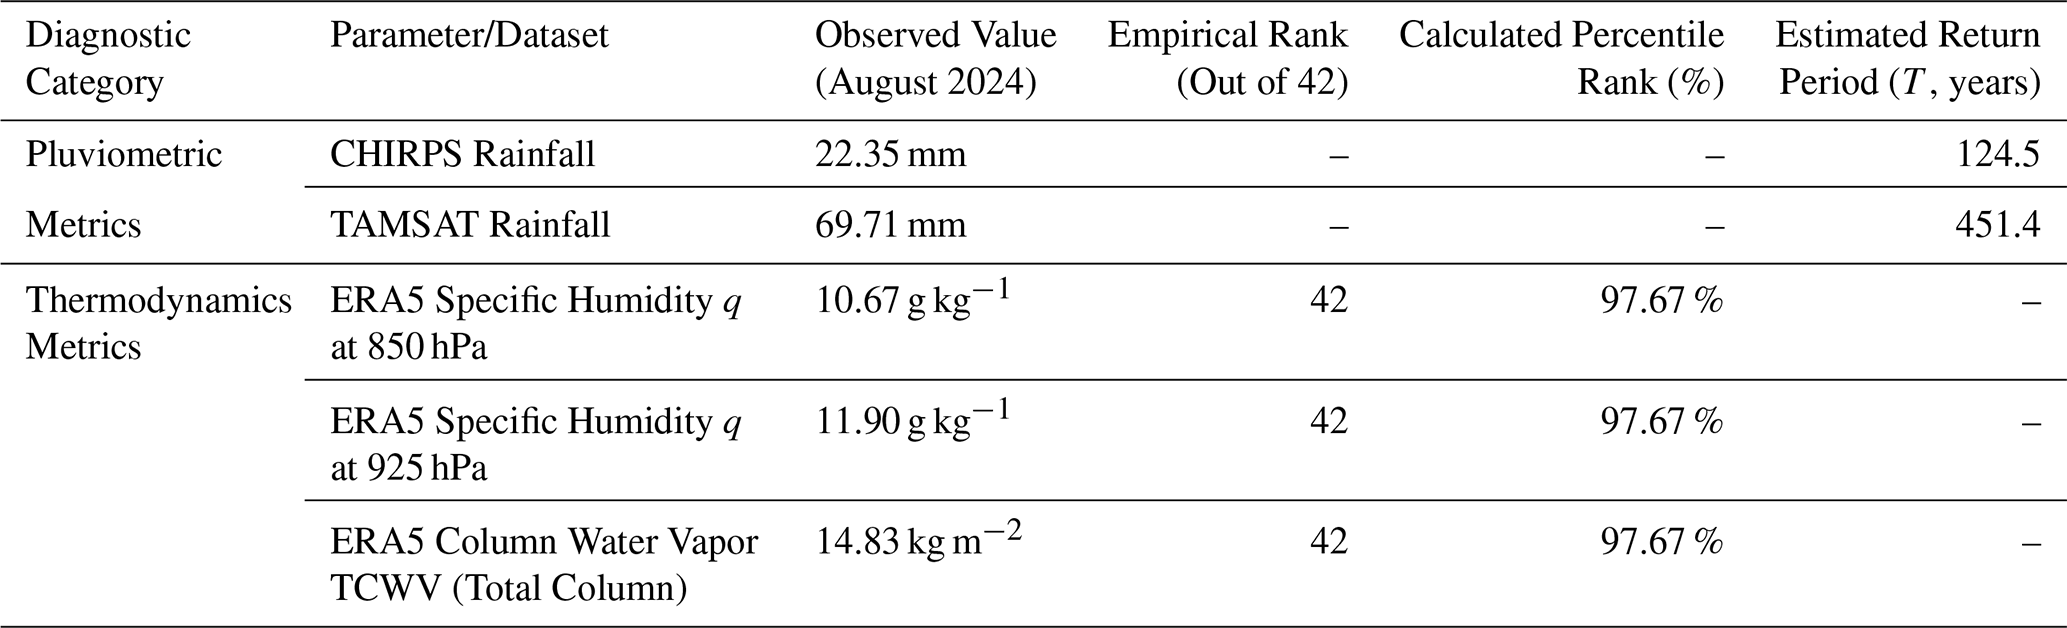
The results, summarized in Table 1, contrast the parametric return periods (T) derived from the optimized two-parameter Gamma distribution against the empirical thermodynamic percentile ranks (PR) computed via the mathematically consistent Weibull plotting position (Makkonen, 2006). The regionalized August 2024 rainfall anomaly exhibits a return period of 124.5 years according to CHIRPS (mean: 22.35 mm), and reaches up to 451.4 years according to the TAMSAT satellite product (mean: 69.71 mm). The structural discrepancy between these two satellite estimates reflects well-known algorithmic sensitivities in hyper-arid, gauge-sparse regions. TAMSAT relies exclusively on Thermal Infrared (TIR) Cold Cloud Duration (CCD) thresholds calibrated specifically for African convective regimes (Maidment et al., 2014, 2017). Consequently, it effectively captured the persistent, deep cloud tops and prolonged convective activity that sustained this specific event, likely yielding a physically representative depiction of the local convective intensity. Conversely, while CHIRPS integrates TIR data, its methodology heavily relies on the blending of in-situ rain gauge observations for structural bias correction (Funk et al., 2015). In the hyper-arid northern territory of Chad, the severe scarcity of operational, real-time reporting gauges forces the CHIRPS algorithm to heavily weight its background climatology, typically inducing a conservative underestimation during unprecedented, high-magnitude anomalies. Despite this systematic magnitude offset, both independent datasets structurally agree on the centennial to multi-centennial scale of the anomaly. This out-of-boundary pluviometric response was systematically fueled by an extraordinary, vertically coherent thermodynamic state throughout the tropospheric column. The monthly mean specific humidity (q) reached absolute historical records at both the lower-tropospheric base (11.90 g kg−1 at 925 hPa) and the core of the monsoonal layer (10.67 g kg−1 at 850 hPa).
This profound moistening is further corroborated by the Total Column Water Vapor (TCWV), which attained an unprecedented historical peak of 14.83 kg m−2. For all three hydro-thermodynamic parameters, August 2024 ranked 42nd out of the 42-year climatological record, placing the month at the 97.67th empirical percentile of the historical distribution (Table 1). This joint analysis confirms that the historic rainfall observed in the Saharan regions of Chad resulted from a perfect synergy between, on the one hand, a local moisture reservoir reaching its absolute maximum, thereby preventing the inflow of dry air and lowering the condensation level due to lifting, and, on the other hand, a dynamically optimized triggering mechanism at the synoptic scale. However, while these extraordinary thermodynamic conditions created a highly conducive and moisture-saturated background state, they constitute a necessary but not sufficient condition for such extreme convective development. To fully understand how this localized precipitable water was dynamically lifted and organized into plumes of intense precipitation across the hyper-arid heartland, it is essential to shift our focus from hydrostatic column measurements to the synoptic-scale transient triggers that governed regional atmospheric circulation during August 2024.
3.3 Synoptic-Scale Triggering: African Easterly Waves (AEWs) Dynamics
To study the synoptic-scale atmospheric mechanisms underlying the exceptional precipitation anomalies observed in August 2024, Fig. 5 presents a longitude-time (Hovmöller) diagram of the meridional wind and relative vorticity at 700 hPa, averaged over the Saharan belt (16–24° N). During the first half of the month (from 1 to 16 August), the regional atmosphere was featured by robust and well-defined activity of the AEWs. This dynamic is visually identifiable by distinct diagonal corridors propagating westward, composed of alternating meridional components of north (blue) and south (red) winds. It is important to note that between 10 and 14 August, a high-amplitude wave trough penetrated the specific study area bounded by the meridians 13 and 25° E (vertical dotted lines). This synoptic event was characterized by a powerful acceleration of the southerly wind exceeding +4 m s−1 , which acted as a dynamic conveyor belt, ensuring significant moisture advection from the monsoon reservoirs in the low latitudes toward the hyper-arid interior. This hydrodynamic driving mechanism was closely linked to a significant core of cyclonic relative vorticity (green contour ≥ 1 × 10⁻⁵ s−1), ensuring the large-scale upwelling and vertical organization of the necessary cells. This intense dynamic forcing on a synoptic scale explains the onset, development, and concentration of the extreme hydrometeorological events observed over the Tibesti, Borkou, and Ennedi mountain ranges during this specific period spanning several days. In contrast, the second half of August 2024 (after 16 August) was marked by a notable change in weather conditions. The organized, in-phase, and propagating AEW structures have weakened considerably, as evidenced by the disruption of the diagonal wind bands. This state of suppression gave way to more stationary atmospheric features and localized, isolated vorticity maxima, centered mainly near the eastern boundary (25° E) during the last few days of the month. This evolution indicates that, while the first half of the month was dominated by transient wave-induced convective bursts, the second half shifted toward a more localized convective regime of thermodynamic origin, within the context of stationary synoptic patterns.
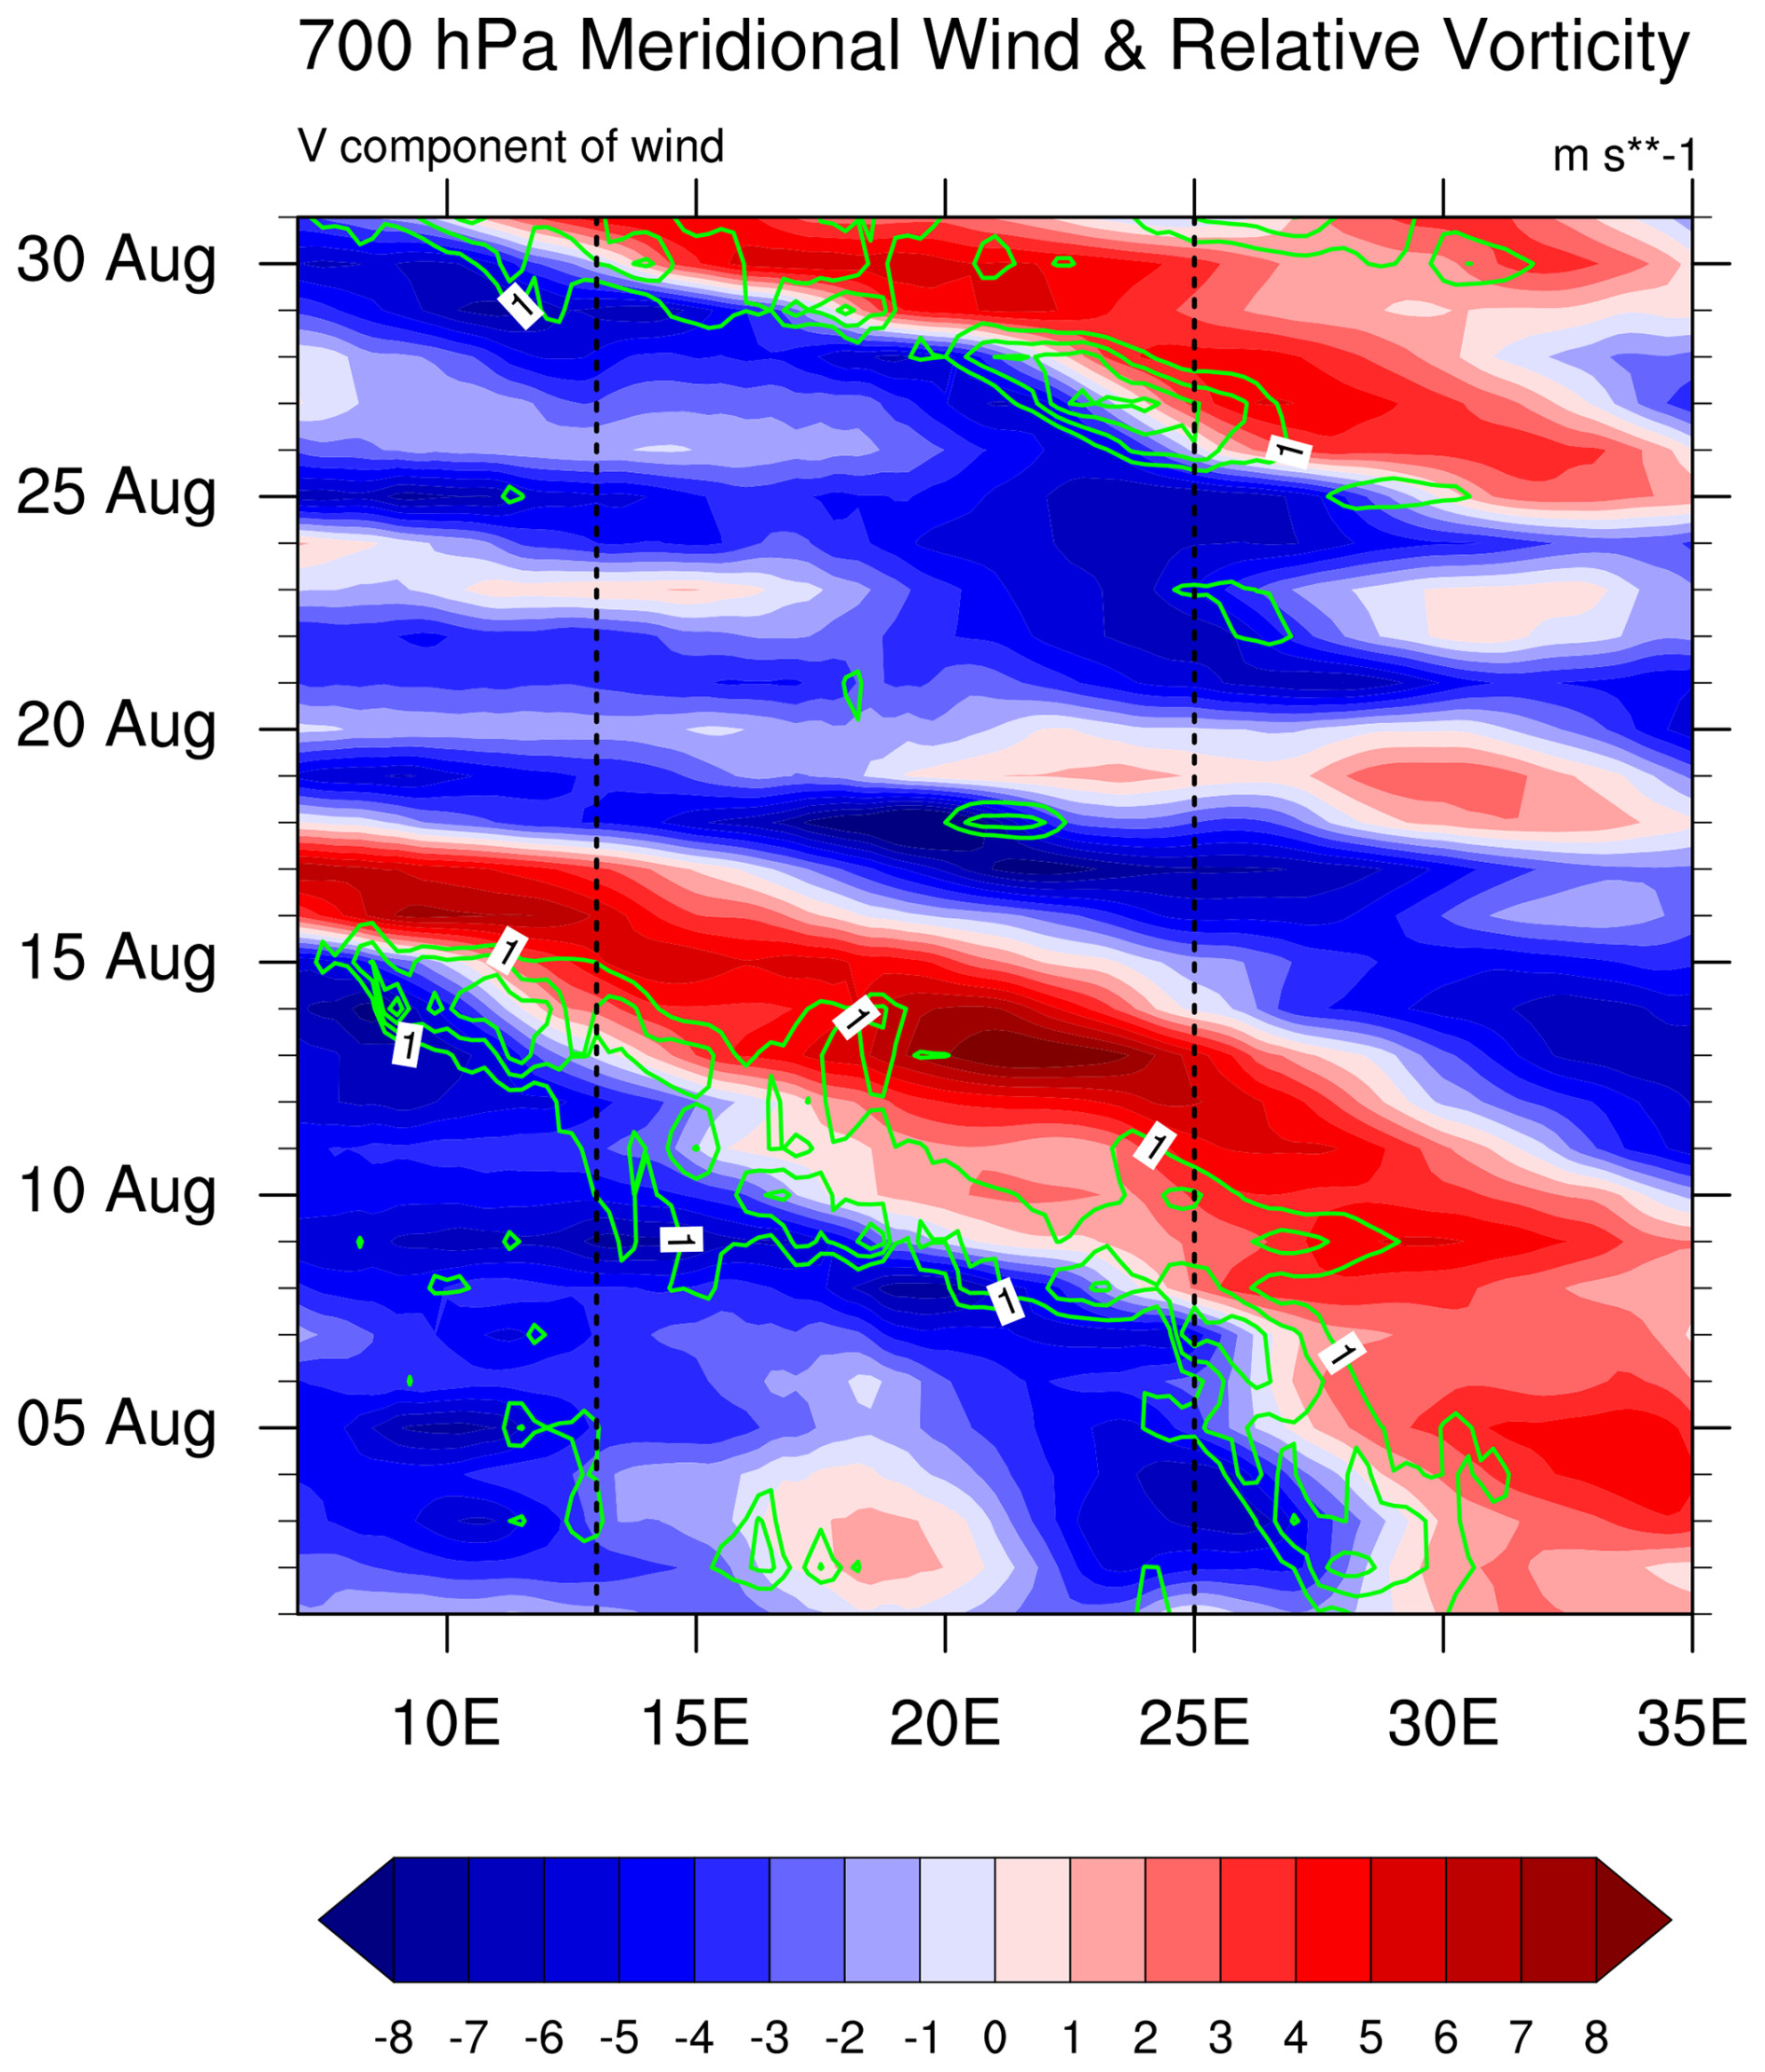
Figure 5Longitude-time (Hovmöller) diagram of 700 hPa meridional wind (shaded, m s−1) and relative vorticity (contours, 10−5 s−1) averaged over the Saharan band (16–24° N) during August 2024. Dashed vertical lines delimit the core study domain (13–25° E).
3.4 Climatological mean and anomalous state of lower-tropospheric (850 hPa) circulation, wind convergence, and Intertropical Front (ITF) positions
The progressive AEW packets analyzed in the previous section are not merely isolated daily weather events; on the contrary, their recurring occurrence and intensity are likely to modulate the large-scale monthly atmospheric state. To quantify the net, integrated impact of these synoptic drivers on the lower troposphere, this section examines the monthly mean dynamic configuration at 850 hPa. More specifically, Fig. 6 displays the spatial distribution of 850 hPa wind convergence, horizontal wind vectors, and the latitudinal position of the Intertropical Front (ITF), defined by the 15 °C dew point isodrosotherm. Three states are compared: the 1983–2023 August climatology (Fig. 6a), the August 2024 observed state (Fig. 6b), and the resultant absolute anomalies (Fig. 6c).
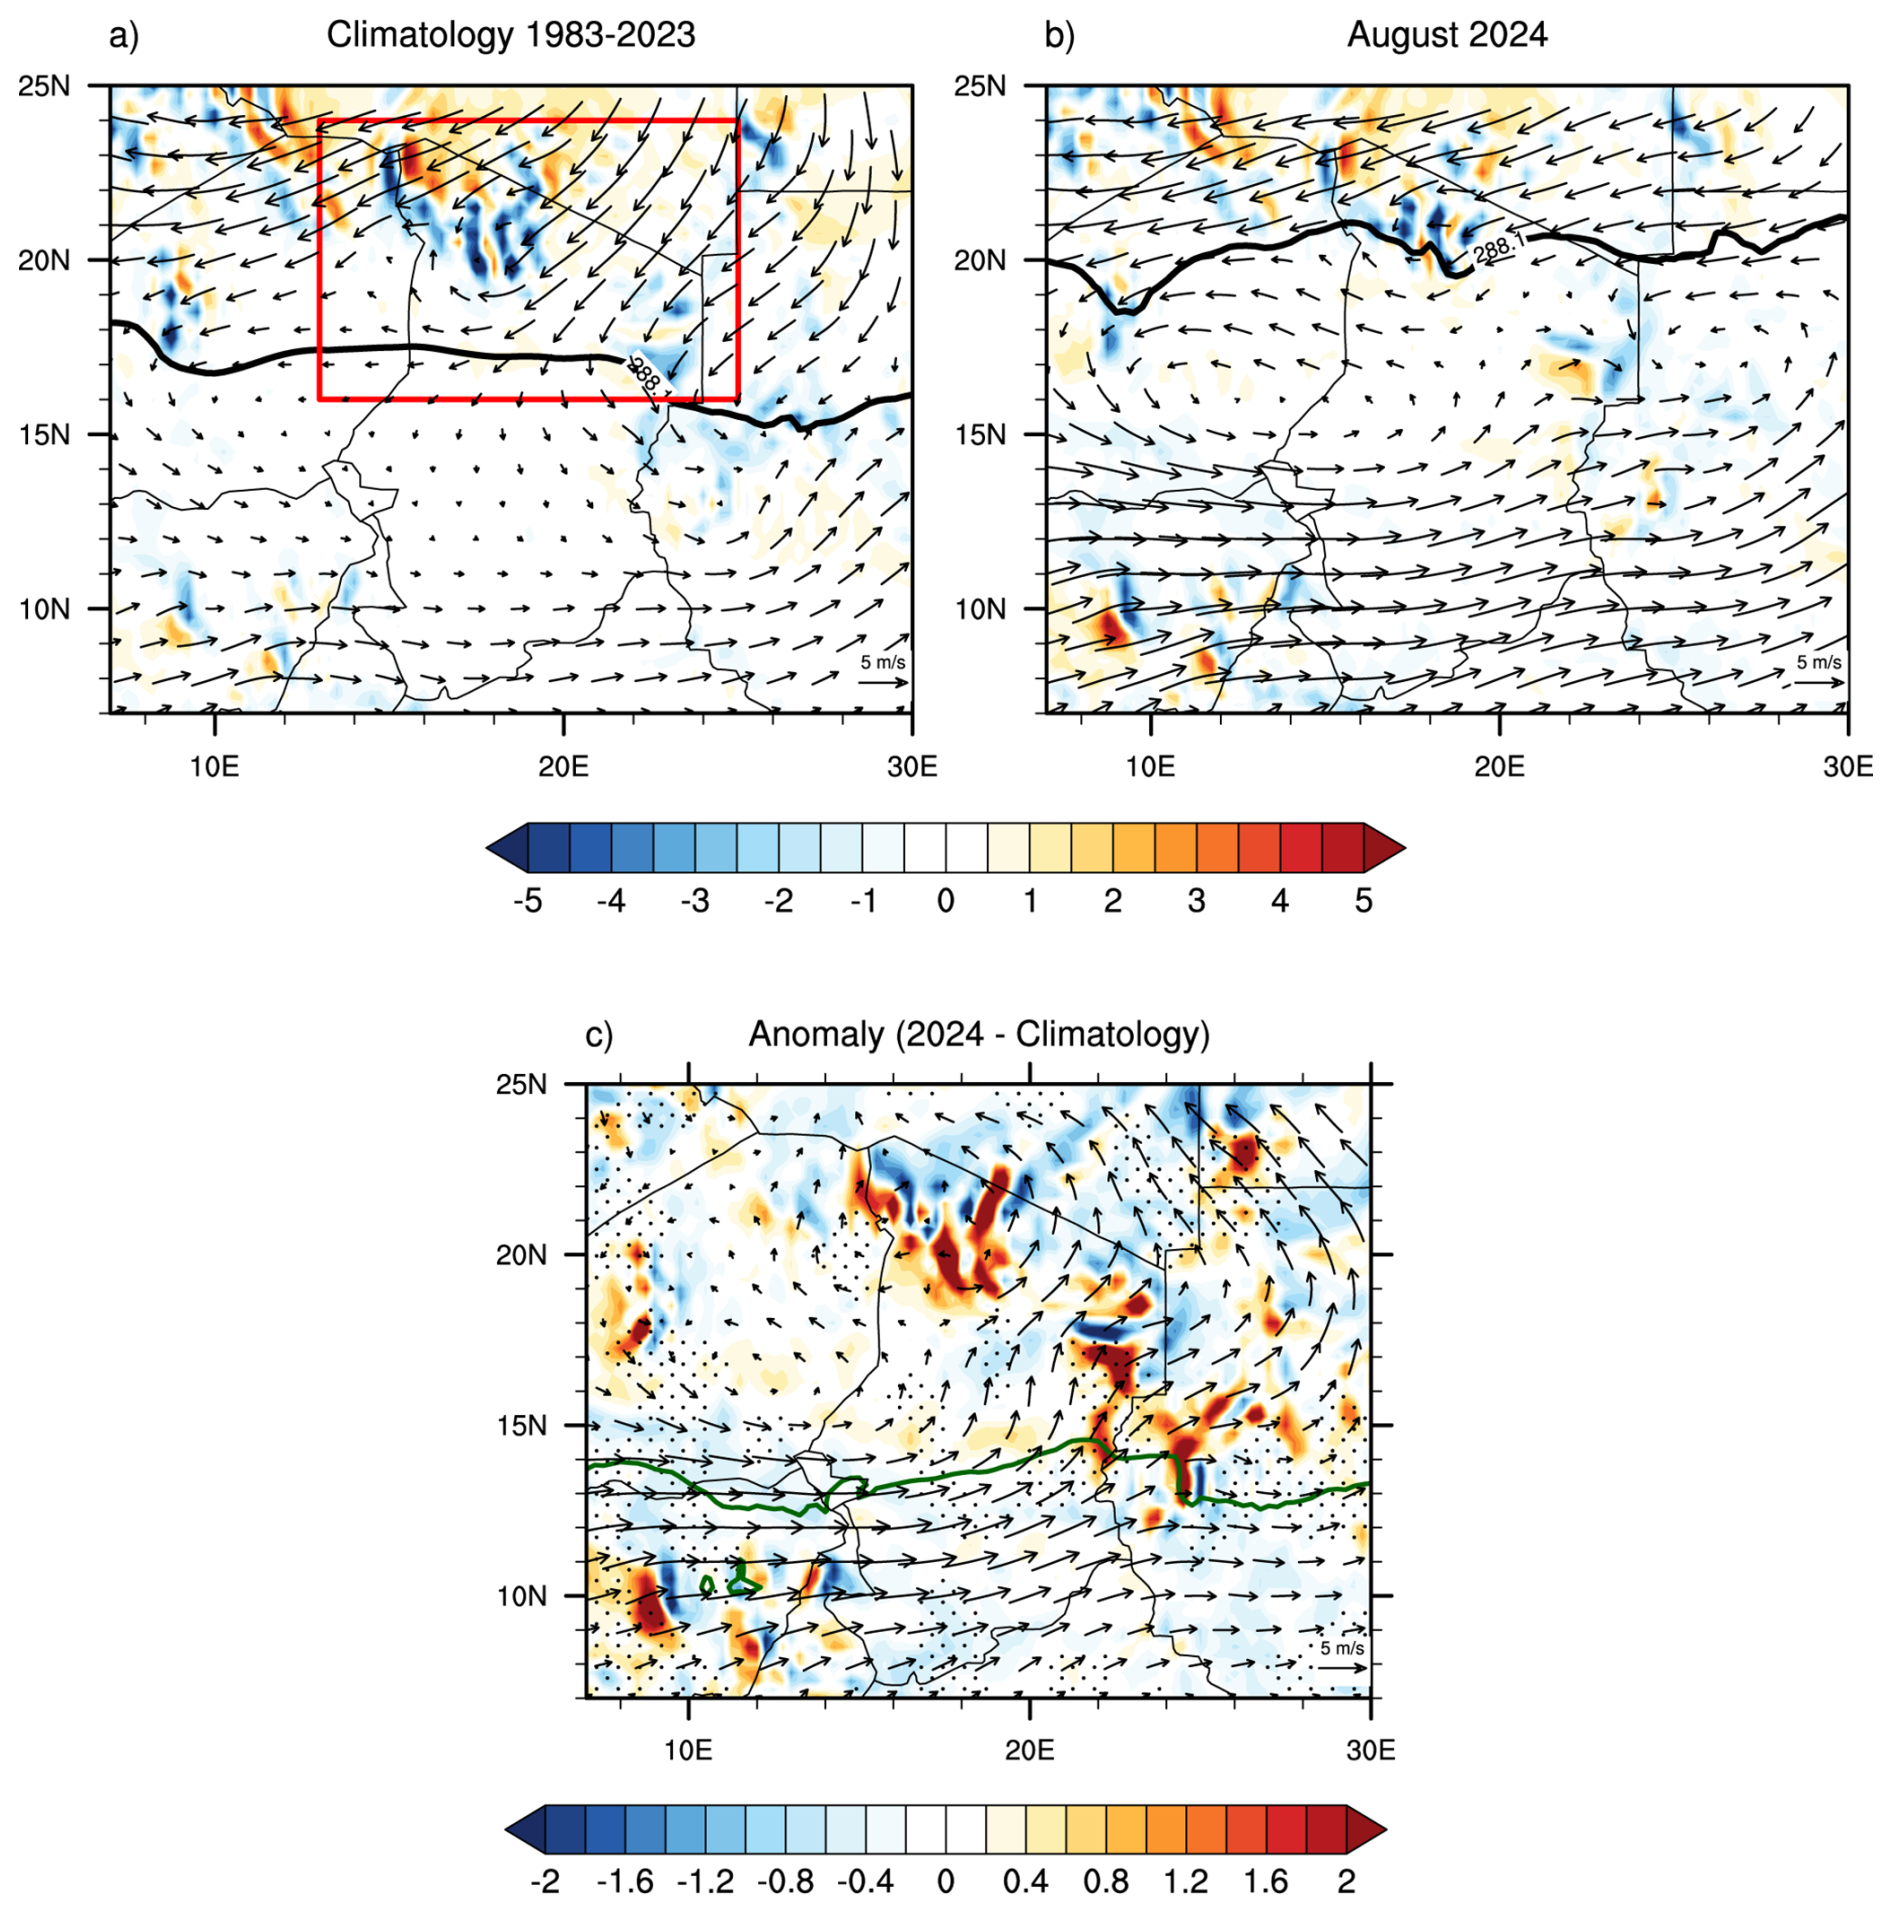
Figure 6Spatial distribution of lower tropospheric dynamics at 850 hPa in August, showing wind convergence (shading; × 10−5 s−1), horizontal wind vectors (arrows; m s−1), and tropospheric moisture boundaries. The panels show: (a) the climatological mean from 1983 to 2023, (b) conditions observed in August 2024, and (c) absolute anomalies for August 2024 relative to the climatological reference. In panels (a) and (b), the solid black contour line defines the absolute position of the intertropical front (ITF) via the dew point isodrosotherm at 15 °C (288.15 K). In panel (c), the solid green line follows the dew point anomaly threshold of +1 K (ΔTd) associated with the monsoon intrusion, and the stippling indicate regions where convergence anomalies are statistically significant at a 95 % confidence level (p ≤ 0.05), based on a Monte Carlo permutation test with 1000 iterations. The reference vector located at the bottom right of each figure corresponds to a wind speed of 5 m s−1. The red frame in panel (a) delineates the specific study area in northern Chad (16–24° N, 13–25° E).
In the climatological mean (Fig. 6a), the solid black contour marking the ITF exhibits a zonal orientation localized between 15 and 18° N, while the color shading reveals a well-defined band of low-level convergence (blue shading; −1 to −3 × 10⁻⁵ s−1) strictly bounded to the Sahelian belt. South of this boundary, the horizontal wind field is characterized by persistent, large-scale southwesterly vectors exceeding 5 m s−1. Conversely, inside the red box defining the northern Chadian study domain (16–24° N, 13–25° E), the background shading is dominated by positive divergence values (light yellow to white; +0.5 to +2 × 10⁻⁵ s−1), followed by strong northeasterly wind arrows. Dynamically, this indicates that significant low-level convergence is normally restricted to the humid monsoonal flow over the Sahel. Northern Chad, including the Tibesti, Borkou, and Ennedi massifs, is climatologically dominated by a strongly divergent, subsiding regime associated with the descending branch of the Hadley cell and dry Harmattan winds. These synoptic conditions maintain absolute atmospheric stability and structurally inhibit deep convection, a configuration perfectly aligned with the established canonical structure of the West African Monsoon (WAM) (Sultan and Janicot, 2003; Nicholson, 2013).
In August 2024 (Fig. 6b), the thick black ITF line displays a pronounced northward deformation, looping up to the 20–22° N latitudinal band, while the core of negative divergence values (blue patches; −2 to −4 × 10⁻⁵ s−1) undergoes a substantial northward migration into the Saharan interior. Simultaneously, the horizontal wind vectors show a total reorientation within the study domain, where the traditional northeasterlies are replaced by an uncharacteristic influx of southwesterly and southerly arrows penetrating past 20° N. This interior flow was embedded within a broader synoptic configuration, characterized by enhanced cyclonic circulation gyres visible both to the west and east of the study domain. Visually and physically, this confirms a radical breakdown of the typical desert circulation. This deep latitudinal displacement allowed intense southwesterly monsoonal surges to bypass their usual boundaries and directly establish a powerful dynamic convergence engine over the complex terrain of the Tibesti massif, the Borkou depressions, and the Ennedi plateau. This localized convergence provided the forced mechanical ascent necessary to overcome the hyper-arid background stability, shifting a normally stable region into a highly active convective state. This structural configuration closely mirrors the diagnostic frameworks of extreme multi-day rainfall events documented in arid northern Africa, where topographically locked moisture flux convergence drives unprecedented precipitation events (Vondou et al., 2025).
The absolute anomaly field (Fig. 6c) reveals a vast, cohesive cell of enhanced convergence anomalies (blue shading; reaching −0.6 to −1.6 × 10⁻⁵ s−1) spanning the 15–22° N domain, overlaid by a prominent cyclonic (counter-clockwise) wind vector circulation centered over the Chad-Niger border. The solid green contour, tracking the +1 K dew point anomaly threshold, extends well north of 15° N and runs spatially in-phase with the maximum convergence anomalies. Physically, this feature indicates that the dynamic lifting engine was perfectly co-located with a highly anomalous tropospheric moisture loading, which effectively suppressed dry entrainment and favored widespread condensation over the Saharan massifs. Mathematically, this cyclonic wind anomaly explicitly proves that horizontal wind convergence was complemented by a substantial increase in low-tropospheric cyclonic vorticity. Such an environment is vital for providing the mesoscale organization and hydrodynamic longevity required to sustain organized and long-lived convective systems in extreme environments (Lavaysse et al., 2009; Flamant et al., 2018). Crucially, the extensive stippling mask confirms that these enhanced convergence anomalies are statistically significant (p ≤ 0.05) based on the 1000-iteration Monte Carlo permutation test. Because this significant signal is spatially in-phase with the anomalous southwesterly moisture advection, it confirms a total, non-random disruption of the Saharan divergent regime, representing a profound, transient northward expansion of the Sahelian convective climate boundary into the hyper-arid core of Northern Chad (Taylor et al., 2017; Biasutti, 2019). In summary, the out-of-boundary rainfall event of August 2024 resulted from a perfect synergy between the exceptional northward migration of the ITF, reinforced low-level convergence at 850 hPa, and the establishment of a regional cyclonic circulation that optimized the vertical lifting of warm, moist air masses over Northern Chad. These findings strongly align with recent literature linking increased WAM variability to a higher frequency of hydroclimatic extremes along the Sahara-Sahel transition zone (Janicot et al., 2008; Taylor et al., 2017; Biasutti, 2019; Tamoffo et al., 2026b).
3.5 Spatial Distribution of Low-Level Humidity and Moisture Flux
While the anomalous 850 hPa wind convergence and northward ITF displacement analyzed in Sect. 3.4 establish the necessary structural lifting engine over Northern Chad, dynamic forcing alone cannot trigger extreme precipitation without a sufficient and continuous supply of atmospheric water vapor. To assess the thermodynamic environment supporting this localized convergence, it is essential to examine the availability and transport of low-level moisture. Consequently, this section evaluates the spatial distribution of specific humidity and horizontal moisture flux fields at 850 hPa. Figure 7 displays the spatial distribution of 850 hPa specific humidity along with horizontal moisture flux vectors over West and Central Africa. Three configurations are compared: the 1983–2023 August historical climatology (Fig. 7a), the observed conditions in August 2024 (Fig. 7b), and the resulting absolute anomalies (Fig. 7c).
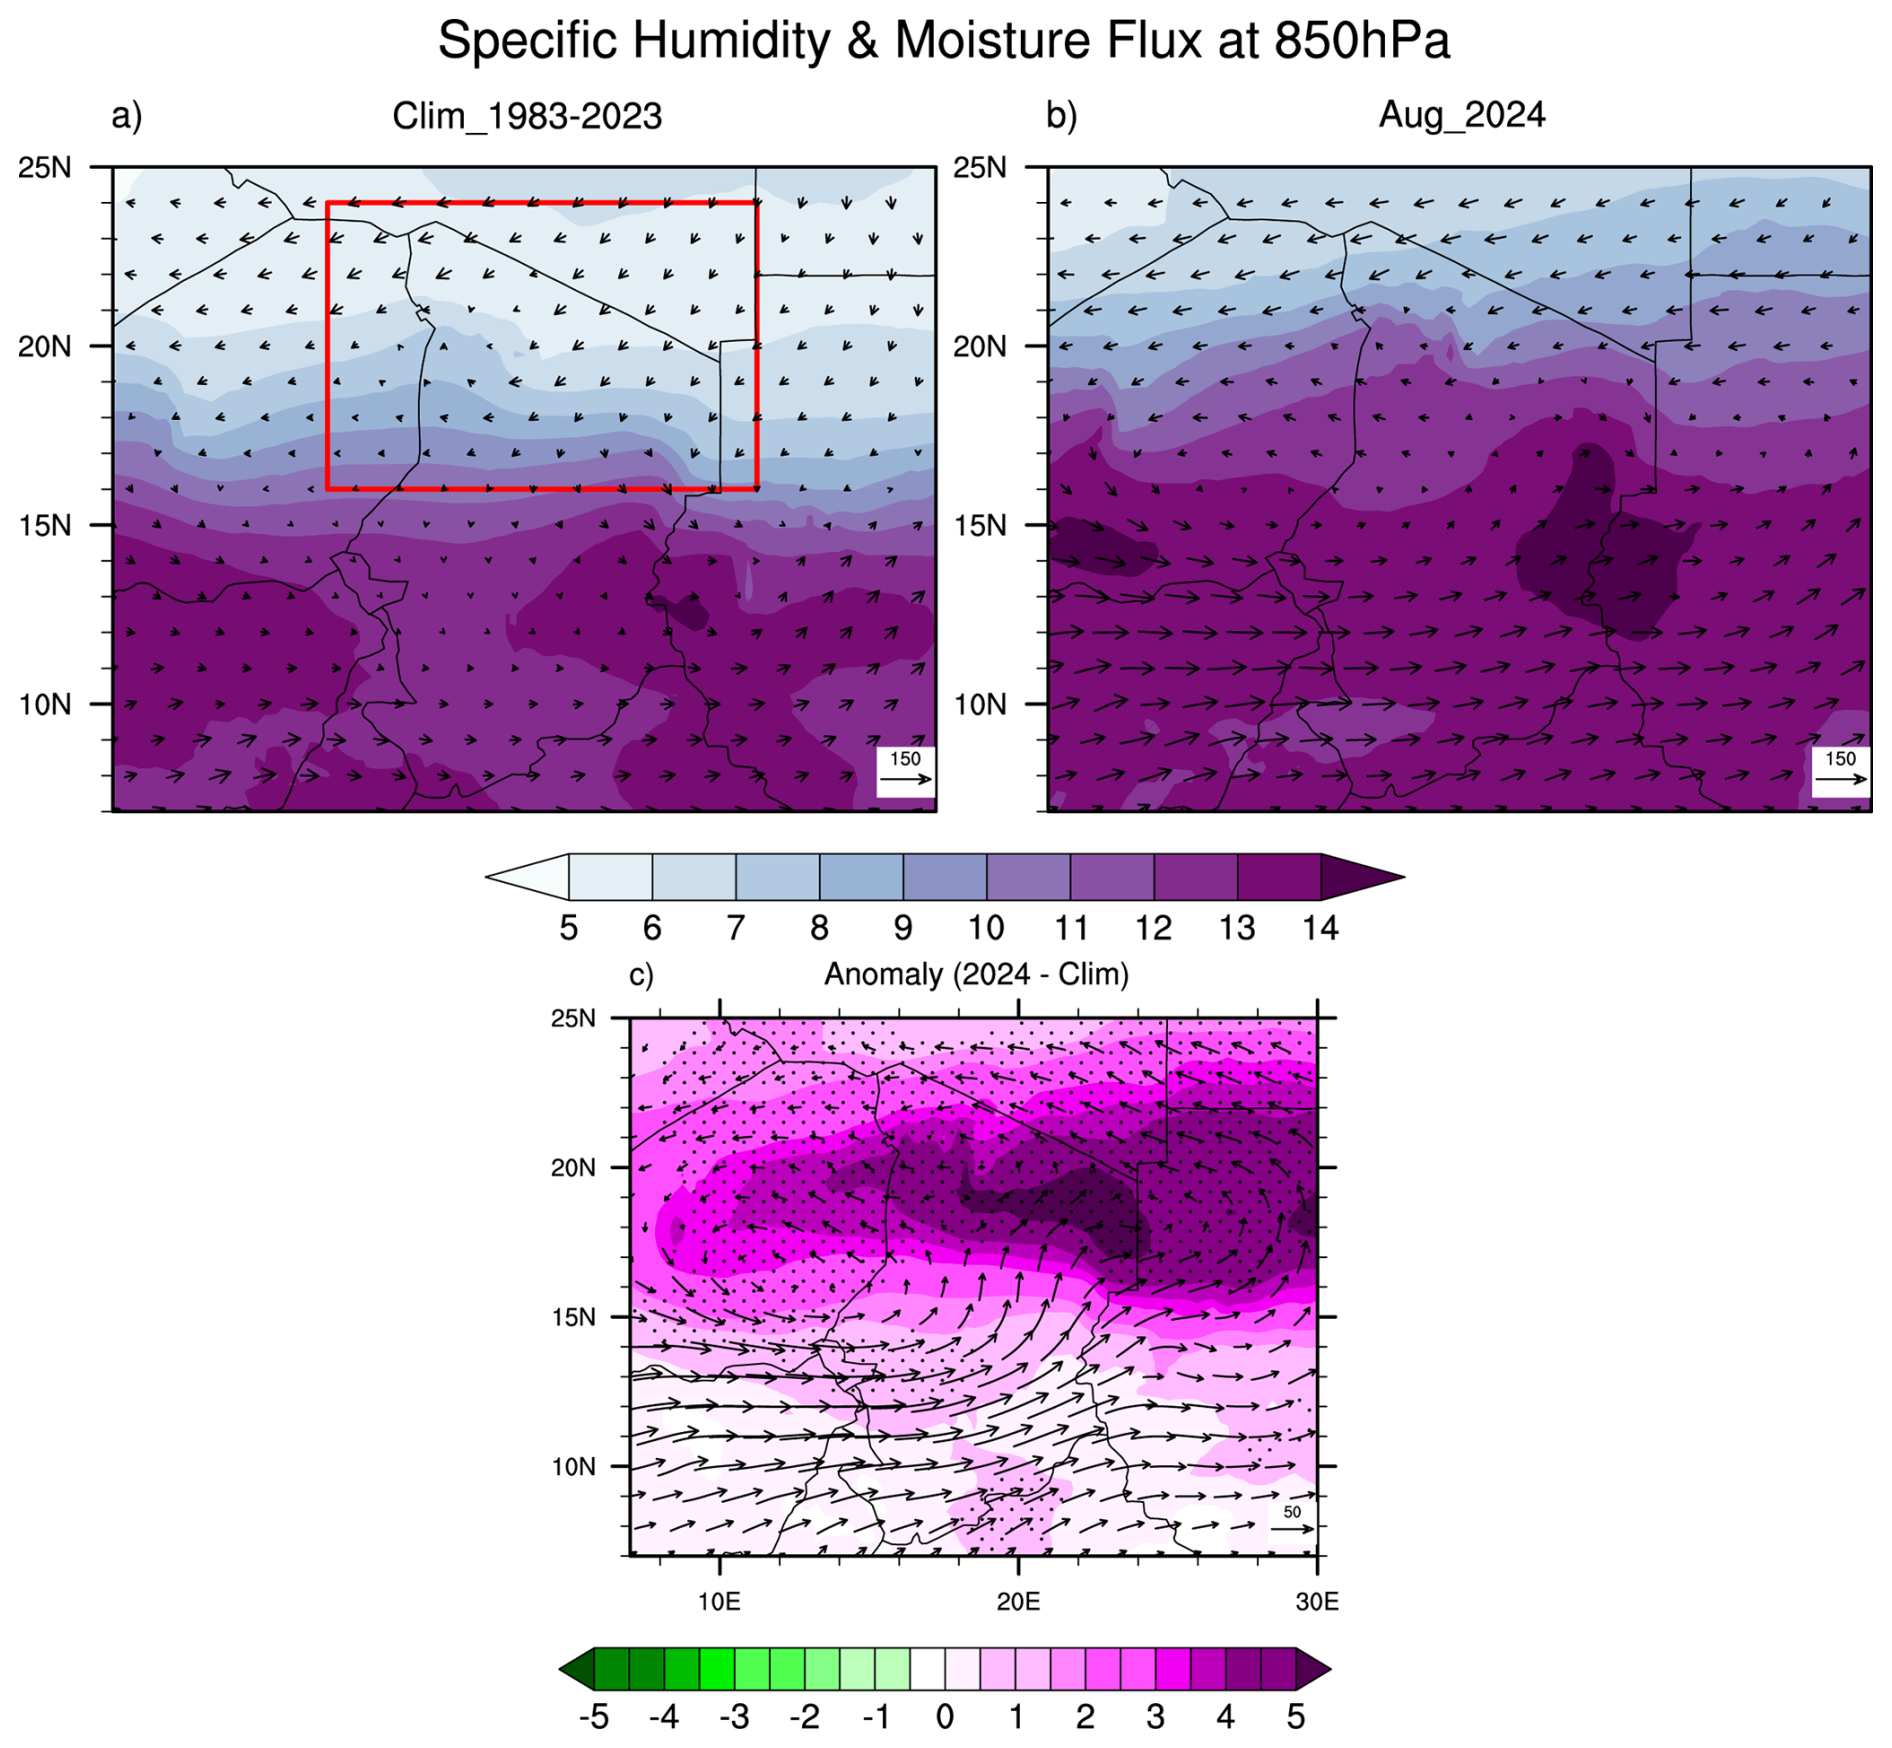
Figure 7Spatial distribution of 850 hPa specific humidity and horizontal moisture flux fields in August over West and Central Africa. The red box outlines the specific study domain over Northern Chad (16–24° N, 13–25° E). Panels display: (a) the 1983–2023 climatological mean, (b) the observed conditions in August 2024, and (c) the absolute anomalies for August 2024 relative to the historical baseline. Shading denotes specific humidity (g kg−1), and vectors represent horizontal moisture flux (g kg−1 m s−1). In panel (c), stippling highlights regions where specific humidity anomalies are statistically significant at the 95 % confidence level (p ≤ 0.05) based on a 1000-iteration Monte Carlo permutation test. Reference vectors corresponding to 150 g kg−1 m s−1 (a, b) and 50 g kg−1 m s−1 (c) are displayed in the bottom-right corners.
The climatological mean (Fig. 7a) highlights a sharp meridional moisture gradient across the region. High specific humidity values (purple shading; exceeding 10 to 14 g kg−1) remain strictly confined south of the 15–18° N latitudinal belt, marking the canonical northernmost boundary of the West African Monsoon (WAM) moisture pool. South of this transition zone, the horizontal moisture flux vectors exhibit a powerful, organized southwesterly routing, driving a continuous supply of monsoonal water vapor from the Atlantic toward the Sahelian corridor. Conversely, inside the red box defining the Northern Chadian study domain (16–24° N, 13–25° E), the lower troposphere is climatologically arid, characterized by low specific humidity values (light blue to white shading; dropping below 6 to 8 g kg−1) and a weak, predominantly zonal moisture transport. This asymmetric structural configuration shows that, under typical summer conditions, the Saharan desert interior is structurally isolated from significant low-level tropical moisture influxes (Nicholson, 2013; Biasutti, 2019).
In August 2024 (Fig. 7b), this mean baseline was heavily disrupted. The low-level moisture pool underwent an exceptional northward migration, pushing the 10 to 12 g kg−1 specific humidity thresholds deep into the hyper-arid core of Northern Chad, well past 20° N. Concurrently, the horizontal moisture flux vectors reveal a massive, uncharacteristic reorientation. The climatological continental desert regime was entirely replaced by an intensified, cross-equatorial southwesterly moisture conveyor that bypassed its traditional Sahelian limits to directly feed the complex topography of the Tibesti, Borkou, and Ennedi massifs. Physically, this structural change confirms that the 850 hPa layer was subjected to a continuous, large-scale tropical moisture loading, satisfying a critical thermodynamic prerequisite for widespread and persistent high-latitude rainfall anomalies.
The absolute anomaly field (Fig. 7c) provides a quantitative diagnostic of this hydroclimatic shift. A vast, spatially cohesive core of positive specific humidity anomalies (pink shading; reaching +2 to +4 g kg−1) covers the entire 15–23° N Saharan interior. Crucially, the extensive stippling mask generated by the 1000-iteration Monte Carlo permutation test confirms that these moist anomalies are statistically significant (p ≤ 0.05) over virtually the entire northern Chadian domain. This significant moisture surplus runs perfectly in-phase with robust anomalous southerly and southwesterly moisture flux arrows. This alignment explicitly proves that the local humidification of the desert boundary layer was structurally driven by enhanced active advection from the tropical Atlantic and the monsoonal belt rather than localized evaporation. In summary, the out-of-boundary convective activation of August 2024 resulted from an optimal dynamical-thermodynamical coupling. The exceptional low-level moisture advection documented here (Fig. 7) acted in perfect synergy with the strong 850 hPa wind convergence anomalies previously analyzed. By shifting the normally dry and stable Saharan boundary layer into an uncharacteristically humid and moist state, this combined synoptic-scale mechanism effectively sustained a highly active and long-lived convective regional climate.
3.6 Atmospheric Vertical Structure and Meridional Circulation Cross-Sections
The horizontal accumulation of low-level moisture and enhanced moisture fluxes documented in Sect. 3.5 over the Saharan interior cannot trigger extreme rainfall anomalies without a corresponding vertical mechanism capable of lifting this moist air mass throughout the troposphere. To understand the dynamic framework supporting these surface thermodynamic shifts, it is essential to examine the meridional-vertical structure of the atmospheric column. Consequently, this section investigates the vertical overturning regional circulation. Figure 8 presents the latitude-pressure cross-sections of vertical velocity (ω, shaded) and superimposed meridional-vertical circulation vectors (v, ω) averaged over the 13–25° E longitudinal band for the August historical climatology (Fig. 8a), August 2024 (Fig. 8b), and their absolute anomalies (Fig. 8c). Following the standard meteorological convention, negative ω values (blue shading) denote upward atmospheric motion, whereas positive values (red shading) correspond to subsidence.
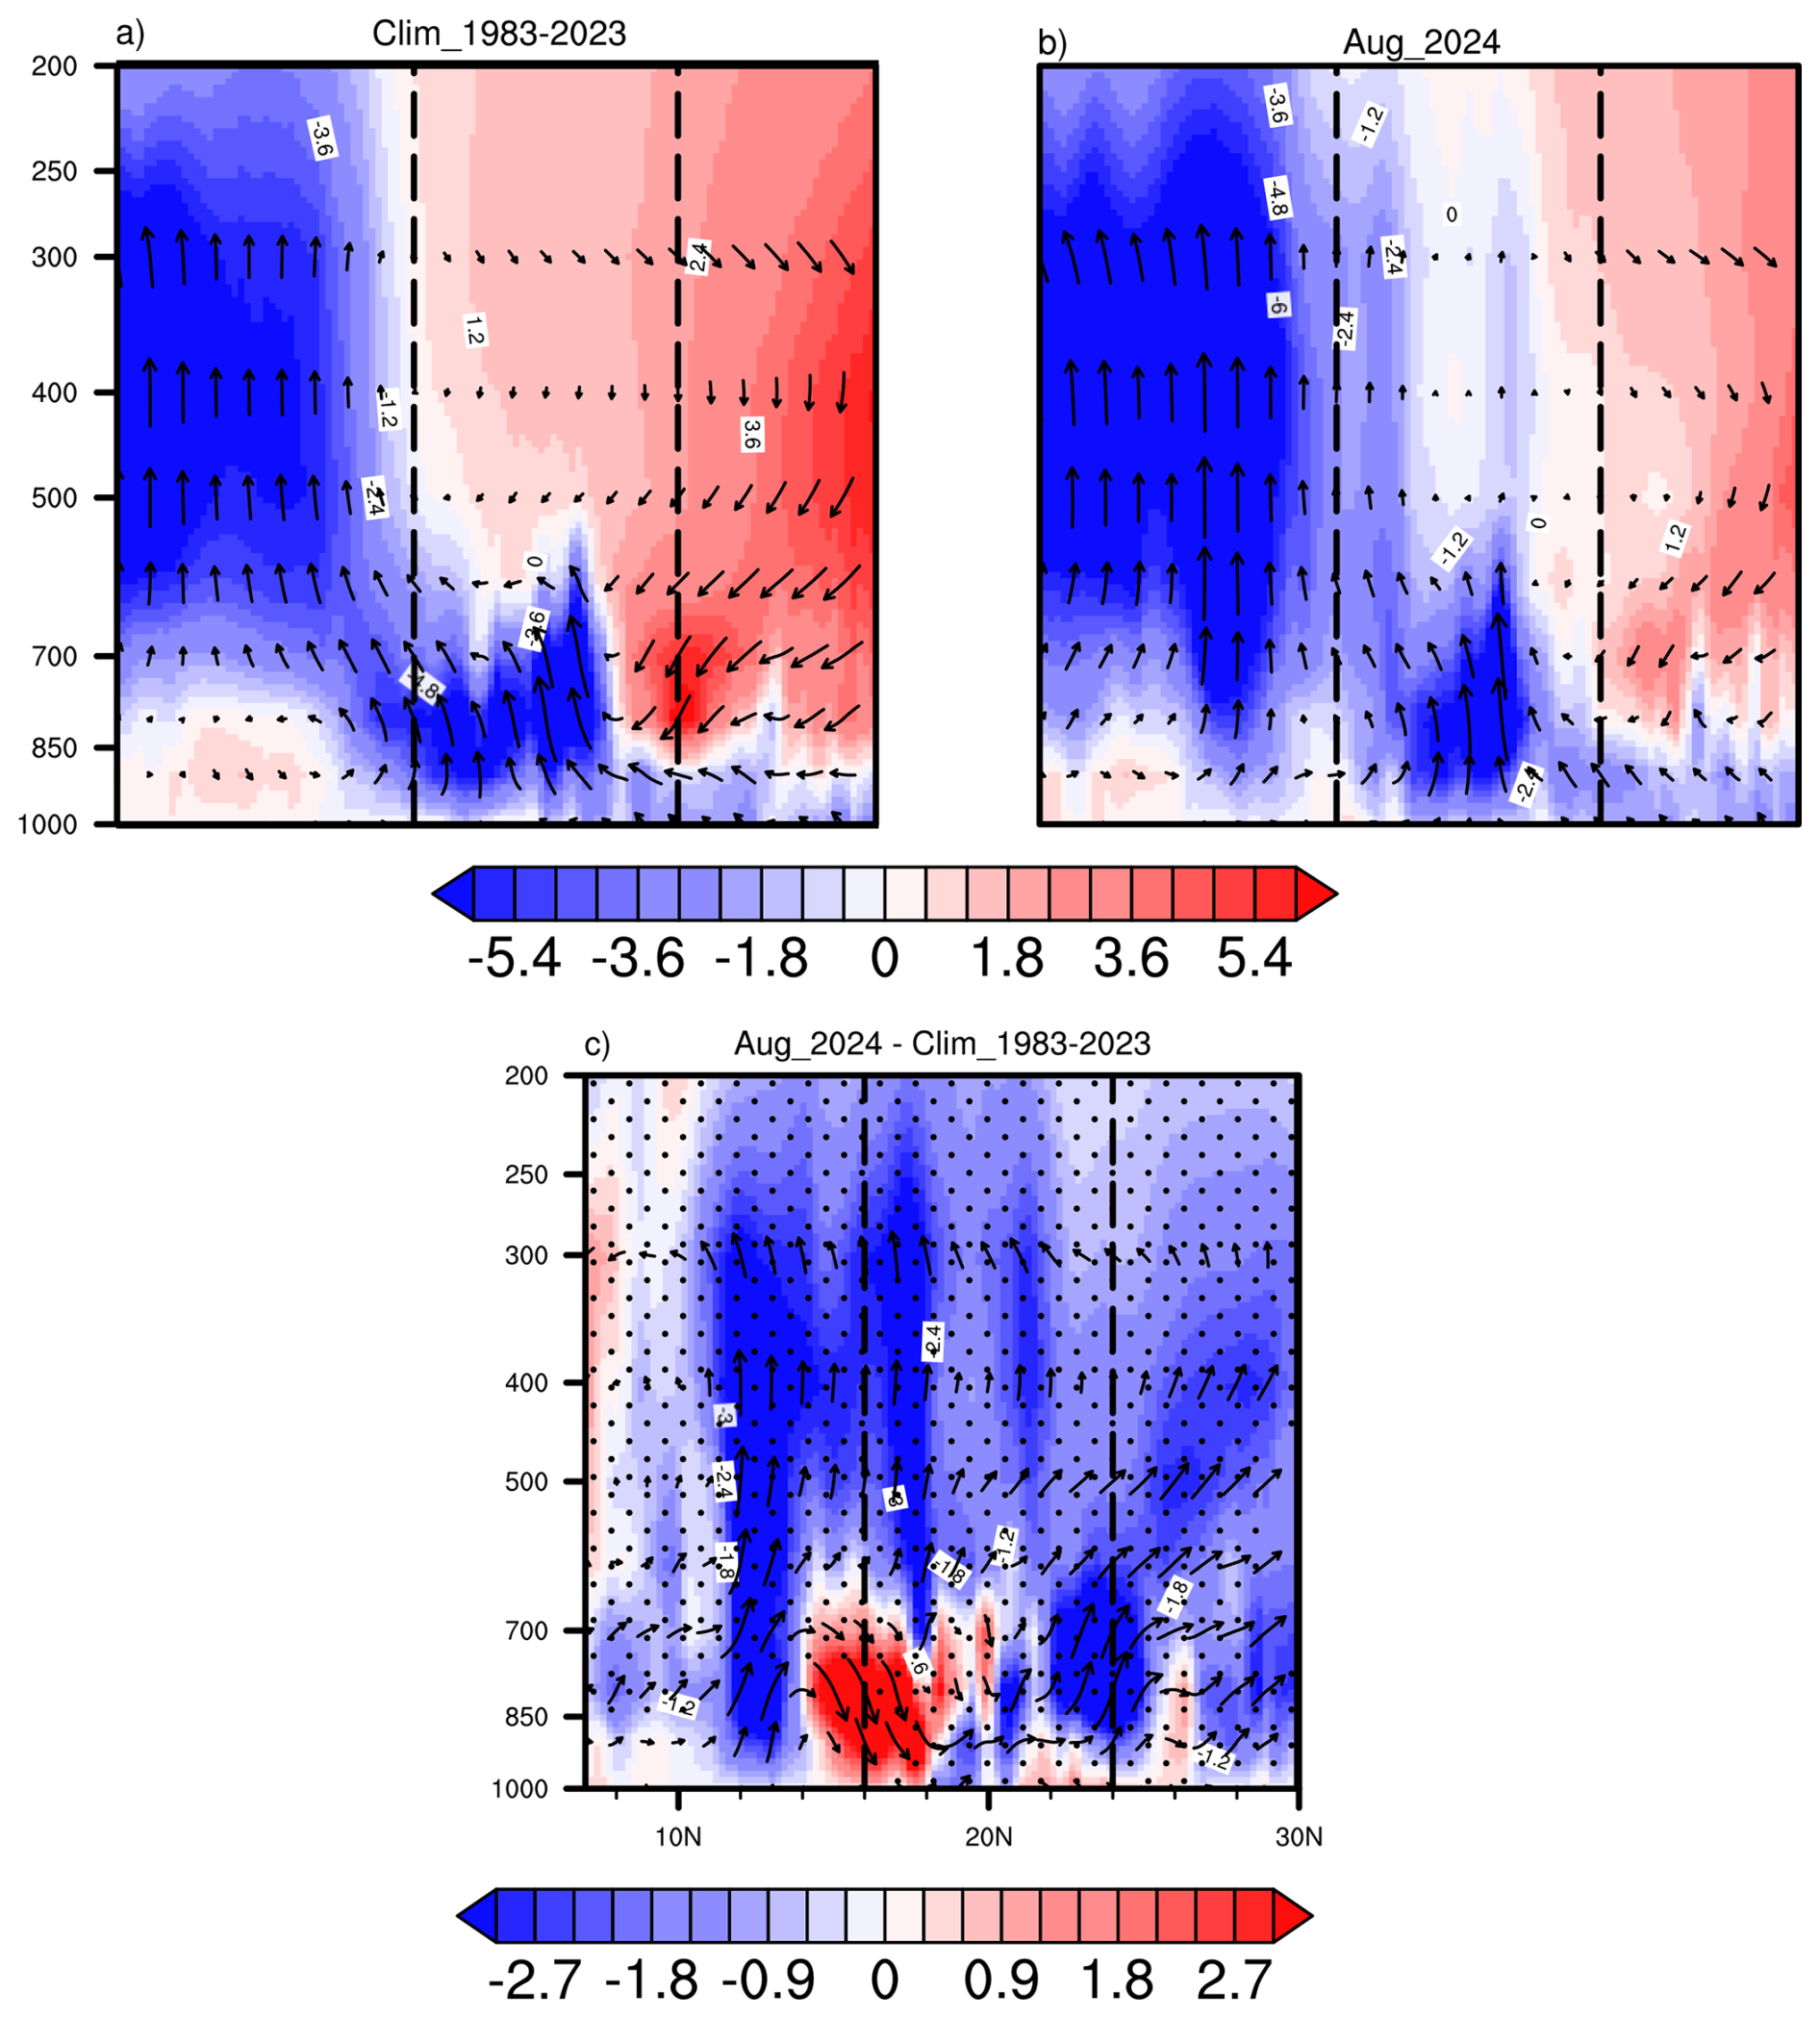
Figure 8Latitude-pressure cross-sections of meridional-vertical atmospheric circulation and thermodynamic structure for August averaged over the 13–25° E longitudinal band. Shading displays the vertical velocity (ω, × 10−2 Pa s−1), where negative values denote upward motion and positive values correspond to subsidence. Vectors represent the combined meridional and vertical wind components (v and ω, with vertical velocity scaled for visualization). Panels show (a) the 1983–2023 climatological mean, (b) August 2024, and (c) the absolute anomalies (August 2024 minus climatology). In panel (c), stippling isolates regions where anomalies are statistically significant at the 95 % confidence level (p ≤ 0.05) based on a 1000-iteration Monte Carlo permutation test. Dashed vertical lines delimit the latitudinal domain of the study area (16–24° N).
In the historical climatology (Fig. 8a), the regional overturning circulation exhibits a classic asymmetric Hadley-type cell configuration. Deep and intense ascending motions (ω < 0; blue shading) are structurally confined between 10 and 15° N, extending from the lower boundary layer up to the upper troposphere (∼ 300 hPa). This deep vertical convective core represents the mean position of the summer monsoonal ascending branch. North of 18° N, including the northern Chadian study domain (16–24° N, highlighted by the vertical dashed lines), the troposphere is heavily dominated by widespread subsidence (ω > 0; red shading), particularly in the middle and upper layers (600–200 hPa). This pervasive mid-tropospheric capping downwelling structurally stabilizes the Saharan atmosphere, explaining the hyper-arid baseline of the desert interior under typical summer conditions.
During August 2024 (Fig. 8b), this mean vertical circulation experienced a profound latitudinal reorganization. The core of deep monsoonal ascent underwent an exceptional northward migration and intensification, with robust negative ω fields (blue shading) spreading continuously into the Saharan interior up to 21–22° N. The circulation vectors reveal a powerful, uninterrupted vertical conveyor bridging the lower layers (1000–850 hPa) directly with the upper tropospheric outflow up to 200 hPa. This structural shift implies that the climatological Saharan subsidence capping was completely broken down and replaced by a deep, regional-scale ascending chimney, creating an environment highly favorable for sustained regional moist convection.
The absolute anomaly field (Fig. 8c) confirms the statistical robustness of this dynamic displacement, with the 1000-iteration Monte Carlo permutation test isolating large areas of significant changes (p ≤ 0.05; stippling mask) within the Saharan interior. A prominent, deeply rooted negative ω anomaly (blue shading) occupies the 16–24° N latitudinal belt, indicating an unprecedented intensification of upward vertical velocity relative to the climatology. Directly south of this feature, between 15 and 18° N and confined to the lower troposphere (1000–700 hPa), a localized positive ω anomaly (red shading) is visible, accompanied by downward-pointing anomalous circulation vectors. When cross-examined with the absolute fields (Fig. 8a, b), where blue shading (upward motion) persists during both periods, this positive anomaly does not represent physical synoptic-scale subsidence or an invasion of dry desert air. Instead, it indicates a localized, non-statistically significant reduction in the magnitude of the monsoonal updrafts. Because the main convective core of the West African Monsoon underwent a pronounced northward migration beyond 18° N in August 2024, the vertical ascent within the traditional 15–18° N latitudinal belt was weaker in absolute terms than its strong historical climatological counterpart, mechanically generating a positive anomaly value.
In summary, Fig. 8 demonstrates that the extreme Saharan rainfall of August 2024 was driven by an optimal dynamical-thermodynamical synergy. The exceptional low-level moisture advection previously analyzed acted in perfect harmony with a major vertical reorganization of the West African Monsoon circulation, providing the large-scale lifting engine necessary to sustain deep and widespread atmospheric destabilization over Northern Chad.
3.7 Spatial patterns of moist static energy anomalies
While the anomalous meridional-vertical overturning analyzed in Sect. 3.6 provides the deep dynamical lifting engine necessary to breach the Saharan subsidence capping, the longevity and intensity of such regional updrafts depend heavily on the continuous availability of thermal and latent energy at the surface. To map the horizontal footprint and intensity of the energy reservoir feeding this enhanced vertical circulation, it is essential to examine the spatial distribution of key atmospheric thermodynamic tracers. Consequently, this section investigates the regional patterns of low-level energy accumulation.
Figure 9 illustrates the spatial distribution of low-level (at the 850 hPa pressure level) moist static energy (MSE; shaded, kJ kg−1) anomalies and the corresponding contours of equivalent potential temperature (θe; black contours, K) anomalies over the Sahelian and Saharan sectors. As an integrative thermodynamic state variable combining sensible heat, geopotential, and latent enthalpy contributions, low-level MSE serves as a robust diagnostic tool to link sub-synoptic dynamic forcing (such as wind convergence) to the thermodynamic conditions required to fuel deep convection (Neelin and Held, 1987; Romps, 2015). To guarantee the statistical robustness of the featured structures, only highly significant anomalies exceeding twice the climatological standard deviation (> 2σ) are represented in this figure. Robust positive MSE anomalies dominate the central and eastern Saharan latitudes, displaying a well-defined zonal structure. The core of these statistically significant thermodynamic anomalies is centered between 18 and 25° N, directly encompassing the Northern Chad study area designated by the red bounding box. This spatial configuration reflects an exceptional energetic enrichment of the lower troposphere over an arid region typically characterized by a low historical energy baseline. Conversely, the weaker or absent anomalies observed further south imply a significant northward shift of the moist monsoon energy reservoir into the Saharan transition zone. In accordance with the theoretical framework of Romps (2015), the accumulation of high boundary-layer MSE shifts the ascending air parcel's moist adiabat, directly maximizing its thermal buoyancy integral aloft and unlocking the potential for deep convective initiation. The contours of anomalies exhibit a spatial geometry that perfectly mirrors the MSE fields, with isolines strictly bounding the core of the energy maxima. The tight spatial co-location between the maximum MSE shading and the elevated θe contours highlights their direct thermodynamic covariation arising from shared conservation properties during moist adiabatic displacements within the planetary boundary layer. The northward extension of the 6 and 10 K anomaly contours deep into the Sahara Desert confirms that the observed regional warming and moisture enrichment were co-dependent, fueled by the intense horizontal advection of moist monsoonal air coupled with anomalous surface diabatic heating. This closely coupled MSE-θe configuration marks a profound reorganization of the regional desert thermodynamic environment relative to its baseline. Such persistent, large-scale positive energy anomalies exceeding the 2σ threshold are recognized precursors to extreme rainfall over West Africa when spatially aligned with lower-tropospheric convergent dynamic structures (Taylor et al., 2017). In a broader context, the heavy lower-tropospheric energy loading illustrated in Fig. 9 is consistent with recent mechanistic views linking the intensification of the West African monsoon system to a higher frequency of intense rainfall over North Africa (Biasutti, 2019). This thermodynamic configuration highlights the role of atmospheric moisture preconditioning and its interaction with the Sahelian dryline boundary, which are critical precursors for driving high-impact convective extremes across the region (Vizy and Cook, 2022). The accumulation of high surface MSE over Northern Chad acted as a powerful thermodynamic primer; once matched with the persistent 850 hPa wind convergence and moisture pump documented in the preceding sections, it sustained the development and longevity of the severe convective systems observed in August 2024. This synergy aligns perfectly with the regional-scale mechanisms described by Akinsanola and Zhou (2019), whose moisture budget analyses demonstrate that rainfall intensification across the central and eastern Sahel is intrinsically driven by a co-forcing between dynamic convergence in the low-to-mid troposphere and the thermodynamic enrichment of surface moisture.
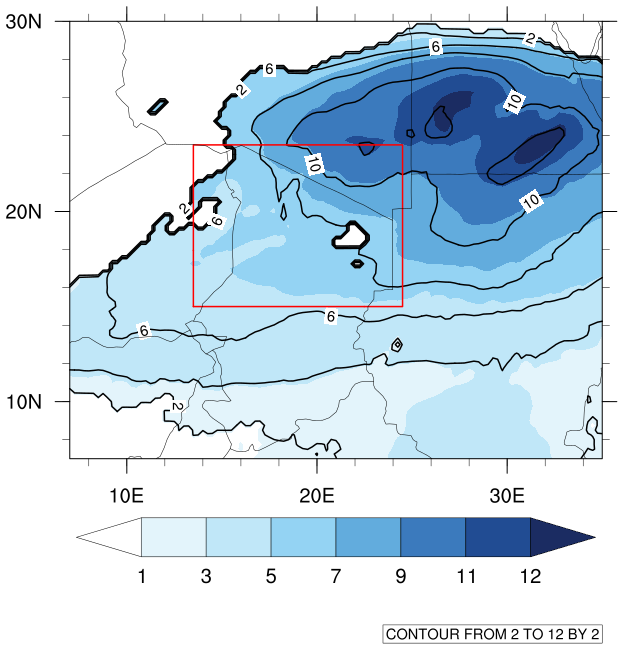
Figure 9Spatial anomalies of moist static energy (MSE; shaded, kJ kg−1) and equivalent potential temperature (θe; black contours, K) at the 850 hPa pressure level. The map illustrates the coupling between regional thermodynamic variability and the spatial organization of MSE over the Sahel-Saharan region. The superposition of these fields highlights the northward expansion of high-energy air masses and the intensification of the monsoon-related energy reservoir.
3.8 Socio-economic impacts of the August 2024 extreme event
In 2024, Chad experienced the most catastrophic flooding in its recorded history. Nationwide, the impact was profound: nearly 2 million people were affected, resulting in 576 confirmed fatalities. The floods submerged approximately 432 800 ha of agricultural land, destroyed 217 700 homes, and led to the loss of 72 100 head of livestock. Furthermore, infrastructure damage was extensive, with 3058 schools severely impacted. Geographically, the crisis was universal, affecting all 23 provinces. Notably, the Saharan provinces, typically spared due to their hyper-arid climate, suffered disproportionately heavy losses.
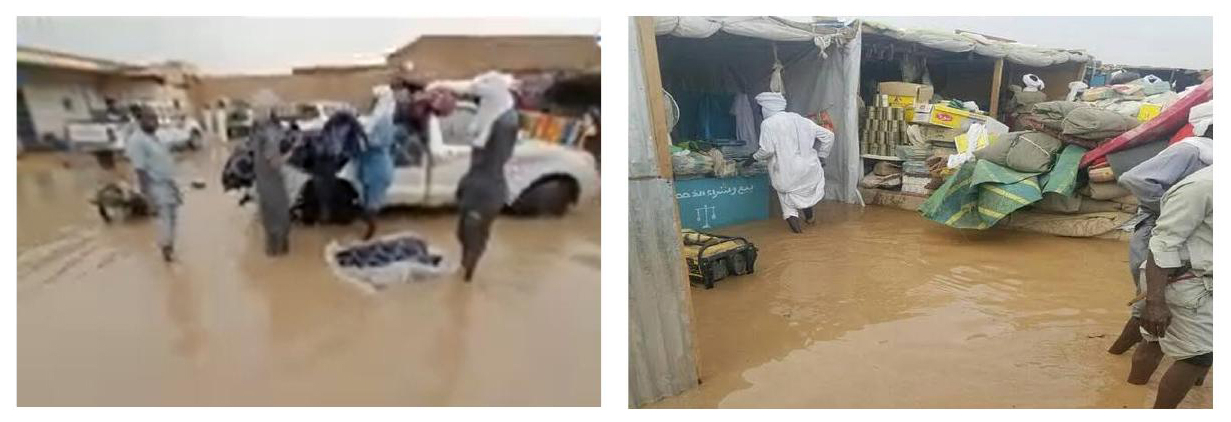
Figure 10Flooded streets and commercial stalls at the Faya-Largeau market (Source: Tchad Info Société).
In the desert zone, initial warnings were issued in July as flooding began in the south. However, torrential rains struck the northern desert region with unprecedented intensity between 9 and 14 August 2024. National meteorological records documented 126.5 mm of rainfall over eight days in areas where total annual precipitation rarely reaches 100 mm (Tchadinfos). These levels represent the highest rainfall totals in 60 years. Visual evidence (Fig. 10) corroborates these records, showing water levels reaching knee-depth at the Faya-Largeau market, where commercial and material losses were severe.
Within the specific study area, the flooding impacts are categorized by human displacement, mortality, agricultural devastation, and infrastructural loss. While national reports often aggregate these figures, detailed provincial data is typically only prioritized where significant losses of life occur. Consequently, the situations in Borkou (4 deaths) and Tibesti (60 deaths) are better documented than in the Ennedi provinces, which reported no fatalities. However, OCHA situational reporting as of 1 October 2024, allows for a more granular assessment of the affected populations across all study provinces. This disparity highlights the critical need for developing nations to enhance civil protection services and systematic data collection during hydrometeorological disasters (Saha et al., 2018; Mazhin et al., 2021). Table 2 presents the damage breakdown for each province covered by this study.

Beyond the quantified losses in Table 2, the regional economy, heavily reliant on trade and mining, suffered significant shocks. Thousands of shops were destroyed, and merchandise was lost. In the Tibesti region, gold mining operations suffered immense equipment losses. A particularly grave secondary hazard emerged as the 2024 floods unearthed thousands of landmines remaining from previous conflicts, creating a long-term security and humanitarian risk for the local population.
This study elucidates the atmospheric mechanisms and long-term hydro-climatic shifts driving the unprecedented, record-breaking rainfall event observed in August 2024 across the hyper-arid Chadian Sahara (16–24° N, 13–25° E), while documenting its catastrophic socio-economic impacts. Based on a 42-year climatological reference period (1983–2024), the results demonstrate that, far from being an isolated synoptic fluctuation or one unrelated to other phenomena, the historical anomaly observed in August 2024 represents the ultimate manifestation of a persistent and statistically significant trend toward increased humidity over several decades. This long-term transition, evident since the early 2000s, is characterized by a gradual trend toward increased atmospheric moisture content, with a +59.2 % rise in integrated water vapor transport (IVT). This altered baseline, which has grown wetter over recent decades, has maximized regional vulnerability to extreme monsoon precipitation, structurally shifting the regional hazard paradigm from perpetual hyper-aridity to severe hydrological risks.
On a regional scale, the exceptional magnitude of the August 2024 event is evidenced by accumulated monthly rainfall totals that reached up to 250–400 mm over the rugged topographies of the Tibesti, Borkou, and Ennedi massifs, representing the highest rainfall totals in 60 years. These accumulations correspond to extraordinary standardized anomalies systematically exceeding +8σ (and locally transcending +12σ), which are shown to be statistically significant (p ≤ 0.05) via grid-point Monte Carlo testing. Parametric probability frameworks reveal that this rainfall plume represents a centennial to multi-centennial phenomenon, with return periods estimated between 124.5 years (CHIRPS) and 451.4 years (TAMSAT). This extreme pluviometric response was sustained by an unprecedented, vertically coherent thermodynamic loading, wherein monthly specific humidity at 925 and 850 hPa, alongside Total Column Water Vapor (TCWV), reached their absolute historical records (97.67th empirical percentile), establishing a highly conducive, moisture-saturated column over the Saharan interior.
The synthesis of atmospheric diagnostics reveals that this record-breaking event was governed by an optimal, highly synchronized dynamic-thermodynamic coupling. Synoptically, the first half of the month was intensely triggered by high-amplitude African Easterly Waves (AEWs) between 10 and 14 August, acting as a powerful dynamic conveyor belt for low-latitude moisture advection. On a monthly scale, this transient wave activity drove a radical breakdown of the typical desert circulation, forcing a profound northward migration of the Intertropical Front (ITF), which reached latitudes of 20–22° N, supported by a synchronized intensification of the West African Monsoon (WAM).
Consequently, the climatological low-level divergence and mid-tropospheric subsidence capping that historically stabilize the desert interior were completely replaced by robust 850 hPa wind convergence anomalies, a sharp increase in lower-tropospheric specific humidity, and an uninterrupted, deep vertical ascending chimney reaching the upper troposphere (∼ 200 hPa). This is evidenced by pronounced negative ω anomalies extending from the lower to the upper troposphere, which perfectly coupled in space with robust lower-tropospheric moist static energy (MSE) and equivalent potential temperature (θe, derived via Bolton's formulation) anomalies exceeding the 2σ statistical threshold over Northern Chad. This substantial energetic loading indicates a profound thermodynamic enrichment of the atmospheric column in regions typically dominated by dry air and moisture deficits.
The accumulation of high boundary-layer energy acted as a powerful thermodynamic primer; once matched with the persistent low-level convergence pump and horizontal moisture advection, it provided the necessary instability to sustain the vertical lifting and longevity of the convective systems, resulting in the exceptional rainfall totals observed.
The socio-economic consequences of this hydroclimatic shift were historically devastating. On a national scale, the floods affected nearly 2 million people, claiming 576 lives, submerging 432 800 ha of agricultural land, and destroying 217 700 homes and 3058 schools. Within the hyper-arid study domain, the impacts were severe and spatially heterogeneous: the Borkou province recorded over 67 000 affected individuals and the destruction of 23 174 structures, while the Tibesti region suffered a heavy human toll with 60 confirmed fatalities. Beyond structural and livestock losses, the severe rainfall caused major economic shocks to local trade and gold mining operations due to massive equipment destruction. Crucially, the floods generated a grave secondary humanitarian hazard by unearthing thousands of conflict-era landmines, introducing long-term security risks for local populations.
Finally, the scale of this disaster underscores the profound vulnerability of hyper-arid regions to sudden hydrological hazards. Given that the observed intensification of the regional hydrological cycle suggests an increasing recurrence of such high-impact convective extremes under global climate change, there is an urgent need for regional authorities to transition from reactive disaster management to proactive climate adaptation strategies. Furthermore, these findings provide a robust empirical benchmark for improving the representation of monsoon-desert interfaces in climate models, highlighting the necessity for future research utilizing high-resolution convection-permitting simulations to track the long-term evolution of these saharan hydroclimatic shifts.
Figures shown in this study are plotted using the NCAR Command Language (NCL; https://doi.org/10.5065/D6WD3XH5, NCAR Command Language, 2017) and QGIS. Codes can be obtained from the corresponding author.
The ERA5 data were obtained from the Copernicus Climate Change Service (C3S) Climate Data Store (https://cds.climate.copernicus.eu, last access: 31 January 2026). Climate Hazards Group InfraRed Precipitation with Station data (CHIRPS) is available through https://www.chc.ucsb.edu/data/chirps3 (last access: 31 January 2026). The TAMSAT rainfall estimates and derived products are based on Meteosat thermal infra-red (TIR) imagery provided by EUMETSAT (https://data.tamsat.org.uk/data-download/rainfall/, last access: 31 January 2026).
CWT: conceptualization; data analysis; formal analysis; investigation; methodology; writing original draft; project administration; review and editing. FS: supervision; conceptualization; data analysis; investigation; project administration; writing original draft; review and editing. ATT: methodology; resources; validation; writing; review; project administration and editing.
The contact author has declared that none of the authors has any competing interests.
Publisher's note: Copernicus Publications remains neutral with regard to jurisdictional claims made in the text, published maps, institutional affiliations, or any other geographical representation in this paper. The authors bear the ultimate responsibility for providing appropriate place names. Views expressed in the text are those of the authors and do not necessarily reflect the views of the publisher.
The authors thank all the observational and reanalysis data providers used in this study and the research of the International Joint Laboratory “Dynamics of Terrestrial Ecosystems in Central Africa: A Context of Global Changes” (IJL DYCOCA/LMI DYCOFAC).
The authors acknowledge the use of Gemini AI (Google) for linguistic refinement and stylistic editing of the manuscript.
This paper was edited by Peter Knippertz and reviewed by Christophe Lavaysse and Erwan Cornillault.
Adeyeri, O. E.: Hydrology and climate change in Africa: Contemporary challenges and future resilience pathways, Water, 17, 2247, https://doi.org/10.3390/w17152247, 2025
Adeyeri, O. E., Lawin, A. E., Laux, P., Ishola, K. A., and Ige, S. O.: Analysis of climate extreme indices over the Komadugu-Yobe basin Lake Chad region: Past and future occurrences, Weather and Climate Extremes, 23, 100194, https://doi.org/10.1016/j.wace.2019.100194, 2019.
Akinsanola, A. A. and Zhou, W.: Dynamic and thermodynamic factors controlling increasing summer monsoon rainfall over the West African Sahel, Clim. Dynam., 52, 4501–4514, https://doi.org/10.1007/s00382-018-4394-x, 2019.
Allan, R. P. and Soden, B. J.: Atmospheric warming and the amplification of precipitation extremes, Science, 321, 1481–1484, https://doi.org/10.1126/science.1160787, 2008.
Awoleye, P. O., Adebiyi, A. A., Abiodun, B. J., Balogun, I. A., Akinbobola, A., Oluleye, A., and Ajayi, V. O.: Moisture and dust in motion: The dual role of integrated vapour transport over West Africa, Theor. Appl. Climatol., 156, 666, https://doi.org/10.1007/s00704-025-05913-1, 2025.
Biasutti, M.: Rainfall trends in the African Sahel: Characteristics, processes, and causes, WIREs Climate Change, 10, e591, https://doi.org/10.1002/wcc.591, 2019.
Bolton, D.: The computation of equivalent potential temperature, Mon. Weather Rev., 108, 1046–1053, https://doi.org/10.1175/1520-0493(1980)108<1046:TCOEPT>2.0.CO;2, 1980.
Brandt, M., Mbow, C., Diouf, A. A., Verger, A., Samimi, C., and Fensholt, R.: Ground- and satellite-based evidence of the biophysical mechanisms behind the greening Sahel, Glob. Change Biol., 21, 1610–1620, https://doi.org/10.1111/gcb.12807, 2015.
Cook, K. H. and Vizy, E. K.: Hydrodynamics of regional and seasonal variations in Congo Basin precipitation, Springer Science and Business Media LLC, 59, 1775–1797, https://doi.org/10.21203/rs.3.rs-879134/v1, 2021.
Ehtasham, L., Sherani, S. H., and Nawaz, F.: Acceleration of the hydrological cycle and its impact on water availability over land: An adverse effect of climate change, Meteorology Hydrology and Water Management, 12, https://doi.org/10.26491/mhwm/188920, 2024.
Ferreira, T. M., Trigo, R. M., Gaspar, T. H., Pinto, J. G., and Ramos, A. M.: The record-breaking precipitation event of December 2022 in Portugal, Nat. Hazards Earth Syst. Sci., 25, 609–623, https://doi.org/10.5194/nhess-25-609-2025, 2025.
Flamant, C., Knippertz, P., Fink, A. H., Akpo, A., Brooks, B., Chiu, C. J., Coe, H., Danuor, S., Evans, M., Jegede, O., Kalthoff, N., Konaré, A., Liousse, C., Lohou, F., Mari, C., Schlager, H., Schwarzenboeck, A., Adler, B., Amekudzi, L., and Yoboué, V.: The dynamics–aerosol–chemistry–cloud interactions in west africa field campaign: Overview and research highlights, B. Am. Meteorol. Soc., 99, 83–104, https://doi.org/10.1175/bams-d-16-0256.1, 2018.
Gimeno, L., Nieto, R., Vázquez, M., and Lavers, D. A.: Atmospheric rivers: A mini-review, Front. Earth Sci., 2, 2, https://doi.org/10.3389/feart.2014.00002, 2014.
Gimeno, L., Dominguez, F., Nieto, R., Trigo, R., Drumond, A., Reason, C. J. C., Taschetto, A. S., Ramos, A. M., Kumar, R., and Marengo, J.: Major mechanisms of atmospheric moisture transport and their role in extreme precipitation events, Annu. Rev. Environ. Resour., 41, 117–141, https://doi.org/10.1146/annurev-environ-110615-085558, 2016.
Hersbach, H., Bell, B., Berrisford, P., Hirahara, S., Horányi, A., Muñoz-Sabater, J., Nicolas, J., Peubey, C., Radu, R., Schepers, D., Simmons, A., Soci, C., Abdalla, S., Abellan, X., Balsamo, G., Bechtold, P., Biavati, G., Bidlot, J., Bonavita, M., De Chiara, G., Dahlgren, P., Dee, D., Diamantakis, M., Dragani, R., Flemming, J., Forbes, R., Fuentes, M., Geer, A., Haimberger, L., Healy, S., Hogan, R. J., Hólm, E., Janisková, M., Keeley, S., Laloyaux, P., Lopez, P., Lupu, C., Radnoti, G., de Rosnay, P., Rozum, I., Vamborg, F., Villaume, S., and Thépaut, J.: The ERA5 global reanalysis, Q. J. Roy. Meteor. Soc., 146, 1999–2049, https://doi.org/10.1002/qj.3803 , 2020.
Holloway, C. E. and Neelin, J. D.: Moisture vertical structure, column water vapor, and tropical deep convection, J. Atmos. Sci., 66, 1665–1683, https://doi.org/10.1175/2008jas2806.1, 2009.
Janicot, S., Thorncroft, C. D., Ali, A., Asencio, N., Berry, G., Bock, O., Bourles, B., Caniaux, G., Chauvin, F., Deme, A., Kergoat, L., Lafore, J.-P., Lavaysse, C., Lebel, T., Marticorena, B., Mounier, F., Nedelec, P., Redelsperger, J.-L., Ravegnani, F., Reeves, C. E., Roca, R., de Rosnay, P., Schlager, H., Sultan, B., Tomasini, M., Ulanovsky, A., and ACMAD forecasters team: Large-scale overview of the summer monsoon over West Africa during the AMMA field experiment in 2006, Ann. Geophys., 26, 2569–2595, https://doi.org/10.5194/angeo-26-2569-2008, 2008.
Johannsen, F., Ermida, S., Martins, J., Trigo, I. F., Nogueira, M., and Dutra, E.: Cold bias of ERA5 summertime daily maximum land surface temperature over iberian peninsula, Remote Sens., 11, 2570, https://doi.org/10.20944/preprints201909.0268.v1, 2019.
Kenfack, K., Marra, F., Djomou, Z. Y., Tchotchou, L. A. D., Tamoffo, A. T., and Vondou, D. A.: Dynamic and thermodynamic contribution to the October 2019 exceptional rainfall in western central Africa, Weather Clim. Dynam., 5, 1457–1472, https://doi.org/10.5194/wcd-5-1457-2024, 2024.
Kenfack, K., Djiotang Tchotchou, L. A., Marra, F., Bellomo, K., Tamoffo, A. T., Tchana, B. C., Donfack, F. C., Fotso-Nguemo, T. C., Tanessong, R. S., Djomou, Z. Y., and Vondou, D. A.: Radiative anomalies associated with extreme precipitation of November 2023 in equatorial Central Africa, Atmos. Res., 321, 108090, https://doi.org/10.1016/j.atmosres.2025.108090, 2025.
Kiladis, G. N., Thorncroft, C. D., and Hall, N. M. J.: Three-dimensional structure and dynamics of African easterly waves. Part i: Observations, J. Atmos. Sci., 63, 2212–2230, https://doi.org/10.1175/jas3741.1, 2006.
Lafore, J. P., Biasutti, M., Knippertz, P., and Taylor, C.: The west african monsoon. In World Scientific Series on Asia-Pacific Weather and Climate, World Scientific, 35–49, https://doi.org/10.1142/9789813200913_0004, 2017.
Lavaysse, C., Flamant, C., Janicot, S., Parker, D. J., Lafore, J.-P., Sultan, B., and Pelon, J.: Seasonal evolution of the West African heat low: A climatological perspective, Clim. Dynam., 33, 313–330, https://doi.org/10.1007/s00382-009-0553-4 , 2009.
Livezey, R. E. and Chen, W. Y.: Statistical Field Significance and its Determination by Monte Carlo Techniques, Mon. Weather Rev., 46–59, https://doi.org/10.1175/1520-0493(1983)111 <0046:sfsaid>2.0.co;2, 1983.
Maidment, R. I., Grimes, D., Allan, R. P., Tarnavsky, E., Stringer, M., Hewison, T., Roebeling, R., and Black, E.: The 30 year TAMSAT African Rainfall Climatology And Time series (TARCAT) data set, J. Geophys. Res.-Atmos., 119, 10619–10644, https://doi.org/10.1002/2014jd021927, 2014.
Maidment, R. I., Grimes, D., Black, E., Tarnavsky, E., Young, M., Greatrex, H., Allan, R. P., Stein, T., Nkonde, E., Senkunda, S., and Alcántara, E. M. U.: A new, long-term daily satellite-based rainfall dataset for operational monitoring in Africa, Sci. Data, 4, 170063, https://doi.org/10.1038/sdata.2017.63, 2017.
Makkonen, L.: Plotting positions in extreme value analysis, J. Appl. Meteorol. Clim., 45, 334–340, https://doi.org/10.1175/jam2349.1, 2006.
Mazhin, S. A., Farrokhi, M., Noroozi, M., Roudini, J., Hosseini, S. A., Motlagh, M. E., Kolivand, P., and Khankeh, H.: Worldwide disaster loss and damage databases: A systematic review, Journal of Education and Health Promotion, 10, 329, https://doi.org/10.4103/jehp.jehp_1525_20, 2021.
Neelin, J. D. and Held, I. M.: Modeling tropical convergence based on the moist static energy budget, Mon. Weather Rev., 11, 3–12, https://doi.org/10.1175/1520-0493(1987)115 <0003:mtcbot>2.0.co;2, 1987.
Ngavom, Z., Fotso-Nguemo, T. C., Vondou, D. A., Fotso-Kamga, G., Zebaze, S., Yepdo, Z. D., and Diedhiou, A.: Projected changes in population exposure to extreme precipitation events over Central Africa under the global warming levels of 1.5 °C and 2 °C: Insights from CMIP6 simulations, Modeling Earth Systems and Environment, 10, 5753–5769, https://doi.org/10.1007/s40808-024-02091-3, 2024.
Nicholson, S. E.: Dryland climatology, Cambridge University Press, https://doi.org/10.1175/1520-0469(1990)047<3067:atfllm>2.0.co;2, 2011.
Nicholson, S. E.: The west african sahel: A review of recent studies on the rainfall regime and its interannual variability, ISRN Meteorology, 2013, 1–32, https://doi.org/10.1155/2013/453521, 2013.
Nicholson, S. E., Fink, A. H., and Funk, C.: Assessing recovery and change in West Africa’s rainfall regime from a 161‐year record, Int. J. Climatol., 38, 3770–3786, https://doi.org/10.1002/joc.5530, 2018.
Nour, A. M., Abderamane, H., Ngatcha, B. N., Deschamps, P., and Bouchez, C.: Characterization and Aquifer Functioning System of Haraz Al Biar (North Chari Baguirmi), International Journal of Current Research and Academic Review, 5, 52–64, https://doi.org/10.20546/ijcrar.2017.512.008, 2017.
OCHA: TCHAD: Situation des inondations Rapport de situation no 03 (01/10/2024), United Nations Office for the Coordination of Humanitarian Affairs, https://doi.org/10.1175/1520-0442(2003)016<3389:twamdp>2.0.co;2, 2024.
Parker, D. J., Burton, R. R., Diongue-Niang, A., Ellis, R. J., Felton, M., Taylor, C. M., Thorncroft, C. D., Bessemoulin, P., and Tompkins, A. M.: The diurnal cycle of the West African monsoon circulation, Q. J. Roy. Meteor. Soc., 131, 2839–2860, https://doi.org/10.1256/qj.04.52, 2005.
Pausata, F. S. R., Emanuel, K. A., Chiacchio, M., Diro, G. T., Zhang, Q., Sushama, L., Stager, J. C., and Donnelly, J. P.: Tropical cyclone activity enhanced by Sahara greening and reduced dust emissions during the African Humid Period, P. Natl. Acad. Sci. USA, 114, 6221–6226, https://doi.org/10.1073/pnas.1619111114, 2017.
Pausata, F. S. R., Gaetani, M., Messori, G., Berg, A., Maia de Souza, D., Sage, R. F., and deMenocal, P. B.: The greening of the Sahara: Past changes and future implications, One Earth, 2, 235–250, https://doi.org/10.1016/j.oneear.2020.03.002, 2020.
Raimond, C., Boukar, H., Bouba, D., Boubakary, S., and Pennec, F.: Migrations des agriculteurs et de leurs plantes: une recomposition de l’agro-biodiversité à l’échelle régionale, Les Cahiers d’Outre-Mer, 67, 195–224, https://doi.org/10.4000/com.7176, 2014.
Raymond, D. J. and Jiang, H.: A theory for long-lived mesoscale convective systems, J. Atmos. Sci., 47, 3067–3077, https://doi.org/10.1175/1520-0493(1998)126<0725:apafmf>2.0.co;2, 1990.
Romps, D. M.: MSE Minus CAPE is the True Conserved Variable for an Adiabatically Lifted Parcel, J. Atmos. Sci., 72, 3639–3646, https://doi.org/10.1175/jas-d-15-0054.1, 2015.
Saha, F., Tchio, N. D., Tchindjang, M., Voundi, É., and Mbevo, F. P.: Production of so-called “natural” risks in major urban centers of Cameroon, Nat. Sci. Soc., 26, 418–433, https://doi.org/10.1051/nss/2019003, 2018.
Saha, F., Tchindjang, M., Dzana, J. G., and Nguemadjita, D.: Natural hazards in the Far- North Region of Cameroon and the hydrological extremes dynamics of the Chari-Logone system. Physio-Géo, Physical Geography and Environment, 15, 69–88, https://doi.org/10.4000/physio-geo.10719, 2020.
Selami, N., Sèze, G., Gaetani, M., Grandpeix, J.-Y., Flamant, C., Cuesta, J., and Benabadji, N.: Cloud cover over the Sahara during the summer and associated circulation features, Atmosphere, 12, 428, https://doi.org/10.3390/atmos12040428, 2021.
Sen, P. K.: Estimates of the regression coefficient based on kendall's tau, J. Am. Stat. Assoc., 63, 1379–1389, https://doi.org/10.1080/01621459.1968.10480934, 1968.
Seneviratne, S. I., Zhang, X., Adnan, M., Badi, W., Dereczynski, C., Luca, A. D., and Allan, R.: Weather and climate extreme events in a changing climate, Working group I contribution to the sixth assessment report of the IPCC, 1513–1766, https://doi.org/10.1017/9781009157896.013, 2021.
Sindikubwabo, C., Li, R., and Wang, C.: Abrupt change in Sahara precipitation and the associated circulation patterns, Atmos. Clim. Sci., 8, 262–273, https://doi.org/10.4236/acs.2018.82017, 2018.
Siwe, A. N., Sandjon, A. T., Tchotchou, L. A. D., Tchinda, C. W., Vondou, D. A., and Nzeukou, A.: Study the impact of intraseasonal oscillations on water vapour transport in central africa: The case of 25–70 day oscillations, Int. J. Climatol., 46, e70150, https://doi.org/10.1002/joc.70150, 2025.
Ssenyunzi, R. C., Oruru, B., D'ujanga, F. M., Realini, E., Barindelli, S., Tagliaferro, G., von Engeln, A., and van de Giesen, N.: Performance of ERA5 data in retrieving Precipitable Water Vapour over East African tropical region, Adv. Space Res., 65, 1877–1893, https://doi.org/10.1016/j.asr.2020.02.003, 2020.
Sultan, B. and Janicot, S.: The West African monsoon dynamics, Part II: The “preonset” and “onset” of the summer monsoon, J. Climate, 16, 3407–3427, https://doi.org/10.1175/1520-0442016, 2003.
Sultan, B., Janicot, S., and Diedhiou, A.: The west african monsoon dynamics Part I: Documentation of intraseasonal variability, J. Climate, 16, 3389–3406, https://doi.org/10.1017/cbo9780511973840, 2003.
Tamoffo, A. T., Weber, T., and Saleem, F.: Population exposed to compound extreme hot and humid and wet and windy events in Africa, Environ. Res. Lett., 20, 014038, https://doi.org/10.1088/1748-9326/ad9d5f, 2024a.
Tamoffo, A. T., Weber, T., Cabos, W., Monerie, P.-A., Cook, K. H., Sein, D. V., and Jacob, D.: West african monsoon system's responses to global ocean–regional atmosphere coupling, J. Climate, 37, 4291–4312, https://doi.org/10.1175/jcli-d-23-0749.1, 2024b.
Tamoffo, A. T., Mouassom, F. L., Weber, T., Ghomsi, F. E. K., and Nana, H. N.: Pattern recognition of West African monsoon extreme rainfall events using convolutional neural networks, Geophys. Res. Lett., 53, e2026GL124425, https://doi.org/10.1029/2026gl124425, 2026a.
Tamoffo, A. T., Mouassom, F. L., Weber, T., and Jacob, D.: Constraining high-emission future West African monsoon with physics-weighted deep learning ensembles, Commun. Earth Environ., 7, https://doi.org/10.1038/s43247-026-03839-8, 2026b.
Tarek, M., Brissette, F. P., and Arsenault, R.: Evaluation of the ERA5 reanalysis as a potential reference dataset for hydrological modelling over North America, Hydrol. Earth Syst. Sci., 24, 2527–2544, https://doi.org/10.5194/hess-24-2527-2020, 2020.
Taylor, C. M., Belušić, D., Guichard, F., Parker, D. J., Vischel, T., Bock, O., Harris, P. P., Janicot, S., Klein, C., and Panthou, G.: Frequency of extreme Sahelian storms tripled since 1982 in satellite observations, Nature, 544, 475–478, https://doi.org/10.1038/nature22069, 2017.
Tchana, B. C., Djomou, Z. Y., Kenfack, K., Tamoffo, A. T., Mouassom, F. L., Tchotchou, L. A. D., Vondou, D. A., and Mbane, C. B.: Analysis of air temperature anomalies during abnormal rainfall events in Western Central Africa from September to November 2023, Theor. Appl. Climatol., 156, 288, https://doi.org/10.1007/s00704-025-05528-6, 2025.
Tchinda, C. W., Sandjon, A. T., Tchotchou, A. L. D., Vondou, D. A., and Nzeukou, A.: Impact of the 25–70 day intraseasonal oscillation on extreme rainfall distribution over Central Africa, Journal of the European Meteorological Society, 4, 100035, https://doi.org/10.1016/j.jemets.2026.100035, 2026.
Trenberth, K. E., Fasullo, J. T., and Shepherd, T. G.: Attribution of climate extreme events, Nature Climate Change, 5, 725–730, https://doi.org/10.1038/nclimate2657, 2015.
UNESCO: Map of the world distribution of arid regions: explanatory note, https://www.unocha.org/publications/report/chad/ (last access: 15 August 2026), 1977.
Vizy, E. K. and Cook, K. H.: Distribution of extreme rainfall events and their environmental controls in the West African Sahel and Soudan, Clim. Dynam., 59, 997–1026, https://doi.org/10.1007/s00382-022-06171-x, 2022.
Vondou, D. A., Maranan, M., Fink, A. H., and Knippertz, P.: Meteorological conditions leading to a catastrophic, rain-induced landslide in Cameroon in October 2019, Q. J. Roy. Meteor. Soc., 152, e70066, https://doi.org/10.1002/qj.70066, 2025.
Wainwright, C. M., Finney, D. L., Kilavi, M., Black, E., and Marsham, J. H.: Extreme rainfall in East Africa, October 2019–January 2020 and context under future climate change, Weather, 76, 26–31, https://doi.org/10.1002/wea.3824, 2021.
Wamba Tchinda, C., Tchakoutio Sandjon, A., Djiotang Tchotchou, A. L., Nzeudeu Siwe, A., Vondou, D. A., and Nzeukou, A.: The influence of intraseasonal oscillations on rainfall variability over Central Africa: Case of the 25–70 days variability, Sci. Rep., 13, 19842, https://doi.org/10.1038/s41598-023-46346-y, 2023.
Zhang, W., Zhou, T., Ye, W., Zhang, T., Zhang, L., Wolski, P., Risbey, J., Wang, Z., Min, S.-K., Ramsay, H., Brody, M., Grimm, A., Clark, R., Ren, K., Jiang, J., Chen, X., Fu, S., Li, L., Tang, S., and Hu, S.: A year marked by extreme precipitation and floods: Weather and climate extremes in 2024, Adv. Atmos. Sci., 42, 1045–1063, https://doi.org/10.1007/s00376-025-4540-4, 2025.
Zhu, Y. and Newell, R. E.: A proposed algorithm for moisture fluxes from atmospheric rivers, Mon. Weather Rev., 126, 725–735, https://doi.org/10.1175/1520-0493(1998)126<0725:apafmf>2.0.co;2, 1998.