
the Creative Commons Attribution 4.0 License.
the Creative Commons Attribution 4.0 License.
 | 14 Oct 2026
A composite-based analysis of the dynamical linkage of atmospheric rivers, warm conveyor belts, and extratropical cyclones
Tiago M. Ferreira

Ricardo M. Trigo
Joaquim G. Pinto
Julian Quinting
Svenja Christ
Alexandre M. Ramos
Extratropical cyclones (ETCs), warm conveyor belts (WCBs), and atmospheric rivers (ARs) are dynamically connected features key to understanding midlatitude weather and hydroclimate. However, the precise spatial and temporal coupling between the moisture transport in ARs and the ascent in ETC's associated WCBs remains poorly understood. Therefore, this study employs a composite-based analysis, combining probabilistic footprints of WCB identification and Eulerian AR detection for the North Atlantic extended winter (October–March) using ERA5 reanalysis. We evaluate composite fields relative to AR centroids, differentiating between events where the WCB ascent phase is present within the AR plume from those where it is absent. Our results demonstrate that ARs overlapping with WCBs are characterized by stronger vertically integrated vapor transport, a wider AR plume, and, most critically, a shift of precipitation maxima northeast of the AR axis, aligning with the region of strongest frontal ascent near the associated ETC. In contrast, ARs where the ascent phase is absent exhibit weaker vertically integrated vapor transport values and a diffuse precipitation to the northeast towards the cyclone. Finally, temporal composites centered on the ETC's maximum deepening point (MDP) reveal a phased evolution: while peak WCB inflow precedes the MDP, peak WCB ascent and AR-related precipitation coincide with the MDP, and peak WCB outflow follows, illustrating a tightly coupled feedback loop.
- Article
(10402 KB) - Full-text XML
-
Supplement
(864 KB) - BibTeX
- EndNote


Extratropical cyclones (ETCs) are responsible for significant weather hazards such as strong winds, extreme precipitation, and strong temperature gradients (Wernli et al., 2002; Fink et al., 2009; Pfahl et al., 2014). Climatologically, these cyclones develop preferentially along the Gulf Stream and North Atlantic Current, a region of enhanced baroclinicity, before tracking northeastward toward Iceland and the Norwegian Sea (Hoskins and Hodges, 2002; Ulbrich et al., 2009). This main storm track exhibits a distinct seasonal cycle, with maximum cyclone intensity and frequency during boreal winter due to a stronger meridional temperature gradient and an intensified jet stream (Ulbrich et al., 2009; Woollings et al., 2010). The variability of the North Atlantic storm track is closely linked to large-scale teleconnection patterns, such as the North Atlantic Oscillation (NAO), which modulates the latitudinal position and strength of cyclone activity (Trigo et al., 2002; Woollings and Blackburn, 2012). The classical structure of an ETC is characterised by a warm front, a cold front, and a warm sector, features that were first synthesised in the Norwegian Cyclone Model more than a century ago (Bjerknes and Solberg, 1922). As reviewed by Dacre (2020), subsequent observational and modelling studies have refined this conceptual view, revealing additional features such as the dry intrusion, the conveyor-belt airflow (warm and cold conveyors), and the occluded front. More recent research, summarised by Schultz et al. (2019), has emphasised that ETCs are fundamentally three-dimensional, tropopause-reaching structures. Their evolution is governed by the interaction between lower-tropospheric baroclinicity and upper-level potential vorticity anomalies.
Within these systems, two crucial moisture transport mechanisms are often present: warm conveyor belts (WCBs) and atmospheric rivers (ARs). Both WCBs and ARs play pivotal roles in the global hydrological cycle and are often associated with extreme weather events (Pfahl et al., 2014; Catto et al., 2015; Ramos et al., 2018a, b). Nevertheless, their precise dynamical relationship remains an active area of research: although the definition of ARs (Ralph et al., 2018) states that they align with the low-level jet and warm sector of ETCs, the spatial coincidence between the core of maximum integrated vapor transport (IVT) defining an AR and the region of strongest WCB ascent is often not given. Recently, it has been suggested that understanding the intricate interactions between ETCs, WCBs, and ARs is crucial for enhancing weather forecasting and climate projections (Lopez-Marti et al., 2025).
WCBs are coherent, rapidly ascending airstreams originating in the lower troposphere within the warm sector of an ETC, transporting warm, moist air poleward and upward towards the upper troposphere and lower stratosphere (Carlson, 1980; Wernli, 1997; Catto et al., 2010; Wernli and Gray, 2024). This ascent leads to significant latent heat release through condensation, which can intensify the cyclone and contribute to the formation of extensive cloud bands and precipitation (Binder et al., 2016; Wernli and Gray, 2024). The strength of WCBs has been moderately to strongly correlated with cyclone intensification, as quantified by the normalized maximum 24 h central sea level pressure deepening (Binder et al., 2016). Recent studies highlight that while classical WCBs are characterized by continuous ascent, embedded convection with ascent rates exceeding 50 hPa h−1 can occur, influencing their moisture transport characteristics and cloud properties (Oertel et al., 2019; Schwenk and Miltenberger, 2024). Much of this embedded convection is organized by conditional symmetric instability (CSI), a slantwise instability common in midlatitude frontal zones that generates uplift and can locally intensify latent heat within the WCB ascent phase (Bennetts and Sharp, 1982; Glinton et al., 2017). Moreover, the interaction between CSI and WCB ascent thus influences the vertical structure of moisture transport and may help explain spatial offsets between maximum ascent and maximum IVT. WCBs play a crucial role in redistributing moisture within cyclones, and kinematic analysis reveals how airflows within a cyclone's warm sector move rear-ward relative to the cyclone precipitation shield (Dacre et al., 2019). The ascent timescales within WCBs are critical for understanding moisture transport into the upper troposphere and lower stratosphere, impacting cloud radiative forcing (Joos, 2019; Schwenk and Miltenberger, 2024).
ARs are narrow, elongated corridors of concentrated water vapor transport in the troposphere, extending from subtropical to extratropical regions (Ralph et al., 2004; Gimeno et al., 2014; Dacre et al., 2015; Ralph et al., 2018). These systems represent the high transport of moisture, accounting for the majority of poleward water vapor transport in the midlatitudes (Gimeno et al., 2014; Dacre et al., 2015). ARs are frequently associated with extreme precipitation events when they are forced upward, for example when they make landfall over mountainous terrain or by the influence of the WCB's ascent phase, leading to flooding and providing crucial water supply (Dacre et al., 2015; Eiras-Barca et al., 2016; Ralph et al., 2018). They are usually identified using a threshold of IVT and are typically located in regions where their dynamical and thermodynamical components are relatively large throughout the depth of the lower troposphere (Dacre et al., 2019).
ARs can be considered as an integral part of the broader WCB system of ETCs (Dacre et al., 2015). Research indicates a strong statistical relationship between ARs and ETCs, with a pronounced cyclone typically located poleward and westward of the AR centroid and an anticyclone located equatorward and eastward of the AR (Guo et al., 2020). This creates a strong horizontal pressure gradient that forces moisture to be transported within the warm sector of the cyclone, where the AR is present. While a significant majority (82 %) of ARs are associated with an ETC, only about 45 % of ETCs are paired with an AR, and the spatial relationship between them can vary considerably (Zhang et al., 2019). Stronger ARs are frequently associated with explosive ETCs, with nearly 78 % of ARs over the Northern Pacific being linked to strong ETCs (Eiras-Barca et al., 2018; Peng et al., 2025). This suggests that more intense ARs are more closely related with more intense cyclones, contributing to extreme weather phenomena such as compound windstorm-flood events (Lopez-Marti et al., 2025). ARs have also been analysed in comparison with extratropical fronts by Luís et al. (2025). They found that ARs are more frequently located closer to the cold front rather than the warm front. This region, closer to the cold front, is characterized by a higher precipitation occurrence. Despite these advances, critical knowledge gaps persist regarding the precise spatial and temporal coupling between ARs and WCBs. While it is well established that ARs are often collocated with the inflow region of WCBs ahead of cold fronts (Dacre et al., 2019), the exact location of maximum ascent relative to the highest IVT remains ambiguous. Some evidence suggests that peak WCB ascent may occur along the flanks or leading edge of ARs rather than coinciding with the core of maximum moisture flux, potentially influenced by conditional symmetric instability or frontal forcing (Schwenk and Miltenberger, 2024; Dacre and Clark, 2025). Research has traditionally focused on either the dynamical structure of the cyclone and its WCB (Madonna et al., 2014; Oertel et al., 2020) or on the thermodynamical characteristics and hydrological impacts of the AR (Gershunov et al., 2017; Ralph et al., 2018; Ramos et al., 2018a, b; Zavadoff and Kirtman, 2020). To our best knowledge, a quantitative analysis that directly maps the Lagrangian analysis of the WCB onto the Eulerian AR detection has only been done by Sodemann et al. (2020), but only from an area/occurrence point of view. They found that, in winter, about 40 % of ARs occur in isolation and that around 23 % overlap with WCBs. Therefore, several research gaps persist: is the most vigorous WCB ascent co-located with the axis of maximum IVT that defines the AR core? Or does the ascent occur preferentially along the AR's flanks or leading edge, perhaps due to frontal dynamics or CSI?
In recent years, two different events, involving the connection between ARs, WCBs, and ETCs affected Portugal. Both resulted in new 24 h precipitation records, the first in Lisbon, Portugal, in December 2022 (Ferreira et al., 2025b), and the second in the Madeira Island in June 2023 (Ferreira et al., 2025a). The authors provided evidence that for both events, the WCB's inflow and ascent phases were present within the AR itself, the convergence of air (WCB inflow) created suitable conditions for moisture inflow, as the AR intensified in both moisture content and spatial extent, and also, the WCB ascent phase might have helped to intensify the precipitation occurrence, leading to both extreme events. Based on the above, and to address the research gaps presented above, this study employs a composite analysis using reanalysis data to systematically quantify the relationship between the ascent (and inflow) phase of the WCB and the spatial structure of ARs. We move beyond a purely Eulerian analysis of IVT and precipitation fields by incorporating a Lagrangian-based identification of WCB trajectories (based on a probability footprint of the different phases of the WCB). By compositing fields of IVT, mean sea level pressure (SLP), and precipitation relative to these identified ascent domains, we aim to elucidate the characteristic spatial pattern of ascent and its direct contribution to the total precipitation field.
We address the following research questions:
-
How does the presence or absence of the WCB ascent phase influence the intensity and spatial distribution of precipitation within ARs, i.e., how different are the AR characteristics when the ascent phase is present within the AR?
-
How does the AR-WCB association evolve during the lifecycle of the associated ETC particularly around the time of maximum deepening?
The structure of this manuscript is as follows: data and methods are presented in Sect. 2; the climatological context and a case study are shown in Sect. 3; the composite analysis from the AR perspective is detailed in Sect. 4; the temporal evolution around the ETC's MDP is analysed in Sect. 5; followed by discussion in Sect. 6 and conclusions in Sect. 7.
2.1 Reanalysis Data – ERA5
The data used in this study to describe the large-scale flow is the European Centre for Medium-Range Weather Forecasts (ECMWF) Reanalysis v5 (ERA5; Hersbach et al., 2020). Several fields are extracted from both the surface and at specific atmospheric levels. The former includes the SLP and total precipitation. The latter include the zonal and meridional components of the IVT, considering the entire atmospheric column. All these fields are obtained with a 0.25° latitude–longitude grid spacing and a 6-hourly temporal resolution. The IVT corresponds to the following metrics:
with
and
where g is the gravitational acceleration, q is the specific humidity, ps is the surface pressure, p is maximum pressure (usually 300 hPa), and u and v are the zonal and meridional wind components (Lavers et al., 2012). This field is internally computed by the ECMWF, from the surface to the top of the atmosphere (1 hPa), considering all 37 pressure levels available in ERA5. While the upper layer of the atmosphere holds very little humidity, using the full column is standard practise and computationally efficient, as ERA5 provides IVTu and IVTv as pre-computed, vertically integrated fields: “vertical integral of eastward water vapor flux” (IVTu) and “vertical integral of northward water vapor flux” (IVTv).
The analysis is applied to the entire North Atlantic basin and the western and central regions of Europe, ranging from 100° W to 40° E and 0 to 90° N, considering only the extended winter season (from October to March) for the period 1979 to 2023.
2.2 AR Detection method – IPART
For the detection of AR events, we have implemented and adapted the global AR tracking method developed by Xu et al. (2020) and widely used in recent years (e.g., Fernández-Alvarez et al., 2023; Ferreira et al., 2025a, b). The detection algorithm is based on thresholds at the spatiotemporal scale of ARs and is independent of the IVT thresholds. Unlike conventional methods, IPART (image-processing-based atmospheric river tracking method) is less dependent on magnitude thresholds, detecting ARs based on their spatial “spikiness” rather than absolute moisture values. This approach is particularly advantageous because it identifies ARs as transient moisture anomalies superimposed on the climatological moisture field, making the detection less sensitive to regional variations in background moisture – a critical feature when comparing events across different seasons and regions. This is achieved by the use of the “Top Hat by Reconstruction” technique (Vincent, 1993), which involves subtracting a greyscale reconstruction by dilation image from the original image (Fig. S1 in the Supplement). This greyscale reconstruction by dilation image is the background IVT content, and the original image is the non-negative IVT distribution. The latter refers to the raw/total observed IVT field (Fig. S1a), from which the smoothed large-scale environmental background (the former, Fig. S1b) is subtracted to isolate the transient IVT anomalies (Fig. S1c), in which the ARs are searched for. A threshold of 200 kg m−1 s−1 is applied to the anomaly field, and for each region the standard criteria for AR detection (length ≥ 2000 km; width < 1000 km; length width ratio > 2) are implemented. More details on this method can be found in Xu et al. (2020).
Additionally, in order to exclude tropical cyclones from the analysis, we apply both a circularity criterion with a maximum value of 0.5 (following the work of Mahto et al., 2023) and a minimum value of 1000 km to the distance between the first and last points of the AR axis, ensuring that the feature is a long, filamentary plume, distinct from the closed circulation typical of tropical cyclones. Here, an AR object corresponds to an AR detected at a timestep and an AR event as the entire lifecycle tracking. A key advantage of IPART is that it is more robust for detecting ARs in both midlatitude and polar systems, without changing settings, and in a warming climate where atmospheric moisture levels are expected to increase (Lu et al., 2025). The filtering process is relatively insensitive to the size/shape of the structuring element, providing greater tolerance to varying water vapor flux intensities. Also, the new axis identification method (developed by Xu et al., 2020) provides a physically correspondent axis that follows major flow directions, stays close to the maximum flux values, handles complex shapes, and never extends out of the AR boundary. For this, the process starts by identifying the boundary of the AR region (Fig. S1d). Moisture flux data (from the raw IVT field) is then used to classify boundary points as “entry” or “exit” nodes for moisture flow. The optimal path, or axis (light-blue points in the image below), is determined by solving a shortest-path problem (using Dijkstra's algorithm) that connects an entry point to an exit point, selecting the path that maximizes the integral of along-edge fluxes. For the centroid identification (pink dot in the image below), used as the central point throughout this study, the geographic center of the AR object, weighted by its intensity, is calculated. This weighted centroid gives more importance to areas with higher moisture transport, providing a center that is influenced by the strength of the feature.
2.3 WCB Identification – ELIAS
The method ELIAS (EuLerian Identification of Ascending AirStreams), developed by Quinting and Grams (2022), uses convolutional neural networks to predict the conditional probabilities of the WCB inflow, ascent, and outflow footprints. The model was trained on a labelled dataset where the “ground truth” for each WCB stage was defined using Lagrangian trajectories (from Madonna et al., 2014, and extended to 2016 by Sprenger et al., 2017), computed with the LAGRANTO algorithm (Wernli and Davies, 1997; Sprenger and Wernli, 2015) on a 1° × 1° horizontal grid, using the ERA-Interim dataset. Trajectories are only considered if, first, they ascend by at least 600 hPa in 48h and, second, they are matched with an ETC (Wernli and Schwierz, 2006) at least once during this 48 h period. Based on these criteria, the WCB trajectory is segmented into three phases according to vertical pressure levels: the inflow (below 800 hPa), the ascent (between 800 and 400 hPa), and the outflow (above 400 hPa). The inflow originates from the boundary layer in the warm sector of ETCs, where warm, moist air converges into the cyclone. In the ascent phase, air is carried upward across the cyclone's warm front, while the outflow phase transports it to the upper troposphere, where it can influence downstream flow.
ELIAS employs a convolutional neural network architecture that learns to recognize the spatial patterns associated with each WCB stage from two-dimensional atmospheric fields. The model uses, for each WCB stage, four different predictors (see Table 1 in Quinting and Grams, 2022) that can be calculated from temperature, geopotential height, specific humidity, horizontal wind components (u and v) at seven pressure levels (1000, 925, 850, 700, 500, 300, and 200 hPa). Additionally, a 30 d running mean trajectory-based climatology of WCB occurrence frequency is used as a fifth predictor. This set of inputs allows ELIAS to provide a computationally efficient and consistent Eulerian alternative to traditional Lagrangian trajectory calculations, offering a probabilistic footprint of WCB stages that is highly suitable for large-scale composite analysis.
The inclusion of data beyond 2016 – the final year of the ERA-Interim trajectory dataset based on which the ELIAS model was trained – justifies the use of the machine learning approach. ELIAS allows us to efficiently extend the WCB identification into recent years without the computational burden of recalculating trajectories, providing a consistent and reproducible methodology across the full 45-year period. The model has been applied to ERA5 and compared with the WCB footprints derived from the Lagrangian ERA-Interim trajectories by Christ et al. (2025), who found the results to be consistent. ELIAS outputs a continuous probability field (0–100) for each WCB phase, that creates binary masks using pre-defined thresholds. In this study, we use a probability threshold consistent with Quinting and Grams (2022) to identify WCB footprints.
2.4 ETC tracking method
The ETC tracks used in this study are based on the algorithm described by Pinto et al. (2005) based on Murray and Simmonds (1991). The algorithm is applied to the Northern Hemisphere (20 to 90° N) and involves a multi-step approach, primarily focusing on the Laplacian of mean sea level pressure (∇2SLP). The process begins with the identification of local maxima in the laplacian field across the Northern Hemisphere, indicating regions of intense cyclonic circulation. Subsequently, the algorithm searches for corresponding minima in the raw SLP field that are in close vicinity to these laplacian maxima. If such a minimum is found, the cyclone is classified as a closed system, with its core located at the pressure minimum. If a pressure minimum cannot be found in the vicinity, the feature is defined as a “open system”. If the laplacian value does not reach 0.1 hPa (degree latitude)−2, the feature is eliminated. Cyclone information of different time steps is then combined into cyclone tracks (cf. Pinto et al., 2005). Only the cyclones that are considered as closed systems at least once during its lifetime are used in this study. To ensure that only synoptically significant cyclones are analysed, several filtering criteria are applied to the identified tracks (Pinto et al., 2005, 2009): (1) a minimum lifetime of 24 h, eliminating short-lived systems that typically do not contribute significantly to large-scale weather patterns; (2) at least once in its lifetime, the laplacian must exceed a minimum threshold of 0.6 hPa (degree latitude)−2; (3) a minimum deepening rate of 0.3 hPa (degree latitude)−2 over 24 h; and (4) a minimum travel distance of 1000 km. This ensures that non-synoptic relevant systems (e.g. semi-stationary heat lows, features that remain open systems during their lifetime) that are unlikely to be associated with either ARs or WCBs are removed. Topographic influences are also accounted for by discarding cyclones located over high orography, specifically above 1500 m. This cyclone tracking approach compares well with other methods, particularly for strong long living systems during the central part of their lifetime (Neu et al., 2013).
2.5 Assignment of ARs to ETCs
In order to associate each AR object to an ETC, for every AR object several conditions are assessed:
-
If there is only 1 ETC at a maximum distance of 2000 km from the AR centroid, the association is straightforward.
-
If there is more than 1 ETC, the AR is associated to the one that has the lowest SLP.
-
If there is no ETC within a 2000 km radius of the AR, then the maximum distance is increased to 4000 km, and the search process is redone. If there is still no ETC, the AR is saved as not associated.
-
Then, if an AR event is associated to more than 1 ETC throughout its lifecycle, the AR is associated to the one that had the most concurrent timesteps. This helps avoid duplicated data on the composite analysis.
This procedure successfully associated approximately 99.2 % of all ARs events with an ETC. The primary radius of 2000 km follows the work of Zhang et al. (2019) and Guo et al. (2020), who systematically quantified the distance between AR centroids and their associated ETC centers across the northern hemisphere, finding that the distance between the two systems vary from ∼ 300 to > 2000 km (in Zhang et al., 2019) and from 500 to 1500 km (in Guo et al., 2020). Based on this, the former searched for an ETC around a 2500 km × 2500 km box from the AR's centroid, and the latter at a 30° distance. As such, we chose the primary radius of 2000 km. The secondary radius of 4000 km is applied only when no ETC is found within 2000 km. This two-step approach accounts for two specific scenarios: (i) decaying ARs where the associated ETC has weakened or moved rapidly poleward, and (ii) very large, occluded cyclones where the AR may be positioned further from the center than in the mature phase. This is applied to our analysis by adding the condition that the AR needs to be within 2000 km from the ETC at least once during its lifecycle. The 2000 km radius successfully associated approximately 95 % of ARs with an ETC while the remaining 5 % of ARs require the 4000 km radius (distribution shown in Fig. S2). We note that the extended 4000 km search radius may occasionally capture coincidental pairings with unrelated cyclones.
Finally, all cyclone tracks are evaluated relative to the time and value of maximum deepening, which is defined as Maximum Deepening Point (MDP) and Maximum Deepening Rate (MDR), respectively, throughout this study. The MDP is defined as the time of maximum 6-hourly SLP decrease (i.e., peak intensification rate), which typically precedes the cyclone's minimum central pressure by approximately 6–12 h, while the MDR is defined as the maximum 6-hourly SLP decrease value. Timesteps before (after) this MDP are indicated as MDP -xxh (MDP +xxh).
2.6 Rotation Methodology
Following the identification of AR objects, we standardized their geometric orientation for robust composite analysis. This procedure was adopted to mitigate the confounding effects of varying AR axis directions on the composite structure, ensuring that the resulting patterns reflect intrinsic physical relationships rather than geometric aliasing.
In Dacre et al. (2019), cyclone composites were calculated by considering the direction of movement on the time of maximum intensity of each cyclone. As such, the direction applied to the rotation becomes the same for all cyclones. Contrary to them, and following the work of Asharaf et al. (2024), the rotation was performed individually for each AR object at its respective timestep, for the associated environmental fields (including IVT, SLP, and precipitation) and also for the WCB at the same time step. The core of this transformation involves a two-stage process:
-
Each AR object was rotated by an angle of (90°−θ), where θ is the object's primary directional orientation. This calculation effectively reorients all AR objects to a common west-to-east orientation within the composite framework, aligning their moisture plumes along a standardized longitudinal axis. This transformation is illustrated in Fig. 1. For a given timestep, the original fields (Fig. 1a) are rotated such that the AR's primary axis is aligned zonally (west-to-east) within the composite framework (Fig. 1b); and
-
to account for the convergence of meridians in the spherical coordinate system and the resulting reduction in zonal grid spacing with increasing latitude, all rotated fields were normalized by the cosine of the latitude (cos (φ)). This essential adjustment rectifies the areal distortion inherent in latitude–longitude grids, ensuring that quantitative measures of flux and intensity are conserved and comparable across the composite domain.
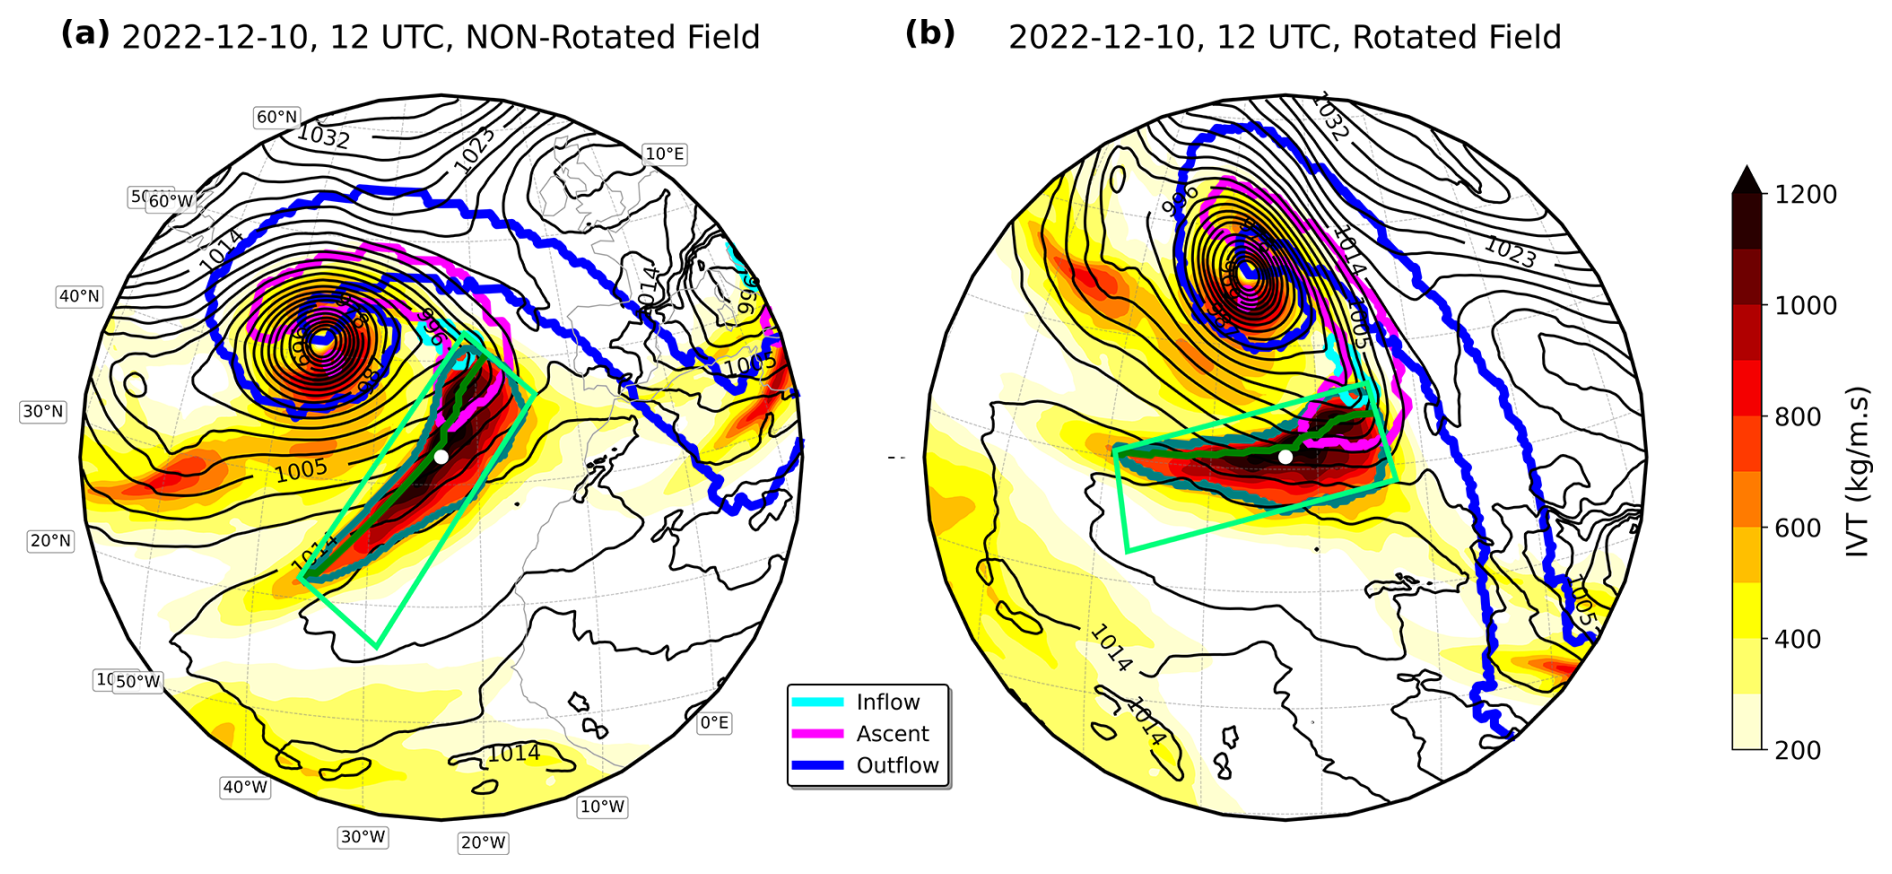
Figure 1Schematic of the rotational composite methodology. (a) Original fields for a case study on 10 December 2022, 12:00 UTC, showing an AR (dark-green contour), the WCB inflow (light blue), ascent (pink), and outflow (blue) phases, SLP (black contours), and IVT (shaded in kg m−1 s−1). The ETC center is located northwest of the AR. The light-green box denotes the search region for WCB ascent influence. The white point marks the AR centroid and the green line inside the AR represents its axis. (b) The same fields after application of the rotational and latitude-correction algorithm, aligning the AR axis zonally (west-to-east, green line inside the AR) for compositing.
The final output of this preprocessing step is a set of standardized, rotated fields for each AR event, all centered on the AR's centroid and aligned along a uniform directional axis. This object-based, rotated framework provides a consistent coordinate system, which is a prerequisite for a meaningful composite analysis. It allows for the precise examination of the spatial co-location between the axis of maximum IVT and the regions of most vigorous WCB ascent, free from the directional variability of individual events.
2.7 Composite Methodology
The core of our diagnostic approach involves the construction of Eulerian composites to elucidate the three-dimensional structure of the coupled AR-WCB system. This technique allows us to statistically synthesize the key atmospheric fields around a common reference point, revealing the characteristic spatial patterns that define the interaction. The composite analysis was performed separately for two distinct populations to enable a comparative assessment:
-
Definition of event classes. At each 6-hourly analysis timestep, all identified AR objects were classified into one of two categories based on the presence of the WCB's ascent phase:
- a.
WCB-coupled ARs: AR objects that are co-located with a diagnosed WCB ascent region (inside the green box in Fig. 1a and b, i.e., an overlap of any WCB ascent grid point with the AR object).
- b.
AR-only cases: AR objects where the WCB ascent phase is absent or far from the AR.
- a.
-
Grid extraction and alignment. For each event in both classes, a regional domain of fixed size was extracted from the global fields. The centroid of the AR object was used as the central point, placed at the geometric origin (0,0) of a standardized composite grid. This alignment ensures that the composite mean reflects the typical spatial organization of variables relative to the AR's centroid.
-
Composite mean calculation. The final composite fields for each event class were generated by computing the arithmetic mean of all aligned grids. This process yields a statistically representative model of the atmospheric state for each class, effectively filtering out the noise of individual case-specific features and highlighting the robust, systematic signals of the AR–WCB interaction. For example, the precipitation composite is calculated by accumulating the precipitation field of all ARs in each class (Sect. 4) and on each 6 h (Sect. 5) and then dividing by the number of cases presented on each image title.
This stratified compositing approach is designed to isolate the unique fingerprint of the WCB's dynamical forcing on AR structure. By comparing the composite fields of WCB-coupled events against those of AR-only, we can quantitatively attribute differences in the patterns of vertical motion, precipitation, and integrated vapor transport directly to the influence of the ascending airstream.
This classification yielded 16 852 AR objects in the WCB-coupled ARs category and 3883 AR objects in the AR-only category over the 45-year period. This corresponds to approximately 81 % of AR objects being coupled with WCB ascent.
3.1 Climatological Overview
Previous studies have examined AR and WCB climatologies separately (e.g., Sodemann et al., 2020; Madonna et al., 2014), but direct intercomparison of their spatial co-occurrence has been limited. Our Fig. 2 provides the first combined climatological view of all three systems (ARs, WCB phases, and ETCs) using a consistent methodological framework.
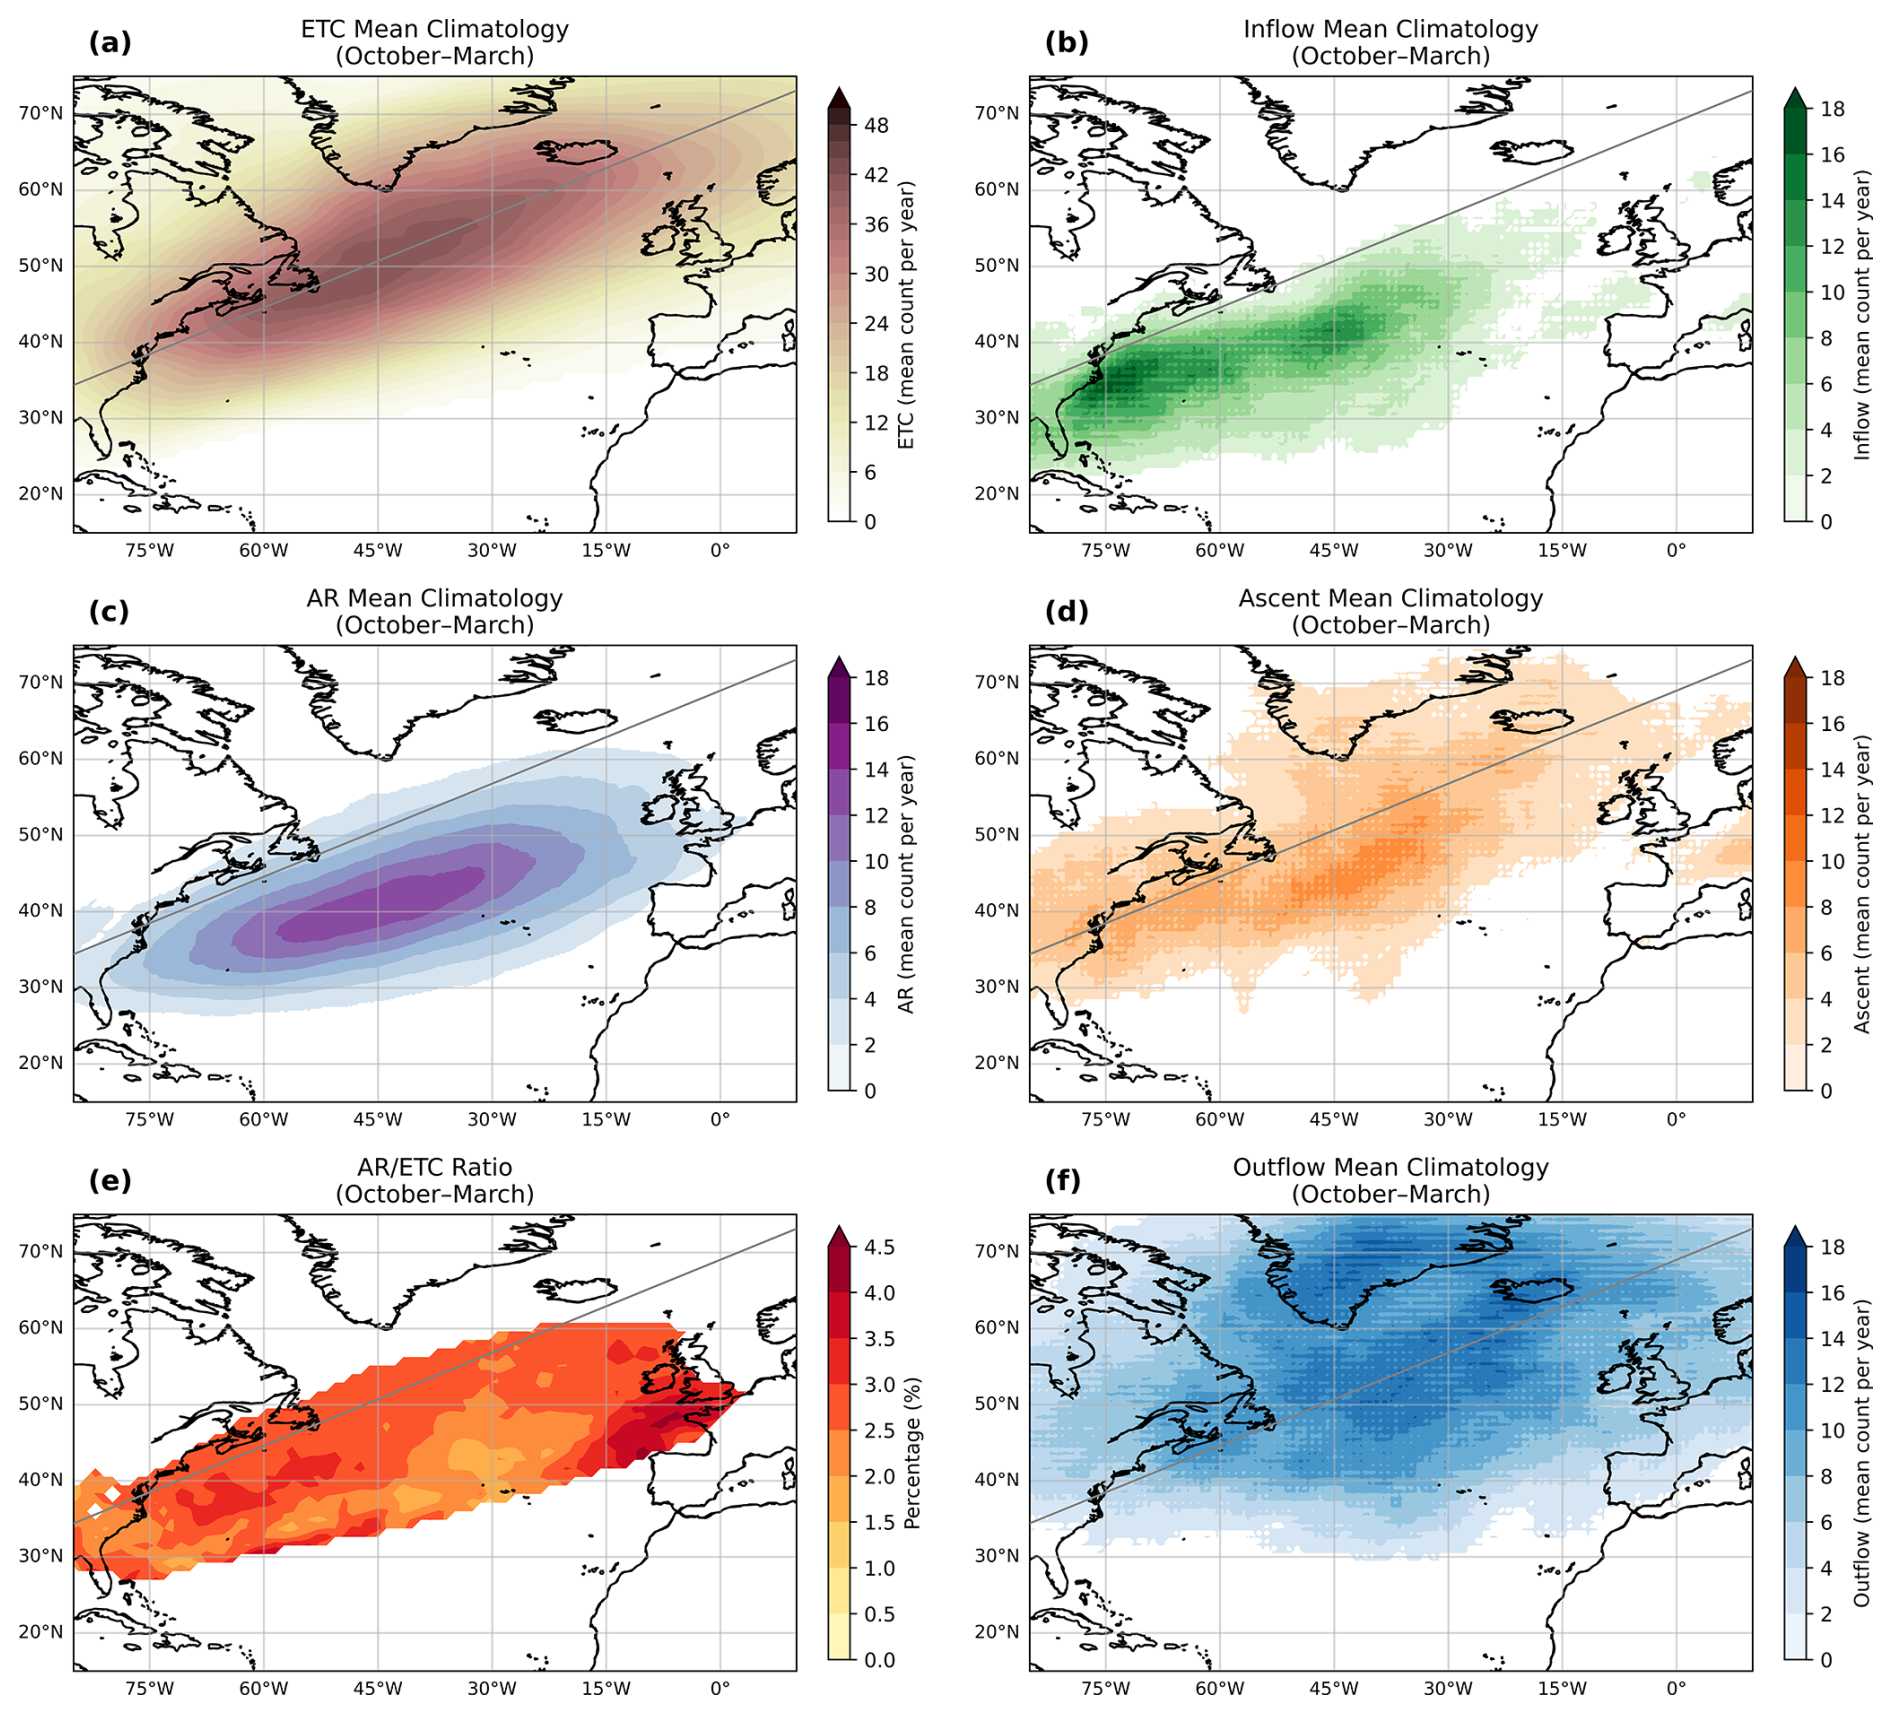
Figure 2Extended winter (October–March) climatology (1979–2023) of (a) all ETCs frequency, (b) WCB inflow frequency, (c) AR frequency, (d) WCB ascent frequency, (e) AR ETC Ratio (AR count per year ETC count per year), and (f) WCB outflow frequency. Grey line represents the axis of the ETC climatology's distribution shown in panel (a), for easier orientation.
The extended winter climatology of ARs, WCBs phases, and ETCs reveals a coherent, co-located spatial pattern across the North Atlantic. All features exhibit maximum frequency along a southwest-northeast corridor extending from the Gulf Stream region towards Iceland and northwestern Europe. The peak of WCB inflow occurrence (Fig. 2b) is located at approximately 37° N, 73° W, just off the eastern coast of North America. Eastward of this, the AR (Fig. 2c), WCB ascent (Fig. 2d), and ETC (Fig. 2a) frequency maxima are located at approximately 40° N, 45° W; 45° N, 43° W; and 50° N, 45° W, respectively – exhibiting a progressive ∼ 10° latitudinal northward offset, while the WCB outflow maximum (Fig. 2f) is located southeast of Greenland.
While only about 30.5 % of all ETCs have an associated AR, a remarkable 99.2 % of detected ARs are linked to an ETC. This underscores that almost every AR in this region is an integral component of a larger synoptic-scale cyclonic system, acting as its primary moisture reservoir. To isolate the preferential coupling between the systems, Fig. 2e displays the ratio of ARs to total ETCs. The highest ratios are found in the western North Atlantic and just off the northwest coast of Europe (up to 4.5 %), which aligns with our conclusion that ETCs linked to ARs preferentially form directly over the Gulf Stream.
3.2 Illustrative Case Study: February 2010
In Fig. 3, a case study from 2–7 February 2010 illustrates the typical development/lifecycle of an WCB/ETC/AR coupled system. On 2 February, 06:00 UTC (Fig. 3a), a large-scale inflow region can be observed at low latitudes off the east coast of North America. On 3 February, 00:00 UTC (Fig. 3b), the vertically coherent organization of the WCB, where parcels rapidly transition from boundary layer inflow to significant ascent and ultimately upper-tropospheric outflow, can be observed just off the east coast of North America, depicting the cyclogenesis of an ETC. One day after, on 4 February, 00:00 UTC (Fig. 3c), the cyclone centre emerges at 60° W, 38° N (with a minimum value of 980 hPa) with a region of high integrated water vapor transport to its southeast with values above 700 kg m−1 s−1. This high moisture transport combined with the large convergence in the WCB inflow region allows the detection of an AR on 5 February, 00:00 UTC. On that day (Fig. 3d), we can clearly see the collocation between the ETC, WCB and AR: (1) diabatic heating in the WCB ascent close to the cyclone centre probably intensifies the cyclone development (to 949 hPa); (2) the WCB ascent is located in the AR region which is at the typical southwestern side of the cyclone; and (3) the inflow phase coincides with most of the AR area, allowing it to develop and intensify. The following day (on 6 February, 00:00 UTC, Fig. 3e), the WCB ascent and inflow move east with the AR away from the ETC center while the AR intensifies in moisture content and spatial extent. On 7 February, 00:00 UTC (Fig. 3f), the AR is no longer influenced by the inflow nor the ascent and begins to lose moisture as it moves closer to the European continent.
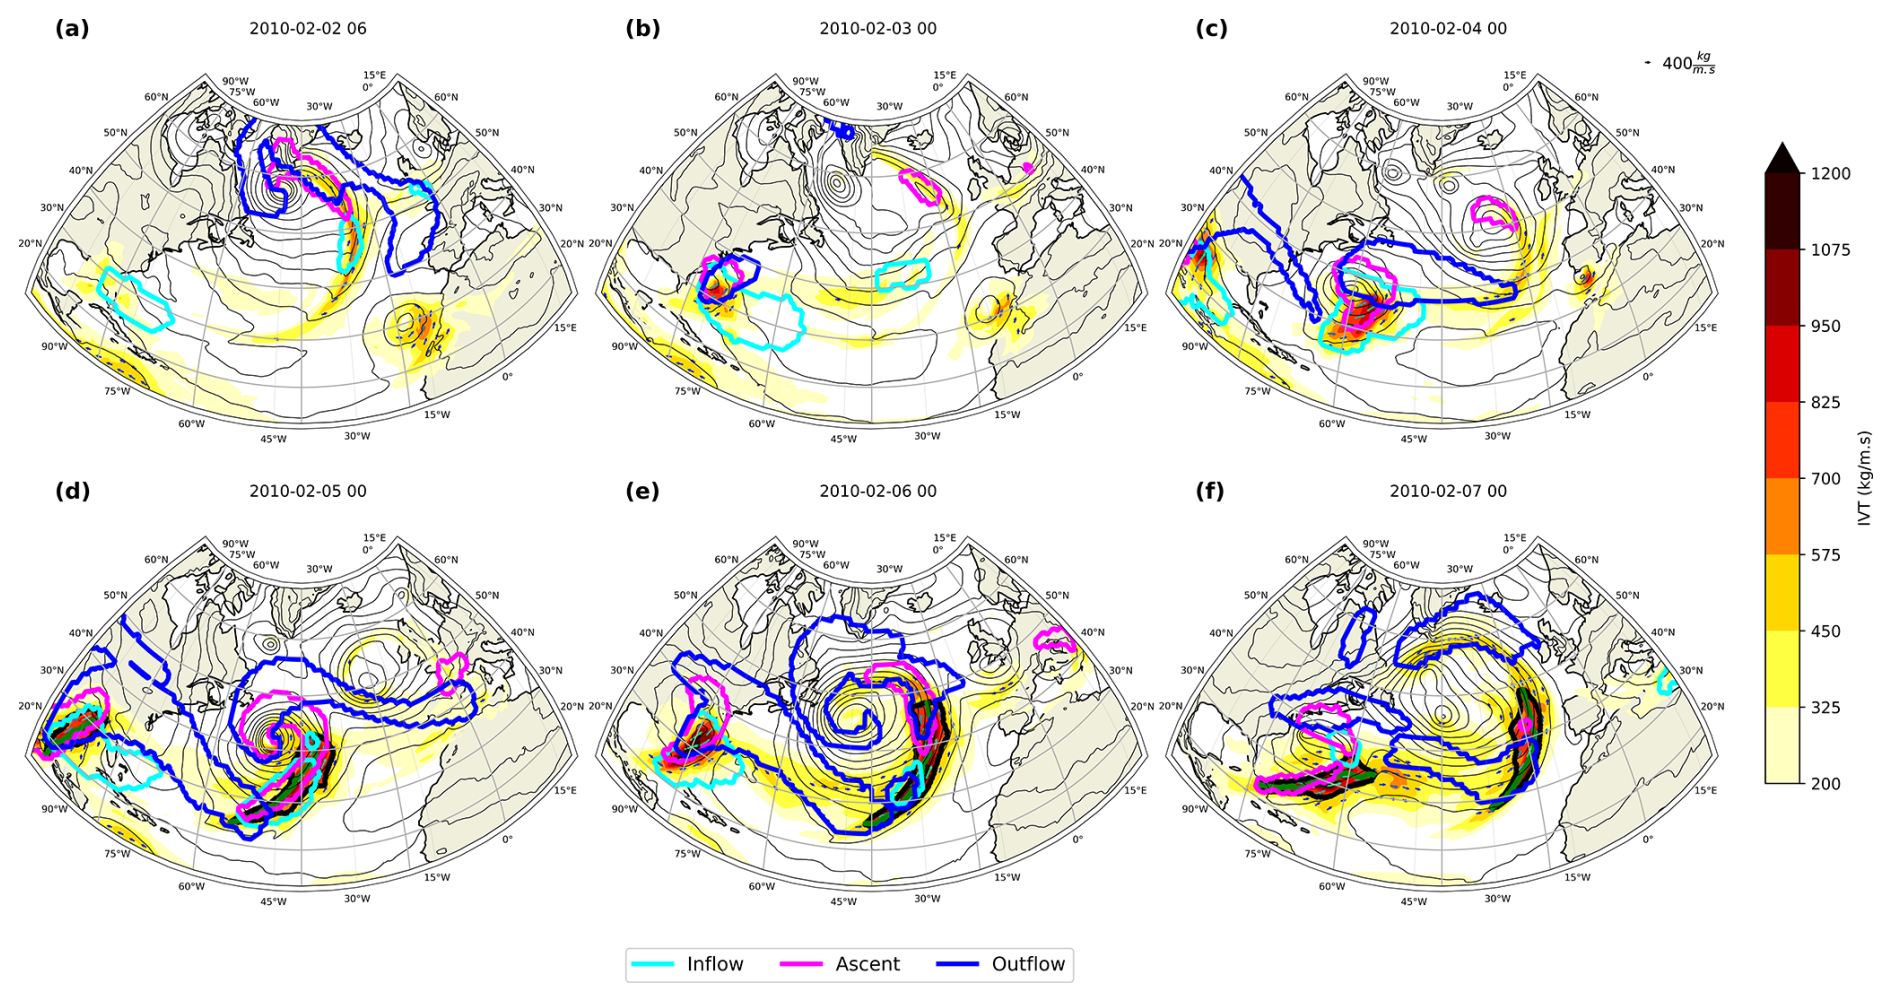
Figure 3Case study of a coupled AR-WCB-ETC event in February 2010. Panels show the evolution from 2 February (06:00 UTC) to 7 February (00:00 UTC). Thin black contours indicate SLP data, and the bolder black contour, on the bottom images, represent the detected AR boundary. WCB phases are shown as inflow (light blue), ascent (pink), and outflow (blue). Shading shows IVT. The sequence illustrates cyclogenesis (3 February), the emergence of a strong AR coincident with cyclone intensification (4–5 February), and the subsequent decay phase where the AR detaches and makes landfall.
In this section we compute several rotated composites (from the viewpoint of the AR) of relevant variables for the study of ARs, differentiating between ARs that are influenced by the ascent phase of the WCB and ARs where the WCB's ascent phase is absent (see Sect. 2.7). Critically, the distinction between WCB-coupled and AR-only cases is not merely semantic: it reflects fundamentally different thermodynamic and kinematic regimes governing moisture conversion efficiency, storm-scale feedback, and downstream flow evolution (Heitmann et al., 2024; Federer et al., 2025). To note, values presented throughout the rotated composites correspond to mean values on each AR object.
4.1 Composite Structure of key fields
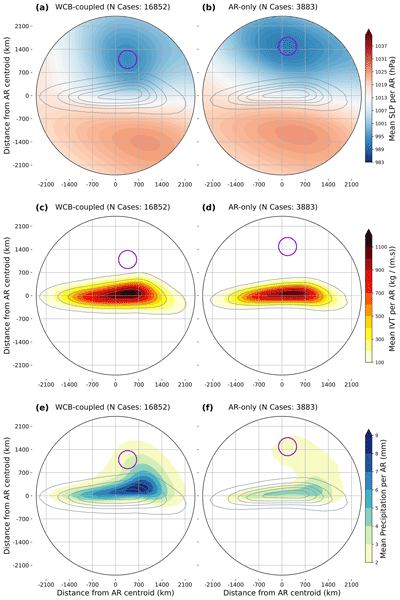
The rotated SLP composites (Fig. 4a and b), confirms the synoptic pattern for both AR types: a cyclone situated poleward of the AR centroid (north, in this rotated coordinate system) and an anticyclone to the south and east. In the original (non-rotated) geographical coordinates, this corresponds to the cyclone being located northwest of the AR centroid, consistent with the classical warm-sector positioning of ARs relative to ETCs. According to Guo et al. (2020), this dipole (cyclone located poleward and westward of the AR centroid and anticyclone equatorward and eastward) leads to strong horizontal pressure gradient that forces moisture to be transported along a narrow corridor within the warm sector of the cyclone (with a W-E direction in this rotated framework). However, the differences in the cyclone's proximity and intensity between the two composites suggest that WCB-coupled ARs occur closer to cyclones – a result that is expected, as WCBs are by definition associated with ETCs – which provides the stronger dynamical forcing necessary to sustain the intense WCB ascent.
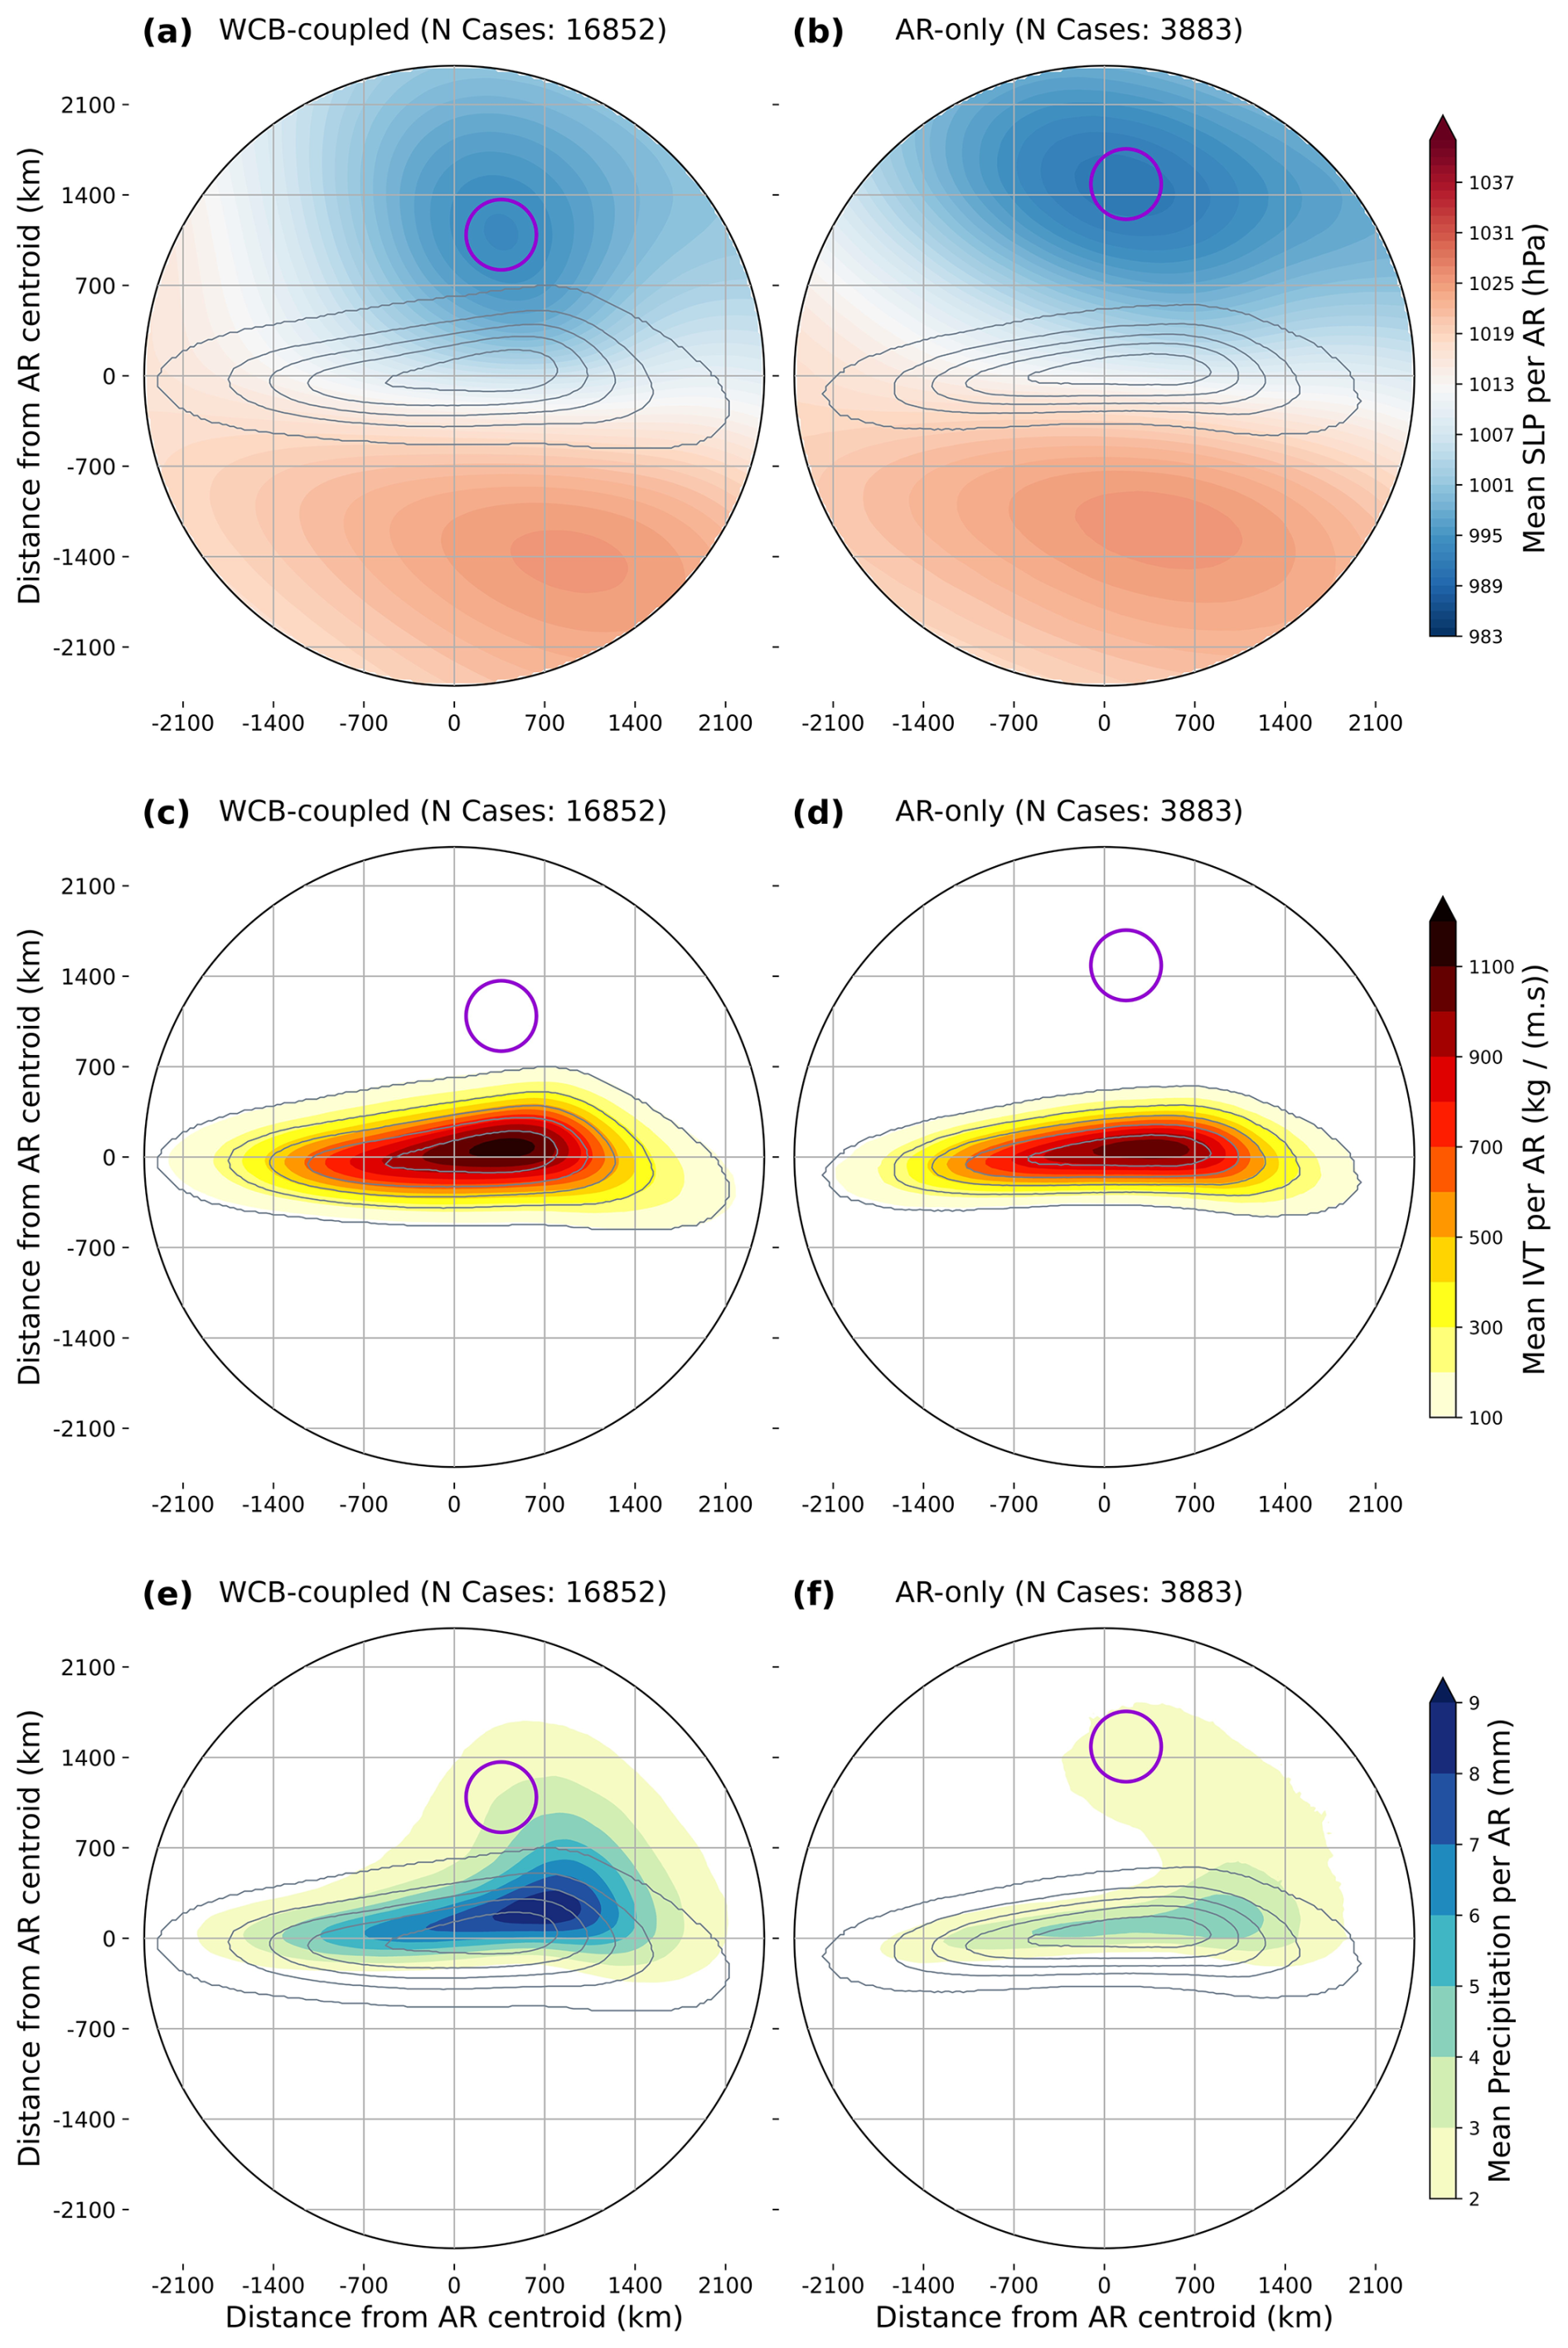
Figure 4Composite fields centered on AR centroids for events with (left column) and without (right column) the WCB ascent phase: (a, b) SLP (hPa); (c, d) IVT (kg m−1 s−1); (e, f) total precipitation (mm). The (0,0) point marks the AR centroid. Purple circle represents the location of the low-pressure center from the SLP composite. Grey contours show the relative frequency of AR occurrence (drawn at 20 % intervals, from 10 % to 90 %).
The IVT rotated composites (Fig. 4c and d) highlight a quantitative difference in moisture intensity. In WCB-coupled cases, the core IVT exceeds 1100 kg m−1 s−1, a threshold significantly higher than the sub-1100 kg m−1 s−1 values observed in AR-only cases. This enhancement is not just a matter of intensity, as the spatial structure is also altered. The relative frequency contours of the AR itself are broader in the influenced cases, suggesting a larger spatial footprint. The data shows that the inflow phase occurs over 40 % of the time north of the AR core in influenced cases (Fig. 5a), compared to a mere 10 % in absent cases (Fig. 5b), providing a clear kinematic explanation for the observed differences in AR width and intensity.
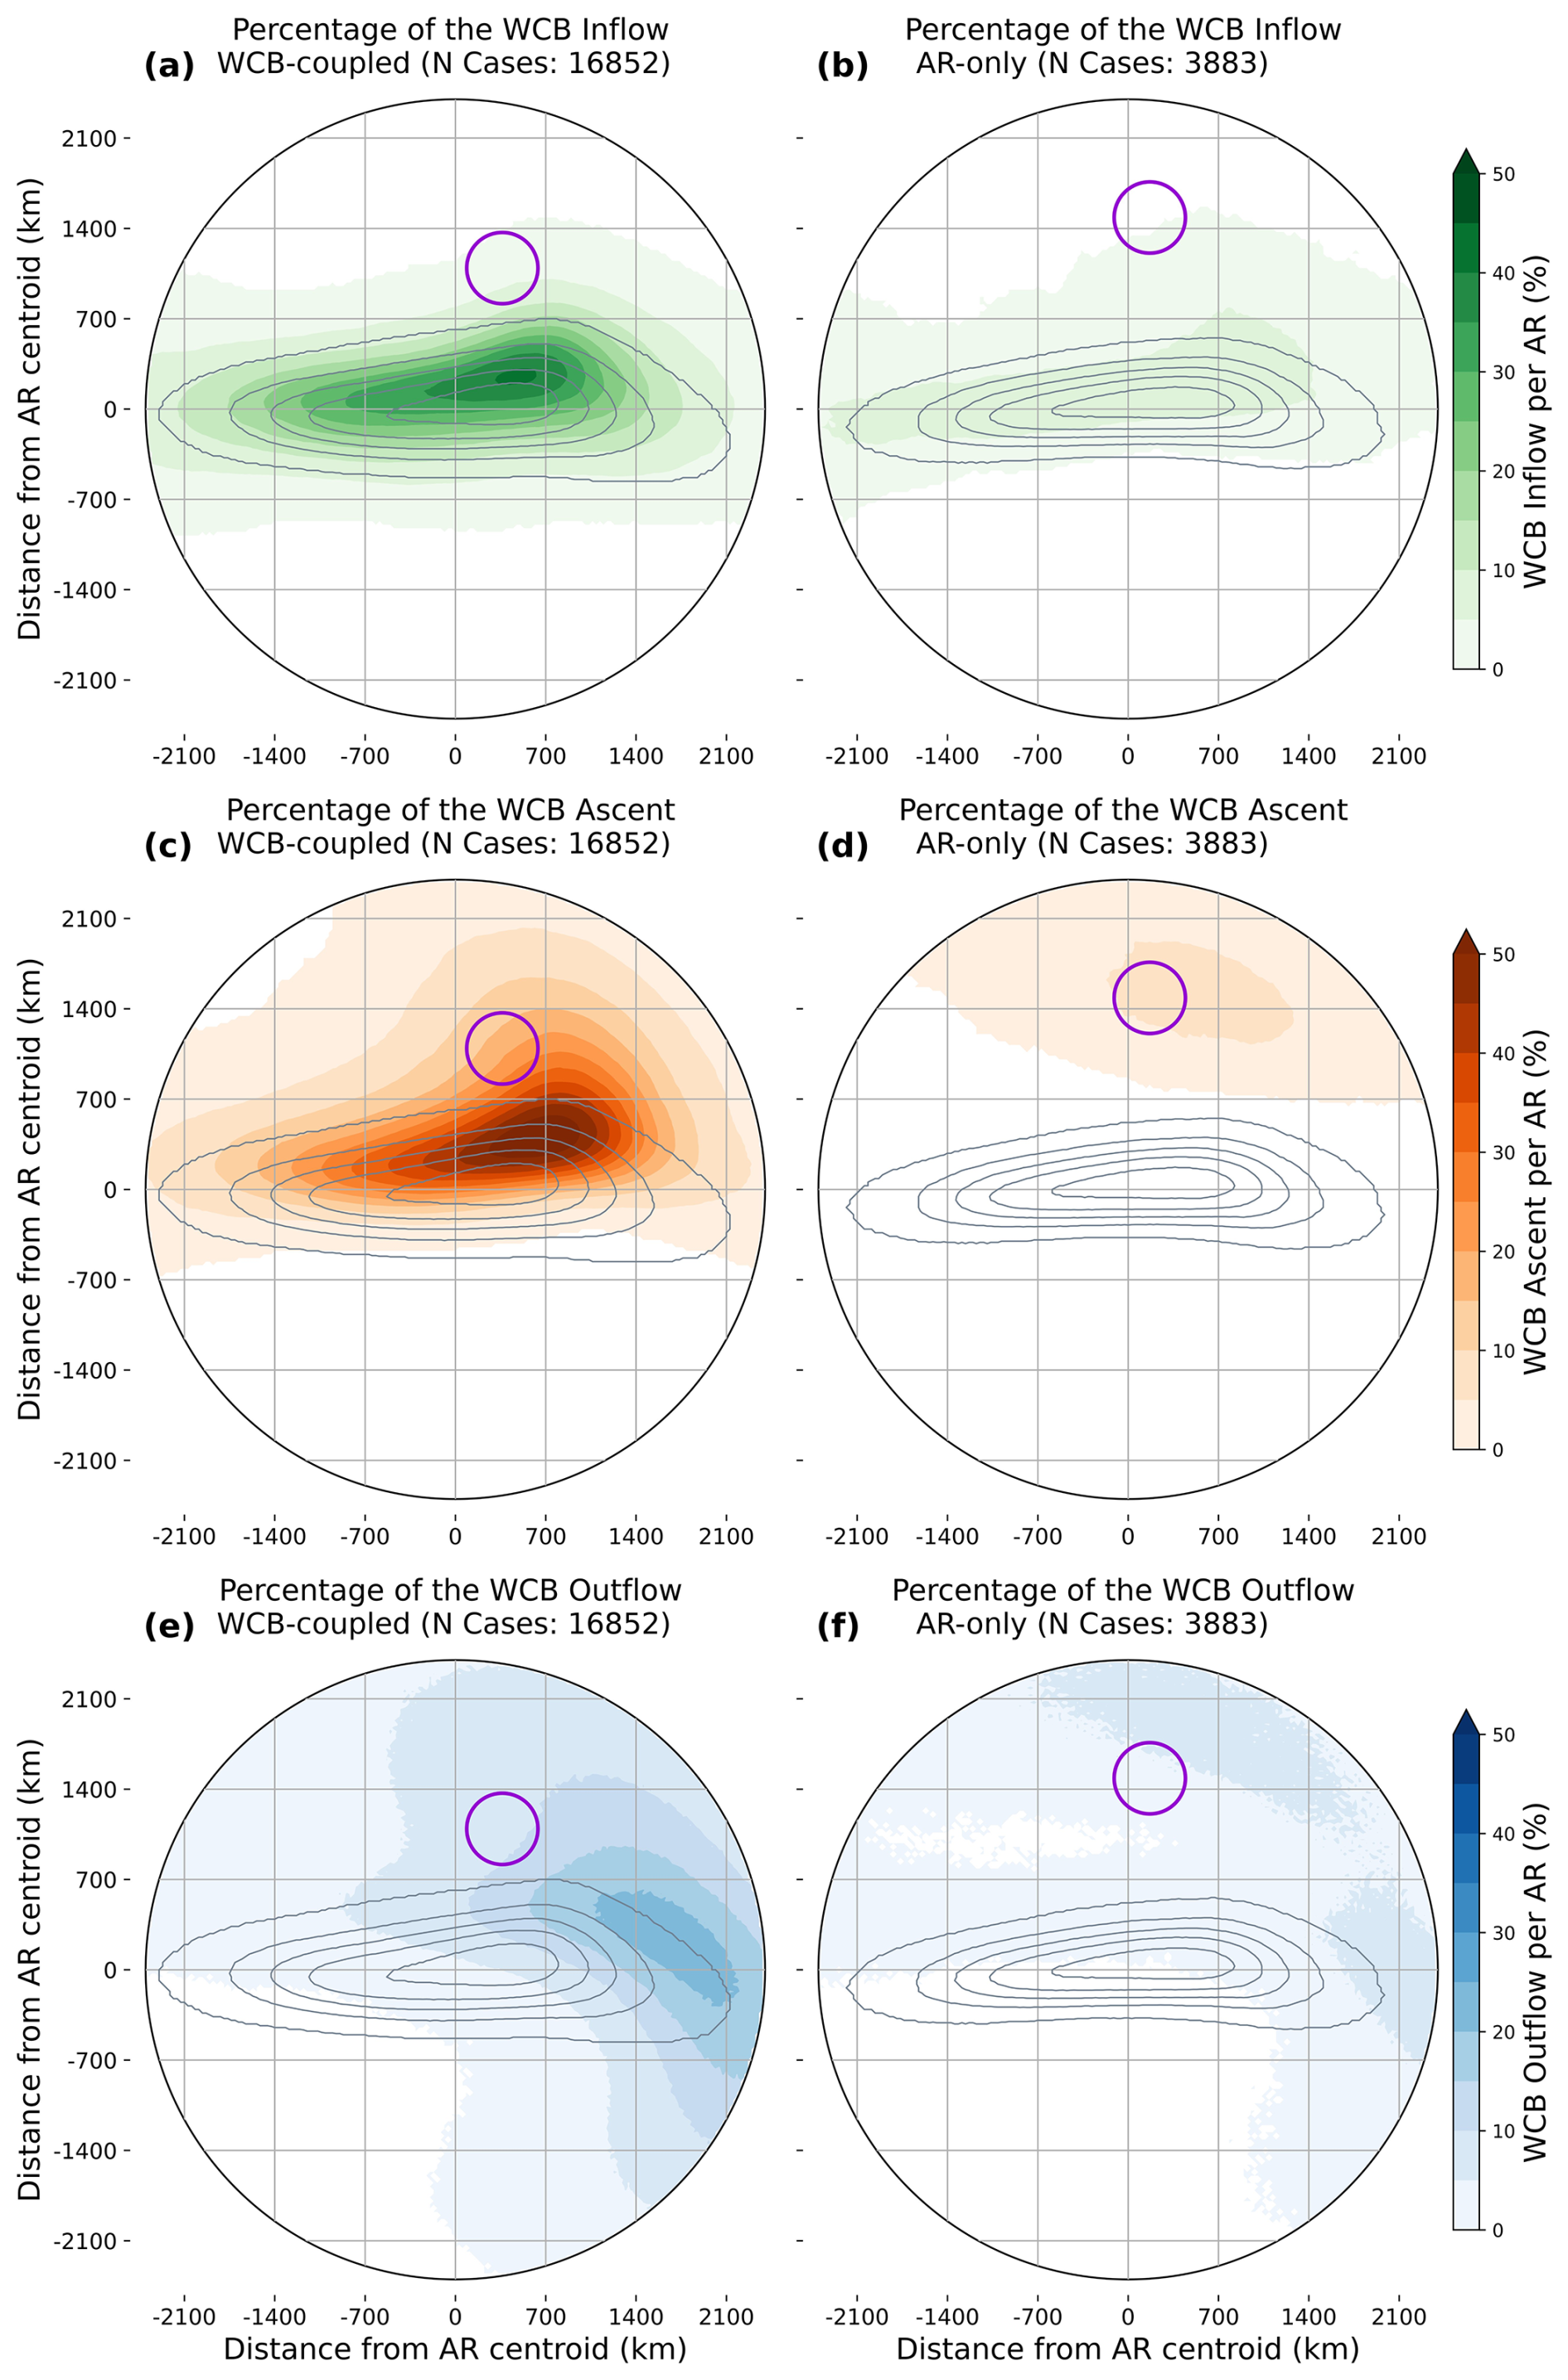
Figure 5Composite frequency of occurrence (%) for each WCB phase, aligned with the AR-centered composites in Fig. 4. The frequency (%) at each grid point represents the percentage of AR objects in each category (WCB-coupled or AR-only) that have a WCB mask present at that specific grid point. (a, b) WCB inflow. (c, d) WCB ascent. (e, f) WCB outflow. Left column: AR events with WCB ascent present. Right column: AR-only events. Purple circle represents the location of the low-pressure center from the SLP composite. Grey contours show the relative frequency of AR occurrence (drawn at 20 % intervals, from 10 % to 90 %).
The most profound and operationally significant finding emerges from the precipitation composites (Fig. 4e and f). In WCB-coupled ARs, precipitation maxima exceeding 8 mm are not centred on the AR's IVT maxima (at the centroid) but are instead displaced to the northeast, forming a distinct plume that extends toward the cyclone centre (located at approximately (350, 1050) km in the rotated frame Fig. 4e). This spatial offset is a direct manifestation of the synoptic-scale dynamics: the heaviest precipitation occurs where the poleward-advected moist air within the AR encounters the strongest large-scale ascent (Fig. 5c), typically along and just ahead of the cold front of the associated ETC. In contrast, AR-only cases (Fig. 4f) produce a much weaker and more diffuse precipitation signal, with values generally below 5 mm within the AR and extending northward, with only 2–3 mm, connecting to the cyclone. This weak signal likely arises from less efficient mechanism like broad slantwise ascent or residual frontal uplift, which lack the focused, enhanced vertical motion characteristics of a WCB.
From these composites we can observe that while there are large amounts of water vapor in both AR cases, the presence of the ascent phase plays an important role for the occurrence of large precipitation values. Its higher presence on the WCB-coupled cases is probably due to the occurrence of the ETC closer to the AR (Fig. 4a and b).
4.2 Spatial Co-location of WCB Phases
For the three phases of the WCB rotated composite (from the AR point of view), we combined the WCB masks based on the spatial alignment between the two systems, i.e., the values shown in Fig. 5 represent a grid-point relative frequency of the WCB per AR object.
Starting with the inflow phase, for the WCB-coupled cases (Fig. 5a), we can observe that convergence occurs above 40 % to the northward side of the AR core, between the 70 % and 90 % of the AR relative frequency isolines, and spreads westward following a similar spatial extension as the AR relative frequency. As per the AR-only cases (Fig. 5b), the inflow is substantially reduced occurring at a maximum of 10 %. It should be noted that (1) the AR-only cases classification is strictly based on the presence (or not) of co-located WCB ascent and, as such, the inflow and outflow phases can still occur; and (2) WCB-coupled cases correspond to 16 852 AR objects and the AR-only to 3883 AR objects (an AR object corresponds to one time step case detection). For the ascent phase, the WCB-coupled composite (Fig. 5c) shows a clear resemblance with the precipitation composite (Fig. 4e), with the highest occurrences within the AR contour but extending northward towards the cyclone. On Fig. 5d, the ascent is located closer to the lowest SLP values of Fig. 4b with a percentage of 5 %–10 % of occurrence. For the outflow phase, the WCB-coupled composite (Fig. 5e) shows a 15 % higher occurrence at the leading edge of the AR, than the AR-only cases. On the contrary, the AR-only cases seem to occur further from the AR. The large difference in the number of AR objects (16 852 WCB-coupled, and 3883 AR-only) underscores that the vast majority of impactful ARs are dynamically linked to a WCB. This demonstrates that while an AR provides the essential moisture reservoir, it is the WCB's ascent phase that converts moisture into precipitation.
Based on the previous results, we now take a closer look at the variation of the 12-hourly composites at (and around) the MDP of each ETC that has an associated AR, from −24 to +24 h from the MDP, each 12 h to better understand how the AR-WCB coupling evolves temporally. Only the AR cases that are influenced by the ascent phase are analysed in this section. Note that the number of cases varies considerably from −24 to +24 h of the MDP: the maximum occurs on the MDP, with 1343 cases, and the minimum at MDP +24 h, with 266 cases.
5.1 Evolution of the WCB
The temporal evolution of the WCB phase frequencies around the ETC's MDP reveals a systematic, phased progression (Fig. 6). Each phase of the WCB exhibits a distinct temporal signature relative to the MDP, with the transitions occurring within ±12 h windows.
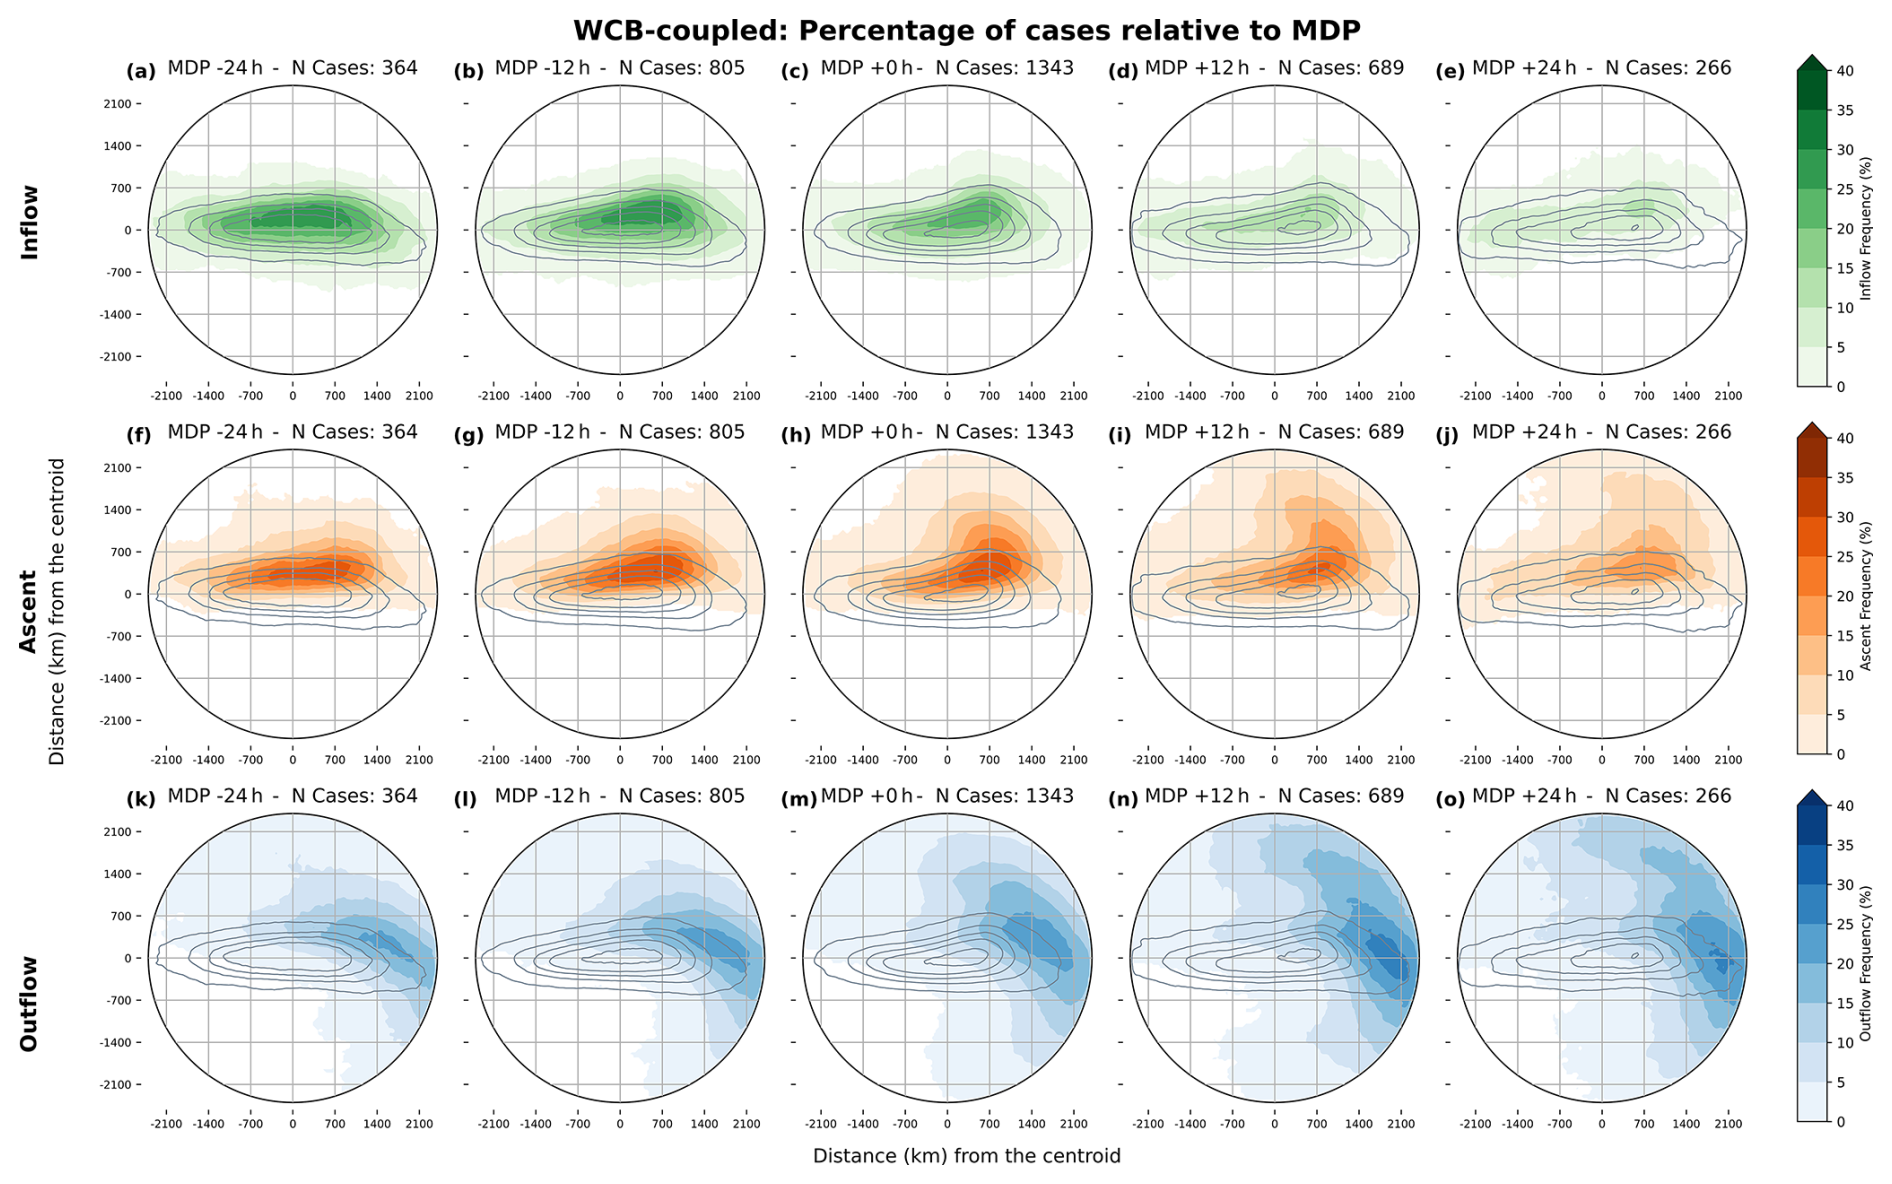
Figure 6Temporal evolution of WCB phase frequency (%) for WCB-coupled AR events, centered on the time of the associated ETC's MDP. Rows show (a–e) WCB inflow, (f–j) WCB ascent, and (k–o) WCB outflow frequency. Columns show fields at MDP−24 h, MDP−12 h, MDP, MDP+12 h, and MDP+24 h. Grey contours represent AR relative frequency (from 10 % to 90 %).
The WCB inflow frequency (Fig. 6a–e) peaks during the pre-MDP period, with the highest frequencies observed at MDP−24 h and MDP−12 h (Fig. 6a, b). At MDP−24 h, the inflow frequencies exceed 20 % within the AR's relative frequency contours (the 50 %–70 % interval), with the inflow region extending northeast from the AR centroid. By MDP−12 h, the inflow is still above 20 %, and the AR's spatial extent has expanded both zonally and meridionally. Afterwards, the inflow frequency begins to decrease slightly (to ∼ 15 % in Fig. 6c), though it remains elevated at the MDP (Fig. 6c). By MDP+12 h (Fig. 6d) and MDP+24 h (Fig. 6e), the inflow has weakened substantially, dropping to below 15 %, consistent with the transition from the cyclone's intensification to its mature/decay phase.
In contrast to the inflow, the WCB ascent frequency (Fig. 6f–j) reaches its maximum at the MDP−12 h and MDP (Fig. 6g, h). At MDP−12 h, the ascent frequency exceeds 20 % within the AR's 50 %–70 % relative frequency contour, with the ascent region extending northeastward toward the cyclone center. At the MDP (Fig. 6h), the ascent has intensified to over 25 % and has expanded spatially, with the highest frequencies now located at the AR's leading edge, where the precipitation maximum is also observed (Fig. 7h). This simultaneous peak in ascent and precipitation confirms that the WCB ascent is the primary mechanism driving the heavy precipitation within the AR. At MDP+12 h (Fig. 6i), the ascent frequency it is still presented above ∼ 25 %, while the spatial extent starts to contract, and, by MDP+24 h (Fig. 6j), the ascent weakens below 15 % and is largely confined to a smaller region near the leading edge of the AR. The ascent region's northeastward displacement from MDP−12 h to MDP+12 h follows the typical trajectory of WCB parcels as they ascend along the cyclone's warm front, consistent with the climatological WCB lifecycle (Madonna et al., 2014; Heitmann et al., 2024).
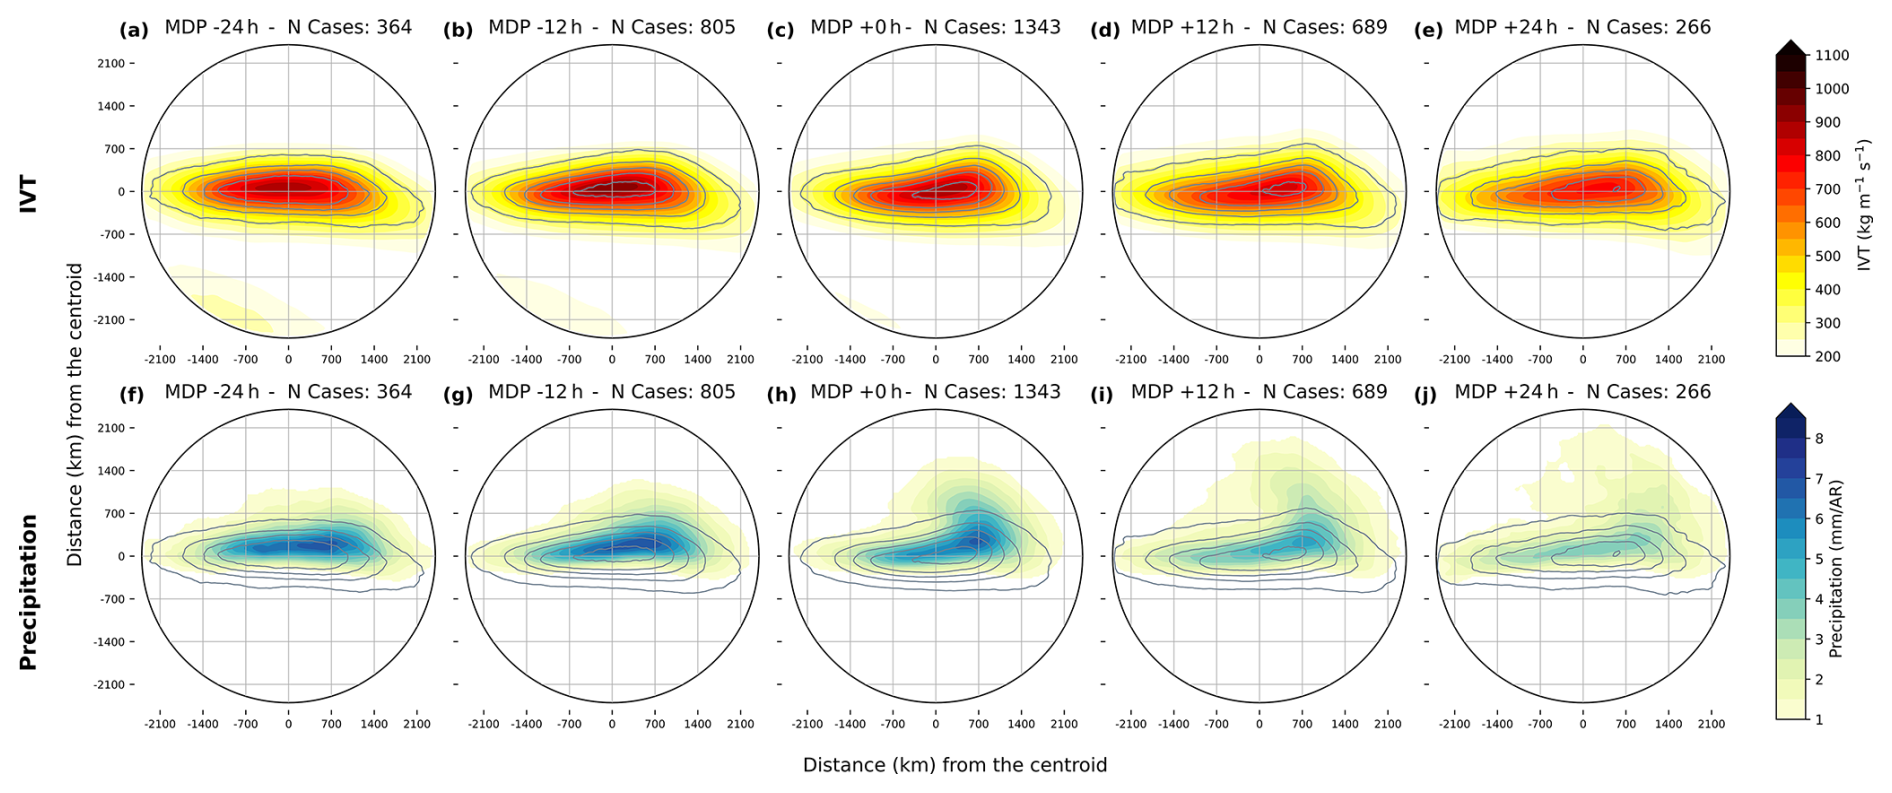
Figure 7Temporal evolution of composites for WCB-coupled AR events, around the ETC's MDP (same timeline as Fig. 6). Top row (a–e): IVT (kg m−1 s−1 per AR). Bottom row (f–j): total precipitation (mm per AR).
The WCB outflow frequency (Fig. 6k–o) increases and shifts downstream throughout the entire ETC lifecycle. Although its frequency span within 20 %–25 % range to the northeast of the AR centroid before the MDP, its peak intensity occurs after the MDP, reaching a frequency of 30 % at MDP+12 h.
5.2 Evolution of IVT and Precipitation
Throughout the intensification of an ETC, the associated AR exhibits a coherent structure, with IVT values consistently around 1000 kg m−1 s−1 over a 48 h period centred on the cyclone's MDP (Fig. 7a–e). This persistence of high IVT, peaking at the MDP−12 h and maintaining the high intensity through the MDP, suggests that the AR reaches a near-saturated intensity state when the cyclone undergoes its most rapid intensification. The spatial extent of these ARs remains relatively consistent, spreading approximately 4200 km zonally (from −2100 to +2100 km) and 1400 km meridionally (between −700 and +700 km).
The evolution of precipitation within the AR-ETC system (Fig. 7f–j) provides a more detailed view of this coupling. At 24 h prior to the MDP (Fig. 7f), precipitation is relatively modest, approximately 6 mm per AR, and spatially confined near the AR axis. As the cyclone intensifies towards the MDP, precipitation increases to over 7 mm per AR and expands spatially, mirroring the characteristic shape of the WCB ascent region (Fig. 6h). From the MDP−12 h through the MDP (Fig. 7h), the precipitation reaches its maximum values, exceeding 8 mm per AR, and the spatial pattern is distinctly asymmetric: the precipitation extends northeastward (on the MDP, Fig. 7h) aligning closely with the WCB ascent footprint (Fig. 6h), while the south-westward side of the AR remains relatively dry (values below 4 mm per AR). This asymmetry is characteristic of the warm-frontal structure, where the heaviest precipitation occurs ahead of the surface warm front, displaced poleward of the AR's moisture core.
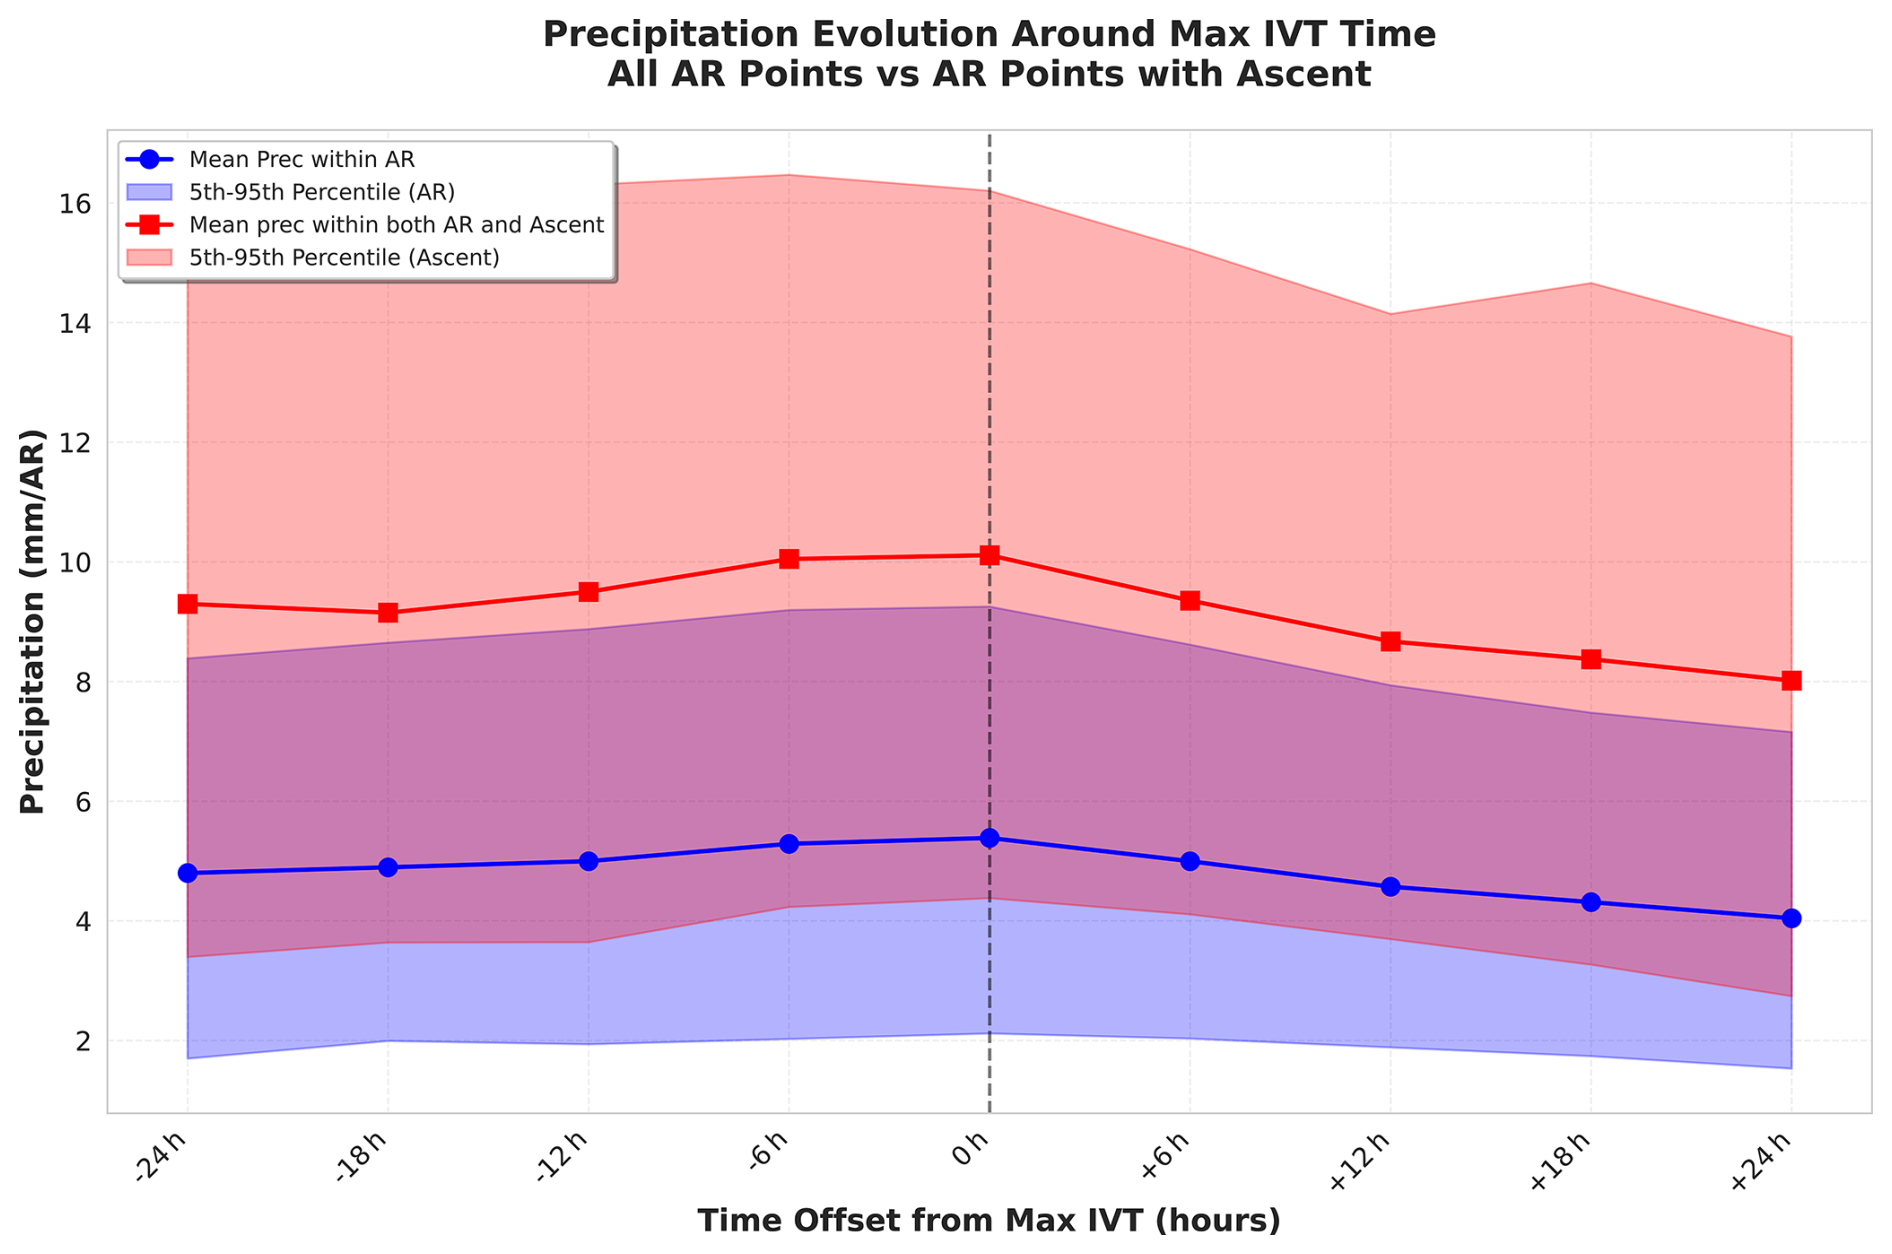
Figure 8Precipitation change relative to the time of maximum IVT within the AR (0 h). The blue line shows the mean precipitation and the blue shading represents the precipitation distribution between the 5th and 95th percentiles over the entire AR area, while the red line shows the mean precipitation and the red shading represents the precipitation distribution between the 5th and 95th percentiles over the region where the AR and the ascent overlap (i.e., the superimposed area).
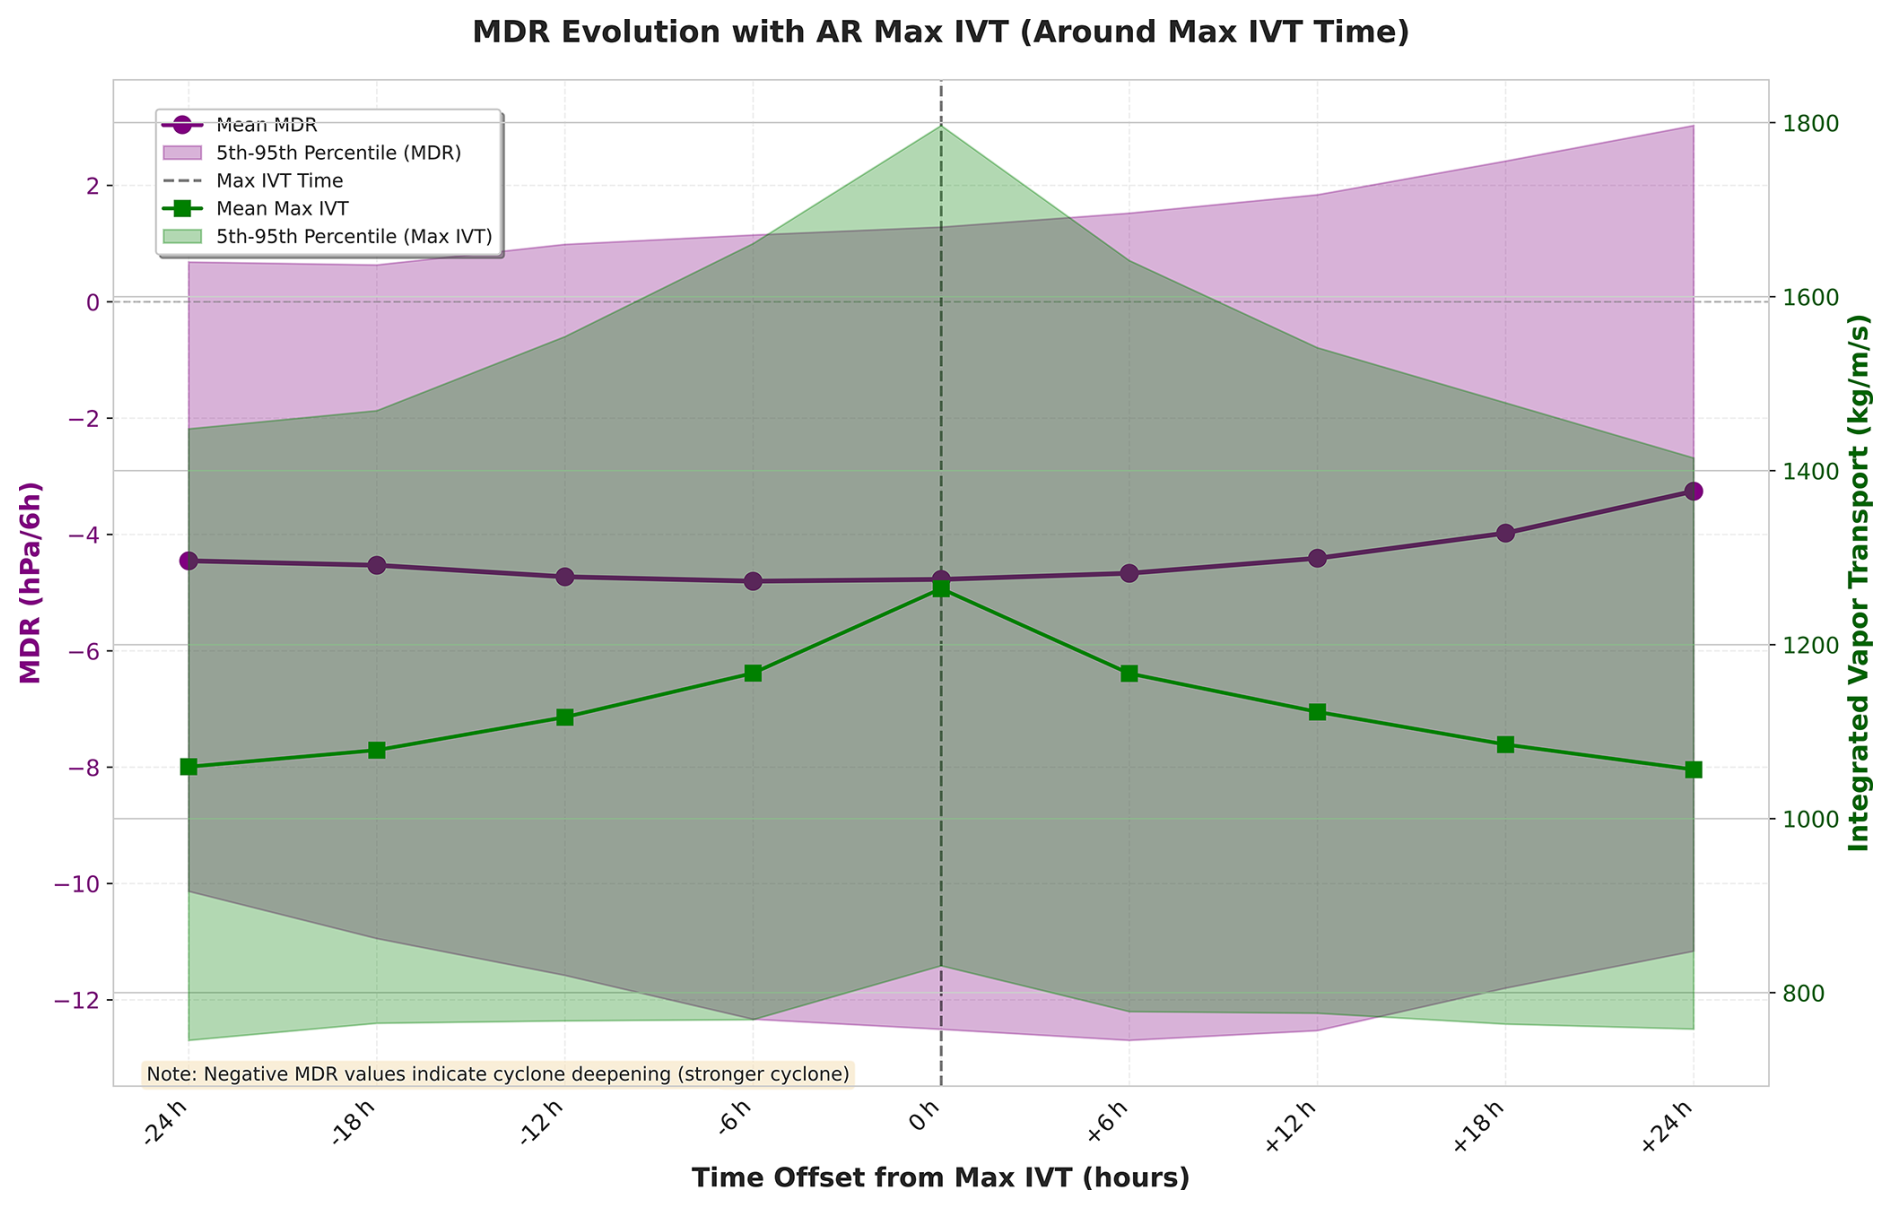
Figure 9Evolution of IVT (green) and the associated MDR (purple) around the time of maximum IVT within the AR. The maximum IVT is defined as the highest IVT value within the AR area. The MDR is calculated for each ETC that has an associated AR. Shading colours represent the distribution of MDR (purple) and Max IVT (green) between the 5th and 95th percentiles.
5.3 Precipitation and MDR distribution around AR's peak intensity
Synthesizing the findings presented above and in Sect. 4, Figs. 8 and 9 illustrate the relationship between AR's precipitation, precipitation where the AR and WCB ascent overlap, and the MDR, all considered from the perspective of the AR's maximum IVT occurrence (IVTmax). Note that in this section we change the point of view from the MDP to the AR's IVTmax. Mean precipitation within the AR area (Fig. 8, blue) shows a small increase from −24 h until the IVTmax and then a pronounced decrease until +24 h. The mean precipitation on the AR and WCB ascent overlap region (Fig. 8, red) shows a similar pattern as the AR's mean precipitation but presenting higher values. This shows the ascent's influence on precipitation occurrence within the AR. For the MDR distribution (considering only the associated ETCs, Fig. 9, purple), we take the associated ETC, calculate where the MDP occurs, and then see where (in the AR lifecycle) it occurs. As we observe in the mean distribution (purple line), the mean MDR values remain largely uniform from −24 to +12 h of the IVTmax. As for the maximum IVT (Fig. 9, green), an average of ∼ 1300 kg m−1 s−1 occurs at peak intensity, with an increase of moisture as the AR develops and a pronounced decrease as precipitation occurs within 6 h of the AR's peak intensity. Notably, on the AR's peak intensity, the distribution reaches 1800 kg m−1 s−1. Consistent with Fig. 7, the highest precipitation occurs on (and before) the MDP of the ETC, closer to the AR's axis before the intensification of the ETC, where the ascent phase presents a northward extension.
The climatological interplay among ARs, WCBs, and ETCs in the North Atlantic constitutes a tightly coupled, process-driven system (Dacre et al., 2019; Dacre and Clark, 2025). Their three-phase structure is physically inseparable from ETC dynamics: the WCB inflow forces the wind convergence in the boundary layer; the AR is the signature of the organized transport of moisture, usually located equatorward of the low's center; and the WCB ascent forces the moisture upward, leading to precipitation formation and the release of latent heat reinforcing the cyclone's circulation (Sodemann et al., 2020). This trio forms a moisture-dynamics-thermodynamics feedback loop, where each component modulates the others' intensity and lifecycle.
The spatial alignment of the three systems is dynamically consistent with the classical structure of mature ETCs, where the AR is positioned within the cyclone's warm sector, typically to the south and southwest of the low-pressure center (Eiras-Barca et al., 2018; Zhang et al., 2019). The collocation of WCB inflow with the AR's moisture plume confirms that the AR provides the moisture reservoir for the WCB, while the WCB ascent (located just ahead of the surface cold front) drives the conversion of this moisture into precipitation (Heitmann et al., 2024; Wernli and Gray, 2024). The WCB outflow maximum southeast of Greenland is consistent with the anticyclonic branch of WCBs, which contributes to upper-tropospheric ridge building (Saffin et al., 2021; Vishnupriya et al., 2025). Our finding that 81 % of AR objects in our sample are coupled with WCB ascent is higher than the ∼ 23 % reported by Sodemann et al. (2020). Several methodological differences likely contribute to this discrepancy. First, our use of the IPART method, which identifies ARs based on spatial “spikiness” rather than absolute IVT thresholds, tends to detect a broader range of AR intensities and shapes, including weaker systems that may be missed by magnitude-threshold methods. Second, our analysis specifically requires the WCB ascent phase to overlap with the AR object, while Sodemann et al. (2020) considered overlap of the WCB trajectory (as an object, instead of the three phases separated) with an AR.
The enhancement of IVT and spatial extent in WCB-coupled ARs is likely a direct consequence of the intensified low-level convergence associated with the WCB inflow phase, which draws in and concentrates water vapor over a wider area. The displacement of the heaviest precipitation northeast of the AR's IVT axis underscores that the core of maximum moisture flux and the region of most vigorous ascent are frequently misaligned. This weak signal in AR-only events likely arises from less efficient mechanisms like broad slantwise ascent or residual frontal lift, which lack the focused, enhanced vertical motion characteristics of a WCB (Oertel et al., 2021). The composite results demonstrate that the WCB ascent and AR are not merely co-located but the former plays a critical role in transforming the AR's moisture into a possible extreme precipitation event. This has direct forecasting implications: assuming precipitation is co-located with the IVT maximum would lead to significant forecast errors.
The region where the highest precipitation matches the highest WCB ascent occurrence coincides with the typical location of the cyclone's warm front, where large-scale uplift and conditional symmetric instability can trigger deep convection (Wernli and Gray, 2024). This indicates that the WCB's organized ascent is the primary mechanism converting AR moisture into intense rainfall, a distinction crucial for operational forecasting, as it demonstrates that extreme precipitation is not merely a result of high moisture content but also strongly associated with the presence and location of strong ascent.
The phased evolution outlines a feedback loop: intense convergence (inflow) feeds both the AR and the cyclone. Diabatic release in the WCB ascent intensifies the cyclone (peaking at MDP) and generates intense precipitation within the AR. Finally, the cyclone's modification of the upper-level flow (outflow) begins to alter the large-scale environment, contributing to the system's decay. This tight temporal coupling, occurring within 12 h windows, underscores that, for WCB-coupled ARs, the AR, WCB, and ETC should be considered an integrated, co-evolving system rather than independent features. This conclusion applies specifically to the subset of ARs associated with ETCs and overlapped with the WCB ascent phase. For AR-only events, such strong coupling is not evident, as the absence of WCB ascent appears to decouple precipitation generation from the cyclone's intensification. Latent heat release through condensation in the WCB ascent enhances cyclone deepening, creating a positive feedback loop where strong ascent leads to more latent heat, which deepens the low, which in turn strengthens the pressure gradient and the low-level inflow, feeding even more moisture into the system. This explains why the most extreme precipitation events are linked to the MDP of the associated ETC (McErlich et al., 2023). The dynamic interactions between these components are critical, as errors in forecasting the jet stream that steers an AR, or inaccuracies in estimating moisture availability, can lead to significant forecast errors (Lavers et al., 2020; Li et al., 2024).
The temporal evolution throughout the ETC development, with key transitions occurring within narrow ±12 h windows, highlights the dynamical link, where the frequency of WCB ascent, the magnitude of IVT, and the spatial extent and intensity of precipitation all reach their maximum values at the exact time of the cyclone's most rapid deepening. This maximum ascent coinciding with the cyclone's strongest intensification is consistent with the climatological WCB lifecycle documented by Heitmann et al. (2024) for the North Atlantic, who similarly found that the most rapidly ascending WCBs are associated with the highest precipitation rates.
For forecasting, this means that accurately predicting the timing and location of the MDP is of utmost importance, as it serves as the point for the entire sequence of high-impact weather. This coupling explains the forecast errors documented by Lavers et al. (2020) and Li et al. (2024), where inaccuracies in the jet stream or initial moisture fields propagate through the system, leading to significant errors in the predicted location and intensity of the AR and its associated extreme precipitation. Moreover, while the magnitude of IVT is expected to increase with temperature due to the Clausius–Clapeyron relation (Payne et al., 2020), our results suggest that the dynamic component – specifically the presence and location of the WCB ascent – will ultimately determine future flood risk severity, requiring that climate models adequately resolve these process interactions. In addition, the sensitivity of WCB ascent characteristics to cloud microphysical parameterizations and inflow environmental conditions, as quantified by Oertel et al. (2025), further increases these forecast challenges. Their perturbed parameter ensemble demonstrates that uncertainties in the representation of microphysical processes locally modify vertical velocity along the WCB and determine precipitation efficiency, with distinct impacts on the spatial distribution and intensity of precipitation – precisely the features our composite analysis identifies as critical for extreme event outcomes.
The critical role of the WCB in converting moisture to extreme precipitation is underscored by previous work. For example, Catto et al. (2015) demonstrated that the role of the WCB in producing extreme precipitation events (EPEs), when matched with fronts, was found to be between 2 and 10 times more critical to EPE occurrence than when considering fronts alone. Similarly, Pfahl et al. (2014) showed that 70 %–80 % of extreme precipitation in the extratropics is associated with a WCB. This is consistent with our own finding that this result holds in the absence of orography: contrary to the western coast of North America, where topography acts as an uplift mechanism for extreme precipitation, in western Europe the dynamical mechanism (the ascent phase) may be more important for the occurrence of EPEs.
The aim of this study was to perform a composite-based analysis, to systematically quantify the dynamical linkage between ARs, WCBs, and ETCs over the North Atlantic. This integrated methodology addresses a critical gap in understanding the spatial misalignment between the core of maximum IVT, which defines the AR, and the region of strongest WCB ascent which is a driver of precipitation (Pfahl et al., 2014). The main conclusions are formulated below as answers to our research questions as follows:
-
How does the presence or absence of the WCB ascent phase influence the intensity and spatial distribution of precipitation within ARs, i.e., how different are the AR characteristics when the ascent phase is present within the AR? Composite analysis reveals that ARs coupled with WCB ascent exhibit stronger IVT (exceeding 1100 kg m−1 s−1) and a broader spatial extent compared to AR-only events. This intensification is supported by enhanced low-level convergence, observed in the WCB inflow region, located predominantly north of the AR core. WCB ascent phase appears to dictate the location and intensity of the precipitation field. While both AR classes transport large moisture amounts, only WCB-coupled events generate heavy precipitation maxima (> 8 mm per AR) shifted northeast of the AR centroid. In AR-only cases, precipitation is substantially weaker (with values lower than 5 mm) and forms a diffuse northeastward extent towards the cyclone center.
-
How does the AR-WCB association evolve during the lifecycle of the associated ETC particularly around the time of maximum deepening?
Temporal composites around the ETC's MDP illustrate a dynamic sequence: (i) (−24 to −12 h) strong WCB inflow, potentially allowing the inflow of moisture into the developing AR. (ii) (MDP) WCB ascent, AR IVT, and precipitation all peak simultaneously, with the precipitation pattern resembling the ascent footprint. (iii) (+12 to +24 h) ascent weakens, while WCB outflow peaks, and the number of ARs decreases as moisture is removed through precipitation.
Our results have significant implications for both weather prediction and climate modelling. Operational models often struggle to accurately represent the timing and location of AR-related precipitation extremes, partly because they may not adequately resolve the mesoscale dynamics that govern the interaction between the AR's moisture plume and the WCB's ascent. The finding that precipitation maxima are displaced from the IVT core underscores the need for forecast verification metrics that assess not just the AR's position and intensity but also the model's ability to correctly simulate the location of frontal ascent and embedded convection. Moreover, ongoing climate change is expected to change both ETC (Catto et al., 2019) and AR characteristics (Payne et al., 2020). This reinforces our conclusion that the dynamic component will ultimately determine future flood risk severity, requiring that climate models adequately resolve these process interactions.
Several limitations of this study should be acknowledged. First, the IPART algorithm detects ARs based on spatial “spikiness” rather than absolute IVT thresholds. While this approach is advantageous for detecting ARs across different climate regimes, it may detect a broader population of moisture plumes than threshold-based methods, potentially including weaker features that are less dynamically significant. Second, our analysis is limited to the North Atlantic basin during the extended winter season (October–March); the extent to which these findings apply to other ocean basins (e.g., North Pacific, Southern Hemisphere) or other seasons remains to be tested. Third, while the secondary 4000 km radius for AR-ETC association was applied to only 5 % of cases, it introduces the possibility of spurious pairings, though we verified that excluding these cases does not alter the composite patterns.
Looking forward, our findings suggest the use of convection-permitting models to investigate the role of embedded convection within WCBs, a process that these studies identified as a key amplifier that our composite analysis could not fully resolve. In addition, this composite analysis should be expanded to other ocean basins to assess the universality of these dynamics. Addressing this gap is essential for understanding how the dynamic coupling identified here will shape the most severe midlatitude hydrological extremes in a warming climate.
ERA5 reanalyses are available from the Copernicus Climate Data Store at https://doi.org/10.24381/CDS.ADBB2D47 (Copernicus Climate Change Service, Climate Data Store, 2023). The WCB data was accessed through the LSDF Online Storage service of KIT (Karlsruhe Institute of Technology), provided by Quinting and Grams (2022). The exact version of the time-lag models, the decision thresholds, the 30 d running mean trajectory-based WCB climatology, and code to process the input data for the models are archived on Zenodo at https://doi.org/10.5281/zenodo.5154980 (Quinting and Grams, 2021). The ETC data was provided by Svenja Christ.
The supplement related to this article is available online at https://doi.org/10.5194/wcd-7-2043-2026-supplement.
AMR, RMT, JGP, JQ and TMF conceived and designed the study. TMF performed the data analysis and prepared the figures. AMR, RMT, JQ, SC and JGP contributed with methodologies and data. The initial draft was written by TMF, supported by RMT, AMR, JQ, SC and JGP. All authors contributed to discussions, comments, and text revisions.
The contact author has declared that none of the authors has any competing interests.
Publisher's note: Copernicus Publications remains neutral with regard to jurisdictional claims made in the text, published maps, institutional affiliations, or any other geographical representation in this paper. The authors bear the ultimate responsibility for providing appropriate place names. Views expressed in the text are those of the authors and do not necessarily reflect the views of the publisher.
The authors thank the German Climate Computing Center (DKRZ), Hamburg, for providing computing and storage resources under project number bb0105. JGP thanks AXA Research Fund for support. We would like to thank the two anonymous reviewers and the editor for their valuable comments.
This work was supported by the Portuguese Science Foundation (FCT) I.P./MCTES through the project AMOTHEC (DRI/India/0098/2020) with https://doi.org/10.54499/DRI/India/0098/2020 and through national funds (PIDDAC): LA/P/0068/2020 – (https://doi.org/10.54499/LA/P/0068/2020), UID/50019/2025 – (https://doi.org/10.54499/UID/50019/2025), UID/PRR/50019/2025 – https://doi.org/10.54499/UID/PRR/50019/2025), UID/PRR2/50019/2025. TMF was supported by FCT through PhD grant no. UI/BD/154496/2022. SC and JGP contributions were funded by the German Federal Ministry of Research, “A6 Intensity and structural changes of extreme midlatitude cyclones in a warming climate” (grant no. 01LP2322A). The contribution of JQ was funded by the European Union (ERC, ASPIRE, grant no. 101077260). AMR was supported by the Helmholtz “Changing Earth – Sustaining our Future” program.
The article processing charges for this open-access publication were covered by the Karlsruhe Institute of Technology (KIT).
This paper was edited by Silvio Davolio and reviewed by two anonymous referees.
Asharaf, S., Guan, B., and Waliser, D. E.: ROTATE: A coordinate system for analyzing atmospheric rivers, Geophys. Res. Lett., 51, e2023GL106736, https://doi.org/10.1029/2023GL106736, 2024.
Bennetts, D. A. and Sharp, J. C.: The relevance of conditional symmetric instability to the prediction of mesoscale frontal rainbands, Q. J. Roy. Meteor. Soc., 108, 595–602, https://doi.org/10.1002/qj.49710845707, 1982.
Binder, H., Boettcher, M., Joos, H., and Wernli, H.: The Role of Warm Conveyor Belts for the Intensification of Extratropical Cyclones in Northern Hemisphere Winter, J. Atmos. Sci., 73, 3997–4020, https://doi.org/10.1175/JAS-D-15-0302.1, 2016.
Bjerknes, J. and Solberg, H.: Life cycle of cyclones and the polar front theory of atmospheric circulation, Geofys. Publ., 3, 1–18. https://geofysikk.org/NGF/GeoPub/NGF_GP_Vol03_no1.pdf (last access: 11 January 2026), 1922.
Carlson, T. N.: Airflow Through Midlatitude Cyclones and the Comma Cloud Pattern, Mon. Weather Rev., 108, 1498–1509, https://doi.org/10.1175/1520-0493(1980)108<1498:ATMCAT>2.0.CO;2, 1980.
Catto, J. L., Madonna, E., Joos, H., Rudeva, I., and Simmonds, I.: Global Relationship between Fronts and Warm Conveyor Belts and the Impact on Extreme Precipitation, J. Climate, 28, 8411–8429, https://doi.org/10.1175/JCLI-D-15-0171.1, 2015.
Catto, J. L., Shaffrey, L. C., and Hodges, K. I.: Can Climate Models Capture the Structure of Extratropical Cyclones?, J. Climate, 23, 1621–1635, https://doi.org/10.1175/2009JCLI3318.1, 2010.
Catto, J. L., Ackerley, D., Booth, J. F., Champion, A. J., Colle, B. A., Pfahl, S., Pinto, J. G., Quinting, J. F., and Seiler, C.: The Future of Midlatitude Cyclones, Current Climate Change Reports 5, 407–420, https://doi.org/10.1007/s40641-019-00149-4, 2019.
Christ, S., Quinting, J., and Pinto, J. G.: Characteristics of diabatically influenced cyclones with high wind damage potential in Europe, Q. J. Roy. Meteor. Soc., 152, e70083, https://doi.org/10.1002/qj.70083, 2025.
Copernicus Climate Change Service, Climate Data Store: ERA5 hourly data on single levels from 1940 to present, Copernicus Climate Change Service (C3S) Climate Data Store (CDS) [data set], https://doi.org/10.24381/cds.adbb2d47, 2023.
Dacre, H. F.: A review of extratropical cyclones: observations and conceptual models over the past 100 years, Weather, 75, 4–7, https://doi.org/10.1002/wea.3653, 2020.
Dacre, H. F. and Clark, P. A.: A kinematic analysis of extratropical cyclones, warm conveyor belts and atmospheric rivers, npj Clim. Atmos. Sci., 8, 97, https://doi.org/10.1038/s41612-025-00942-z, 2025.
Dacre, H. F., Clark, P. A., Martinez-Alvarado, O., Stringer, M. A., and Lavers, D. A.: How do atmospheric rivers form?, B. Am. Meteorol. Soc., 96, 1243–1255, https://doi.org/10.1175/BAMS-D-14-00031.1, 2015.
Dacre, H. F., Martínez-Alvarado, O., and Mbengue, C. O.: Linking atmospheric rivers and warm conveyor belt airflows, J. Hydrometeorol., 20, 1183–1196, https://doi.org/10.1175/JHM-D-18-0175.1, 2019.
Eiras-Barca, J., Ramos, A. M., Pinto, J. G., Trigo, R. M., Liberato, M. L. R., and Miguez-Macho, G.: The concurrence of atmospheric rivers and explosive cyclogenesis in the North Atlantic and North Pacific basins, Earth Syst. Dynam., 9, 91–102, https://doi.org/10.5194/esd-9-91-2018, 2018.
Eiras-Barca, J., Brands, S., and Miguez-Macho, G.: Seasonal variations in North Atlantic atmospheric river activity and associations with anomalous precipitation over the Iberian Atlantic Margin, J. Geophys. Res.-Atmos., 121, 931–948, https://doi.org/10.1002/2015JD023379, 2016.
Federer, M., Papritz, L., Sprenger, M., and Grams, C. M.: Synoptic perspective on the conversion and maintenance of local available potential energy in extratropical cyclones, Weather Clim. Dynam., 6, 211–230, https://doi.org/10.5194/wcd-6-211-2025, 2025.
Fernández-Alvarez, J. C., Pérez-Alarcón, A., Eiras-Barca, J., Rahimi, S., Nieto, R., and Gimeno, L. Projected changes in atmospheric moisture transport contributions associated with climate warming in the North Atlantic, Nat. Commun., 14, 6476, https://doi.org/10.1038/s41467-023-41915-1, 2023.
Ferreira, T. M., Gaspar, T. H., Molina, M. O., Trigo, R. M., Deus, R., and Ramos, A. M.: Extreme rainfall in Madeira: the June 2023 weather event, Weather, 81, 164–171 https://doi.org/10.1002/wea.7786, 2025a.
Ferreira, T. M., Trigo, R. M., Gaspar, T. H., Pinto, J. G., and Ramos, A. M.: The record-breaking precipitation event of December 2022 in Portugal, Nat. Hazards Earth Syst. Sci., 25, 609–623, https://doi.org/10.5194/nhess-25-609-2025, 2025b.
Fink, A. H., Brücher, T., Ermert, V., Krüger, A., and Pinto, J. G.: The European storm Kyrill in January 2007: synoptic evolution, meteorological impacts and some considerations with respect to climate change, Nat. Hazards Earth Syst. Sci., 9, 405–423, https://doi.org/10.5194/nhess-9-405-2009, 2009.
Gershunov, A., Shulgina, T., Ralph, F. M., Lavers, D. A., and Rutz, J. J.: Assessing the climate-scale variability of atmospheric rivers affecting western North America, Geophys. Res. Lett., 44, 7900–7908, https://doi.org/10.1002/2017GL074175, 2017.
Gimeno, L., Nieto, R., Vázquez, M., and Lavers, D. A.: Atmospheric Rivers: a mini-review, Frontiers in Earth Science, 2, https://doi.org/10.3389/feart.2014.00002, 2014.
Glinton, M. R., Gray, S. L., Chagnon, J. M., and Morcrette, C. J.: Modulation of precipitation by conditional symmetric instability release, Atmos. Res., 185, 186–201, https://doi.org/10.1016/j.atmosres.2016.10.013, 2017.
Guo, Y., Shinoda, T., Guan, B., Waliser, D. E., and Chang, E. K. M.: Statistical relationship between atmospheric rivers and extratropical cyclones and anticyclones, J. Climate, 33, 7817–7834, https://doi.org/10.1175/JCLI-D-19-0126.1, 2020.
Heitmann, K., Sprenger, M., Binder, H., Wernli, H., and Joos, H.: Warm conveyor belt characteristics and impacts along the life cycle of extratropical cyclones: case studies and climatological analysis based on ERA5, Weather Clim. Dynam., 5, 537–557, https://doi.org/10.5194/wcd-5-537-2024, 2024.
Hersbach, H., Bell, B., Berrisford, P., Hirahara, S., Horányi, A., Muñoz-Sabater, J., Nicolas, J., Peubey, C., Radu, R., Schepers, D., Simmons, A., Soci, C., Abdalla, S., Abellan, X., Balsamo, G., Bechtold, P., Biavati, G., Bidlot, J., Bonavita, M., Chiara, G., Dahlgren, P., Dee, D., Diamantakis, M., Dragani, R., Flemming, J., Forbes, R., Fuentes, M., Geer, A., Haimberger, L., Healy, S., Hogan, R. J., Hólm, E., Janisková, M., Keeley, S., Laloyaux, P., Lopez, P., Lupu, C., Radnoti, G., Rosnay, P., Rozum, I., Vamborg, F., Villaume, S., and Thépaut, J. N.: The ERA5 global reanalysis, Q. J. Roy. Meteor. Soc., 146, 1999–2049, https://doi.org/10.1002/qj.3803, 2020.
Hoskins, B. J. and Hodges, K. I.: New Perspectives on the Northern Hemisphere Winter Storm Tracks, J. Atmos. Sci., 59, 1041–1061, https://doi.org/10.1175/1520-0469(2002)059<1041:NPOTNH>2.0.CO;2, 2002.
Joos, H.: Warm Conveyor Belts and Their Role for Cloud Radiative Forcing in the Extratropical Storm Tracks, J. Climate, 32, 5325–5343, https://doi.org/10.1175/JCLI-D-18-0802.1, 2019.
Lavers, D. A., Ingleby, N. B., Subramanian, A. C., Richardson, D. S., Ralph, F. M., Doyle, J. D., Reynolds, C. A., Torn, R. D., Rodwell, M. J., Tallapragada, V., and Pappenberger, F.: Forecast Errors and Uncertainties in Atmospheric Rivers, Weather Forecast., 35, 1447–1458, https://doi.org/10.1175/WAF-D-20-0049.1, 2020.
Lavers, D. A., Villarini, G., Allan, R. P., Wood, E. F., and Wade, A. J.: The detection of atmospheric rivers in atmospheric reanalyses and their links to British winter floods and the large-scale climatic circulation, J. Geophys. Res.-Atmos., 117, D20106, https://doi.org/10.1029/2012JD018027, 2012.
Li, L., Shao, A., and Qiu, X.: Short-term forecast large-scale error characteristics and their relationship with precipitation forecast skill under two rainfall regimes, Atmos. Res., 298, 107152, https://doi.org/10.1016/j.atmosres.2023.107152, 2024.
Lopez-Marti, F., Ginesta, M., Faranda, D., Rutgersson, A., Yiou, P., Wu, L., and Messori, G.: Future changes in compound explosive cyclones and atmospheric rivers in the North Atlantic, Earth Syst. Dynam., 16, 169–187, https://doi.org/10.5194/esd-16-169-2025, 2025.
Lu, M., Song, Y., Huang, W., and Zhang, L.: Atmospheric rivers emerge as future freshwater reserves and heat stocks, Communications Earth & Environment, 6, 825, https://doi.org/10.1038/s43247-025-02780-6, 2025.
Luís, D., Gama, C., Gonçalves, C., Castanheira, J. M., Ramos, A. M., Sprenger, M., and Gorodetskaya, I. V.: Atmospheric rivers in the Iberian Peninsula: Connection with extratropical fronts and precipitation, J. Geophys. Res.-Atmos., 130, e2025JD043891, https://doi.org/10.1029/2025JD043891, 2025.
Madonna, E., Wernli, H., Joos, H., and Martius, O.: Warm Conveyor Belts in the ERA-Interim Dataset (1979–2010). Part I: Climatology and Potential Vorticity Evolution, J. Climate, 27, 3–26, https://doi.org/10.1175/JCLI-D-12-00720.1, 2014.
Mahto, S. S., Nayak, M. A., Lettenmaier, D. P., and Mishra, V.: Atmospheric rivers that make landfall in India are associated with flooding, Communications Earth & Environment, 4, 120, https://doi.org/10.1038/s43247-023-00775-9, 2023.
McErlich, C., McDonald, A., Renwick, J., and Schuddeboom, A.: An assessment of extra-tropical cyclone precipitation extremes over the Southern Hemisphere using ERA5, Geophys. Res. Lett., 50, e2023GL104130, https://doi.org/10.1029/2023GL104130, 2023.
Murray, R. and Simmonds, I.: A numerical scheme for tracking cyclone centres from digital data. Part I: Development and operation of the scheme, Aust. Meteorol. Mag., 39, 155–166, https://doi.org/10.1071/ES91020, 1991.
Neu, U., Akperov, M. G., Bellenbaum, N., Benestad, R., Blender, R., Caballero, R., Cocozza, A., Dacre, H. F., Feng, Y., Fraedrich, K., Grieger, J., Gulev, S., Hanley, J., Hewson, T., Inatsu, M., Keay, K., Kew, S. F., Kindem, I., Leckebusch, G. C., Liberato, M. L. R., Lionello, P., Mokhov, I. I., Pinto, J. G., Raible, C. C., Reale, M., Rudeva, I., Schuster, M., Simmonds, I., Sinclair, M., Sprenger, M., Tilinina, N. D., Trigo, I. F., Ulbrich, S., Ulbrich, U., Wang, X. L., and Wernli, H.: IMILAST: A Community Effort to Intercompare Extratropical Cyclone Detection and Tracking Algorithms, B. Am. Meteorol. Soc., 94, 529–547, https://doi.org/10.1175/BAMS-D-11-00154.1, 2013.
Oertel, A., Boettcher, M., Joos, H., Sprenger, M., Konow, H., Hagen, M., and Wernli, H.: Convective activity in an extratropical cyclone and its warm conveyor belt – a case-study combining observations and a convection-permitting model simulation, Q. J. Roy. Meteor. Soc., 145, 1406–1426, https://doi.org/10.1002/qj.3500, 2019.
Oertel, A., Boettcher, M., Joos, H., Sprenger, M., and Wernli, H.: Potential vorticity structure of embedded convection in a warm conveyor belt and its relevance for large-scale dynamics, Weather Clim. Dynam., 1, 127–153, https://doi.org/10.5194/wcd-1-127-2020, 2020.
Oertel, A., Sprenger, M., Joos, H., Boettcher, M., Konow, H., Hagen, M., and Wernli, H.: Observations and simulation of intense convection embedded in a warm conveyor belt – how ambient vertical wind shear determines the dynamical impact, Weather Clim. Dynam., 2, 89–110, https://doi.org/10.5194/wcd-2-89-2021, 2021.
Oertel, A., Miltenberger, A. K., Grams, C. M., and Hoose, C.: Sensitivities of warm conveyor belt ascent, associated precipitation characteristics and large-scale flow pattern: Insights from a perturbed parameter ensemble, Q. J. Roy. Meteor. Soc., 151, e4986, https://doi.org/10.1002/qj.4986, 2025.
Payne, A. E., Demory, M.-E., Leung, L. R., Ramos, A. M., Shields, C. A., Rutz, J. J., Siler, N., Villarini, G., Hall, A., and Ralph, F. M.: Responses and impacts of atmospheric rivers to climate change. Nature Reviews Earth & Environment, 1, 143–157. https://doi.org/10.1038/s43017-020-0030-5, 2020.
Peng, Y.-M., Fu, G., Li, P.-Y., and Ni, J.: Characteristics of super atmospheric rivers associated with explosive extratropical cyclones over the Northern Pacific Ocean, Geophys. Res. Lett., 52, e2025GL114654, https://doi.org/10.1029/2025GL114654, 2025.
Pfahl, S., Madonna, E., Boettcher, M., Joos, H., and Wernli, H.: Warm Conveyor Belts in the ERA-Interim Dataset (1979–2010). Part II: Moisture Origin and Relevance for Precipitation, J. Climate, 27, 27–40, https://doi.org/10.1175/JCLI-D-13-00223.1, 2014.
Pinto, J. G., Spangehl, T., Ulbrich, U.. and Speth, P.: Sensitivities of a cyclone detection and tracking algorithm: individual tracks and climatology, Meteorol. Z., 14, 823–838, https://doi.org/10.1127/0941-2948/2005/0068, 2005.
Pinto, J. G., Zacharias, S., Fink, A. H., Leckebusch, G. C., and Ulbrich, U.: Factors contributing to the development of extreme North Atlantic cyclones and their relationship with the NAO, Clim. Dynam., 32, 711–737, https://doi.org/10.1007/s00382-008-0396-4, 2009.
Quinting, J. F. and Grams, C. M.: EuLerian Identification of ascending AirStreams (ELIAS 2.0) in Numerical Weather Prediction and Climate Models, Version v1, Zenodo [code], https://doi.org/10.5281/zenodo.5154980, 2021.
Quinting, J. F. and Grams, C. M.: EuLerian Identification of ascending AirStreams (ELIAS 2.0) in numerical weather prediction and climate models – Part 1: Development of deep learning model, Geosci. Model Dev., 15, 715–730, https://doi.org/10.5194/gmd-15-715-2022, 2022.
Ralph, F. M., Neiman, P. J., and Wick, G. A. Satellite and CALJET Aircraft Observations of Atmospheric Rivers over the Eastern North Pacific Ocean during the Winter of 1997/98, Mon. Weather Rev., 132, 1721–1745, https://doi.org/10.1175/1520-0493(2004)132<1721:SACAOO>2.0.CO;2, 2004.
Ralph, F. M., Dettinger, M. D., Cairns, M. M., Galarneau, T. J., and Eylander, J.: Defining “Atmospheric River”: How the Glossary of Meteorology Helped Resolve a Debate, B. Am. Meteorol. Soc., 99, 837–839, https://doi.org/10.1175/BAMS-D-17-0157.1, 2018.
Ramos, A. M., Martins, M. J., Tomé, R., and Trigo, R. M.: Extreme Precipitation Events in Summer in the Iberian Peninsula and Its Relationship With Atmospheric Rivers, Frontiers in Earth Science, 6, 110, https://doi.org/10.3389/feart.2018.00110, 2018a.
Ramos, A. M., Trigo, R. M., Tomé, R., and Liberato, M. L. R.: Impacts of Atmospheric Rivers in Extreme Precipitation on the European Macaronesian Islands, Atmosphere, 9, 325, https://doi.org/10.3390/atmos9080325, 2018b.
Saffin, L., Methven, J., Bland, J., Harvey, B., and Sanchez, C.: Circulation conservation in the outflow of warm conveyor belts and consequences for Rossby wave evolution, Q. J. Roy. Meteor. Soc., 147, 3587–3610, https://doi.org/10.1002/qj.4143, 2021.
Schultz, D. M., Bosart, L. F., Colle, B. A., Davies, H. C., Dearden, C., Keyser, D., Martius, O., Roebber, P. J., Steenburgh, W. J., Volkert, H., and Winters, A. C.: Extratropical Cyclones: A Century of Research on Meteorology's Centerpiece, Meteor. Mon., 59, 16.1–16.56, https://doi.org/10.1175/AMSMONOGRAPHS-D-18-0015.1, 2019.
Schwenk, C. and Miltenberger, A.: The role of ascent timescales for warm conveyor belt (WCB) moisture transport into the upper troposphere and lower stratosphere (UTLS), Atmos. Chem. Phys., 24, 14073–14099, https://doi.org/10.5194/acp-24-14073-2024, 2024.
Sodemann, H., Wernli, H., Knippertz, P., Cordeira, J. M., Dominguez, F., Guan, B., Hu, H., Ralph, F. M., and Stohl, A.: Structure, Process, and Mechanism, in: Atmospheric Rivers, edited by: Ralph, F., Dettinger, M., Rutz, J., and Waliser, D., Springer, Cham, https://doi.org/10.1007/978-3-030-28906-5_2, 2020.
Sprenger, M. and Wernli, H.: The LAGRANTO Lagrangian analysis tool – version 2.0, Geosci. Model Dev., 8, 2569–2586, https://doi.org/10.5194/gmd-8-2569-2015, 2015.
Sprenger, M., Fragkoulidis, G., Binder, H., Croci-Maspoli, M., Graf, P., Grams, C. M., Knippertz, P., Madonna, E., Schemm, S., Škerlak, B., and Wernli, H.: Global climatologies of Eulerian and Lagrangian flow features based on ERA-Interim, B. Am. Meteorol. Soc., 98, 1739–1748, https://doi.org/10.1175/BAMS-D-15-00299.1, 2017.
Trigo, R. M., Osborn, T. J., and Corte-Real, J. M.: The North Atlantic Oscillation influence on Europe: climate impacts and associated physical mechanisms, Clim. Res., 20, 9–17, https://doi.org/10.3354/cr020009, 2002.
Ulbrich, U., Leckebusch, G. C., and Pinto, J. G.: Extra-tropical cyclones in the present and future climate: a review, Theor. Appl. Climatol., 96, 117–131, https://doi.org/10.1007/s00704-008-0083-8, 2009.
Vincent, L.: Morphological grayscale reconstruction in image analysis: applications and efficient algorithms, IEEE T. Image Process., 2, 176–201, https://doi.org/10.1109/83.217222, 1993.
Vishnupriya, S., Sprenger, M., Joos, H., and Wernli, H.: The interaction of warm conveyor belt outflows with the upper-level waveguide: a four-type climatological classification, Weather Clim. Dynam., 6, 1195–1219, https://doi.org/10.5194/wcd-6-1195-2025, 2025.
Wernli, H.: A Lagrangian-based analysis of extratropical cyclones. II: A detailed case-study, Q. J. Roy. Meteor. Soc., 123, 1677–1706, https://doi.org/10.1002/qj.49712354211, 1997.
Wernli, H. and Davies, H. C.: A Lagrangian-based analysis of extratropical cyclones. I: The method and some applications, Q. J. Roy. Meteor. Soc., 123, 467–489, https://doi.org/10.1256/smsqj.53810, 1997.
Wernli, H. and Gray, S. L.: The importance of diabatic processes for the dynamics of synoptic-scale extratropical weather systems – a review, Weather Clim. Dynam., 5, 1299–1408, https://doi.org/10.5194/wcd-5-1299-2024, 2024.
Wernli, H. and Schwierz, C.: Surface cyclones in the ERA-40 dataset (1958–2001). Part I: Novel identification method and global climatology, J. Atmos. Sci, 63, 2486–2507, https://doi.org/10.1175/JAS3766.1, 2006.
Wernli, H., Dirren, S., Liniger, M. A., and Zillig, M.: Dynamical aspects of the life cycle of the winter storm 'Lothar' (24–26 December 1999), Q. J. Roy. Meteor. Soc., 128, 405–429, https://doi.org/10.1256/003590002321042036, 2002.
Woollings, T. and Blackburn, M.: The North Atlantic Jet Stream under Climate Change and Its Relation to the NAO and EA Patterns, J. Climate, 25, 886–902, https://doi.org/10.1175/JCLI-D-11-00087.1, 2012.
Woollings, T., Hannachi, A., and Hoskins, B.: Variability of the North Atlantic eddy-driven jet stream, Q. J. Roy. Meteor. Soc., 136, 856–868, https://doi.org/10.1002/qj.625, 2010.
Xu, G., Ma, X., Chang, P., and Wang, L.: Image-processing-based atmospheric river tracking method version 1 (IPART-1), Geosci. Model Dev., 13, 4639–4662, https://doi.org/10.5194/gmd-13-4639-2020, 2020.
Zavadoff, B. L. and Kirtman, B. P.: Dynamic and Thermodynamic Modulators of European Atmospheric Rivers, J. Climate, 33, 4167–4185, https://doi.org/10.1175/JCLI-D-19-0601.1, 2020.
Zhang, Z., Ralph, F. M., and Zheng, M.: The Relationship Between Extratropical Cyclone Strength and Atmospheric River Intensity and Position, Geophys. Res. Lett., 46, 1814–1823, https://doi.org/10.1029/2018GL079071, 2019.
- Abstract
- Introduction
- Data and Methodology
- Climatological context and case study analysis of AR-WCB-ETC interactions
- The role of WCB ascent: Composite analysis from the AR perspective
- How do the AR characteristics vary throughout the ETC intensification?
- Discussion
- Conclusions
- Data availability
- Author contributions
- Competing interests
- Disclaimer
- Acknowledgements
- Financial support
- Review statement
- References
- Supplement
- Abstract
- Introduction
- Data and Methodology
- Climatological context and case study analysis of AR-WCB-ETC interactions
- The role of WCB ascent: Composite analysis from the AR perspective
- How do the AR characteristics vary throughout the ETC intensification?
- Discussion
- Conclusions
- Data availability
- Author contributions
- Competing interests
- Disclaimer
- Acknowledgements
- Financial support
- Review statement
- References
- Supplement