the Creative Commons Attribution 4.0 License.
the Creative Commons Attribution 4.0 License.
 | 18 Feb 2026
Environmental characteristics associated with the development of deep warm core Mediterranean Cyclones
Lisa Bernini
Leone Cavicchia
Fabien Desbiolles
Enrico Scoccimarro
Claudia Pasquero
Cyclonic perturbations in the Mediterranean region sometimes acquire characteristics typical of tropical cyclones, such as a deep inner warm core. In these cases, they become very intense structures that can cause large precipitations and significant damage. In this study, the environmental conditions during the intensification of cyclones are investigated using reanalysis data. A comparison of the conditions associated with the evolution of classical and intense cold-core extratropical cyclones and those associated with the development of tropical-like disturbances highlights the characteristic that favors the conversion: a much larger potential intensity and a weaker vertical wind shear. The larger potential intensity associated with Mediterranean tropical-like cyclones comes from both higher SST and a strong PV-intrusion that destabilizes the air column. Sea surface cooling induced by the cyclones is further shown to play a role in the dissipation of tropical-like cyclones. Future research should focus on the role of potential intensity as a precursor for Mediterranean tropical-like cyclone forecasting, improving predictive capabilities and risk mitigation strategies in the Mediterranean region.
- Article
(5647 KB) - Full-text XML
- BibTeX
- EndNote


Various weather-induced natural hazards in the Mediterranean region like heavy rainfall, floods, and windstorms, are associated with Mediterranean cyclones (Lionello et al., 2006; Flaounas et al., 2022). These cyclones are typically extra-tropical cyclones (ETC) that have baroclinic origins, related to the deviation of the jet stream over the Mediterranean Sea (Flocas, 2000; Fita et al., 2007; Flaounas et al., 2014). Orography also plays a role in this region surrounded by mountains and makes some areas more prone to cyclogenesis than others (Buzzi et al., 2003; Campins et al., 2011; McTaggart-Cowan et al., 2010b).
In rare cases, some cyclones develop in their mature stage characteristics similar to those of tropical cyclones (TC): an axisymmetric, deep warm core, generally with a windless cloud-free center surrounded by strong winds (Fita et al., 2007; Tous et al., 2013). Those Mediterranean Tropical-Like Cyclones (MTLC), also known as Medicanes – a portmanteau of Mediterranean Hurricanes – are particularly severe: their peak strength can reach category 1 of the TC Saffir-Simpson scale (Akhtar et al., 2014). They have recurrently affected, among others, Libya, Italy, and Greece, inflicting loss of human lives, environmental damages, and billions of Euros in losses (Bakkensen, 2017; Nastos et al., 2018). It has been shown that medicanes account for 2 % to 5 % of all extreme precipitation events in the Mediterranean Sea (Zhang et al., 2020). In addition, climatological studies suggest that in a warming climate, their intensity and duration may increase (Cavicchia et al., 2014; González‐Alemán et al., 2019). Hence, the necessity to properly understand their development and intensification processes.
Since the early works on medicanes, some key differences with respect to classical tropical cyclones have been identified. They develop over much colder waters (Tous et al., 2013; McTaggart-Cowan et al., 2010a), and they originate from baroclinic eddies. Indeed, they first develop as typical Mediterranean extratropical cyclones, meaning through the intrusion of a Potential Vorticity (PV) streamer into the Mediterranean (Raveh‐Rubin and Flaounas, 2017; Flaounas et al., 2021), and then transition towards more tropical characteristics.
The tropical transition (TT) is a process at play in many cases, even outside the Mediterranean, that describes the dynamical and thermodynamical transformation of an initially baroclinic cold-core cyclone into a thermally symmetric, warm-core system sustained primarily by diabatic heating and wind-induced surface heat exchange (WISHE; Emanuel, 1986) feedbacks rather than by horizontal temperature gradients. This paradigm, formalized by Davis and Bosart (2003, 2004) and supported by global climatologies (McTaggart-Cowan et al., 2008, 2013), highlights that the boundary between “tropical” cyclogenesis and baroclinically assisted development is fluid, with many warm-core systems benefiting from an initial baroclinic “kickstart.”
In the Mediterranean, previous studies have documented TT-like evolutions, identifying multiple pathways in which baroclinic forcing and diabatic processes interact to varying degrees (Chaboureau et al., 2011; Mazza et al., 2017; Miglietta and Rotunno, 2019; Kouroutzoglou et al., 2021). Understanding what allows and favors those transitions is the motivation of the present work.
MTLC are relatively rare phenomena, with an annual frequency that depends on the definition adopted but generally amounts to only a few cases per year (Tous and Romero, 2012; Ragone et al., 2018; Zhang et al., 2020; de la Vara et al., 2021). As a result, the physical mechanisms underlying their development have most often been investigated through detailed analyses of individual or small sets of case studies (Tous and Romero, 2012; Miglietta and Rotunno, 2019; Varlas et al., 2023; Gutiérrez‐Fernández et al., 2024). A more systematic perspective was provided by the climatological study of Cavicchia et al. (2013), based on downscaled reanalysis data, which characterized the large-scale environmental conditions associated with their formation. That study highlighted the presence, during the early stages, of weak vertical wind shear, upper-level cold intrusions, enhanced moisture availability, and strong vorticity, expressed as anomalies relative to the seasonal climatology.
However, many of these environmental features are not specific to Mediterranean tropical-like cyclones, but are also commonly associated with Mediterranean cyclones more generally, including classical cold-core systems. This raises a fundamental open question: which factors control whether a Mediterranean cyclone follows a “classical” extratropical evolution or transitions toward a tropical-like structure?
The scientific literature has not yet converged toward a unique and universally accepted definition of MTLC. This lack of consensus has recently prompted efforts to focus on key characteristics and processes associated with Medicanes (Miglietta et al., 2025). In this spirit, they propose the following definition:
A medicane is a mesoscale cyclone that develops over the Mediterranean Sea and displays tropical-like cyclone characteristics: a warm core extending into the upper troposphere, an eye-like feature in its center with spiral cloud bands around, an almost windless center surrounded by nearly symmetric sea-surface wind circulation with maximum wind speed within a few tens of kilometers from the center.
Given that the precise boundaries of what constitutes a medicane remain debated, we adopt in this study a more phenomenological approach. We use the term Deep Warm-Core Cyclone (DWCC) to refer to Mediterranean cyclones that develop a pronounced and vertically deep warm-core structure during their mature phase, regardless of whether they satisfy all the morphological or dynamical criteria of existing medicane definitions. This choice allows us to focus on the physical processes that lead to warm-core development, knowing that it can be related to multiple mechanisms.
Indeed, it can be associated with the WISHE mechanism (Emanuel, 1986). This means that DWCC evolution is due to the positive feedback between the sea surface heat fluxes and the surface wind (Emanuel, 2005; Miglietta and Rotunno, 2019). In those cases, the large release of latent heat favors the development of a warm core, as in TC, and deep convection is significant to maintain the system. Another mechanism that leads to the development of a warm core is associated with the enhancement of the low-level circulation by the upper-level PV anomaly, which in turn increases the sea-surface fluxes (Fita and Flaounas, 2018). In those cases, the warm core is mainly a consequence of warm air seclusion in the cyclone's inner core by surrounding colder air (Mazza et al., 2017; Miglietta and Rotunno, 2019), and convection becomes rather weak during the mature stage of the cyclone.
In this work, we analyze under what conditions cyclones develop a warm core. The novelty lies in providing a systematic and climatic analysis of DWCC within the broader population of Mediterranean cyclones. Rather than focusing on a limited number of emblematic events, we exploit a large dataset spanning a wide range of cyclones' types and intensities. By comparing DWCC with intense cold-core cyclones, we analyze the evolution of their structure and environmental conditions throughout the cyclone life cycle to identify the factors that distinguish warm-core development from more typical Mediterranean cyclone evolution.
In Sect. 2, the data and analysis methods used in this study are introduced. Section 3 presents the results, with a focus on the intensification and weakening phases separately. Finally, Sect. 4 discusses and comments on the outcomes in light of the existing literature.
2.1 Cyclone tracks and atmospheric conditions
Mediterranean cyclone tracks are taken from a new dataset provided by Flaounas et al. (2023). It consists of composite cyclone trajectories and intensities detected by ten different cyclone detection and tracking methods applied to hourly data of the ERA5 reanalysis (Hersbach et al., 2020) in the 42 years of 1979–2020. In the following work, we retained the cyclones tracked by at least five of the ten tracking algorithms (confidence level of five). Such a confidence level is a trade-off between “robustness” and “completeness” of the final dataset and has already been used in other studies (Givon et al., 2024). The original cyclones of Flaounas et al. (2023) have been tracked on the Extended Mediterranean Sea Region: −20–45° E, 20–50° N. To focus only on Mediterranean Cyclones, Atlantic Cyclones have been discarded by reducing the domain to: 6° W–45° E, 30–50° N. The cyclones that stay less than 6 h over the Mediterranean Sea have also been discarded to not take into account the thermal lows present over the Sahara desert.
The maximum intensity of the cyclone is defined as the lifetime minimum Sea Level Pressure, SLP, at the cyclone center, and the first time this minimum is reached is defined as time 0. Data are then organized into an intensification phase (before time 0) and a weakening phase (after time 0), although in a few cases, short re-intensification periods might occur.
Based on the position of the tracked cyclones, hourly 3D fields of temperature, moisture, wind, rainfall, geopotential height, heat fluxes, and potential vorticity have been extracted from the ERA5 reanalysis dataset in an area of 10° × 10° surrounding the center of the depression. Anomalies have been computed as departures from the climatological seasonal cycle, computed as a 7 d running mean of the daily mean values over the 42 years.
2.2 Hart cyclones phase space diagram
The cyclone phase space (CPS) diagram (Hart, 2003) has been applied to distinguish between typical asymmetric ETC with a cold inner core and axisymmetrical tropical-like cyclones (TLC) with a deep inner warm core. To construct this CPS, three parameters are needed:
-
B, the thermal asymmetry of the cyclone in the lower troposphere.
-
Vl, the lower tropospheric thermal wind
-
Vu, the upper tropospheric thermal wind
Those parameters are computed using the geopotential height field Z at three different vertical levels (900, 600, and 200 hPa) within a circle of radius 1.25° around the cyclone center. They are mathematically defined as follows:
where the over-bar indicates the mean over the area of a semicircle of radius 1.25°, located to the right (subscript R) or to the left (subscript L) of the storm trajectory.
with (at the same pressure level, in a region of radius 1.25° around the cyclone center).
In Hart's view, a TLC is a non-frontal system characterized by thermal symmetry, while an ETC is a frontal system that is thermally asymmetric. Mature TC have values of B of approximately zero while developing ETC have large positive values of B. The symmetry condition for distinguishing a TLC from a ETC is conventionally set at m.
The parameters Vl and Vu instead are related to the radial gradient of temperature in the cyclone. In a cold-core structure, the geopotential height perturbation increases with height. Cold-core structures like ETC have negative values for both −Vl and −Vu. Conversely, in a warm-core structure, the geopotential height perturbation is larger closer to the surface than at higher levels. Warm-core structures like TC have positive values for both −Vl and −Vu. Hybrid and transitioning cyclones may have a sign of −Vl that is different from −Vu.
In the present study, following the work of Cavicchia et al. (2013), Gaertner et al. (2016), Picornell et al. (2014), and Walsh et al. (2013), we define Deep Warm Core Cyclones (DWCC) as cyclones that, during part of their lifetime and while over the sea, develop a deep warm core, such that both −Vl and −Vu are positive for a minimum duration of 6 h. Owing to the hourly temporal resolution of the ERA5 dataset, −Vl and −Vu are evaluated at each individual hour of the cyclone lifetime. Consequently, classification as a DWCC requires that a cyclone exhibit a deep warm core for six consecutive 1-hourly time steps.
The ETC are the ones with a cold core, i.e. they have negative values for both −Vl and −Vu, for their whole lifetime or they have a short duration positive value for −Vl only (less than 6 h). The remaining cyclones, i.e. those with a different sign for −Vl and −Vu, are considered as hybrid and are not included in the study.
In the dataset we used, adding the B parameter threshold criterion to discriminate DWCC from ETC decreases the number of warm core cyclones by 5 %. This is likely due to the fact that most tracking algorithms used in Flaounas et al. (2023) are already considering symmetry criteria to identify a structure as a cyclone. Therefore, in this work, we only use core temperature (−Vl and −Vu parameters) to discriminate between ETC and DWCC.
2.3 Potential Intensity
Potential Intensity (PI) represents the theoretical maximum intensity a tropical cyclone (TC) can attain under specific environmental conditions. It is determined by different thermodynamic factors such as sea surface temperature, atmospheric temperature in the air column, and moisture availability. Following many influential studies (Garner et al., 2009; Vecchi et al., 2013; Wing et al., 2015; Emanuel, 2018; Xu et al., 2019), and others, we adopt the computation of PI based on Bister and Emanuel (2002):
where Ck and Cd are the surface exchange coefficients for enthalpy and momentum; Ts and To are the sea surface and outflow temperatures; CAPE∗ is the convective available potential energy of an air parcel lifted from saturation conditions at the sea surface temperature (referred to as hurricane CAPE in the following), and CAPEenv is the convective available potential energy of a near surface air parcel (referred to as environmental CAPE in the following).
The potential intensity and the CAPE variables were computed using the Python packages described in Gilford (2021). The function takes as input ERA5 sea surface temperature (SST), and temperature and relative humidity profiles at the following pressure levels: 2 m, 900 hPa, 850 hPa, 700 hPa, 500 hPa, 400 hPa, 300 hPa, 200 hPa, 100 hPa, and 50 hPa. The ratio was set to 0.9.
In computing the SST and PI composites over the previously mentioned 10° × 10° areas, grid cells that were over land have been excluded (see the percentage of cells concerned Figs. A1 & A2). Then, we also performed a sensitivity test by assigning PI=0 m s−1 in grid points over land areas. While this adjustment significantly reduces the box-averaged PI values, the results of the analysis remain qualitatively unchanged, indicating that the general conclusions of the work are not sensitive to the way in which land points are treated.
3.1 Classification of cyclones
Considering all the criteria previously mentioned, over the 42-year study period, the total number of cyclones present in the dataset is 2026, located in the Mediterranean Sea and the Black Sea. Of those 2026 cyclones, an average of 23 cyclones per year are classified as ETC cyclones (959 cyclones in total), and 3.4 cyclones per year are classified as DWCC cyclones (142 cyclones in total). The rest are intermediate or hybrid cyclones, which were not considered in the following study. Most of the cyclones identified as medicanes in the scientific literature (Dafis et al., 2020; Gutiérrez‐Fernández et al., 2024) – like Callisto (27 September 1983), Celeno (14 January 1995), Rolf (6 November 2011), Trixi (1 November 2016), Ianos (17 September 2020) – are present in the DWCC group. Others identified as Medicanes by Dafis et al. (2020) and Gutiérrez‐Fernández et al. (2024) are not considered in the present study as, according to our definition, they never developed a deep warm core (Leucosia, 24 January 1982; Zeo, 13 December 2005; Ilona, 19 January 2014; only had a low-level warm core). Furthermore, we emphasize that our DWCC group also includes other cyclone types, such as warm seclusions, as previously mentioned.
To ensure a meaningful comparison between categories, the ETC were further divided into two mutually exclusive intensity-based groups. The 15 % of ETC with the lowest Sea Level Pressure (SLP) values were classified as Strong ETC (SETC). This group contains 144 cyclones, a number deliberately chosen to be close to the size of the DWCC sample (142 cyclones), thereby making the two groups more comparable. All remaining ETC not classified as SETC (815 cyclones) were assigned to a separate group, labeled Weak ETC (WETC). Thus, SETC and WETC are disjoint subsets of the ETC population, with no overlap between them. To test the robustness of this classification, we repeated the analysis by defining SETC as the 20 % of ETC with the lowest SLP, and by using maximum wind speed instead of minimum SLP. These alternative definitions produced results consistent with those shown in Sect. 3.3.
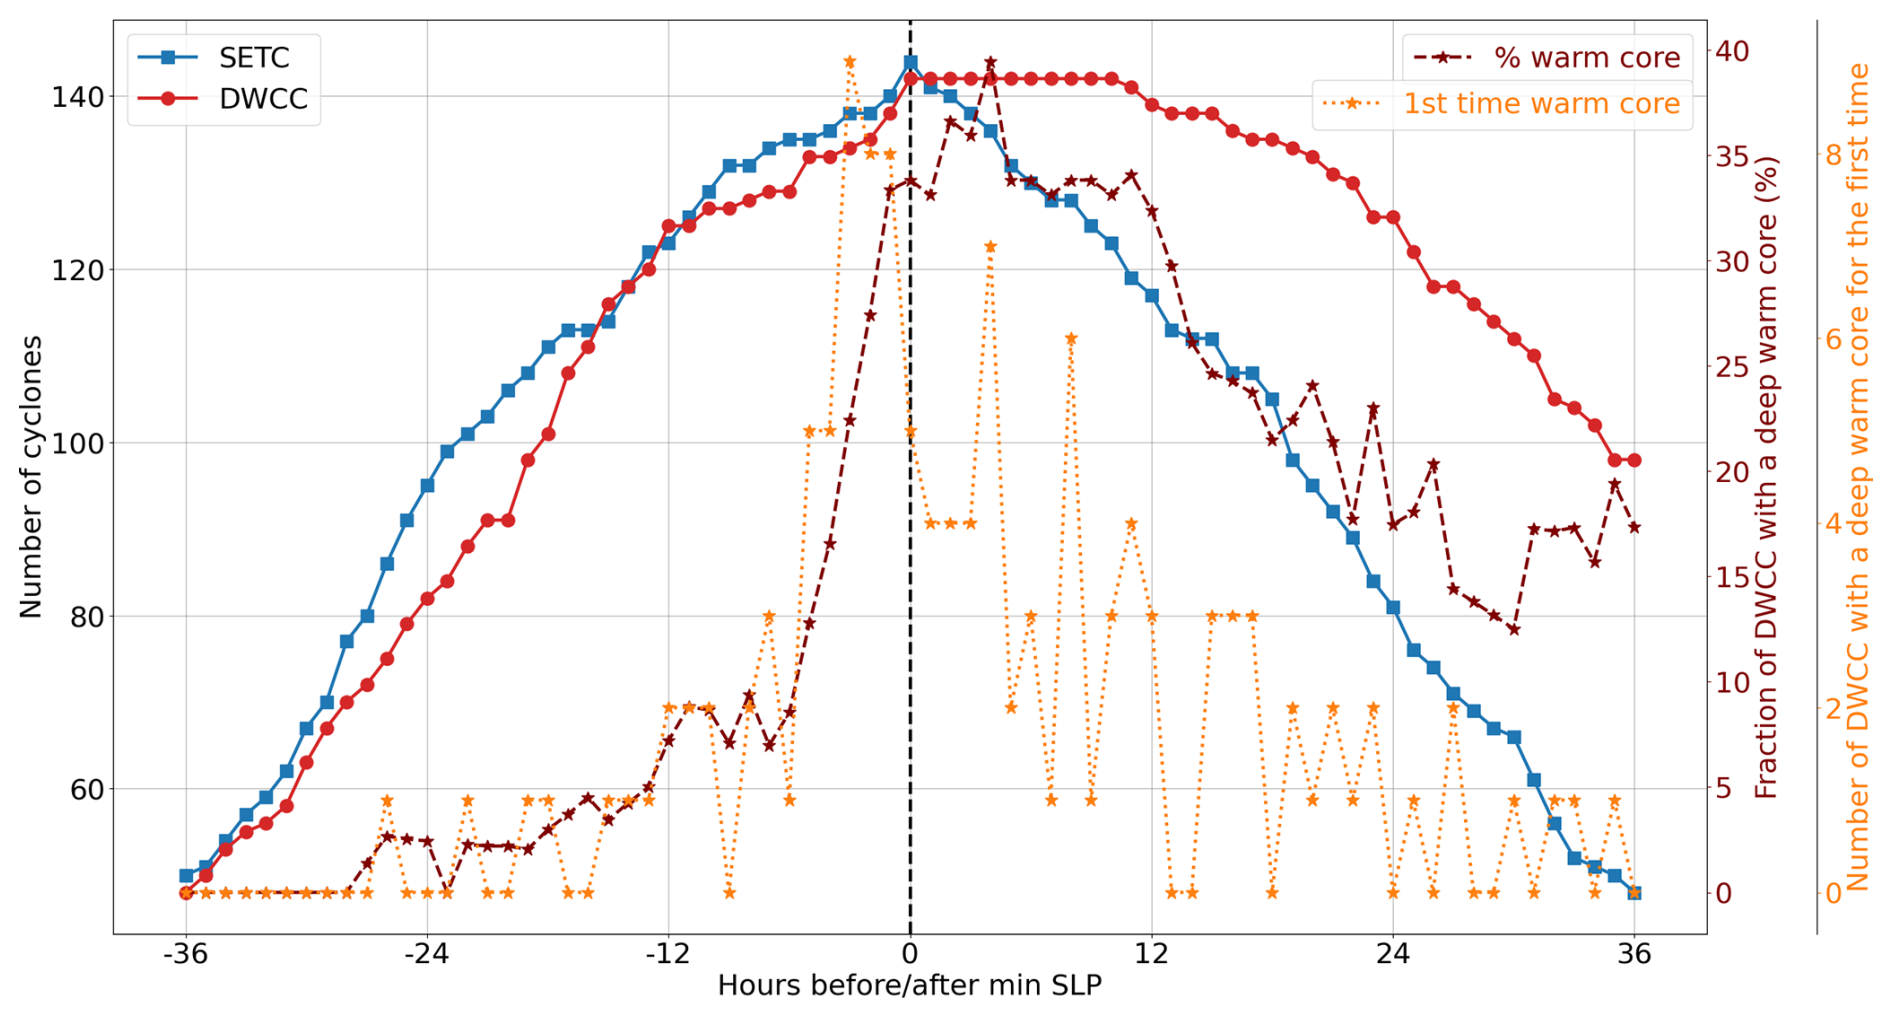
Figure 1Time evolution with respect to minimum SLP of the number of SETC (blue solid line) and DWCC (red solid line), proportion of DWCC that have a warm-core at each time step (maroon dashed line), and number of DWCC that have a deep warm core for the first time (dotted orange line).
To construct composites consistently across all cyclones, we define time t=0 as the moment of maximum intensity, identified as the minimum SLP. This common reference point allows for a homogeneous comparison between categories. The evolution of the number of DWCC and SETC in the period from 36 h before to 36 h after the cyclones' maximum intensity is shown in Fig. 1, with the count decreasing both for negative and positive time intervals due to the limited duration of the tracks. On average, the tracks last 64 h for normal and SETC, while they last much longer (89 h) for DWCC, the difference between the classes being statistically significant at the 99.9 % confidence level. It is also worth noting that the average duration of the warm core in DWCC is 13.5 h.
Figure 1 also presents the proportion of DWCC that have a full warm core (positive values for both −Vl and −Vu) at any given time lag from 0. About 40 % of DWCC have a full warm core at the time of peak intensity, developed in most cases less than 6 h before, and a total of 75 % have at least a lower or an upper warm core at time t=0, while the remaining DWCC develop a warm core in the subsequent hours. Importantly, we emphasize that the timing of maximum intensity does not coincide with the warm-core transition itself: in many cases, the warm core develops well after peak intensity, while in others it is already established several hours beforehand. However, what matters for our analysis is that at 36 h before the maximum intensity, none of the cyclones in the DWCC category present a deep warm core. It means that they are still in their typical cold core or hybrid conditions at those time-steps. For this reason, the difference in the tropospheric conditions between ETC and DWCC at 36 h before the peak intensity is investigated in Sect. 3.3 to identify possible precursors to the development of the deep warm core.
3.2 General characteristics
Cyclones in the Mediterranean are known to occur preferentially in specific regions, including the Gulf of Genoa, the Adriatic Sea, the Black Sea, close to Cyprus, and in northwest Africa, at the leeward side of the Atlas Mountains (Thorncroft and Flocas, 1997; Lionello et al., 2016; Flocas et al., 2010; Campins et al., 2011; Ulbrich et al., 2012; Reale and Lionello, 2013; Ammar et al., 2014; Maslova et al., 2020). As revealed in Fig. 2, which shows the spatial density of tracks separated into ETC and DWCC, the overall distribution of the cyclones analyzed in this study matches the geographical localization of Mediterranean cyclones, but cyclones of different categories are preferentially located in different positions. Most SETC are mainly located in the Gulf of Genoa while cyclones that develop a warm core are mainly present in the western Mediterranean Sea and the Ionian Sea, with some present in the Black Sea, in line with previous studies (Cavicchia et al., 2014; Tous and Romero, 2012). It is important to note that at 36 h before their maximum intensity, the timestep at which we investigate the environmental conditions associated with each category of cyclone in the next section, only one third of SETC have their center over the sea, while about half of DWCC have their center over the sea. This difference is consistent with the already mentioned role played by the air-sea exchanges in the development of DWCC.
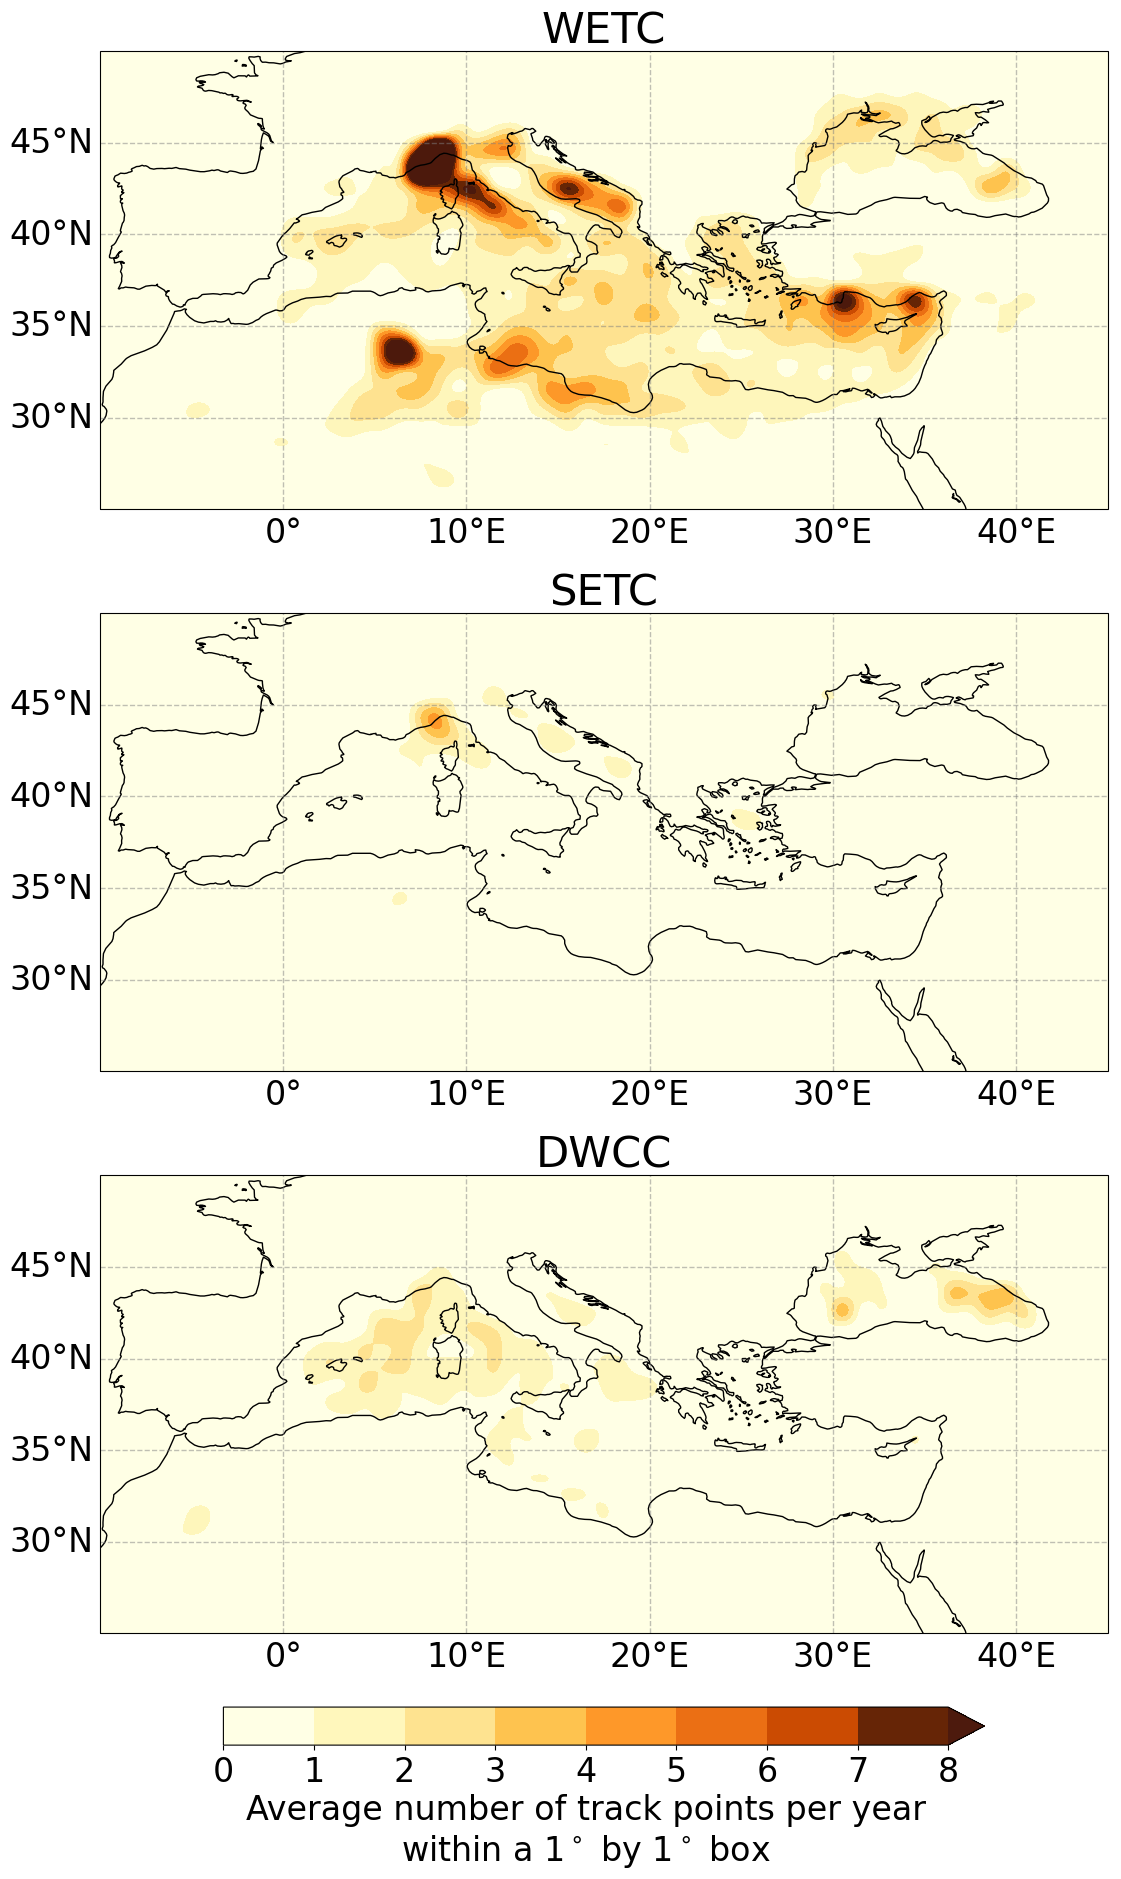
Figure 2Spatial density of cyclone tracks expressed as the average count of track points per year within a 1° × 1° box.
The seasonality of Mediterranean cyclones indicates a preferential occurrence in spring and fall (Campins et al., 2011). This is reflected both in the occurrence of ETC and DWCC (see Fig. 3). Several studies have similarly shown that Mediterranean cyclone activity often peaks during the transition seasons, with enhanced cyclogenesis in spring linked to increasing surface temperatures, strong land–sea thermal contrasts, and elevated atmospheric moisture availability (Trigo et al., 1999; Lionello et al., 2016; Flaounas et al., 2022; Kotsias et al., 2023).
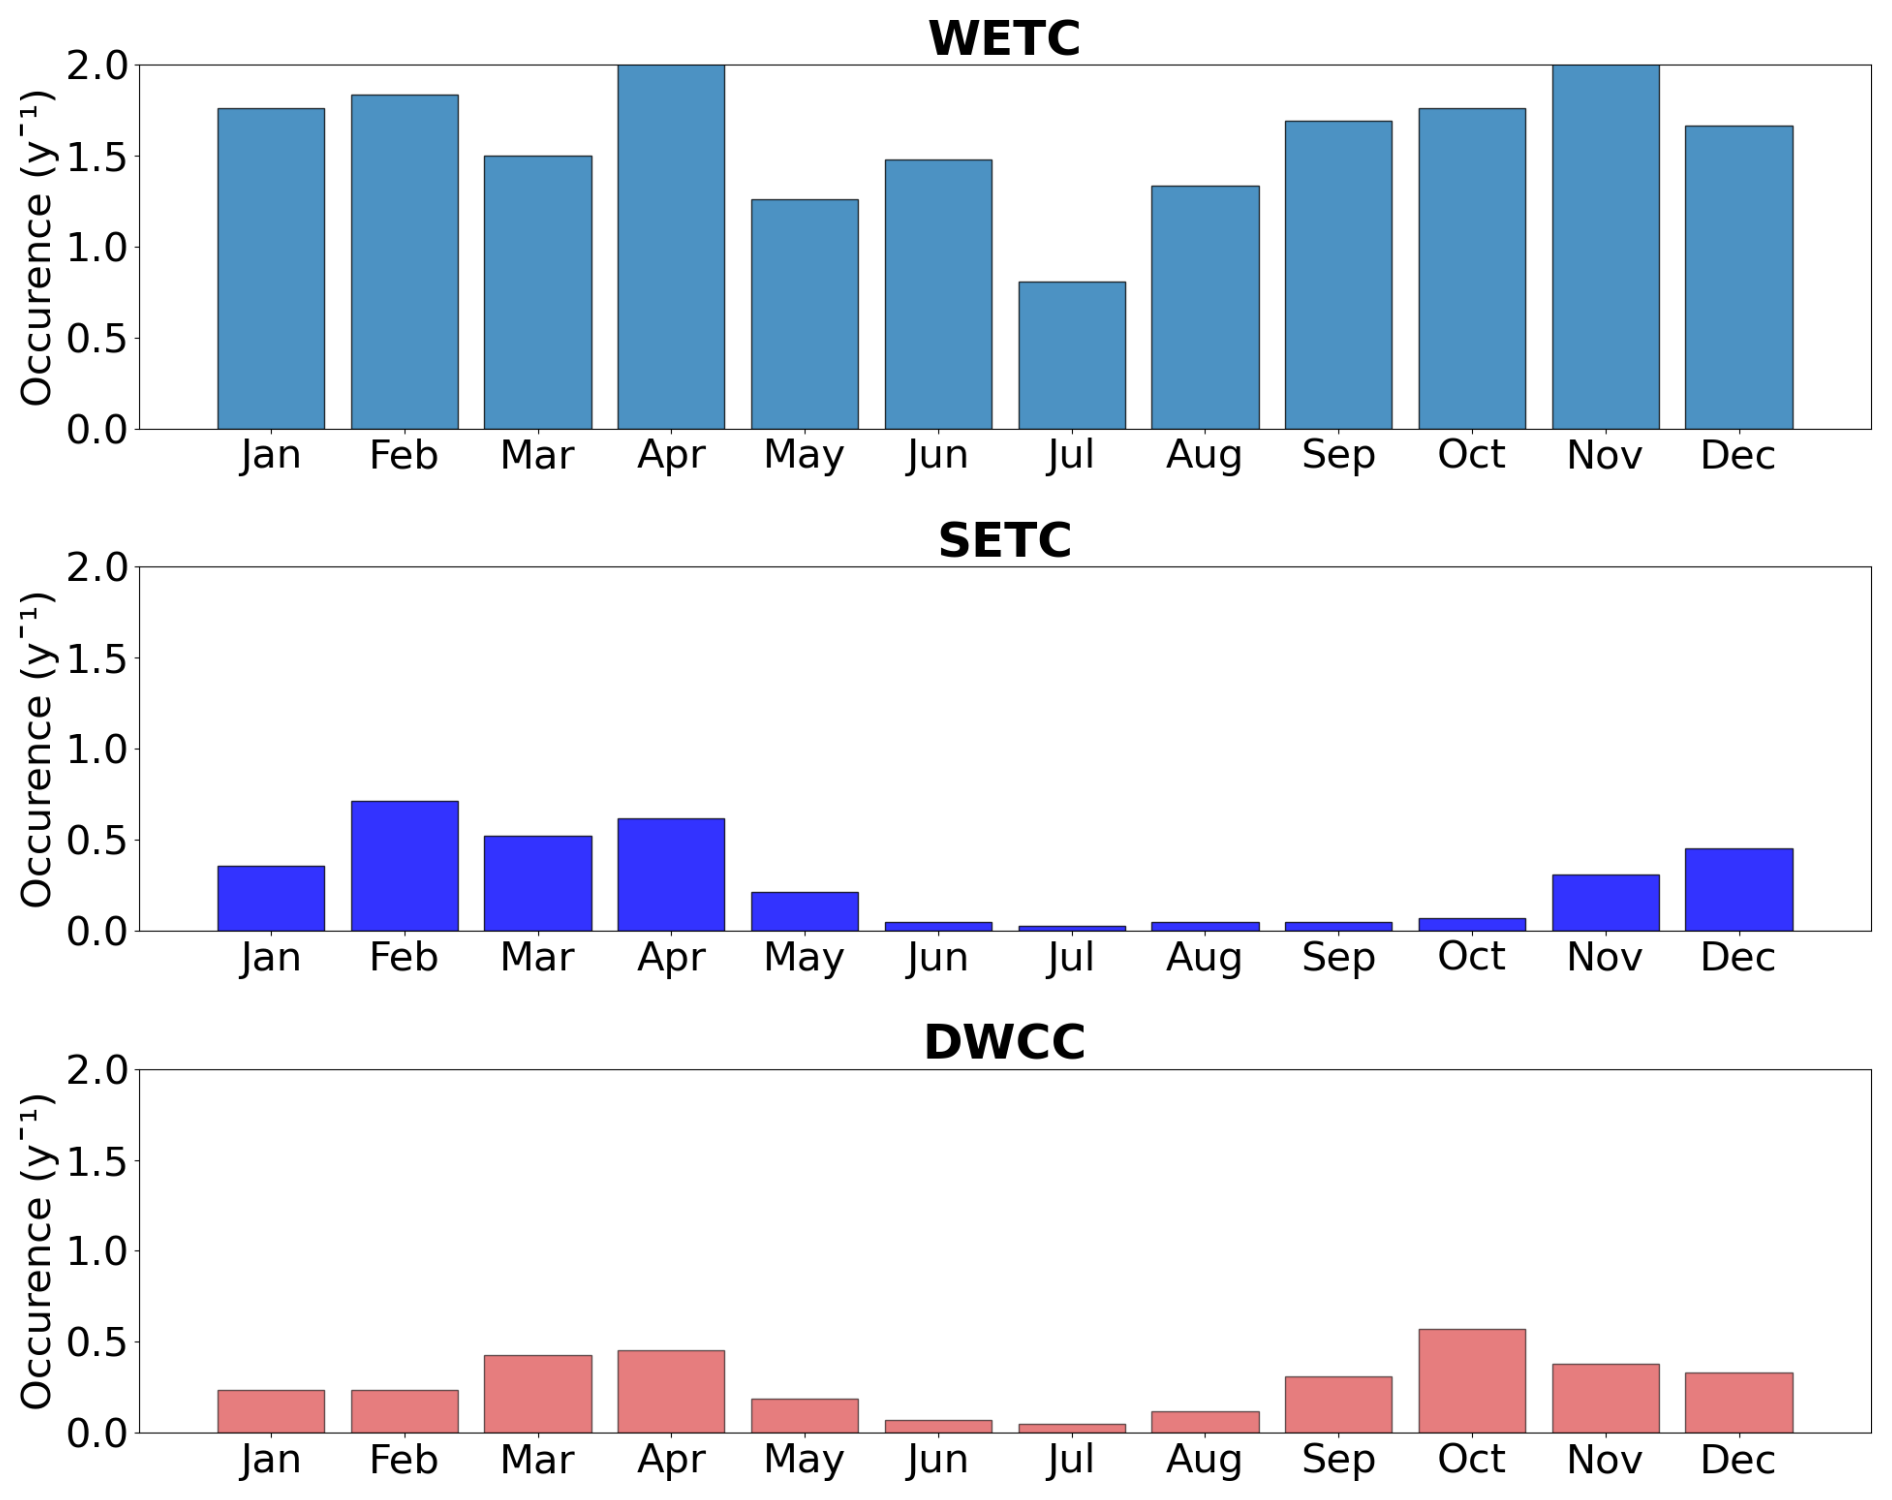
Figure 3Seasonal cycle of ETC (light blue, top row), SETC (dark blue, middle row), and intense DWCC (red, bottom row) occurrence, counted at their time of maximum intensity.
SETC occurrence presents a well-defined maximum in winter and early spring, while some works have found that the most intense Mediterranean cyclones are more frequent in winter (Flaounas et al., 2012, 2014). This apparent discrepancy highlights that the seasonality of intense systems is highly sensitive to the dataset, boundary conditions, and criteria used to define cyclone intensity. Indeed, different thresholds or forcing data can substantially alter the simulated seasonal distribution, as already shown in Flaounas et al. (2012).
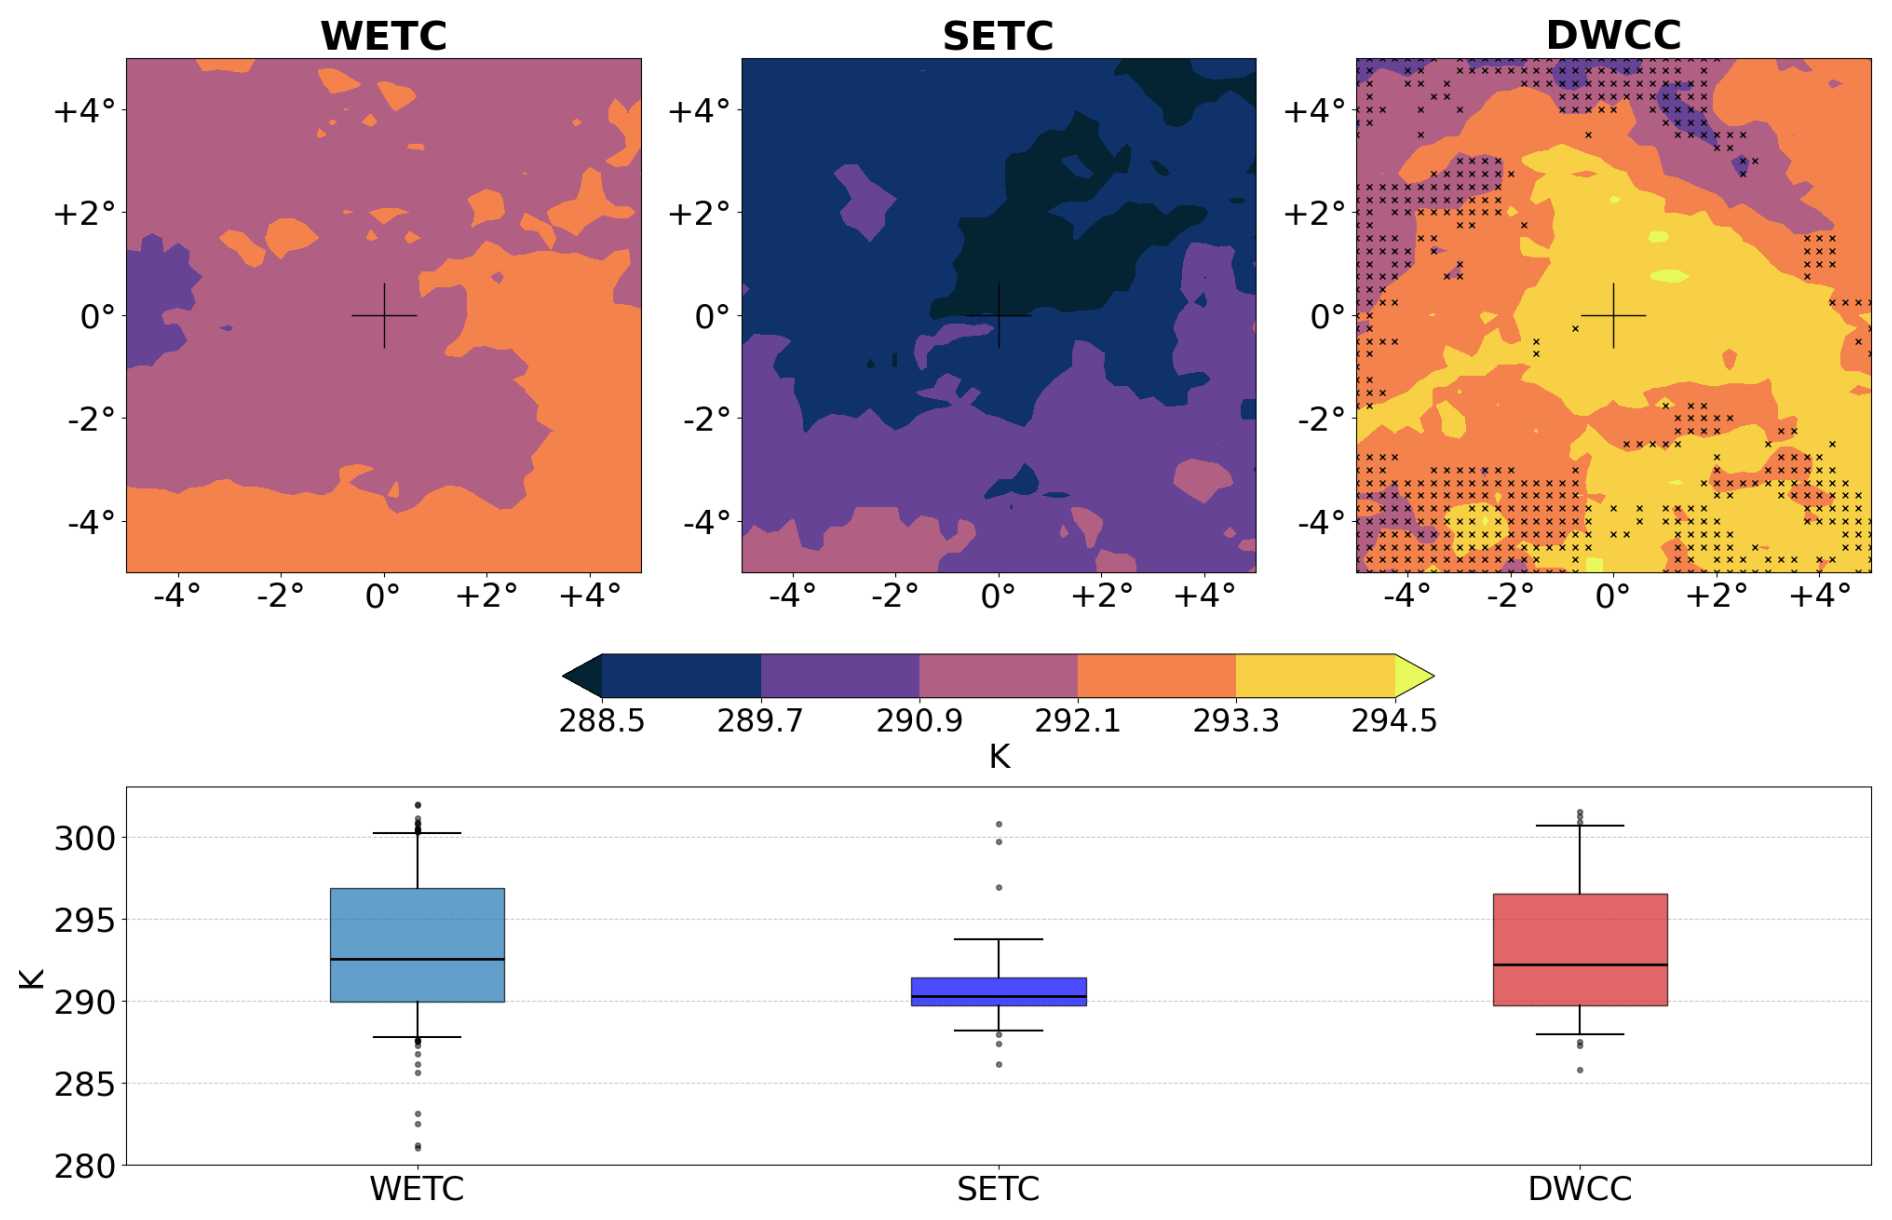
Figure 4Sea Surface Temperature (SST) for the different cyclone classes. Top: 2D composites centered on the cyclones, 36 h before the time of minimum SLP. The markers in the right panel indicate regions where DWCC composited SST is not significantly different from SETC (95 % confidence level). Bottom: boxplots of the mean SST for each cyclone, where the mean is computed on the 10 % highest values over the 10° × 10° box for each cyclone. Boxplots show the median value (horizontal line), the interquartile range (colored area), the 5th and 95th percentiles (whiskers), and outliers.
DWCC are most frequent in October, when the large SST favor air-sea heat exchanges and therefore promote the establishment of the warm core (Gaertner et al., 2016). However, several DWCC are also found in spring. The different seasonality of ETC' and DWCC' occurrence is reflected in the composite sea surface temperature over which they develop, shown in Fig. 4. At 36 h prior to peak intensity, SST is about 3 °C warmer for DWCC than for SETC. In addition, a two-sample t-test comparing the mean values of the 10 % highest SST values in the 10° × 10° box shown in the top panel of Fig. A8 shows that the SSTs associated with DWCC significantly differ from the SETC ones at a 95 % confidence level. (Thereafter, all mentions to statistical outcomes will refer to this two-sample t-test comparing the mean values over the 10 % highest values of the 10° × 10° box at a 95 % confidence level).
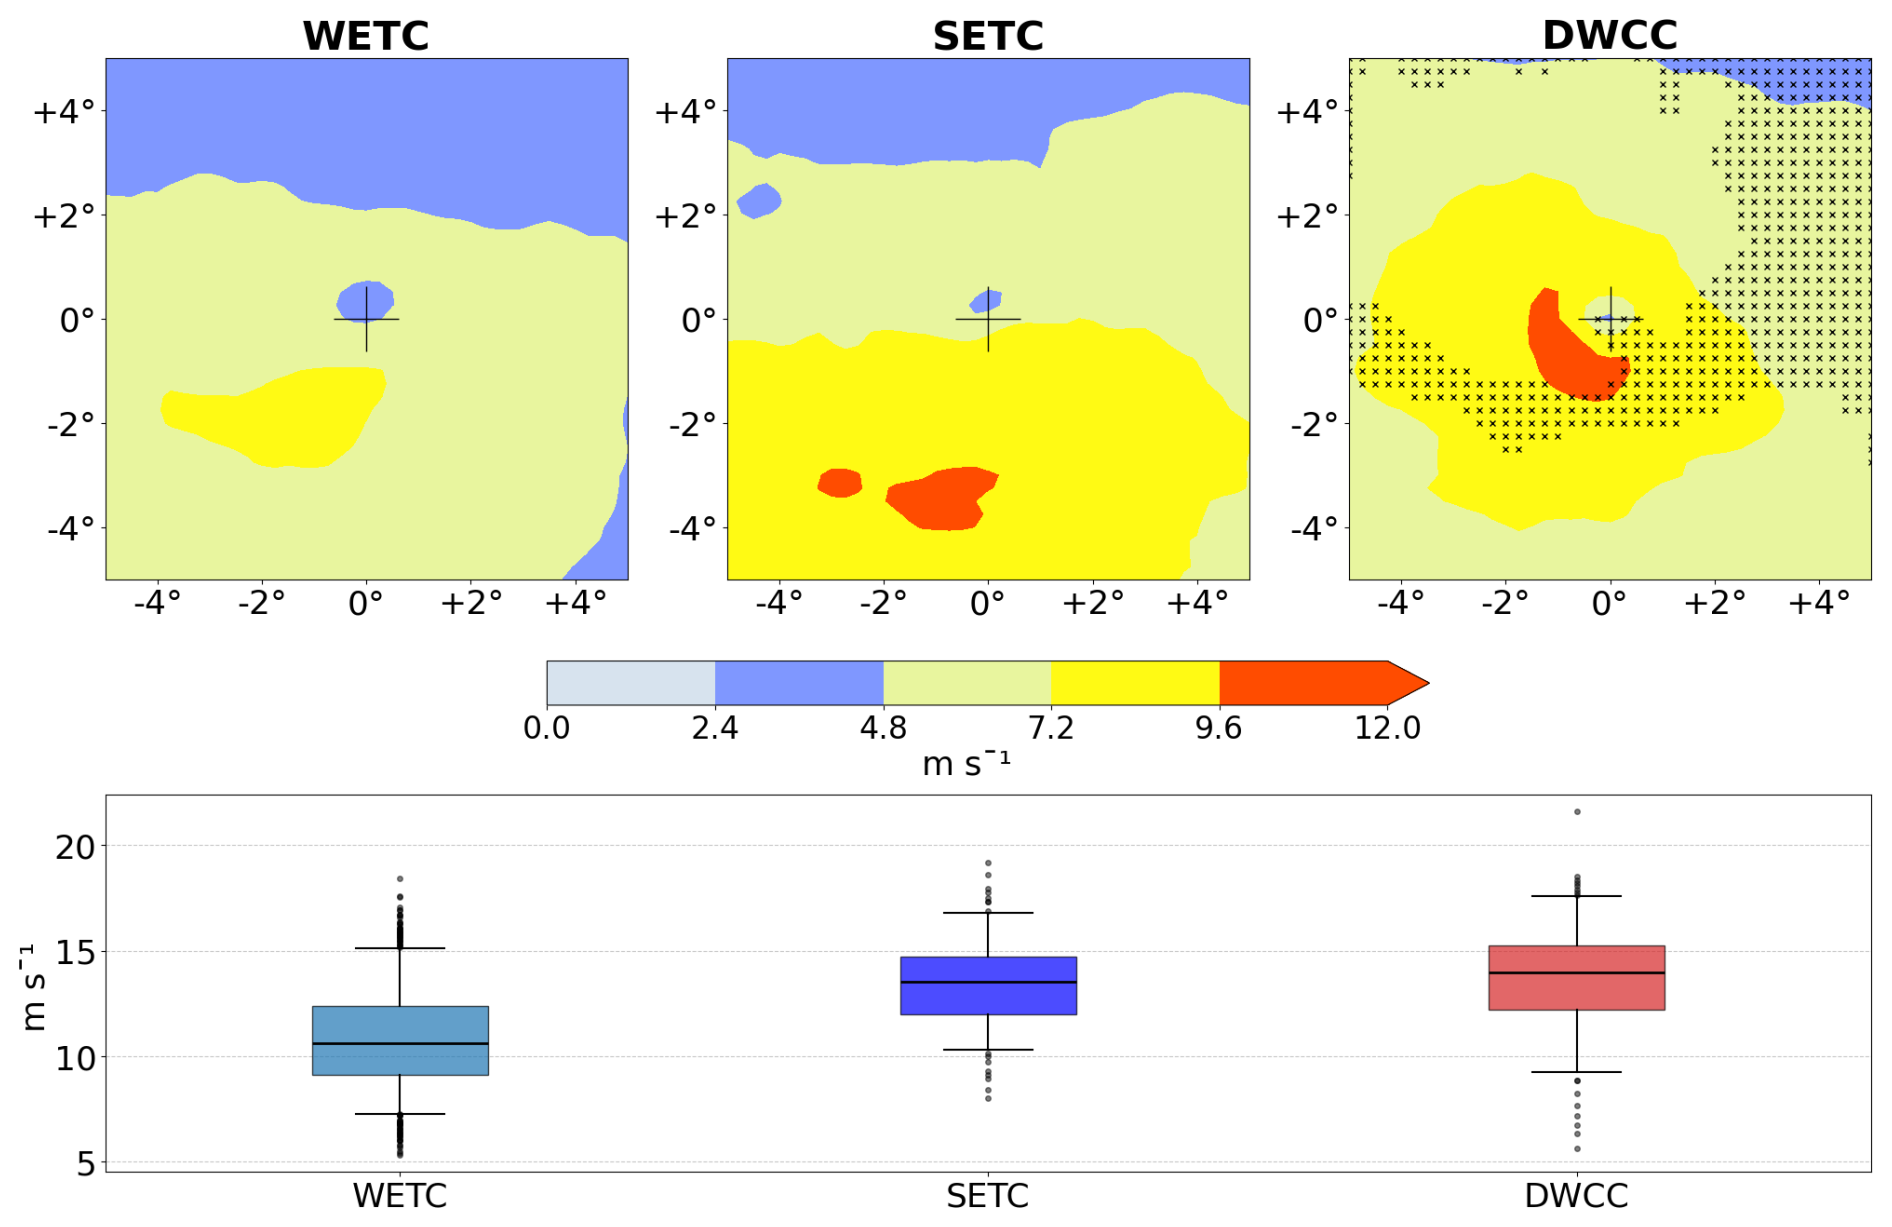
Figure 510 m surface wind for the different cyclone classes. Top: 2D composites centered on the cyclones, at the time of minimum SLP. The markers in the right panel indicate regions where DWCC composited surface wind is not significantly different from SETC (95 % confidence level). Bottom: boxplots of the mean surface wind for each cyclone, where the mean is computed on the 10 % highest values over the 10° × 10° box for each cyclone. Boxplots show the median value (horizontal line), the interquartile range (colored area), the 5th and 95th percentiles (whiskers), and outliers.
ETC and DWCC are also characterized by different peak intensities: the largest SLP anomaly is on average −10 hPa for WETC and −17 hPa for DWCC, whereas SETC are on average even stronger than DWCC (in terms of their depression, which averages at −21 hPa). Consistently, peak winds are comparable between SETC and DWCC, and are much smaller in WETC (Fig. 5). This is confirmed by the two-sided t-test mentioned above, giving no statistically significant difference between the mean values for DWCC and SETC surface wind. Finally, wind composites (Fig. 5) have a maximum in the southwest quadrant. In DWCC, the maximum azimuthally averaged winds are found closer to the center than in ETC (see Fig. A4). However, large heterogeneities exist as the standard deviation of the radius of maximum winds is over 100 km in all classes.
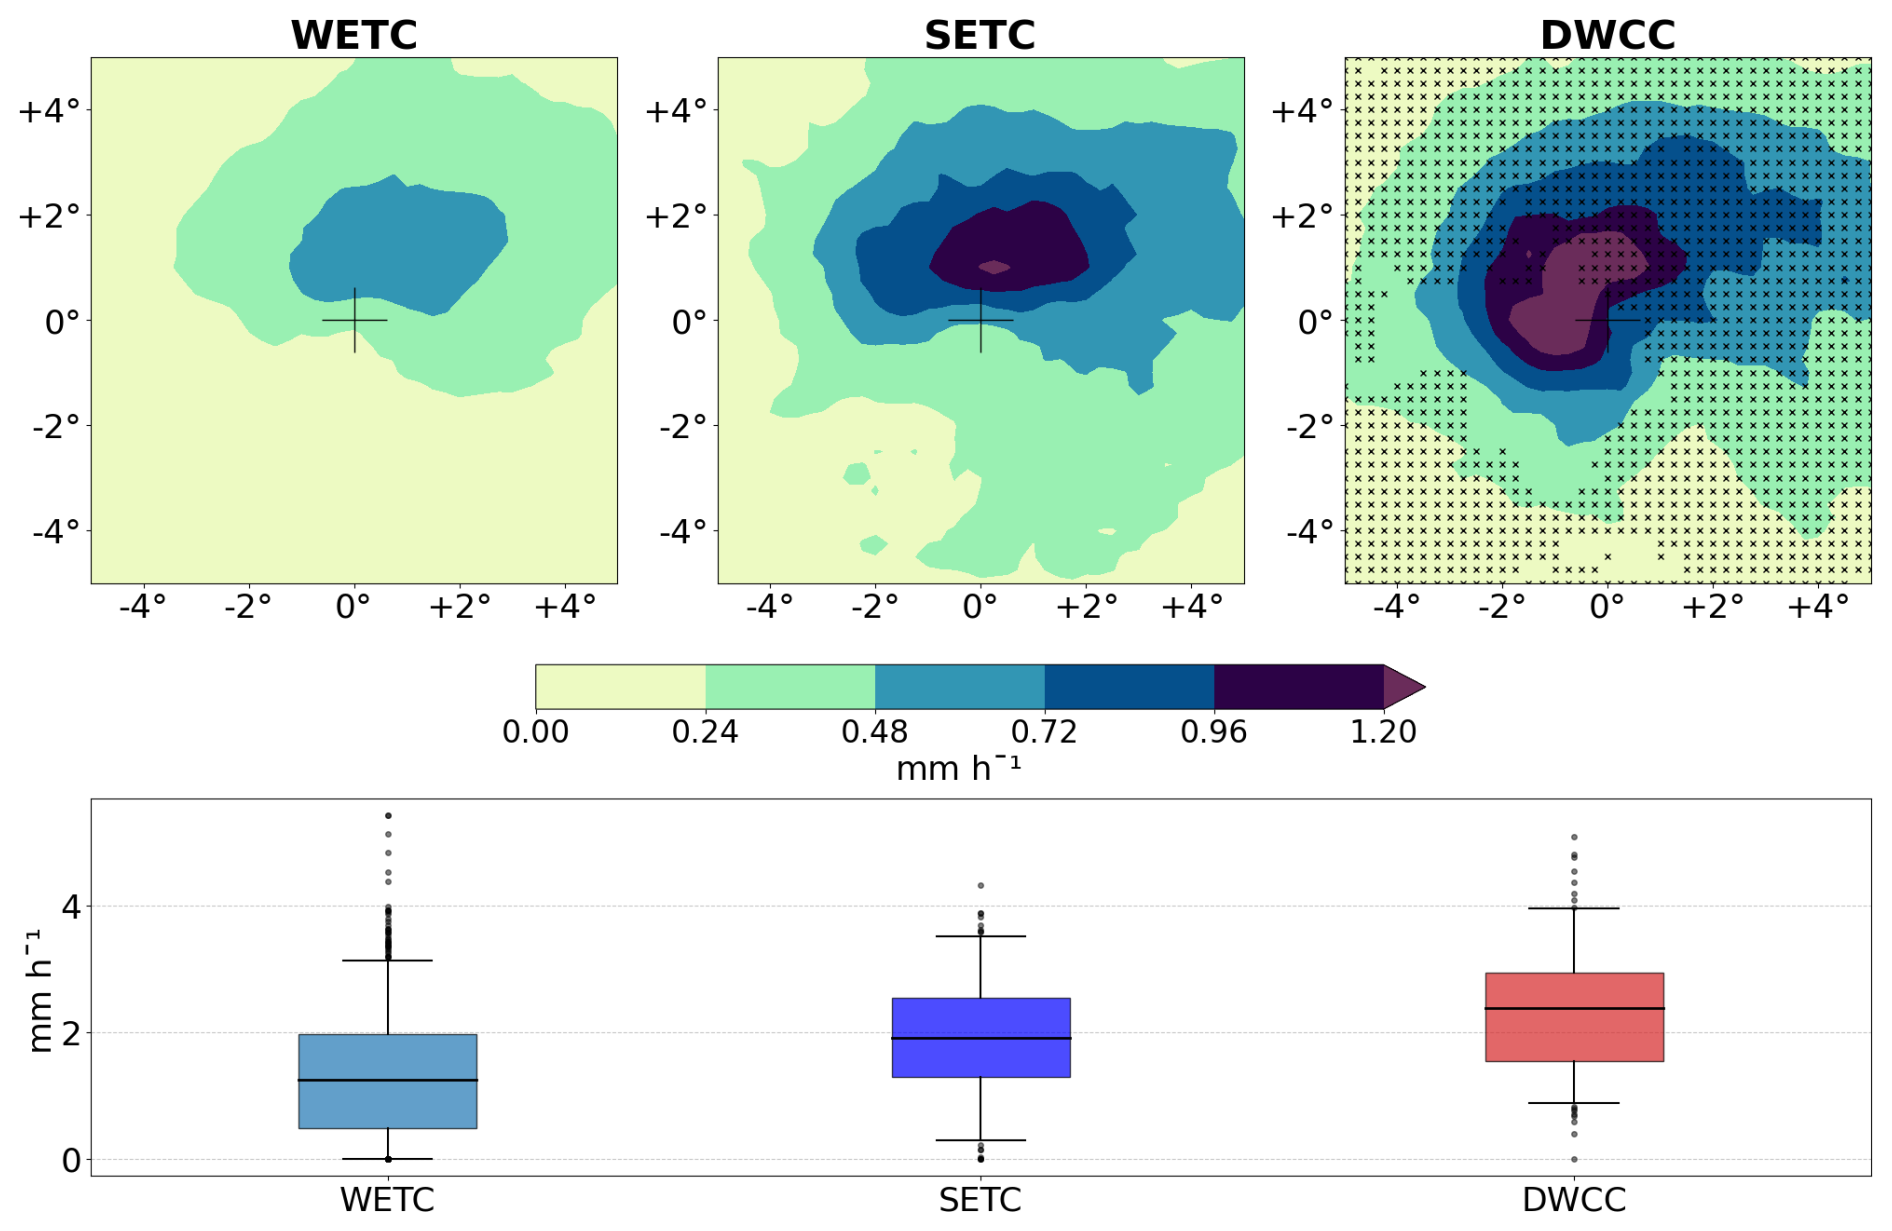
Figure 6Hourly precipitation for the different cyclone classes. Top: 2D composites centered on the cyclones, at the time of minimum SLP. The markers in the right panel indicate regions where DWCC composited hourly precipitation is not significantly different from SETC (95 % confidence level). Bottom: boxplots of the mean hourly precipitation for each cyclone, where the mean is computed on the 10 % highest values over the 10° × 10° box for each cyclone. Boxplots show the median value (horizontal line), the interquartile range (colored area), the 5th and 95th percentiles (whiskers), and outliers.
A major difference emerging between DWCC and SETC is in their associated precipitation: even though the cyclone intensity between the two categories is similar, hourly rainfall is much higher in DWCC, where the azimuthal average peaks to values that are 40 % larger than for SETC (Figs. 6 and A5). Indeed, the mean precipitation over the grid points with the upper decile rainfall rate is significantly larger for DWCC than for SETC, even if very intense rainfall can be present in some cold-core cyclones, as shown by the outliers present in the boxplots of Fig. 6.
Building on the tropical-cyclone literature, which has shown that rainfall intensity can be at least as important as wind speed in determining cyclone-related socioeconomic losses (Bakkensen et al., 2018; Qin et al., 2020; Wen et al., 2018), our composites indicate that DWCC have the potential to produce more severe impacts than their extratropical counterparts.
The precipitation at the peak intensity of ETC is localized in the North-East quadrant (Fig. 6). This spatial distribution is similar to the one reported in the literature for typical extratropical cyclones associated with the presence of the warm-frontal region (Field and Wood, 2007; Yettella and Kay, 2016; Naud et al., 2018), and matches the one described in Flaounas et al. (2017) for Mediterranean cyclones interacting with the warm conveyor belt that advects moist air into the system.
The maximum precipitation for the warm-core cyclones is found in the North-West quadrant (Fig. 6), as already presented in Zhang et al. (2020). Usually, the peak of rainfall in TC occurs at the forefront of the storm center, where the uneven circulation induced by friction in the moving storm generates low-level convergence, significantly intensifying deep convective activity (Lonfat et al., 2004; Du et al., 2023). This is partially confirmed by the composites oriented along the direction of propagation (Fig. A7).
3.3 Intensification phase
The composite evolution of surface wind speed in the different cyclone categories is shown in Fig. 7. In this case, wind speed has been averaged over a 4° by 4° longitude-latitude box centered at the minimum sea level pressure location. The choice of the 4° × 4° box was based on inspection of the two-dimensional composites, which show that this region typically encompasses the area of maximum wind and surface flux intensities around the cyclone center. A smaller box (e.g., 2° × 2°) would exclude part of this high-intensity region for many systems, while a larger one would include unrelated environmental signals. To assess the sensitivity of our results to this choice, we repeated the calculations using box sizes ranging from 10° × 10° down to 2° × 2°. The resulting evolution of wind and heat fluxes was very similar across all cases, confirming the robustness of our findings. Finally, all computations excluded land areas, as wind speeds over land can be biased, either exaggerated by orography or reduced by friction.
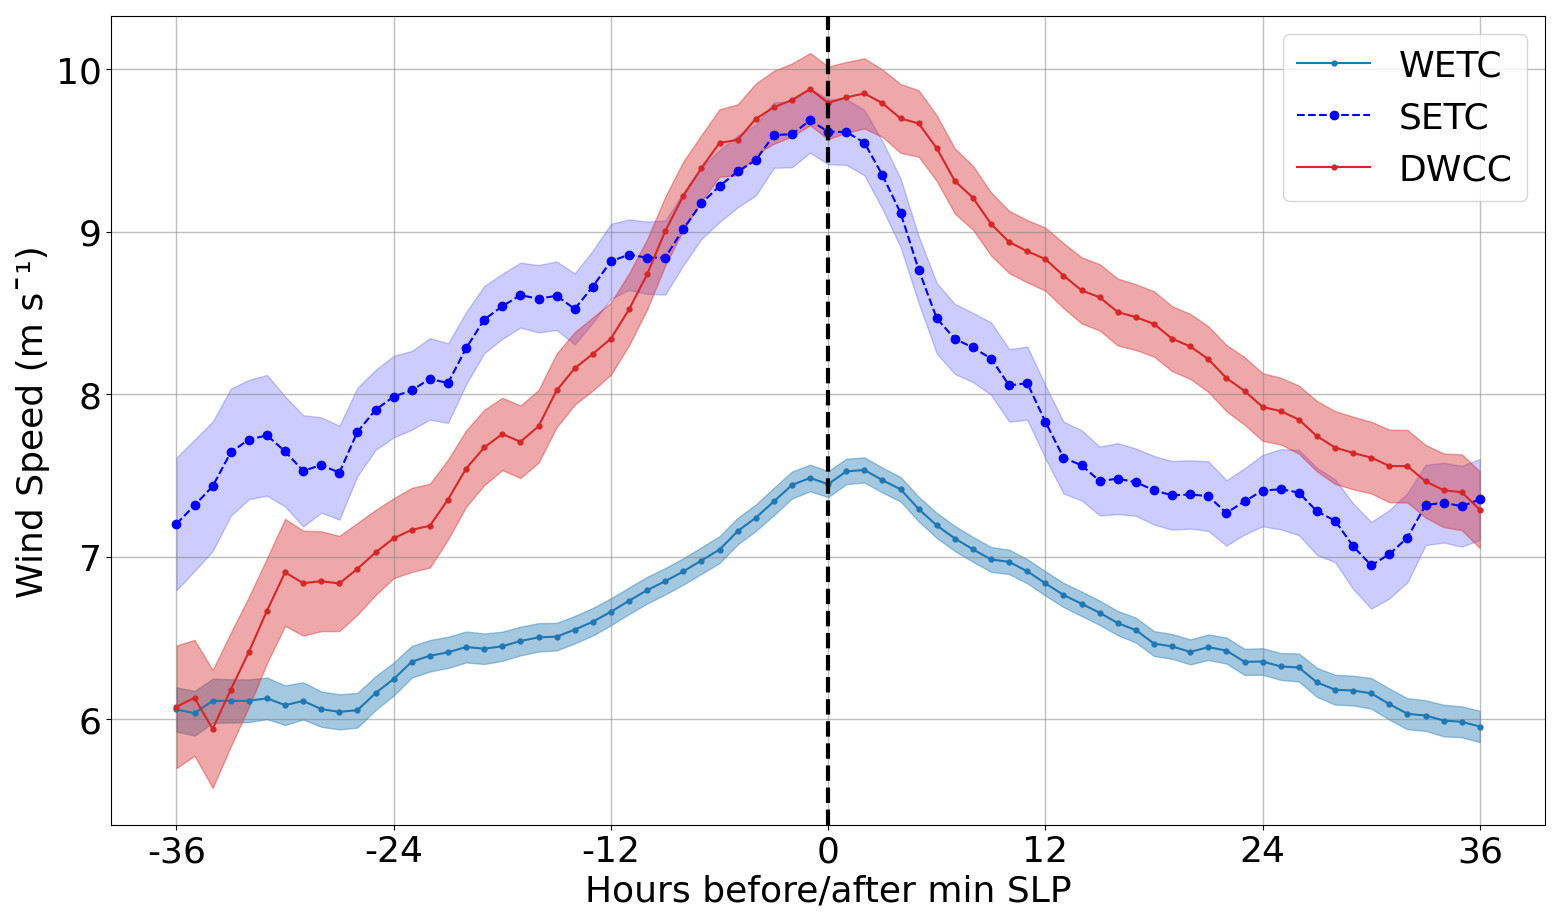
Figure 7Composite time evolution of mean 10 m wind speed in a 4° by 4° box centered on the cyclone. Only the points over the sea are considered to compute the composite. The vertical black dashed line indicates the time of minimum sea level pressure. Shading around the solid line indicates the standard error of the mean.
As for the 2D surface wind composites (Fig. 5), Fig. 7 also indicates similar peak intensities for DWCC and SETC. However, their intensity evolution is quite different, indicating a statistically significantly larger intensification rate for DWCC in the earlier stages, triggered by larger air-sea (latent and sensible) heat fluxes (Fig. 8). SETC, even though they have stronger surface winds than WETC, show quite similar surface fluxes to WETC, suggesting that the wind-induced surface heat exchange (WISHE) feedback is not active in those cases, whereas it can drive the evolution of DWCC. To investigate possible reasons for the observed differences, we next analyze the conditions under which cyclones evolve, focusing on the environmental characteristics at the location where they are 36 h before their peak intensity, when none of them has developed a deep warm core yet.
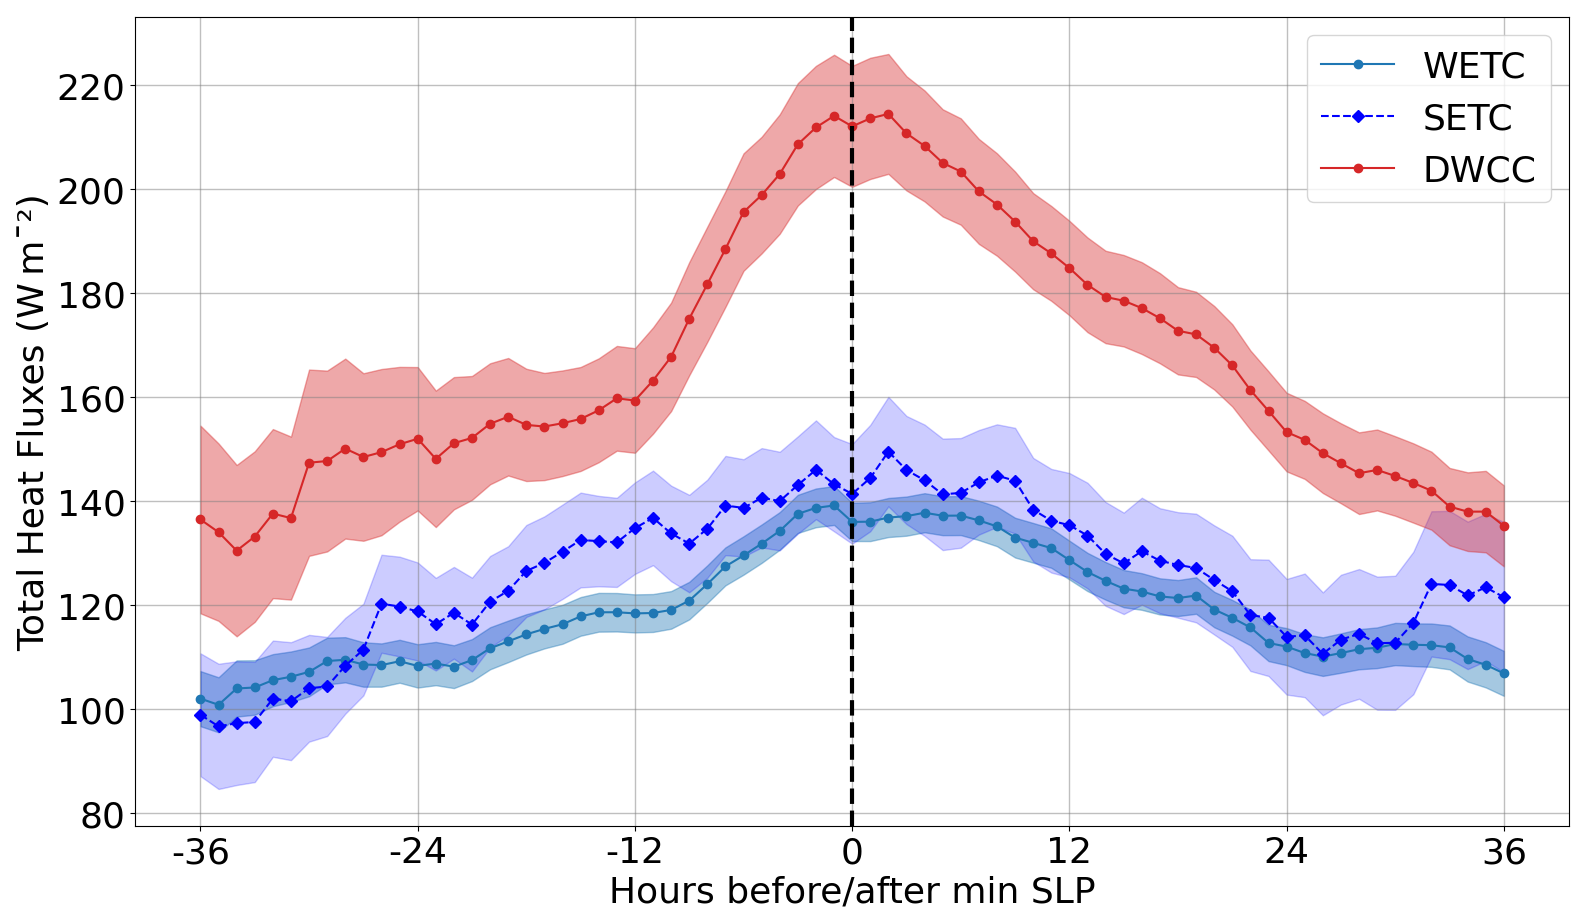
Figure 8Composite time evolution of mean air-sea total (latent and sensible) heat flux in a 4° by 4° box centered on the cyclone. Only the points over the sea are considered to compute the composite. The vertical black dashed line indicates the time of minimum sea level pressure. Shading around the solid line indicates the standard error of the mean.
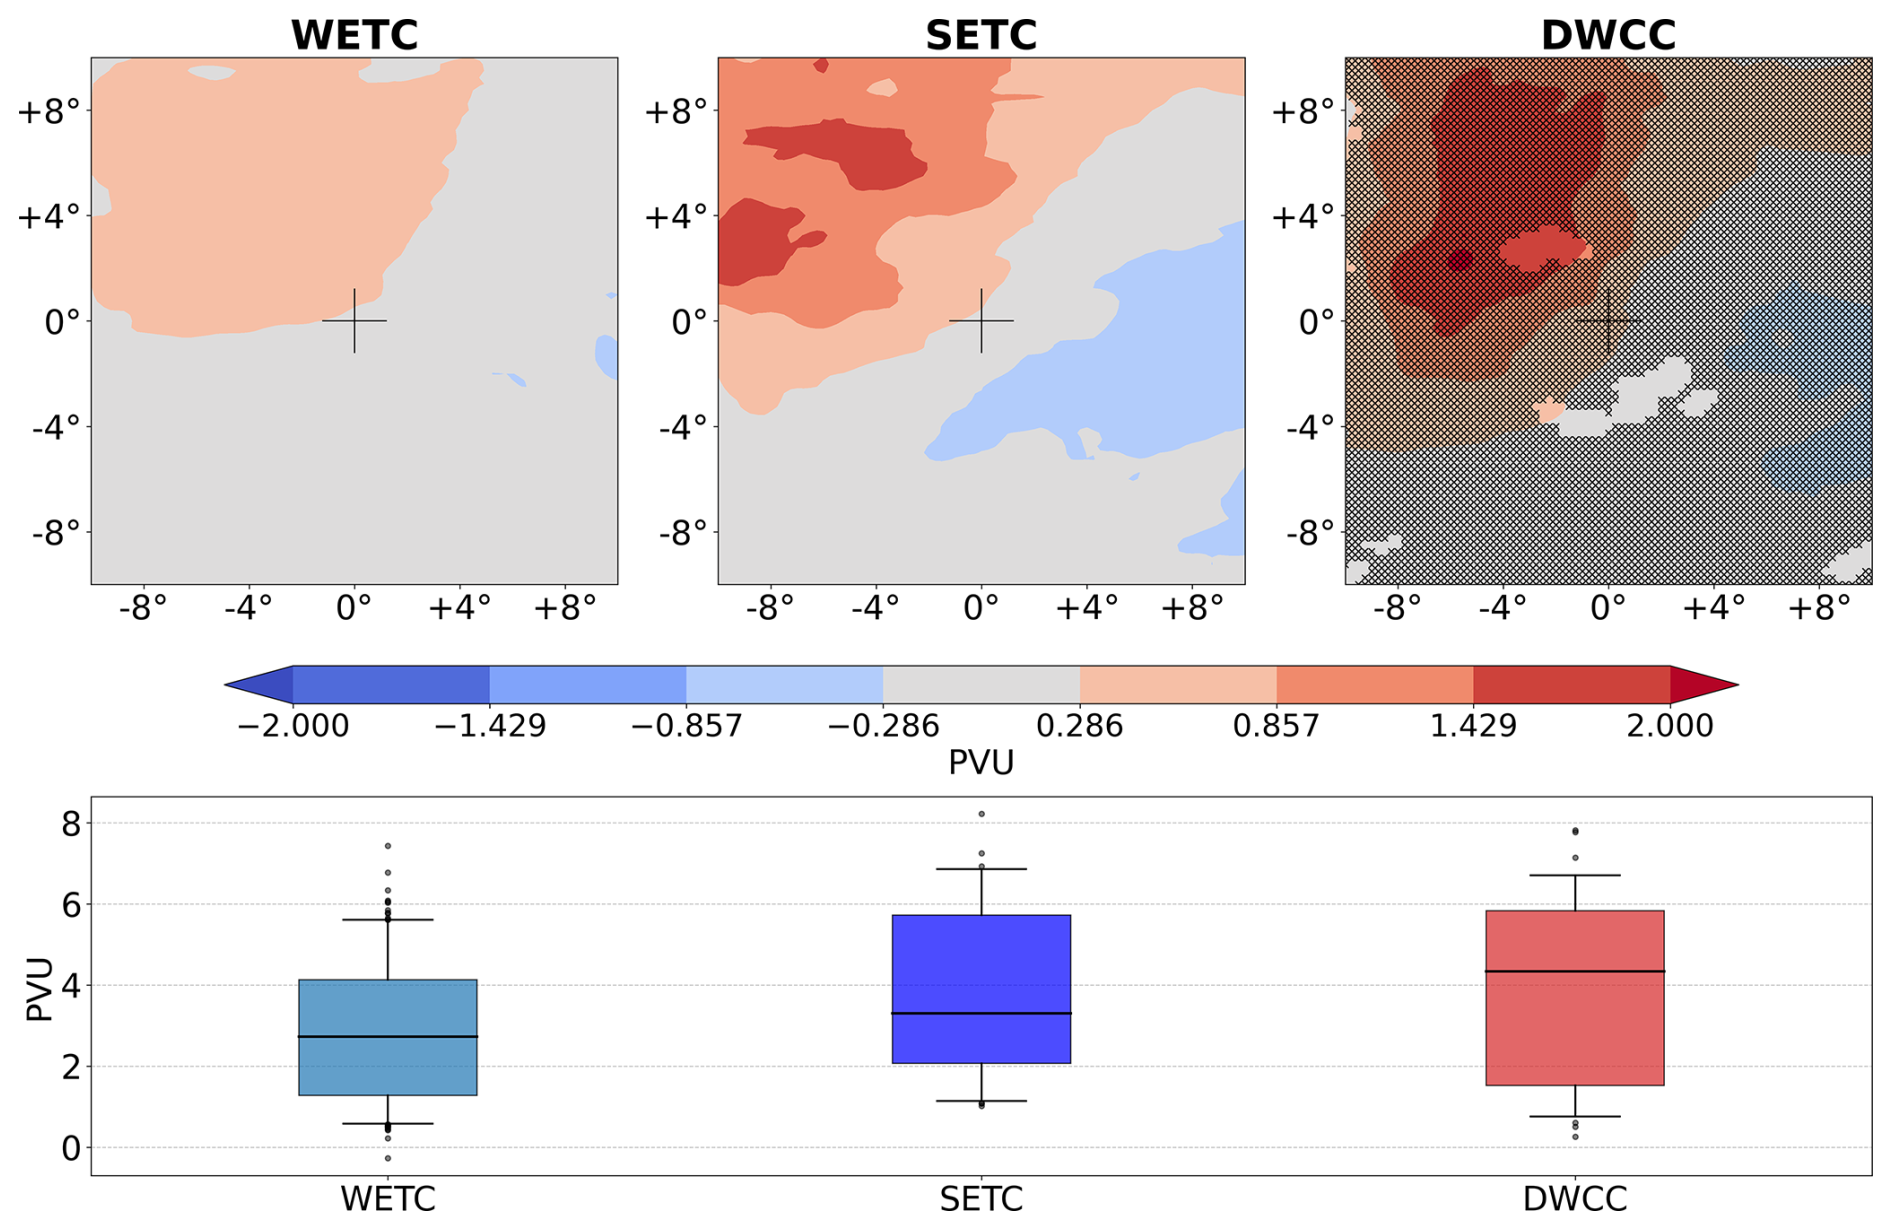
Figure 9300 hPa Potential Vorticity (PV) anomaly for the different cyclone classes. Top: 2D composites centered on the cyclones, 36 h before the time of minimum SLP. The markers in the right panel indicate regions where DWCC composited PV anomaly is not significantly different from SETC (95 % confidence level). Bottom: boxplots of the mean PV anomaly for each cyclone, where the mean is computed on the 10 % highest values over the 10° × 10° box for each cyclone. Boxplots show the median value (horizontal line), the interquartile range (colored area), the 5th and 95th percentiles (whiskers), and outliers.
As already mentioned in the introduction, the origin of Mediterranean cyclones is the presence of a trough in the upper troposphere. The meandering of the jetstream advects positive potential vorticity (PV) anomaly into the region and is associated with cyclone development (Dolores-Tesillos et al., 2022; Sánchez et al., 2024). It also favors upper-level divergence, upward motion, and the intensification of the surface depression. The positive upper-level PV anomaly is present in the analyzed cyclones, as shown in the 300 hPa composite maps 36 h before the cyclone peak intensity (Fig. 9). The average PV anomaly is relatively weak for WETC, and larger for SETC and DWCC, with no statistically significant difference observed between the mean PV anomaly of DWCC and SETC. In addition, the very large differences among cyclones of the same class indicate that the PV anomaly strength is neither a sufficient nor necessary condition for DWCC development.
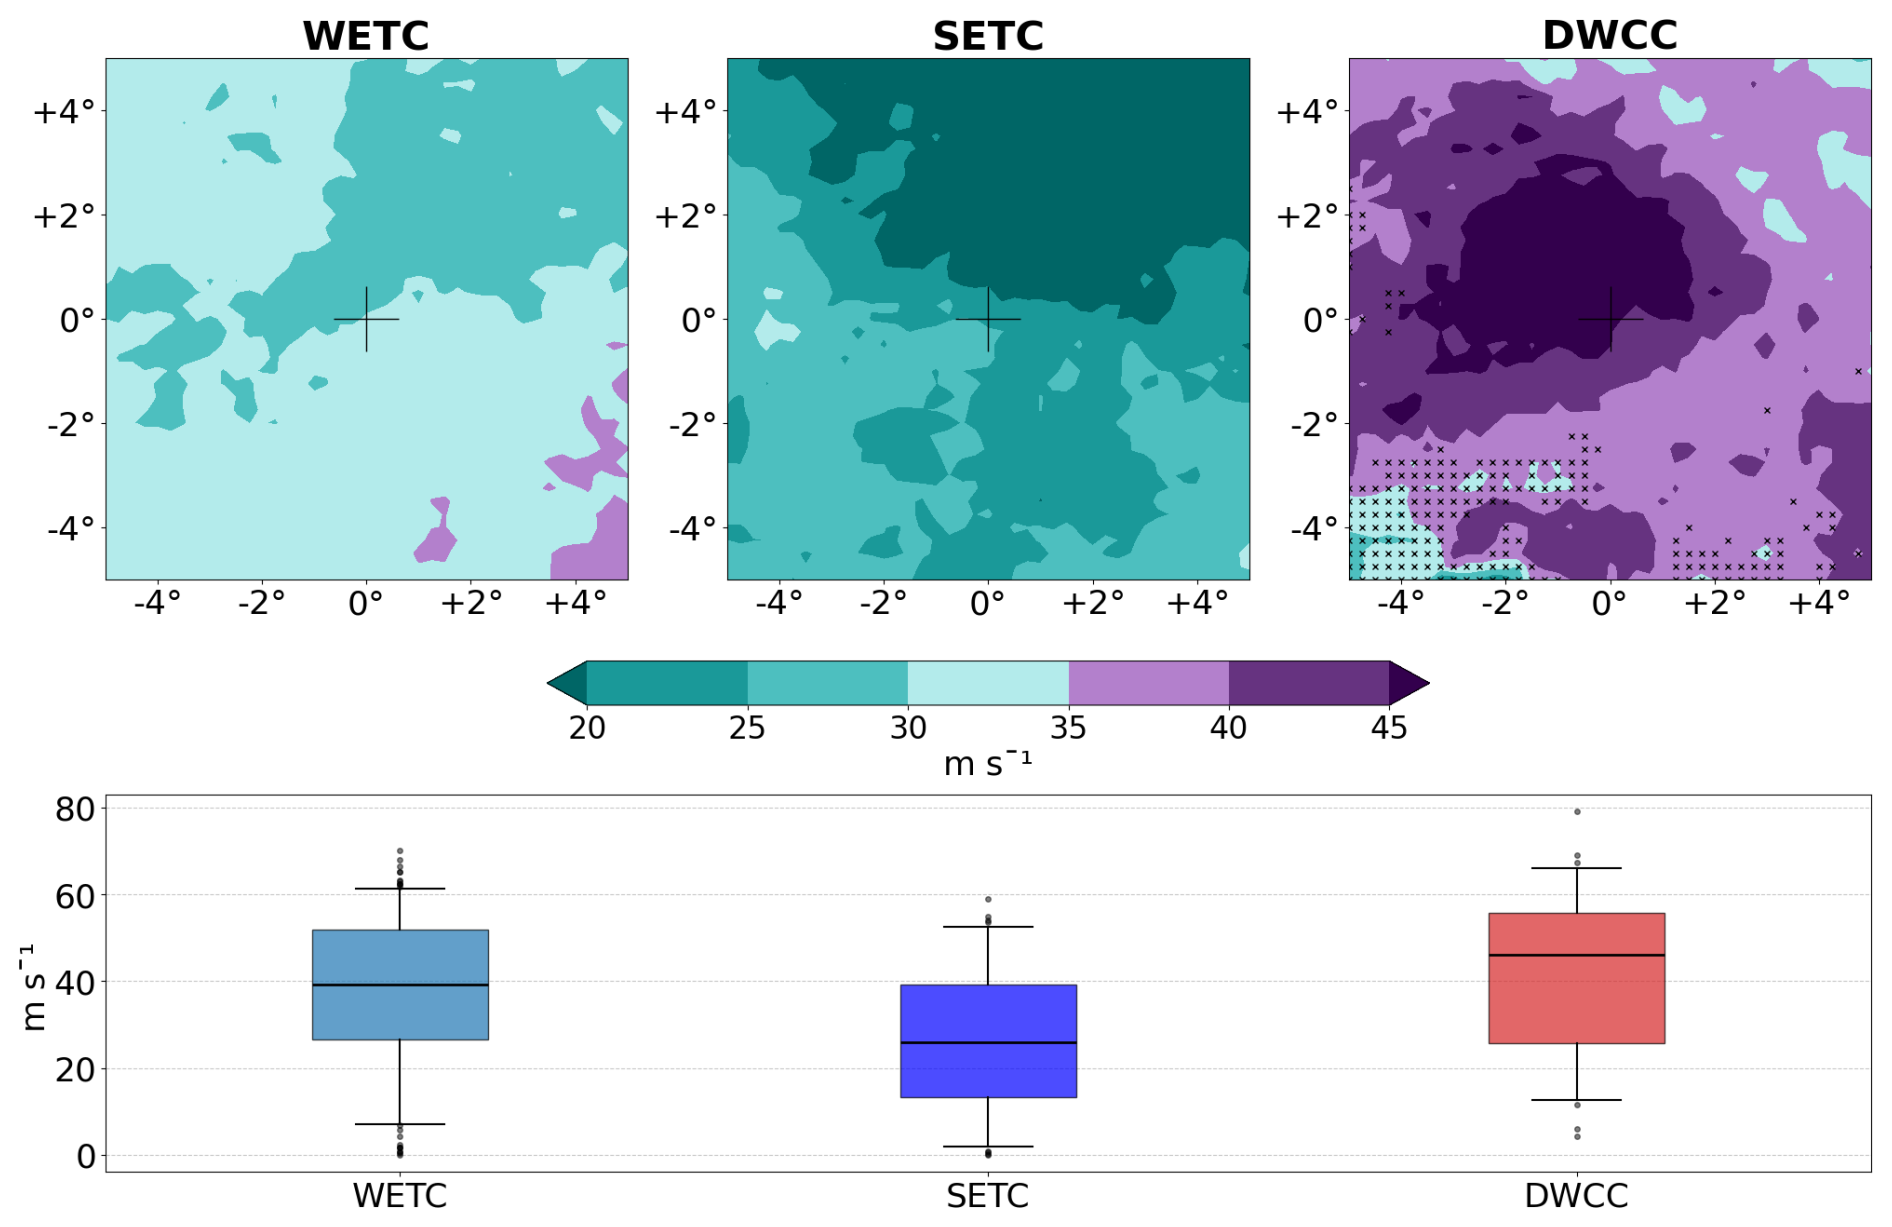
Figure 10Potential Intensity (PI) for the different cyclone classes. Top: 2D composites centered on the cyclones, 36 h before the time of minimum SLP. The markers in the right panel indicate regions where DWCC composited PI is not significantly different from SETC (95 % confidence level). The purple colors represent values of PI above 35 m s−1, value below which tropical cyclones typically do not form (Emanuel, 2010). Bottom: boxplots of the mean PI for each cyclone, where the mean is computed on the 10 % highest values over the 10° × 10° box for each cyclone. Boxplots show the median value (horizontal line), the interquartile range (colored area), the 5th and 95th percentiles (whiskers), and outliers.
We next show composite maps of potential intensity 36 h prior to peak intensity (Fig. 10). DWCC have PI values exceeding the threshold typically associated with tropical cyclone development (> 35 m s−1; Emanuel, 2010), while PI is statistically significantly lower for WETC and SETC. The DWCC high PI region is present in proximity of the cyclone center, suggesting that the perturbation itself contributes to increasing the potential intensity in an environment overall less prone to TC development, as discussed in Emanuel et al. (2025).
To delve into the origin of the differences in potential intensity across the different classes, we compute PI from the climatological conditions. Climatological conditions are obtained as long-term averages of the relevant fields (temperature, moisture, and SLP) at the same location and time of the year of each analyzed cyclone. A stronger climatological PI is obtained for DWCC than for SETC (Fig. A10). This difference (that has an average magnitude of 12 m s−1 and is statistically significant) is associated with their different seasonality, as DWCC occurrence peaks in fall (Fig. 1), when the larger SST (Fig. 4) are associated both to a larger magnitude of the temperature ratio term and of the hurricane CAPE term in Eq. (4).
However, the climatological PI associated with DWCC presents less intense values than the actual PI obtained at their formation, indicating that there are some specific conditions when DWCC develop which increase the local PI value, resulting in a composite PI anomaly (actual minus climatological value) of up to 13 m s−1 (Fig. A11a), and with a mean of 6 m s−1. The main contribution to such an anomaly in PI for DWCC is due to the anomalous CAPE difference term in Eq. (4), while the temperature ratio does not significantly differ from its climatological value (see Fig. A11b and c).
The CAPE difference term depends on sea surface temperature, on near-surface specific humidity (here taken at 2 m a.s.l.), and on the temperature profile in the whole air column. To determine which variable has the most important influence on the anomaly produced in PI for DWCC, we compute the CAPE difference term inserted in the PI derivation using all climatological values except one.
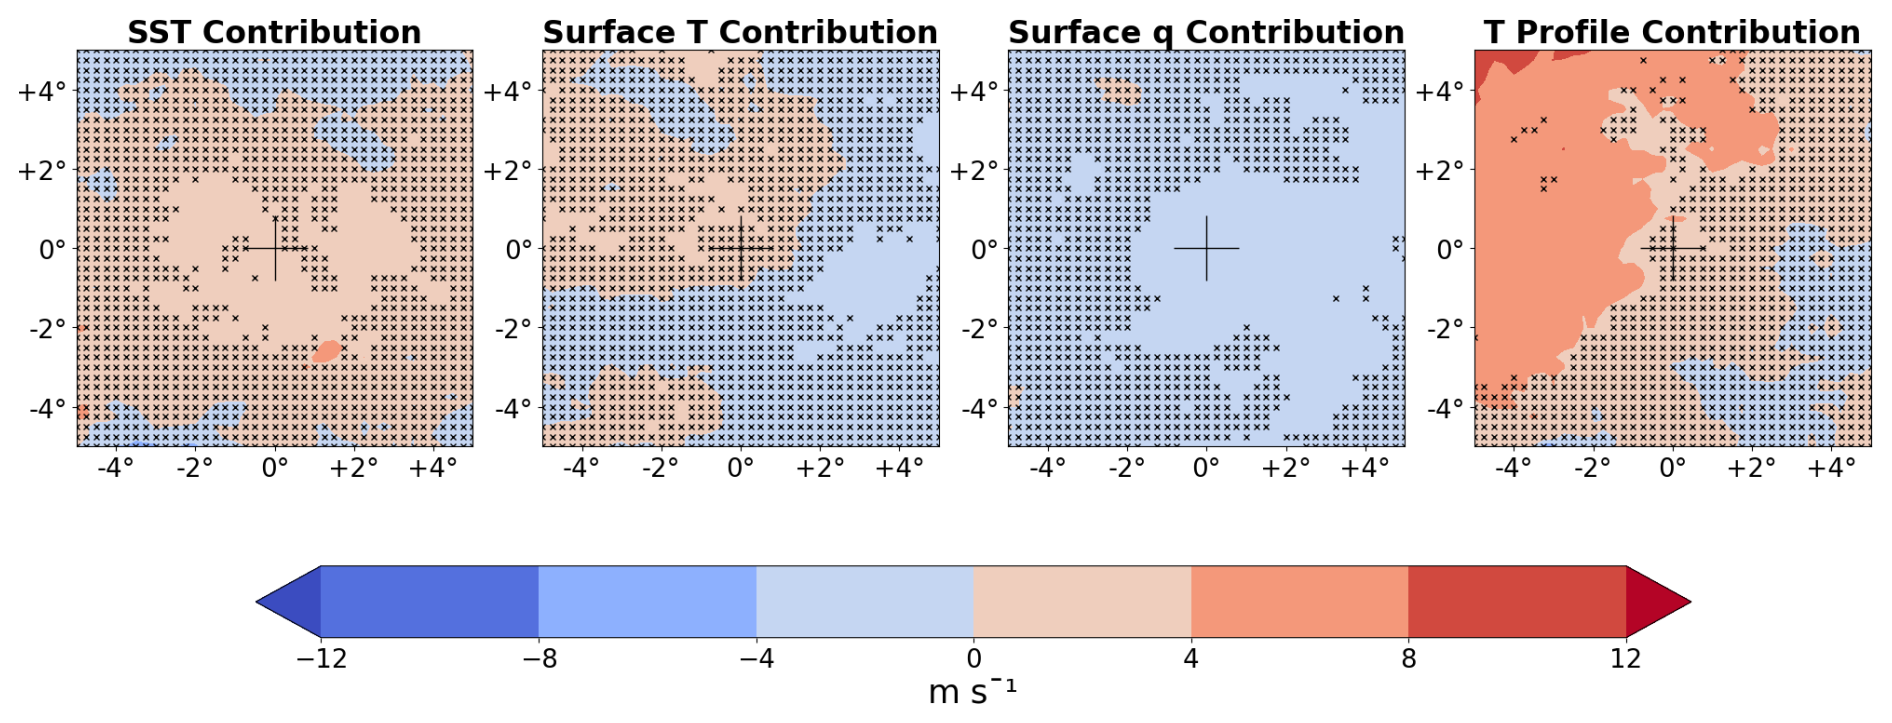
Figure 112D composites of PI anomalies (m s−1) for DWCC 36 h before their minimum SLP. Each panel shows the difference between (a) the PI computed using climatological values except for the CAPE difference term, and (b) the climatological PI (Fig. A10). The CAPE difference term in (a) is computed with climatological fields except one, for which the actual field present at the time of the storm is used. This field is, from left to right panels: SST, 2 m temperature, 2 m specific humidity, and air column temperature profile. The markers indicate the anomalies that are not significantly different from 0 at the 95 % confidence level.
For instance, while keeping climatological values for near-surface specific humidity and tropospheric air temperature, we insert the actual values of SST and derive an anomalous hurricane CAPE that is then used in the PI computation. The difference between the obtained PI and the climatological PI is due to the effect of the SST anomaly only on hurricane CAPE, and is then composited onto the different DWCC and shown in Fig. 11a.
The procedure is then repeated for anomalous near surface specific humidity (here taken at 2 m a.s.l., which affects the buoyancy of the near surface air parcel), for anomalous near surface air temperature (which again affects the buoyancy of the near surface air parcel), and for the rest of the tropospheric temperature profile (which enters in the computation of parcel CAPE). All the different terms are shown in Fig. 11.
They indicate that the negative anomaly in the mid-troposphere air temperature (see Fig. A12) has the largest effect, followed by the positive SST anomalies. The anomalies in near-surface air properties have a minimal effect.
The negative anomaly in tropospheric temperature increases the density of the environmental air, contributing to the CAPE∗ increase. The positive SST anomaly increases the buoyancy of the saturated parcel used to compute hurricane CAPE. Together, the two anomalies significantly increase the hurricane CAPE and thus the PI with respect to climatological conditions. The linear superposition of the PI anomalies shown in Fig. 11 provides a total anomaly very close to the full one, indicating that nonlinear effects are small.
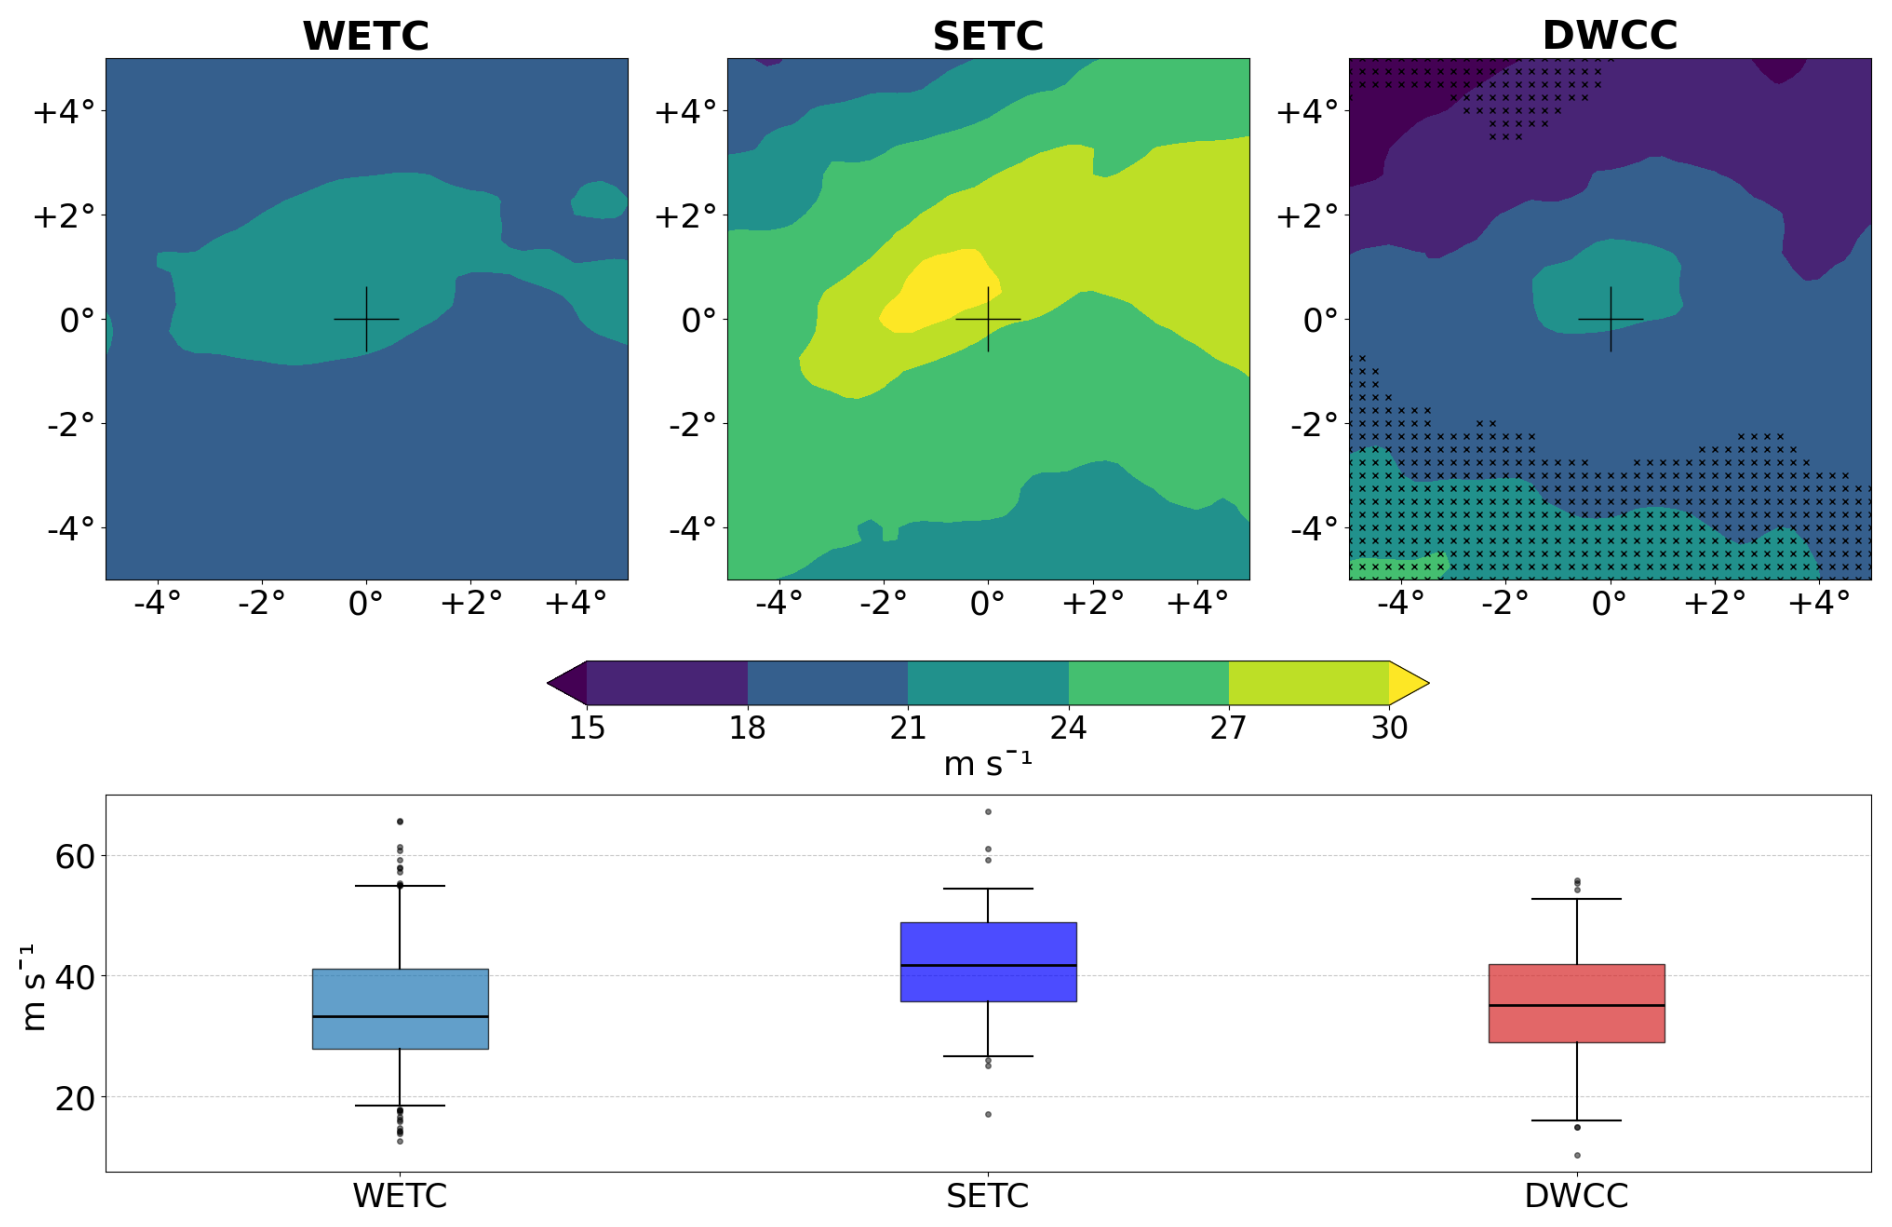
Figure 12Wind shear for the different cyclone classes. Here, the wind shear is defined as the difference between the wind at 300 hPa and the wind at 850 hPa. Top: 2D composites centered on the cyclones, 36 h before the time of minimum SLP. The markers in the right panel indicate regions where DWCC composited wind shear is not significantly different from SETC (95 % confidence level). Bottom: boxplots of the mean wind shear for each cyclone, where the mean is computed on the 10 % highest values over the 10° × 10° box for each cyclone. Boxplots show the median value (horizontal line), the interquartile range (colored area), the 5th and 95th percentiles (whiskers), and outliers.
In addition to PI, we also explore the vertical wind shear in the different categories of Mediterranean cyclones. Indeed, strong wind shear is known to have detrimental effects on the development of tropical cyclones through its ventilation effects (Kaplan and DeMaria, 2003; Elsberry and Jeffries, 1996; Emanuel et al., 2004; Wong and Chan, 2004), and its role on the formation of DWCC has been previously discussed (Tous and Romero, 2012; Cavicchia et al., 2013). In our dataset, DWCC do present a statistically significant weaker wind shear than SETC (Fig. 12), largely because of differences in the upper-level winds. At time h, 300 hPa winds are stronger than in the climatology for all categories of cyclones, in line with their association with the meandering of the jet stream. However, they are less strong for DWCC and WETC than for SETC.
In summary, our results show that, during their early stages, DWCC are typically characterized by higher potential intensity than ETC and evolve in environments with comparatively weak vertical wind shear. Both factors are conducive to the development of tropical-like features within cyclonic systems that are initially triggered by upper-level potential vorticity intrusions.
Although statistically significant differences in mean SST, PI, and wind shear are found between DWCC and SETC, the corresponding distributions exhibit substantial spread and overlap. Consequently, none of these environmental parameters alone provides a reliable discriminator between the two cyclone types. Rather, they should be interpreted as indicating environmental conditions that increase the likelihood of deep warm-core development.
3.4 Potential cause of the DWCC decay
Landfall is usually cited as an important cause of deprivation of moisture supply in tropical cyclones, causing their dissipation (Anthes, 1982; Kaplan and DeMaria, 1995). However, in the present dataset, more than 75 % of DWCC remain over the sea for 36 h after the peak intensity (Fig. A13), while they significantly weaken Fig. 13 and in many cases loose their warm core. Thus, other processes could be responsible for the onset of the dissipation phase.
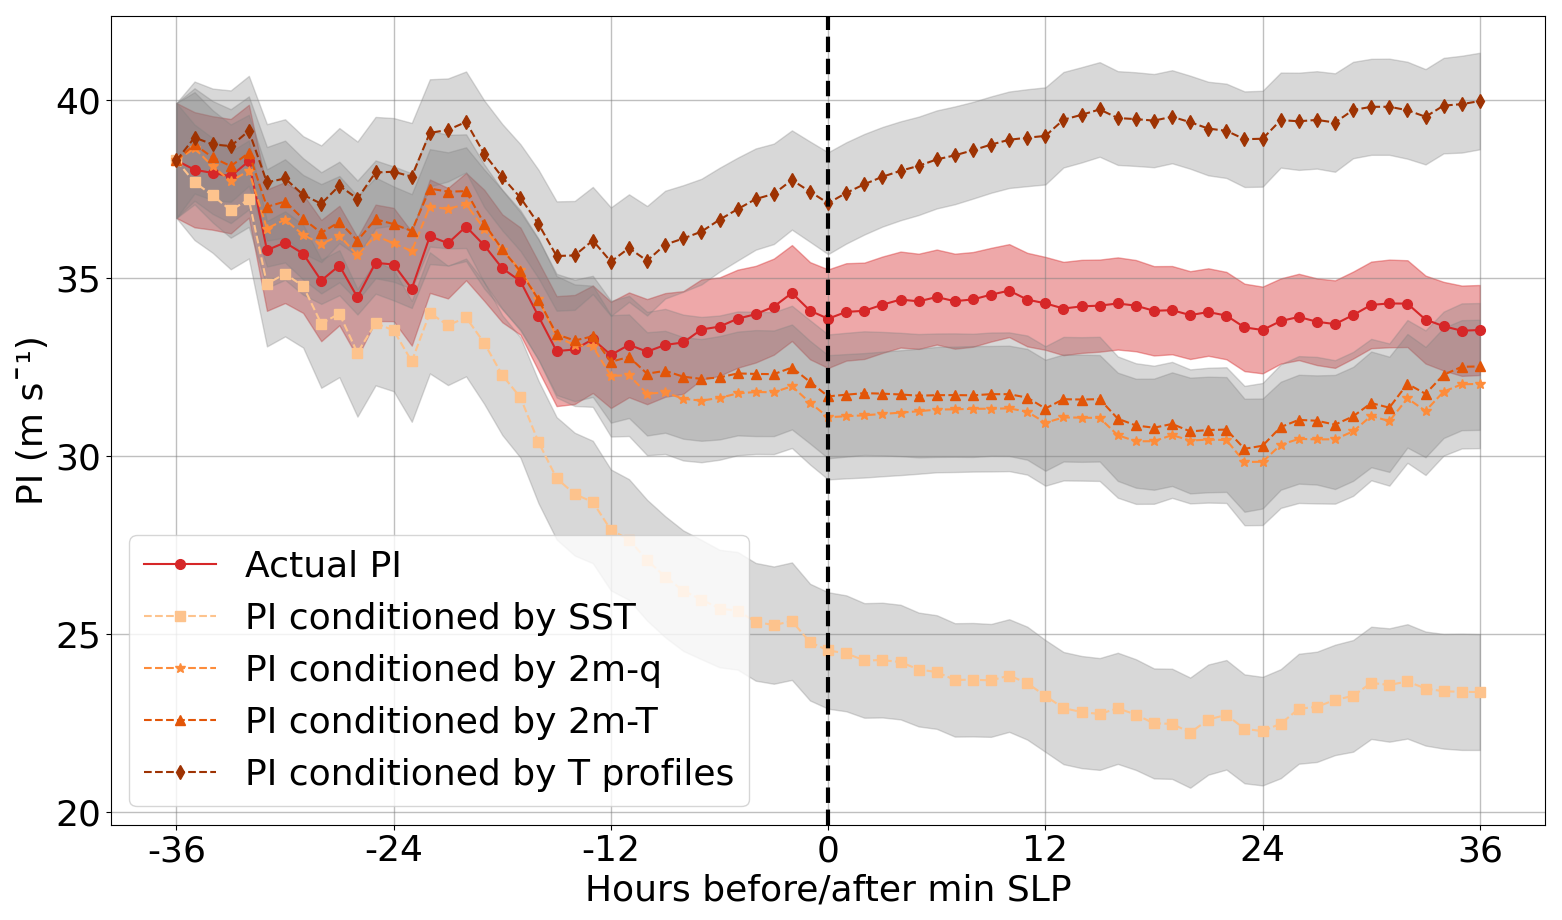
Figure 13Composite time evolution of the mean PI for DWCC with respect to their minimum SLP (black dashed line). The red solid line represents the actual mean PI. Other lines refer to PI computed letting only one variable evolve in time and all the others fixed at their initial value: SST (square markers), 2 m-temperature (triangle markers), 2 m-specific humidity (star markers), tropospheric temperature profile (diamond markers). The mean has been computed in a 4° by 4° box centered on each cyclone. Shading around the solid line indicates the standard error of the mean.
In Fig. 13 the time evolution of DWCC potential intensity is shown between −36 and +36 h from time of peak intensity. A progressive decrease of the PI with time can be noticed starting already in early stages and certainly before peak intensity.
We notice that at the same time there is a considerable reduction in SST (Fig. A8). The reduction in SST along the trajectory of DWCC could be driven by the action of the strong cyclonic winds, which are well known to generate cold wakes on the tracks of TC (Mei and Pasquero, 2013). We also notice that the translation speed of DWCC (and of SETC as well) significantly drops starting 12 h before peak intensity (Fig. A14). While the investigation of the reasons behind this change is beyond the scope of this work, we note that a slower translation speed both causes a colder anomaly at the sea surface (Mei et al., 2012) and leads to the cyclone spending more time over cool water. Those mechanisms generate a reduction in the air-sea fluxes because of the reduced thermodynamical disequilibrium between the upper ocean and the lower atmosphere associated with colder SST and are known to reduce the intensification rate of tropical cyclones (Mei et al., 2012).
The reduction in SST leads to a decrease in hurricane CAPE (i.e. the convective available potential energy of an air parcel lifted from saturation conditions at the sea surface temperature) that can ultimately result in lower PI. To investigate this influence, we computed additional time evolutions of PI by holding all variables constant at their initial values (either at −36 h, or at the first available track time for cyclones with a later track onset), except for one: SST, near-surface specific humidity, near-surface temperature, or the full atmospheric temperature profile (Fig. 13). Among these, the PI computed with varying SST and fixed other variables shows the largest decrease, suggesting that the SST drop can be considered one of the primary contributors to the PI reduction.
In this regard, we notice that the DWCC composite SST reduction of 3 K is a very strong anomaly, compared to the cold wakes of TC (Mei and Pasquero, 2013). This strong cooling, and the potential large cold-wake feedback on cyclone intensity, can be attributed to the shallow mixed layer of the Mediterranean Sea – typically only 15–30 m deep in October (D'Ortenzio et al., 2005), the month of largest DWCC occurrence. Such a shallow mixed layer enhances the effects of the cyclone-induced upwelling and vertical mixing, resulting in a large cooling at the surface.
Thus, our composites are consistent with the SST-controlled intensity feedback known to limit the strength of tropical cyclones. The decay of DWCC might be related to it, but it can also be associated with other dynamical factors, such as the evolving baroclinic environment and changes in the vertical wind shear. While the present analysis highlights the role of air–sea coupling and cold-wake feedbacks as key contributors to the post-peak intensity decline, a detailed assessment of the relative importance and interactions among these processes is left for future work.
This study provides a comprehensive analysis of Mediterranean Deep Warm Core Cyclones (DWCC) compared to classical Extratropical Cyclones (ETC). Moving beyond the individual case studies and idealized model simulations that characterize much of the existing literature (Tous and Romero, 2012; Cavicchia et al., 2014; Dafis et al., 2020; de la Vara et al., 2021), we leverage an extensive dataset of real-world cyclones developed by Flaounas et al. (2023).
While previous works focused on anomalous environmental conditions associated with the peak intensity phase of cyclones (Cavicchia et al., 2013; Tous and Romero, 2012; Gutiérrez-Fernández et al., 2023), which can often appear similar for both warm-core and intense cold-core systems, we directly compare conditions during the intensification phase for DWCC and intense ETC (SETC). This distinction allows us to isolate the specific physical mechanisms that favor the tropical-like transition, in the sense of the evolution of a cold core structure into a deep warm core structure (Davis and Bosart, 2004).
It is, however, important to note that the classification of cyclones presented in this work is based on Cyclone Phase Space (CPS) diagrams (Hart, 2003). Although the CPS framework is a widely accepted diagnostic tool, its application to Mediterranean systems remains a subject of debate within the scientific community. The original formulation by Hart (2003) requires adaptation for the smaller and shorter-lived Mediterranean systems. In this study, this was done following the works of Picornell et al. (2014), Cavicchia et al. (2013), Ragone et al. (2018), Noyelle et al. (2019), and de la Vara et al. (2021). We also stress that CPS diagnostics does not differentiate between diabatically driven warm cores and warm seclusions, as highlighted by Mazza et al. (2017), Fita et al. (2007), Miglietta et al. (2025), and Gutiérrez‐Fernández et al. (2024). Indeed, both medicanes and warm seclusions are present in the DWCC class. The number of warm seclusions may be slightly enhanced by the absence of the symmetry criterion introduced by Hart (2003) (as measured by the B parameter) in the present analysis. However, the tracking algorithm employed by Flaounas et al. (2023) already incorporates symmetry-related constraints: 95 % of the selected cyclones indeed satisfy the low B criterion.
In light of these methodological considerations, and considering that the number of DWCC identified in this study, 3.4 cyclones per year, is considerably larger than the number of medicanes typically reported in the literature, which is about 1.5 per year (Romero and Emanuel, 2013; Cavicchia et al., 2014; Ragone et al., 2018; Zhang et al., 2020), readers may be tempted to conclude that most DWCC are warm seclusions. However, it is worth noting that in several cases reported in the literature, the number of occurrences of tropical-like cyclones has been obtained by explicitly tuning selection criteria used for the definition of medicanes to obtain an average of 1.5 events per year, a number that originated from an informal register that was maintained by the Meteorological group at the University of Balearic Islands (see http://www.uib.es/depart/dfs/meteorologia/METEOROLOGIA/MEDICANES, last access: 7 August 2025). By varying a threshold parameter within a reasonable range in the selection procedure, Cavicchia et al. (2014) found that the number of events varied by a factor of three. Similar sensitivity was presented in Ragone et al. (2018). For these reasons, even acknowledging that the DWCC dataset includes warm seclusions, we cannot presently state what fraction of DWCC belongs to the different categories. In any case, it is reasonable to expect that many of the signals emerging from this work that differentiate DWCC from classical strong ETC evolution might be even more clear for tropical-like cyclones. A demonstration of this, however, requires a clear identification of medicanes within the DWCC class and is left for future work.
Our analysis reveals that both DWCC and strong ETC originate from a strong positive upper-level potential vorticity (PV) anomaly, setting them apart from the majority of weak ETC. Those strong PV anomalies are mainly of adiabatic origin, typically associated with PV advection from the stratosphere (Dolores-Tesillos et al., 2022; Sánchez et al., 2024). While DWCC and SETC exhibit similar surface wind speeds, DWCC are associated with larger and more intense precipitation patterns, as well as stronger enthalpy fluxes at the air-sea interface, resulting, on average, in more dangerous phenomena (Zhang et al., 2020).
The primary distinction between the two cyclone types considered here is reflected in their Potential Intensity (PI) during the intensification phase, which is, on average, larger for DWCC than for SETC. A central contribution of this work is the systematic analysis of PI across a large sample of Mediterranean cyclones, which allows us to assess its diagnostic relevance in a statistical sense. While the PI distributions of extratropical-type cyclones and deep warm-core cyclones partly overlap – indicating that PI alone does not provide a strict separation between the two classes – clear differences nonetheless emerge at the population level. In this way, we move beyond merely demonstrating that high-PI environments can occur in the Mediterranean Sea (Emanuel, 2005; Emanuel et al., 2025). Instead, we show that PI offers probabilistic information on cyclone evolution, indicating a greater likelihood of deep warm-core development under higher PI conditions.
In this PI distinction, seasonality plays an important role: DWCC predominantly form in autumn and spring, whereas SETC develop mainly in winter. Therefore, SETC are typically associated with colder sea surface temperatures (SST) than DWCC, conditions that lead to lower climatological values of PI. In contrast, DWCC form at locations and times in which climatological PI is larger. Moreover, DWCC develop in situations when the actual PI is larger than the climatological value, confirming that specific localized conditions (such as the mid-level cold intrusions) contribute to setting a favorable context for their intensification (Cavicchia et al., 2013). Instead, cold anomaly intrusions in SETC do not significantly modify PI from the climatological value, possibly because of the stronger air column stability associated with the lower SST. Wind shear further distinguishes the two cyclone types: DWCC form in settings with weaker upper-level jets, as suggested in previous studies (Cavicchia et al., 2013; Tous and Romero, 2012).
The development of a cold anomaly in the mid-troposphere (which is present in all cyclone categories, Fig. A12) can be directly driven by the upper-troposphere PV intrusion through several dynamic and thermodynamic processes. A positive PV anomaly induces vertical motion below (Chaboureau et al., 2011), causing mid-tropospheric air to ascend and cool adiabatically as it expands under decreasing pressure. Additionally, the PV anomaly deforms isentropic surfaces, lowering them in the mid-troposphere and displacing colder, denser air downward. The upper-level divergence associated with the anomaly reinforces this upward motion and cooling. Combined, these processes can generate a significant mid-tropospheric cold anomaly, destabilizing the air column in warm environments and enhancing convection. Further investigation of the terms in the omega equation, similar to the analysis of Hurricane Ophelia's extratropical transition by Rantanen et al. (2020), is needed to confirm the action of these individual processes.
We stress that the focus of the present study is the warm-core transition in a broad sense, which encompasses – but is not limited to – tropical transition. It has already been stated multiple times that our dataset also includes warm seclusion events, which are not undergoing a full TT toward a tropical–like state. As such, our results contribute to the TT literature in a more general way, by characterizing the environmental and synoptic conditions associated with warm-core development across a wide population of Mediterranean cyclones, rather than isolating TT cases alone. Our findings are consistent with previous work (Miglietta and Rotunno, 2019; Flaounas et al., 2021), while extending it through an objective framework that tracks the time evolution of cyclones in the Hart cyclone phase space, together with a statistically robust, reanalysis-based perspective on warm-core transitions in the Mediterranean.
Emanuel et al. (2025) propose to differentiate extratropical cyclones with tropical characteristics that develop in the presence of a transient, localized, and self-induced large value of potential intensity (named cyclops) from those that develop in a region where the large PI is a large-scale environmental factor (which are actual tropical cyclones, even if they happen outside the tropics). Whereas we notice that the composite PI anomaly of DWCC is predominantly associated with a perturbation-induced cold tropospheric profile (which highlights the presence of cyclops in the DWCC group), a detailed study of PI and the relative contributions from cold troposphere and warm SST should be performed on individual cyclones to assess the frequency of cyclops.
This possible extension of the present work also requires the integration of the modified potential intensity introduced in Emanuel et al. (2025) to remove the effects of the cyclone-induced tropospheric warming from the computation of PI, which may artificially limit PI once the warm core has developed. Our results suggest that the temporal changes in tropospheric air temperature might play a relatively small role in the evolution of PI (Fig. 13). This result aligns with the statement by Emanuel et al. (2025) that the contribution of the correction in the modified PI is generally modest. However, further analysis will be needed to confirm this indication.
The decay of tropical-like cyclones can be attributed to landfall, increased stability in the air column, wind shear, and passage of the cyclone over a cold SST. Our analysis suggests that DWCC decay is typically linked to a drop in SST, which drives the decrease of PI over time, resembling the SST feedback mechanism known to affect the evolution of classical tropical cyclones, where surface cooling induced by the storm reduces PI (Schade and Emanuel, 1999; Jullien et al., 2014; Mei et al., 2012). However, ERA5 SST (which has been obtained using both spatial and temporal smoothing on observed SSTs) might not be the best available estimate of the actual sea surface temperature fields at the time of DWCC occurrence. The use of purely observational SST datasets could lead to interesting findings in the response of the upper waters to DWCC, in the quantification of cold wakes associated with their passage, and in the investigation of their effect on the subsequent evolution of cyclones.
This study benefits from the large observational dataset assimilated in the ERA5 reanalysis, which represents a substantial improvement over earlier studies based on its coarser predecessor, ERA-40 (Tous and Romero, 2012). Nevertheless, it is important to acknowledge the limitations associated with the use of non-assimilated variables in the analysis, as these may affect the interpretation of key cyclone characteristics. ERA5 tends to underrepresent specific humidity in the lower and mid-troposphere, particularly in convective environments and over sea, which can bias estimates of thermodynamic disequilibrium and moisture fluxes (Johnston et al., 2021; Slocum et al., 2022; Pantillon et al., 2024). Biases in atmospheric temperature and humidity can distort the vertical instability structure and affect potential intensity metrics. Moreover, ERA5 systematically underestimates peak wind speeds in intense cyclones due to its relatively coarse resolution and smoothed surface drag parameterization, resulting in weaker near-surface winds than those observed in both tropical and tropical-like systems (Gandoin and Garza, 2024; Gutiérrez-Fernández et al., 2023).
These shortcomings and the relatively coarse resolution of the used atmospheric model limit ERA5's ability to fully capture the mesoscale dynamics essential for cyclone development and intensification. This limitation is particularly evident when attempting to depict the most intense features – such as those found in the northwest quadrant of DWCC composites for both PI and precipitation – where ERA5's spatial and physical resolution proves insufficient to resolve fine-scale structures. Therefore, future research should integrate high-resolution simulations (following Ragone et al., 2018; Bouin and Lebeaupin Brossier, 2020; Sánchez et al., 2024), fine scale hindcasts of reanalysis data (Bernini et al., 2025, such as the CHAPTER dataset), and targeted observations (like recommended by Velden et al., 2025) to better resolve the fine-scale thermodynamic and dynamical processes governing Mediterranean tropical-like cyclones.
Finally, a key question opened by this study is whether potential intensity (PI) can serve as an early indicator of DWCC formation and intensification. This would involve identifying cyclones that exceed a PI threshold in their early stages and tracking the presence of a warm core throughout their lifecycle. Such an approach could improve DWCC prediction, enhancing preparedness and risk mitigation in the Mediterranean region.
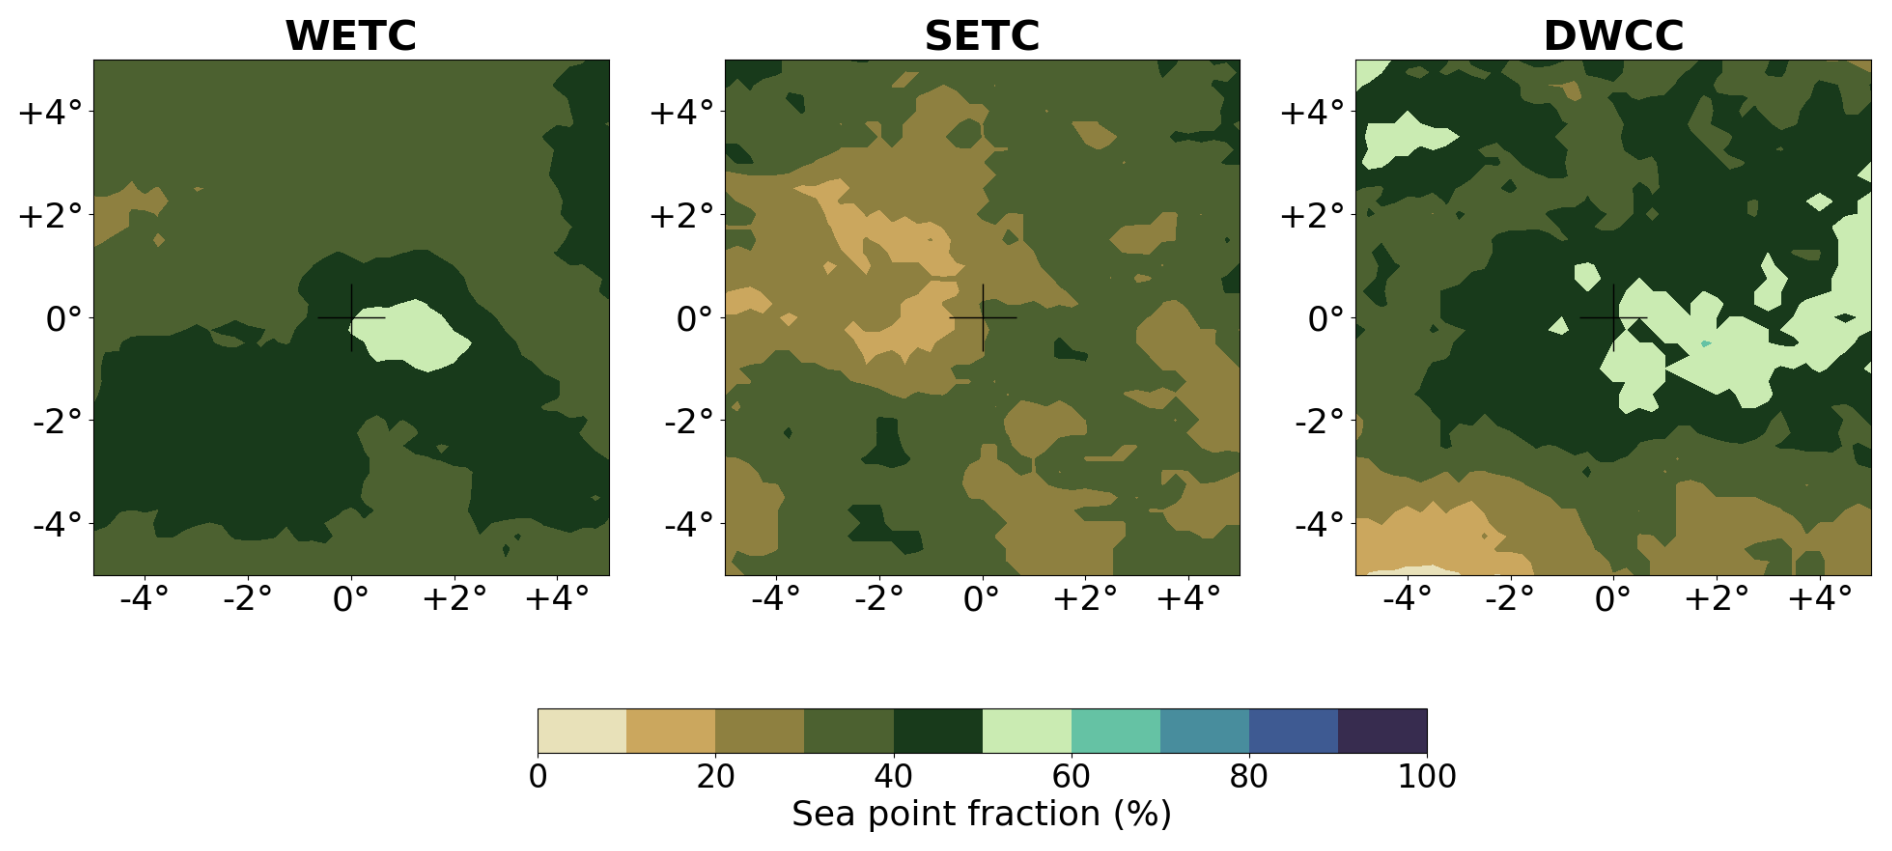
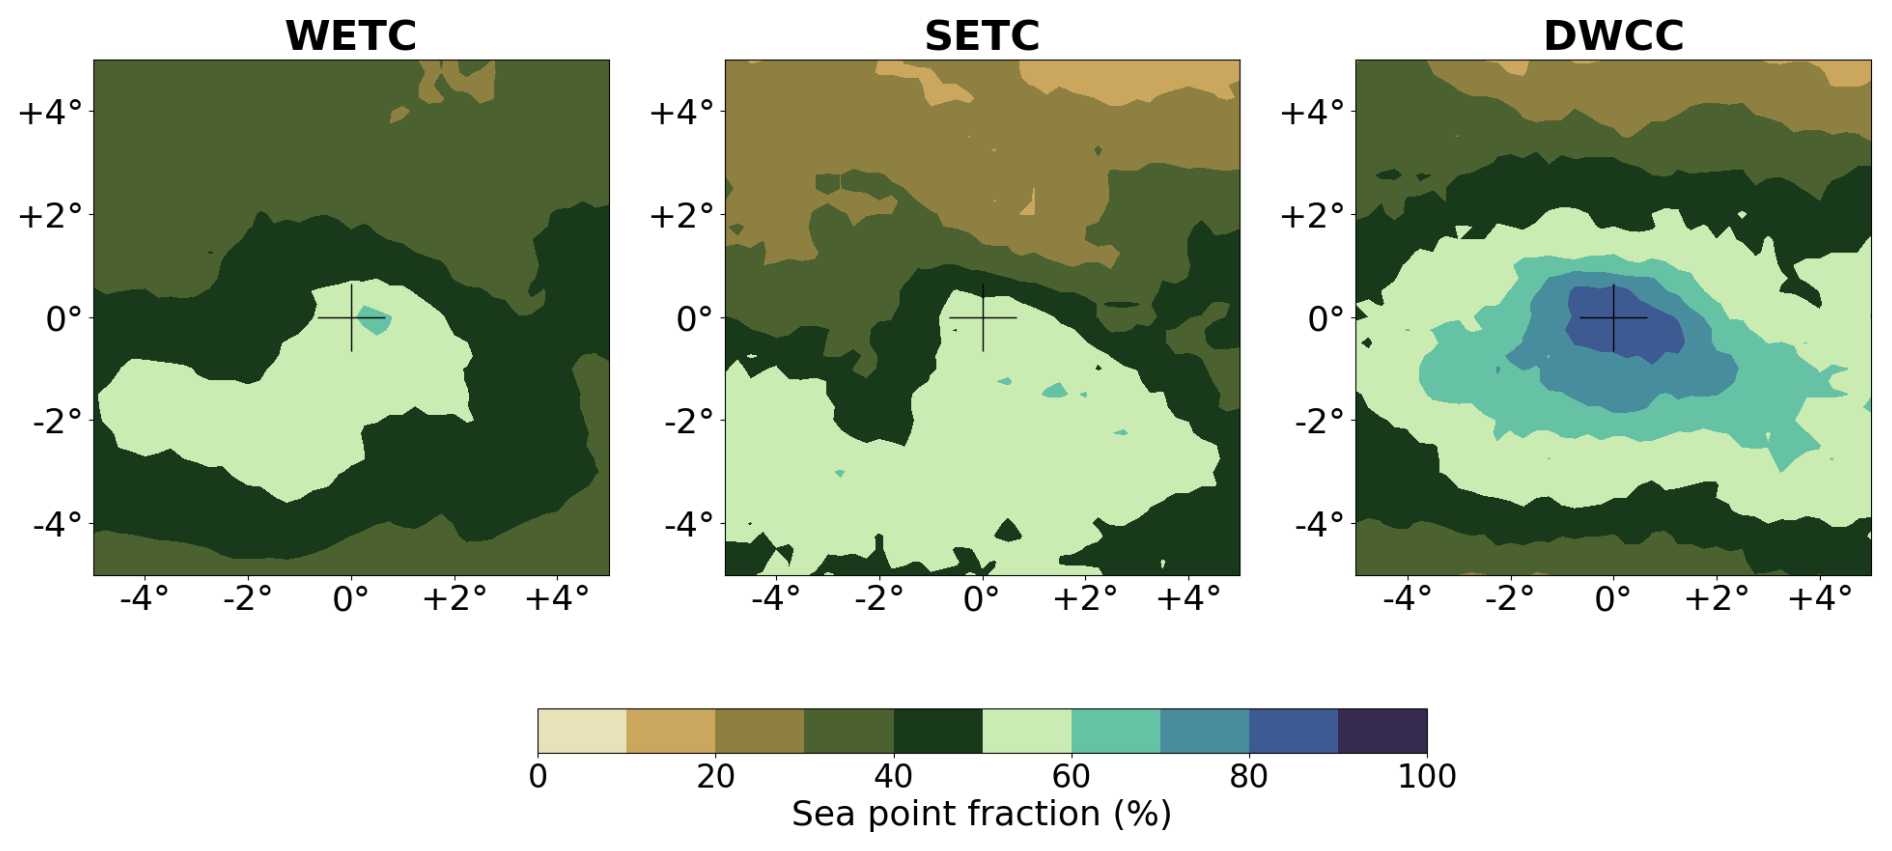
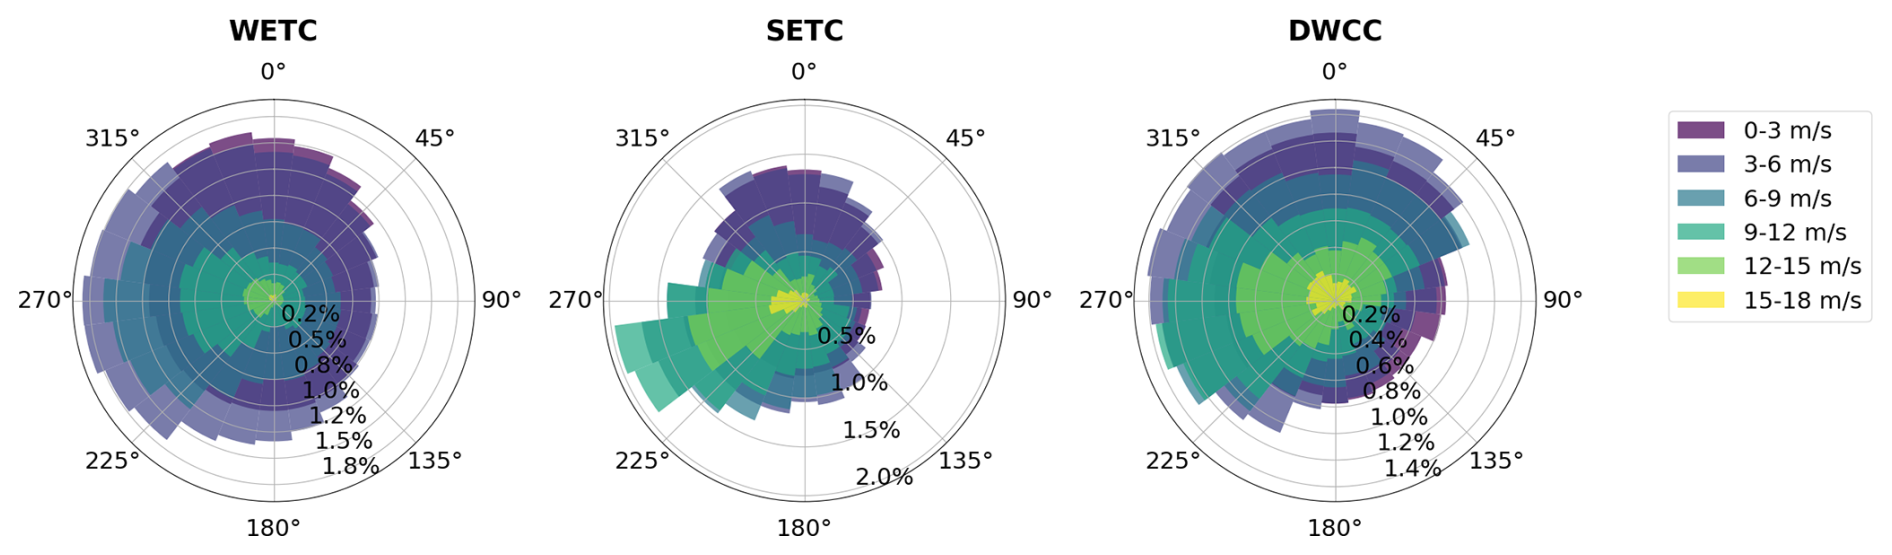
Figure A3Wind rose at time of maximum cyclones' intensity for WETC (left), SETC (middle), and DWCC (right).
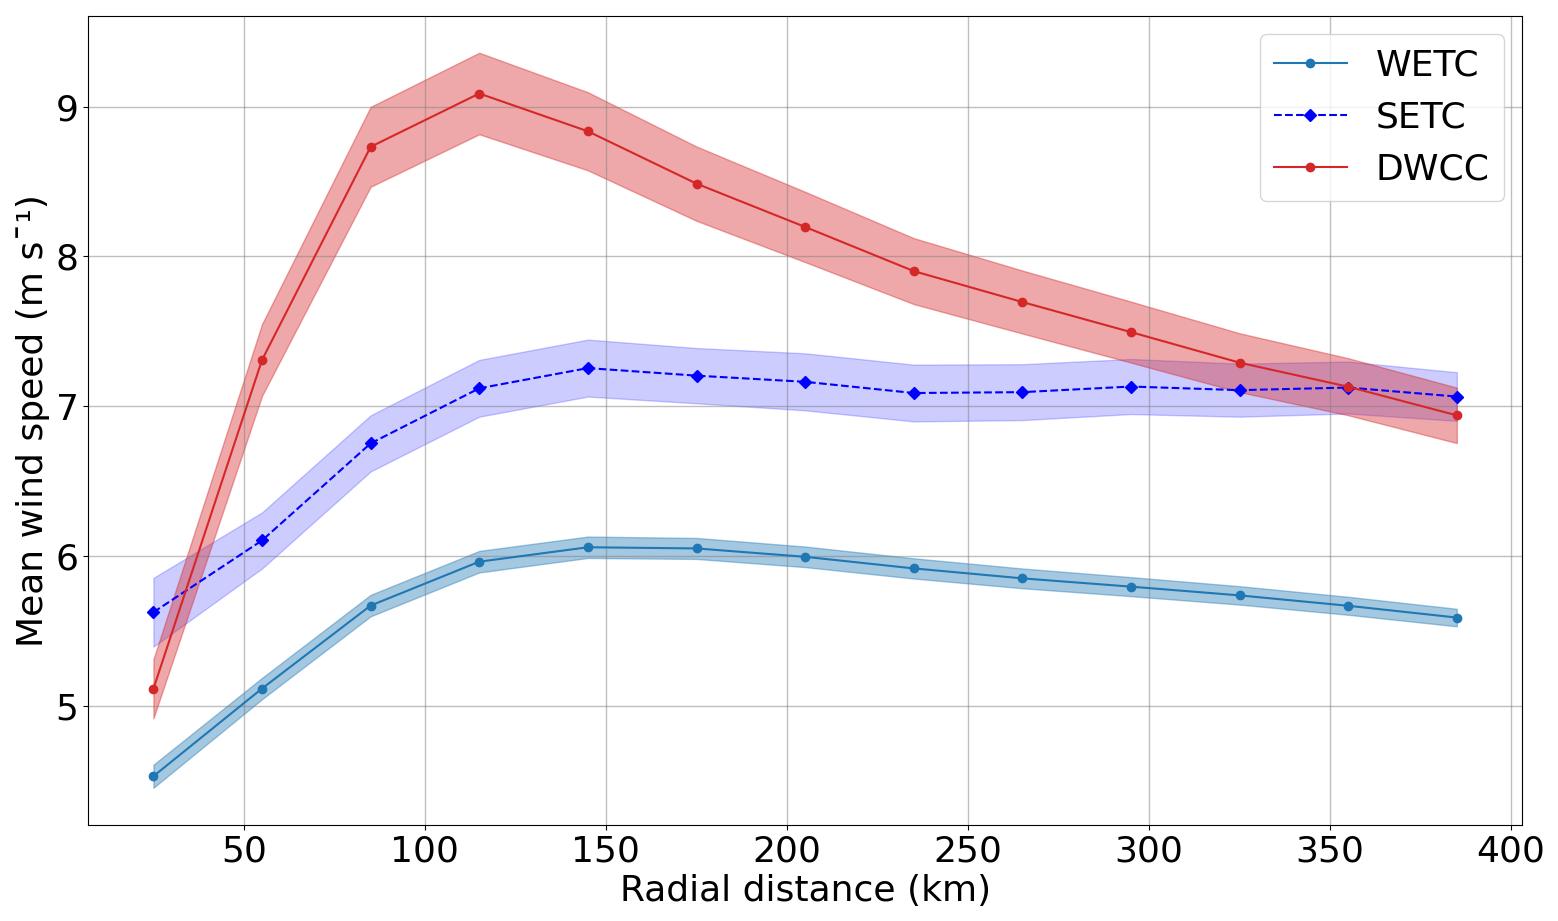
Figure A4Azimuthally averaged wind speed at time of maximum cyclones intensity for WETC (light blue solid line), SETC (dark blue dashed line), and DWCC (red solid line). Shading around the solid line indicates the standard error of the mean.
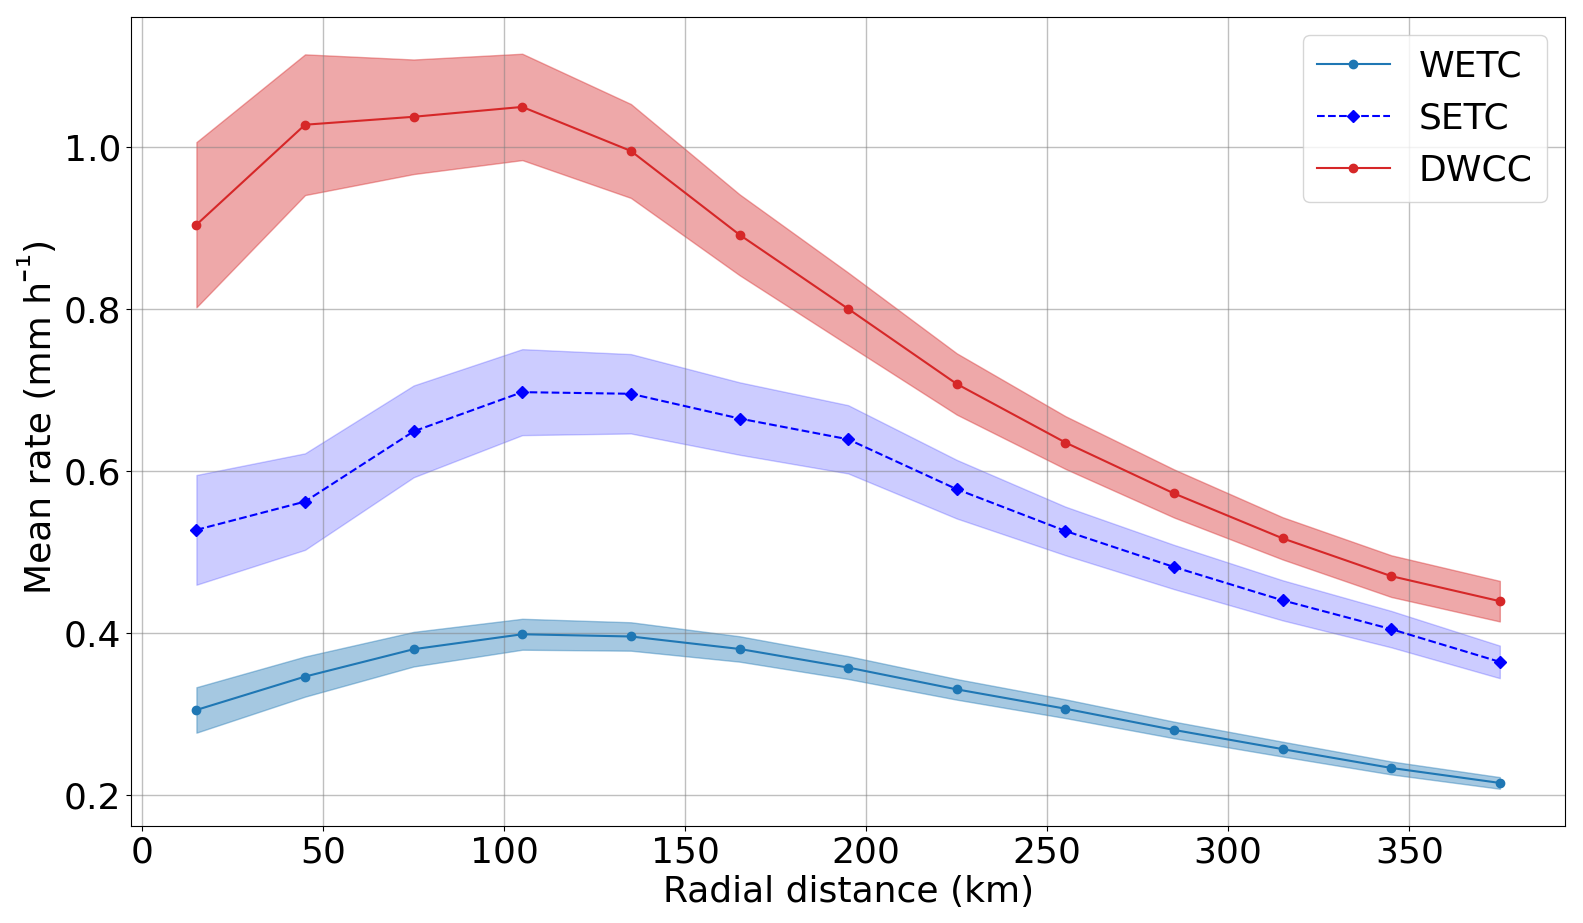
Figure A5Azimuthally averaged precipitation at time of maximum cyclones intensity for WETC (light blue solid line), SETC (dark blue dashed line), and DWCC (red solid line). Shading around the solid line indicates the standard error of the mean.
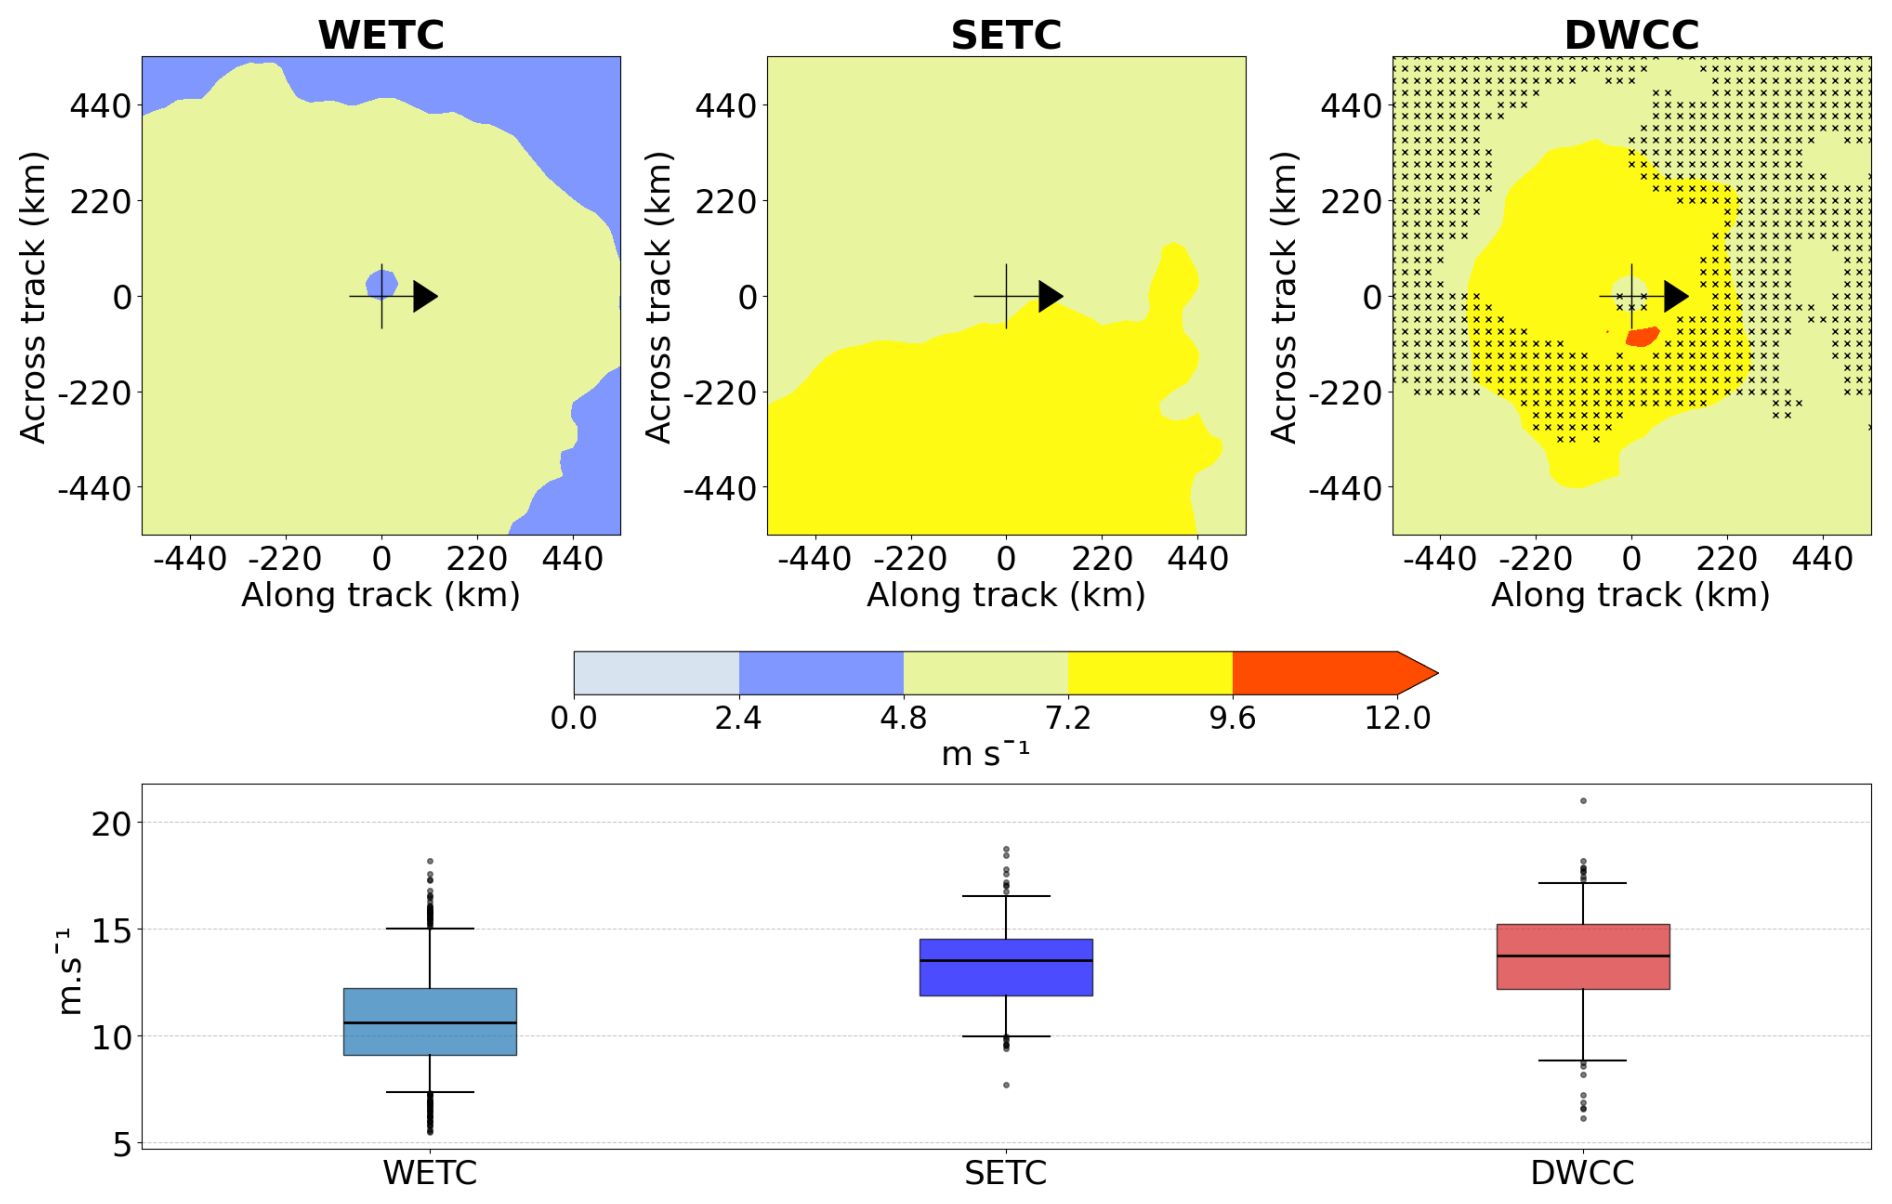
Figure A610 m surface wind for the different cyclone classes. Top: 2D composites centered on the cyclone and oriented along the direction of propagation of the cyclones, at the time of minimum SLP. The markers in the right panel indicate regions where DWCC composited surface wind is not significantly different from SETC (95 % confidence level). Bottom: boxplots of the mean surface wind for each cyclone, where the mean is computed on the 10 % highest values over the 10° × 10° box for each cyclone. Boxplots show the median value (horizontal line), the interquartile range (colored area), the 5th and 95th percentiles (whiskers), and outliers.
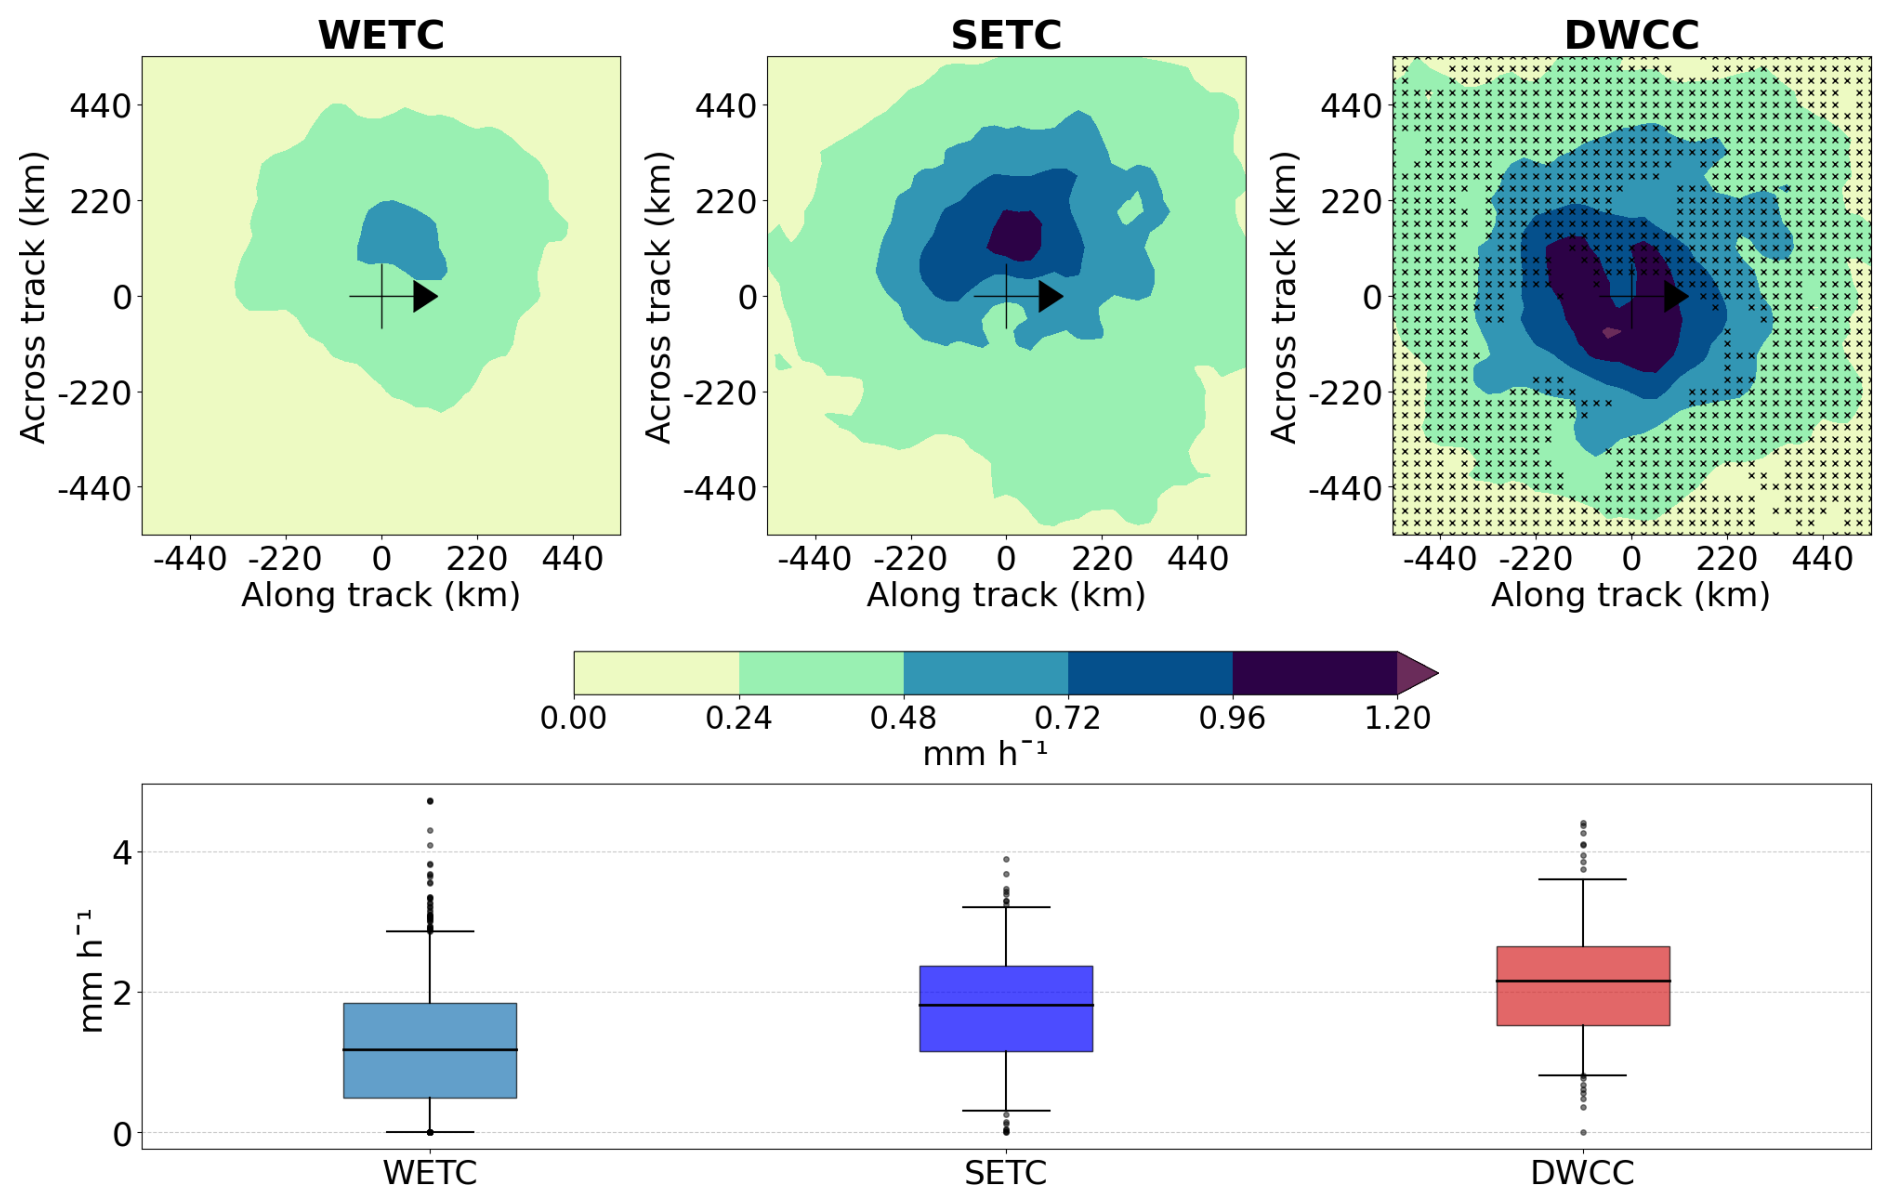
Figure A7Hourly precipitation for the different cyclone classes. Top: 2D composites centered on the cyclones and oriented along the direction of propagation of the cyclones, at the time of minimum SLP. The markers in the right panel indicate regions where DWCC composited hourly precipitation is not significantly different from SETC (95 % confidence level). Bottom: boxplots of the mean hourly precipitation for each cyclone, where the mean is computed on the 10 % highest values over the 10° × 10° box for each cyclone. Boxplots show the median value (horizontal line), the interquartile range (colored area), the 5th and 95th percentiles (whiskers), and outliers.
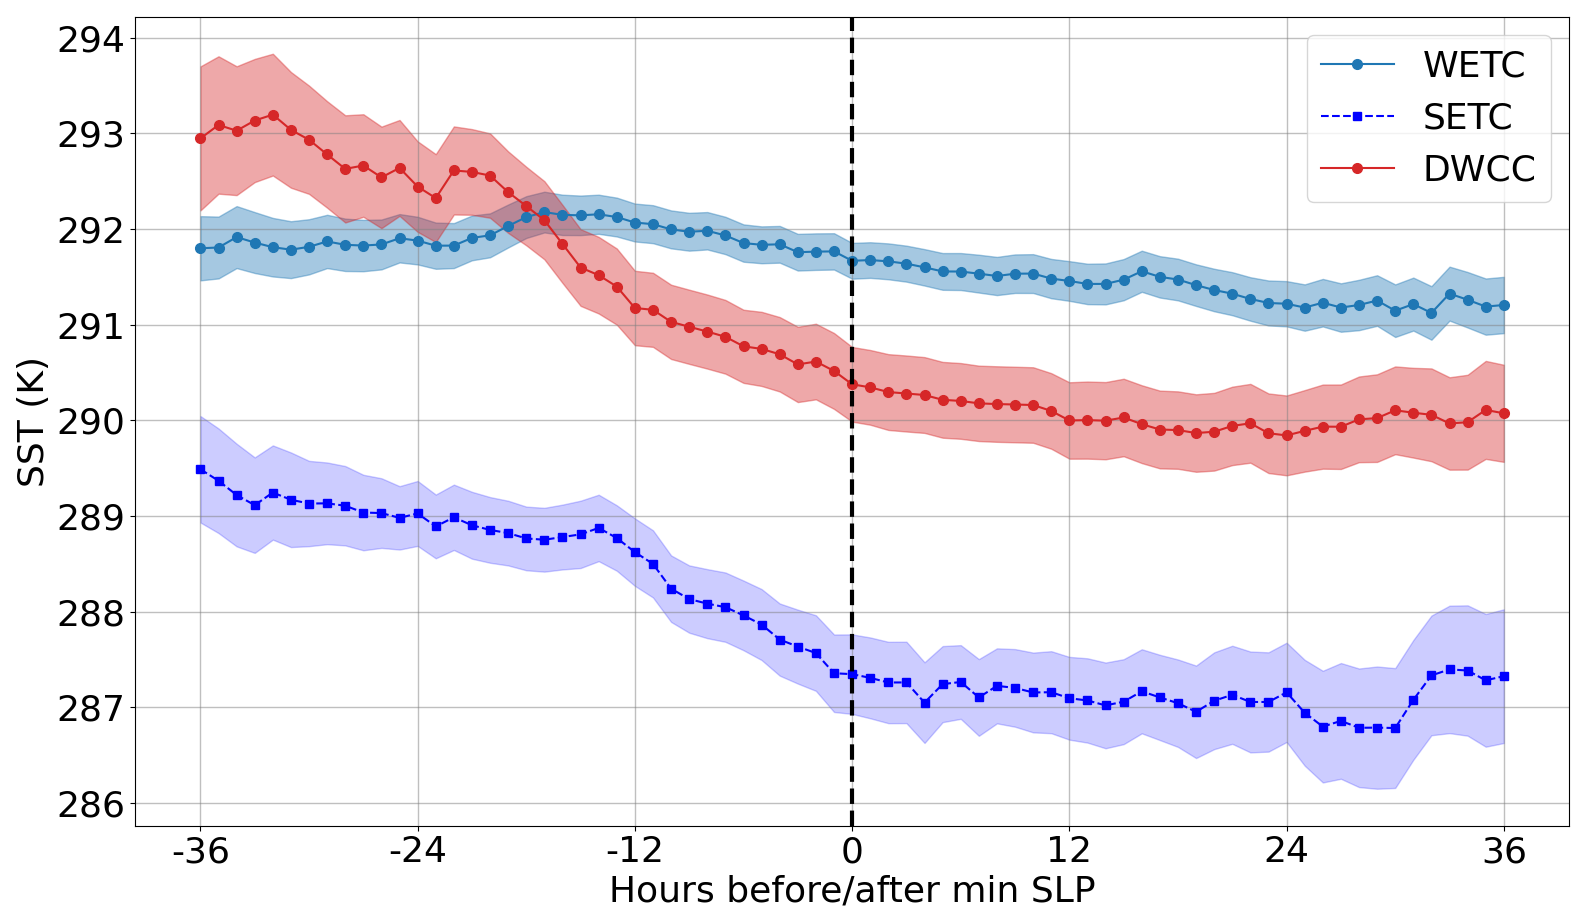
Figure A8Composite time evolution of the mean SST for WETC (light blue solid line), SETC (dark blue dashed line), and DWCC (red solid line) with respect to their minimum SLP (black dashed line). The mean has been computed in a 4° by 4° box centered on each cyclone. Shading around the solid line indicates the standard error of the mean.
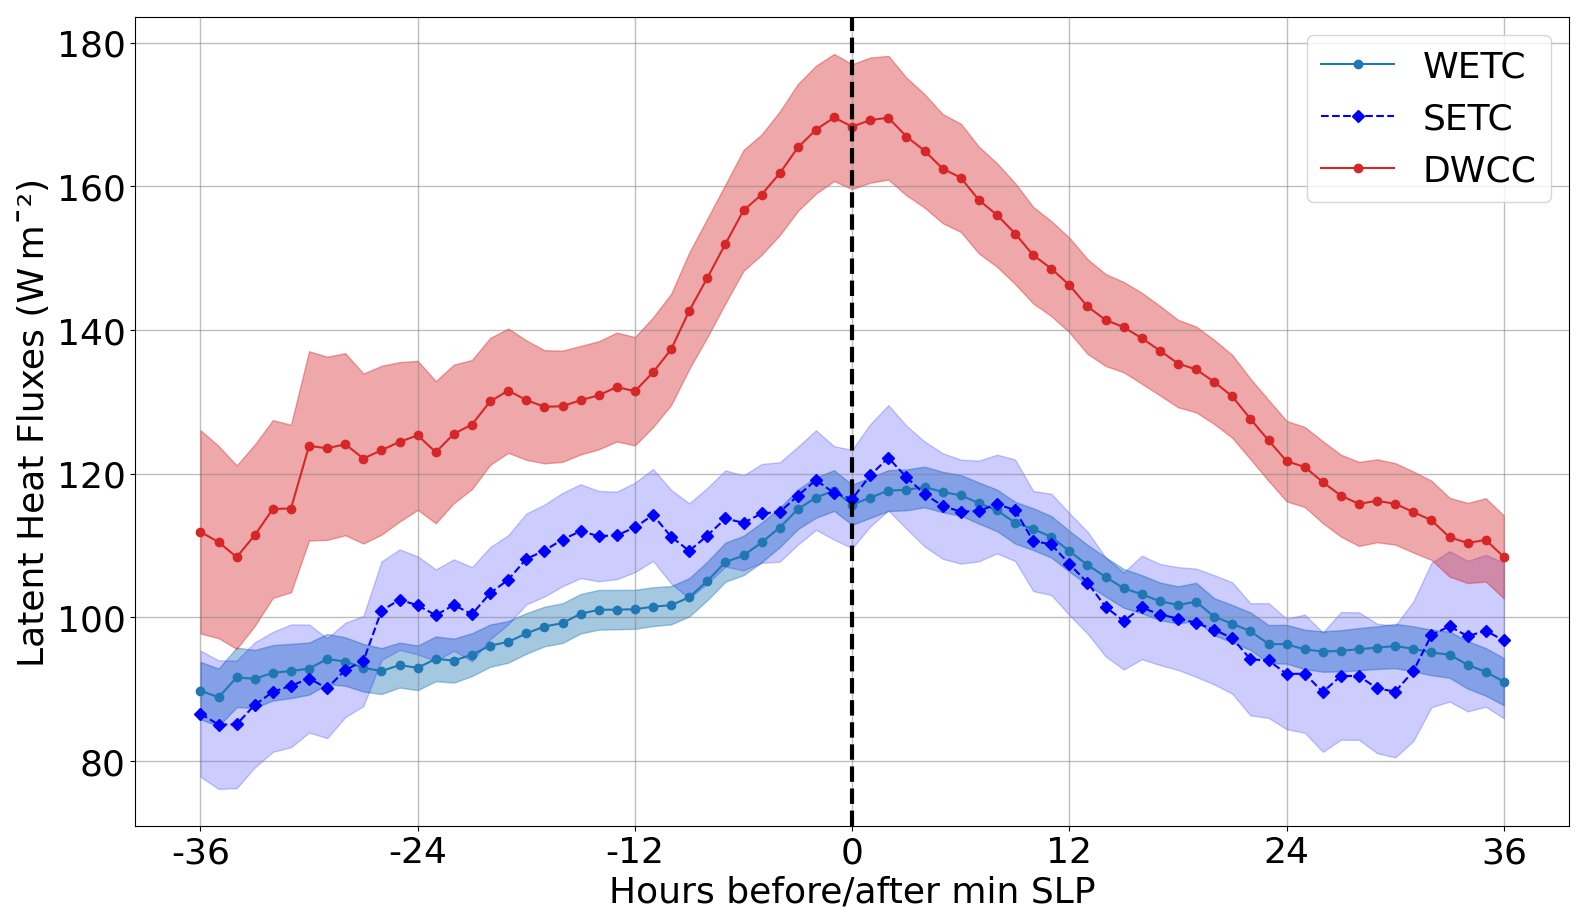
Figure A9Composite time evolution of the mean air-sea latent heat flux for WETC (light blue solid line), SETC (dark blue dashed line), and DWCC (red solid line) with respect to their minimum SLP (black dashed line). The mean has been computed in a 4° by 4° box centered on each cyclone. Only the points over the sea are considered. Shading around the solid line indicates the standard error of the mean.
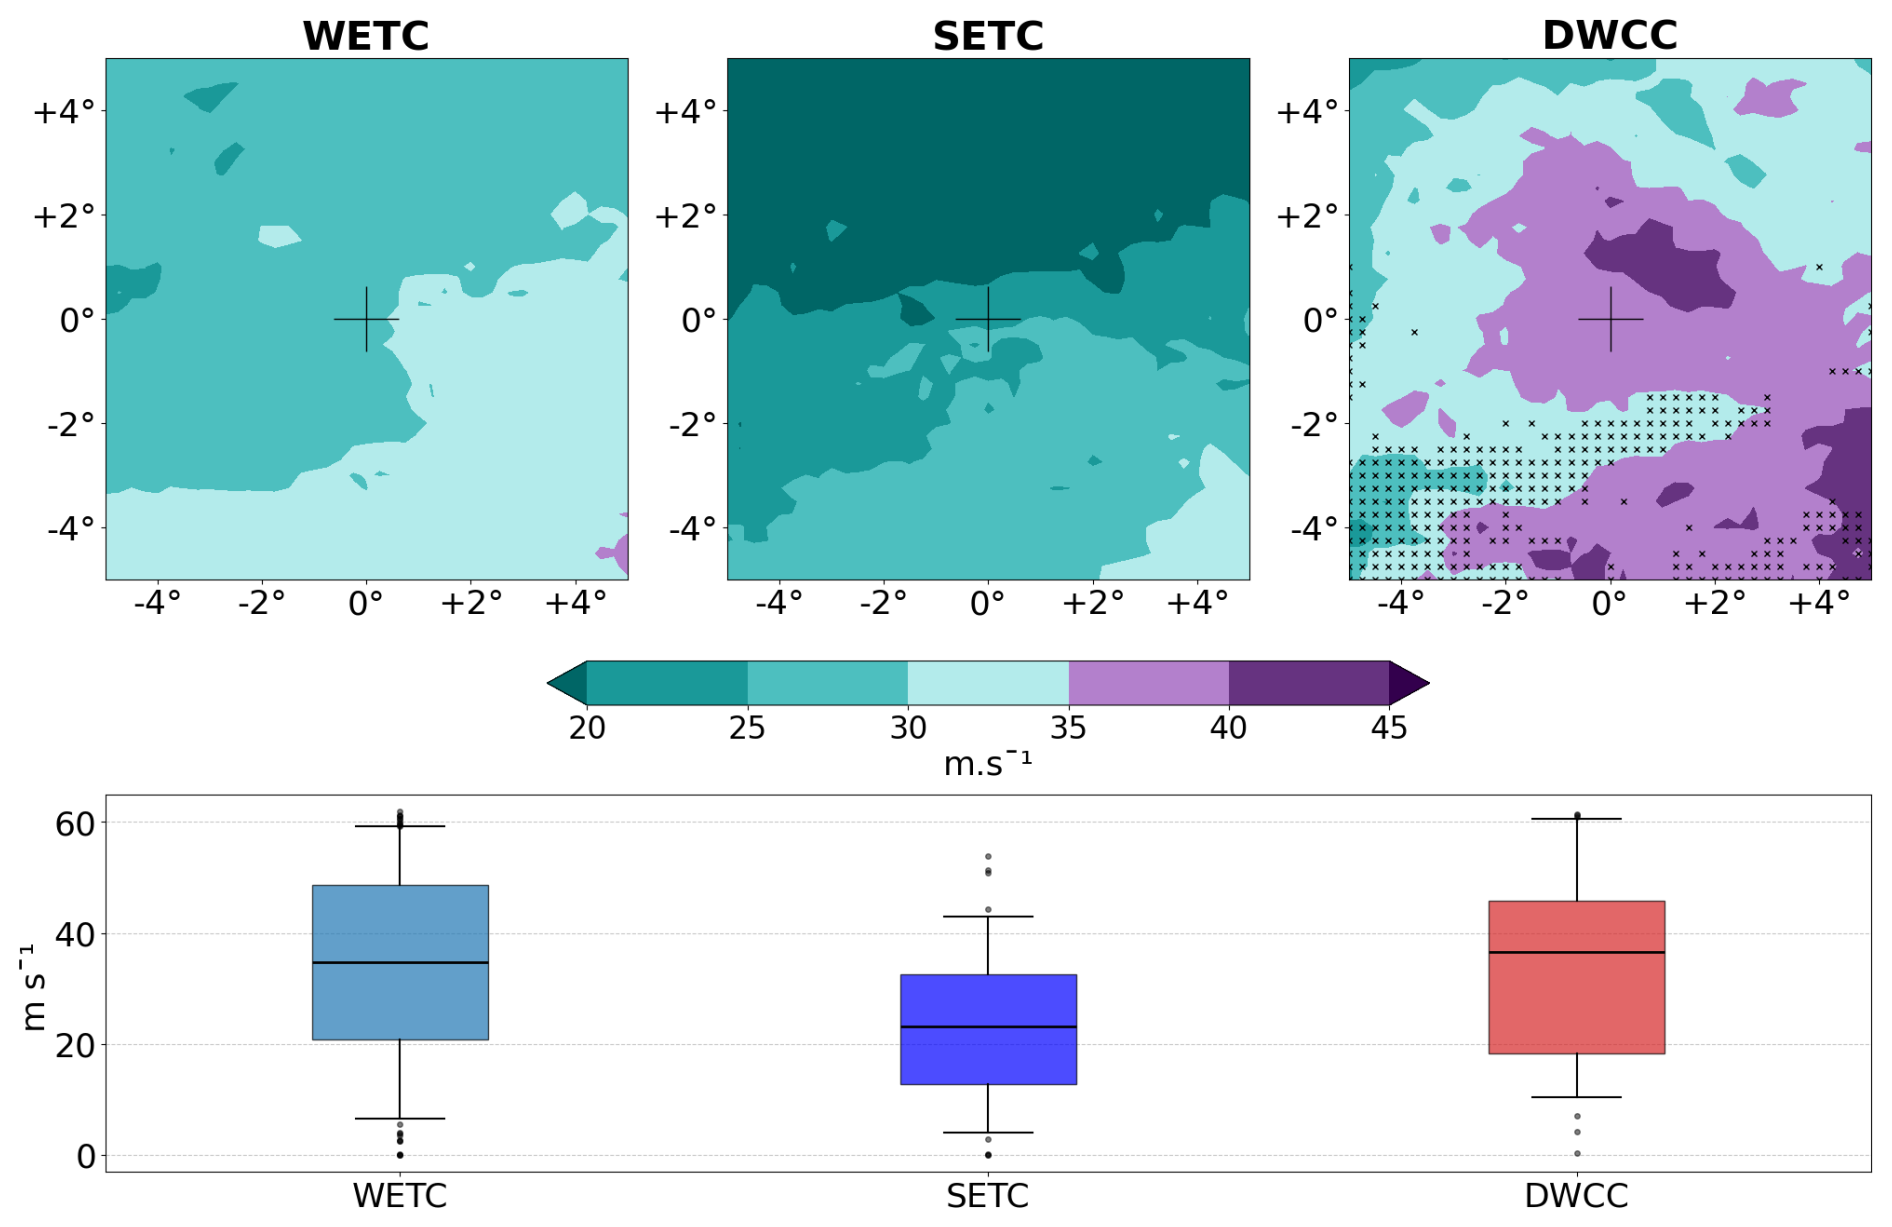
Figure A10Climatological PI for the different cyclone classes. Top: 2D composites centered on the cyclones, 36 h before the time of minimum SLP. The markers in the right panel indicate regions where DWCC composited climatological PI is not significantly different from SETC (95 % confidence level). The purple colors represent values of PI above 35 m s−1, value below which tropical cyclones typically don't form (Emanuel, 2010). Bottom: boxplots of the mean climatological PI for each cyclone, where the mean is computed on the 10 % highest values over the 10° × 10° box for each cyclone. Boxplots show the median value (horizontal line), the interquartile range (colored area), the 5th and 95th percentiles (whiskers), and outliers.
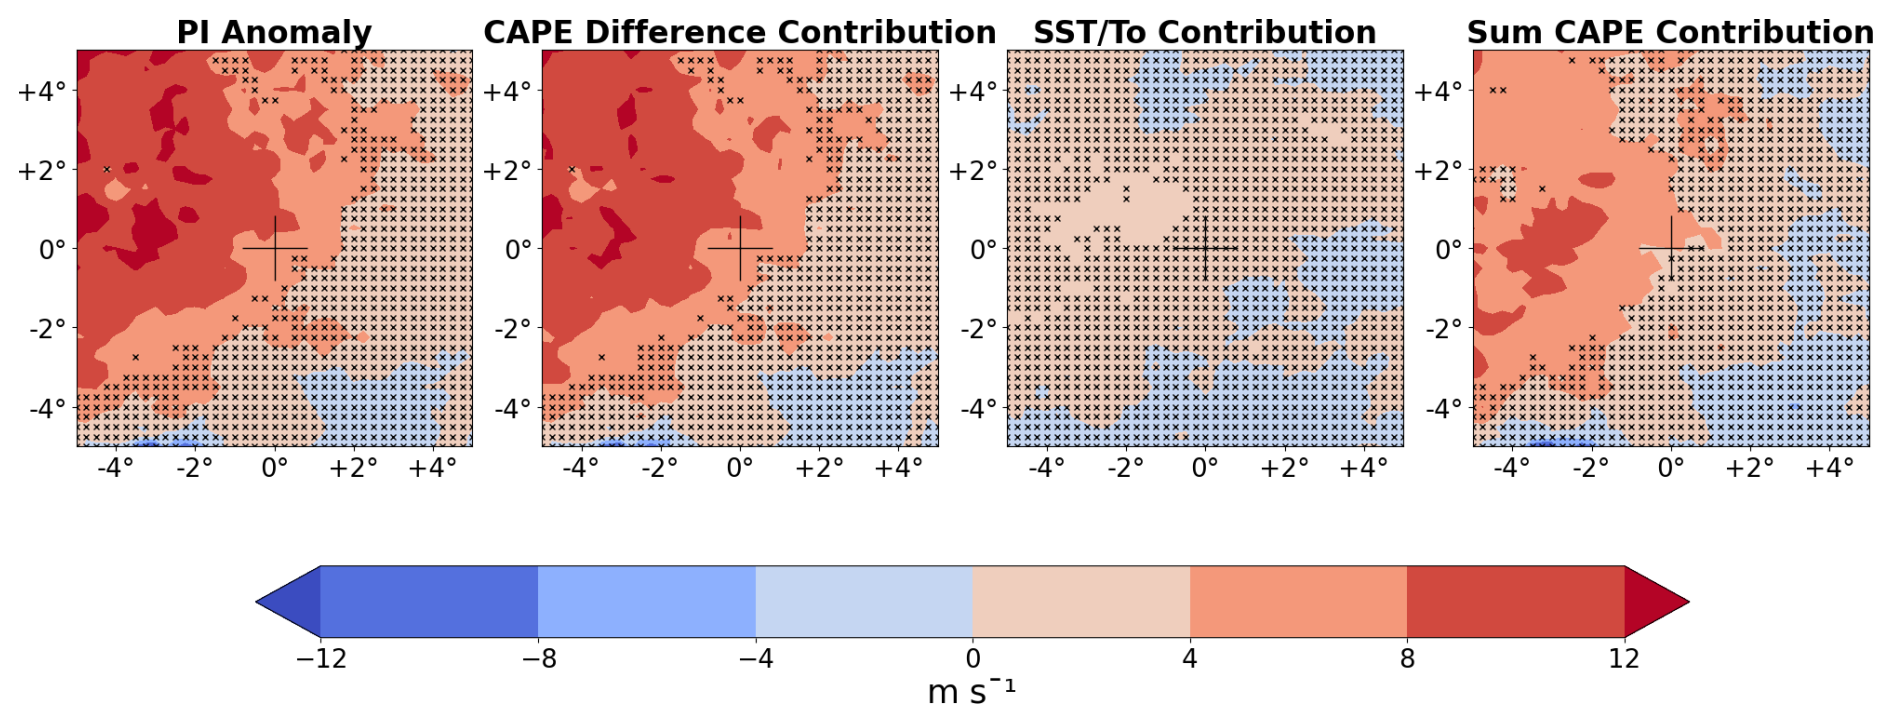
Figure A112D composites of PI anomalies (m s−1) for DWCC 36 h before their minimum SLP. From the left: PI anomaly as the difference between the actual PI (Fig. 10) and the climatological PI (Fig. A10); difference between the PI computed with all climatological values but the actual difference in CAPE and the climatological PI; difference between the PI computed with all climatological values but the actual efficiency factor and the climatological PI; sum of the contributions to the anomaly created by the CAPE difference presented in Fig. 11. The difference between the second and the fourth subplots shows the non-linearities at play in the total contribution of the CAPE difference to the final PI anomaly. The markers indicate the anomalies that are not significantly different from 0 at a 95 % confidence level.
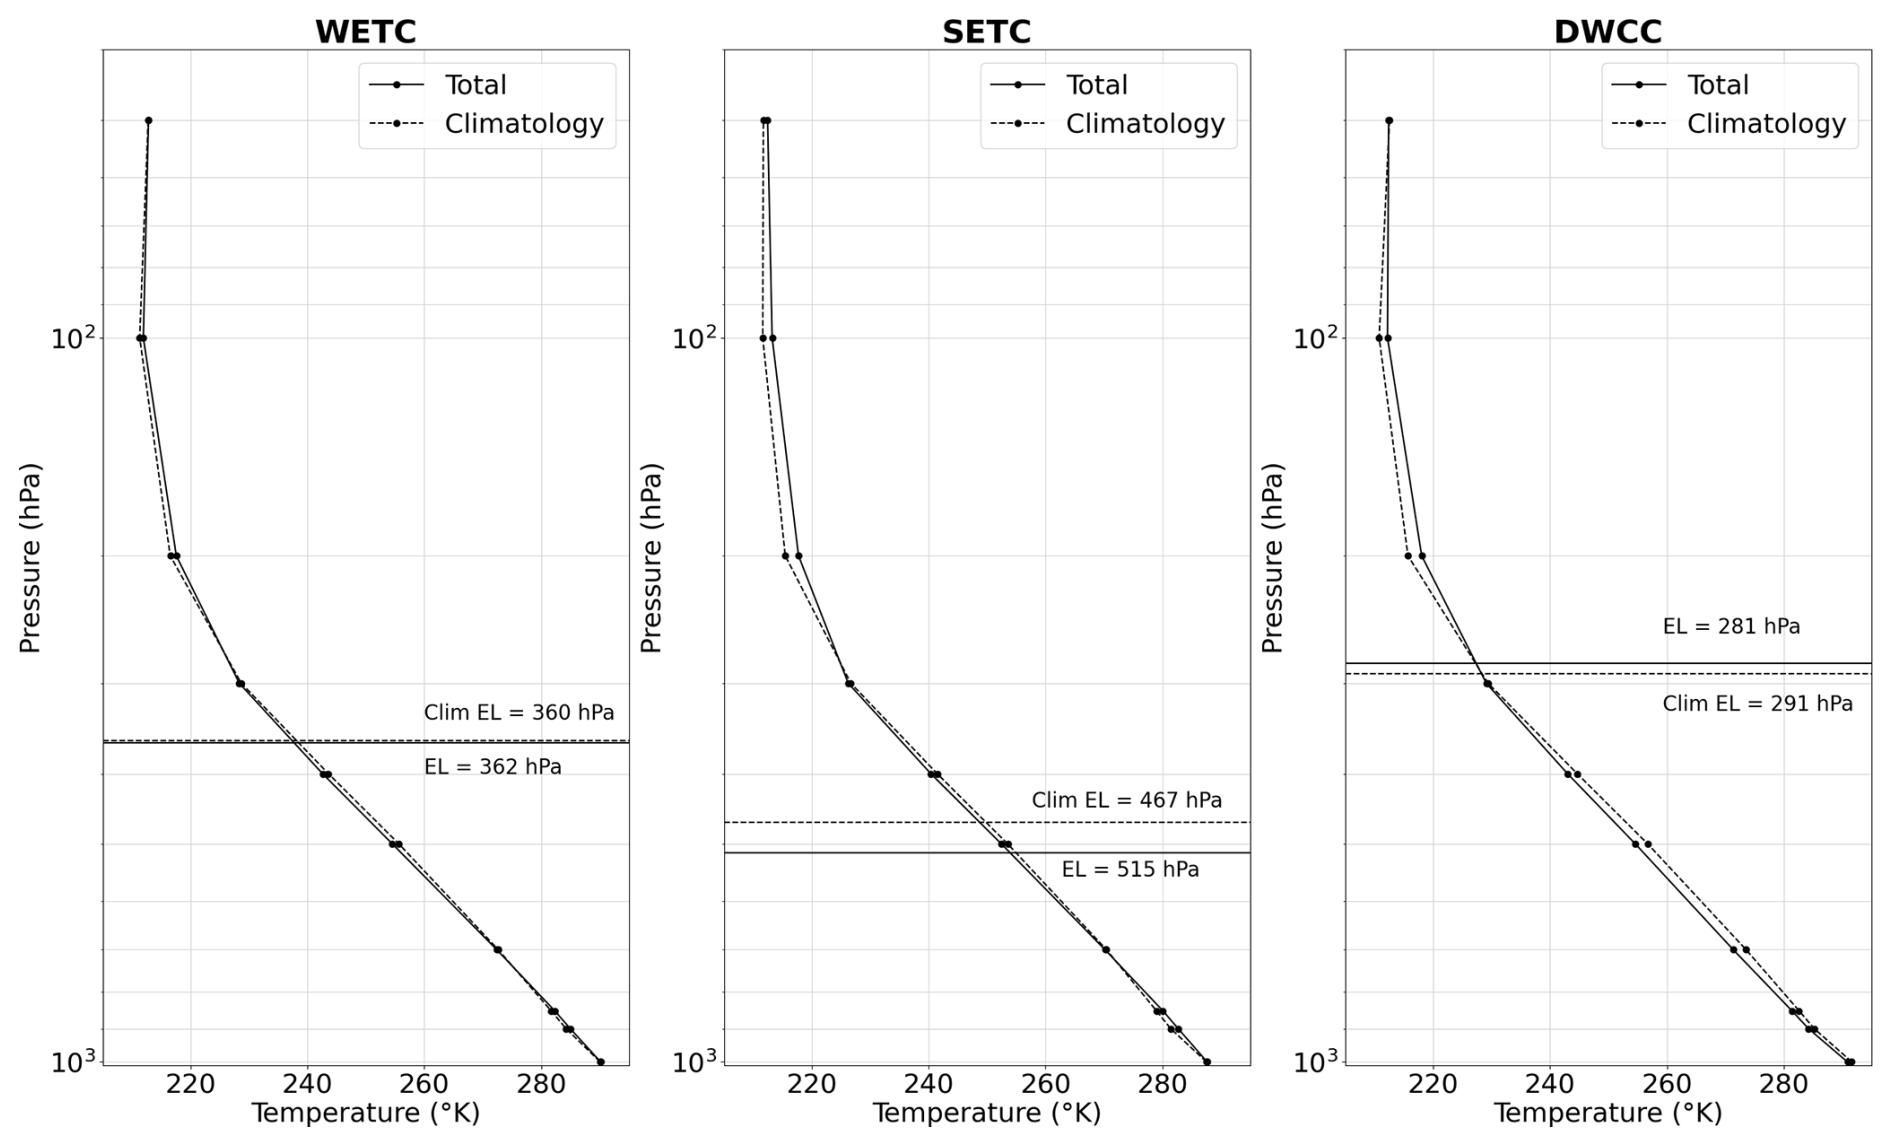
Figure A12Temperature profiles 36 h before the time of minimum SLP. The value is the mean temperature over a 4° by 4° box centered on the cyclone, but only the points over the sea are considered. The equilibrium level (EL) averaged over the same box is also indicated. For all variables, dashed lines correspond to climatological values and full lines indicate the actual values emerging from the composites. It can be appreciated how DWCC present the biggest anomaly in mid-tropospheric temperatures, compared to WETC and SETC.
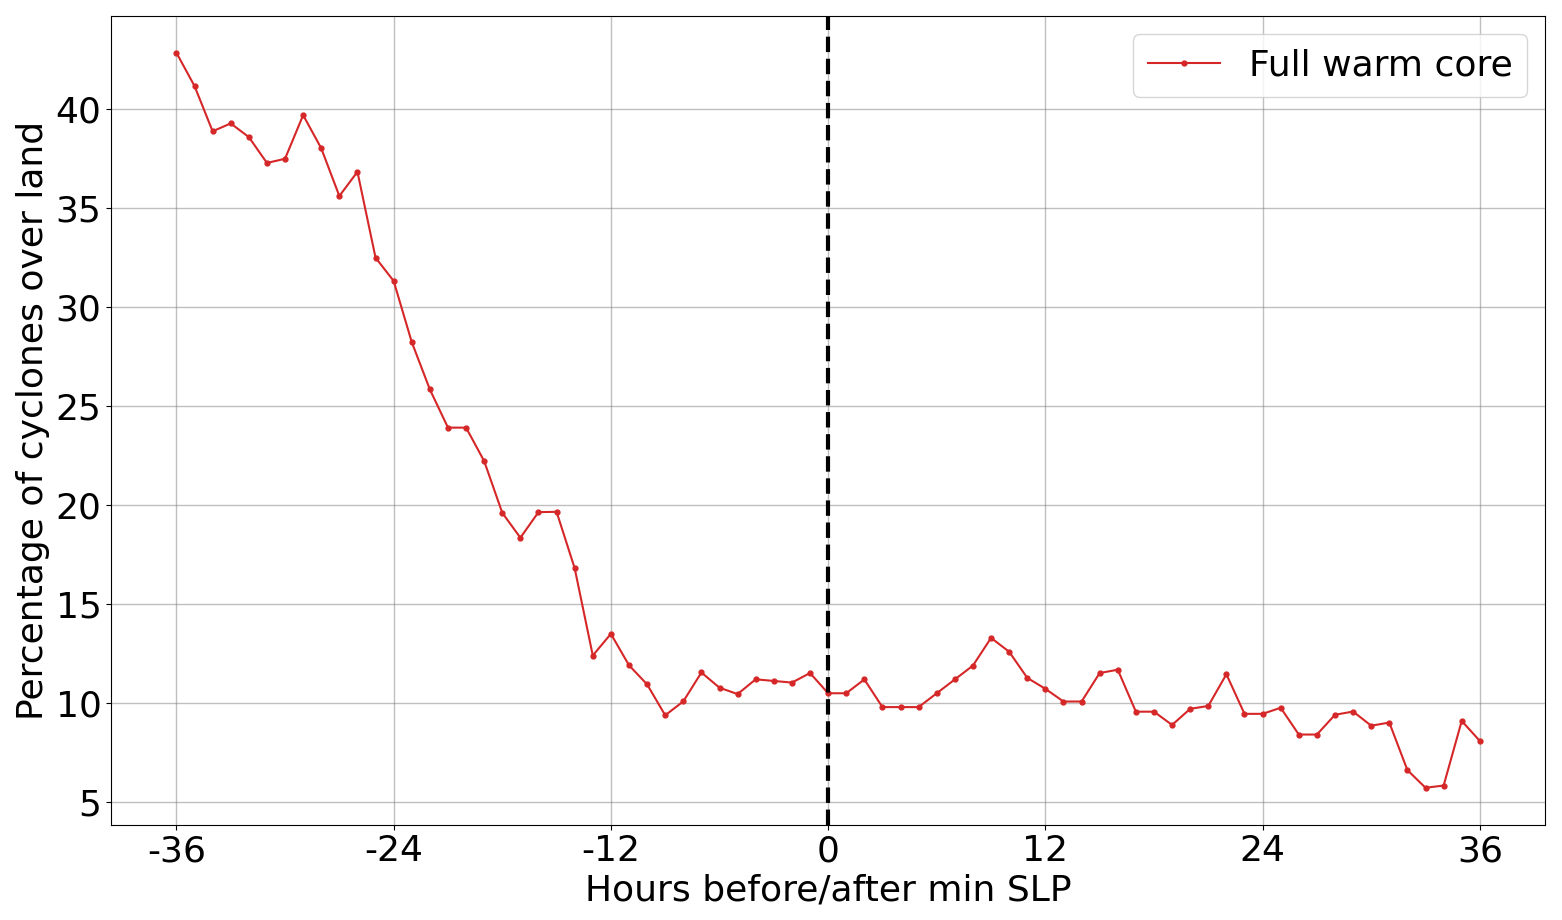
Figure A13Time evolution of the percentage of cyclones over land with respect to time of minimum SLP (black dashed line).
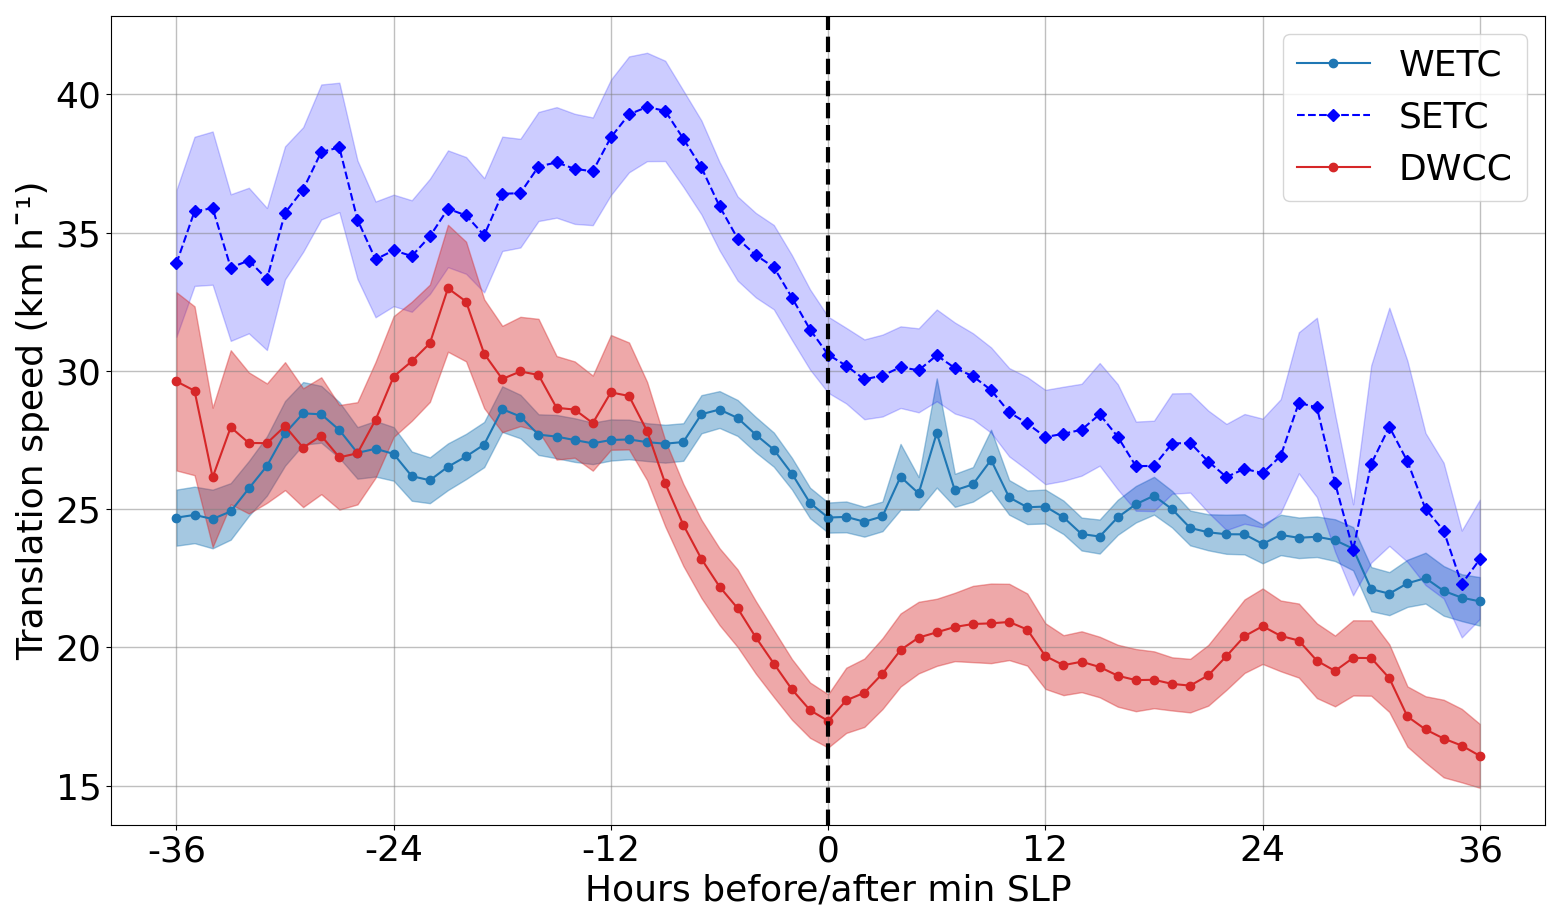
Figure A14Composite time evolution of the translation speed for WETC (light blue solid line), SETC (dark blue dashed line), and DWCC (red solid line) with respect to their minimum SLP (black dashed line). Shading around the solid line indicates the standard error of the mean.
Hersbach et al. (2020) was downloaded from https://doi.org/10.24381/cds.adbb2d47 (Hersbach et al., 2023a) and https://doi.org/10.24381/cds.bd0915c6 (Hersbach et al., 2023b).
Conceptualization: L.B., L.C., and C.P.; methodology: L.B., L.C., E.S., F.D., and C.P.; formal analysis: L.B.; data curation: L.B.; computational resources: F.D. and C.P.; project supervision and administration: C.P.; original draft preparation: L.B. and C.P. All authors were involved in discussing the results and reviewing the manuscript.
The contact author has declared that none of the authors has any competing interests.
Publisher's note: Copernicus Publications remains neutral with regard to jurisdictional claims made in the text, published maps, institutional affiliations, or any other geographical representation in this paper. The authors bear the ultimate responsibility for providing appropriate place names. Views expressed in the text are those of the authors and do not necessarily reflect the views of the publisher.
This study is based upon work from COST Action MedCyclones (CA19109), supported by COST (European Cooperation in Science and Technology, https://www.cost.eu/, last access: 1 August 2025). It was also made possible by the TROPICANA program of the Institut Pascal at Université Paris-Saclay with the support of the program “Investissements d'avenir” ANR-11-IDEX-0003-01, and it is an outcome of Italian Research Ministry Project “Dipartimenti di Eccellenza 2023–2027”. We particularly thank Dr. E. Flaounas, Dr. M. M. Miglietta, and Dr. A. Parodi for their precious support through various and stimulating exchanges. Additionally, the research activities described in this paper have been partially funded by the Italian program “Piano Nazionale di Ripresa e Resilienza – PNRR”, Missione 4 Componente 2, Investimento 3.3 – D.M.352 09/04/2022, – M.U.R., Ministry of University and Research.
This research has been partially supported by the COST Action CA19109 (grant no. E-COST-GRANT-CA19109-afd94039).
This paper was edited by Gwendal Rivière and reviewed by Stella Bourdin and three anonymous referees.
Akhtar, N., Brauch, J., Dobler, A., Béranger, K., and Ahrens, B.: Medicanes in an ocean–atmosphere coupled regional climate model, Nat. Hazards Earth Syst. Sci., 14, 2189–2201, https://doi.org/10.5194/nhess-14-2189-2014, 2014. a
Ammar, K., El-Metwally, M., Almazroui, M., and Abdel Wahab, M. M.: A climatological analysis of Saharan cyclones, Clim. Dynam., 43, 483–501, https://doi.org/10.1007/s00382-013-2025-0, 2014. a
Anthes, R. A.: Tropical Cyclones, American Meteorological Society, ISBN 9781935704287, https://doi.org/10.1007/978-1-935704-28-7, 1982. a
Bakkensen, L. A.: Mediterranean Hurricanes and Associated Damage Estimates, Journal of Extreme Events, 04, 1750008, https://doi.org/10.1142/s2345737617500087, 2017. a
Bakkensen, L. A., Park, D.-S. R., and Sarkar, R. S. R.: Climate costs of tropical cyclone losses also depend on rain, Environ. Res. Lett., 13, 074034, https://doi.org/10.1088/1748-9326/aad056, 2018. a
Bernini, L., Lagasio, M., Milelli, M., Oberto, E., Parodi, A., Hachinger, S., Kranzlmüller, D., and Tartaglione, N.: Convection‐permitting dynamical downscaling of ERA5 for Europe and the Mediterranean basin, Quarterly Journal of the Royal Meteorological Society, 151, https://doi.org/10.1002/qj.5014, 2025. a
Bister, M. and Emanuel, K. A.: Low frequency variability of tropical cyclone potential intensity 1. Interannual to interdecadal variability, Journal of Geophysical Research: Atmospheres, 107, https://doi.org/10.1029/2001jd000776, 2002. a
Bouin, M.-N. and Lebeaupin Brossier, C.: Surface processes in the 7 November 2014 medicane from air–sea coupled high-resolution numerical modelling, Atmos. Chem. Phys., 20, 6861–6881, https://doi.org/10.5194/acp-20-6861-2020, 2020. a
Buzzi, A., D'Isidoro, M., and Davolio, S.: A case‐study of an orographic cyclone south of the Alps during the MAP SOP, Quarterly Journal of the Royal Meteorological Society, 129, 1795–1818, https://doi.org/10.1256/qj.02.112, 2003. a
Campins, J., Genovés, A., Picornell, M. A., and Jansà, A.: Climatology of Mediterranean cyclones using the ERA‐40 dataset, International Journal of Climatology, 31, 1596–1614, https://doi.org/10.1002/joc.2183, 2011. a, b, c
Cavicchia, L., von Storch, H., and Gualdi, S.: A long-term climatology of medicanes, Clim. Dynam., 43, 1183–1195, https://doi.org/10.1007/s00382-013-1893-7, 2013. a, b, c, d, e, f, g
Cavicchia, L., von Storch, H., and Gualdi, S.: Mediterranean Tropical-Like Cyclones in Present and Future Climate, J. Climate, 27, 7493–7501, https://doi.org/10.1175/jcli-d-14-00339.1, 2014. a, b, c, d, e
Chaboureau, J., Pantillon, F., Lambert, D., Richard, E., and Claud, C.: Tropical transition of a Mediterranean storm by jet crossing, Quarterly Journal of the Royal Meteorological Society, 138, 596–611, https://doi.org/10.1002/qj.960, 2011. a, b
Dafis, S., Claud, C., Kotroni, V., Lagouvardos, K., and Rysman, J.: Insights into the convective evolution of Mediterranean tropical‐like cyclones, Quarterly Journal of the Royal Meteorological Society, 146, 4147–4169, https://doi.org/10.1002/qj.3896, 2020. a, b, c
Davis, C. A. and Bosart, L. F.: Baroclinically Induced Tropical Cyclogenesis, Monthly Weather Review, 131, 2730–2747, https://doi.org/10.1175/1520-0493(2003)131<2730:bitc>2.0.co;2, 2003. a
Davis, C. A. and Bosart, L. F.: The TT problem: Forecasting the tropical transition of cyclones, Bulletin of the American Meteorological Society, 85, 1657–1666, https://doi.org/10.1175/bams-85-11-1657, 2004. a, b
de la Vara, A., Gutiérrez‐Fernández, J., Gonzalez‐Alemán, J. J., and Gaertner, M. A.: Characterization of medicanes with a minimal number of geopotential levels, International Journal of Climatology, 41, 3300–3316, https://doi.org/10.1002/joc.7020, 2021. a, b, c
Dolores-Tesillos, E., Teubler, F., and Pfahl, S.: Future changes in North Atlantic winter cyclones in CESM-LE – Part 1: Cyclone intensity, potential vorticity anomalies, and horizontal wind speed, Weather Clim. Dynam., 3, 429–448, https://doi.org/10.5194/wcd-3-429-2022, 2022. a, b
D'Ortenzio, F., Iudicone, D., de Boyer Montegut, C., Testor, P., Antoine, D., Marullo, S., Santoleri, R., and Madec, G.: Seasonal variability of the mixed layer depth in the Mediterranean Sea as derived from in situ profiles, Geophysical Research Letters, 32, https://doi.org/10.1029/2005gl022463, 2005. a
Du, R., Zhang, G., and Huang, B.: Observed surface wind field structure of severe tropical cyclones and associated precipitation, Remote Sensing, 15, 2808, https://doi.org/10.3390/rs15112808, 2023. a
Elsberry, R. L. and Jeffries, R. A.: Vertical Wind Shear Influences on Tropical Cyclone Formation and Intensification during TCM-92 and TCM-93, Monthly Weather Review, 124, 1374–1387, https://doi.org/10.1175/1520-0493(1996)124<1374:vwsiot>2.0.co;2, 1996. a
Emanuel, K.: Genesis and maintenance of “Mediterranean hurricanes”, Adv. Geosci., 2, 217–220, https://doi.org/10.5194/adgeo-2-217-2005, 2005. a, b
Emanuel, K.: Tropical Cyclone Activity Downscaled from NOAA‐CIRES Reanalysis, 1908–1958, Journal of Advances in Modeling Earth Systems, 2, https://doi.org/10.3894/james.2010.2.1, 2010. a, b, c
Emanuel, K.: 100 Years of Progress in Tropical Cyclone Research, Meteorological Monographs, 59, 15.1–15.68, https://doi.org/10.1175/amsmonographs-d-18-0016.1, 2018. a
Emanuel, K., DesAutels, C., Holloway, C., and Korty, R.: Environmental Control of Tropical Cyclone Intensity, Journal of the Atmospheric Sciences, 61, 843–858, https://doi.org/10.1175/1520-0469(2004)061<0843:ecotci>2.0.co;2, 2004. a
Emanuel, K., Alberti, T., Bourdin, S., Camargo, S. J., Faranda, D., Flaounas, E., Gonzalez-Aleman, J. J., Lee, C.-Y., Miglietta, M. M., Pasquero, C., Portal, A., Ramsay, H., Reale, M., and Romero, R.: CYCLOPs: a Unified Framework for Surface Flux-Driven Cyclones Outside the Tropics, Weather Clim. Dynam., 6, 901–926, https://doi.org/10.5194/wcd-6-901-2025, 2025. a, b, c, d, e
Emanuel, K. A.: An Air-Sea Interaction Theory for Tropical Cyclones. Part I: Steady-State Maintenance, Journal of the Atmospheric Sciences, 43, 585–605, https://doi.org/10.1175/1520-0469(1986)043<0585:aasitf>2.0.co;2, 1986. a, b
Field, P. R. and Wood, R.: Precipitation and cloud structure in midlatitude cyclones, J. Climate, 20, 233–254, 2007. a
Fita, L. and Flaounas, E.: Medicanes as subtropical cyclones: the December 2005 case from the perspective of surface pressure tendency diagnostics and atmospheric water budget, Quarterly Journal of the Royal Meteorological Society, 144, 1028–1044, https://doi.org/10.1002/qj.3273, 2018. a
Fita, L., Romero, R., Luque, A., Emanuel, K., and Ramis, C.: Analysis of the environments of seven Mediterranean tropical-like storms using an axisymmetric, nonhydrostatic, cloud resolving model, Nat. Hazards Earth Syst. Sci., 7, 41–56, https://doi.org/10.5194/nhess-7-41-2007, 2007. a, b, c
Flaounas, E., Drobinski, P., and Bastin, S.: Dynamical downscaling of IPSL-CM5 CMIP5 historical simulations over the Mediterranean: benefits on the representation of regional surface winds and cyclogenesis, Clim. Dynam., 40, 2497–2513, https://doi.org/10.1007/s00382-012-1606-7, 2012. a, b
Flaounas, E., Raveh-Rubin, S., Wernli, H., Drobinski, P., and Bastin, S.: The dynamical structure of intense Mediterranean cyclones, Clim. Dynam., 44, 2411–2427, https://doi.org/10.1007/s00382-014-2330-2, 2014. a, b
Flaounas, E., Kotroni, V., Lagouvardos, K., Gray, S. L., Rysman, J.-F., and Claud, C.: Heavy rainfall in Mediterranean cyclones. Part I: contribution of deep convection and warm conveyor belt, Clim. Dynam., 50, 2935–2949, https://doi.org/10.1007/s00382-017-3783-x, 2017. a
Flaounas, E., Gray, S. L., and Teubler, F.: A process-based anatomy of Mediterranean cyclones: from baroclinic lows to tropical-like systems, Weather Clim. Dynam., 2, 255–279, https://doi.org/10.5194/wcd-2-255-2021, 2021. a, b
Flaounas, E., Davolio, S., Raveh-Rubin, S., Pantillon, F., Miglietta, M. M., Gaertner, M. A., Hatzaki, M., Homar, V., Khodayar, S., Korres, G., Kotroni, V., Kushta, J., Reale, M., and Ricard, D.: Mediterranean cyclones: current knowledge and open questions on dynamics, prediction, climatology and impacts, Weather Clim. Dynam., 3, 173–208, https://doi.org/10.5194/wcd-3-173-2022, 2022. a, b
Flaounas, E., Aragão, L., Bernini, L., Dafis, S., Doiteau, B., Flocas, H., Gray, S. L., Karwat, A., Kouroutzoglou, J., Lionello, P., Miglietta, M. M., Pantillon, F., Pasquero, C., Patlakas, P., Picornell, M. Á., Porcù, F., Priestley, M. D. K., Reale, M., Roberts, M. J., Saaroni, H., Sandler, D., Scoccimarro, E., Sprenger, M., and Ziv, B.: A composite approach to produce reference datasets for extratropical cyclone tracks: application to Mediterranean cyclones, Weather Clim. Dynam., 4, 639–661, https://doi.org/10.5194/wcd-4-639-2023, 2023. a, b, c, d, e
Flocas, H. A.: Diagnostics of Cyclogenesis Over the Aegean Sea Using Potential Vorticity Inversion, Meteorology and Atmospheric Physics, 73, 25–33, https://doi.org/10.1007/s007030050061, 2000. a
Flocas, H. A., Simmonds, I., Kouroutzoglou, J., Keay, K., Hatzaki, M., Bricolas, V., and Asimakopoulos, D.: On Cyclonic Tracks over the Eastern Mediterranean, J. Climate, 23, 5243–5257, https://doi.org/10.1175/2010jcli3426.1, 2010. a
Gaertner, M. A., González-Alemán, J. J., Romera, R., Domínguez, M., Gil, V., Sánchez, E., Gallardo, C., Miglietta, M. M., Walsh, K. J. E., Sein, D. V., Somot, S., Dell'Aquila, A., Teichmann, C., Ahrens, B., Buonomo, E., Colette, A., Bastin, S., van Meijgaard, E., and Nikulin, G.: Simulation of medicanes over the Mediterranean Sea in a regional climate model ensemble: impact of ocean–atmosphere coupling and increased resolution, Clim. Dynam., 51, 1041–1057, https://doi.org/10.1007/s00382-016-3456-1, 2016. a, b
Gandoin, R. and Garza, J.: Underestimation of strong wind speeds offshore in ERA5: evidence, discussion and correction, Wind Energ. Sci., 9, 1727–1745, https://doi.org/10.5194/wes-9-1727-2024, 2024. a
Garner, S. T., Held, I. M., Knutson, T., and Sirutis, J.: The Roles of Wind Shear and Thermal Stratification in Past and Projected Changes of Atlantic Tropical Cyclone Activity, J. Climate, 22, 4723–4734, https://doi.org/10.1175/2009jcli2930.1, 2009. a
Gilford, D. M.: pyPI (v1.3): Tropical Cyclone Potential Intensity Calculations in Python, Geosci. Model Dev., 14, 2351–2369, https://doi.org/10.5194/gmd-14-2351-2021, 2021. a
Givon, Y., Hess, O., Flaounas, E., Catto, J. L., Sprenger, M., and Raveh-Rubin, S.: Process-based classification of Mediterranean cyclones using potential vorticity, Weather Clim. Dynam., 5, 133–162, https://doi.org/10.5194/wcd-5-133-2024, 2024. a
González‐Alemán, J. J., Pascale, S., Gutierrez‐Fernandez, J., Murakami, H., Gaertner, M. A., and Vecchi, G. A.: Potential Increase in Hazard From Mediterranean Hurricane Activity With Global Warming, Geophysical Research Letters, 46, 1754–1764, https://doi.org/10.1029/2018gl081253, 2019. a
Gutiérrez-Fernández, J., Miglietta, M. M., González-Alemán, J. J., and Gaertner, M. Á.: Characteristics of Medicanes using ERA-5 reanalysis, EGU General Assembly 2023, Vienna, Austria, 24–28 April 2023, EGU23-483, https://doi.org/10.5194/egusphere-egu23-483, 2023. a, b
Gutiérrez‐Fernández, J., Miglietta, M. M., González‐Alemán, J. J., and Gaertner, M. A.: A New Refinement of Mediterranean Tropical‐Like Cyclones Characteristics, Geophysical Research Letters, 51, https://doi.org/10.1029/2023gl106429, 2024. a, b, c, d
Hart, R. E.: A Cyclone Phase Space Derived from Thermal Wind and Thermal Asymmetry, Monthly Weather Review, 131, 585–616, https://doi.org/10.1175/1520-0493(2003)131<0585:acpsdf>2.0.co;2, 2003. a, b, c, d
Hersbach, H., Bell, B., Berrisford, P., Hirahara, S., Horányi, A., Muñoz‐Sabater, J., Nicolas, J., Peubey, C., Radu, R., Schepers, D., Simmons, A., Soci, C., Abdalla, S., Abellan, X., Balsamo, G., Bechtold, P., Biavati, G., Bidlot, J., Bonavita, M., De Chiara, G., Dahlgren, P., Dee, D., Diamantakis, M., Dragani, R., Flemming, J., Forbes, R., Fuentes, M., Geer, A., Haimberger, L., Healy, S., Hogan, R. J., Hólm, E., Janisková, M., Keeley, S., Laloyaux, P., Lopez, P., Lupu, C., Radnoti, G., de Rosnay, P., Rozum, I., Vamborg, F., Villaume, S., and Thépaut, J.: The ERA5 global reanalysis, Quarterly Journal of the Royal Meteorological Society, 146, 1999–2049, https://doi.org/10.1002/qj.3803, 2020. a, b
Hersbach, H., Bell, B., Berrisford, P., Biavati, G., Horányi, A., Muñoz Sabater, J., Nicolas, J., Peubey, C., Radu, R., Rozum, I., Schepers, D., Simmons, A., Soci, C., Dee, D., and Thépaut, J.-N.: ERA5 hourly data on single levels from 1940 to present, Copernicus Climate Change Service (C3S) Climate Data Store (CDS) [data set], https://doi.org/10.24381/cds.adbb2d47, 2023a. a
Hersbach, H., Bell, B., Berrisford, P., Biavati, G., Horányi, A., Muñoz Sabater, J., Nicolas, J., Peubey, C., Radu, R., Rozum, I., Schepers, D., Simmons, A., Soci, C., Dee, D., and Thépaut, J.-N.: ERA5 hourly data on pressure levels from 1940 to present, Copernicus Climate Change Service (C3S) Climate Data Store (CDS) [data set], https://doi.org/10.24381/cds.bd0915c6, 2023b. a
Johnston, B. R., Randel, W. J., and Sjoberg, J. P.: Evaluation of Tropospheric Moisture Characteristics Among COSMIC-2, ERA5 and MERRA-2 in the Tropics and Subtropics, Remote Sensing, 13, 880, https://doi.org/10.3390/rs13050880, 2021. a
Jullien, S., Marchesiello, P., Menkes, C. E., Lefèvre, J., Jourdain, N. C., Samson, G., and Lengaigne, M.: Ocean feedback to tropical cyclones: climatology and processes, Clim. Dynam., 43, 2831–2854, https://doi.org/10.1007/s00382-014-2096-6, 2014. a
Kaplan, J. and DeMaria, M.: A Simple Empirical Model for Predicting the Decay of Tropical Cyclone Winds after Landfall, Journal of Applied Meteorology, 34, 2499–2512, https://doi.org/10.1175/1520-0450(1995)034<2499:asemfp>2.0.co;2, 1995. a
Kaplan, J. and DeMaria, M.: Large-Scale Characteristics of Rapidly Intensifying Tropical Cyclones in the North Atlantic Basin, Weather Forecast., 18, 1093–1108, https://doi.org/10.1175/1520-0434(2003)018<1093:lcorit>2.0.co;2, 2003. a
Kotsias, G., Lolis, C. J., Hatzianastassiou, N., Bakas, N., Lionello, P., and Bartzokas, A.: Objective climatology and classification of the Mediterranean cyclones based on the ERA5 data set and the use of the results for the definition of seasons, Theoretical and Applied Climatology, 152, 581–597, https://doi.org/10.1007/s00704-023-04374-8, 2023. a
Kouroutzoglou, J., Samos, I., Flocas, H. A., Hatzaki, M., Lamaris, C., Mamara, A., and Emmannouil, A.: Analysis of the Transition of an Explosive Cyclone to a Mediterranean Tropical-like Cyclone, Atmosphere, 12, 1438, https://doi.org/10.3390/atmos12111438, 2021. a
Lionello, P., Bhend, J., Buzzi, A., Della-Marta, P., Krichak, S., Jansa, A., Maheras, P., Sanna, A., Trigo, I., and Trigo, R.: Cyclones in the Mediterranean region: climatology and effects on the environment, in: Mediterranean, vol. 4, 325–372, Elsevier, ISBN 9780444521705, https://doi.org/10.1016/s1571-9197(06)80009-1, 2006. a
Lionello, P., Trigo, I. F., Gil, V., Liberato, M. L. R., Nissen, K. M., Pinto, J. G., Raible, C. C., Reale, M., Tanzarella, A., Trigo, R. M., Ulbrich, S., and Ulbrich, U.: Objective climatology of cyclones in the Mediterranean region: a consensus view among methods with different system identification and tracking criteria, Tellus A: Dynamic Meteorology and Oceanography, 68, 29391, https://doi.org/10.3402/tellusa.v68.29391, 2016. a, b
Lonfat, M., Marks, F. D., and Chen, S. S.: Precipitation Distribution in Tropical Cyclones Using the Tropical Rainfall Measuring Mission (TRMM) Microwave Imager: A Global Perspective, Monthly Weather Review, 132, 1645–1660, https://doi.org/10.1175/1520-0493(2004)132<1645:pditcu>2.0.co;2, 2004. a
Maslova, V. N., Voskresenskaya, E. N., Lubkov, A. S., Yurovsky, A. V., Zhuravskiy, V. Y., and Evstigneev, V. P.: Intense Cyclones in the Black Sea Region: Change, Variability, Predictability and Manifestations in the Storm Activity, Sustainability, 12, 4468, https://doi.org/10.3390/su12114468, 2020. a
Mazza, E., Ulbrich, U., and Klein, R.: The Tropical Transition of the October 1996 Medicane in the Western Mediterranean Sea: A Warm Seclusion Event, Monthly Weather Review, 145, 2575–2595, https://doi.org/10.1175/mwr-d-16-0474.1, 2017. a, b, c
McTaggart-Cowan, R., Deane, G. D., Bosart, L. F., Davis, C. A., and Galarneau, T. J.: Climatology of Tropical Cyclogenesis in the North Atlantic (1948–2004), Monthly Weather Review, 136, 1284–1304, https://doi.org/10.1175/2007mwr2245.1, 2008. a
McTaggart-Cowan, R., Galarneau, T. J., Bosart, L. F., and Milbrandt, J. A.: Development and Tropical Transition of an Alpine Lee Cyclone. Part I: Case Analysis and Evaluation of Numerical Guidance, Monthly Weather Review, 138, 2281–2307, https://doi.org/10.1175/2009mwr3147.1, 2010a. a
McTaggart-Cowan, R., Galarneau, T. J., Bosart, L. F., and Milbrandt, J. A.: Development and Tropical Transition of an Alpine Lee Cyclone. Part II: Orographic Influence on the Development Pathway, Monthly Weather Review, 138, 2308–2326, https://doi.org/10.1175/2009mwr3148.1, 2010b. a
McTaggart-Cowan, R., Galarneau, T. J., Bosart, L. F., Moore, R. W., and Martius, O.: A Global Climatology of Baroclinically Influenced Tropical Cyclogenesis, Monthly Weather Review, 141, 1963–1989, https://doi.org/10.1175/mwr-d-12-00186.1, 2013. a
Mei, W. and Pasquero, C.: Spatial and Temporal Characterization of Sea Surface Temperature Response to Tropical Cyclones, J. Climate, 26, 3745–3765, https://doi.org/10.1175/jcli-d-12-00125.1, 2013. a, b
Mei, W., Pasquero, C., and Primeau, F.: The effect of translation speed upon the intensity of tropical cyclones over the tropical ocean, Geophysical Research Letters, 39, https://doi.org/10.1029/2011gl050765, 2012. a, b, c
Miglietta, M. M. and Rotunno, R.: Development mechanisms for Mediterranean tropical‐like cyclones (medicanes), Quarterly Journal of the Royal Meteorological Society, 145, 1444–1460, https://doi.org/10.1002/qj.3503, 2019. a, b, c, d, e
Miglietta, M. M., Flaounas, E., González-Alemán, J. J., Panegrossi, G., Gaertner, M. A., Pantillon, F., Pasquero, C., Schultz, D. M., D'Adderio, L. P., Dafis, S., Husson, R., Ricchi, A., Carrió Carrió, D. S., Davolio, S., Fita, L., Picornell, M. A., Pytharoulis, I., Raveh-Rubin, S., Scoccimarro, E., Bernini, L., Cavicchia, L., Conte, D., Ferretti, R., Flocas, H., Gutiérrez-Fernández, J., Hatzaki, M., Homar Santaner, V., Jansà, A., and Patlakas, P.: Defining Medicanes: Bridging the Knowledge Gap between Tropical and Extratropical Cyclones in the Mediterranean, Bulletin of the American Meteorological Society, 106, E1955–E1971, https://doi.org/10.1175/bams-d-24-0289.1, 2025. a, b
Nastos, P., Karavana Papadimou, K., and Matsangouras, I.: Mediterranean tropical-like cyclones: Impacts and composite daily means and anomalies of synoptic patterns, Atmospheric Research, 208, 156–166, https://doi.org/10.1016/j.atmosres.2017.10.023, 2018. a
Naud, C. M., Booth, J. F., Lebsock, M., and Grecu, M.: Observational Constraint for Precipitation in Extratropical Cyclones: Sensitivity to Data Sources, Journal of Applied Meteorology and Climatology, 57, 991–1009, https://doi.org/10.1175/jamc-d-17-0289.1, 2018. a
Noyelle, R., Ulbrich, U., Becker, N., and Meredith, E. P.: Assessing the impact of sea surface temperatures on a simulated medicane using ensemble simulations, Nat. Hazards Earth Syst. Sci., 19, 941–955, https://doi.org/10.5194/nhess-19-941-2019, 2019. a
Pantillon, F., Davolio, S., Avolio, E., Calvo-Sancho, C., Carrió, D. S., Dafis, S., Gentile, E. S., Gonzalez-Aleman, J. J., Gray, S., Miglietta, M. M., Patlakas, P., Pytharoulis, I., Ricard, D., Ricchi, A., Sanchez, C., and Flaounas, E.: The crucial representation of deep convection for the cyclogenesis of Medicane Ianos, Weather Clim. Dynam., 5, 1187–1205, https://doi.org/10.5194/wcd-5-1187-2024, 2024. a
Picornell, M. A., Campins, J., and Jansà, A.: Detection and thermal description of medicanes from numerical simulation, Nat. Hazards Earth Syst. Sci., 14, 1059–1070, https://doi.org/10.5194/nhess-14-1059-2014, 2014. a, b
Qin, R., Khakzad, N., and Zhu, J.: An overview of the impact of Hurricane Harvey on chemical and process facilities in Texas, International Journal of Disaster Risk Reduction, 45, 101453, https://doi.org/10.1016/j.ijdrr.2019.101453, 2020. a
Ragone, F., Mariotti, M., Parodi, A., Von Hardenberg, J., and Pasquero, C.: A Climatological Study of Western Mediterranean Medicanes in Numerical Simulations with Explicit and Parameterized Convection, Atmosphere, 9, 397, https://doi.org/10.3390/atmos9100397, 2018. a, b, c, d, e
Rantanen, M., Räisänen, J., Sinclair, V. A., and Lento, J.: The extratropical transition of Hurricane Ophelia (2017) as diagnosed with a generalized omega equation and vorticity equation, Tellus A: Dynamic Meteorology and Oceanography, 72, 1721215, https://doi.org/10.1080/16000870.2020.1721215, 2020. a
Raveh‐Rubin, S. and Flaounas, E.: A dynamical link between deep Atlantic extratropical cyclones and intense Mediterranean cyclones, Atmospheric Science Letters, 18, 215–221, https://doi.org/10.1002/asl.745, 2017. a
Reale, M. and Lionello, P.: Synoptic climatology of winter intense precipitation events along the Mediterranean coasts, Nat. Hazards Earth Syst. Sci., 13, 1707–1722, https://doi.org/10.5194/nhess-13-1707-2013, 2013. a
Romero, R. and Emanuel, K.: Medicane risk in a changing climate, Journal of Geophysical Research: Atmospheres, 118, 5992–6001, https://doi.org/10.1002/jgrd.50475, 2013. a
Sánchez, C., Gray, S., Volonté, A., Pantillon, F., Berthou, S., and Davolio, S.: The impact of preceding convection on the development of Medicane Ianos and the sensitivity to sea surface temperature, Weather Clim. Dynam., 5, 1429–1455, https://doi.org/10.5194/wcd-5-1429-2024, 2024. a, b, c
Schade, L. R. and Emanuel, K. A.: The Ocean's Effect on the Intensity of Tropical Cyclones: Results from a Simple Coupled Atmosphere–Ocean Model, Journal of the Atmospheric Sciences, 56, 642–651, https://doi.org/10.1175/1520-0469(1999)056<0642:toseot>2.0.co;2, 1999. a
Slocum, C. J., Razin, M. N., Knaff, J. A., and Stow, J. P.: Does ERA5 Mark a New Era for Resolving the Tropical Cyclone Environment?, J. Climate, 35, 7147–7164, https://doi.org/10.1175/jcli-d-22-0127.1, 2022. a
Thorncroft, C. D. and Flocas, H. A.: A Case Study of Saharan Cyclogenesis, Monthly Weather Review, 125, 1147–1165, https://doi.org/10.1175/1520-0493(1997)125<1147:acsosc>2.0.co;2, 1997. a
Tous, M. and Romero, R.: Meteorological environments associated with medicane development, International Journal of Climatology, 33, 1–14, https://doi.org/10.1002/joc.3428, 2012. a, b, c, d, e, f, g, h
Tous, M., Romero, R., and Ramis, C.: Surface heat fluxes influence on medicane trajectories and intensification, Atmospheric Research, 123, 400–411, https://doi.org/10.1016/j.atmosres.2012.05.022, 2013. a, b
Trigo, I. F., Davies, T. D., and Bigg, G. R.: Objective Climatology of Cyclones in the Mediterranean Region, J. Climate, 12, 1685–1696, https://doi.org/10.1175/1520-0442(1999)012<1685:ococit>2.0.co;2, 1999. a
Ulbrich, U., Lionello, P., Belušić, D., Jacobeit, J., Knippertz, P., Kuglitsch, F. G., Leckebusch, G. C., Luterbacher, J., Maugeri, M., Maheras, P., Nissen, K. M., Pavan, V., Pinto, J. G., Saaroni, H., Seubert, S., Toreti, A., Xoplaki, E., and Ziv, B.: Climate of the Mediterranean, Elsevier, ISBN 9780124160422, 301–346, https://doi.org/10.1016/b978-0-12-416042-2.00005-7, 2012. a
Varlas, G., Pytharoulis, I., Steeneveld, G.-J., Katsafados, P., and Papadopoulos, A.: Investigating the impact of sea surface temperature on the development of the Mediterranean tropical-like cyclone “Ianos” in 2020, Atmospheric Research, 291, 106827, https://doi.org/10.1016/j.atmosres.2023.106827, 2023. a
Vecchi, G. A., Fueglistaler, S., Held, I. M., Knutson, T. R., and Zhao, M.: Impacts of Atmospheric Temperature Trends on Tropical Cyclone Activity, J. Climate, 26, 3877–3891, https://doi.org/10.1175/jcli-d-12-00503.1, 2013. a
Velden, C., Knaff, J., Herndon, D., Mouche, A., Hawkins, J., Panegrossi, G., Stoffelen, A., Courtney, J., Tsukada, T., and Fontan, A.-C.: Recent innovations in satellite-based applications and their impacts on tropical cyclone analyses and forecasts, Journal of the European Meteorological Society, 2, 100011, https://doi.org/10.1016/j.jemets.2025.100011, 2025. a
Walsh, K., Giorgi, F., and Coppola, E.: Mediterranean warm-core cyclones in a warmer world, Clim. Dynam., 42, 1053–1066, https://doi.org/10.1007/s00382-013-1723-y, 2013. a
Wen, S., Su, B., Wang, Y., Fischer, T., Li, X., Yin, Y., Chao, G., Wang, R., and Jiang, T.: Economic sector loss from influential tropical cyclones and relationship to associated rainfall and wind speed in China, Global and Planetary Change, 169, 224–233, https://doi.org/10.1016/j.gloplacha.2018.08.004, 2018. a
Wing, A. A., Emanuel, K., and Solomon, S.: On the factors affecting trends and variability in tropical cyclone potential intensity: potential intensity trends and variability, Geophysical Research Letters, 42, 8669–8677, https://doi.org/10.1002/2015gl066145, 2015. a
Wong, M. L. M. and Chan, J. C. L.: Tropical Cyclone Intensity in Vertical Wind Shear, Journal of the Atmospheric Sciences, 61, 1859–1876, https://doi.org/10.1175/1520-0469(2004)061<1859:tciivw>2.0.co;2, 2004. a
Xu, J., Wang, Y., and Yang, C.: Factors Affecting the Variability of Maximum Potential Intensity (MPI) of Tropical Cyclones Over the North Atlantic, Journal of Geophysical Research: Atmospheres, 124, 6654–6668, https://doi.org/10.1029/2019jd030283, 2019. a
Yettella, V. and Kay, J. E.: How will precipitation change in extratropical cyclones as the planet warms? Insights from a large initial condition climate model ensemble, Clim. Dynam., 49, 1765–1781, https://doi.org/10.1007/s00382-016-3410-2, 2016. a
Zhang, W., Villarini, G., Scoccimarro, E., and Napolitano, F.: Examining the precipitation associated with medicanes in the high‐resolution ERA-5 reanalysis data, International Journal of Climatology, 41, https://doi.org/10.1002/joc.6669, 2020. a, b, c, d, e