the Creative Commons Attribution 4.0 License.
the Creative Commons Attribution 4.0 License.
 | 20 Apr 2026
Left- and right-moving supercell dynamics, environments and hazards – today and in future
Monika Feldmann
Sandro Beer
Aaron W. Zeeb
Killian P. Brennan
Lena Wilhelm
Olivia Martius
Supercell thunderstorms are among the most hazardous and damaging weather phenomena in Europe. However, little information is available on the relationship between supercell morphology and environmental conditions in Europe. We dissect supercell morphology, the changes in environmental conditions, and the subsequent changes in associated hazardous weather using numerical simulations of the current and a warmer (+3 °C) climate at 2 km grid resolution. Comparing right- (RM) and left-moving (LM) storms, we find that RMs have a more coherent storm structure and larger high-intensity areas, and their motion deviates stronger from the mean flow compared to LMs. LMs occur in a narrower range of environmental conditions, namely in hotter and less stable environments compared to RMs. Overall, in the warmer climate the pre-storm environment becomes less stable, and deep-layer shear increases. Accordingly, hazards associated with supercells such as lightning, wind gusts, intense precipitation, and hail size all increase. RMs and LMs reach similar hazard intensities, while RMs tend to have larger high-hazard areas than LMs. The relative increase in hazard severity in the warmer climate is more pronounced for LMs, particularly for hail area and lightning intensity. A regional decomposition across Europe indicates LMs tend to occur in warmer, more unstable conditions than RMs, and that these regional differences are generally greater than the differences in storm environments between LMs and RMs.
- Article
(7696 KB) - Full-text XML
- BibTeX
- EndNote


Supercell thunderstorms are characterized by a persistent, rotating updraft and are widely recognized as the most hazardous convective storm type (Markowski and Richardson, 2010). They frequently produce large hail, torrential rainfall, intense lightning, tornadoes, and non-tornadic wind gusts (Markowski and Richardson, 2010). Right-moving (RM) supercells, which deviate to the right of the 0–6 km mean wind vector and rotate cyclonically in the Northern Hemisphere, are more frequent and generally associated with a higher hazard intensity and likelihood compared to their left-moving (LM) counterparts that deviate to the left of the mean wind vector and rotate anticyclonically (Homeyer et al., 2025; Bunkers et al., 2024, 2000; Davies-Jones, 1986). Due to the higher occurrence rate, most supercell research focuses on RMs (Zeeb et al., 2026) and has led to little quantification and analysis of LMs in research that addresses future climate conditions (e.g., Feldmann et al., 2025a; Zeeb et al., 2024; Ashley et al., 2023). Most research on LMs focuses on case studies (Edwards and Thompson, 2024; Edwards and Hodanish, 2006; Edwards et al., 2004; Grasso, 2000; Brown and Meitín, 1994), while more recent studies focus more on fundamental characteristics and climatologies (Zeeb et al., 2026; Homeyer et al., 2025; Bunkers et al., 2024; Tonn et al., 2023) Though less frequent, LMs still represent an important fraction of the storm population and can be prolific hail producers (Homeyer et al., 2025; Tonn et al., 2023; Edwards and Hodanish, 2006; Houze et al., 1993). Considering that LMs have different life-cycles and often require a different environmental parameter space than RMs (Zeeb et al., 2026; Homeyer et al., 2025; Grasso, 2000; Brown and Meitín, 1994), their response to a warming climate may also differ. Indeed, how both storm types respond to climate change is still subject to large uncertainties.
European research often focuses on severe convection in general rather than on supercells specifically. Previous studies on how severe convection changes with climate change faced several challenges. Reporting databases often suffer from sampling biases (Pîrloagă et al., 2021; Barras et al., 2019). Most radar networks undergo significant quality changes (Germann et al., 2022; Saltikoff et al., 2019), and their observational periods are typically too short for robust trend analyses (Wilhelm et al., 2024; Taszarek et al., 2021; Nisi et al., 2018). Proxy-based analyses in reanalysis or coarse-resolution climate models implicitly assume that the spatio-temporal distribution of storm environments reflects that of actual convection (Battaglioli et al., 2023), and they cannot capture structural changes in the storms themselves. Environmental analyses indicate that overall instability is expected to increase over large parts of Europe, while trends for deep-layer shear are more heterogeneous (Taszarek et al., 2021). The emergence of kilometer-scale climate simulations allows studying explicitly resolved supercells in present and future climate simulations (Feldmann et al., 2025a; Kahraman et al., 2025; Ashley et al., 2023), as the kilometer-scale resolution approaches storm-resolving properties (Prein et al., 2025, 2021; Schär et al., 2020; Weisman et al., 1997). Although these simulations remain limited to single realizations so far, they overcome many limitations of proxy studies and allow direct analyses of storm structure, environments, and hazards. These single realizations lend to pseudo-global-warming (PGW) experiments, where observed boundary conditions are perturbed by a climate change Δ, allowing for a high-resolution climate change experiment (Hall et al., 2024; Brogli et al., 2023; Sato et al., 2007; Schär et al., 1996). The PGW approach has been popular in convective case studies (e.g., Trapp et al., 2025, 2021) but has also found application in multi-year climate simulations (Thurnherr et al., 2025; Heim et al., 2023).
The preceding work of Feldmann et al. (2025a) uses two 11-year convection-permitting climate simulations over Europe: one representing the current climate and one using a PGW approach corresponding to a +3 °C global warming level (GWL) relative to preindustrial levels (Cui et al., 2025; Thurnherr et al., 2025). Feldmann et al. (2025a) showed an overall increase in supercell frequency by 11 % over Europe, with regional trends ranging from −28 % to +116 %, and frequency hotspots hugging the flanks of mountain ranges. Regional trends are tied to climatological moisture shifts, with frequency decreases being tied to an increasingly dry climate. Environmental analyses show an increase in both the frequency and magnitude of unstable conditions in the areas with the greatest positive trend, in agreement with Taszarek et al. (2021). The region with the largest decrease also shows decreases in unstable days and less potent convective conditions. Deep-layer shear during unstable conditions increases significantly over the majority of Europe, supporting the overall increase in supercell severity (Feldmann et al., 2025a).
Here, we use the same climate dataset for storm-centered analyses of storm morphology, surface hazards and pre-storm environments, over the whole European domain and in climatologically distinct sub-regions. Right- and left-moving supercells are tracked separately, allowing us to address the following research questions:
-
How do the frequency, structure, pre-storm environments, and hazards associated with RM and LM supercells differ in the present climate?
-
How do the environment and hazard characteristics change in a +3 °C warming scenario?
-
How do regional climate regimes affect this?
By explicitly analyzing RMs and LMs separately, this study reveals new insights into the fundamental characteristics of these two supercell types, as well as their future changes.
2.1 Data
We use km-scale climate model data from the COSMO-6 regional climate model, which was run at a 2.2 km resolution over continental Europe (for model domain, see Fig. A1). In the current climate (CC) simulation (2011–2021), the boundary conditions are provided by ERA5 (Hersbach et al., 2020). The future climate (FC) simulation follows a PGW approach, using a GWL of +3 °C (Brogli et al., 2023). A model member representative of convective summer precipitation of the MPI-HRES-ENS was chosen to compute the +3 °C climate change Δ (Thurnherr et al., 2025). This climate change Δ is added to the ERA5 boundary conditions, mimicking the same 11-year period and its variability in a warmed climate. Further details on the climate simulations and their verification are described in Cui et al. (2025), Thurnherr et al. (2025) and Feldmann et al. (2025a).
To identify supercells trajectories, supercell tracks from Feldmann et al. (2025a) are used. To identify supercells, first all thunderstorms are tracked based on 5 min precipitation data (Brennan et al., 2025a). Along these tracks, the hourly 3-dimensional (3D) pressure-level wind field is used to apply vertical vorticity and updraft velocity thresholds in the mid-troposphere, identifying the mesocyclone (for full documentation, see Feldmann et al., 2025a). The tracking differentiates cyclonic and anticyclonic updraft vorticity signatures, separating RM from LM supercells.
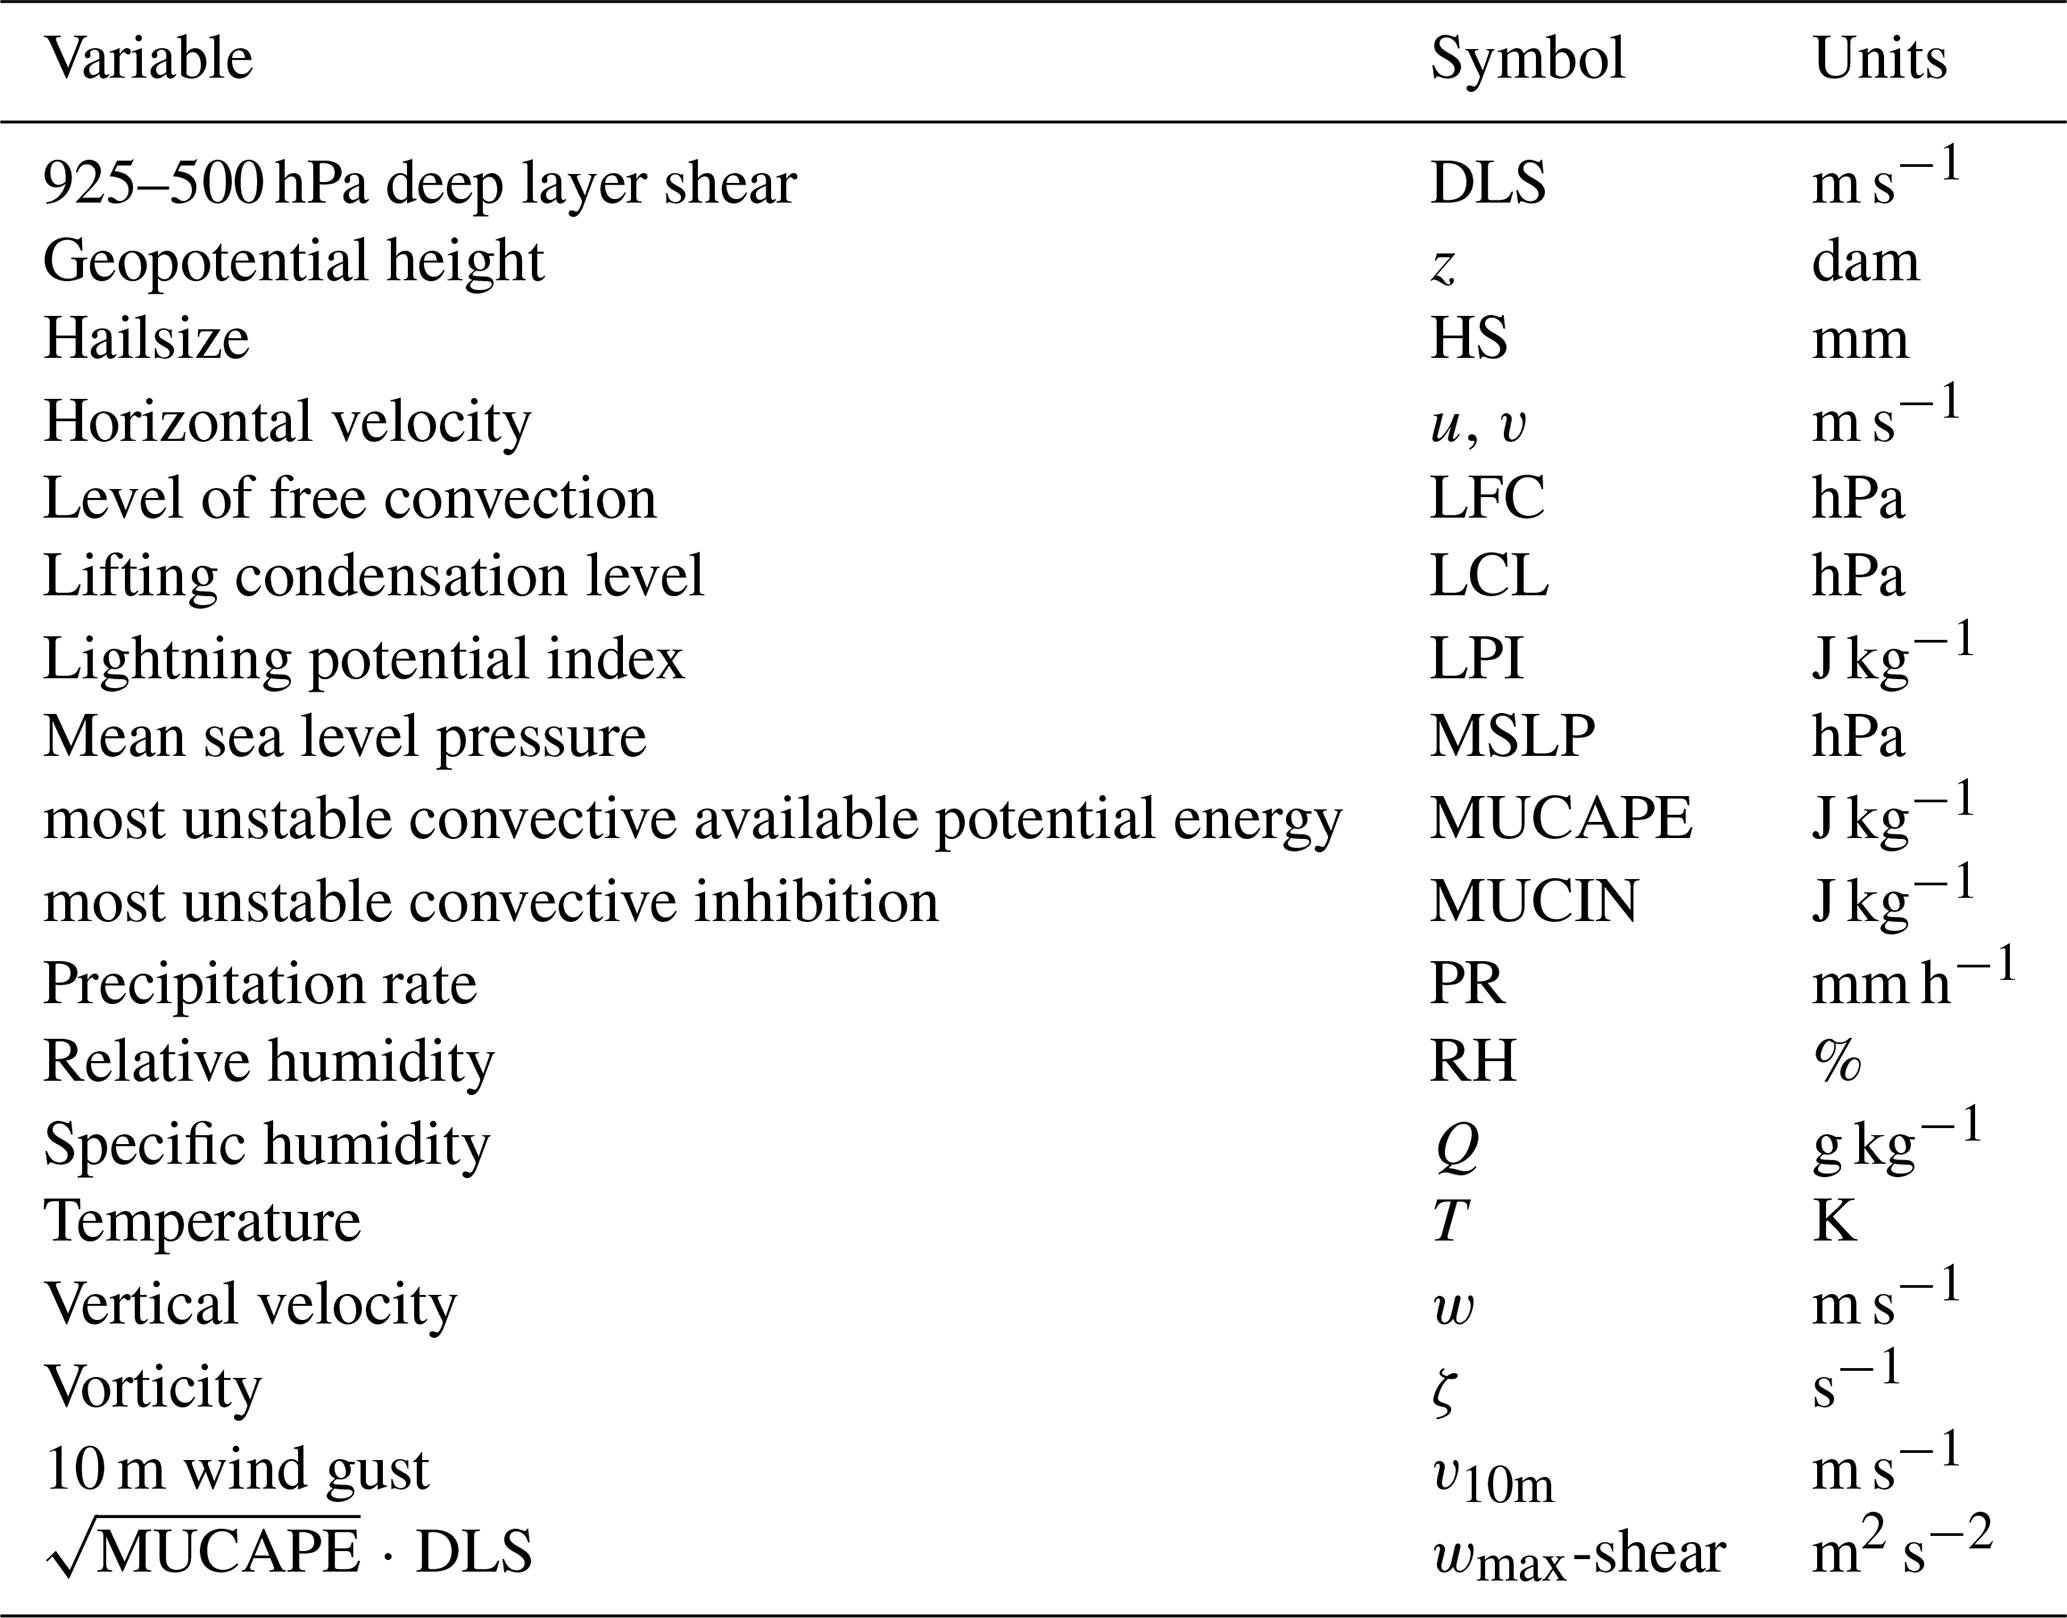
Table 1 provides an overview of analyzed variables. Precipitation variables are stored at a 5 min resolution, whereas all other variables are stored hourly. 3D data is available on 8 pressure levels. A limited set of convective parameters was computed online from 60 model levels.
2.2 Methods
We use the cookie-cutter method introduced in Brennan et al. (2025b). In this method, 3D environmental fields are extracted from the model data within a 60 km radius around each identified supercell at hourly intervals. Each extracted disk is rotated so that the hourly smoothed propagation direction of the storm is due right (0°). The environmental data is extracted at the time of the storm, to reflect in-storm conditions, as well as 1 and 2 h prior, to reflect pre-storm conditions. For each variable, we compute composites across all supercells or subsets of supercells for the current and future climate simulations separately. Composite vertical profiles of the pre-storm environment are obtained from the extracted disks, with a filtering of active convection via a precipitation filter of 5 mm h−1 with a 5-gridpoint circular buffer. Aggregated analyses are performed within the whole 60 km radius, while spatial figures showing the storm structure are zoomed in to a 20 km radius. All statistical tests are performed with a two-sided Mann–Whitney U test (p > 0.05, McKnight and Najab, 2010), a non-parametric, unpaired test. Spatial analyses are additionally processed with a false-discovery-rate (FDR) correction (Ventura et al., 2004; Benjamini and Hochberg, 1995).
Analyses of storm motion make use of the Bunkers storm motion estimate (Bunkers et al., 2000) for RMs (Eq. 1) and LMs (Eq. 2):
where Vmean = , S = V500 hPa−V925 hPa, = , and S⟂ = , here adapted to pressure-level model data. Originally both CRM and CLM were estimated at 7.5 m s−1 (Bunkers et al., 2000), while Bunkers et al. (2024) suggests an updated CLM of 5 m s−1. In contrast, Tonn et al. (2023) suggests a combined C in Europe for both RM and LM of 4 m s−1, smaller than any C tuned for the United States.
The tracking identifies ∼ 8200 right-moving hourly supercell detections and ∼ 1200 left-moving ones in the current climate simulations. While observational studies do suggest a majority of RM storms (75 %, Tonn et al., 2023), we consider the modeled fraction of 87 % to likely be an overestimation of the true RM fraction, because of the shorter lifetime of LMs, which are hence more likely to be missed by the hourly detection interval (Zeeb et al., 2026; Wade and Parker, 2021; Sherburn et al., 2016; Sherburn and Parker, 2014). In the warmer climate, RMs increase by 8 % to ∼ 8900 detections and LMs by 21 % to ∼ 1500 detections, resulting in a slight increase in the LM fraction from 13 % to 14 %.1
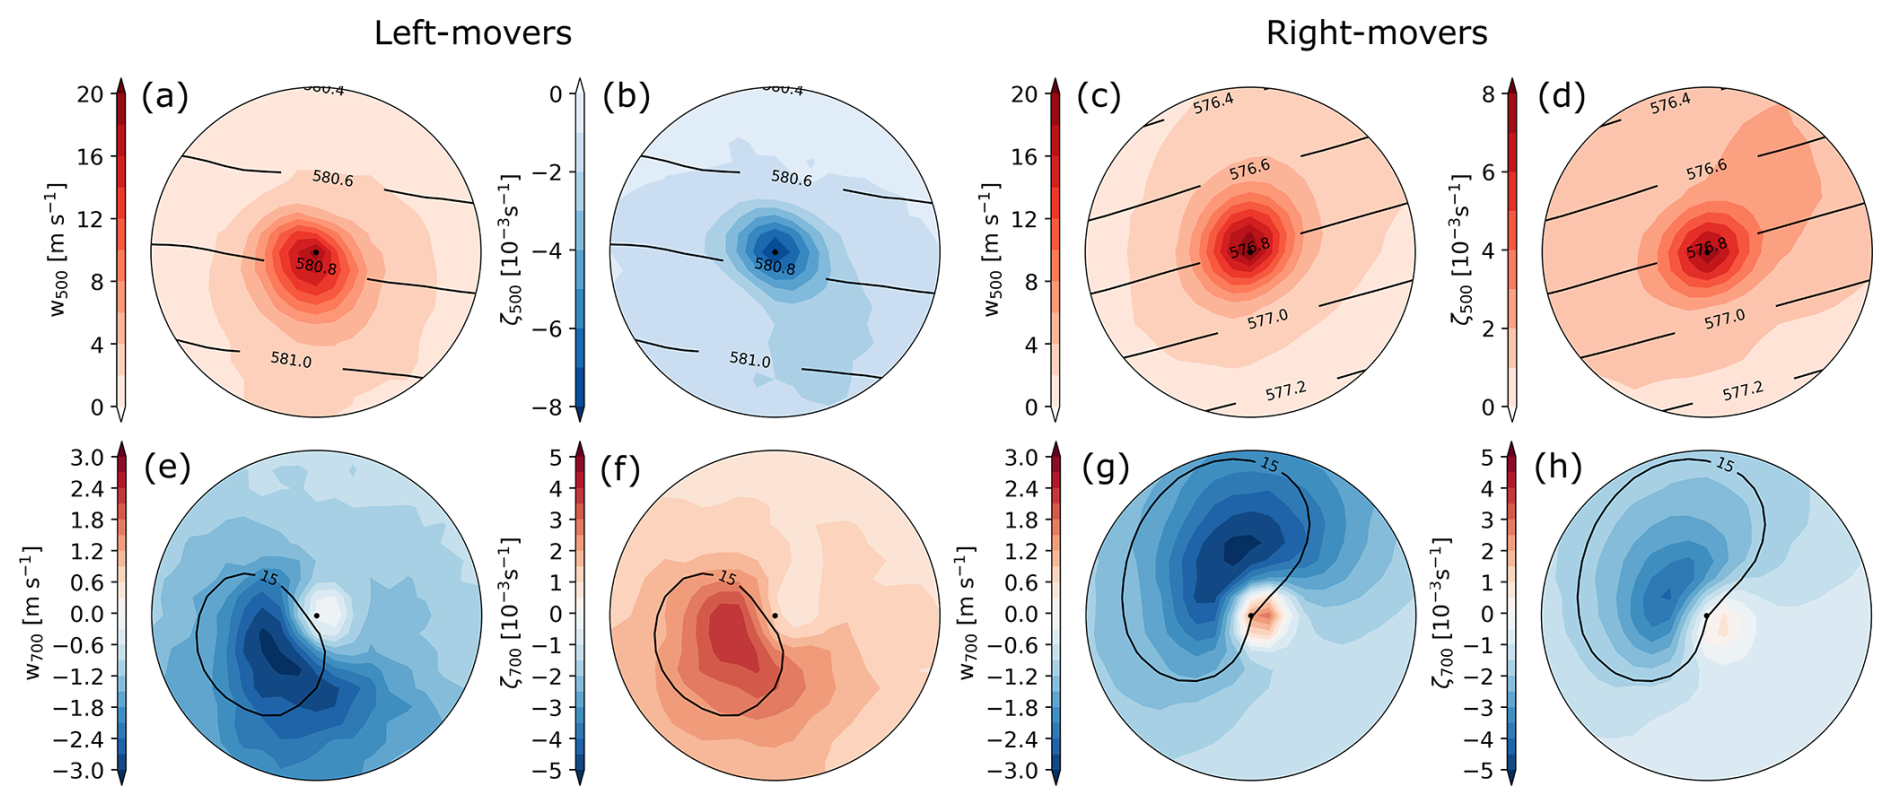
Figure 1Structure of LMs (left half) and RMs (right half) in the current climate. The 20 km radii show grid-point wise percentile values across all LM or RM cases and across all time steps. For the updraft metrics (top row) we show the 90th percentile at the 500 hPa level, for the downdraft metrics (bottom row) we show the 10th percentile at the 700 hPa level. Composite mean geopotential height at 500 hPa (dam) and mean precipitation rate (15 mm h−1) are shown in black contours.
3.1 Supercell structure
Figure 1 compares the storm structure of right- and left-moving supercells based on composites of precipitation, vertical velocity, and vorticity. Overall, the composites show strongly smoothed storm structures, owed to the averaging across many cases. RM storms exhibit the familiar right-leaning curvature of the 15 mm h−1 precipitation contour, with the mesocyclone located at the inner corner of this curve (center of the 20 km radius). LM storms show a weaker and less elongated leftward curvature of the precipitation field. To identify the updraft, we show the 90th percentile of 500 hPa vertical wind and 500 hPa vertical vorticity (10th percentile of vertical vorticity for the LMs, due to the opposite sign of the vorticity). Midlevel updraft and vorticity extrema are both in the center of the composite. The updraft and vorticity signatures are of similar size and intensity in both storm types. The downdraft features are depicted by extracting the 10th percentile of the 700 hPa vertical wind and 500 hPa vertical vorticity (90th for the LMs). Similar to the updraft, the downdraft intensity and area are comparable in the RM and the LM. Precipitation largely falls in the respective downdraft regions. The vorticity in the downdraft area is more pronounced on the LMs than the RMs. Despite the less pronounced shape in the mean precipitation contour, LMs still show a clearly identified updraft area in the center of the composite, and a downdraft area at the right-hand storm flank, that mirror the structure of the RMs and rival them in terms of intensity (e.g., Davies-Jones, 2015).
To investigate the synoptic meteorological situation, we look at the composite of geopotential height at 500 hPa 2 h before storm-encounter, to ensure unperturbed conditions – 1 h prior and hour zero were tested and showed considerable influence of the presence of the storm. Both storm types deviate to the right and left of the isohypses, respectively, consistent with their deviant motion. The isohypses also indicate a low-pressure area lying to the left-hand side of storm motion and higher pressure being on the right-hand side. The gradient of geopotential height is greater in the RMs, while also being at a lower geopotential height. Severe convection in Europe typically occurs at the leading edge of an approaching trough and in southwesterly flow (Feldmann et al., 2025b; Wapler and James, 2014), consistent with the pattern of geopotential height. The greater height and weaker gradient for LMs indicate that they may be preferentially located closer to the downstream ridge. This behavior will be discussed further in Sect. 3.2.
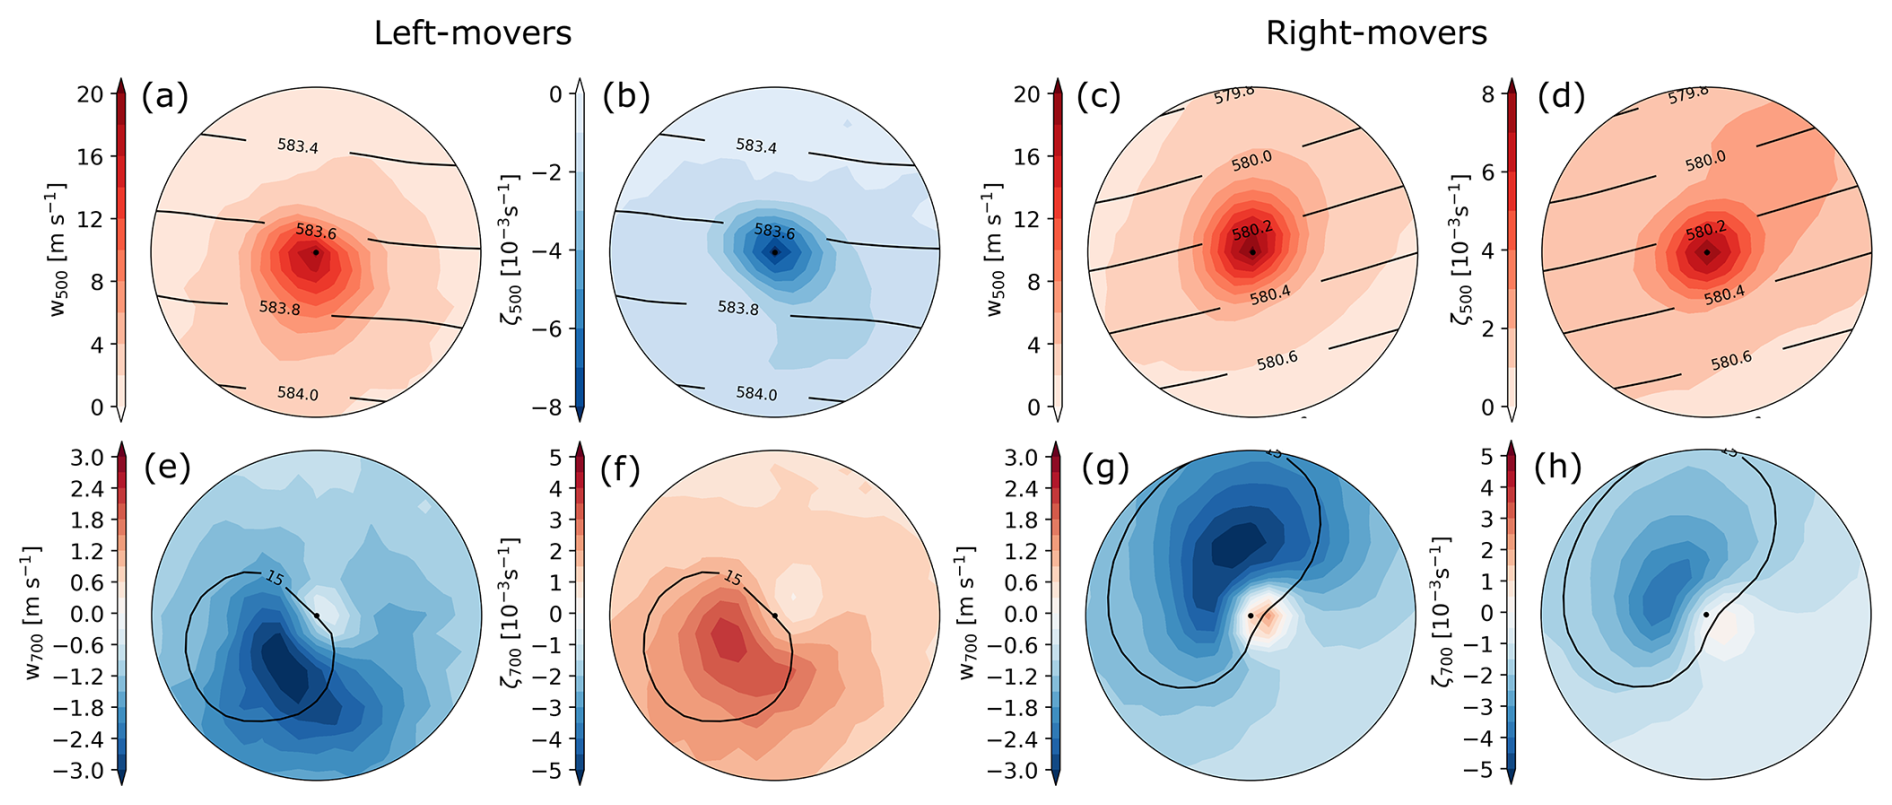
Figure 2 shows the same composites of storm structure and synoptic environment for the future climate. The hallmark features remain the same, with left- and right-leaning storm contours, and deviant motion to the left and right of the geopotential height contours. The most noticeable changes are an increase in storm precipitation area for both LMs and RMs, as well as a distinct increase of the 500 hPa geopotential height by ∼ 3 dam. Both up- and downdraft areas appear slightly broader in LMs and RMs, though reach similar peak values in the composite.
3.2 Supercell environments
Prior research suggests the biggest differences between RM and LM supercell environments in their respective pre-storm hodographs (e.g., Bunkers, 2002; Bunkers et al., 2000; Houze et al., 1993). The environmental conditions are extracted 1h pre-storm encounter (see Fig. 3), which yielded the most representative (i.e., least convectively contaminated and highest convective potential) results. The hodographs are rotated so that storm motion is aligned among all of them, yielding storm-direction-relative (SR) uSR- and vSR-components of the profile, uSR being along the propagation direction and vSR perpendicular to it, i.e. modeled storm motion lies on the vSR = 0 line.
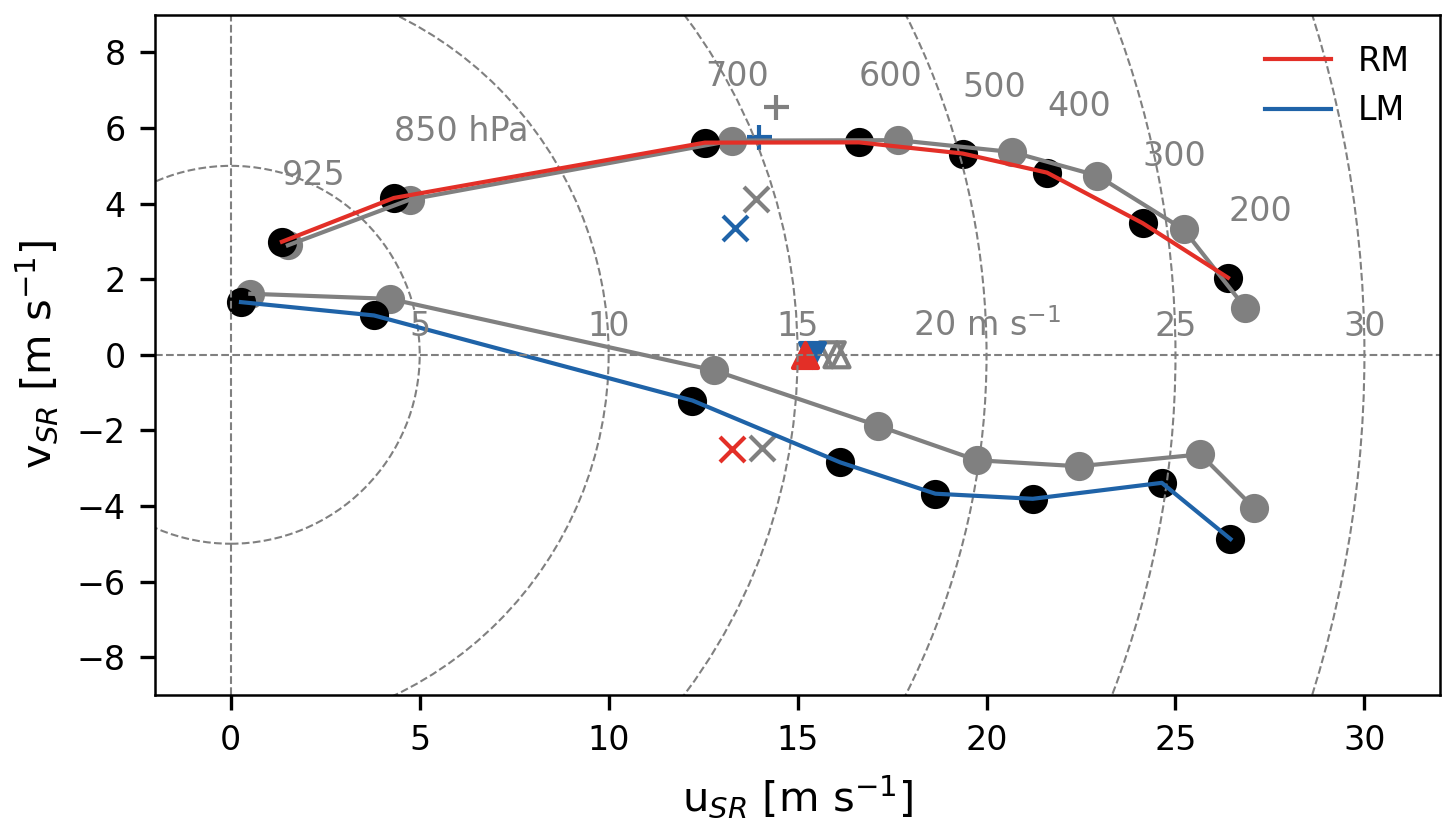
Figure 3Composite storm-direction-relative (SR) hodographs in the current (colored) and future (grayed out) climates. In the hodographs, observed storm motion is indicated with a colored triangle, Bunkers motion with an x (current recommendation c = 7.5 m s−1 for RM and 5 m s−1 for LM) or a + (old recommendation c = 7.5 m s−1 for LM).
The hodographs of RMs in the current climate (Fig. 3a) exhibit a slight clockwise curvature with altitude, while overall being largely straight, with storm motion lying to the right of the hodograph. Shear is largely concentrated at the 850–700 hPa level, whereas the near-surface change in wind speed is very gradual. The LMs' hodograph has a lower degree of counterclockwise curvature with slight veering in the low-levels and virtually identical deep-layer shear (e.g., Zeeb et al., 2026; Bunkers et al., 2024; Tonn et al., 2023; Bunkers, 2002; Bunkers et al., 2000). Both mean hodographs are mostly straight and do not contain substantial directional shear (Fig. 3). At a 3 °C warming level (Fig. 3b), both hodographs lengthen and the 925–500 hPa shear increases by 1–2 m s−1.
Modeled storm motion was extracted from the 5 min precipitation tracks and smoothed with a moving-average 5-timestep window. We compare modeled storm motion (vSR = 0 m s−1) to the estimated Bunkers storm motion (Bunkers et al., 2024, 2000, see Eqs. 1 and 2) using both the CRM,LM = 7.5 m s−1 and CLM = 5 m s−1 constant. While the obtained velocity is comparable, albeit slightly smaller than the modeled storms, the estimated deviation from the mean flow is considerably larger than in the modeled storms. By refitting C to scale estimated storm motion onto the vSR = 0 m s−1 line, our simulations suggest an RM offset of CRM = 5 m s−1 and an LM offset of CLM = 1 m s−1. In combination, these are closer to C = 4 m s−1 as estimated by Tonn et al. (2023).
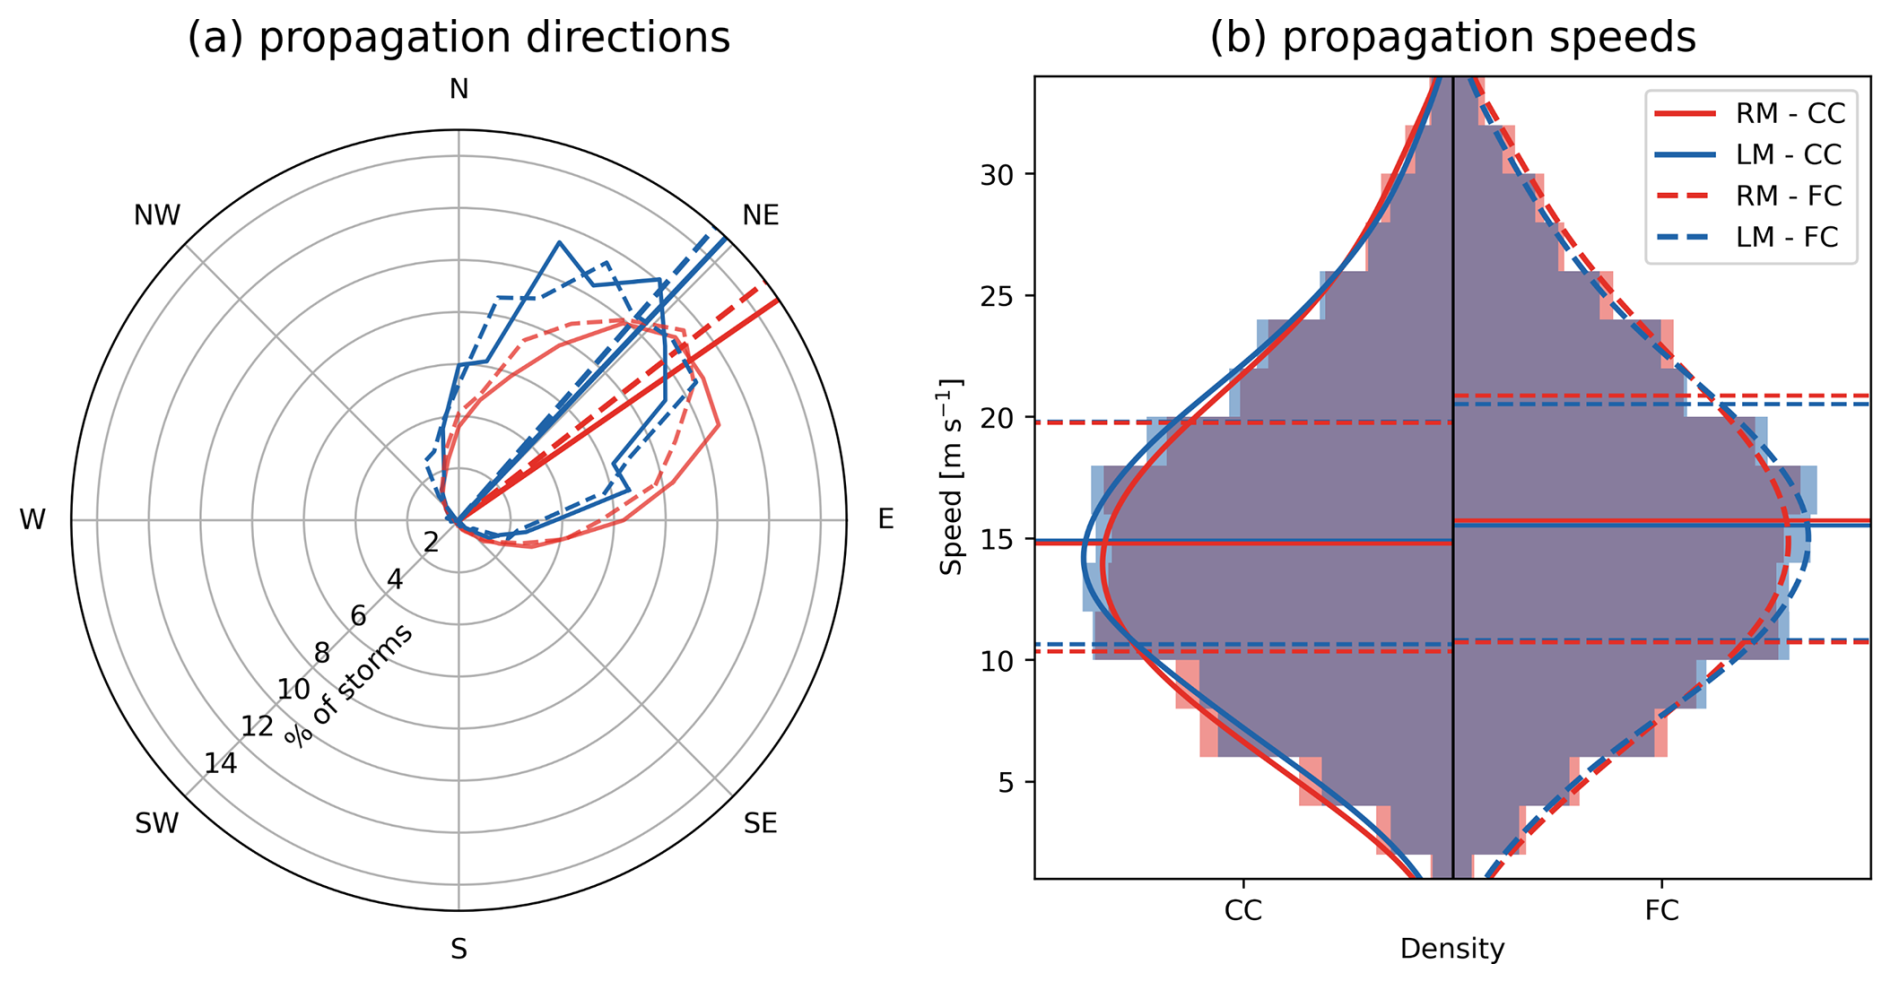
Figure 4Density distributions of propagation (a) direction and (b) speed, solid lines indicate current climate (CC) and dashed lines future climate (FC), blue corresponds to LM and red to RM. In panel (b), the interquartile range is indicated in dotted lines, the median with a solid line, CC is depicted on the left-hand side, and FC on the right-hand side.
In addition to the composite hodographs, we investigate the mean propagation direction and speed in Fig. 4. In line with previous studies showing that severe convection in Europe happens overwhelmingly during SW flow (Feldmann et al., 2021; Mohr et al., 2020; Wapler and James, 2014), supercells track largely towards the NE (see Fig. 4a). There is a distinct separation of the mean track direction of right- and left-movers by 12°, with the mean track of RMs lying to the right of the LMs, as expected. The relatively small angle difference between the storm types suggests that they form in different systematic relative locations within the parent synoptic systems, where the hodograph shape and orientation, and subsequent mean wind vector are different. Both storm populations track 3° more northwards in the future climate (Fig. 4a). From Fig. 4b we further see that propagation speed is comparable between RMs and LMs, with an average of approximately 15 m s−1. In line with the increase in deep-layer shear and the lengthening of the hodograph, the propagation speed increases by ∼1.5 m s−1 at the 3 °C GWL.
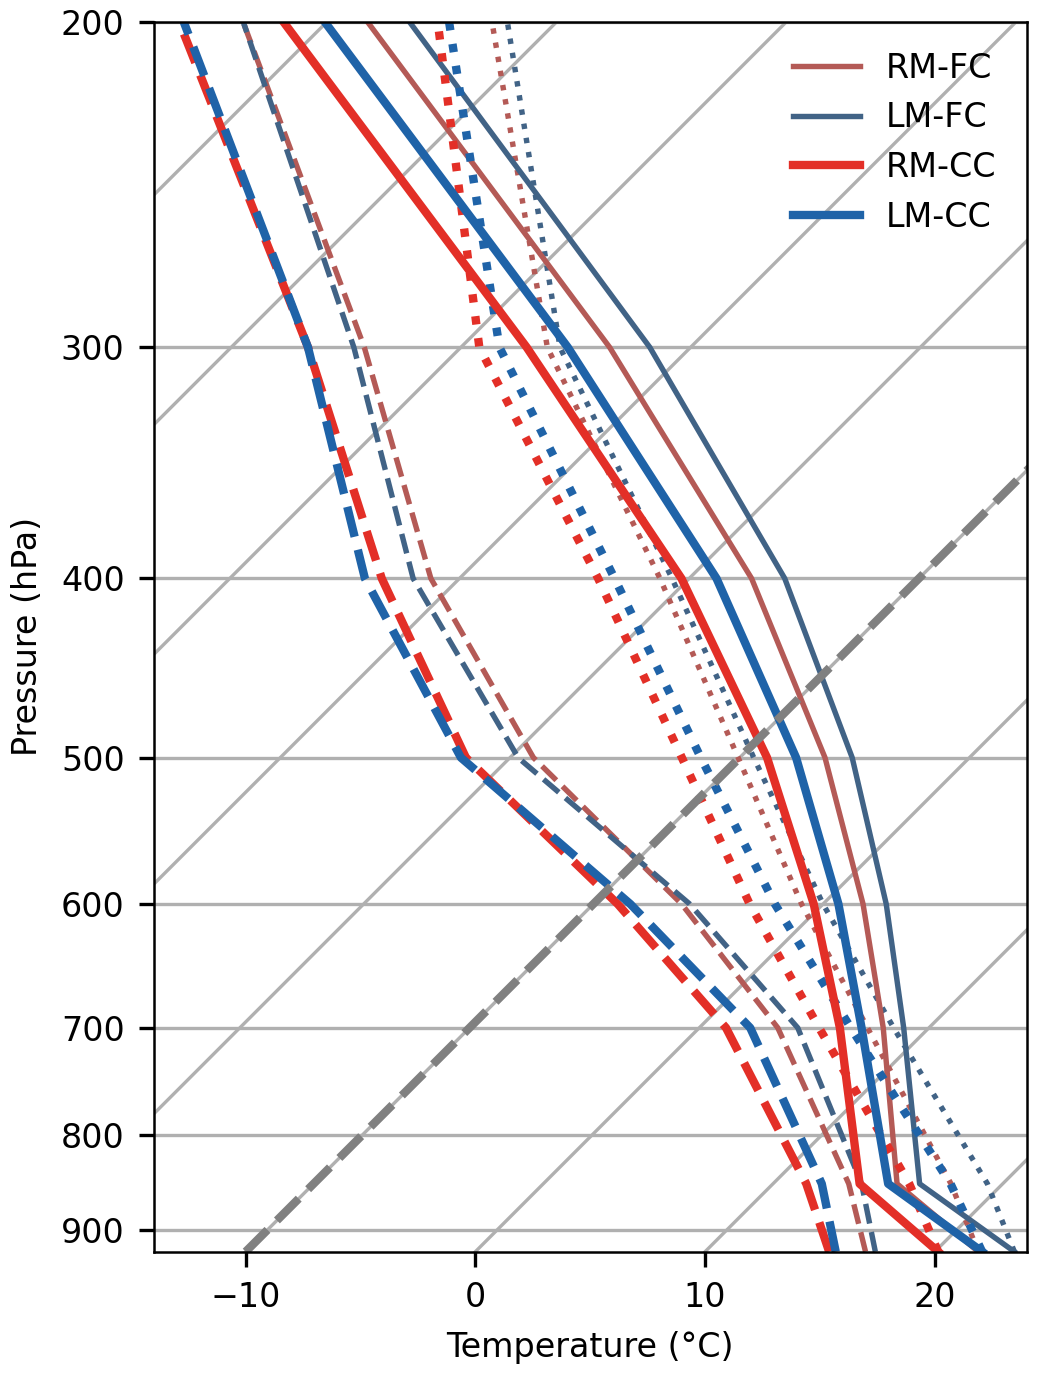
Figure 5Composite skew-T log P diagrams of LMs (blue lines) and RMs (red lines) in the current (CC) and future (FC) climates. Temperature profile in dotted line, moisture profile in dashed line, parcel profile in solid line.
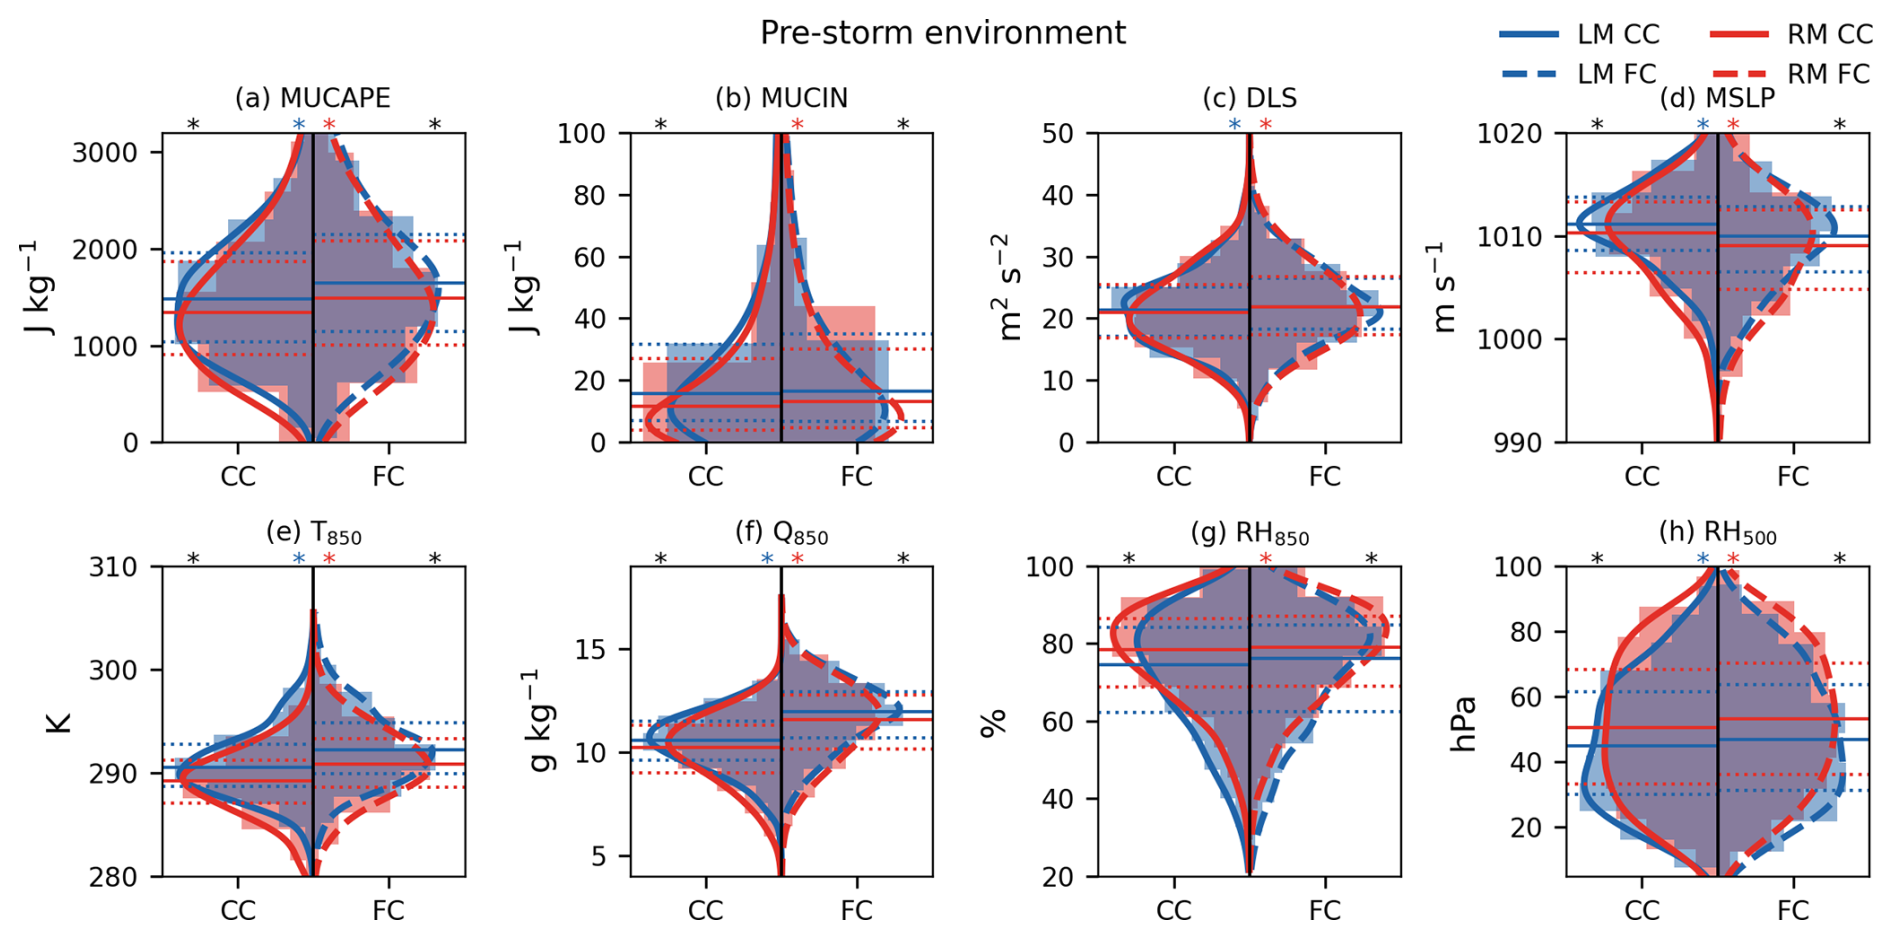
Figure 6Density distributions of 1h pre-storm environment, interquartile range is indicated in dotted lines, the median with a solid line. The current climate (CC) is depicted on the left-hand side of each plot, the future climate (FC) on the right-hand side. Significant differences between the LMs are indicated with a blue asterisk, between the RMs with a red asterisk, between the current climate with a black asterisk on the left, and between the future climate with a black asterisk on the right.
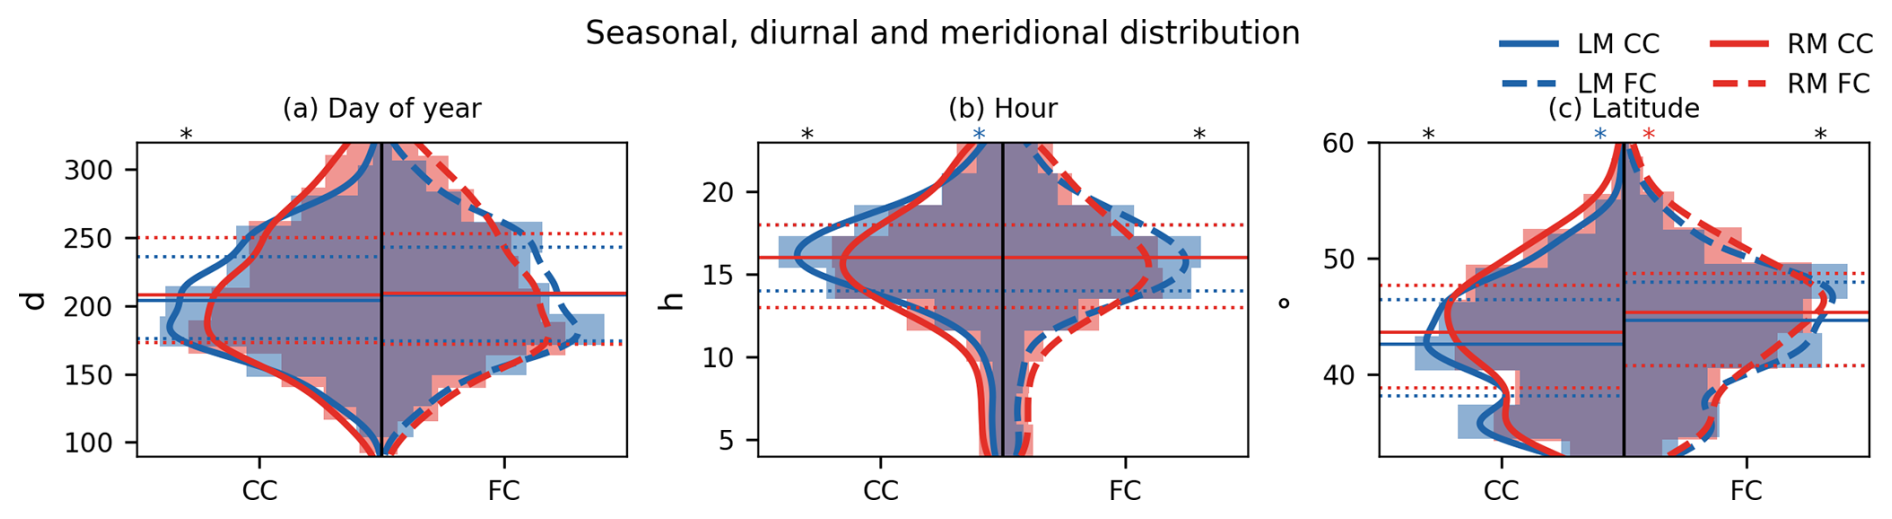
Figure 7Empirical PDF of seasonal and diurnal cycle, as well as longitudinal distribution of LMs (blue) and RMs (red) in the current (solid lines, left) and future climate (dashed lines, right). Significant differences between LMs and RMs are marked with an asterisk, the median is depicted with a solid line and the interquartile range dotted.
We investigate the thermodynamic environment both in a composite skew-T log-p diagram (see Fig. 5) and by comparing the distribution of composite environmental parameters (see Fig. 6) throughout the extracted 60 km radius. The skew-T diagram (Fig. 5) shows statistically significant differences between RM and LM in the current climate. LMs occur in significantly warmer conditions, with higher lifting condensation levels (LCL) and higher CAPE and CIN values than RMs. Low-level specific humidity is also slightly higher for LMs, but relative humidity is lower due to the large temperature difference of almost 3 °C. This poses the question, why LMs occur in such thermodynamically different conditions. Comparing the distribution of CAPE, CIN, deep-layer shear, and low-level atmospheric conditions for RM and LM (Fig. 6), we see that LM-supporting conditions have lower variability than those of RMs, with a narrower interquartile range. Given that LMs occur more rarely, it appears that LMs require a more specific range of environmental conditions (Fig. 6). In the seasonal and diurnal cycle, LMs occur more frequently during the convective peak season, and less frequently in the shoulder seasons, showing a sharper peak in the distribution, with shorter tails (see Fig. 7a). During the convective peak season, instability and temperature are generally greater than in the less favorable shoulder seasons and nighttime hours. Additionally, LMs occur in significantly higher mean surface pressure situations than RMs (see Fig. 6h), and their surroundings show smaller surface pressure gradients (not shown). This indicates that, from a synoptic perspective, they occur closer to the center of the ridge, further supporting the hypothesis from Sect. 3.1. Overall, severe convection in Europe predominantly occurs between an upstream trough and a downstream ridge (Feldmann et al., 2025b). In this transition area, warm air advection may occur in the warm sector ahead of the cold front. Warm air advection induces a vertical clockwise turning of the geostrophic flow, due to thermal wind balance. Closer to the center of the ridge, wind speeds are lower and hence warm air advection is smaller, hence producing less synoptic forcing towards a clockwise turning hodograph, which favors RMs (Houze et al., 1993; Peyraud, 2013; Davies-Jones, 1984, 2002).
Table 2Thermodynamic mean state and mean climate change Δ from pressure levels.
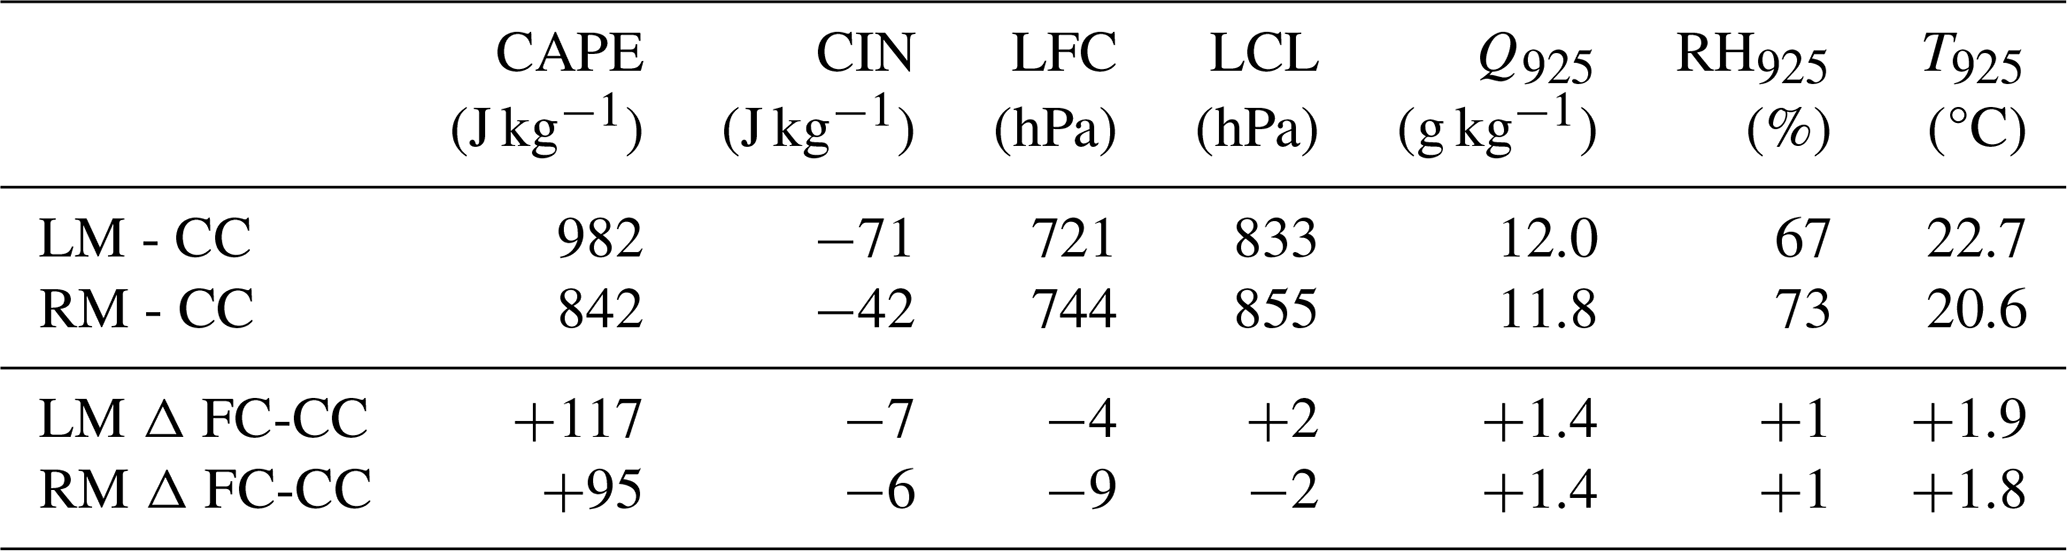
In a 3 °C warmer atmosphere, the thermodynamic profiles for both RMs and LMs show an increase in temperature and specific humidity (see Figs. 5 and 6). Focusing on the vertical profiles of the RMs, separate factors contributing to both increases can be identified. With a surface temperature increase and a low-level specific moisture increase, the LCL remains approximately stable (see Table 2). Due to the steeper moist adiabatic lapse rate at warmer temperatures, the level of free convection (LFC) increases slightly. The environmental lapse rate is stabilizing slightly; however, the steeper moist adiabat over the full vertical range from the surface to the LFC for CIN and from the LFC to the level of neutral buoyancy (LNB) for CAPE compensates this and increases the area of the integral. While relevant environmental intensity metrics increase for both right- and left-movers (Fig. 6), the increase tends to be even greater for LMs, with larger changes in CAPE, surface temperature, and specific humidity. Overall, the composite thermodynamic profiles show typical features of severe convective environments in Europe, with a moist boundary layer and increasingly dry mid-levels, consistent with the possible presence of an elevated mixed layer (Schultz et al., 2025).
3.3 Supercell hazards
Overall, RMs exhibit higher average intensities of 5 min precipitation rate, and extend over larger areas for all hazards, consistent with their larger size compared to LMs (see Figs. 9 and 8). Specifically, the greater relative humidity in RMs is consistent with the higher intensity and area of precipitation (see Figs. 9b, g and 6f, g). As for hail size, LMs produce similarly sized hail as RMs, but over a smaller area (Fig. 9c, h). Notably, they lack the lower end of the maximum hail size distribution, with smaller sizes being less common (Fig. 9c, LM distribution narrower at smallest sizes). Given the higher temperature, this is consistent with the melting of hail (Gensini et al., 2024; Raupach et al., 2021; Dessens et al., 2015).
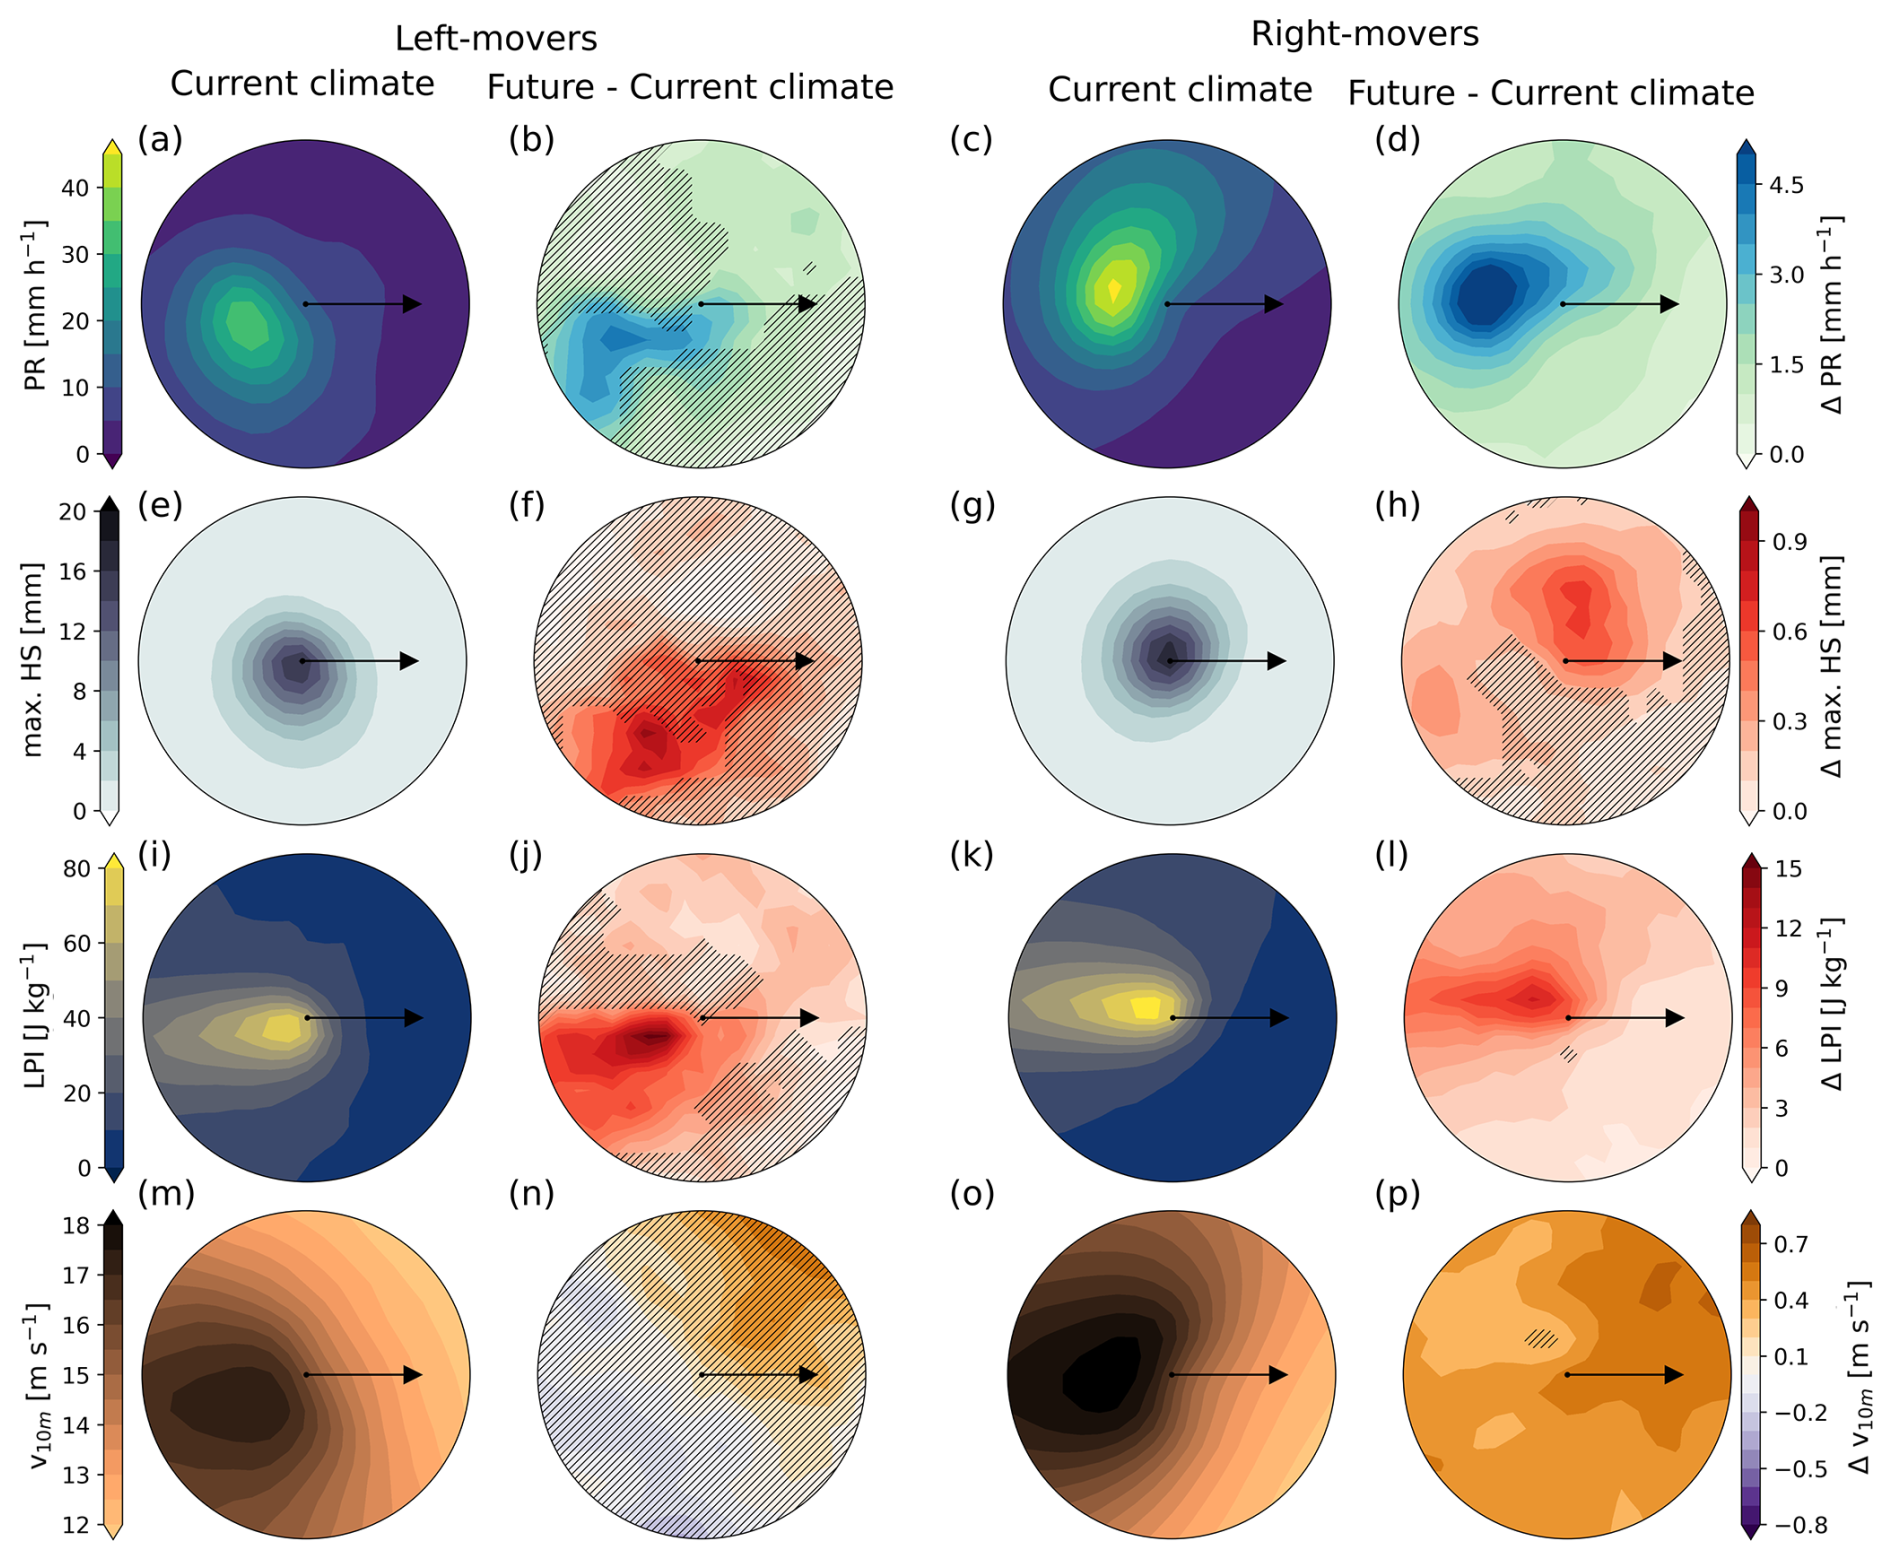
Figure 85 min precipitation rate, 5 min max. hailsize, hourly max. lightning potential index and hourly max. 10 m wind gust of LMs and RMs in the current climate and their climate change delta. Non-significant areas are hatched. The 20 km radii show grid-point wise averages across all LM or RM cases and across all time steps.
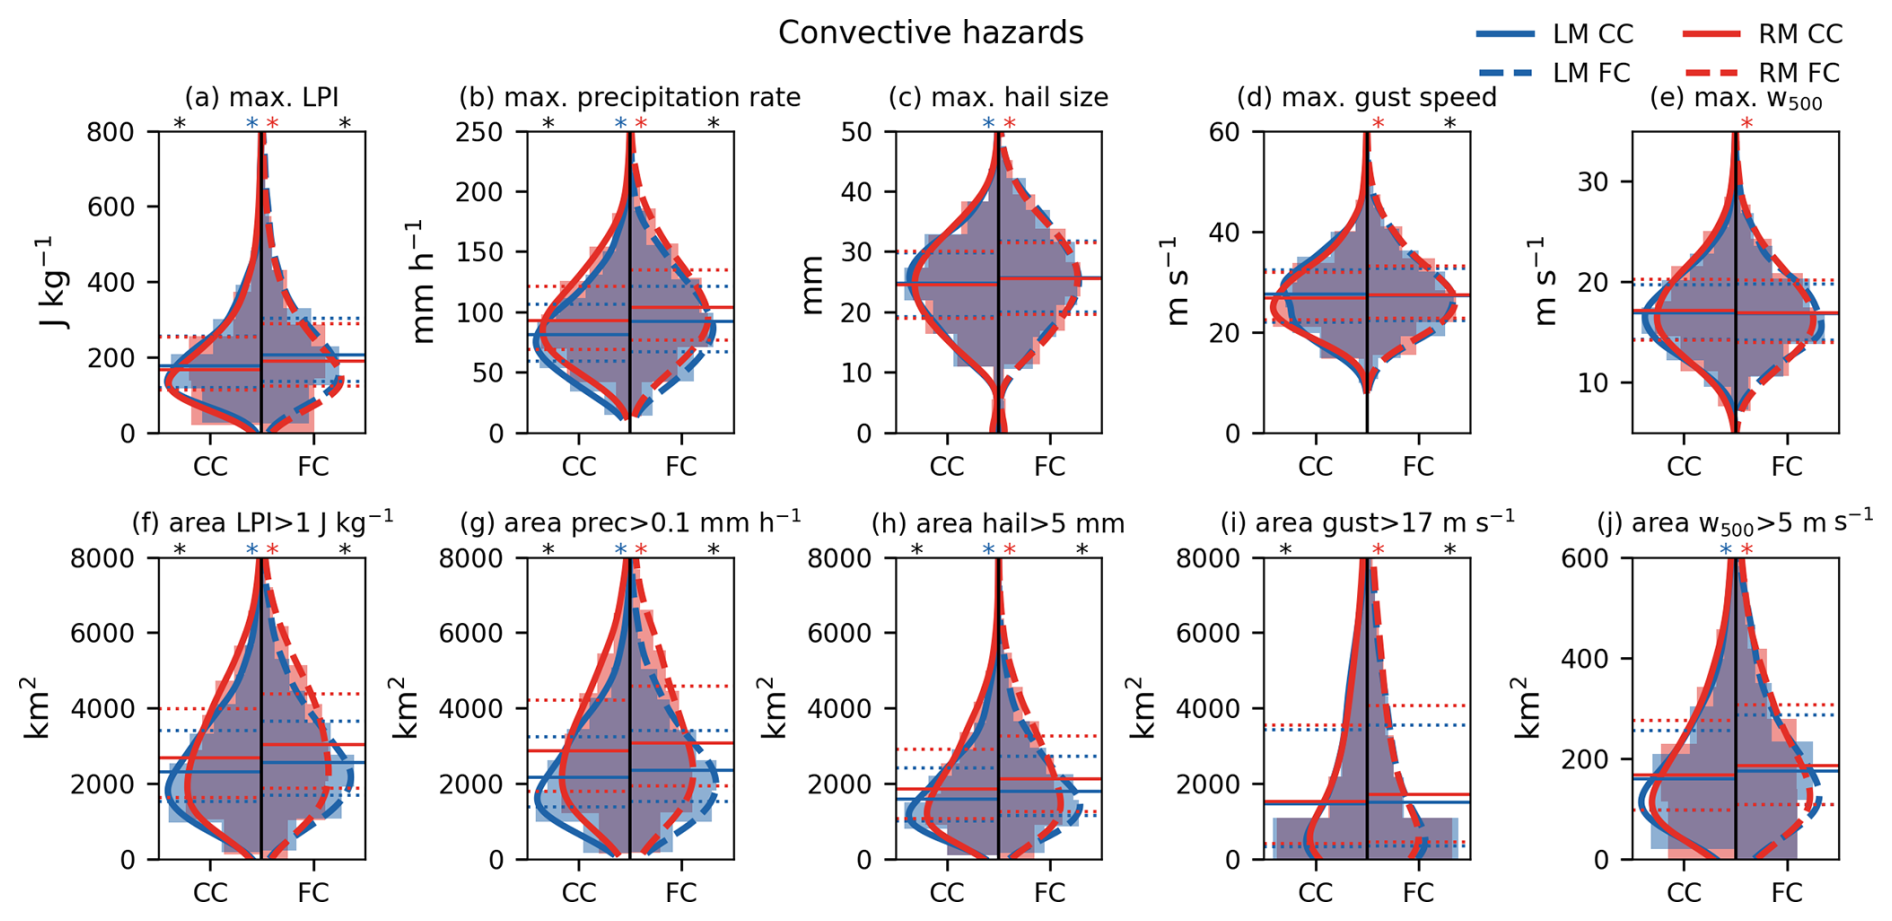
Figure 9Density distributions of storm-associated maximum hazard intensities and hazard areas, interquartile range is indicated in dotted lines, the median with a solid line. The current climate (CC) is depicted on the left-hand side of each plot, the future climate (FC) on the right-hand side. Significant differences between the LMs are indicated with a blue asterisk, between the RMs with a red asterisk, between the current climate with a black asterisk on the left, and between the future climate with a black asterisk on the right.
At the 3 °C GWL, all hazard intensities increase significantly for both RMs and LMs, apart from LM wind gust intensity (Fig. 9a–d). The hazard intensification contrasts with stable maximum updraft speeds in both RM and LM (see Fig. 9e), however, updraft area increases significantly (Fig. 9j). Larger updrafts are more resistant to midlevel entrainment and additionally, the mid-levels are significantly moister in future (Fig. 6h). The hazard intensity changes are larger for LMs, especially at the higher percentiles (not shown). Hence, despite LMs being a smaller subset of all supercell thunderstorms, their hazards are increasing more than those of the total storm population. Hazard areas also increase consistently for both storm populations, apart from the surface gust area of LMs, which has no significant difference. Given the overall smaller size of LMs, the absolute change in hazard area is smaller than for RMs, but the relative change is of a similar magnitude.
The lack of significant change in surface wind gusts is surprising, as thermodynamic considerations suggest that with the given change in environmental conditions, a more pronounced intensification should occur (expected ∼ 15 %, Prein, 2023). However, the variable investigated depicts the hourly maximum 10 m wind speed, and it is not at a 5 min temporal resolution, as opposed to precipitation and hail metrics. Moreover, 10 m wind gusts are parametrized and not diagnosed directly in the model. This may be responsible for part of this discrepancy. Another factor is the presence of considerable terrain over large parts of Europe, especially in the supercell occurrence hotspots of the Alpine region. Wind gust behavior in complex topography is considerably more complicated and less straightforward to infer, as local channeling and damming effects nonlinearly affect the gust amplitude.
3.4 Regional comparison
To investigate the impact of local climates and their future changes on supercells, we use two subregions in the European domain: the Iberian Peninsula (IP) and the Northern Alps (NAL, see Figs. 10 and 11, regions defined in Fig. A1). The climate of these two regions differs strongly between a dry, Mediterranean climate in IP and a moderate, strongly topographically influenced climate in NAL. The IP region is ∼ 6.5 times larger compared to NAL (ca. 1 000 000 km2 vs. ca. 150 000 km2), with a moderate supercell occurrence (1420 mesocyclones and 20.8 % LMs.) The NAL is a comparatively smaller region, however, it has a higher supercell occurrence for its area with 447 detected mesocyclones in the current climate and a LM-ratio of 11.6 %.
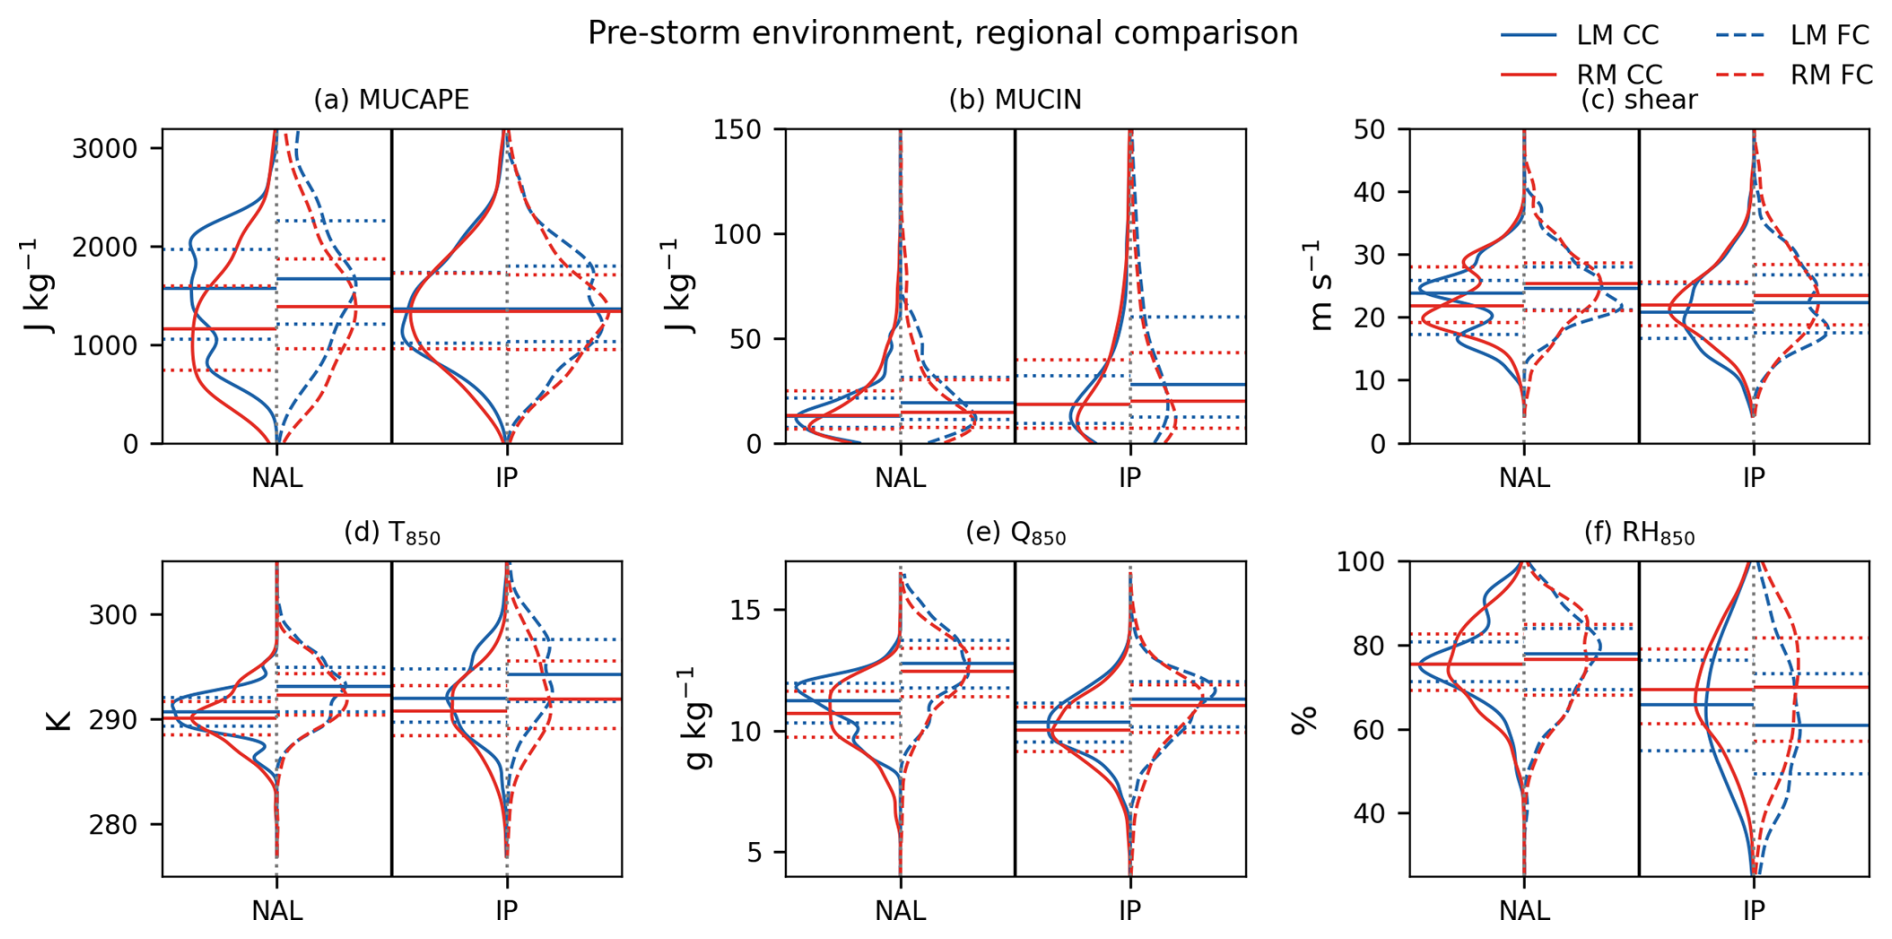
Figure 10Density distributions of pre-storm environment, interquartile range is indicated in dotted lines, the median with a solid line. The current climate (CC) is depicted on the left-hand side of each plot, the future climate (FC) on the right-hand side. The two regions are depicted in the respective halves of the panels.
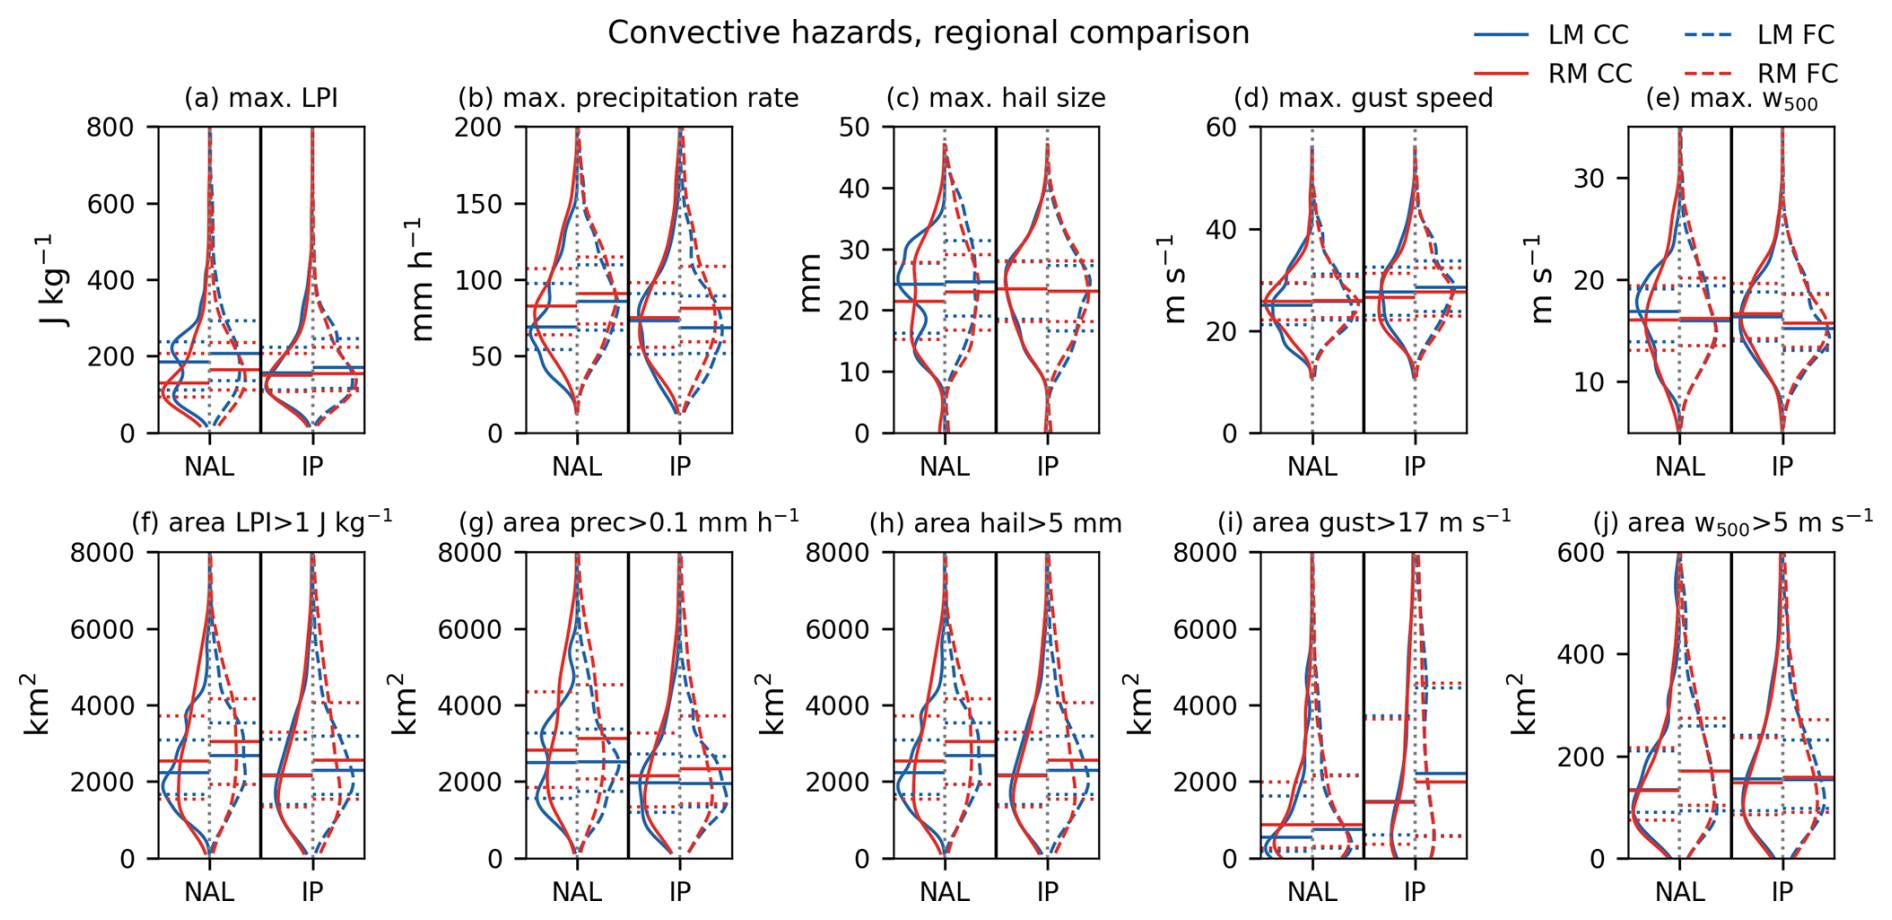
Figure 11Density distributions of storm-associated maximum hazard intensities and hazard areas, interquartile range is indicated in dotted lines, the median with a solid line. The current climate (CC) is depicted on the left-hand side of each plot, the future climate (FC) on the right-hand side. The two regions are depicted in the respective halves of the panels.
Comparing the pre-storm environmental conditions of the current climate in both regions (see Fig. 10), IP emerges as the region where supercells form in hotter and drier conditions (Fig. 10d, e, f); 850 hPa specific and relative humidity are considerably lower than in NAL (Fig. 10e, f). This combination of hotter, but drier conditions results in comparable instability (Fig. 10a), with the range of the CAPE distribution being greater in NAL, reaching higher values in the upper percentiles. CIN is greater in IP, driven by the dryness (Fig. 10b). In the regional decomposition, the pattern of LM occurring in hotter and relatively drier conditions also persists. In NAL we also find higher-CAPE conditions for LMs, but the dry conditions in IP compensate for the hotter temperatures and lead to the same instability range for RMs and LMs. This further supports the hypothesis of LMs occurring (a) closer to the ridge center in synoptically driven situations and (b) preferentially during the convective peak in the day and year, when conditions are most optimal.
In line with the hotter and drier conditions, the distribution of maximum hail sizes in IP lacks the small hail sizes (Fig. 11c, IP's distribution is narrower for small sizes than NAL's), consistent with melting signatures. However, upwards of the median, the percentiles are distributed very similarly to NAL (Fig. 11c, h). IP also has lower precipitation intensities that decrease for LMs in the future climate but increase for RMs (Fig. 11b, g). This suggests that for these storms, while the warmer air could carry more moisture, there is not enough specific humidity available to sustain higher precipitation rates or greater precipitation areas. The increase in RM precipitation rates may result from the larger shear, which increases storm area and organization, RH, and updraft area and may overcompensate for the slight decrease in updraft strength (e.g., Mulholland et al., 2024; Nielsen and Schumacher, 2020, 2018). In both regions, LMs reach higher lightning activity, but in a smaller area than RMs (Fig. 11a, f). Lightning activity in NAL is slightly greater than in IP, possibly related to the greater moisture content. IP has a greater potential for wind gusts in area and speed (Fig. 11d, i). Strong gusts are more likely in drier conditions that can initiate and accelerate downbursts through evaporative cooling (Díaz-Fernández et al., 2025; Romanic et al., 2022; Srivastava, 1985).
Overall, within these sub-regions, the hazard intensities between LMs and RMs can have similar variability as the climate scenarios. Moreover, LMs can have equal or higher intensity hazards, but tend to have them in a smaller area, as their size is overall smaller.
In the kilometer-scale climate model data, our methods identified ∼ 8200 RMs and ∼ 1200 LMs in the current climate. We find an 8 % increase of RMs and 21 % increase of LMs in a +3 °C climate. We emphasize that while the fraction of RMs is 87 % of the total supercell population, we are likely undercounting the number of LMs due to their short-lived and transient nature (Zeeb et al., 2026; Wade and Parker, 2021; Sherburn et al., 2016; Sherburn and Parker, 2014). In the simulated data, both storm types show a realistic, albeit smooth, morphology with distinct right- and left-leaning features and characteristic motion deviations from the mean flow with correspondingly curved hodographs. The fraction of LMs increases marginally (+1 %) in the warmer climate, however the relative increase of LMs (+21 %) is more than twice that of RMs (+8 %).
For both RM and LM hodographs, modeled storm motion deviates less from the hodograph than Bunkers' storm motion estimate. As suggested by Tonn et al. (2023), a reduction of the offset may be warranted in Europe, in addition to having a smaller offset for LMs than RMs (Bunkers et al., 2024). Our analyses propose separate offsets of CRM = 5 m s−1 and CLM = 1 m s−1. The hodographs overall show that shear is largely concentrated at the 850-700 hPa level, while the near-surface change in wind speed is very gradual (also found in Taszarek et al., 2020; Peyraud, 2013; Houze et al., 1993), contrasting the typical supercell environments of the Great Plains, which tend to have large amounts of shear in the first km (e.g., Davenport, 2021). The identified generally northeasterly track of supercells is well-supported by literature showing SW flow during severe convective outbreaks in Europe (Feldmann et al., 2025b, 2021; Mohr et al., 2020; Wapler and James, 2014). The future shift to more northerly tracks may be owed to the spatial shift towards NE Europe (Feldmann et al., 2025a), as synoptic drivers have distinct regional characteristics throughout Europe (Feldmann et al., 2025b; Ghasemifard et al., 2024). Furthermore, the analysis of hodographs revealed an overall backing hodograph for LMs, which is synoptically less likely to occur in the overall convectively favorable prefrontal zone, where warm air advection and veering generally dominate (van Delden, 1998). In combination with the higher mean sea level pressure for LMs, they appear to occur further away from an approaching trough and closer to the center of the downstream ridge, where veering is less pronounced and a backing hodograph has a higher likelihood. Additionally, our results show that LMs occur at higher temperatures and greater instability, and are more likely around the convective peak of the day and season, which has also been found in observational studies targeting the United States (Zeeb et al., 2026; Homeyer et al., 2025). The higher temperatures further suggest the closer location of LMs to the ridge axis, as conditions near the ridge center are increasingly hotter and drier. These conditions often result in less favorable convective conditions, potentially causing the lower percentage of LMs in the overall supercell population.
In comparison to RMs in the current climate, the future climate, as well as LMs in all climates have increased instability and increased convective inhibition. The steeper moist adiabat at higher temperatures reflects both the greater moisture-holding capacity of a warmer atmosphere and the stronger condensation response to cooling, where a given temperature decrease during ascent produces greater latent heat release (Emanuel, 2023). This leads to a simultaneous increase of CAPE and CIN at higher temperatures, when RH remains approximately unchanged.
Analyses of surface hazards show that even though LMs are the minority across the storm population, they are associated with considerable hazard intensities and their hazards increase stronger than those of RMs in the warmer climate. Nonetheless, RMs are the more intense storm type overall. Additionally, in combination with the lower fractional percentage of LMs, LMs remain poorly documented in the European context, and few studies provide detailed analyses of their structure, environments, or hazards (e.g., Houze et al., 1993; Tonn et al., 2023). Consequently, some of our findings cannot be directly compared to previous literature, highlighting the need for further research on this storm type. In the limited previous literature, LMs have been described as prolific hail producers (Zeeb et al., 2026; Nelson, 2024; Houze et al., 1993). The similar hail size distribution to RMs, as well as their marked hail size increase at 3 °C, support this notion. LMs have a smaller fraction of non-hailing storms, and since LMs occur in higher temperatures and greater instability, these may result in a more potent hail environment, possibly skewing the hail size distribution towards larger sizes as small hail melts disproportionately more in the warmer conditions (effects of melting also discussed in Gensini et al., 2024; Raupach et al., 2021; Dessens et al., 2015). Additionally, LMs show equally high lightning and gust magnitudes as RMs, stressing the importance of not neglecting this fraction of the storm population. LMs are ∼ 35 % smaller and thus their hazards are concentrated into a smaller area. In combination with their shorter and more transient lifecycles, this makes for a very volatile storm type that has the potential to be very damaging in a comparatively small area and short amount of time. While the total damages are spatially more confined than with RMs, the local impacts can be just as devastating, emphasizing the need for accurate warnings and forecasts.
In the future climate, the median updraft strength across all supercells slightly decreases, while the updraft area increases slightly. As such, the overall increases in surface hazards (e.g., precipitation rates, hailfall, wind gusts) for both RMs and LMs can be explained by the changes in the storm environment, whereas the changes in hazard area may be related to the increase in updraft width, allowing greater moisture transport for precipitation. Precipitation intensity and area increase in agreement with Clausius–Clapeyron scaling (Estermann et al., 2025; Ban et al., 2020, 2015). Zeeb et al. (2024) shows a similar increase in precipitation intensities in RM supercells in the United States. Precipitation changes may also be modulated by the increase in low-level moisture, temperature, CAPE, and shear, leading to potentially stronger storms and subsequent intensification of precipitation production (e.g., Mulholland et al., 2024; Nielsen and Schumacher, 2020, 2018). While surface wind gusts intensify by ∼ 5 % in RMs, the increase is smaller than expected based on the environmental changes, which suggest a ∼ 15 % increase (Prein, 2023). Possible limitations here may be that wind gusts are an hourly accumulated maximum, instead of a 5 min output variable, as well as the influence of complex topography on surface wind phenomena and the limitations of the gust parametrization.
Comparing the Iberian Peninsula (IP) and Northern Alps (NAL) contrasts a hot and dry climate with a negative supercell frequency trend and a cooler, more humid, and mountainous region with an increasing supercell frequency. At the 3 °C warming level, IP experiences a significant decrease in overall supercell occurrence of 30 %, whereas activity in NAL increases significantly by 50 %, with their LM fractions remaining unchanged (Feldmann et al., 2025a). Overall, these changes in supercell frequency are caused by changes in the frequency of unstable days. Specifically, the increasingly dry summers of IP reduce the number of days, where CAPE exceeds 100 J kg−1 (Thurnherr et al., 2025; Feldmann et al., 2025a). IP has no further reduction in relative humidity for RMs in the pre-storm environment, as specific humidity rises with the local warming. This is a sign that IP's storms are near the limit of how dry conditions can be, while still supporting deep moist convection; median relative humidity values around 60 %–70 % for LMs are comparatively low (Feldmann et al., 2025b). NAL's climate change signal, however, is closer to the domain mean, with CAPE and CIN increasing alongside low-level temperature and specific humidity; low-level relative humidity remains stable for RMs. These increases result in more frequent unstable days (Thurnherr et al., 2025; Feldmann et al., 2025a), therefore significantly increasing the supercell occurrence in NAL.
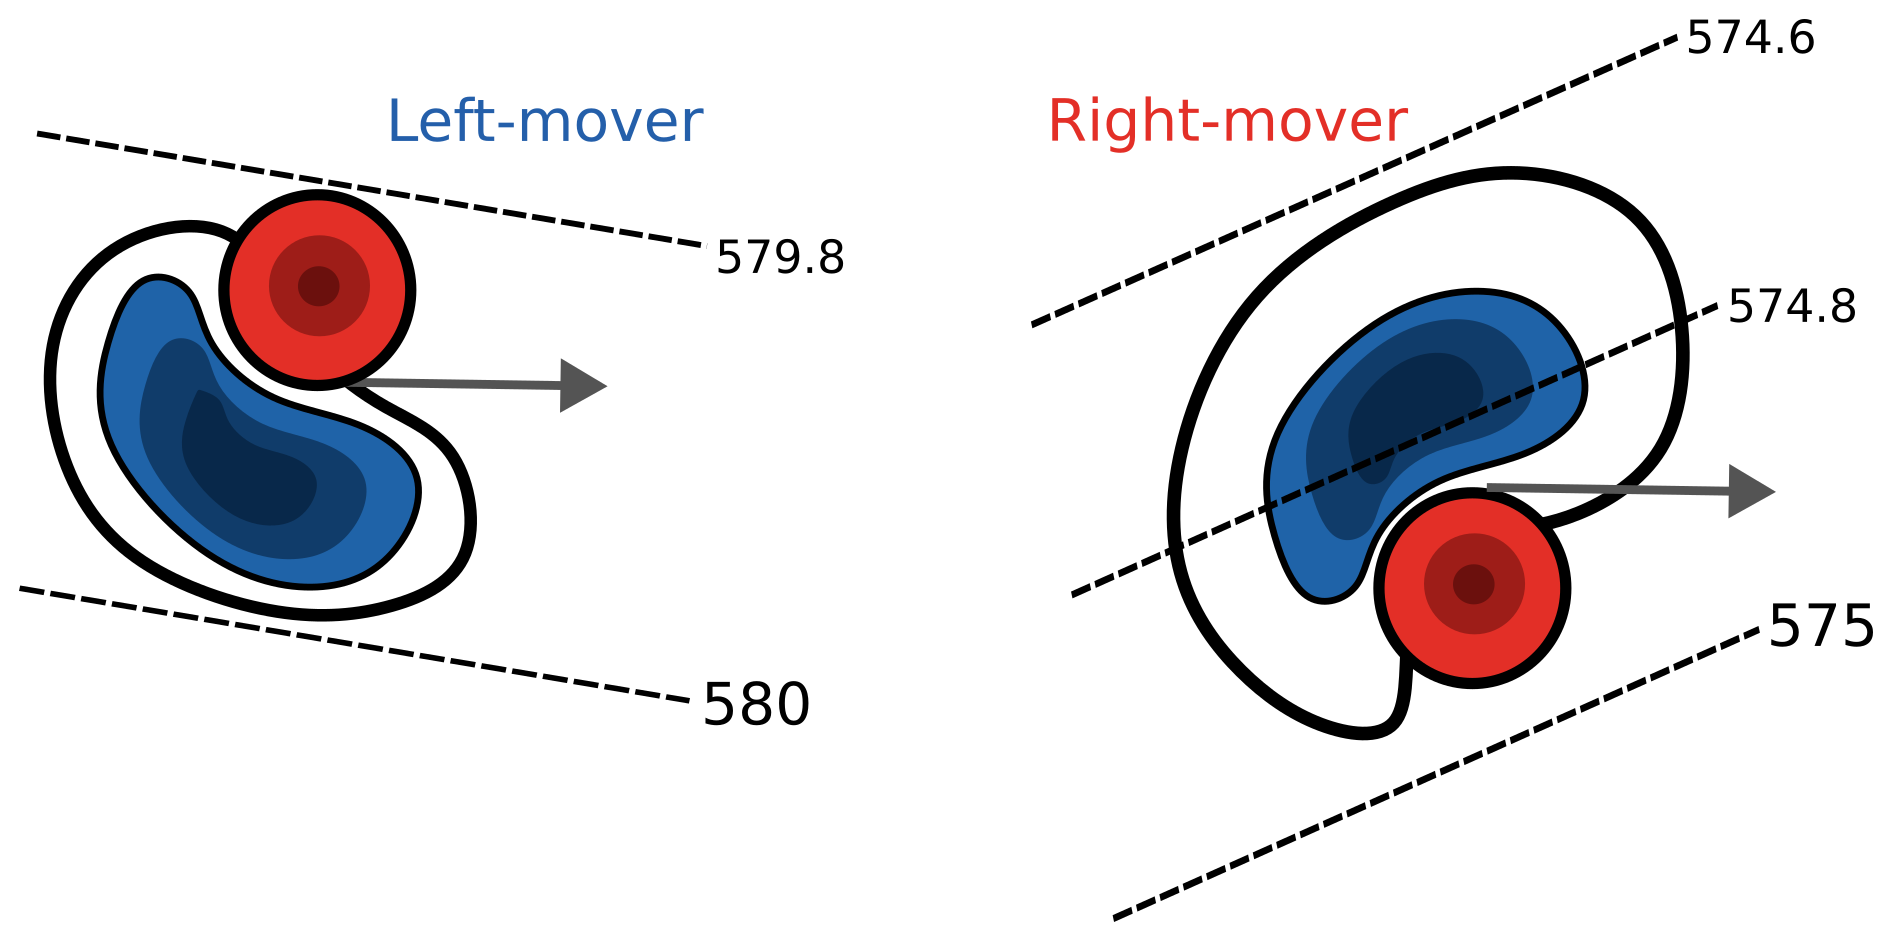
Figure 12Schematic of supercell structures derived from current climate model composites: black outline – precipitation contour, red area – updraft, blue area – downdraft, black dashed lines – isohypses (dam), gray arrow – storm motion. Structural differences between LM and RM: smaller storm area, similar strength up- and downdrafts, less deviant motion for LMs, lesser gradient of geopotential height, and greater geopotential height. Features are exaggerated and not true to scale.
The regional comparison highlights IP as a drier region than NAL, with comparable instability values (also found in observations/reanalysis in Feldmann et al., 2023; Calvo-Sancho et al., 2022). The drier environment in IP reduces the hailfall area, but increases the gust area. Previous studies have shown downburst-favorable environments for IP (Díaz-Fernández et al., 2025; Calvo-Sancho et al., 2022; Romanic et al., 2022). The complex topography and varied environments in NAL produce a wider range of instability conditions supporting supercell development for both RMs and LMs (Feldmann et al., 2024). The more humid conditions also make NAL a region more prone to larger hail-, precipitation-, and lightning areas per storm (Estermann et al., 2025; Cui et al., 2023; Feldmann et al., 2023; Nielsen and Schumacher, 2020; Ban et al., 2020; Nielsen and Schumacher, 2018).
Some inherent limitations of the work here are owed to the limitations of the climate simulation. A 2.2 km horizontal resolution is still on the coarse end for representing supercellular convection (Prein et al., 2025; Weisman et al., 2023); however, it is currently the highest resolution available, especially for the spatio-temporal dimensions of the dataset. Feldmann et al. (2025a) show that this resolution is sufficient to capture the spatio-temporal distribution of supercells with mesocyclones of at least 5 km diameter. Nonetheless, smaller and shorter-lived storms are missed by the tracking, affecting LMs disproportionately, provided their smaller and more transient nature. While observational references for LMs are strongly limited, we assume that the identified proportion of 25 % LMs in Tonn et al. (2023) is more realistic than the < 15 % identified here.
Likewise, the PGW approach here constitutes a single realization of a 3 °C warming scenario. While the chosen driving climate model member is close to the ensemble mean with respect to summer precipitation (Thurnherr et al., 2025), this method does not provide uncertainty information on the range of general possible conditions at a 3 °C GWL. Presumably, this uncertainty affects overall storm frequency changes more than the environmental changes when a storm is already present in the model.
The analysis of the regional climate data has allowed us to fundamentally compare right- (RM) and left-moving (LM) supercells from a climatological perspective. Revisiting the questions raised in the beginning, we can summarize as follows:
-
Comparison of structure, environments, and intensity. LMs constitute a minority (13 %) fraction of storms, but can achieve similar hazard intensities as RMs. They are smaller and their averaged curvature is less pronounced than the right-leaning curvature of the RMs (see Fig. 12 for a graphical summary). LMs occur in a narrow range of environmental conditions, on average in higher temperatures and in less stable conditions, with a weakly backing hodograph, found in higher-mean sea level pressure locations with smaller horizontal pressure gradients.
-
Comparison of climate change signal. The instability and hazards of LMs increase more than those of RMs at the 3 °C GWL. Despite the frequency split remaining stable in the model, the hazard intensity increases disproportionately for LMs. For both storm types, the updraft strength remains stable, while the updraft area increases slightly. Hazard intensities and areas increase in future.
-
The role of regional heterogeneity. The comparison of two different climate regimes – one with a drier and hotter climate and the other with a more humid and cooler climate – leads to different supercell frequency changes in the future, showing that key environmental characteristics persist across diverse climate regimes. Regionally, LMs occur in warmer and less stable conditions than RMs. Overall, the differences between regional climates are generally greater than the differences between LMs and RMs, whereas the differences between LMs and RMs are of similar magnitude as the differences between the climate scenarios.
Overall, supercell thunderstorms in Europe are expected to increase in both occurrence and hazard intensity, as their environments grow more potent, with increases in both CAPE and deep-layer shear, supported by increases in specific humidity. The intensity increase is largely decoupled from regional frequency changes. Near-storm environments are preconditioned by the presence of a storm, and while they still lean towards their background climate, certain conditions are always filled, such as moisture availability, instability, and deep-layer shear.
Fundamentally understanding the differences between RMs' and LMs' hazard potential and environments allows for the development of better warning and forecasting tools. The majority of forecasting parameters, such as the supercell composite parameter, are mostly tuned to the occurrence of severe RMs (Zeeb et al., 2026). Given the high hazard potential of LMs and their disproportionate intensification with climate change, better forecasting metrics are essential. Especially in regions like the Alpine region, where the frequency increase is considerable (Feldmann et al., 2025a) and the intensity of LMs rivals RMs, accurate projections of severe weather potential are a key requirement for climate adaptation.
Given the scarcity of literature on LMs, both further observational and modeling studies are essential to fully characterize the processes differentiating them from RMs. LMs are not simply a mirror of RMs, but rather a distinct storm type with unique morphology, environmental conditions, and hazard potential. More broadly, the response of supercells to climate change remains subject to considerable uncertainty. Longer observational records and high-resolution ensemble simulations will be key to constraining future risks and improving preparedness.
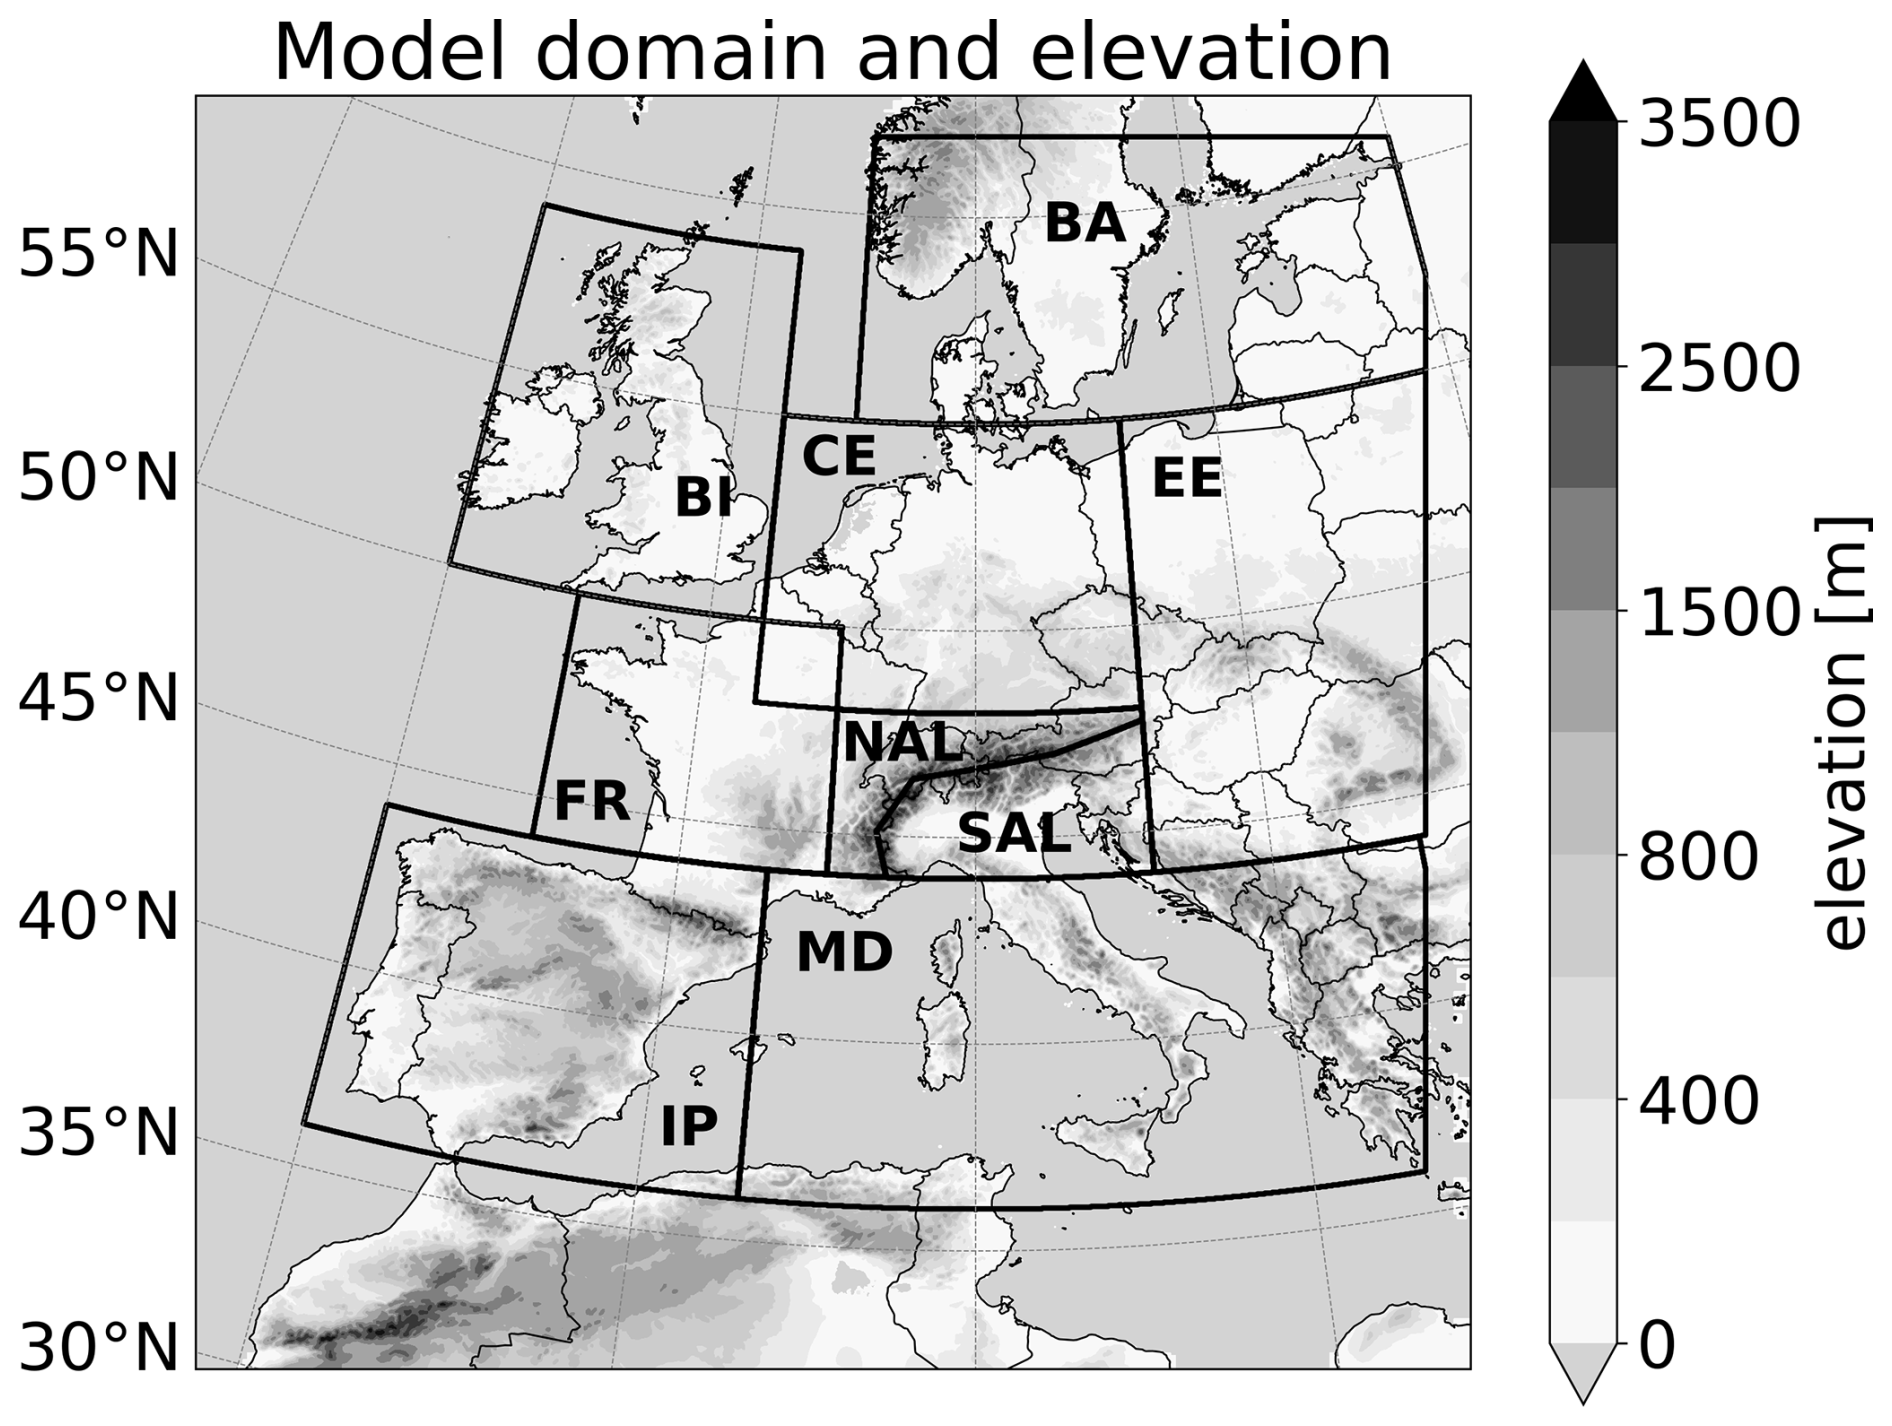
Figure A1Model domain and elevation, including sub-regions.
The code used to extract the storm environment is available at https://doi.org/10.5281/zenodo.14631622 (Brennan, 2025). Storm tracks are available at https://doi.org/10.5281/zenodo.13378057 (Blanc and Feldmann, 2024). The code used for further analyses and visualization of the data is available at https://doi.org/10.5281/zenodo.19384076 (Feldmann, 2026). The extracted 60 km radii at 0 and 1 h lag are available at https://doi.org/10.5281/zenodo.17873169 (Feldmann and Beer, 2026).
The study was designed by MF and OM. SB extracted the data and performed first storm-centered analyses during his MSc thesis, under the supervision of MF, LW, and OM. KB developed the extraction tool. AWZ provided analyses and interpretation relevant to left-moving supercells and supercell dynamics. MF conducted the final analyses, made the visualizations, and wrote the manuscript, which was edited by SB, AWZ, KB, LW, and OM.
The positions of Monika Feldmann and Olivia Martius are funded through the Mobiliar group, which had no influence on any part of this study.
Publisher's note: Copernicus Publications remains neutral with regard to jurisdictional claims made in the text, published maps, institutional affiliations, or any other geographical representation in this paper. The authors bear the ultimate responsibility for providing appropriate place names. Views expressed in the text are those of the authors and do not necessarily reflect the views of the publisher.
We sincerely thank Dr. Iris Thurnherr and Dr. Patricio Velasquez for conducting the climate simulations and providing access to the data.
The authors acknowledge the financial support of the Swiss National Science Foundation (SNSF). MF and OM thank the Mobiliar group for funding. AWZ acknowledges the financial support of the Earth and Ecosystem Science PhD program at Central Michigan University and the National Science Foundation.
We acknowledge the use of ChatGPT for minor text revisions in the manuscript.
This research has been supported by the SNSF grant cRSii5_201792, funding the Synergia-project “Seamless coupling of kilometer-resolution weather predictions and climate simulations with hail impact assessments for multiple sectors” (scClim; https://scclim.ethz.ch/, last access: 13 April 2026). The positions of MF and OM are funded through the Mobiliar group. AWZ is supported by the Earth and Ecosystem Science PhD program at Central Michigan University and the National Science Foundation under Grant AGS-2218623.
This paper was edited by Johannes Dahl and reviewed by two anonymous referees.
Ashley, W. S., Haberlie, A. M., and Gensini, V. A.: The Future of Supercells in the United States, B. Am. Meteorol. Soc., 104, E1–E21, https://doi.org/10.1175/BAMS-D-22-0027.1, 2023. a, b
Ban, N., Schmidli, J., and Schär, C.: Heavy precipitation in a changing climate: Does short-term summer precipitation increase faster?, Geophys. Res. Lett., 42, 1165–1172, https://doi.org/10.1002/2014GL062588, 2015. a
Ban, N., Rajczak, J., Schmidli, J., and Schär, C.: Analysis of Alpine precipitation extremes using generalized extreme value theory in convection-resolving climate simulations, Clim. Dynam., 55, 61–75, https://doi.org/10.1007/s00382-018-4339-4, 2020. a, b
Barras, H., Hering, A., Martynov, A., Noti, P.-A., Germann, U., and Martius, O.: Experiences with > 50,000 Crowdsourced Hail Reports in Switzerland, B. Am. Meteorol. Soc., 100, 1429–1440, https://doi.org/10.1175/BAMS-D-18-0090.1, 2019. a
Battaglioli, F., Groenemeijer, P., Púčik, T., Taszarek, M., Ulbrich, U., and Rust, H.: Modeled Multidecadal Trends of Lightning and (Very) Large Hail in Europe and North America (1950–2021), J. Appl. Meteorol. Clim., 62, 1627–1653, https://doi.org/10.1175/JAMC-D-22-0195.1, 2023. a
Benjamini, Y. and Hochberg, Y.: Controlling the False Discovery Rate: A Practical and Powerful Approach to Multiple Testing, J. Roy. Stat. Soc. B, 57, 289–300, https://doi.org/10.1111/j.2517-6161.1995.tb02031.x, 1995. a
Blanc, M. and Feldmann, M.: Supercell track model data from a current and a future climate European COSMO simulations, Zenodo [data set], https://doi.org/10.5281/zenodo.13378057, 2024. a
Brennan, K.: KillianBrennan/cookie_cutter: climate release, Version climate_release, Zenodo [code], https://doi.org/10.5281/zenodo.14631622, 2025. a
Brennan, K. P., Sprenger, M., Walser, A., Arpagaus, M., and Wernli, H.: An object-based and Lagrangian view on an intense hailstorm day in Switzerland as represented in COSMO-1E ensemble hindcast simulations, Weather Clim. Dynam., 6, 645–668, https://doi.org/10.5194/wcd-6-645-2025, 2025a. a
Brennan, K. P., Thurnherr, I., Sprenger, M., and Wernli, H.: Insights from hailstorm track analysis in European climate change simulations, Nat. Hazards Earth Syst. Sci., 25, 3693–3712, https://doi.org/10.5194/nhess-25-3693-2025, 2025b. a
Brogli, R., Heim, C., Mensch, J., Sørland, S. L., and Schär, C.: The pseudo-global-warming (PGW) approach: methodology, software package PGW4ERA5 v1.1, validation, and sensitivity analyses, Geosci. Model Dev., 16, 907–926, https://doi.org/10.5194/gmd-16-907-2023, 2023. a, b
Brown, R. A. and Meitín, R. J.: Evolution and Morphology of Two Splitting Thunderstorms with Dominant Left-Moving Members, Mon. Weather Rev., 122, 2052–2067, https://doi.org/10.1175/1520-0493(1994)122<2052:EAMOTS>2.0.CO;2, 1994. a, b
Bunkers, M. J.: Vertical Wind Shear Associated with Left-Moving Supercells, Weather Forecast., 17, 845–855, https://doi.org/10.1175/1520-0434(2002)017<0845:VWSAWL>2.0.CO;2, 2002. a, b
Bunkers, M. J., Klimowski, B. A., Zeitler, J. W., Thompson, R. L., and Weisman, M. L.: Predicting Supercell Motion Using a New Hodograph Technique, Weather Forecast., 15, 61–79, https://doi.org/10.1175/1520-0434(2000)015<0061:PSMUAN>2.0.CO;2, 2000. a, b, c, d, e, f
Bunkers, M. J., Broeke, M. S. V. D., and Allen, J. T.: An Update for Predicting Left-Moving Supercell Motion, Weather Forecast., 39, 1777–1794, https://doi.org/10.1175/WAF-D-24-0028.1, 2024. a, b, c, d, e, f
Calvo-Sancho, C., Díaz-Fernández, J., Martín, Y., Bolgiani, P., Sastre, M., González-Alemán, J. J., Santos-Muñoz, D., Farrán, J. I., and Martín, M. L.: Supercell convective environments in Spain based on ERA5: hail and non-hail differences, Weather Clim. Dynam., 3, 1021–1036, https://doi.org/10.5194/wcd-3-1021-2022, 2022. a, b
Cui, R., Ban, N., Demory, M.-E., Aellig, R., Fuhrer, O., Jucker, J., Lapillonne, X., and Schär, C.: Exploring hail and lightning diagnostics over the Alpine-Adriatic region in a km-scale climate model, Weather Clim. Dynam., 4, 905–926, https://doi.org/10.5194/wcd-4-905-2023, 2023. a
Cui, R., Thurnherr, I., Velasquez, P., Brennan, K. P., Leclair, M., Mazzoleni, A., Schmid, T., Wernli, H., and Schär, C.: A European Hail and Lightning Climatology From an 11-Year Kilometer-Scale Regional Climate Simulation, J. Geophys. Res.-Atmos., 130, e2024JD042828, https://doi.org/10.1029/2024JD042828, 2025. a, b
Davenport, C. E.: Environmental Evolution of Long-Lived Supercell Thunderstorms in the Great Plains, Weather Forecast., 36, 2187–2209, https://doi.org/10.1175/WAF-D-21-0042.1, 2021. a
Davies-Jones, R.: Streamwise Vorticity: The Origin of Updraft Rotation in Supercell Storms, J. Atmos. Sci., 41, 2991–3006, https://doi.org/10.1175/1520-0469(1984)041<2991:SVTOOU>2.0.CO;2, 1984. a
Davies-Jones, R.: Linear and Nonlinear Propagation of Supercell Storms, J. Atmos. Sci., 59, 3178–3205, https://doi.org/10.1175/1520-0469(2003)059<3178:LANPOS>2.0.CO;2, 2002. a
Davies-Jones, R.: A review of supercell and tornado dynamics, Atmos. Res., 158–159, 274–291, https://doi.org/10.1016/j.atmosres.2014.04.007, 2015. a
Davies-Jones, R. P.: Tornado dynamics, Thunderstorm morphology and dynamics, 2, 197–236, 1986. a
Dessens, J., Berthet, C., and Sanchez, J. L.: Change in hailstone size distributions with an increase in the melting level height, Atmos. Res., 158–159, 245–253, https://doi.org/10.1016/j.atmosres.2014.07.004, 2015. a, b
Díaz-Fernández, J., Calvo-Sancho, C., Bolgiani, P., Sastre, M., López-Reyes, M., Fernández-González, S., and Martín, M. L.: Effect of complex orography on numerical simulations of a downburst event in Spain, Atmos. Res., 314, 107821, https://doi.org/10.1016/j.atmosres.2024.107821, 2025. a, b
Edwards, R. and Hodanish, S. J.: Photographic Documentation and Environmental Analysis of an Intense, Anticyclonic Supercell on the Colorado Plains, Mon. Weather Rev., 134, 3753–3763, https://doi.org/10.1175/MWR3296.1, 2006. a, b
Edwards, R. and Thompson, R. L.: Right-Moving Supercell Tornadogenesis during Interaction with a Left-Moving Supercell’s Rear-Flank Outflow, Weather Forecast., 39, 141–153, https://doi.org/10.1175/WAF-D-23-0075.1, 2024. a
Edwards, R., Thompson, R. L., Mead, C. M., and Center, S. P.: Assessment of anticyclonic supercell environments using close proximity soundings from the RUC model, Poster Session P1.2, in: 22nd Conference on Severe Local Storms, Hyannis, MA, 4–8 October 2004, Amer. Meteor. Soc., https://ams.confex.com/ams/pdfpapers/81328.pdf (last access: 13 April 2026), 2004. a
Emanuel, K.: On the Physics of High CAPE, J. Atmos. Sci., 80, 2669–2683, https://doi.org/10.1175/JAS-D-23-0060.1, 2023. a
Estermann, R., Rajczak, J., Velasquez, P., Lorenz, R., and Schär, C.: Projections of Heavy Precipitation Characteristics Over the Greater Alpine Region Using a Kilometer–Scale Climate Model Ensemble, J. Geophys. Res.-Atmos., 130, e2024JD040901, https://doi.org/10.1029/2024JD040901, 2025. a, b
Feldmann, M.: feldmann-m/SC_left_right: SC_LR_V1, Zenodo [code], https://doi.org/10.5281/zenodo.19384076, 2026. a
Feldmann, M. and Beer, S.: Supplement data to “Left- and right-moving supercell dynamics, environments and hazards - today and in future”, Zenodo [data set], https://doi.org/10.5281/zenodo.17873169, 2026. a
Feldmann, M., Germann, U., Gabella, M., and Berne, A.: A characterisation of Alpine mesocyclone occurrence, Weather Clim. Dynam., 2, 1225–1244, https://doi.org/10.5194/wcd-2-1225-2021, 2021. a, b
Feldmann, M., Hering, A., Gabella, M., and Berne, A.: Hailstorms and rainstorms versus supercells – a regional analysis of convective storm types in the Alpine region, npj Climate and Atmospheric Science, 6, 1–11, https://doi.org/10.1038/s41612-023-00352-z, 2023. a, b
Feldmann, M., Rotunno, R., Germann, U., and Berne, A.: Supercell Thunderstorms in Complex Topography—How Mountain Valleys with Lakes Can Increase Occurrence Frequency, Mon. Weather Rev., 152, 471–489, https://doi.org/10.1175/MWR-D-22-0350.1, 2024. a
Feldmann, M., Blanc, M., Brennan, K. P., Thurnherr, I., Velasquez, P., Martius, O., and Schär, C.: European supercell thunderstorms – A prevalent current threat and an increasing future hazard, Science Advances, 11, eadx0513, https://doi.org/10.1126/sciadv.adx0513, 2025a. a, b, c, d, e, f, g, h, i, j, k, l, m, n, o
Feldmann, M., Domeisen, D. I. V., and Martius, O.: A pan-European analysis of large-scale drivers of severe convective outbreaks, Weather Clim. Dynam., 6, 1089–1106, https://doi.org/10.5194/wcd-6-1089-2025, 2025b. a, b, c, d, e
Gensini, V. A., Ashley, W. S., Michaelis, A. C., Haberlie, A. M., Goodin, J., and Wallace, B. C.: Hailstone size dichotomy in a warming climate, npj Climate and Atmospheric Science, 7, 185, https://doi.org/10.1038/s41612-024-00728-9, 2024. a, b
Germann, U., Boscacci, M., Clementi, L., Gabella, M., Hering, A., Sartori, M., Sideris, I. V., and Calpini, B.: Weather Radar in Complex Orography, Remote Sensing, 14, 503, https://doi.org/10.3390/rs14030503, 2022. a
Ghasemifard, H., Groenemeijer, P., Battaglioli, F., and Púčik, T.: Do changing circulation types raise the frequency of summertime thunderstorms and large hail in Europe?, Environmental Research: Climate, 3, 015008, https://doi.org/10.1088/2752-5295/ad22ec, 2024. a
Grasso, L. D.: The Dissipation of a Left-Moving Cell in a Severe Storm Environment, Mon. Weather Rev., 128, 2797–2815, https://doi.org/10.1175/1520-0493(2000)128<2797:TDOALM>2.0.CO;2, 2000. a, b
Hall, A., Rahimi, S., Norris, J., Ban, N., Siler, N., Leung, L. R., Ullrich, P., Reed, K. A., Prein, A. F., and Qian, Y.: An Evaluation of Dynamical Downscaling Methods Used to Project Regional Climate Change, J. Geophys. Res.-Atmos., 129, e2023JD040591, https://doi.org/10.1029/2023JD040591, 2024. a
Heim, C., Leutwyler, D., and Schär, C.: Application of the Pseudo-Global Warming Approach in a Kilometer-Resolution Climate Simulation of the Tropics, J. Geophys. Res.-Atmos., 128, e2022JD037958, https://doi.org/10.1029/2022JD037958, 2023. a
Hersbach, H., Bell, B., Berrisford, P., Hirahara, S., Horányi, A., Muñoz-Sabater, J., Nicolas, J., Peubey, C., Radu, R., Schepers, D., Simmons, A., Soci, C., Abdalla, S., Abellan, X., Balsamo, G., Bechtold, P., Biavati, G., Bidlot, J., Bonavita, M., De Chiara, G., Dahlgren, P., Dee, D., Diamantakis, M., Dragani, R., Flemming, J., Forbes, R., Fuentes, M., Geer, A., Haimberger, L., Healy, S., Hogan, R. J., Hólm, E., Janisková, M., Keeley, S., Laloyaux, P., Lopez, P., Lupu, C., Radnoti, G., de Rosnay, P., Rozum, I., Vamborg, F., Villaume, S., and Thépaut, J.-N.: The ERA5 global reanalysis, Q. J. Roy. Meteor. Soc., 146, 1999–2049, https://doi.org/10.1002/qj.3803, 2020. a
Homeyer, C. R., Bunkers, M. J., Allen, J. T., and Murphy, A. M.: United States Supercell Storms and Their Severity: A 14-yr Radar-Based Climatology, J. Appl. Meteorol. Clim., 64, 959–970, https://doi.org/10.1175/JAMC-D-24-0185.1, 2025. a, b, c, d, e
Houze Jr., R. A., Schmid, W., Fovell, R. G., and Schiesser, H.-H.: Hailstorms in Switzerland: Left Movers, Right Movers, and False Hooks, Mon. Weather Rev., 121, 3345–3370, https://doi.org/10.1175/1520-0493(1993)121<3345:HISLMR>2.0.CO;2, 1993. a, b, c, d, e, f
Kahraman, A., Kendon, E. J., Fowler, H. J., and Short, C. J.: Future changes in severe hail across Europe, including regional emergence of warm-type thunderstorms, Nat. Commun., 16, 8438, https://doi.org/10.1038/s41467-025-62780-0, 2025. a
Markowski, P. and Richardson, Y.: Mesoscale Meteorology in Midlatitudes, Wiley-Blackwell, https://doi.org/10.1002/9780470682104, ISBN 978-0-470-74213-6, 2010. a, b
McKnight, P. E. and Najab, J.: Mann-Whitney U Test, in: The Corsini Encyclopedia of Psychology, edited by: Weiner, I. B. and Craighead, W. E., John Wiley & Sons, Ltd, 1–1, https://doi.org/10.1002/9780470479216.corpsy0524, ISBN 978-0-470-47921-6, 2010. a
Mohr, S., Wilhelm, J., Wandel, J., Kunz, M., Portmann, R., Punge, H. J., Schmidberger, M., Quinting, J. F., and Grams, C. M.: The role of large-scale dynamics in an exceptional sequence of severe thunderstorms in Europe May–June 2018, Weather Clim. Dynam., 1, 325–348, https://doi.org/10.5194/wcd-1-325-2020, 2020. a, b
Mulholland, J. P., Nowotarski, C. J., Peters, J. M., Morrison, H., and Nielsen, E. R.: How Does Vertical Wind Shear Influence Updraft Characteristics and Hydrometeor Distributions in Supercell Thunderstorms?, Mon. Weather Rev., 152, 1663–1687, https://doi.org/10.1175/MWR-D-23-0166.1, 2024. a, b
Nelson, R.: Polarimetric Radar Signatures in Significant Severe Left-moving Supercells, thesis, Department of Earth and Atmospheric Sciences: Dissertations, Theses, and Student Research, https://digitalcommons.unl.edu/geoscidiss/158 (last access: 13 April 2026), 2024. a
Nielsen, E. R. and Schumacher, R. S.: Dynamical Insights into Extreme Short-Term Precipitation Associated with Supercells and Mesovortices, J. Atmos. Sci., 75, 2983–3009, https://doi.org/10.1175/JAS-D-17-0385.1, 2018. a, b, c
Nielsen, E. R. and Schumacher, R. S.: Dynamical Mechanisms Supporting Extreme Rainfall Accumulations in the Houston “Tax Day” 2016 Flood, Mon. Weather Rev., 148, 83–109, https://doi.org/10.1175/MWR-D-19-0206.1, 2020. a, b, c
Nisi, L., Hering, A., Germann, U., and Martius, O.: A 15-year hail streak climatology for the Alpine region, Q. J. Roy. Meteor. Soc., 144, 1429–1449, https://doi.org/10.1002/qj.3286, 2018. a
Peyraud, L.: Analysis of the 18 July 2005 Tornadic Supercell over the Lake Geneva Region, Weather Forecast., 28, 1524–1551, https://doi.org/10.1175/waf-d-13-00022.1, 2013. a, b
Prein, A. F.: Thunderstorm straight line winds intensify with climate change, Nat. Clim. Change, 13, 1353–1359, https://doi.org/10.1038/s41558-023-01852-9, 2023. a, b
Prein, A. F., Rasmussen, R. M., Wang, D., and Giangrande, S. E.: Sensitivity of organized convective storms to model grid spacing in current and future climates, Philoso. T. Roy. Soc. A, 379, 20190546, https://doi.org/10.1098/rsta.2019.0546, 2021. a
Prein, A. F., Wang, D., Ge, M., Ramos Valle, A., and Chasteen, M. B.: Resolving Mesoscale Convective Systems: Grid Spacing Sensitivity in the Tropics and Midlatitudes, J. Geophys. Res.-Atmos., 130, e2024JD042530, https://doi.org/10.1029/2024JD042530 2025. a, b
Pîrloagă, R., Ene, D., and Antonescu, B.: Population Bias on Tornado Reports in Europe, Applied Sciences, 11, 11485, https://doi.org/10.3390/app112311485, 2021. a
Raupach, T. H., Martius, O., Allen, J. T., Kunz, M., Lasher-Trapp, S., Mohr, S., Rasmussen, K. L., Trapp, R. J., and Zhang, Q.: The effects of climate change on hailstorms, Nature Reviews Earth & Environment, 2, 213–226, https://doi.org/10.1038/s43017-020-00133-9, 2021. a, b
Romanic, D., Taszarek, M., and Brooks, H.: Convective environments leading to microburst, macroburst and downburst events across the United States, Weather and Climate Extremes, 37, 100474, https://doi.org/10.1016/j.wace.2022.100474, 2022. a, b
Saltikoff, E., Haase, G., Delobbe, L., Gaussiat, N., Martet, M., Idziorek, D., Leijnse, H., Novák, P., Lukach, M., and Stephan, K.: OPERA the Radar Project, Atmosphere, 10, 320, https://doi.org/10.3390/atmos10060320, 2019. a
Sato, T., Kimura, F., and Kitoh, A.: Projection of global warming onto regional precipitation over Mongolia using a regional climate model, J. Hydrol., 333, 144–154, https://doi.org/10.1016/j.jhydrol.2006.07.023, 2007. a
Schär, C., Frei, C., Lüthi, D., and Davies, H. C.: Surrogate climate-change scenarios for regional climate models, Geophys. Res. Lett., 23, 669–672, https://doi.org/10.1029/96GL00265,1996. a
Schär, C., Fuhrer, O., Arteaga, A., Ban, N., Charpilloz, C., Girolamo, S. D., Hentgen, L., Hoefler, T., Lapillonne, X., Leutwyler, D., Osterried, K., Panosetti, D., Rüdisühli, S., Schlemmer, L., Schulthess, T. C., Sprenger, M., Ubbiali, S., and Wernli, H.: Kilometer-Scale Climate Models: Prospects and Challenges, B. Am. Meteorol. Soc., 101, E567–E587, https://doi.org/10.1175/BAMS-D-18-0167.1, 2020. a
Schultz, D. M., Young, M. V., and Kirshbaum, D. J.: The Spanish Plume Elevated Mixed Layer: A Review of Its Use and Misuse within the Scientific Literature, Mon. Weather Rev., 153, 737–761, https://doi.org/10.1175/MWR-D-24-0139.1, 2025. a
Sherburn, K. D. and Parker, M. D.: Climatology and Ingredients of Significant Severe Convection in High-Shear, Low-CAPE Environments, Weather Forecast., 29, 854–877, https://doi.org/10.1175/WAF-D-13-00041.1, 2014. a, b
Sherburn, K. D., Parker, M. D., King, J. R., and Lackmann, G. M.: Composite Environments of Severe and Nonsevere High-Shear, Low-CAPE Convective Events, Weather Forecast., 31, 1899–1927, https://doi.org/10.1175/WAF-D-16-0086.1, 2016. a, b
Srivastava, R. C.: A Simple Model of Evaporatively Driven Downdraft: Application to Microburst Downdraft, J. Atmos. Sci., 42, 1004–1023, https://doi.org/10.1175/1520-0469(1985)042<1004:ASMOED>2.0.CO;2, 1985. a
Taszarek, M., Kendzierski, S., and Pilguj, N.: Hazardous weather affecting European airports: Climatological estimates of situations with limited visibility, thunderstorm, low-level wind shear and snowfall from ERA5, Weather and Climate Extremes, 28, 100243, https://doi.org/10.1016/j.wace.2020.100243, 2020. a
Taszarek, M., Allen, J. T., Brooks, H. E., Pilguj, N., and Czernecki, B.: Differing Trends in United States and European Severe Thunderstorm Environments in a Warming Climate, B. Am. Meteorol. Soc., 102, E296–E322, https://doi.org/10.1175/BAMS-D-20-0004.1, 2021. a, b, c
Thurnherr, I., Cui, R., Velasquez, P., Wernli, H., and Schär, C.: The effect of 3 °C global warming on hail over Europe, Geophys. Res. Lett., 52, e2025GL114811, https://doi.org/10.1029/2025GL114811, 2025. a, b, c, d, e, f, g
Tonn, M., Wilhelm, J., and Kunz, M.: Evaluating Bunkers' storm motion of hail-producing supercells and their storm-relative helicity in Germany, Meteorol. Z., 32, 229–243, https://doi.org/10.1127/metz/2023/1165, 2023. a, b, c, d, e, f, g, h, i
Trapp, R. J., Woods, M. J., Lasher-Trapp, S. G., and Grover, M. A.: Alternative Implementations of the “Pseudo-Global-Warming” Methodology for Event-Based Simulations, J. Geophys. Res.-Atmos., 126, e2021JD035017, https://doi.org/10.1029/2021JD035017, 2021. a
Trapp, R. J., Lasher-Trapp, S. G., Claybrooke, R. D., and Romppainen-Martius, O.: A Storyline Climate-Change Attribution Study of a High-Impact Hailstorm in Switzerland, Geophys. Res. Lett., 52, e2025GL117142, https://doi.org/10.1029/2025GL117142, 2025. a
van Delden, A.: The synoptic setting of a thundery low and associated prefrontal squall line in western Europe, Meteorol. Atmos. Phys., 65, 113–131, https://doi.org/10.1007/BF01030272, 1998. a
Ventura, V., Paciorek, C. J., and Risbey, J. S.: Controlling the Proportion of Falsely Rejected Hypotheses when Conducting Multiple Tests with Climatological Data, J. Climate, 17, 4343–4356, https://doi.org/10.1175/3199.1, 2004. a
Wade, A. R. and Parker, M. D.: Dynamics of Simulated High-Shear, Low-CAPE Supercells, J. Atmos. Sci., 78, 1389–1410, https://doi.org/10.1175/JAS-D-20-0117.1, 2021. a, b
Wapler, K. and James, P.: Thunderstorm occurrence and characteristics in Central Europe under different synoptic conditions, Atmos. Res., 158-159, 231–244, https://doi.org/10.1016/j.atmosres.2014.07.011, 2014. a, b, c
Weisman, M. L., Skamarock, W. C., and Klemp, J. B.: The Resolution Dependence of Explicitly Modeled Convective Systems, Mon. Weather Rev., 125, 527–548, https://doi.org/10.1175/1520-0493(1997)125<0527:TRDOEM>2.0.CO;2, 1997. a
Weisman, M. L., Manning, K. W., Sobash, R. A., and Schwartz, C. S.: Simulations of Severe Convective Systems Using 1- versus 3-km Grid Spacing, Weather Forecast., 38, 401–423, https://doi.org/10.1175/WAF-D-22-0112.1, 2023. a
Wilhelm, L., Schwierz, C., Schröer, K., Taszarek, M., and Martius, O.: Reconstructing hail days in Switzerland with statistical models (1959–2022), Nat. Hazards Earth Syst. Sci., 24, 3869–3894, https://doi.org/10.5194/nhess-24-3869-2024, 2024. a
Zeeb, A. W., Allen, J. T., and Van Den Broeke, M.: Understanding left-moving supercells: Environmental factors and forecasting challenges, Weather Forecast., https://doi.org/10.1175/WAF-D-25-0153.1, 2026. a, b, c, d, e, f, g, h, i
Zeeb, A. W., Ashley, W. S., Haberlie, A. M., Gensini, V. A., and Michaelis, A. C.: Supercell precipitation contribution to the United States hydroclimate, Int. J. Climatol., 44, 1489–1512, https://doi.org/10.1002/joc.8395, 2024. a, b
Discrepancies with the changes shown in Feldmann et al. (2025a) are owed to computing the RM/LM fraction and their changes based on complete tracks, in comparison to all hourly detections, as done here. Changes in track duration and rotation persistence throughout the track cause these differences.