the Creative Commons Attribution 4.0 License.
the Creative Commons Attribution 4.0 License.
 | 11 May 2026
Impacts of orography and urbanization on extreme precipitation event in Beijing during 2023
Haobo Cui
Hongyong Yu
Xingshuo Zuo
The effects of urbanization and orographic uplift play significant roles in extreme precipitation events, and therefore in water management. In this study, the main impact factors in an extreme precipitation event that occurred during July 2023 in Beijing were analyzed, using the Weather Research and Forecasting (WRF) model. The results showed that the main cause of this precipitation event was the residual forces of Typhoon Doksuri combined with water vapor transported from the subtropical high. The orographic effect altered the spatial pattern of accumulated precipitation throughout the simulation period by changing the local circulation, as the accumulated precipitation in the southwestern mountainous regions increased by 229.4 mm (41.3 %), and the precipitation in the plain areas decreased by 83.6 mm (43.5 %). The impact of the underlying urban surface led to accumulated precipitation in the southwestern mountainous regions of Beijing decreasing by 88.1 mm (15.9 %). Further analysis showed that orographic features caused the uplift of air masses in the mountainous regions and prevented the low-pressure system from propagating, leading to significant enhancement of the convective intensity over Beijing and precipitation for a prolonged duration. The presence of urban surfaces contributed to reductions in the latent heat flux and wind speed, resulting in decreased energy transfer to the southwestern mountainous regions via easterly winds. This reduction in energy suppressed convective activity and subsequently led to a decrease in precipitation in these regions. As extreme precipitation events become more frequent, the comprehensive research into such events may help with prevention and the response to similar events in the future.
- Article
(22659 KB) - Full-text XML
-
Supplement
(2416 KB) - BibTeX
- EndNote


In the precipitation process, water vapor in the atmosphere condenses and falls to the Earth's surface in the form of liquid or solid as a crucial component of the global water cycle (Gimeno et al., 2010; Trenberth et al., 2003). Unlike other climatic variables, precipitation is typically discontinuous in a given location and its temporal distribution is uneven (Pendergrass and Knutti, 2018; Wu et al., 2021). Extreme precipitation events, characterized by high precipitation rates over short durations or prolonged accumulated precipitation, often result in natural disasters such as floods and landslides. These events can disrupt ecosystems, agricultural production, and cause significant economic damage and loss of life (Ayat et al., 2022; Mahoney, 2016; Yu et al., 2024). Therefore, extreme precipitation has become a major focus of research in weather and climate research (Dai et al., 2024; Li et al., 2024a; Sun et al., 2021; Zhang et al., 2022).
Orography is one of the most critical factors in land-air interaction, due to its capacity to alter precipitation patterns through a variety of complex processes (Smith, 2006). Mountains can modify the spatial distribution of precipitation by blocking and uplifting air masses to alter the atmospheric properties at different elevations on both the windward and leeward sides (Cornejo et al., 2024; Davolio et al., 2009; Lin et al., 2001; Wei et al., 2023). Meanwhile, orographic forcing can also influence the temperature and humidity of the lower atmosphere, which alters the distribution of convection by controlling the buoyancy of air masses to increase the moisture content over the foothills, thereby promoting precipitation in these regions (Du et al., 2020; Gao et al., 2021; Xia and Zhang, 2019; Yin et al., 2020; Nicolas and Boos, 2024). In addition, the thermodynamic contrast between mountainous regions and plains give rise to local thermal circulations, which is one of the key physical processes shaping the spatial distribution and diurnal variation of precipitation (Chen et al., 2014; He and Zhang, 2010). The altitude used in the numeric model can affect the regional water vapor flux, especially the channel of moisture in the lower and middle troposphere (Saurral et al., 2015). Therefore, the influence of orography is particularly significant for determining precipitation patterns in mountainous regions and surrounding plains.
Due to human activities, altered land use patterns caused by urbanization are another key factor that needs to be considered in extreme precipitation events (Dou et al., 2015; Niyogi et al., 2011; Huang et al., 2019). The emergence of urban areas has led to the development of unique urban canopies and urban boundary layers, giving rise to the urban heat island (UHI) effect, thereby causing convergence and upward lifting in the lower atmosphere (Bornstein and Lin, 2000; Hjelmfelt, 1982). The UHI effect can enhance boundary layer turbulence mixing by increasing the surface heat flux, therefore strengthen boundary layer instability and promote precipitation (Holst et al., 2016; Nie et al., 2017). This effect is especially significant for mesoscale and small-scale circulations and convection (Dixon and Mote, 2003; Oke, 1982; Yin et al., 2020; Zhang et al., 2017), which induces convective activity in urban and surrounding areas, and changes in precipitation patterns (Fu et al., 2024; Li et al., 2011; Yang et al., 2017). However, precipitation respond to urbanization varies under different degree of land use change climatic backgrounds (Wang et al., 2015). The “urban rain island” effect may be observed in some coastal cities with abundant moisture transport (Jauregui and Romales, 1996; Wang et al., 2018), whereas the depletion of moisture in the lower atmosphere caused by urban activities may lead to the “urban dry island” effect in relatively arid cities (Freitag et al., 2018; Wang and Gong, 2010). Therefore, the mechanisms that urbanization influences extreme precipitation events are complex, and further research are required to clarify the roles of cities in these events.
Beijing is located in the northwest of the North China Plain, where is the transitional zone between the Taihang Mountains, Yanshan Mountains, and North China Plain. It is an international metropolis with a population of over 10 million and its surrounding areas have experienced rapid urbanization since the 1980s. In recent years, Beijing and neighboring areas of Hebei and Tianjin have frequently experienced high-intensity extreme precipitation events during the summer months (Tewari et al., 2022; Yu et al., 2017; Zhang et al., 2013; Zhong et al., 2015). Some previous studies have provided evidence of increases in the frequency of extreme precipitation events in large cities (Liang and Ding, 2017), and Beijing is a representative region for studying these events.
In this study, an extreme precipitation event that occurred in Beijing from 29 July to 2 August 2023 was analyzed, using the Weather Research and Forecasting model (WRF). The accumulated precipitation distribution had a clear pattern, with higher amounts in the southwestern mountainous areas and lower amounts in the northeastern regions. Therefore, both the orographic effect and urban land use could have potentially influences to the precipitation spatial pattern, which were assessed by the comparisons of several experiment schemes. The causes of the event and the related mechanisms were examined, by quantifying the effects of orography, land use, and other factors on the precipitation event.
2.1 Study Area and Precipitation Event
The present study focused on the “23 ⋅ 7” precipitation event that occurred in Beijing area (shown in region D04 in Fig. 1) during July 2023. From 29 July to 2 August 2023, a severe and prolonged heavy rainfall event affected Beijing and neighboring areas of Tianjin and Hebei. This event was driven by the residual forces of Typhoon Doksuri moving northward combined with the water vapor transported from the subtropical high. The average precipitation in the Beijing region exceeded 300 mm, where the most affected areas, including Fangshan and Mentougou districts, recorded average accumulated rainfall amounts greater than 500 mm (Li et al., 2024b). The rainstorm also triggered severe flooding and urban waterlogging, resulting in significant damage to infrastructure and property across the entire region.
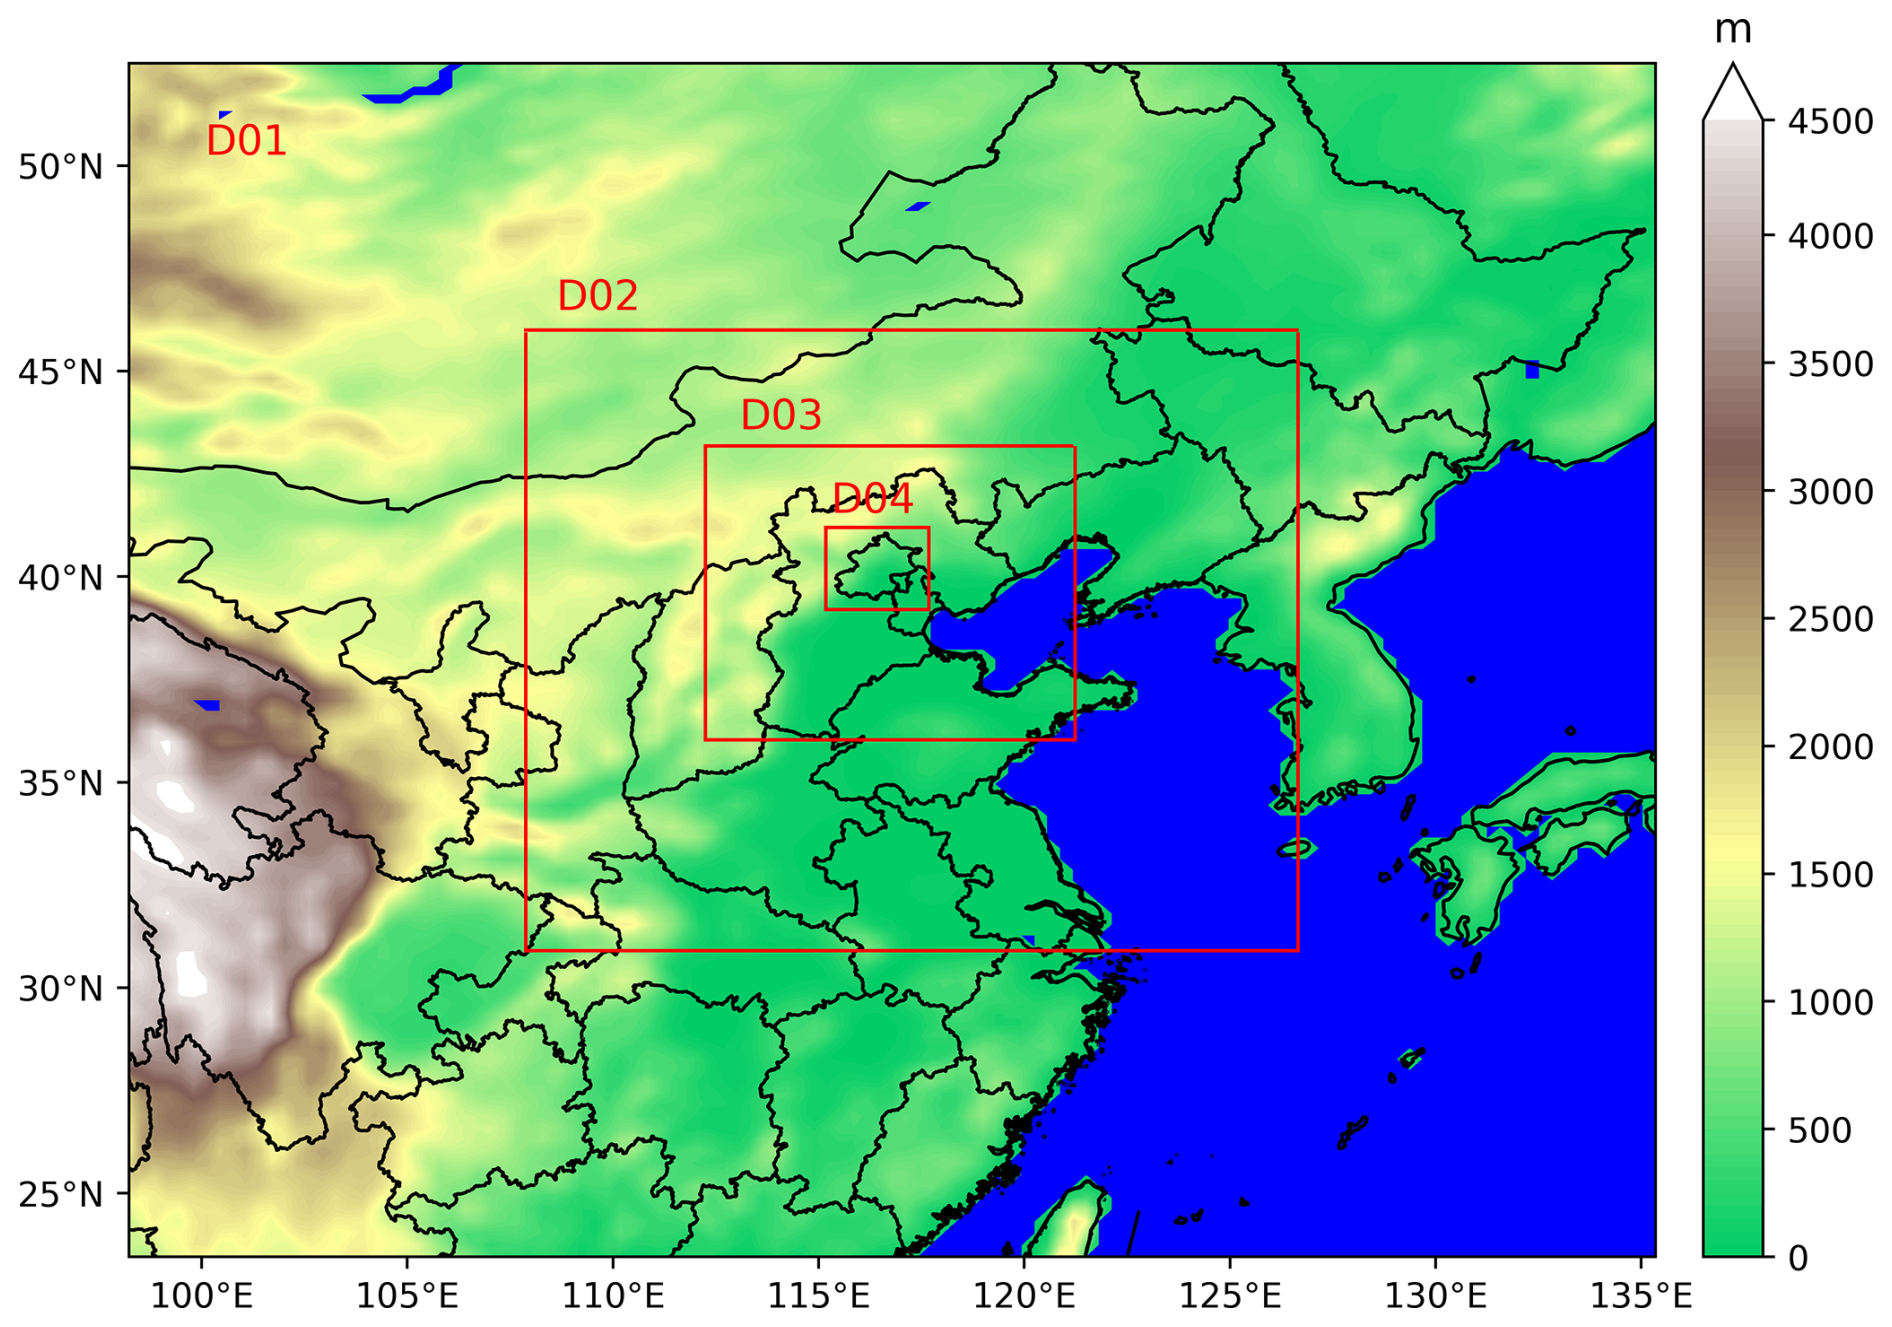
Figure 1Study area and domains of the numerical model. The coordinates of the different domains are as follows: D01: 98.23 to 135.35° E, 23.45 to 52.49° N; D02: 107.88 to 126.65° E, 30.91 to 46.00° N; D03: 112.25 to 121.23° E, 36.04 to 43.19° N; D04: 115.17 to 117.68° E, 39.21 to 41.20° N. The grid spacing for each domain is 27, 9, 3, and 1 km, respectively.
2.2 Data Descriptions
In the experiment, ERA5 global reanalysis data were used to provide initial and boundary conditions for the WRF model (Hersbach et al., 2020). The data selected for this study has a temporal resolution of 1 h and a spatial resolution of 0.25° × 0.25°. To investigate the impact of land use in the simulation, updated land use data were used to replace the default one within the WRF model. The data used in this study were acquired from the Moderate-resolution Imaging Spectroradiometer (MODIS) MCD12Q1 V6 product for the year of 2020, with a spatial resolution of 500 m (Friedl and Sulla-Menashe, 2019).
The gauge observations used to verify the model simulation on single points were from the China Meteorological Administration (version 2.0; http://data.cma.cn/en/?r=data/detail&dataCode=A.0012.0001, last access: 30 October 2024). There are totally 37 stations in the D04 area, shown in Fig. 2a. Due to the scarcity of meteorological stations, the observations were compared with the model outputs on the grid that the meteorological stations located in. In order to evaluate the quality of simulated precipitation depending on terrain, the stations with altitude greater or smaller than 100 m are divided into mountainous stations and plain stations, which have 10 and 27 stations respectively.
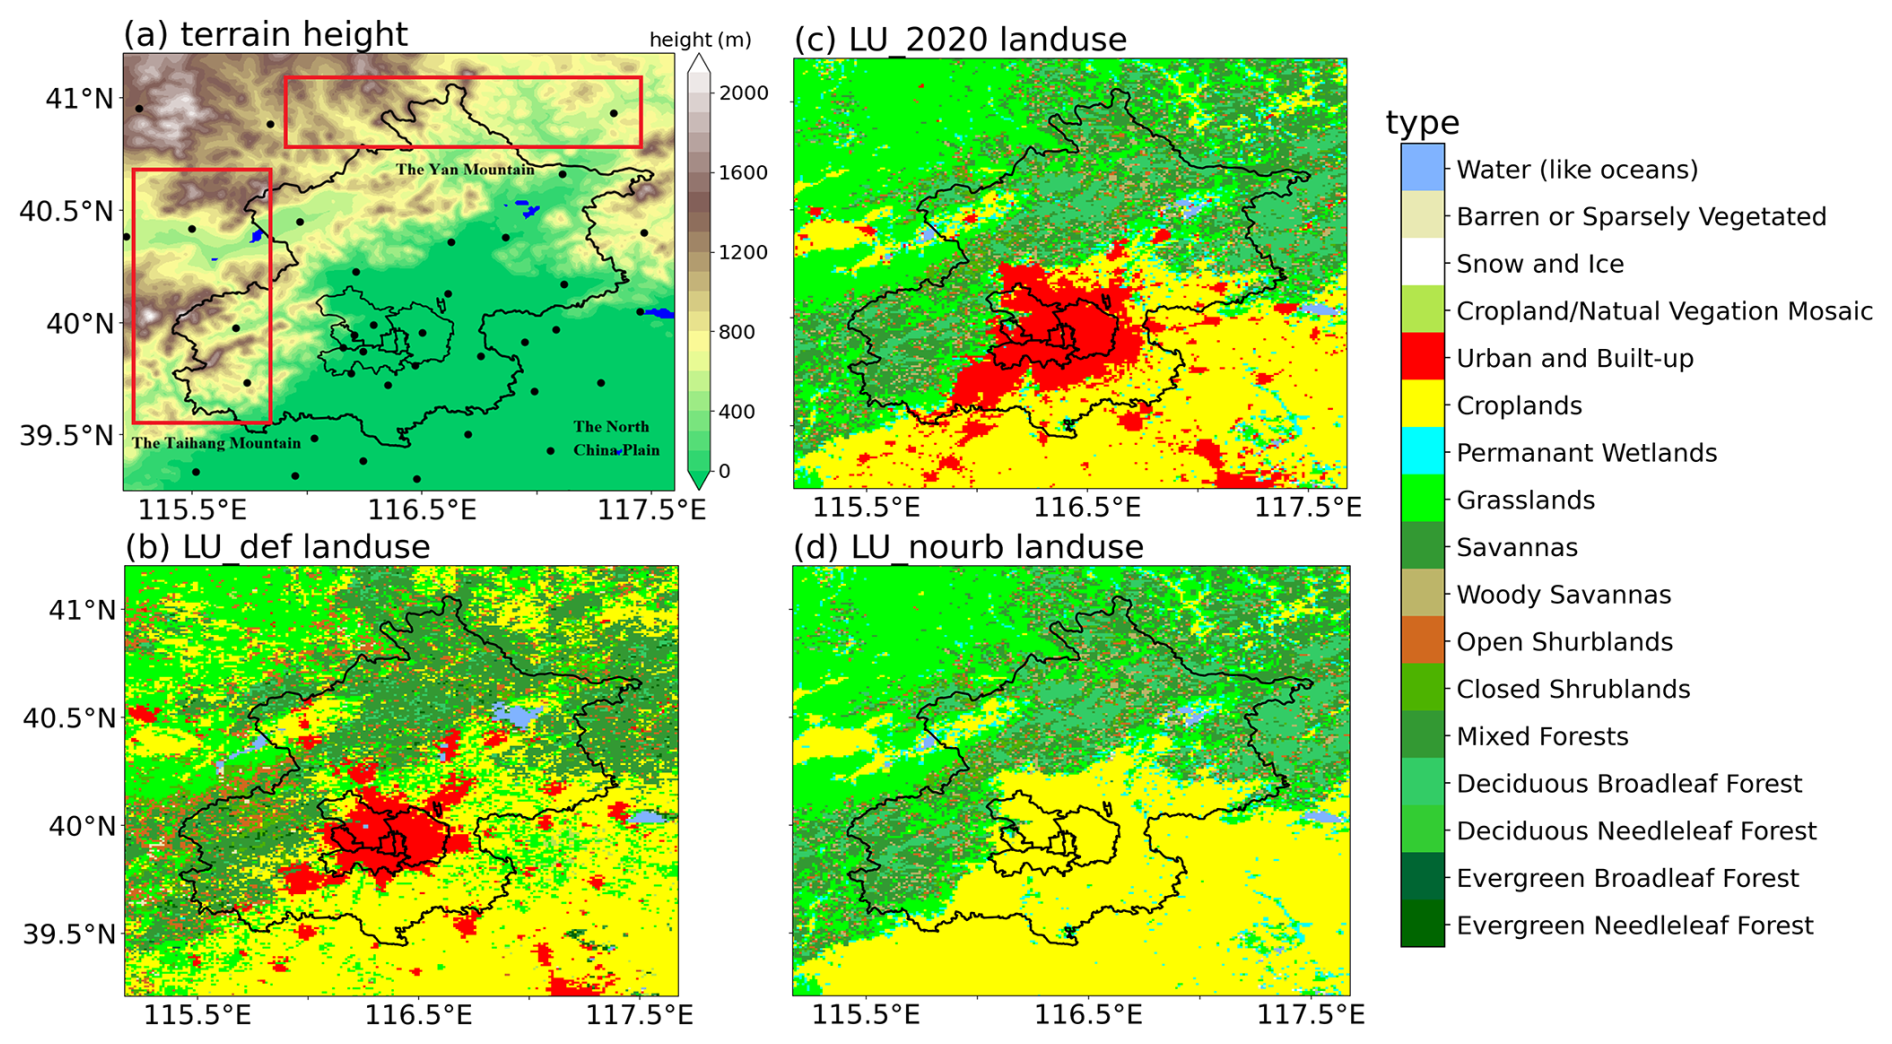
Figure 2Terrain elevation and land use types in domain D04 in the experiment. (a) Terrain elevation in region D04. The dots represent the locations of meteorological stations used in this study. (b) Default land use types in region D04. (c) Land use types of 2020 in region D04 after replacement. (d) Land use types in region D04 with urban areas replaced by cropland.
The analysis involves the movement and spatial variability of extreme precipitation systems, which cannot be adequately captured by meteorological observation stations. Alternatively, satellite-derived precipitation products are commonly used and have reliabilities in estimating spatial precipitation distribution (Bhattarai and Talchabhadel, 2024). Among them, the Climate Prediction Center Morphing technique (CMORPH) product can offer high temporal and spatial resolution and has demonstrated advantages in capturing extreme precipitation patterns (Liu et al., 2022), which has been validated over China in previous studies (Ebert et al., 2007; Jiang et al., 2016; Sun et al., 2016). CMORPH data based on a combination of microwave and infrared precipitation data provide high temporal and spatial resolution global precipitation data (Joyce et al., 2004), and is highly reasonable to be used to validate the simulation results. In this study, CMORPH data with a temporal resolution of 30 min and spatial resolution of 8 km × 8 km were used for precipitation validation.
2.3 Model Description and Experimental Design
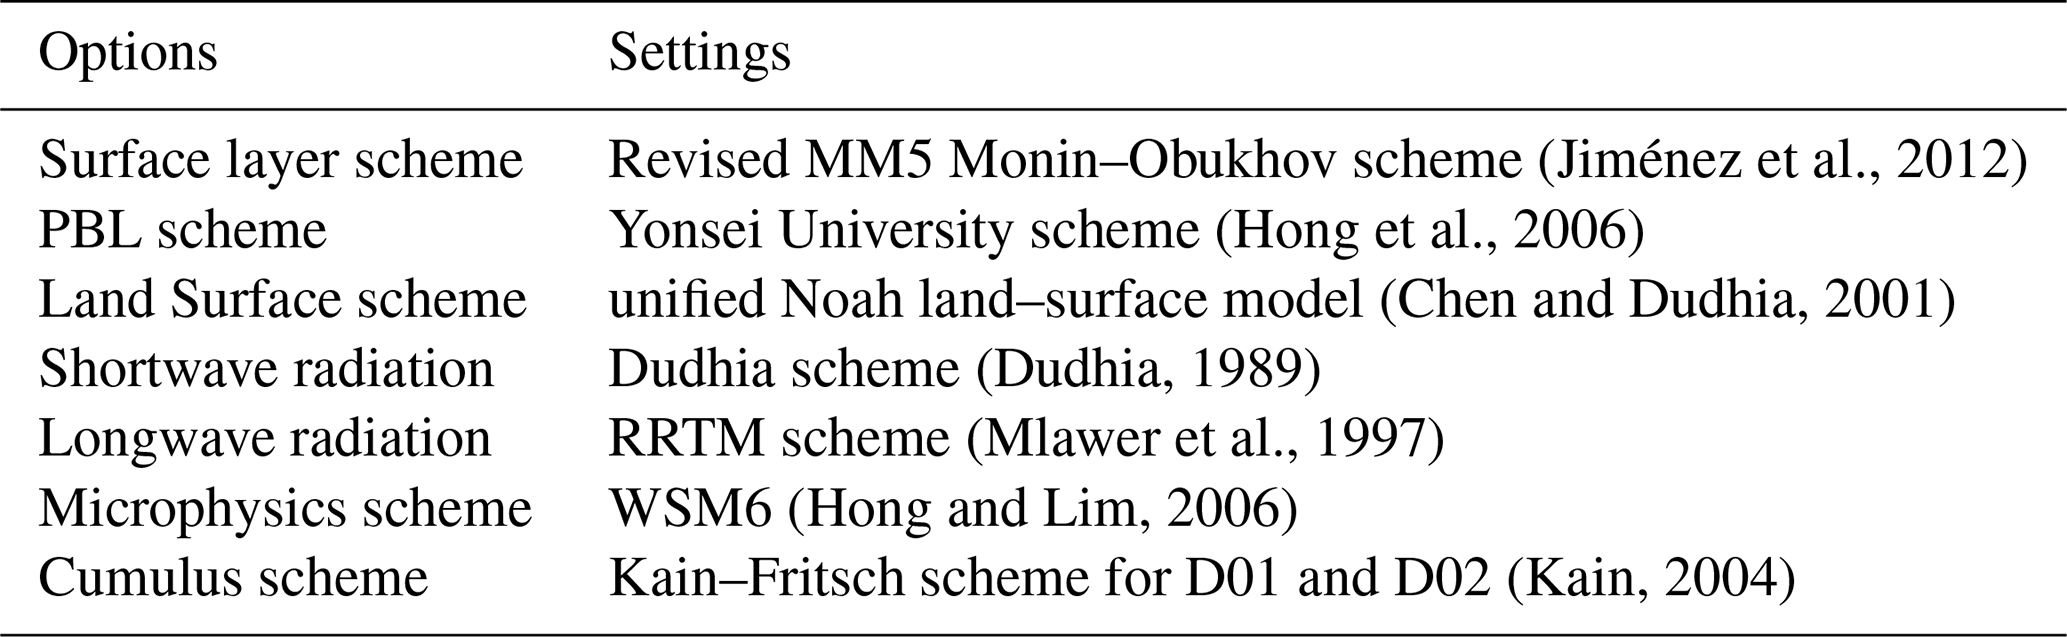
WRF model version 4.5.1 was selected as the numerical simulation tool for this study (Skamarock et al., 2019). The simulation period covered from 00:00 UTC 28 July 2023 to 00:00 UTC 2 August 2023, while the first 24 h were used for model spin-up. A four-level nested domain was utilized with grid spacing (grid number) of 27 km (120 × 122), 9 km (181 × 187), 3 km (259 × 268), and 1 km (217 × 226). Domain D01 covered most of central and eastern China, and domain D04 was focused on the Beijing region (Fig. 1). In addition, 49 vertical layers were employed in the simulation and the upper boundary was set at 50 hPa to resolve the vertical structure of the subtropical high and upper-level jet streams while minimizing spurious wave reflection near the upper boundary (Wang et al., 2018; Yu et al., 2024; Pei et al., 2025). The physical packages used are summarized in Table 1. To ensure that the large-scale circulation in the experiment closely matched the ERA5 input data for accurate results, spectral nudging was applied to the D01 domain in terms of the zonal and meridional wind, temperature, and specific humidity (Miguez-Macho et al., 2004; Spero et al., 2014). The assimilation coefficient was set to 3 × 10⁻⁴ s−1 suggested in other previous researches (Liu et al., 2012; Holst et al., 2016; Ma et al., 2016; Pei et al., 2025), and the cut-off wave number was set to 3 in both the zonal and meridional directions as the length-scale is more accurate at 1000 km (Gómez and Miguez-Macho, 2017; Kukulies et al., 2023). The hourly output for region D04 was used in the following analysis.
To improve the accuracy when simulating the impacts of urban areas on the precipitation event, the single-layer urban canopy model (Chen et al., 2011) was used to enhance the accurate simulation of the evolution of dynamic and thermodynamic processes in urban environments (Yu and Liu, 2015; He et al., 2023). Different sensitivity test groups were set-up to explore the effects of land use and orography on the precipitation event, and the differences between these test groups were analyzed. The default land use types in WRF (represented as LU_def in Fig. 2b) were replaced with land use data from the MODIS MCD12Q1 V6 product for the year 2020 (represented as LU_2020 in Fig. 2c).
To explore the impact of orography, based on the LU_2020 scheme, areas in domain D03 and D04 with elevations greater than 100 m were set to 100 m (represented as LU_nohgt) in order to explore the impacts of the Taihang and Yan Mountains on precipitation. In addition, urban areas in the land use data in D04 were replaced with cropland (represented as LU_nourb in Fig. 2d) to examine the results in the absence of urban surface effects.
2.4 Verification Statistics
To investigate the impacts of land use changes on the simulation results, the accumulated precipitation, precipitation intensity from LU_2020 simulations with validated data were analyzed. The following evaluation metrics were used for validation: mean absolute error (MAE), root mean square error (RMSE), and correlation coefficient (R). The specific formulas for these metrics are as follows:
where Si and Oi are the simulated and observed values, respectively; and are the average values of the simulated and validated data, respectively; and n is the number of grid points.
3.1 Evolution of the Precipitation Event
As shown in Fig. 3, the remnant low of Typhoon Doksuri maintained considerable intensity at the 500 hPa level on 29 July, with its center located near 112–114° E, 32–34° N. At this time, the main body of the Western Pacific Subtropical High (WPSH) was situated along the eastern coastal region of China and the adjacent seas, with the westernmost position of the 5880 gpm geopotential height contour around 118° E, indicating its limited westward extension. The Beijing area was primarily located within the weakly influenced northwestern periphery of the WPSH, where low-level moisture transport was relatively weak and heavy precipitation had not developed.
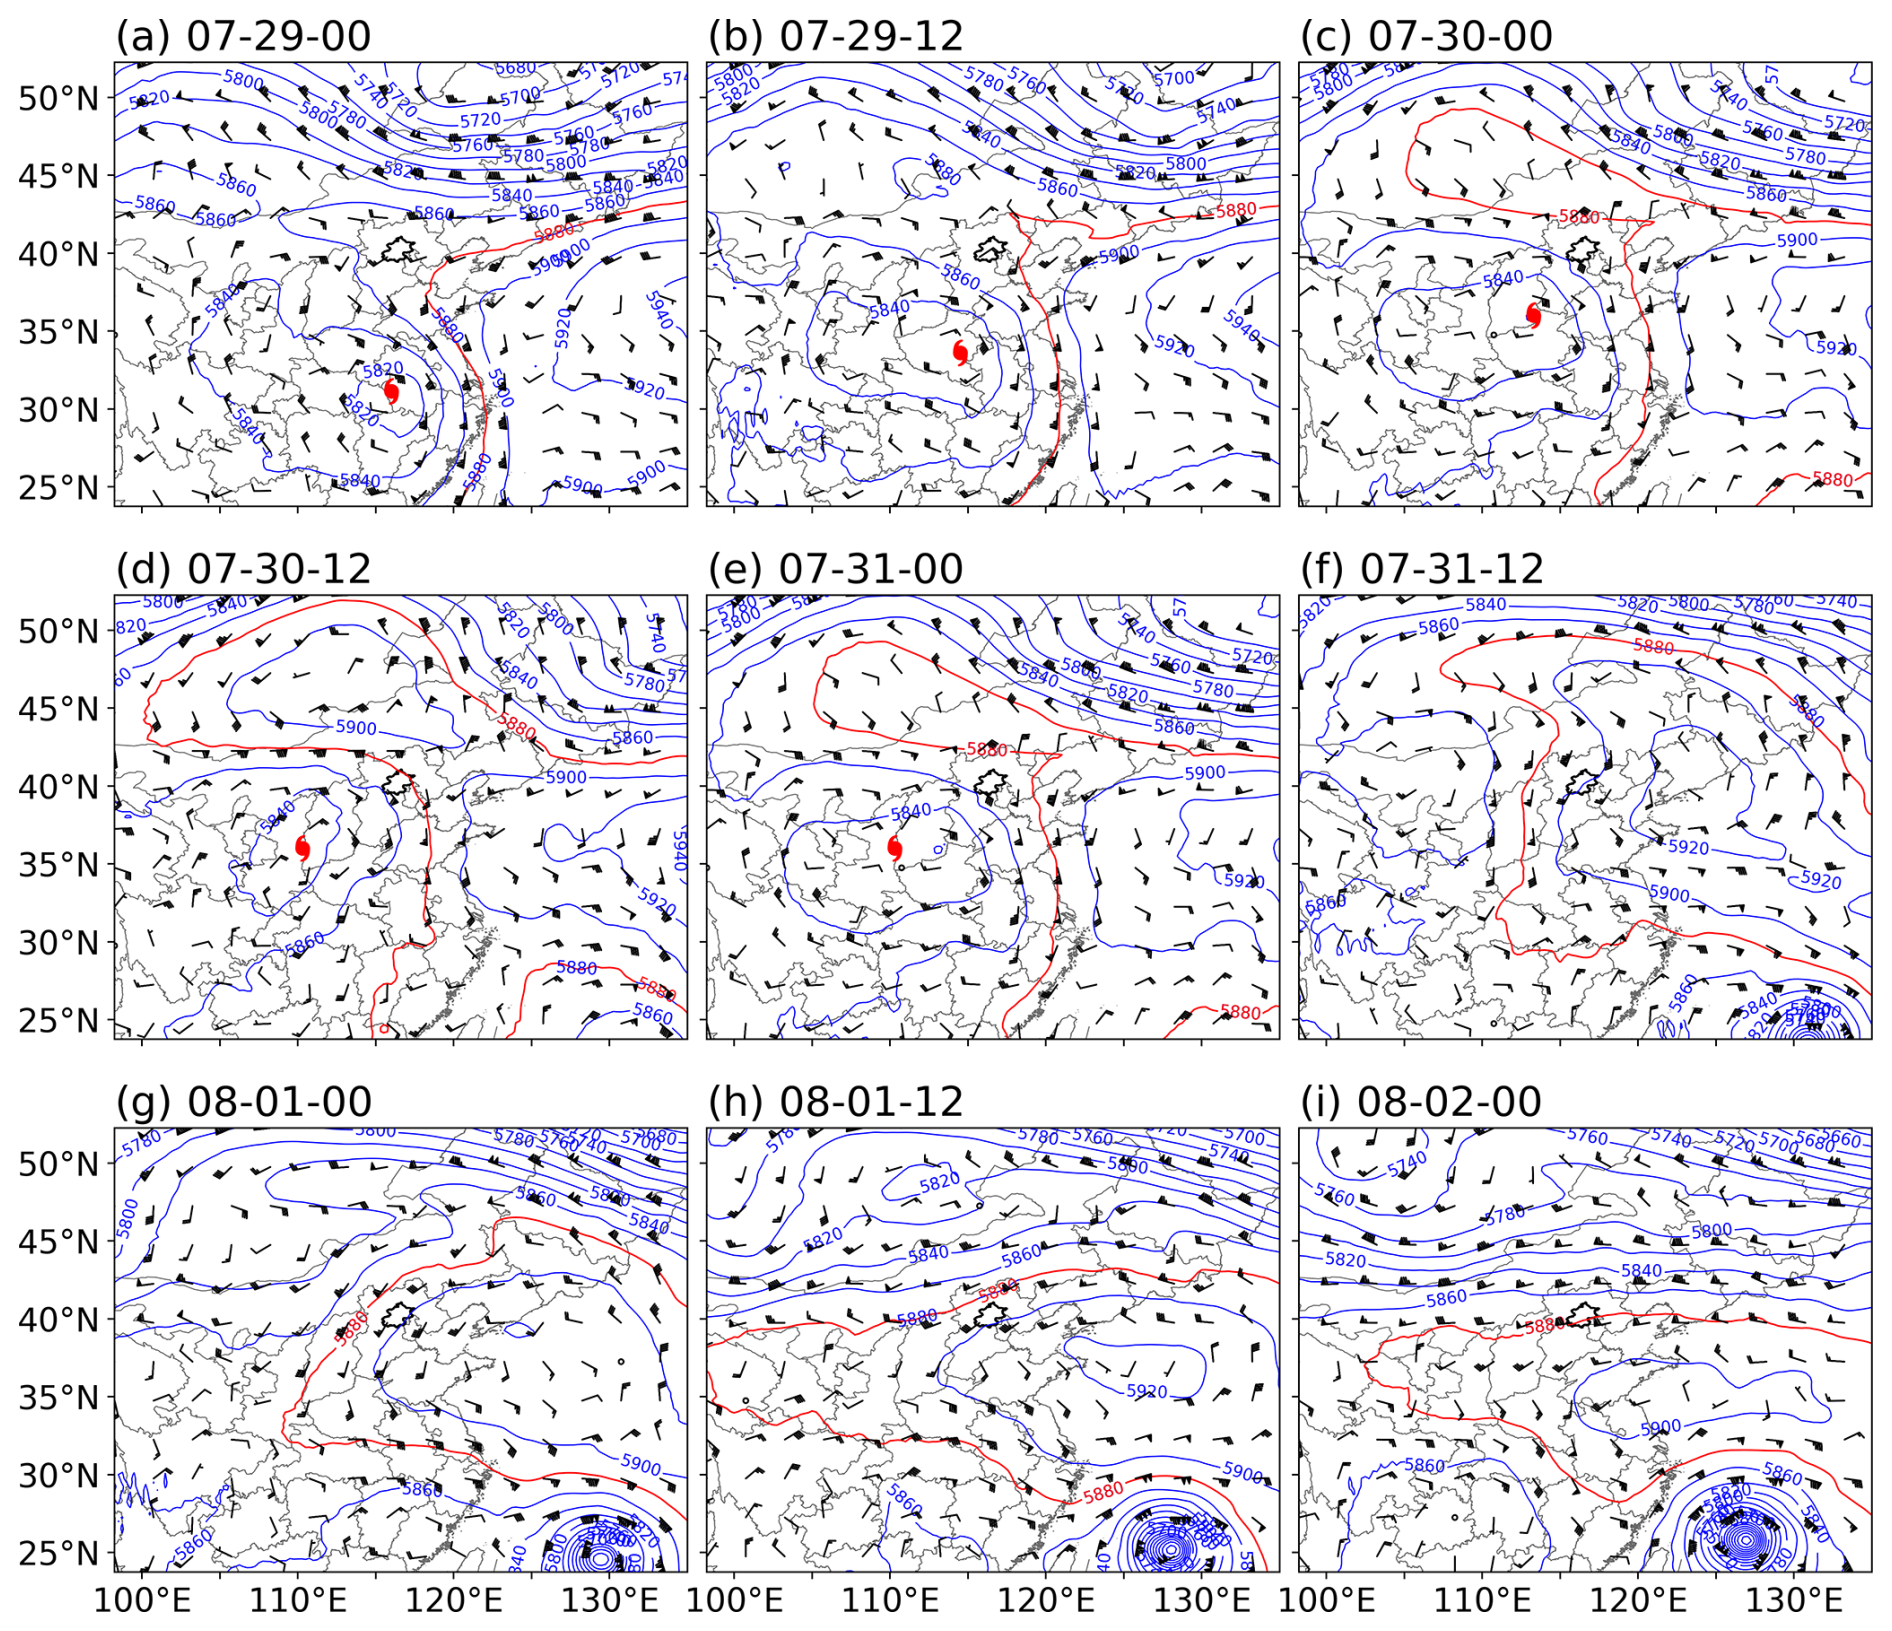
Figure 3500 hPa circulation pattern for the precipitation event (source: ERA5). The blue solid lines represent geopotential height contours; the red solid contours represent position of subtropical high; the typhoon symbols in panels (a)–(e) represent residual circulation center of typhoon Doksuri.
By 30 July, the WPSH had extended westward, with the 5880 gpm contour reaching approximately 105–110° E and stretching northward to Mongolia. It thereby established a relatively stable high-pressure ridge to the north of the Doksuri remnant low and formed a typical blocking circulation pattern. Consequently, the center of the remnant low oscillated slightly within 112–115° E and 33–35° N, illustrating a pronounced quasi-stationary state that persisted until around 12:00 UTC 31 July. During this period, Beijing was located between the southern of the blocking high and the northern of the remnant low. This configuration was favorable for sustained southeast flow and continuous moisture toward Beijing area.
After 12:00 UTC 31 July, the remnant low of Doksuri gradually weakened and shifted slightly westward, while the blocking high also began to decay. Meanwhile, Typhoon Khanun over the offshore waters of China (Fig. 3f–i) established a strong cyclonic circulation on its northwestern side, further enhancing moisture transport into North China. It greatly increased precipitable water, thereby triggered the heavy precipitation event between 12:00 UTC 31 July and 00:00 UTC 1 August. Then, the WPSH further intensified and continued to westward extension, with the 5880 gpm contour maintained at the west of 108° E. The western ridge of the strengthened WPSH subsequently blocked the moisture transport pathway from Typhoon Khanun toward North China, leading to a pronounced reduction in the moisture transportation. The precipitation process then gradually weakened and terminated.
The differences among the experimental groups are mainly reflected in the local circulation. A comparison of Figs. S1 and S2 shows that the removal of terrain elevation exerts a noticeable influence on the circulation associated with the remnant low-pressure system. In the absence of the orographic blocking effect of the Taihang Mountains, the remnant low of Typhoon Doksuri continued to move northward and prolonged the duration of the low-pressure circulation. Consequently, the changed dynamical and thermal conditions over the Beijing region were prone to alter the spatiotemporal distribution of precipitation. In comparison, the differences between Figs. S1 and S3 indicate that urban underlying surface has a relatively weak effect on the large-scale circulation. It resulted in the reduction of the regional surface roughness and an increase in wind speed over Beijing area. In addition, the dissipation time of the remnant low circulation in the LU_nourb scheme is slightly prolonged due to the reduction of anthropogenic heat. Therefore, the large-scale circulation pattern in the LU_nohgt and LU_nourb schemes are generally similar to LU_2020. This suggests that the differences in simulated precipitation are primarily induced by the changes in local circulation.
3.2 Analysis of Variations in Precipitation
3.2.1 Impacts of Updated Land Use Data
The simulated precipitation was compared with meteorological station observations and satellite products to evaluate the accuracy of the model outputs. It was found that, the maximum observed precipitation is 772.2 mm, which was comparable with the simulation result of approximate 800.0 mm. The average precipitation amount was 237.0 mm for all the station observations during this precipitation event, and the average simulated value on the grid where the station located in is 228.4 mm. Therefore, the magnitudes were comparable between model simulation and observation on the stations.
The CMORPH data were used to further verify the spatial distribution of precipitation on D04 region. As shown in Fig. 4a–b, the spatial distributions of accumulated precipitation were similar, with higher precipitation in the southwestern mountainous areas and lower precipitation in the northeastern region. This illustrated that the pattern of LU_2020 scheme closely matched the accumulated precipitation distribution obtained by CMORPH, which was slightly higher than 700 mm. The simulated average precipitation intensity results also matched closely with the spatial distribution of CMORPH (Fig. 4c–d) although LU_2020 slightly underestimated the precipitation intensity (Fig. 4e). Thus, the WRF simulation results provided a reasonable representation of the overall precipitation event, and the LU_2020 simulation results were used to analyze the differences due to orography and land use. The correlation coefficient of the plain areas shows a smaller value (R = 0.56) compared with mountain areas (R = 0.81). For the result of MAE and RMSE, the statistics in the plain areas are smaller than those in the mountainous areas and the entire study region (Table 2). This may be due to that there are more stations in the plain areas, and the precipitation is smaller than mountain areas.
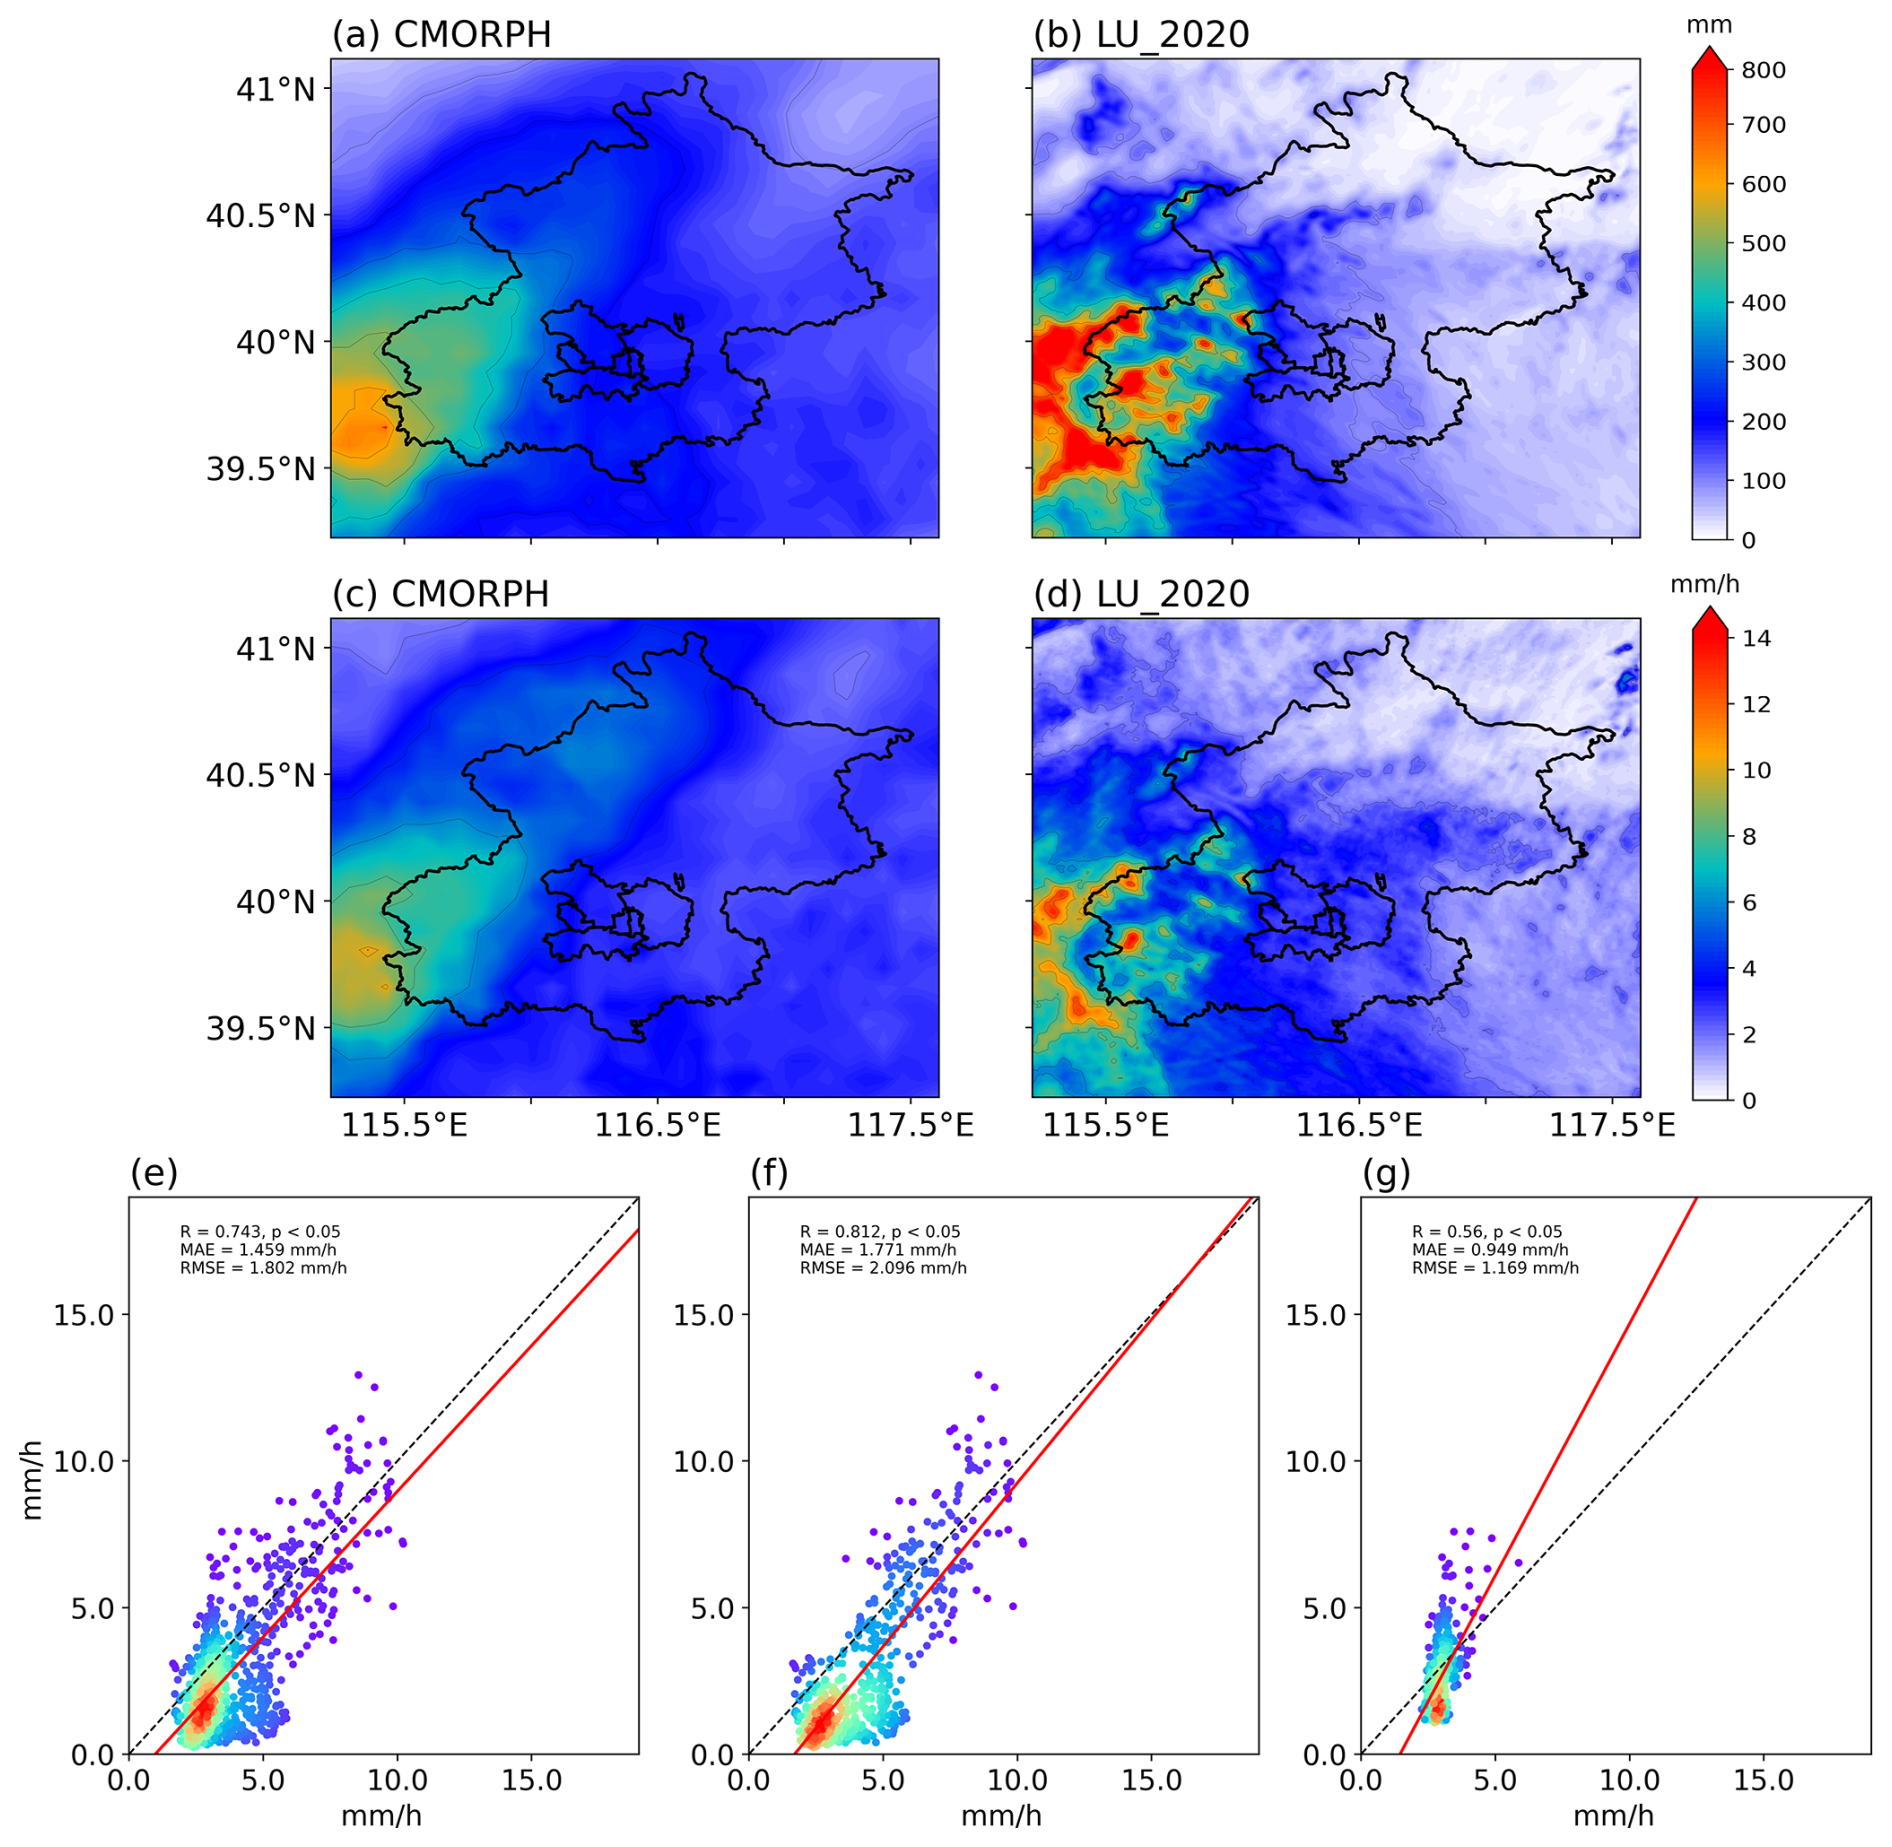
Figure 4Comparison of simulated and validated precipitation: (a, b) accumulated precipitation for CMORPH and LU_2020, respectively; (c, d) average precipitation intensity for CMORPH and LU_2020; and (e) scatter plots for the precipitation intensity for CMORPH in x axis and LU_2020 in y axis, while the red line represents the linear regression; (f, g) representing area where terrain height greater and smaller than 100 m.
Table 2Statistics of the precipitation intensity between simulation and CMORPH data.
In addition, the model uncertainty was further accessed using an ensemble simulation of LU_2020 scheme, where are originated from 10 ensemble members of ERA5. They provide estimates of the short-range forecast uncertainty, and can be considered to represent the evolution of the errors in the high-resolution component of ERA5 (Hersbach et al., 2020). The results show that there is slightly difference between the ensemble mean simulation and our experimental results (Fig. S4). Statistically, the average precipitation intensity is 3.6 mm h−1 for LU_2020 scheme and 4.1 mm h−1 for the ensemble mean. The RMSE and MAE of precipitation intensity is 1.17 mm h−1 and 0.86 mm h−1 for the two simulation results and the correlation coefficient is 0.90. Therefore, the experimental scheme and simulation results in this study are convincing.
3.2.2 Impacts of Orography
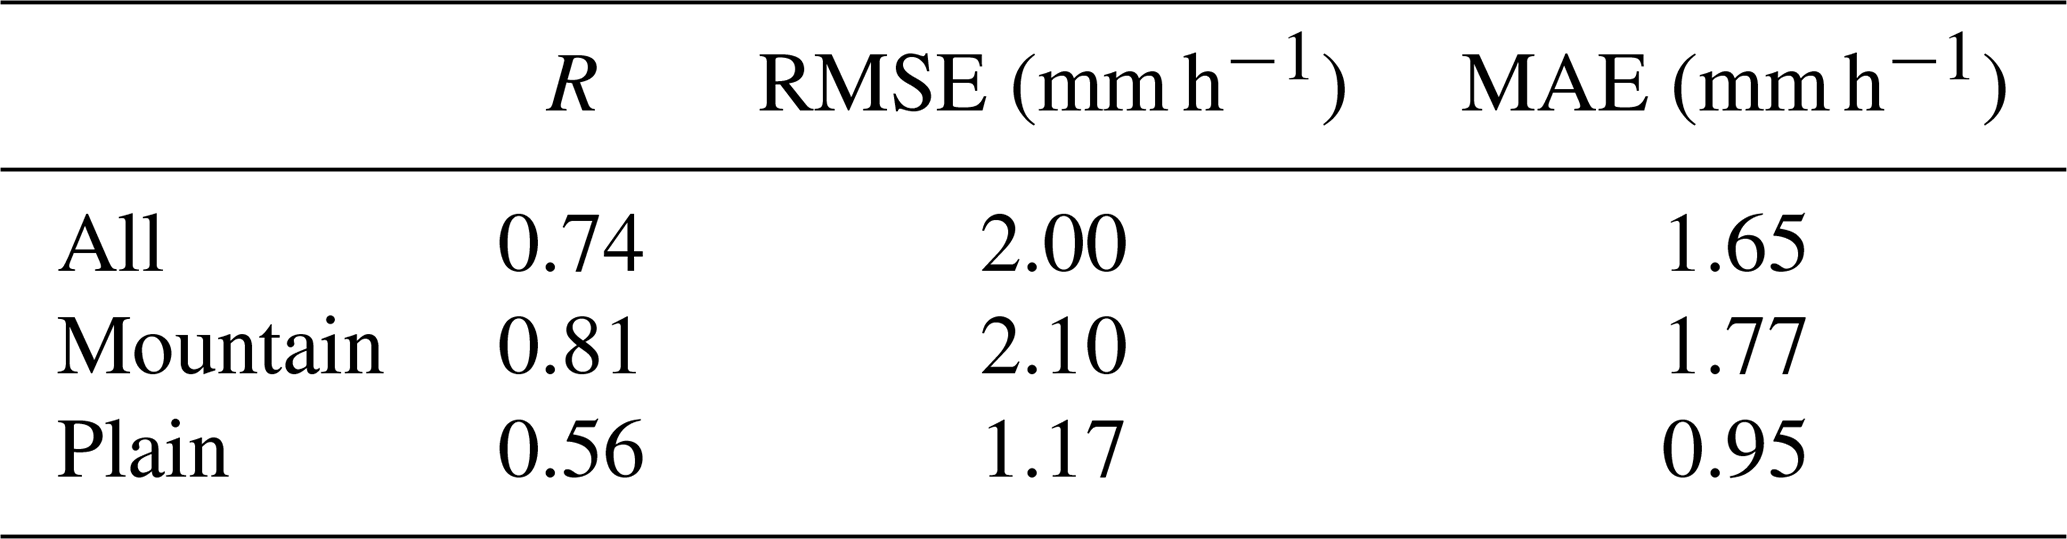
Figure 5a and c show the spatial distributions of the average precipitation intensity and accumulated precipitation before and after removing the orography. It illustrated that the removal of terrain elevation indeed significantly altered the spatial pattern of accumulated precipitation throughout the simulation period. Compared to the LU_2020 scheme, the LU_nohgt exhibited a marked decrease in cumulative precipitation over the southwestern portion of D04 area. The accumulated precipitation was 229.4 mm higher in LU_nohgt, accounting for over 41.3 % of the total precipitation. In contrast, in the central urban and northern regions of Beijing, the total precipitation was 83.6 mm lower, representing 43.5 % of the total precipitation. This is primarily attributed to the removal of the Taihang mountainous region. As the blocking effect caused by mountain on the remnant circulation was greatly diminished. This allowed low-pressure system persist a long period within Beijing region and facilitated its northward progression. The lack of orographic lifting ultimately leads to different precipitation distributions over the Beijing region.
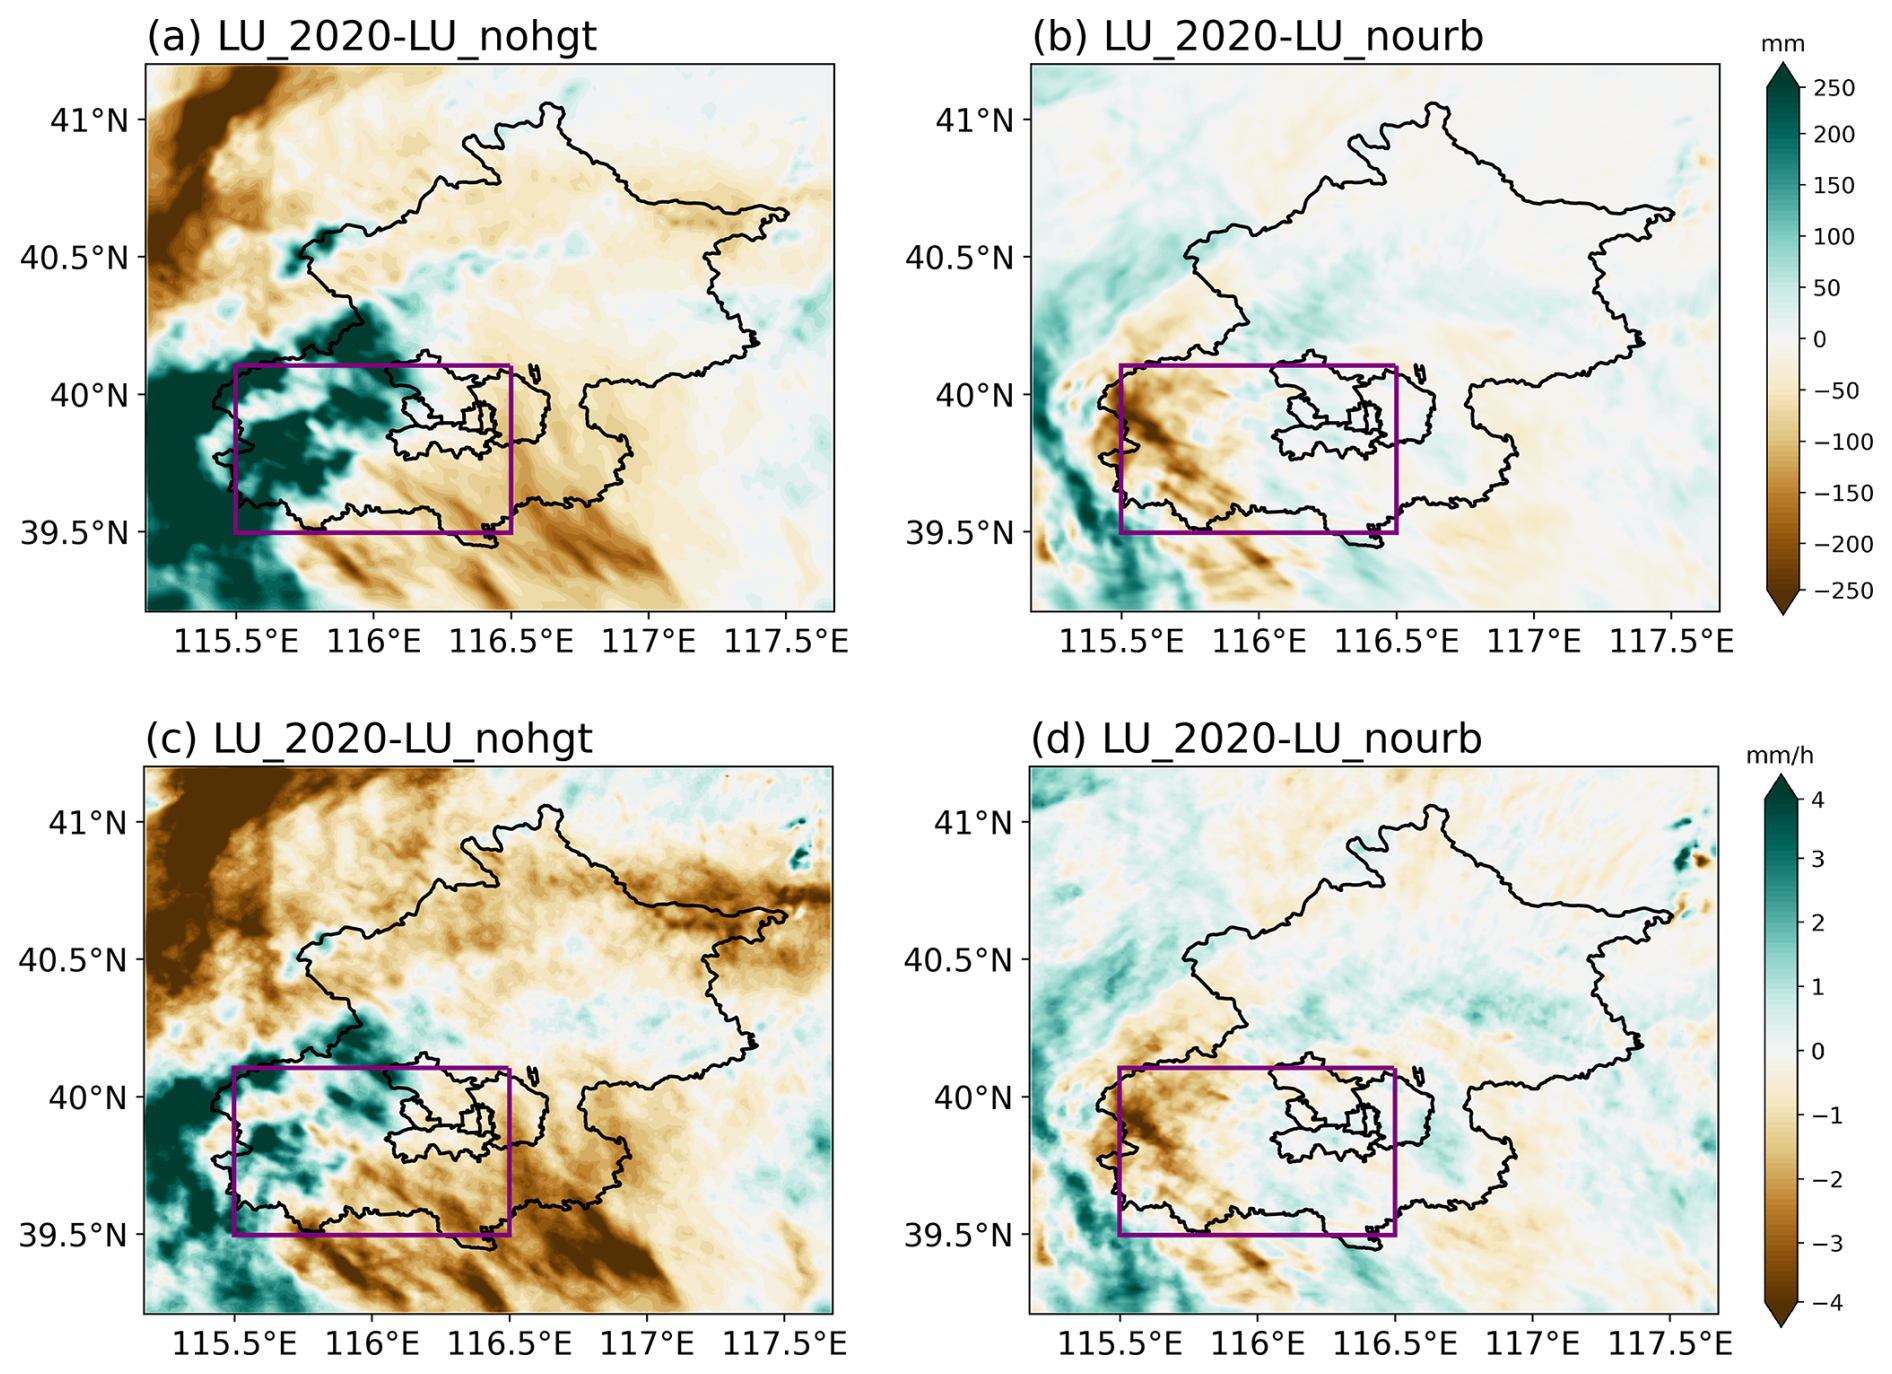
Figure 5Effects of terrain and urban underlying surface changes on accumulated precipitation and average precipitation intensity from 00:00 UTC 29 July to 00:00 UTC 2 August: panels (a) and (c) are differences in accumulated precipitation and average precipitation intensity between the simulation using 2020 land use data and the scheme where terrain higher than 100 m was removed; panels (b) and (d) are differences in accumulated precipitation and average precipitation intensity between the simulation using 2020 land use data and the scheme where urban land use was removed. The purple area (RegP) indicates the region in Beijing where the difference in precipitation was significant.
Figure 6a and b show the changes in precipitation for each time period at the central latitudes between 39.5 and 40.1° N. From 00:00 to 10:00 UTC on 30 July, precipitation primarily occurred in the transition zone between the city and mountains, where the terrain features caused heavy precipitation in the mountainous areas in the morning during this period. From 31 July to 12:00 UTC on 1 August, precipitation mainly occurred in the mountainous areas, and the impact of orography became more significant. In the LU_nohgt scheme, precipitation in the mountainous areas stopped around 12:00 UTC on 31 July, whereas in the LU_2020 scheme, precipitation continued until around 00:00 UTC on 1 August, i.e., 12 h longer. Thus, the orography had a significant impact on the second phase of precipitation. In terms of the precipitation intensity and distribution, the presence of the orography altered the timing of heavy precipitation in the mountainous areas and intensified the precipitation in the central urban area around 12:00 UTC on 31 July.
Figure 6Hovmöller diagrams from 00:00 UTC 29 July to 00:00 UTC 2 August for the three experimental groups: (a) LU_2020 scheme, (b) LU_nohgt scheme, and (c) LU_nourb scheme, within the range of 39.8–40.1° N. Terrain heights at corresponding latitudes are shown.
3.2.3 Impacts of Land Use
Figure 5b and d show the impact of the urban land surface compared with removal of the urban land surface. The spatial distributions of the average precipitation intensity and accumulated precipitation were quite similar between LU_2020 and LU_nourb, with no significant difference in the overall precipitation pattern. The presence of urban areas did not significantly affect the central urban region of Beijing. However, in the southwestern mountainous region of Beijing, the average accumulated precipitation was 88.1 mm lower (the total precipitation was 15.9 % lower).
Figure 6a and c show the variations in precipitation with longitude and time for the central urban region corresponding to the central latitude. From 00:00 to 10:00 UTC on 30 July, the range and intensity of precipitation differed little between the city and the mountain transition zone, indicating that changes in land use had minor effects during this period. From 31 July to 12:00 UTC on 1 August, the overall total precipitation was lower in the LU_2020 scheme, although more precipitation occasionally occurred in the western part of the city in the LU_2020 scheme compared with the LU_nourb scheme. There was no significant difference in the duration of precipitation between the two experimental groups.
Therefore, during the precipitation event, both orography and land use altered the precipitation pattern, where the most significant changes in precipitation occurred in the southwestern part of Beijing. To understand the main causes of the differences in precipitation, the region in purple box in Fig. 5 was selected for more detailed analysis of the underlying mechanism as it was affected most by the land surface (referred to as RegP hereinafter). In addition, due to the prolonged nature of the event, three time periods with notable differences in the precipitation distribution were selected for further mechanistic analysis to explore the effects of orography and land use on the event. The three periods of interest were: 01:00–04:00 UTC on 30 July (referred to as T1), 03:00–06:00 UTC on 31 July (referred to as T2), and 12:00–15:00 UTC on 31 July (referred to as T3).
3.3 Physical Mechanism
3.3.1 Energy and Water Vapor Budget Comparison
The energy and water vapor fluxes were compared among different experimental groups. As shown in Fig. 7, all experimental groups exhibited distinct diurnal variations, with significant increases in both the sensible heat flux and latent heat flux after 00:00 UTC 1 August. This phenomenon was mainly due to the end of the extreme precipitation event, where the increased surface energy input strengthened both the sensible and latent heat fluxes. In RegP, both the sensible and latent heat fluxes were slightly higher than the regional averages. The orographic effects on the latent heat flux were more pronounced, especially during periods T1 and T2 (Table 3), as the removal of orographic features lead to an increase in both surface pressure and temperature for the high elevated regions. It enhances near-surface humidity and alters the latent heat flux across the region. The relatively lower latent heat flux observed in LU_nohgt during period T3 could be attributed to the extended duration of the precipitation event, which was caused by the removal of orography.
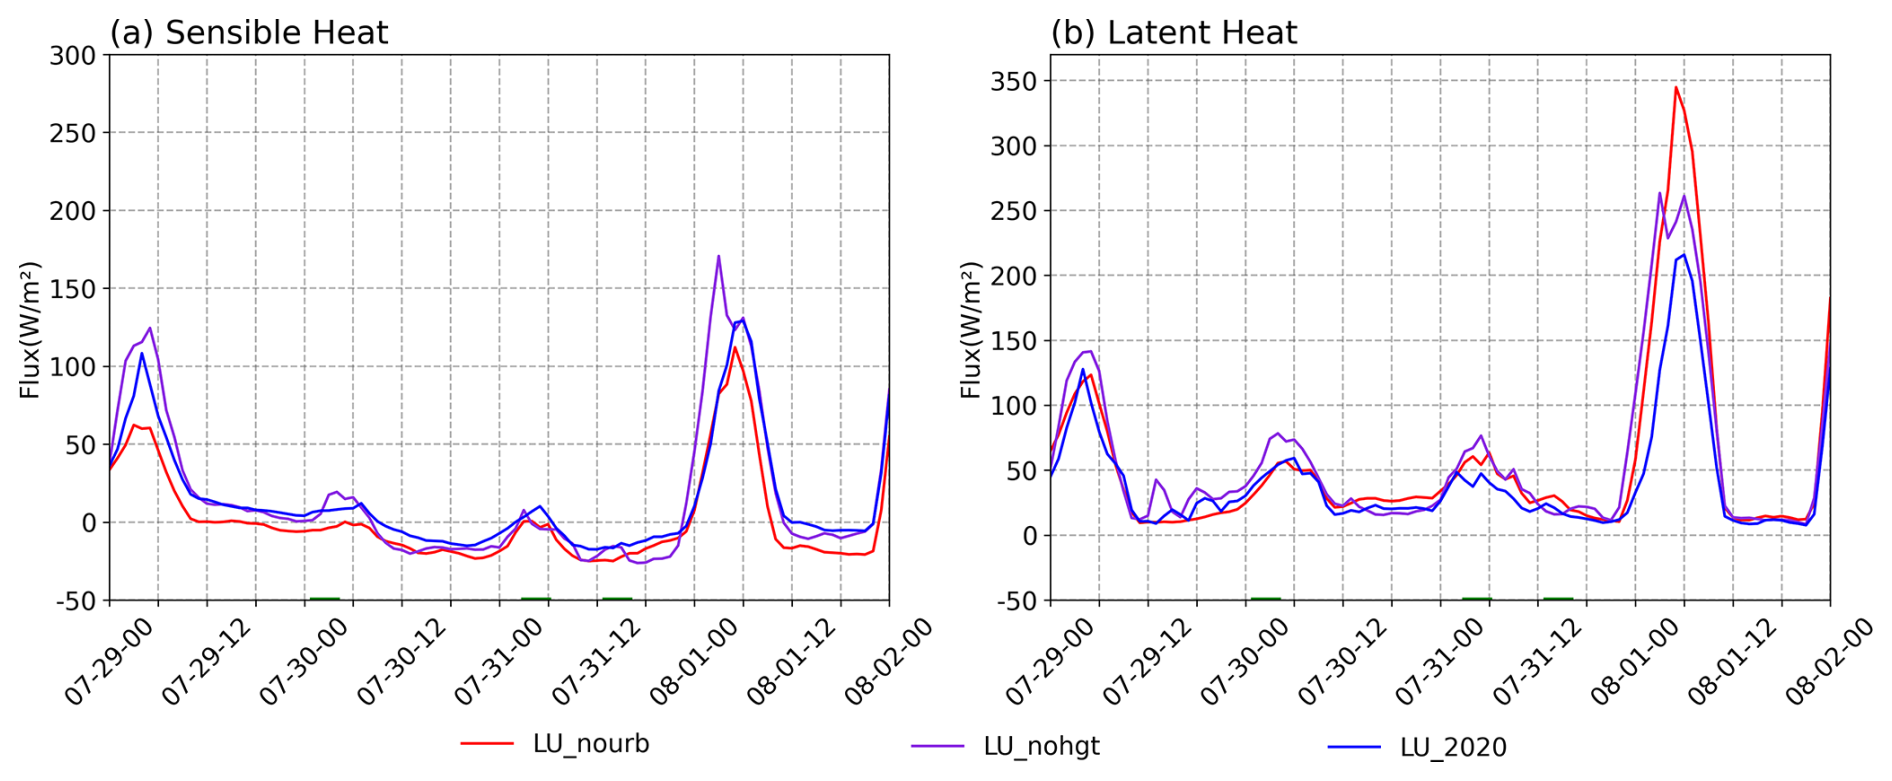
Figure 7Temporal variations in energy balance during the event for the LU_2020, LU_nohgt, and LU_nourb schemes. In panels (a) and (b), solid lines represent the sensible and latent heat fluxes within the precipitation anomaly area RegP for each scheme.
Table 3Average flux values in RegP region during precipitation process (unit: W m−2).
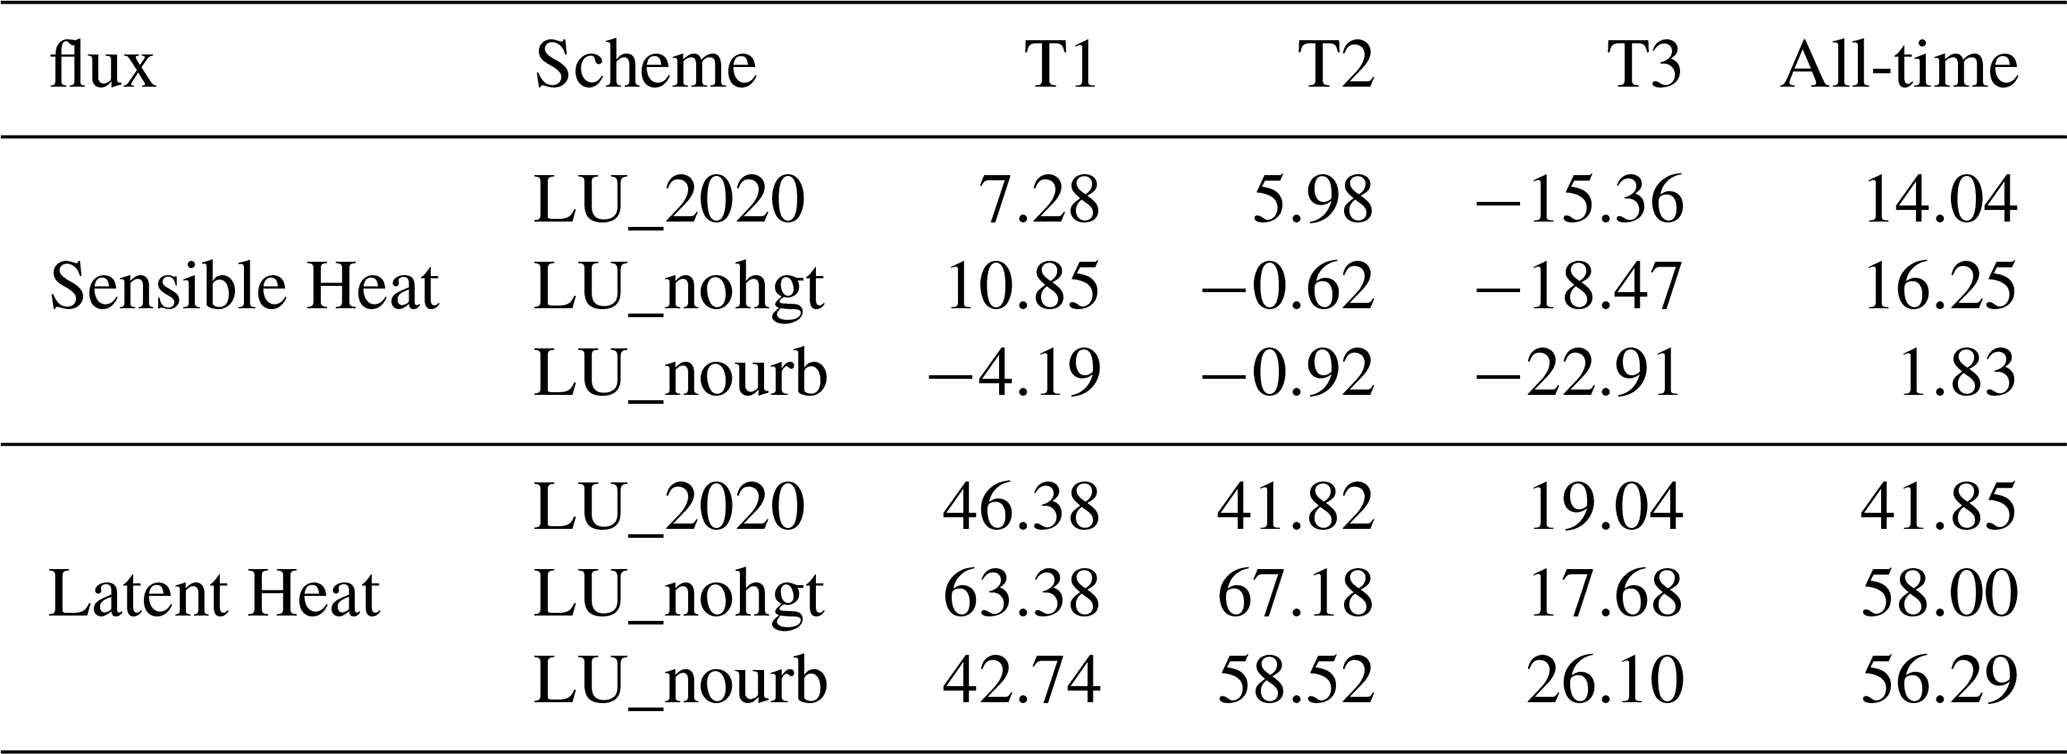
Compared with period T1, urbanization reduced latent heat flux by an average of 16.70 and 7.06 W m−2 in RegP during periods T2 and T3, respectively. This was mainly because the lower permeability of urban surfaces compared with croplands reducing the regional humidity, and thus decreasing the latent heat flux across the area. The impact of urbanization on the moisture content in RegP was less pronounced during period T1, suggesting that removing urban areas had minimal effect on the water vapor content. Changes in the sensible heat flux (Fig. 7a) due to urbanization were also concentrated in RegP, since the orography in the urban area varied little among the three experimental groups. When the land use shifted from urban surfaces to croplands, the reduced urban heat emissions significantly decreased the sensible heat flux in the central urban area, so it was lower than that in the other groups. It was notable that changes in the latent heat flux (Fig. 7b) in RegP were more complex than those in the sensible heat flux, which could be attributed to different changes in the water vapor content.
Figure 8 shows the magnitudes of the water vapor flux at the four boundaries of RegP for LU_2020. An increase in net moisture convergence during each period leads to higher precipitable water over the region, which in turn provides more favorable conditions for precipitation. Specifically, the moisture inflow across the southern boundary (Fig. 8a, e, i) and the eastern boundary (Fig. 8d, h, l) represents meridional and zonal sources of water vapor entering the region. The outflow across the northern boundary (Fig. 8b, f, j) and the western boundary (Fig. 8c, g, k) reflects the moisture exported from the region. The difference between the inflow and outflow moisture flux indicates net moisture income in each time period (shown in Table 4).
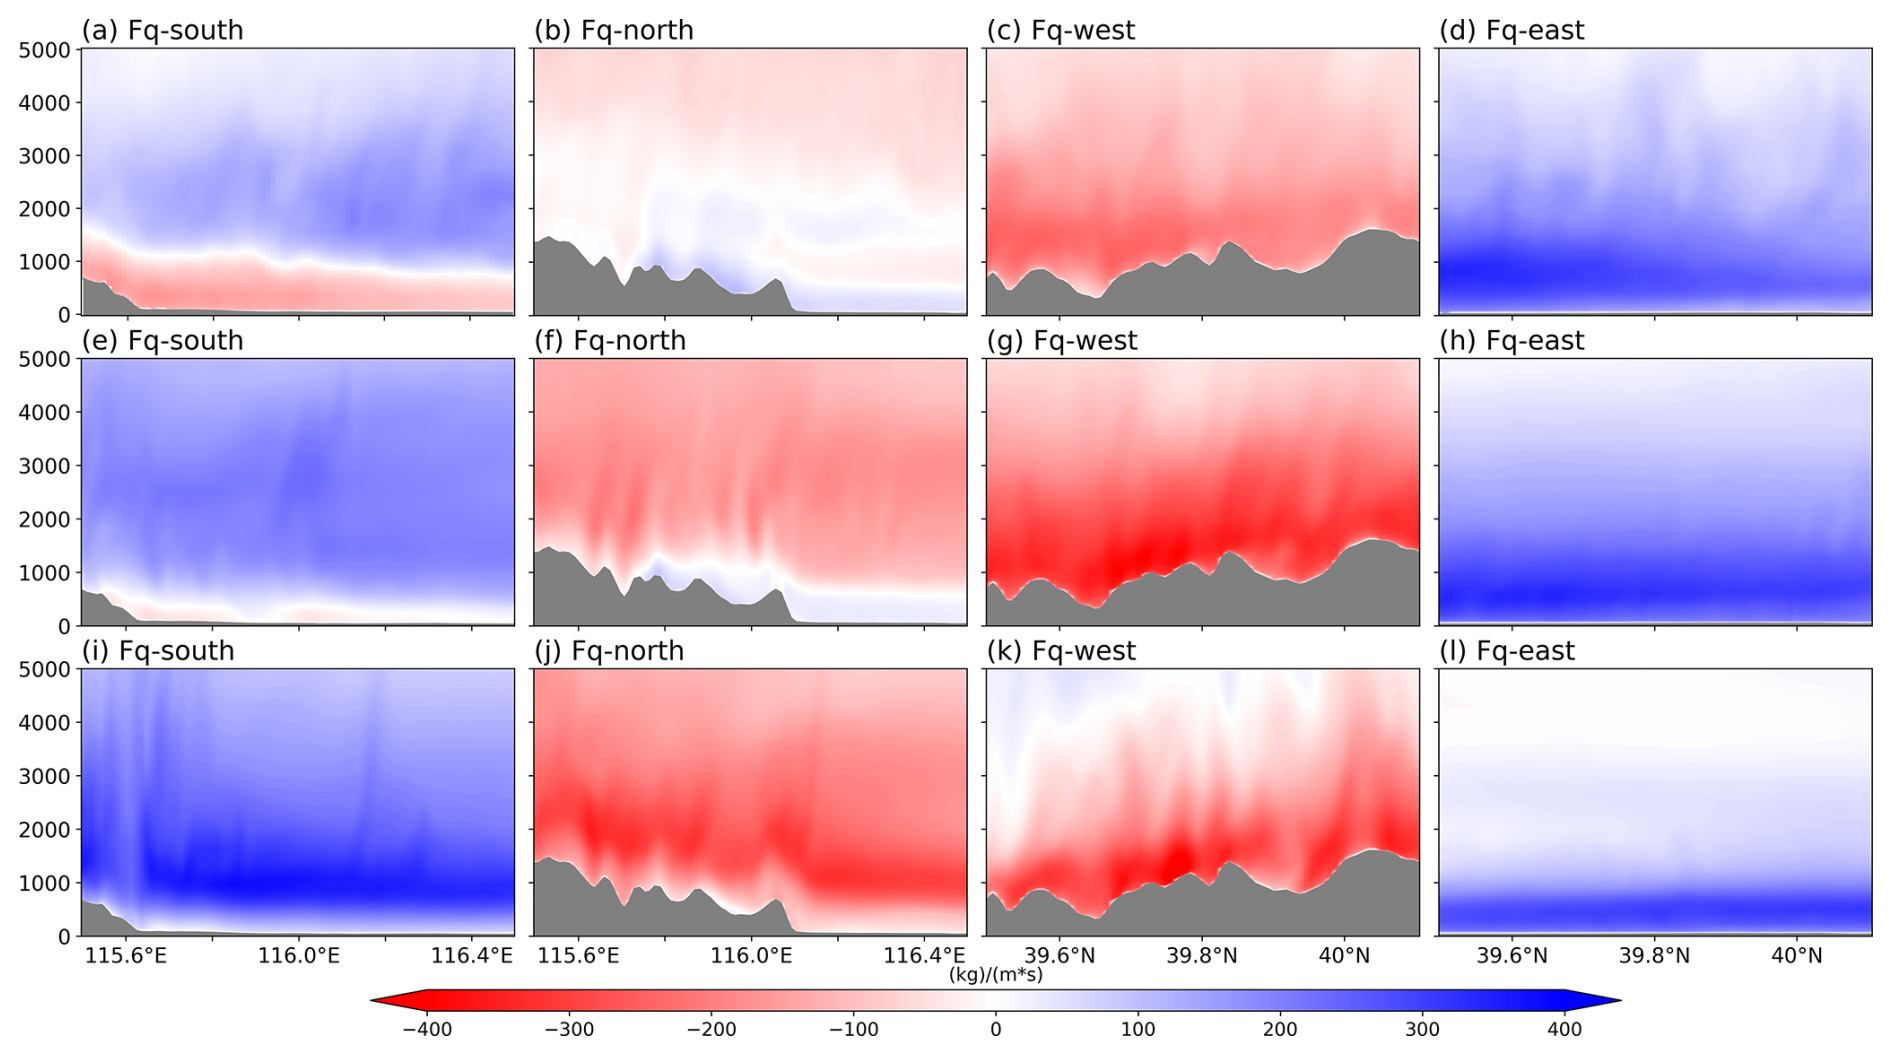
Figure 8Distribution of water vapor flux magnitude in the LU_2020 scheme across latitude-height/longitude-height coordinates of RegP. Figures show the water vapor flux magnitude for time periods T1 (a–d), T2 (e–h), and T3 (i–l), with fluxes from the south (a, e, i), north (b, f, j), west (c, g, k), and east (d, h, l). Positive and negative water vapor flux values correspond to input and output water vapor flux relative to RegP.
Table 4The water vapor flux (kg (m s)−1) during each period for different schemes.
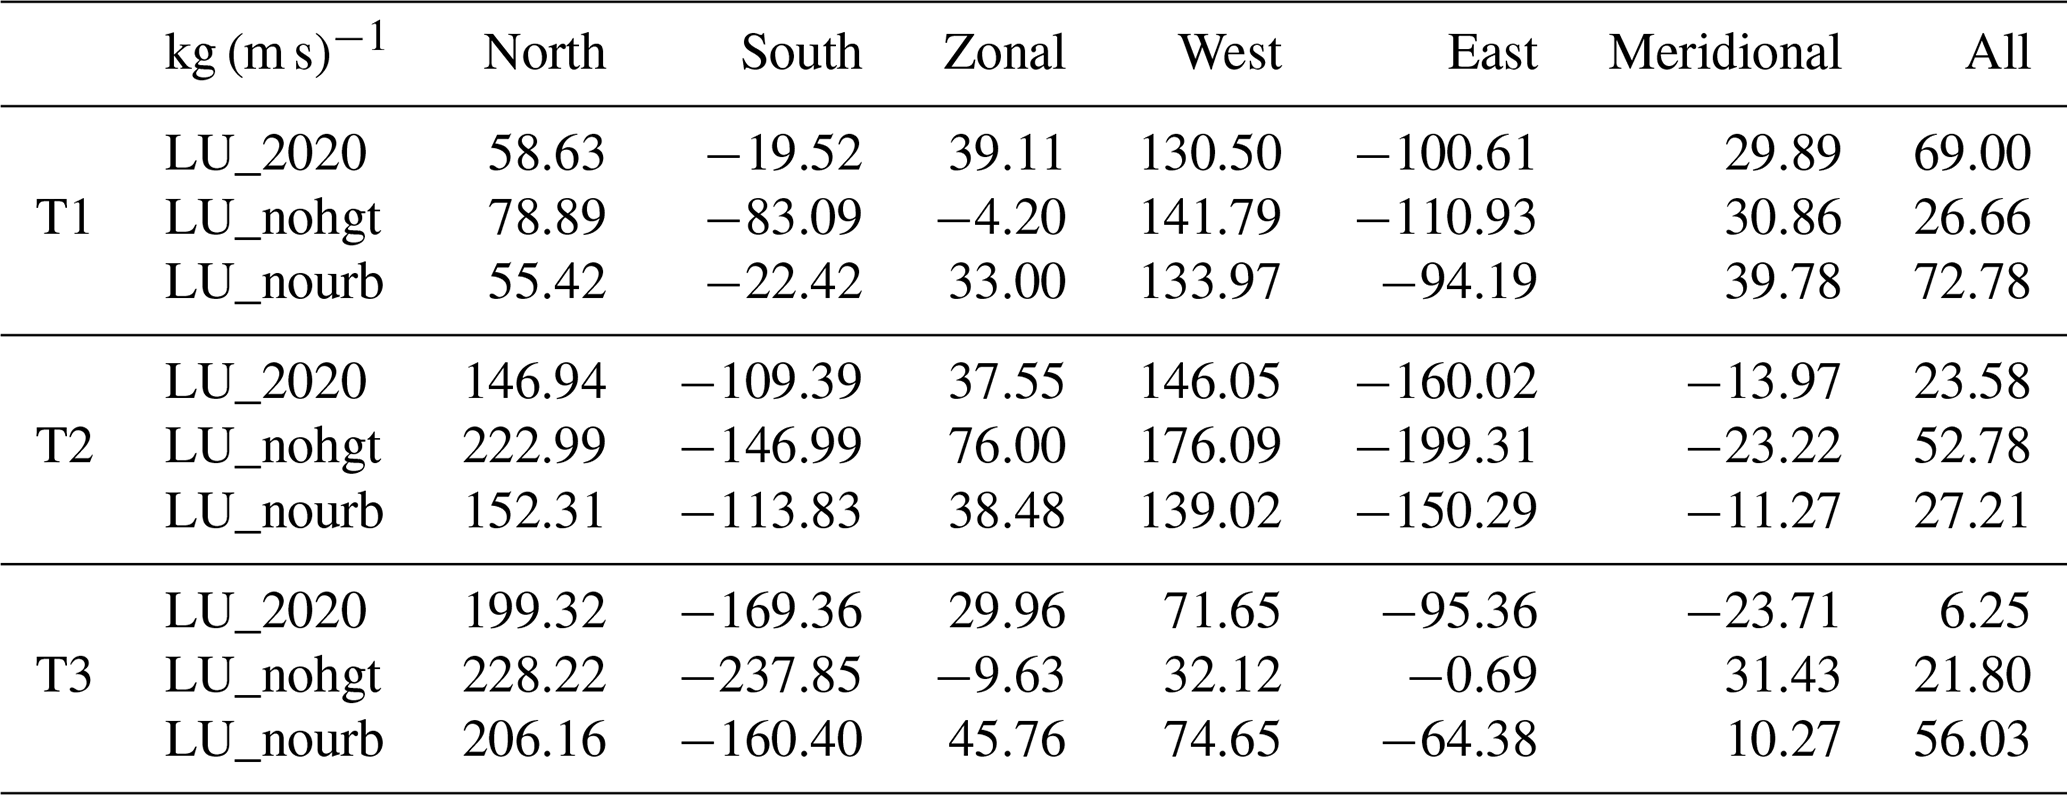
During period T1, about 49.58 kg (m s)−1 water vapor was transported southward at lower latitudinal levels along the southern boundary, while it was transported totally 58.63 kg (m s)−1 northward at high latitudes. As the Taihang Mountains extend in a southwest-northeast direction in the study area, the eastern zonal airflow was totally 130.50 kg (m s)−1, blocked by the mountainous area and shifted southward which explained why water vapor transported southward in northern boundary. Overall, the moisture input into the RegP was dominated by zonal water vapor transport. Although the meridional transport contributed a relatively large amount of moisture inflow, its substantial outflow resulted in a comparatively small net contribution to the regional moisture budget.
The water vapor flux distributions were similar during periods T2 and T3, while the magnitude of water vapor decreased from 23.58 to 6.25 kg (m s)−1. Although the zonal water vapor transport increased to some extent, the total moisture inflow during the two periods remained comparable. Meridionally, the eastward water vapor flux decreased from −13.97 to −23.71 kg (m s)−1. In addition, the water vapor transport during T3 became more concentrated in the lower layers which indicated the contribution of low-level water vapor transport to the precipitation process. Compared with that in T1, the northward water vapor flux at the southern boundary was significantly increased in T2 and T3. The northwestward transport increased and led to strong uplift motion in the mountainous area. Consequently, the mountainous areas may have been more prone to intense convective weather events due to the sufficient water vapor and air uplift during T2 and T3.
Orographic height significantly impacted water vapor flux transport, as shown by the differences in the water vapor distribution between LU_2020 (Fig. 8) and LU_nohgt (Fig. 9) and the corresponding water vapor flux transport in Table 4. From a zonal perspective, orography considerably influenced the water vapor distribution within RegP. Due to orographic effects, water vapor was lifted and its northward transport was prevented, statistically reduced about 63.57 kg (m s)−1 in the LU_2020 (Fig. 9a, e, i), which also increased the total amount of zonal water vapor flux in LU_2020. From meridional perspective, the meridional water vapor flux output from western boundary substantially decreased by 49.41 and 79.38 kg (m s)−1 during the whole period, resulting in a noticeable rise in the water vapor content in the entire region. Furthermore, the easterly winds were blocked and diverted by the orographic effect of the mountains to the west of Beijing, which also leads to a modest increase in the magnitude of the southward water vapor flux at the southern boundary in the lower atmospheric layers.
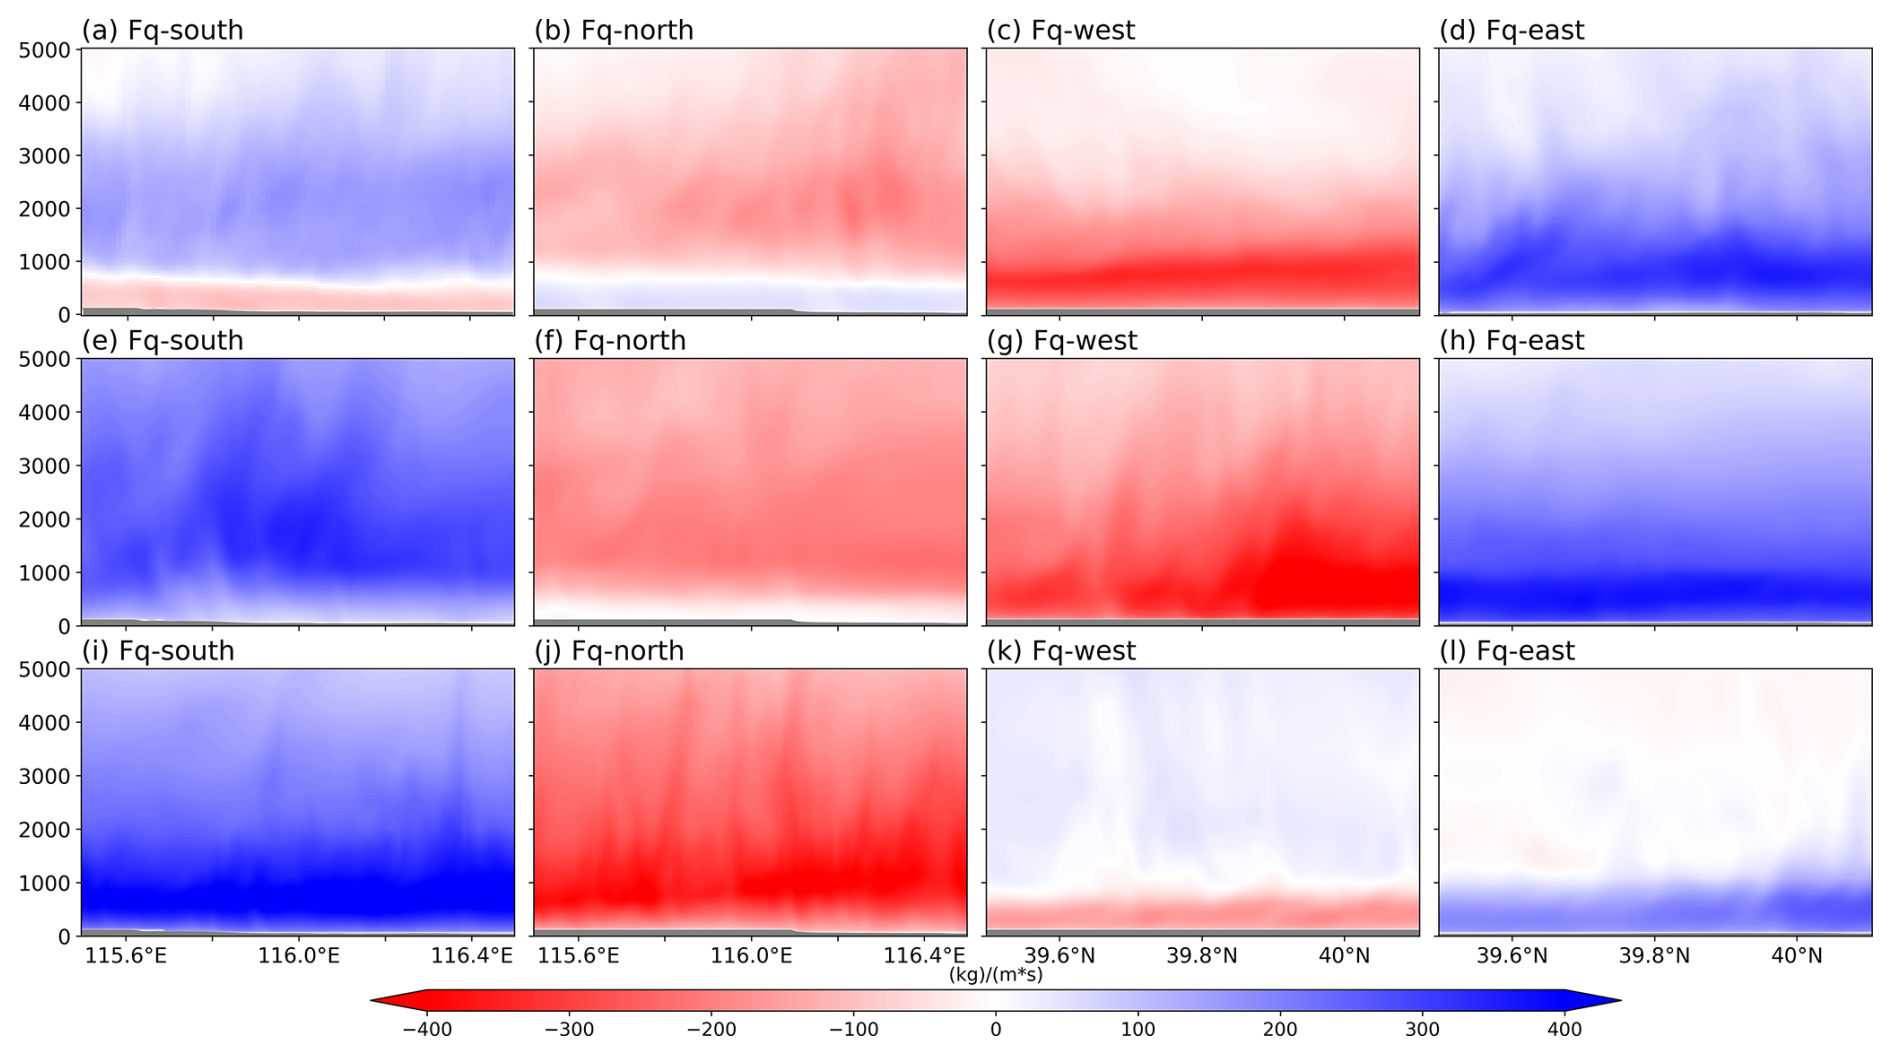
Figure 9Water vapor fluxes as shown in Fig. 8, where panels (a)–(l) depict the magnitude of the water vapor flux from four directions in the LU_nohgt scheme.
The impacts of the urbanization on water vapor transport are shown in Fig. 10. There was no significant difference between LU_2020 and LU_nourb in water vapor flux during periods T1 and T2 as the difference between net convergence is smaller than 10 kg (m s)−1. However, the differences mainly appeared at the western boundaries of RegP during period T3. At the western boundary, the westward water vapor flux was 30.98 kg (m s)−1 higher compared with that in LU_nourb (Fig. 10k). These differences of moisture flux between different schemes were mainly due to wind speed in lower troposphere. As urban land use can influence local atmospheric circulation, such strong ascent induces horizontal convergence and a subsequent conversion of horizontal momentum into vertical motion. Such momentum redistribution can reduce the horizontal wind speed, particularly within the convectively active region, leading to a reduction in moisture flux across the western and northern boundaries.
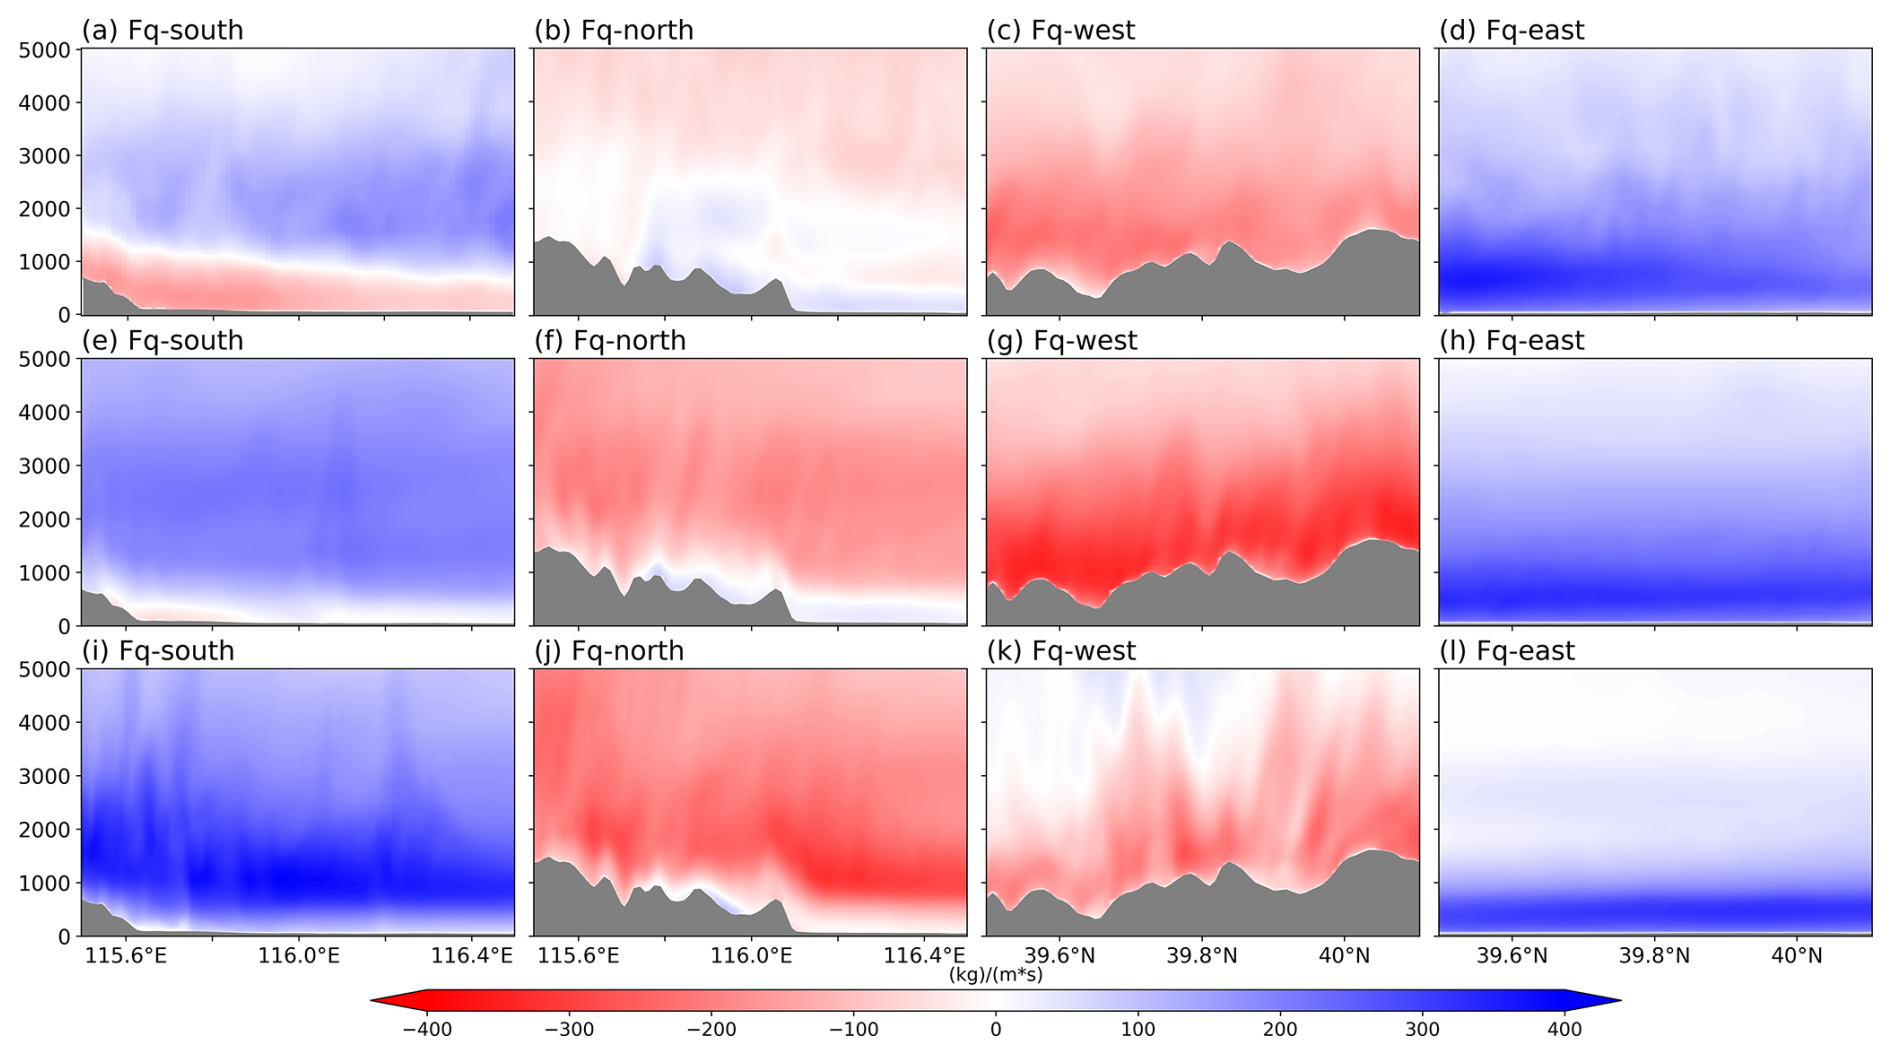
Figure 10Water vapor fluxes as shown in Fig. 8, where panels (a)–(l) depict the magnitude of the water vapor flux from four directions in the LU_nourb scheme.
3.3.2 Differences in Near-surface Physical Variables
Near-surface physical quantities did not directly determine the magnitude of precipitation, but the changes in the underlying surface were directly reflected in variations in near-surface physical quantities, which influenced the upper atmosphere and subsequently affected the intensity of precipitation. Figure 11a–c illustrates the horizontal distributions of the equivalent potential temperature, wind speed, and the humidity during the three precipitation time periods.
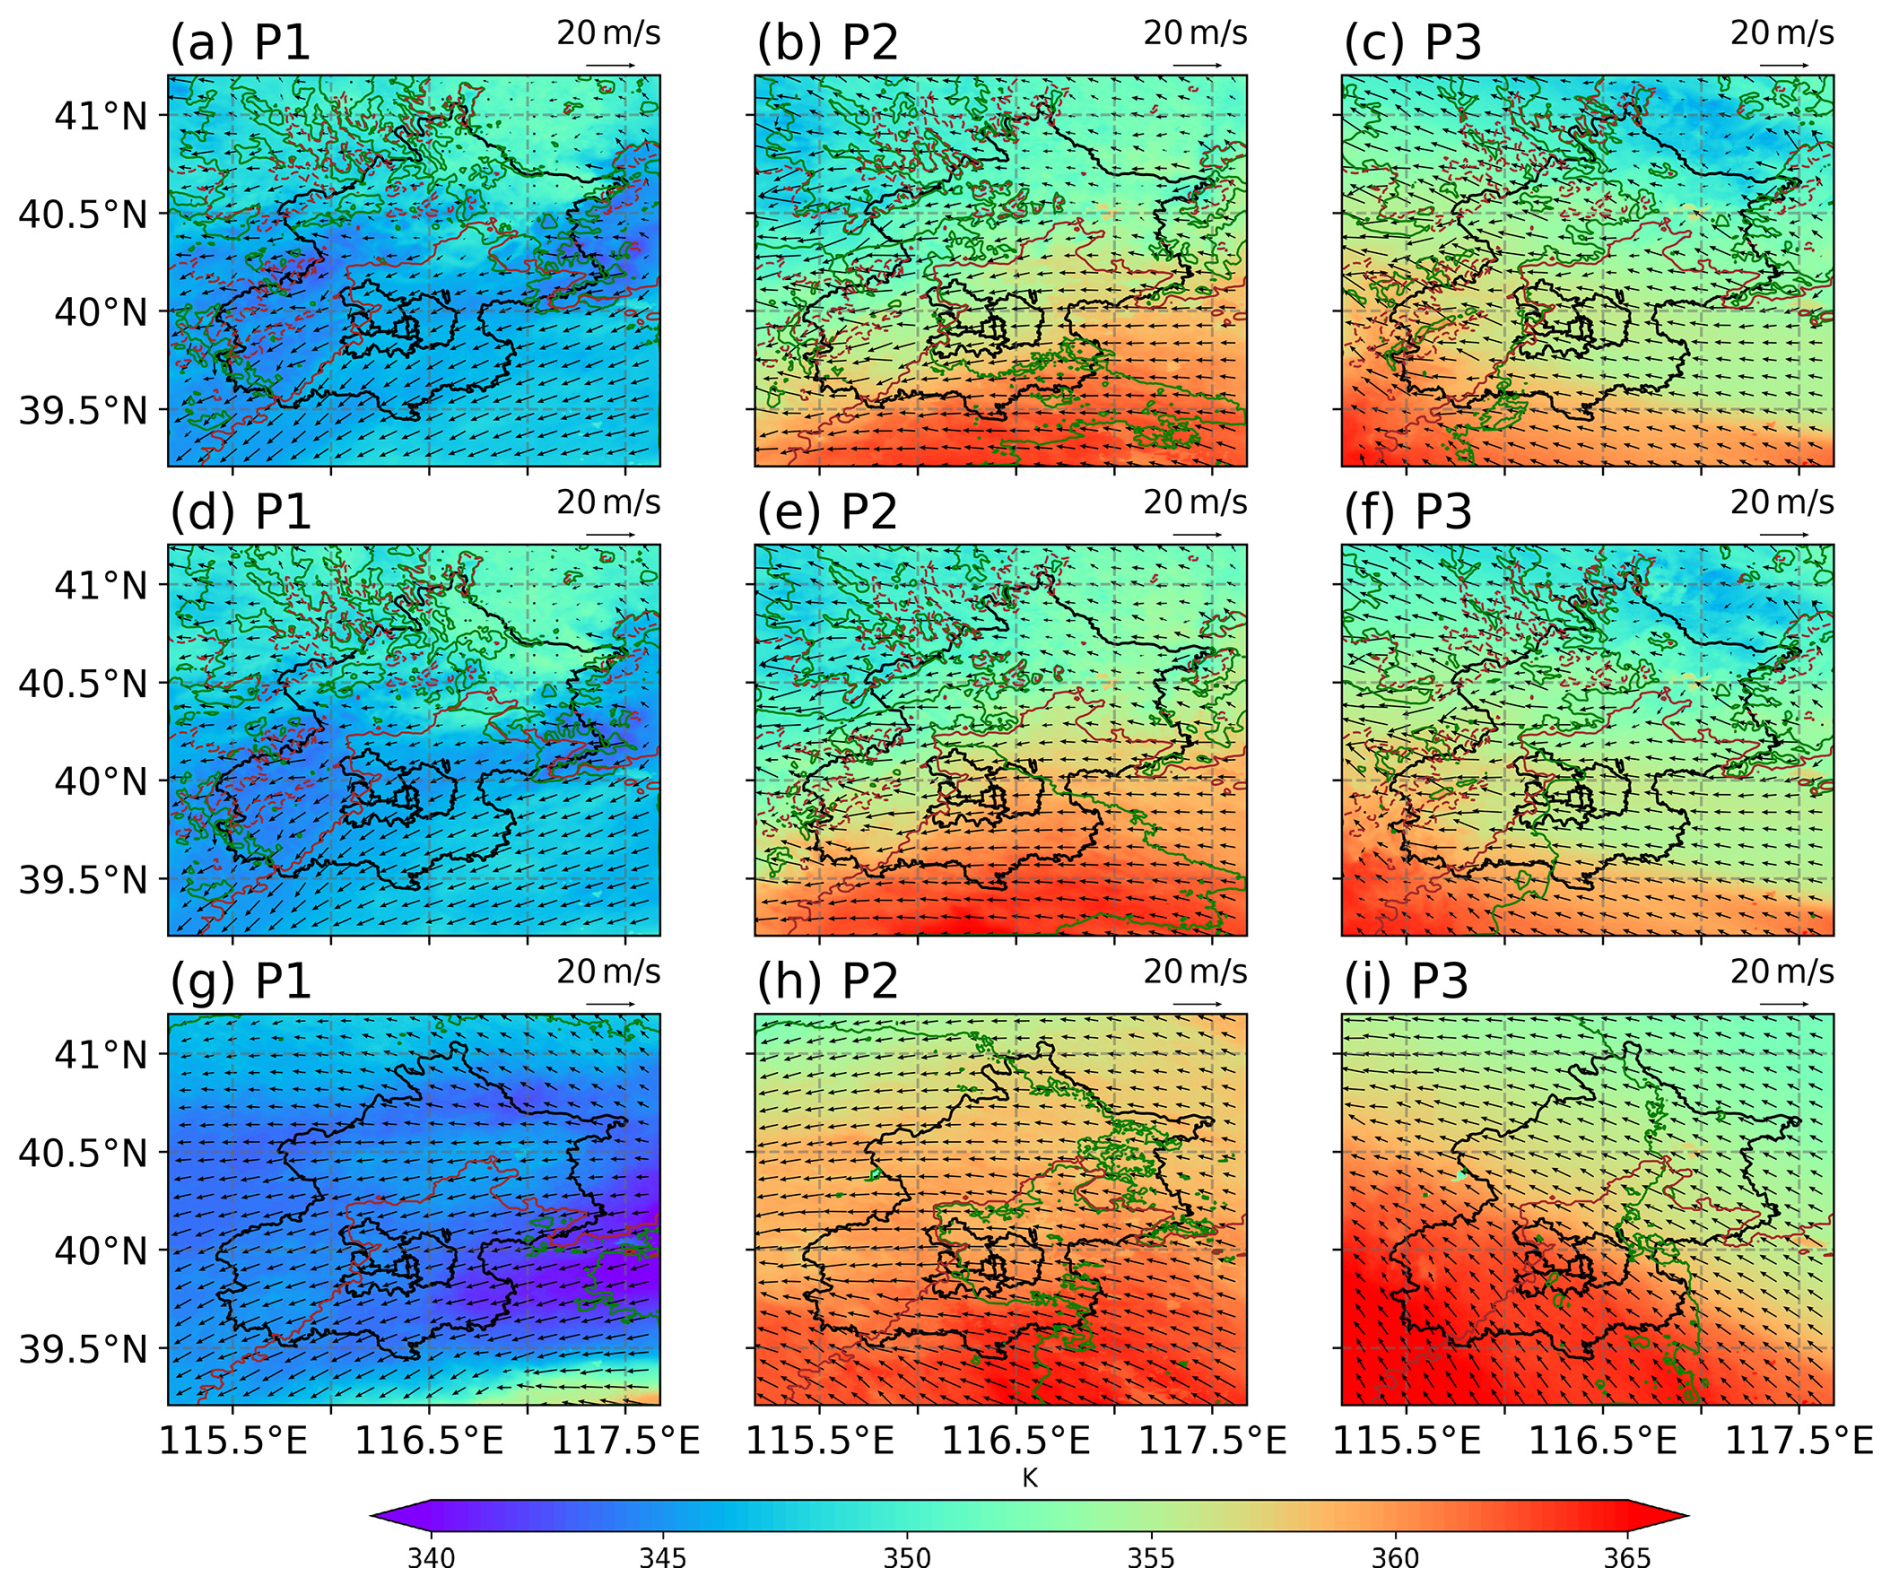
Figure 11Simulated 2 m equivalent potential temperature, 2 m relative humidity, 10 m wind speed, and orographic height for LU_2020 scheme (a–c), LU_nohgt scheme (d-f), and LU_nourb scheme (g-i). Three consecutive time periods were selected: T1 (a, d, g), T2 (b, e, h), and T3 (c, f, i). In the figures, the 2 m temperature is represented by color-filled maps, areas with 2 m relative humidity greater than 90 % are outlined by green dashed lines, the 10 m wind speed is represented by arrows, brown solid lines indicate orographic contours at 100 m, and brown dashed lines represent orographic contours at 1000 m.
During period T1 (Fig. 11a), precipitation was mainly concentrated in the southwestern mountainous and central region. The equivalent potential temperature over Beijing remained between 346 and 347 K, but it was slightly lower than the regional average in RegP. These results are consistent with the flux changes shown in Fig. 7. The lowest equivalent potential temperature in Beijing was observed in the northwestern mountainous region (343 K). In addition, the 2 m relative humidity in Beijing during period T1 remained at an average value above 90 %, and the 10 m wind direction was influenced by the circulation and orographic blocking, resulting in northeastern wind. The wind direction was more erratic in the mountainous areas, where the relative humidity was slightly lower than that in the plains, and the precipitation was also relatively lower compared with the southern regions.
During period T2 (Fig. 11b), the precipitation entered the initial stage of the second precipitation phase, during which the precipitation mainly occurred in the southwestern mountainous areas. The warm and moist southerly air currents transported water vapor and also provided the energy required for precipitation. The equivalent potential temperature was higher in southern Beijing, and it decreased from south to north, a trend linked to the energy loss as the air moved northward. This variation was associated with the energy dissipation process as the airflow moved northward. The overall equivalent potential temperature gradually increased over time, from 351.6 K at 03:00 UTC on 31 July to 354.3 K at 06:00 UTC on 31 July.
In period T3 (Fig. 11c), the precipitation remained intense and the areas with the most intense precipitation were still located in the western mountainous areas. The overall distribution of the equivalent potential temperature during this period was similar to that in period T2, and the highest values were still located in the southwestern mountainous areas of Beijing. The average equivalent potential temperature in Beijing remained within a range of 355 to 356 K. The overall relative humidity in the region was higher compared with that in period T2 (rising to 90.0 %). The wind direction in the central urban area shifted slightly to the north due to the influence of the northerly air currents, but there was no significant change in the wind speed compared with that in period T2.
The effects of orography on the wind speed, temperature, and humidity were evident (Fig. 11d–f). During period T1, the equivalent potential temperature in the LU_2020 scheme over Beijing was significantly higher compared with that in the LU_nohgt scheme, with the largest increase observed in the eastern and northeastern regions of Beijing. Due to the blocking effect of the mountains, the relative humidity across the entire D04 area also increased during period T1. During periods T2 and T3, the presence of the mountain range led to a notable decrease in the equivalent potential temperature across the region compared with the LU_nohgt scheme, mainly due to the transport of water vapor along the Taihang Mountains to the Beijing area during the second stage, during which substantial amounts of water vapor and energy accumulated as the air mass passed through the mountainous areas. The dissipation of energy and water vapor during this process led to significant reductions in the relative humidity and equivalent potential temperature in the plains and northern Beijing during these periods. Moreover, the presence of the western mountainous terrain led to the redistribution of the water vapor, resulting in significant variability in the humidity distribution in the mountainous areas. Minimal variation was found in wind direction in the plains, and there were no significant differences between the two experimental groups across all three periods. However, in the mountainous areas, the orography induced air convergence at the boundary between the plains and mountains. Due to the complexity of the terrain, the wind speed and direction were more heterogeneous in the western mountainous areas.
The effects of urbanization were analyzed by comparing LU_2020 (Fig. 11a–c) and LU_nourb (Fig. 11g–i). The changes in precipitation were primarily concentrated in periods T2 and T3. During period T2, replacing urban underlying surfaces with croplands significantly altered the 2 m relative humidity in the central urban area, with an increase of more than 5 %. This increase in the relative humidity led to greater accumulation of latent heat in the air. As a result, the 2 m equivalent potential temperature increased by approximately 1 K. The wind speed increased slightly in the urban area, with greater air convergence in the mountainous regions. During period T3, the increase in the relative humidity in the urban area was smaller compared with that in period T2 (increasing by around 3 %). Wind convergence was evident in the western mountainous regions. Although the relative humidity in the central urban area increased significantly, there was no noticeable increase in the relative humidity in the downstream mountainous areas located to the east of the urban region.
Since presenting only the surface equivalent potential temperature could be insufficient to fully explain the influence mechanisms of the underlying surface, the gradient of equivalent potential temperature at representative times is further analyzed to characterize the atmospheric stability (Fig. 12). The orographic lifting exerts a significant modulation on the spatial distribution of the horizontal equivalent potential temperature gradient. During the T1 period, the LU_nohgt scheme exhibits an eastward displacement of the maximum gradient compared with the LU_2020, accompanied by a noticeable shift in the 850 hPa wind shear location. This indicates the orographic lifting alters the low-level flow and thermodynamic structure, thereby modulates the distribution of moist baroclinicity and the position of the potential frontal zone. Therefore, it can provide a more favorable thermodynamic environment for convective development over the mountainous areas. During the T2 period, orographic lifting further enhances low-level moist baroclinicity and makes the high-gradient zone more continuous. Combined with the low-level wind shear, these conditions are conducive to frontogenetic processes and convective systems.
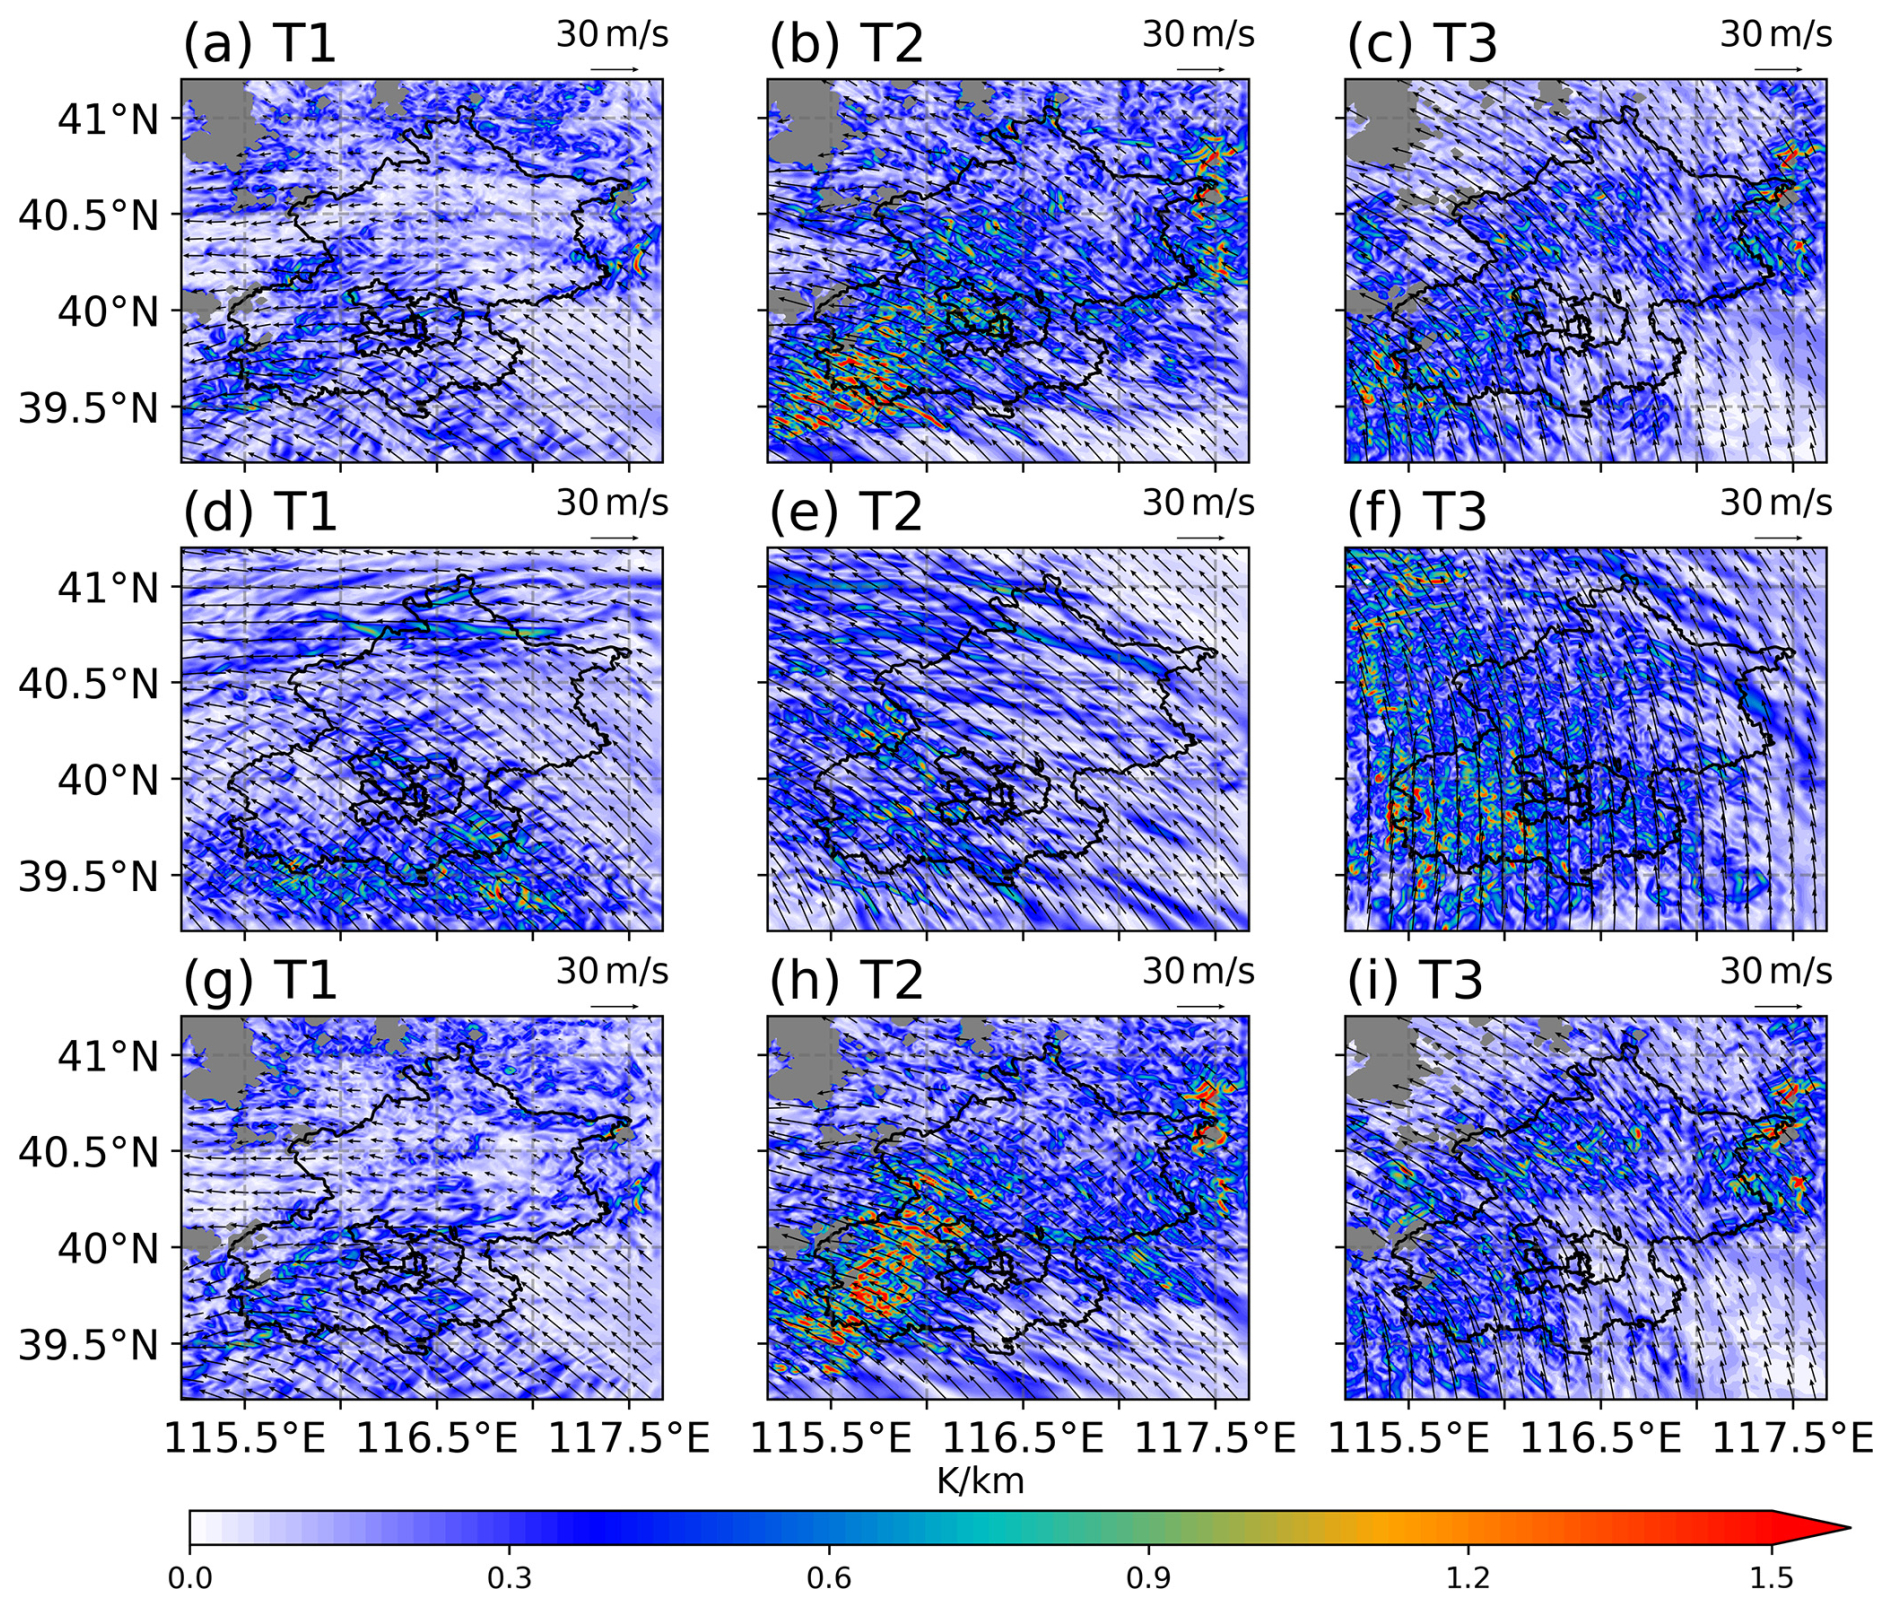
Figure 12Gradient of equivalent potential temperature field for LU_2020 scheme (a–c), LU_nohgt scheme (d–f), and LU_nourb scheme (g–i) from 850 hPa. Three consecutive time periods were selected: T1 (a, d, g), T2 (b, e, h), and T3 (c, f, i).
In contrast, although relatively large gradients still exist in the LU_nohgt during the T3 period, the low-level convergence and vertical ascent are substantially weakened. It prevents the effective release of thermodynamic instability, and therefore the precipitation process consequently comes to an end. Meanwhile, the changes in urban land use also influence the precipitation intensity, especially during the T2 period. The LU_2020 scheme exhibits larger horizontal gradients over the southwestern mountainous region than LU_nourb. This indicates that urbanization can enhance low-level moist baroclinicity in this area, which is favorable for strengthening frontal structures and increasing the likelihood of intense convection precipitation.
3.3.3 Differences in the Vertical Profile
Figure 13 presents the meridional and zonal vertical profiles for the three distinct time periods. In LU_2020 scheme, convection was primarily confined to the mountainous regions and the plains to the east of the mountains during period T1. The orography blocking effect resulted in significant upward motion in both the mountainous areas and adjacent plains. Around 02:00 UTC on 30 July, the eastward water vapor flux was sufficiently high, leading to condensation of substantial amounts of water vapor into cloud droplets and raindrops over the mountainous regions. The latent heat released in this process induced fluctuations in the equivalent potential temperature contours in the upper levels. In the zonal direction, cloud droplets and raindrops were predominantly located over the southern mountains. In the northern mountainous areas, due to the relatively low water vapor flux and lower equivalent potential temperature, there was almost no vertical motion in the air, resulting in negligible cloud droplet formation in this region.
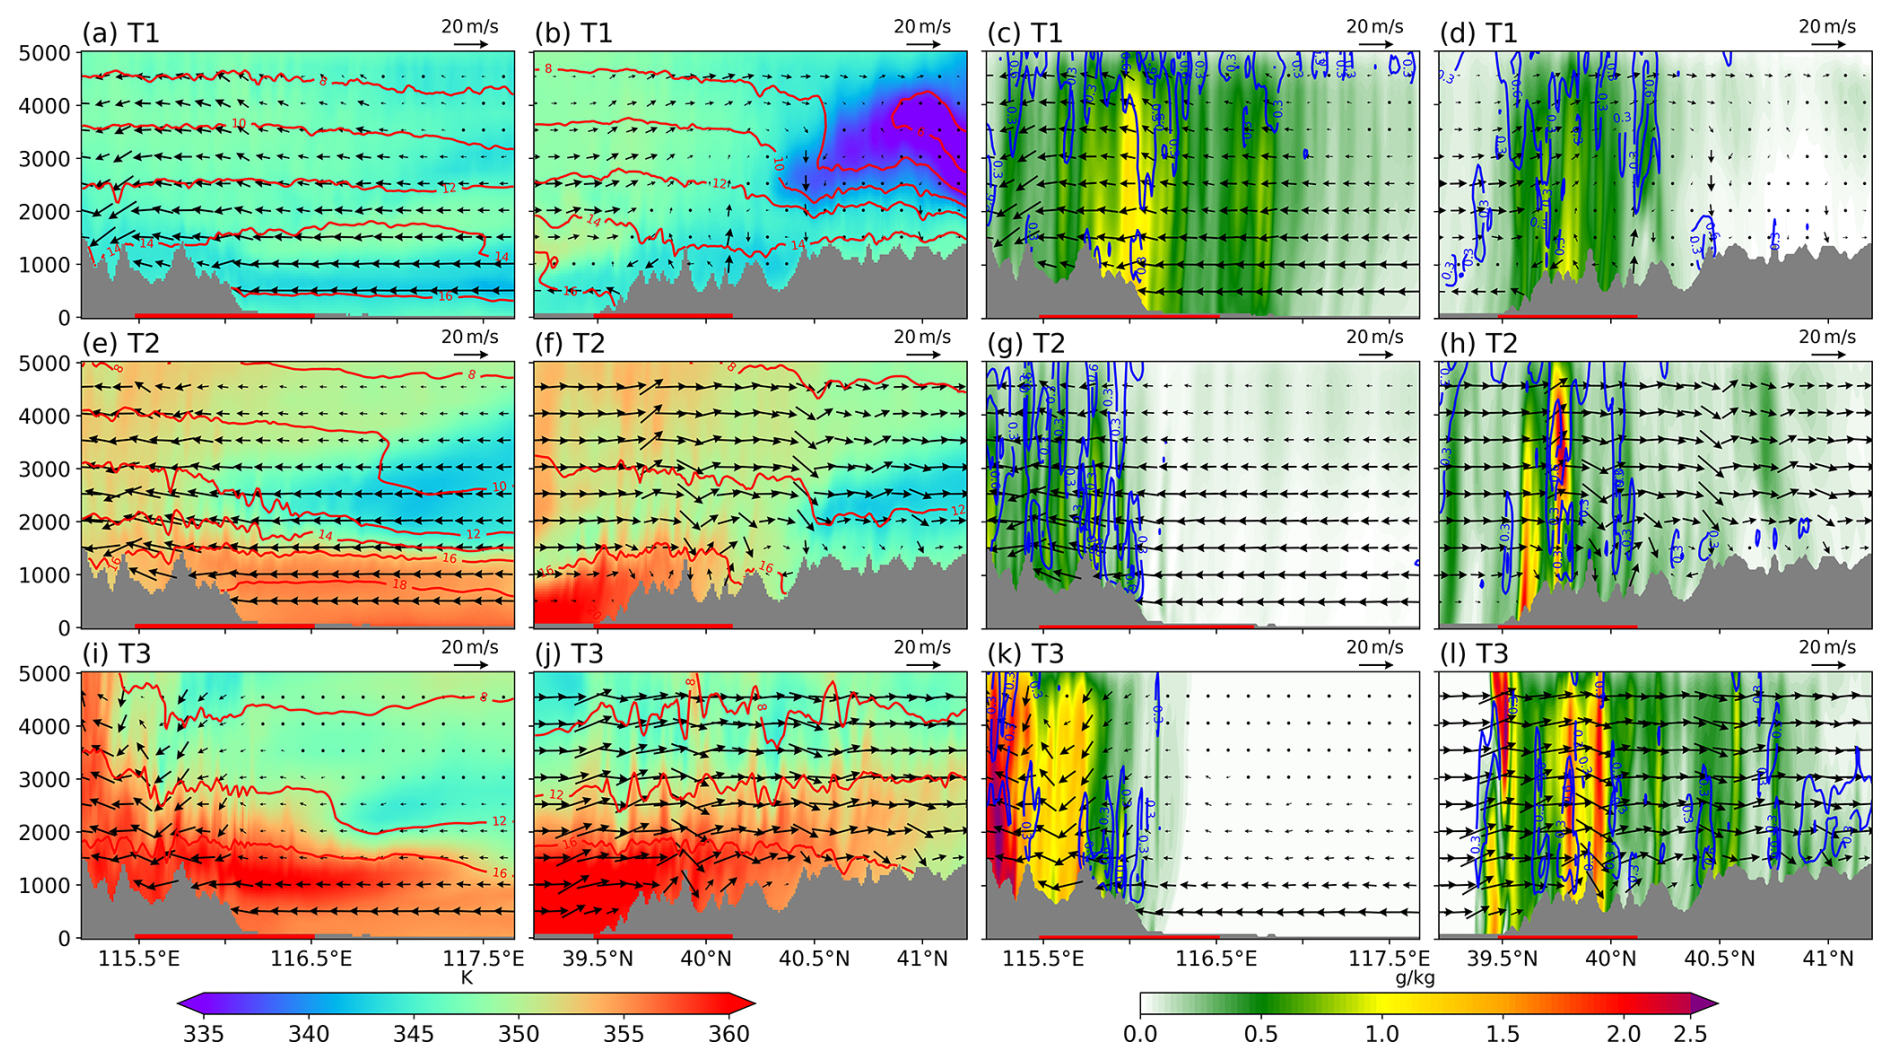
Figure 13Meridional-vertical profiles (a, c, e, g, i, k) at 39.9° N and zonal-vertical profiles (b, d, f, h, j, l) at 115.7° E for LU_2020. In panels (a), (b), (e), (f), (i), (j), the shaded areas represent the magnitude of the equivalent potential temperature and red contours indicate the water vapor mixing ratio. In panels (c), (d), (g), (h), (k), (l), the shaded areas represent the rainwater mixing ratio and blue contours indicate the cloud water mixing ratio. The arrows represent the horizontal wind vectors (with the vertical wind speed amplified by a factor of five). Gray shading denotes the terrain height. The red line at the bottom of the map indicates RegP, as shown in Fig. 6.
During period T2, the atmosphere over the mountainous regions was characterized by vigorous convection in the meridional direction. In the southwestern mountains, higher equivalent potential temperatures correlated with greater cloud droplet concentrations. Both the southerly winds and vertical wind speeds increased significantly compared with those in period T1, while the cloud water and rainwater mixing ratios elevated near 39.8° N. The cloud water mixing ratios were relatively high in other regions, but this corresponded to the early stages of precipitation when cloud water had not yet to fully convert into rainwater, resulting in low rainwater concentrations in most areas.
In the meridional direction, only the low-level wind speed over the plains was noticeably higher in period T3 compared with that in period T2. The low-level winds exhibited convergence, whereas the upper-level winds exhibited divergence in the southwestern mountainous region, and thus the equivalent potential temperature remained relatively high near the surface. In the zonal direction, notable convection occurred over the mountainous areas, accompanied by significant fluctuations in the near-surface equivalent potential temperature. In addition, the southward water vapor flux was relatively large during this period, and energy, water vapor, and motion within the southwestern mountainous regions were conducive to the development of convection. As illustrated in Fig. 13i–k, both the cloud water and rainwater concentrations in the southwestern mountainous area increased compared with other regions. Consequently, the region experienced relatively higher precipitation during period T3.
Comparisons between the LU_2020 (Fig. 13) and LU_nohgt (Fig. 14) experimental groups highlighted the convection observed during the three periods driven by orographic uplift. In period T1, the uplift motion in the southern part of the area facilitated the condensation of cloud droplets and raindrops, thus increasing the precipitation intensity. In period T2, due to higher equivalent potential temperature and water vapor content of the atmosphere, strong convection persisted in the western part of the study area in LU_nohgt. The intensity of convection and water droplet concentration in the atmosphere were markedly higher than those observed in the LU_2020 scheme. In the zonal direction, significant differences were observed between the locations of cloud water droplet accumulation between the two experimental setups. In period T3, convection shifted northward with the southerly winds in the LU_nohgt scheme. At the southern edge of the convective cloud mass, the distributions of wind speed, temperature, and humidity stabilized, indicating the cessation of intense precipitation in the region. Despite the high energy levels within the study area, the absence of orographic uplift led to a reduction in the intensity of precipitation, and the precipitation event ended earlier compared with the LU_2020 scheme.
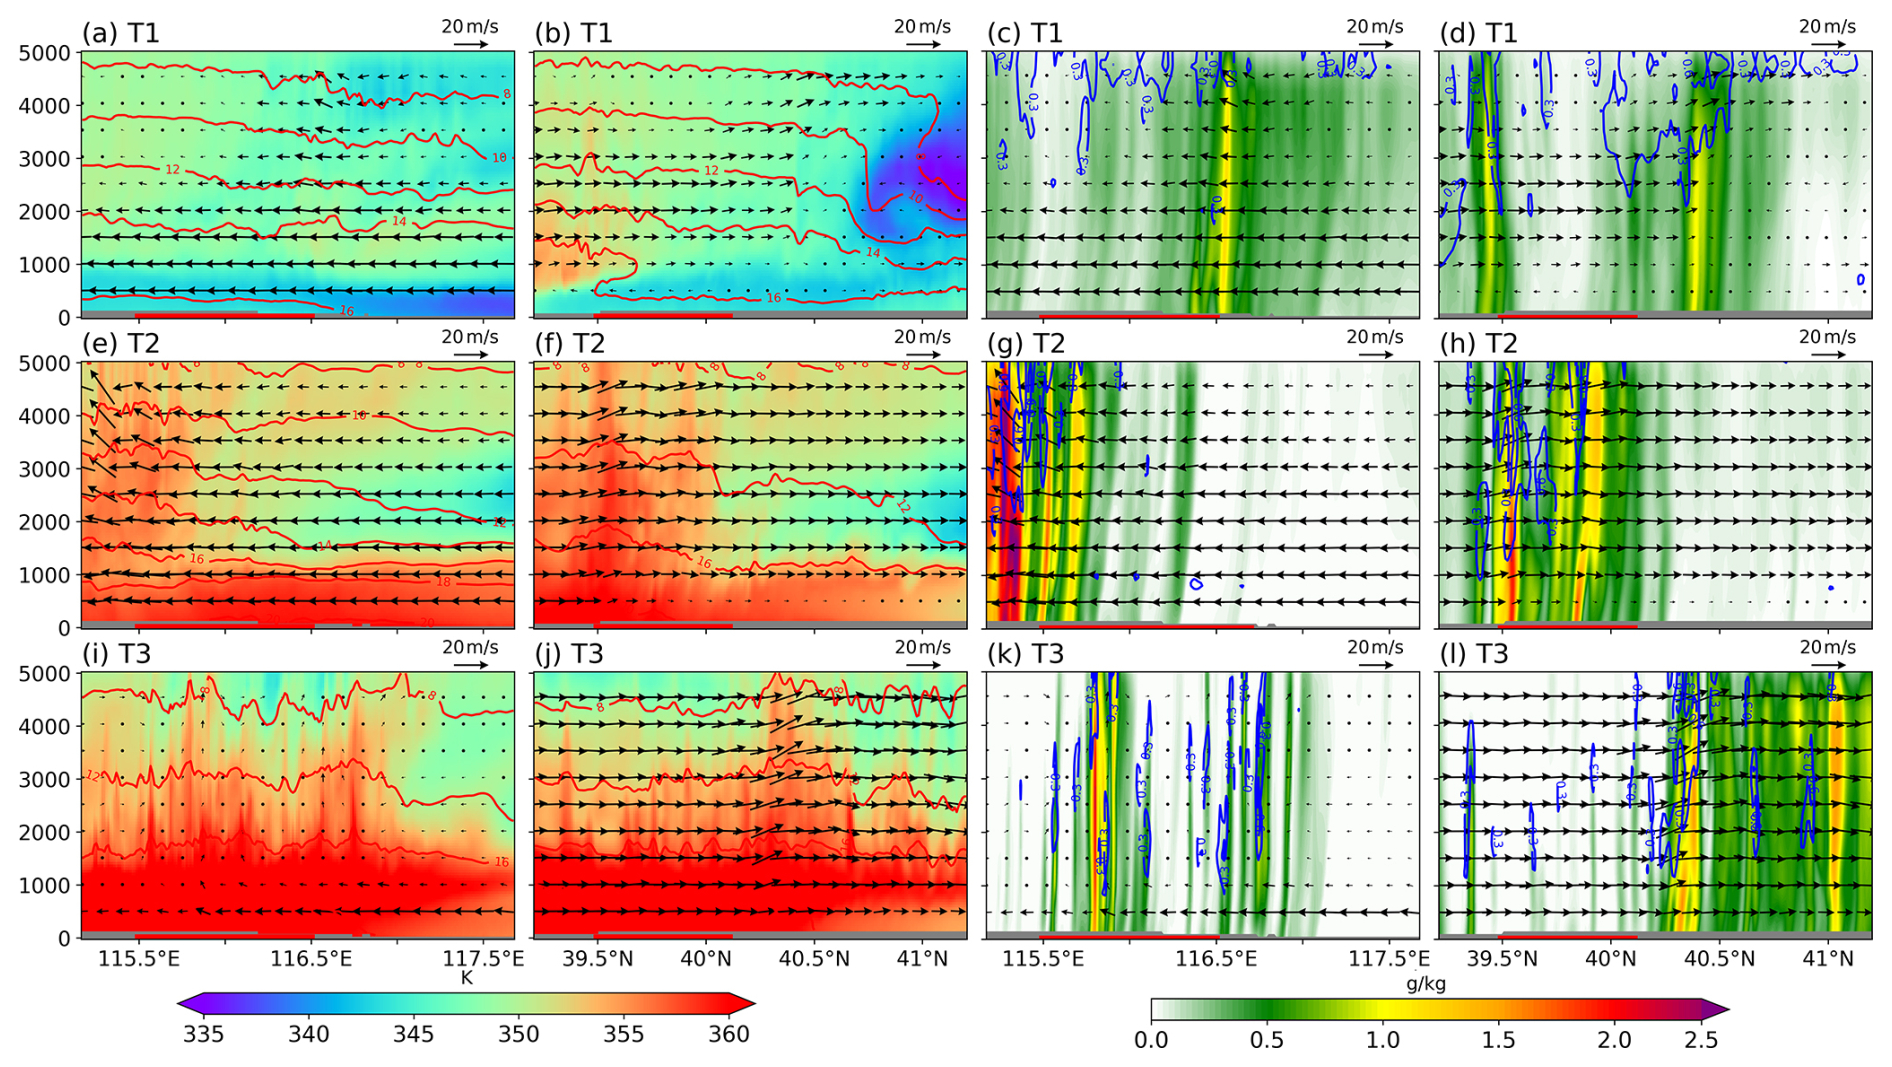
Figure 14Meridional-vertical and zonal-vertical profiles for the LU_nohgt schemes. The physical quantities are consistent with those shown in Fig. 13.
The impacts of urbanization on precipitation outcomes were examined by comparing the LU_2020 (Fig. 13) and LU_nourb (Fig. 15) schemes, where the primary effects were observed during periods T2 and T3. Due to the influence of urbanization, there were no significant changes in the cloud water content over the mountainous areas during period T2, besides the rainwater content was markedly reduced, indicating a smaller amount of precipitation relative to LU_nourb. Urbanization led to decreases in the water vapor and energy transported into the mountains from the eastern and southern parts of the region, thereby reducing the condensation of cloud water and water vapor particles, which also agreed with the delayed precipitation during T2 due to urbanization. During period T3, both the meridional and zonal convection activities were weaker compared with LU_nourb, and the distribution of cloud droplet particles were also altered. The presence of the city reduced the latent heat flux in the region, thereby diminishing the amount of energy transported into the southwestern mountainous areas, and thus intense precipitation occurred in the southwestern mountainous region during periods T2 to T3.
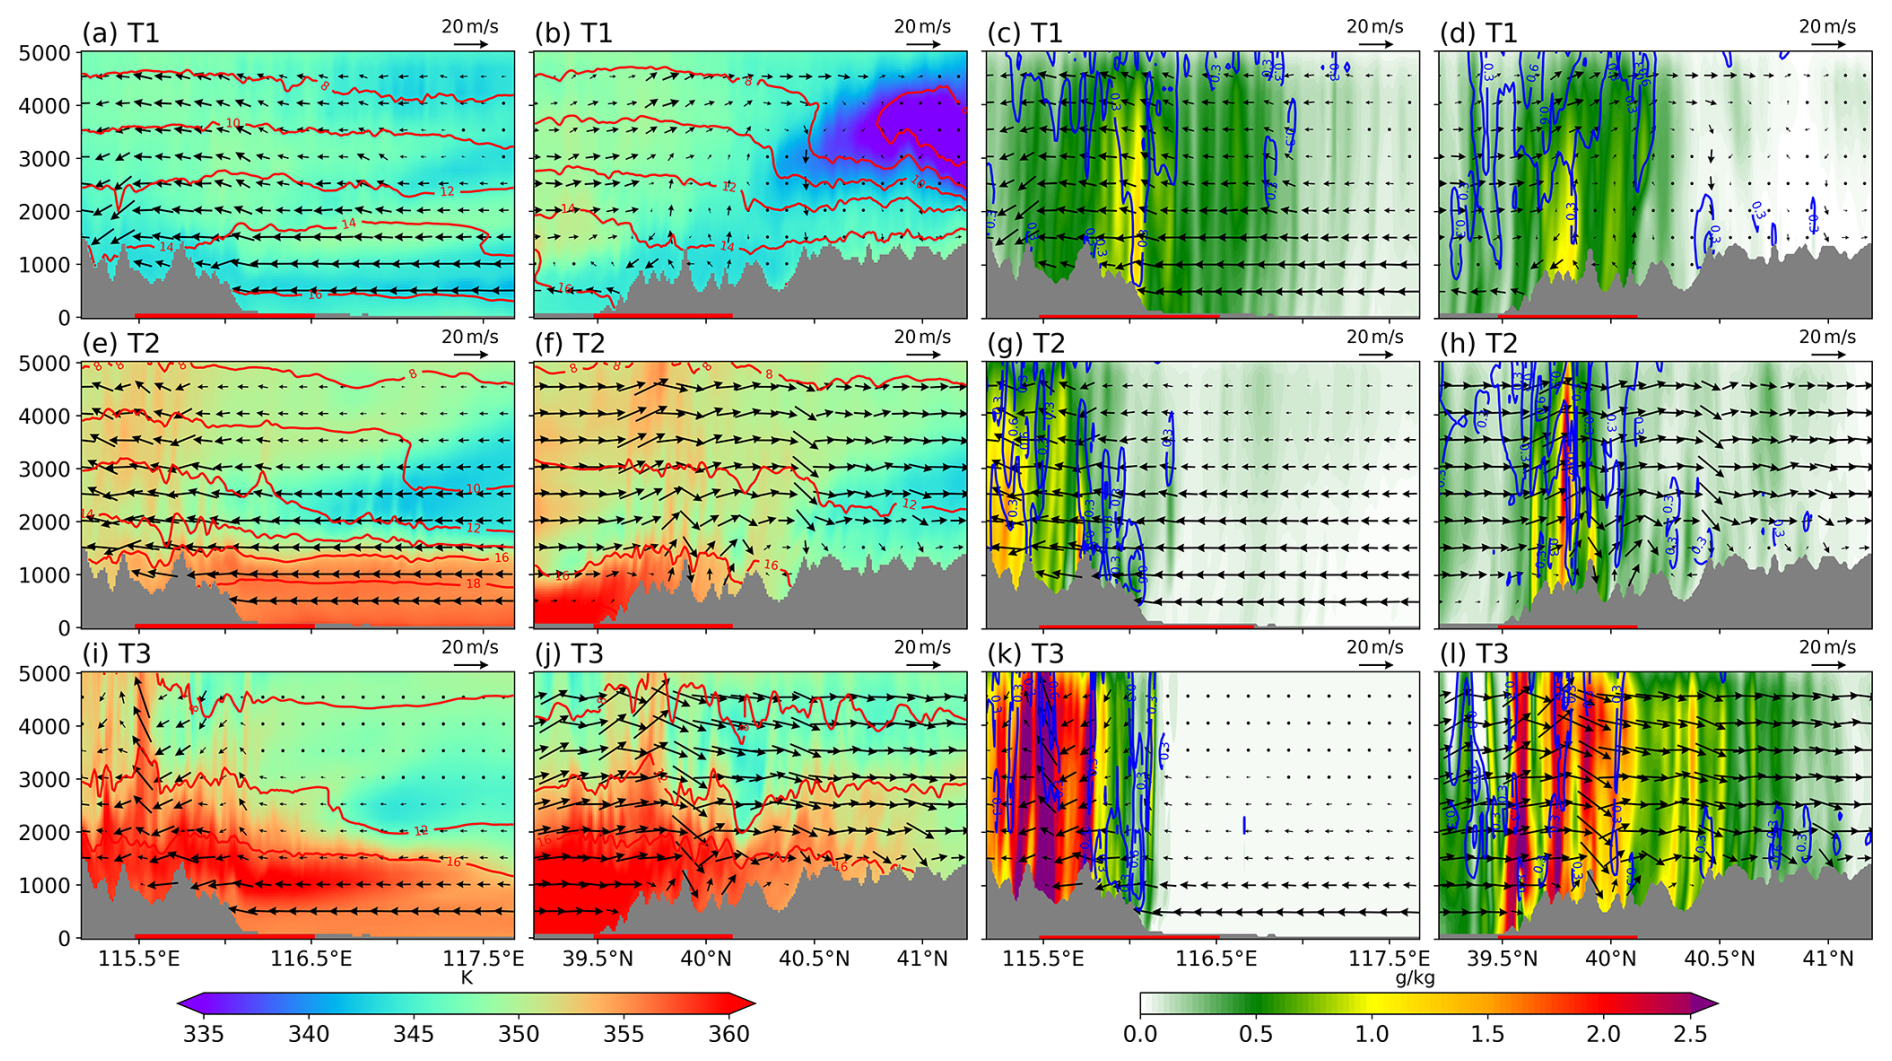
Figure 15Meridional-vertical and zonal-vertical profiles for the LU_nourb schemes. The physical quantities are consistent with those shown in Fig. 13.
4.1 The intention of experiment design
In this study, simulations were conducted using the WRF model to investigate the changes in the timing and spatial distribution of precipitation during the “23 ⋅ 7” event caused by the effects of orography and urban land use. Previous studies have also analyzed the mechanisms related to precipitation and the impacts of orography on extreme precipitation events (Gao et al., 2024; Li et al., 2024b). In contrast to previous analyses, the effects of mountain-plain orographic conditions were explored by altering the underlying surfaces as well as investigating the impact of urbanization on this extreme precipitation event. The primary causes of this extreme precipitation event were identified by considering three time periods with significant differences in precipitation and analyzing the changes in basic physical quantities.
It has been pointed out that regional climate models have some limits on reproducing large-scale circulation features (Kukulies et al., 2023; Yu et al., 2024). To address this limitation, spectral nudging to the D01 domain was applied in all schemes. The ERA5 reanalysis data was used to constrain large-scale circulation of the model, while allowing freely development for mesoscale and small-scale processes within the domain (Ma et al., 2022; Miguez-Macho et al., 2005; von Storch et al., 2000; Waldron et al., 1996). Therefore, it can provide a more accurate large-scale flow fields to the inner domains. The simulation results showed that, the orography and land use modifications in this study primarily influenced local circulation patterns and had limited impacts on synoptic-scale weather systems.
4.2 Comparisons with related studies
According to previous research, the maximum reduction in precipitation due to urbanization during warm-season rainfall occurs in the northeastern region of Beijing (Song et al., 2014; Wang et al., 2018). However, in the present study, the largest reduction in precipitation induced by urbanization was observed in the southwestern mountainous region. This difference is mainly caused by the different response patterns of mean and extreme precipitation events. The climatological statistics represent response of mean state, while extreme precipitation is often governed by nonlinear, specific dynamical forcing, and that may cause different distribution pattern (Liu and Niyogi, 2019). As shown in the results, the water vapor transport of this precipitation event was mainly dominated by the southeasterly water vapor flux governed by the large-scale circulation, which thus triggered precipitation in the southwestern piedmont area of the Taihang Mountains. Although precipitation also occurred in the northwestern region, its intensity was weaker than that in the southwestern region, which is also the reason why this precipitation event is distinct from others. Therefore, compared with the changes in the average distribution of seasonal precipitation in Beijing found in previous studies, individual case experiments may simulate precipitation distribution patterns that differ from the multi-year observed accumulated precipitation.
Previous studies also found that, the modifications of local urban land surface can influence local-scale atmospheric circulation (Kim et al., 2021; Sui et al., 2024; Zajic et al., 2011). The widespread presence of impervious surfaces in urban areas restrained surface evaporation, by reducing the upward transport of moisture into the atmosphere. This process can lead to low relative humidity and reduce atmospheric instability, which in turn modifies the local precipitation distribution (Wang et al., 2018). For the extreme precipitation event occurred on 21 July 2012, the precipitation event was mostly generated by convective cells that were triggered by local orography and then propagated along a quasi-stationary linear convective system (Zhang et al., 2013). According to analyses of multiple extreme precipitation events in Beijing in recent years, urbanization can reduce rainfall in the urban area and increases rainfall downwind of the city. In some cases, the larger percentage of sealed area could give rise to the heavier precipitation or extreme rain events (Liu et al., 2021). As different types of precipitation or different weather conditions can lead to complex relationships between precipitation and elevation, even along the same slope (Gnann et al., 2025; Houze, 2012). Therefore, urban effects of each event should be analyzed independently (Liu et al., 2021). This precipitation event is somewhat representative; however, for precipitation events under different initial conditions, further investigation is needed.
4.3 Uncertainty in the experiment simulation
The choice of removing the terrain with an elevation above 100 m was adopted in this study to ensure that the terrain in other regions would not be affected while eliminates the terrain of the Taihang and Yanshan Mountains. Similar experimental design had been used in other researches (Song and Shao, 2023; Saurral et al., 2015; Insel et al., 2010; Boos and Kuang, 2010). To detect the influence of the terrain removal operation, the experiment was repeated after removing all the terrain in the entire research area and the simulation of completely flat terrain was explored. It can be seen from Fig. S5 that the spatial patterns of precipitation are similar for the schemes of 100 and 0 m removal experiment. The center of maximum precipitation in 0 m removal experiment shifts eastward. This is mainly because the flat terrain enhanced the northward transport of water vapor and further slowed the dissipation of the remnant low of Doksuri. It therefore increases the precipitable water over the region and leads to a more intense precipitation event. Statistically, the mean precipitation intensity is 4.2 and 4.7 mm h−1 for the 100 and 0 m removal experiment, respectively. The RMSE and MAE of precipitation intensity is 1.54 and 1.17 mm h−1 between these two schemes and the correlation coefficient is 0.74. The results proved the strong relationships between the precipitations from 100 and 0 m removal experiment schemes, which may apply to other precipitation related variables.
The simulations were conducted using selected parameterization schemes and the impacts of the underlying surface were analyzed in this study. Physical parameterization schemes are widely recognized to exert substantial impacts on precipitation simulations, affecting not only intensity and duration, but also spatiotemporal distribution patterns. The parameterization method adopted in this study had also been used in other studies about urban extreme precipitation events (Xian et al., 2023; Wang et al., 2018; Ryu et al., 2016; Huang and Gao, 2017; Tian et al., 2017), which can partly can prove the rationality of this study. Additional investigations into the parameterization schemes governing this precipitation event are required to elucidate the specific atmospheric conditions and physical mechanisms. Furthermore, due to constraints in data accessibility, only the 2020 MODIS land use dataset was obtained and used in our simulations, despite potential temporal mismatches with other input data periods. The Sentinel-2 satellite observations were further detected to assess the potential biases in land use between 2020 and 2023. The urban extent exhibited minimal variation between these years (Fig. S6), validating the temporal stability of the MODIS baseline. However, the inherent differences in classification schemes between MODIS and Sentinel-2 precluded direct data integration or substitution. Therefore, the 2020 MODIS dataset was retained as the most recent consistent one, though it may introduce some uncertainties into the results.
Besides, the concentrations of aerosols emitted in urban areas could also have influenced the extreme precipitation because it is largely driven by the coalescence of cloud droplets. Studies have shown that aerosols can lead to the formation of smaller-sized cloud droplets, increasing the effective radius of precipitation, and thus impact convective rainfall (Sun et al., 2022; Zhong et al., 2015). In addition, topographic variations can also affect the generation of cloud particles (Lee et al., 2018; Mazzetti et al., 2021). However, this study focuses on the impact of natural factors, particularly the underlying surface, on precipitation events. Aerosols are largely attributed to anthropogenic factors, therefore are not involved in this study and would be considered in future research.
In this study, the WRF model was used to analyze the extreme precipitation event that occurred in the Beijing region from 29 July to 2 August 2023. The effects of orography and land use on the precipitation process were evaluated by removing the orography and replacing urban land use types with croplands from the updated land use experiment group. The results showed that, the areas influenced most significantly by orography were concentrated in the southwestern mountainous region of Beijing. Presence of terrain caused orographic uplift and increased the precipitation within the mountainous area by more than 40 % during the event. This main because that the mountainous area blocked the existence of the low-pressure system of typhoon Doksuri from propagating northward and lead to extended duration of the precipitation event by approximately 12 h. The underlying urban surfaces also altered the overall precipitation process. For the scheme removing the underlying urban surfaces the enhanced water vapor flux transported by low-level easterly winds to the southwestern mountainous region of the city increased the accumulation of energy and water vapor in the region. After 31 July, the accumulation of sufficient energy and moisture in the southwestern mountainous region strengthened the intensity of precipitation. In addition, removing the underlying urban surface caused an increase in the wind speed in the plain areas, which led to large convergence at the mountain boundary and contributed to stronger precipitation. These findings can help us with the prevention and response to similar future events, and possibly reduce the likelihood of disasters.
The ERA5 reanalysis data can be downloaded at Climate Data Store (https://cds.climate.copernicus.eu, last access: 23 September 2024). The hourly gauge observations were from the China Meteorological Administration (version 2.0; https://data.cma.cn/en, last access: 30 October 2024). The CMOPRH precipitation data were obtained from Climate Prediction Center (https://www.ncei.noaa.gov/products/climate-data-records/precipitation-cmorph, last access: 27 September 2024). The updated land use/land cover data from MCD12Q1 V6 over Beijing region are available from the Land Processes Distributed Active Archive Center (https://lpdaac.usgs.gov/, last access: 22 August 2024).
The supplement related to this article is available online at https://doi.org/10.5194/wcd-7-743-2026-supplement.
HC: Conceptualization; formal analysis; methodology; software; validation; visualization; writing – original draft; writing – review and editing. HY: Conceptualization; methodology; writing – review and editing. XZ: methodology; writing – review and editing. GW: Conceptualization; data curation; funding acquisition; investigation resources; supervision; writing – original draft; writing – review and editing.
The contact author has declared that none of the authors has any competing interests.
Publisher's note: Copernicus Publications remains neutral with regard to jurisdictional claims made in the text, published maps, institutional affiliations, or any other geographical representation in this paper. The authors bear the ultimate responsibility for providing appropriate place names. Views expressed in the text are those of the authors and do not necessarily reflect the views of the publisher.
The authors thank the editor and the reviewers for their constructive comments that lead to significant improvement of this paper.
This research has been supported by the National Natural Science Foundation of China (grant nos. 42077421 and 41930970).
This paper was edited by Dariusz Baranowski and reviewed by Wei Shangguan and one anonymous referee.
Ayat, H., Evans, J. P., Sherwood, S. C., and Soderholm, J.: Intensification of subhourly heavy rainfall, Science, 378, 655–659, https://doi.org/10.1126/science.abn8657, 2022.
Bhattarai, S. and Talchabhadel, R.: Comparative analysis of satellite-based precipitation data across the CONUS and Hawaii: Identifying optimal satellite performance, Remote Sensing, 16, 3058, https://doi.org/10.3390/rs16163058, 2024.
Boos, W. R. and Kuang, Z.: Dominant control of the South Asian monsoon by orographic insulation versus plateau heating, Nature, 463, 218–222, https://doi.org/10.1038/nature08707, 2010.
Bornstein, R. and Lin, Q. L.: Urban heat islands and summertime convective thunderstorms in Atlanta: three case studies, Atmos. Environ., 34, 507–516, https://doi.org/10.1016/S1352-2310(99)00374-X, 2000.
Chen, F. and Dudhia, J.: Coupling an advanced land surface-hydrology model with the Penn State-NCAR MM5 modeling system. Part II: Preliminary model validation, Mon. Weather Rev., 129, 587–604, https://doi.org/10.1175/1520-0493(2001)129<0587:CAALSH>2.0.CO;2, 2001.
Chen, F., Kusaka, H., Bornstein, R., Ching, J., Grimmond, C. S. B., Grossman-Clarke, S., Loridan, T., Manning, K. W., Martilli, A., Miao, S. G., Sailor, D., Salamanca, F. P., Taha, H., Tewari, M., Wang, X. M., Wyszogrodzki, A. A., and Zhang, C. L.: The integrated WRF/urban modelling system: development, evaluation, and applications to urban environmental problems, Int. J. Climatol., 31, 273–288, https://doi.org/10.1002/joc.2158, 2011.
Chen, M. X., Wang, Y. C., Gao, F., and Xiao, X.: Diurnal evolution and distribution of warm-season convective storms in different prevailing wind regimes over contiguous North China, J. Geophys. Res.-Atmos., 119, 2742–2763, https://doi.org/10.1002/2013JD021145, 2014.
Cornejo, I. C., Rowel, A. K., Rasmussen, K. L., and Dehartb, J. C.: Orographic controls on extreme precipitation associated with a mei-yu front, Mon. Weather Rev., 152, 531–551, https://doi.org/10.1175/MWR-D-23-0170.1, 2024.
Dai, P. X., Nie, J., Yu, Y., and Wu, R. G.: Constraints on regional projections of mean and extreme precipitation under warming, P. Natl. Acad. Sci. USA, 121, https://doi.org/10.1073/pnas.2312400121, 2024.
Davolio, S., Buzzi, A., and Malguzzi, P.: Orographic triggering of long lived convection in three dimensions, Meteorol. Atmos. Phys., 103, 35–44, https://doi.org/10.1007/s00703-008-0332-5, 2009.
Dixon, P. G. and Mote, T. L.: Patterns and causes of Atlanta's urban heat island-initiated precipitation, J. Appl. Meteorol., 42, 1273–1284, https://doi.org/10.1175/1520-0450(2003)042<1273:PACOAU>2.0.CO;2, 2003.
Dou, J. J., Wang, Y. C., Bornstein, R., and Miao, S. G.: Observed Spatial Characteristics of Beijing Urban Climate Impacts on Summer Thunderstorms, J. Appl. Meteorol. Clim., 54, 94–105, https://doi.org/10.1175/jamc-d-13-0355.1, 2015.
Du, Y., Chen, G. X., Han, B., Bai, L. Q., and Li, M. H.: Convection initiation and growth at the coast of south China. Part II: Effects of the terrain, coastline, and cold pools, Mon. Weather Rev., 148, 3871–3892, https://doi.org/10.1175/MWR-D-20-0090.1, 2020.
Dudhia, J.: Numerical study of convection observed during the winter monsoon experiment using a mesoscale two-dimensional model, J. Atmos. Sci., 46, 3077–3107, https://doi.org/10.1175/1520-0469(1989)046<3077:NSOCOD>2.0.CO;2, 1989.
Ebert, E. E., Janowiak, J. E., and Kidd, C.: Comparison of near-real-time precipitation estimates from satellite observations and numerical models, B. Am. Meteorol. Soc., 88, 47–64, 2007.
Freitag, B. M., Nair, U. S., and Niyogi, D.: Urban modification of convection and rainfall in complex terrain, Geophys. Res. Lett., 45, 2507–2515, https://doi.org/10.1002/2017GL076834, 2018.
Friedl, M. and Sulla-Menashe, D.: MCD12Q1 MODIS/Terra+Aqua land cover type yearly L3 global 500m SIN grid V006, NASA EOSDIS Land Processes Distributed Active Archive Center [data set], https://doi.org/10.5067/MODIS/MCD12Q1.006, 2019.
Fu, Y. Y., Jiang, S. J., Mao, Y. N., and Wu, G. C.: Urbanization reshapes extreme precipitation metrics in typical urban agglomerations of Eastern China, Atmos. Res., 300, 107253, https://doi.org/10.1016/j.atmosres.2024.107253, 2024.
Gao, X. Y., Sun, J. S., Yin, J. F., Abulikemu, A., Wu, C., Liang, X. D., and Xia, R. D.: The impact of mountain-plain thermal contrast on precipitation distributions during the ”23⋅7” record-breaking heavy rainfall over North China, Atmos. Res., 310, 107582, https://doi.org/10.1016/j.atmosres.2024.107582, 2024.
Gao, Z. B., Zhu, J. S., Guo, Y., Luo, N., Fu, Y., and Wang, T. T.: Impact of land surface processes on a record-breaking rainfall event on May 06-07, 2017, in Guangzhou, China, J. Geophys. Res.-Atmos., 126, e2020JD032997, https://doi.org/10.1029/2020JD032997, 2021.
Gimeno, L., Drumond, A., Nieto, R., Trigo, R. M., and Stohl, A.: On the origin of continental precipitation, Geophys. Res. Lett., 37, L13804, https://doi.org/10.1029/2010gl043712, 2010.
Gnann, S., Baldwin, J. W., Cuthbert, M. O., Gleeson, T., Schwanghart, W., and Wagener, T.: The Influence of Topography on the Global Terrestrial Water Cycle, Rev. Geophys., 63, e2023RG000810, https://doi.org/10.1029/2023RG000810, 2025.
Gómez, B. and Miguez-Macho, G.: The impact of wave number selection and spin-up time in spectral nudging, Q. J. Roy. Meteor. Soc., 143, 1772–1786, https://doi.org/10.1002/qj.3032, 2017.
He, H. Z. and Zhang, F. Q.: Diurnal variations of warm-season precipitation over northern China, Mon. Weather Rev., 138, 1017–1025, https://doi.org/10.1175/2010MWR3356.1, 2010.
He, Y., Wang, J., and Feng, J.: A Typical Weakly Forced Mountain-To-Plain Extreme Precipitation Event Exacerbated by Urbanization in Beijing, J. Geophys. Res.-Atmos., 128, e2023JD039275, https://doi.org/10.1029/2023JD039275, 2023.
Hersbach, H., Bell, B., Berrisford, P., Hirahara, S., Horányi, A., Muñoz-Sabater, J., Nicolas, J., Peubey, C., Radu, R., Schepers, D., Simmons, A., Soci, C., Abdalla, S., Abellan, X., Balsamo, G., Bechtold, P., Biavati, G., Bidlot, J., Bonavita, M., De Chiara, G., Dahlgren, P., Dee, D., Diamantakis, M., Dragani, R., Flemming, J., Forbes, R., Fuentes, M., Geer, A., Haimberger, L., Healy, S., Hogan, R. J., Hólm, E., Janisková, M., Keeley, S., Laloyaux, P., Lopez, P., Lupu, C., Radnoti, G., de Rosnay, P., Rozum, I., Vamborg, F., Villaume, S., and Thépaut, J. N.: The ERA5 global reanalysis, Q. J. Roy. Meteor. Soc., 146, 1999–2049, https://doi.org/10.1002/qj.3803, 2020.
Hjelmfelt, M. R.: Numerical simulation of the effects of St. Louis on mesoscale boundary-layer airflow and vertical air motion: Simulations of urban vs non-urban effects, J. Appl. Meteorol., 21, 1239–1257, https://doi.org/10.1175/1520-0450(1982)021<1239:NSOTEO>2.0.CO;2, 1982.
Holst, C. C., Tam, C.-Y., and Chan, J. C. L.: Sensitivity of urban rainfall to anthropogenic heat flux: A numerical experiment, Geophys. Res. Lett., 43, 2240–2248, https://doi.org/10.1002/2015GL067628, 2016.
Hong, S. Y. and Lim, J.-O. J.: The WRF single-moment 6-class microphysics scheme (WSM6), J. Korean Meteor. Soc., 42, 129–151, 2006.
Hong, S. Y., Noh, Y., and Dudhia, J.: A new vertical diffusion package with an explicit treatment of entrainment processes, Mon. Weather Rev., 134, 2318–2341, https://doi.org/10.1175/MWR3199.1, 2006.
Houze Jr., R. A.: Orographic effects on precipitating clouds, Rev. Geophys., 50, https://doi.org/10.1029/2011RG000365, 2012.
Huang, D. and Gao, S.: Impact of different cumulus convective parameterization schemes on the simulation of precipitation over China, Tellus A, 69, 1406264, https://doi.org/10.1080/16000870.2017.1406264, 2017.
Huang, Y. J., Liu, Y. B., Liu, Y. W., Li, H. Y., and Knievel, J. C.: Mechanisms for a Record-Breaking Rainfall in the Coastal Metropolitan City of Guangzhou, China: Observation Analysis and Nested Very Large Eddy Simulation With the WRF Model, J. Geophys. Res.-Atmos., 124, 1370–1391, https://doi.org/10.1029/2018jd029668, 2019.
Insel, N., Poulsen, C. J., and Ehlers, T. A.: Influence of the Andes Mountains on South American moisture transport, convection, and precipitation, Clim. Dynam., 35, 1477–1492, https://doi.org/10.1007/s00382-009-0637-1, 2010.
Jauregui, E. and Romales, E.: Urban effects on convective precipitation in Mexico city, Atmos. Environ., 30, 3383–3389, https://doi.org/10.1016/1352-2310(96)00041-6, 1996.
Jiang, S.-h., Zhou, M., Ren, L.-l., Cheng, X.-r., and Zhang, P.-j.: Evaluation of latest TMPA and CMORPH satellite precipitation products over Yellow River Basin, Water Science and Engineering, 9, 87–96, https://doi.org/10.1016/j.wse.2016.06.002, 2016.
Jiménez, P. A., Dudhia, J., González-Rouco, J. F., Navarro, J., Montávez, J. P., and García-Bustamante, E.: A Revised Scheme for the WRF Surface Layer Formulation, Mon. Weather Rev., 140, 898–918, https://doi.org/10.1175/MWR-D-11-00056.1, 2012.
Joyce, R. J., Janowiak, J. E., Arkin, P. A., and Xie, P. P.: CMORPH: A method that produces global precipitation estimates from passive microwave and infrared data at high spatial and temporal resolution, J. Hydrometeorol., 5, 487–503, https://doi.org/10.1175/1525-7541(2004)005<0487:CAMTPG>2.0.CO;2, 2004.
Kain, J. S.: The Kain-Fritsch convective parameterization: An update, J. Appl. Meteorol., 43, 170–181, https://doi.org/10.1175/1520-0450(2004)043<0170:TKCPAU>2.0.CO;2, 2004.
Kim, G., Lee, J., Lee, M.-I., and Kim, D.: Impacts of urbanization on atmospheric circulation and aerosol transport in a coastal environment simulated by the WRF-Chem coupled with urban canopy model, Atmos. Environ., 249, 118253, https://doi.org/10.1016/j.atmosenv.2021.118253, 2021.
Kukulies, J., Prein, A. F., Curio, J., Yu, H., and Chen, D.: Kilometer-scale multimodel and multiphysics ensemble simulations of a mesoscale convective system in the lee of the Tibetan Plateau: Implications for climate simulations, J. Climate, 36, 5963–5987, https://doi.org/10.1175/JCLI-D-22-0240.1, 2023.
Lee, J. T., Ko, K. Y., Lee, D. I., You, C. H., and Liou, Y. C.: Enhancement of orographic precipitation in Jeju Island during the passage of Typhoon Khanun (2012), Atmos. Res., 201, 58–71, https://doi.org/10.1016/j.atmosres.2017.10.013, 2018.
Li, S., Chen, Y. N., Wei, W., Fang, G. H., and Duan, W. L.: The increase in extreme precipitation and its proportion over global land, J. Hydrol., 628, 130456, https://doi.org/10.1016/j.jhydrol.2023.130456, 2024a.
Li, W. B., Chen, S., Chen, G. X., Sha, W. M., Luo, C., Feng, Y. R., Wen, Z. P., and Wang, B. M.: Urbanization signatures in strong versus weak precipitation over the Pearl River Delta metropolitan regions of China, Environ. Res. Lett., 6, 034020, https://doi.org/10.1088/1748-9326/6/3/034020, 2011.
Li, X., Zhao, S., and Wang, D.: Roles of synoptic characteristics and microphysics processes on the heavy rain event over Beijing region during 29 July to 2 August 2023, Frontiers in Earth Science, 12, 1394342, https://doi.org/10.3389/feart.2024.1394342, 2024b.
Liang, P. and Ding, Y. H.: The Long-term Variation of Extreme Heavy Precipitation and Its Link to Urbanization Effects in Shanghai during 1916–2014, Adv. Atmos. Sci., 34, 321–334, https://doi.org/10.1007/s00376-016-6120-0, 2017.
Lin, Y. L., Chiao, S., Wang, T. A., Kaplan, M. L., and Weglarz, R. P.: Some common ingredients for heavy orographic rainfall, Weather Forecast., 16, 633-660, https://doi.org/10.1175/1520-0434(2001)016<0633:SCIFHO>2.0.CO;2, 2001.
Liu, J. and Niyogi, D.: Meta-Analysis of urbanization impact on rainfall modification, Scientific Reports, 9, 7301, https://doi.org/10.1038/s41598-019-42494-2, 2019.
Liu, J., Schlünzen, K. H., Frisius, T., and Tian, Z.: Effects of urbanization on precipitation in Beijing, Phys. Chem. Earth Pt A/B/C, 122, 103005, https://doi.org/10.1016/j.pce.2021.103005, 2021.
Liu, P., Tsimpidi, A. P., Hu, Y., Stone, B., Russell, A. G., and Nenes, A.: Differences between downscaling with spectral and grid nudging using WRF, Atmos. Chem. Phys., 12, 3601–3610, https://doi.org/10.5194/acp-12-3601-2012, 2012.
Liu, S., Wang, J., and Wang, H.: Assessing 10 satellite precipitation products in capturing the July 2021 extreme heavy rain in Henan, China, J. Meteorol. Res/-PRC, 36, 798–808, https://doi.org/10.1007/s13351-022-2053-y, 2022.
Ma, M., Hui, P., Liu, D., Zhou, P., and Tang, J.: Convection-permitting regional climate simulations over Tibetan Plateau: re-initialization versus spectral nudging, Clim. Dynam., 58, 1719–1735, https://doi.org/10.1007/s00382-021-05988-2, 2022.
Ma, Y., Yang, Y., Mai, X., Qiu, C., Long, X., and Wang, C.: Comparison of Analysis and Spectral Nudging Techniques for Dynamical Downscaling with the WRF Model over China, Adv. Meteorol., 2016, 4761513, https://doi.org/10.1155/2016/4761513, 2016.
Mahoney, K. M.: The representation of cumulus convection in high-resolution simulations of the 2013 Colorado front range flood, Mon. Weather Rev., 144, 4265–4278, https://doi.org/10.1175/MWR-D-16-0211.1, 2016.
Mazzetti, T. O., Geerts, B., Xue, L. L., Tessendorf, S., Weeks, C., and Wang, Y. G.: Potential for Ground-Based Glaciogenic Cloud Seeding over Mountains in the Interior Western United States and Anticipated Changes in a Warmer Climate, J. Appl. Meteorol. Clim., 60, 1245–1263, https://doi.org/10.1175/JAMC-D-20-0288.1, 2021.
Miguez-Macho, G., Stenchikov, G. L., and Robock, A.: Spectral nudging to eliminate the effects of domain position and geometry in regional climate model simulations, J. Geophys. Res.-Atmos., 109, 2003JD004495, https://doi.org/10.1029/2003JD004495, 2004.
Miguez-Macho, G., Stenchikov, G. L., and Robock, A.: Regional climate simulations over North America: Interaction of local processes with improved large-scale flow, J. Climate, 18, 1227–1246, https://doi.org/10.1175/JCLI3369.1, 2005.
Mlawer, E. J., Taubman, S. J., Brown, P. D., Iacono, M. J., and Clough, S. A.: Radiative transfer for inhomogeneous atmospheres: RRTM, a validated correlated-k model for the longwave, J. Geophys. Res.-Atmos., 102, 16663-16682, https://doi.org/10.1029/97JD00237, 1997.
Nicolas, Q. and Boos, W. R.: Understanding the spatiotemporal variability of tropical orographic rainfall using convective plume buoyancy, J. Climate, 37, 1737–1757, https://doi.org/10.1175/JCLI-D-23-0340.1, 2024.
Nie, W. S., Zaitchik, B. F., Ni, G. H., and Sun, T.: Impacts of Anthropogenic Heat on Summertime Rainfall in Beijing, J. Hydrometeorol., 18, 693–712, https://doi.org/10.1175/JHM-D-16-0173.1, 2017.
Niyogi, D., Pyle, P., Lei, M., Arya, S. P., Kishtawal, C. M., Shepherd, M., Chen, F., and Wolfe, B.: Urban Modification of Thunderstorms: An Observational Storm Climatology and Model Case Study for the Indianapolis Urban Region, J. Appl. Meteorol. Clim., 50, 1129–1144, https://doi.org/10.1175/2010jamc1836.1, 2011.
Oke, T. R.: The energetic basis of the urban heat island, Q. J. Roy. Meteor. Soc., 108, 1–24, https://doi.org/10.1002/qj.49710845502, 1982.
Pei, L., Miao, S.-G., Huang, X.-Y., Yan, Z.-W., and Chen, D.: Assessing the added value of convection-permitting modeling for urban climate research: A case study in eastern China, Advances in Climate Change Research, 16, 1–11, https://doi.org/10.1016/j.accre.2025.01.004, 2025.
Pendergrass, A. G. and Knutti, R.: The uneven nature of daily precipitation and its change, Geophys. Res. Lett., 45, 11980–11988, https://doi.org/10.1029/2018gl080298, 2018.
Ryu, Y.-H., Smith, J. A., Bou-Zeid, E., and Baeck, M. L.: The influence of land surface heterogeneities on heavy convective rainfall in the Baltimore–Washington metropolitan area, Mon. Weather Rev., 144, 553–573, https://doi.org/10.1175/MWR-D-15-0192.1, 2016.
Saurral, R. I., Camilloni, I. A., and Ambrizzi, T.: Links between topography, moisture fluxes pathways and precipitation over South America, Clim. Dynam., 45, 777–789, https://doi.org/10.1007/s00382-014-2309-z, 2015.
Skamarock, W. C., Klemp J. B., Dudhia J., Gill D. O., Liu Z., Berner J., Wang W., Powers J. G., Duda M. G., Barker D. M., and Huang X.-Y.: A Description of the Advanced Research WRF Version 4, NCAR Tech. Note NCAR/TN-556+STR, 145, https://doi.org/10.5065/1dfh-6p97, 2019.
Smith, R. B.: Progress on the theory of orographic precipitation, in: Tectonics, Climate, and Landscape Evolution, edited by: Willett, S. D., Hovius, N., Brandon, M. T., and Fisher, D. M., Geological Society of America, https://doi.org/10.1130/2006.2398(01), 2006.
Song, X. M., Zhang, J. Y., AghaKouchak, A., Sen Roy, S., Xuan, Y. Q., Wang, G. Q., He, R. M., Wang, X. J., and Liu, C. S.: Rapid urbanization and changes in spatiotemporal characteristics of precipitation in Beijing metropolitan area, J. Geophys. Res.-Atmos., 119, 11250–11271, https://doi.org/10.1002/2014JD022084, 2014.
Song, Y. and Shao, M.: Impacts of Complex Terrain Features on Local Wind Field and PM2.5 Concentration, Atmosphere, 14, 761, https://doi.org/10.3390/atmos14050761, 2023.
Spero, T. L., Otte, M. J., Bowden, J. H., and Nolte, C. G.: Improving the representation of clouds, radiation, and precipitation using spectral nudging in the Weather Research and Forecasting model, J. Geophys. Res.-Atmos., 119, 11682–11694, https://doi.org/10.1002/2014jd022173, 2014.
Sui, X., Yang, Z.-L., Shepherd, M., and Niyogi, D.: Global scale assessment of urban precipitation anomalies, P. Natl. Acad. Sci. USA, 121, e2311496121, https://doi.org/10.1073/pnas.2311496121, 2024.
Sun, N., Fu, Y. F., Zhong, L., and Li, R.: Aerosol effects on the vertical structure of precipitation in East China, npj Climate and Atmospheric Science, 5, https://doi.org/10.1038/s41612-022-00284-0, 2022.
Sun, Q., Zhang, X., Zwiers, F., Westra, S., and Alexander, L. V.: A Global, Continental, and Regional Analysis of Changes in Extreme Precipitation, J. Climate, 34, 243–258, https://doi.org/10.1175/JCLI-D-19-0892.1, 2021.
Sun, R., Yuan, H., Liu, X., and Jiang, X.: Evaluation of the latest satellite–gauge precipitation products and their hydrologic applications over the Huaihe River basin, J. Hydrol., 536, 302–319, https://doi.org/10.1016/j.jhydrol.2016.02.054, 2016.
Tewari, M., Chen, F., Dudhia, J., Ray, P., Miao, S. G., Nikolopoulos, E., and Treinish, L.: Understanding the sensitivity of WRF hindcast of Beijing extreme rainfall of 21 July 2012 to microphysics and model initial time, Atmos. Res., 271, https://doi.org/10.1016/j.atmosres.2022.106085, 2022.
Tian, J., Liu, J., Wang, J., Li, C., Yu, F., and Chu, Z.: A spatio-temporal evaluation of the WRF physical parameterisations for numerical rainfall simulation in semi-humid and semi-arid catchments of Northern China, Atmos. Res., 191, 141–155, https://doi.org/10.1016/j.atmosres.2017.03.012, 2017.
Trenberth, K. E., Dai, A., Rasmussen, R. M., and Parsons, D. B.: The changing character of precipitation, B. Am. Meteorol. Soc., 84, 1205–1217, https://doi.org/10.1175/bams-84-9-1205, 2003.
von Storch, H., Langenberg, H., and Feser, F.: A spectral nudging technique for dynamical downscaling purposes, Mon. Weather Rev., 128, 3664–3673, https://doi.org/10.1175/1520-0493(2000)128<3664:ASNTFD>2.0.CO;2, 2000.
Waldron, K. M., Paegle, J., and Horel, J. D.: Sensitivity of a spectrally filtered and nudged limited-area model to outer model options, Mon. Weather Rev., 124, 529–547, https://doi.org/10.1175/1520-0493(1996)124<0529:SOASFA>2.0.CO;2, 1996.
Wang, J., Feng, J., and Yan, Z.: Impact of extensive urbanization on summertime rainfall in the Beijing region and the role of local precipitation recycling, J. Geophys. Res.-Atmos., 123, 3323–3340, https://doi.org/10.1002/2017JD027725, 2018.
Wang, J., Feng, J. M., and Yan, Z. W.: Potential sensitivity of warm season precipitation to urbanization extents: Modeling study in Beijing-Tianjin-Hebei urban agglomeration in China, J. Geophys. Res.-Atmos., 120, 9408–9425, https://doi.org/10.1002/2015JD023572, 2015.
Wang, X. Q. and Gong, Y. B.: The impact of an urban dry island on the summer heat wave and sultry weather in Beijing City, Chinese Sci. Bull., 55, 1657–1661, https://doi.org/10.1007/s11434-010-3088-5, 2010.
Wei, P., Xu, X., Xue, M., Zhang, C. Y., Wang, Y., Zhao, K., Zhou, A., Zhang, S. S., and Zhu, K. F.: On the key dynamical processes supporting the 21.7 Zhengzhou record-breaking hourly rainfall in China, Adv. Atmos. Sci., 40, 337–349, https://doi.org/10.1007/s00376-022-2061-y, 2023.
Wu, G. C., Li, Y., Qin, S., Mao, Y. N., and Wang, K. C.: Precipitation unevenness in gauge observations and eight reanalyses from 1979 to 2018 over China, J. Climate, 34, 9797–9810, https://doi.org/10.1175/jcli-d-21-0316.1, 2021.
Xia, R. D. and Zhang, D. L.: An observational analysis of three extreme rainfall episodes of 19-20 July 2016 along the Taihang Mountains in North China, Mon. Weather Rev., 147, 4199–4220, https://doi.org/10.1175/MWR-D-18-0402.1, 2019.
Xian, T., Guo, J., Zhao, R., Su, T., and Li, Z.: The impact of urbanization on mesoscale convective systems in the Yangtze River Delta region of China: Insights gained from observations and modeling, J. Geophys. Res.-Atmos., 128, e2022JD037709, https://doi.org/10.1029/2022JD037709, 2023.
Yang, P., Ren, G. Y., and Yan, P. C.: Evidence for a strong association of short-duration intense rainfall with urbanization in the Beijing urban area, J. Climate, 30, 5851–5870, https://doi.org/10.1175/JCLI-D-16-0671.1, 2017.
Yin, J. F., Zhang, D. L., Luo, Y. L., and Ma, R. Y.: On the extreme rainfall event of 7 May 2017 over the coastal city of Guangzhou. Part I: Impacts of urbanization and orography, Mon. Weather Rev., 148, 955–979, https://doi.org/10.1175/MWR-D-19-0212.1, 2020.
Yu, H., Prein, A. F., Qi, D., and Wang, K.: Kilometer-scale multi-physics simulations of heavy precipitation events in Northeast China, Clim. Dynam., 62, 9207–9231, https://doi.org/10.1007/s00382-024-07386-w, 2024.
Yu, M. and Liu, Y. M.: The possible impact of urbanization on a heavy rainfall event in Beijing, J. Geophys. Res.-Atmos., 120, 8132-8143, https://doi.org/10.1002/2015JD023336, 2015.
Yu, M., Miao, S. G., and Li, Q. C.: Synoptic analysis and urban signatures of a heavy rainfall on 7 August 2015 in Beijing, J. Geophys. Res.-Atmos., 122, 65–78, https://doi.org/10.1002/2016JD025420, 2017.
Zajic, D., Fernando, H. J. S., Calhoun, R., Princevac, M., Brown, M. J., and Pardyjak, E. R.: Flow and turbulence in an urban canyon, J. Appl. Meteorol. Clim., 50, 203–223, https://doi.org/10.1175/2010JAMC2525.1, 2011.
Zhang, D.-L., Lin, Y., Zhao, P., Yu, X., Wang, S., Kang, H., and Ding, Y.: The Beijing extreme rainfall of 21 July 2012: “Right results” but for wrong reasons, Geophys. Res. Lett., 40, 1426–1431, https://doi.org/10.1002/grl.50304, 2013.
Zhang, W. X., Furtado, K., Zhou, T. J., Wu, P. L., and Chen, X. L.: Constraining extreme precipitation projections using past precipitation variability, Nat. Commun., 13, 6319, https://doi.org/10.1038/s41467-022-34006-0, 2022.
Zhang, Y. Z., Miao, S. G., Dai, Y. J., and Bornstein, R.: Numerical simulation of urban land surface effects on summer convective rainfall under different UHI intensity in Beijing, J. Geophys. Res.-Atmos., 122, 7851–7868, https://doi.org/10.1002/2017JD026614, 2017.
Zhong, S., Qian, Y., Zhao, C., Leung, R., and Yang, X. Q.: A case study of urbanization impact on summer precipitation in the Greater Beijing Metropolitan Area: Urban heat island versus aerosol effects, J. Geophys. Res.-Atmos., 120, 10903–10914, https://doi.org/10.1002/2015JD023753, 2015.