the Creative Commons Attribution 4.0 License.
the Creative Commons Attribution 4.0 License.
 | 23 Apr 2020
Front–orography interactions during landfall of the 1992 New Year's Day Storm
Clemens Spensberger
Sebastian Schemm
Although following a common synoptic evolution for this region, the 1992 New Year's Day Storm was associated with some of the strongest winds observed along the Norwegian west coast. The narrow wind band along its bent-back front became famous as the “poisonous tail” and paved the way towards today's sting jet terminology. This article re-examines the storm's landfall with a particular focus on the interaction with the orography.
Sensitivity analyses based on WRF simulations demonstrate that the formation and the evolution of the warm-air seclusion and its poisonous tail are largely independent of orography. In contrast, the warm sector of the storm undergoes considerable orographically induced modifications. While moving over the orography, both warm and cold fronts are eroded rapidly. This development fits neither the cold-air-damming paradigm nor the passive-advection paradigm describing front–orography interactions. The warm sector is lifted over the orography, thereby accelerating the occlusion process. The insensitivity of the warm-air seclusion to the orographic modifications of the warm sector raises the question of to which extent these entities are still interacting after the onset of the occlusion process.
- Article
(34810 KB) - Full-text XML
- BibTeX
- EndNote


The 1992 New Year's Day Storm (Norwegian Nyttårsorkanen) was one of the most vigorous winter storms in the history of recorded storms over Norway. Its wind gusts exceeded the upper limits of measurement stations along the Norwegian west coast. Through extrapolation, the Norwegian national weather service (MET Norway) estimated wind gusts exceeding 60 m s−1 and 10 min mean wind speeds exceeding 45 m s−1 at Svinøy lighthouse during landfall (locations and orography shown in Fig. 1; Aune and Harstveit, 1992). Along the coastline from the Svinøy lighthouse to the vicinity of Trondheim, the wind speeds are estimated to have had return periods of more than 200 years (Aune and Harstveit, 1992).
Consequently, the storm attracted the attention of the scientific community. In particular the formation of the extreme wind speeds along the bent-back front and the formation of a warm-air seclusion received attention (Grønås, 1995; Browning, 2004; Clark et al., 2005). With his study, Grønås (1995) introduced the poisonous tail as a widely used metaphor to the scientific literature. The term poisonous tail was already used by the Norwegian forecasting community before the work of Grønås (1995), who learned about it while working as a forecaster at MET Norway in the 1960s. Later, Browning (2004) and Clark et al. (2005) turned the poisonous tail into the “sting at the end of the tail”, which has become a term popular even in the media (Schultz and Browning, 2017). In his analysis of the New Year's Day Storm, Grønås (1995) found that moist diabatic processes played a crucial role in the formation and evolution of the warm-air seclusion. We complement his analysis, investigating the role of front–orography interactions in the evolution of the storm. Specifically, we investigate the role of the landfall on the Scandinavian coastal range (Scandes) in the formation and evolution of the warm-air seclusion, addressing the following questions:
-
Did the landfall of the storm affect the formation of its poisonous tail?
-
Did the landfall affect the track of the New Year's Day Storm?
-
How did the landfall affect the warm and cold fronts of the New Year's Day Storm?
To shed light on these questions, we contrast WRF simulations with double the Scandinavian orography and with no Scandinavian orography.
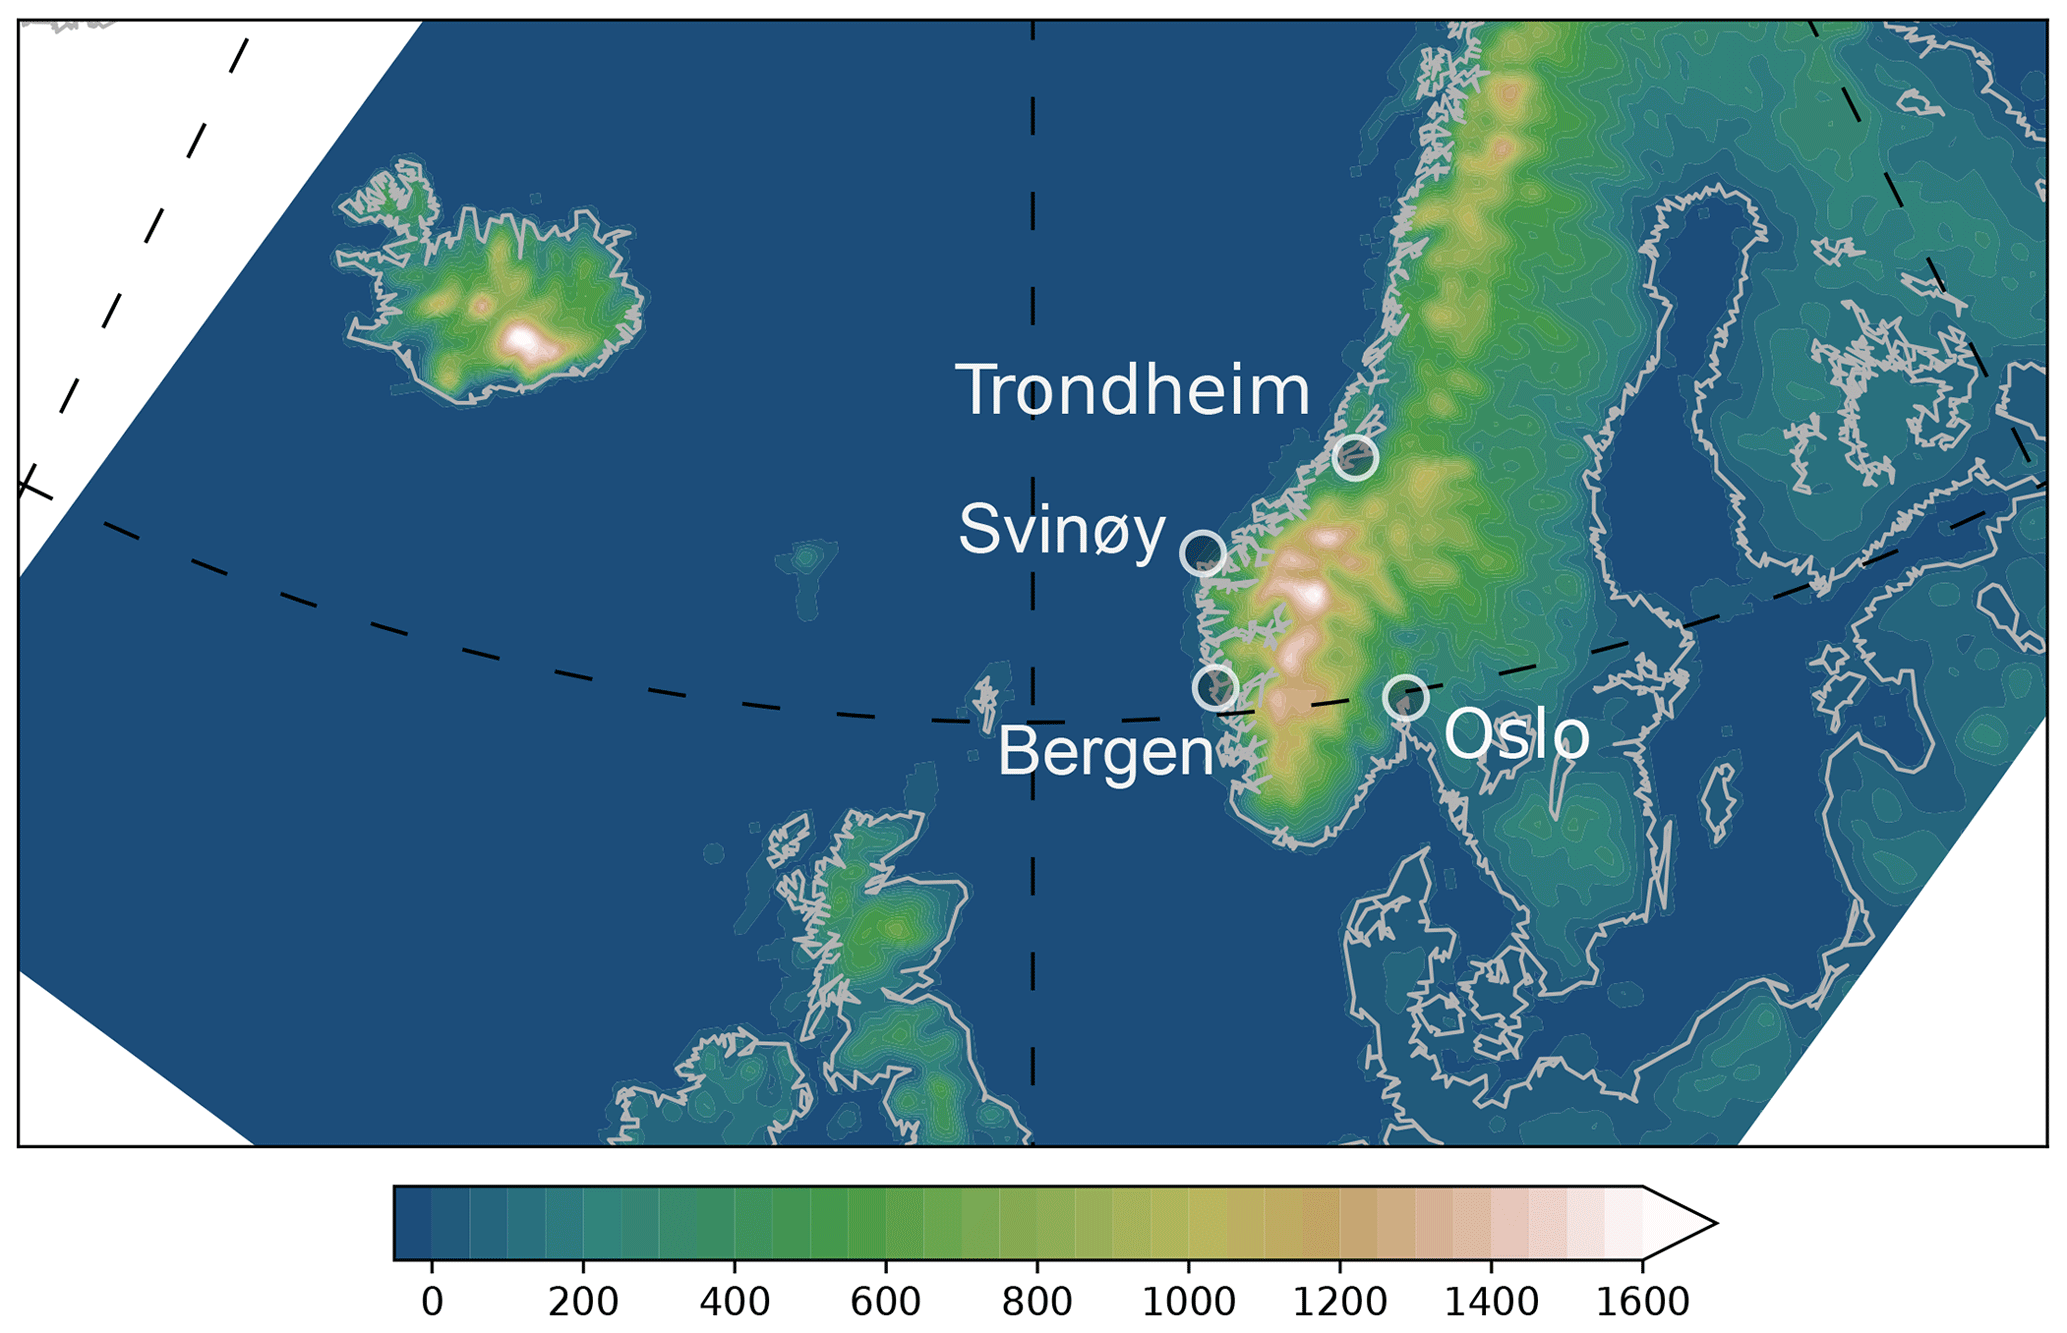
Figure 1Orographic height map (m) from the NORA10 data set. The white circles show the location of some major cities and the Svinøy lighthouse mentioned in the text.
Previous case studies on front–orography interactions often focus only on cold fronts (e.g. Braun et al., 1997; Kljun et al., 2001; Neiman et al., 2004), although a limited number also consider bent-back fronts (e.g. Steenburgh and Mass, 1996) or warm fronts (e.g. Doyle and Bond, 2001). Together, these case studies document numerous processes that can be at play during front–orography interactions, for example front dissipation due to orographic flow deformation (Braun et al., 1997), the formation of barrier jets (Braun et al., 1999; Yang et al., 2017), front retardation due to blocking (Doyle and Bond, 2001; Neiman et al., 2004), as well as foehn and cyclogenesis in the lee (Kljun et al., 2001).
Due to the complexity of the front–orography interplay, only a limited number of conceptual models exist. One of the earliest efforts is presented by Bjerknes and Solberg (1921), who summarized rain observations over Scandinavia in a conceptual model of a warm front moving over a ridge. Their conceptual model includes a pocket of trapped cold air upstream of the ridge and a warm front modified by the vertical motion up- and downstream of the ridge. Davies (1984) and Egger (1992) apply the idea of orographically blocked flow to a non-linear analytical model of cold fronts approaching a triangular ridge. In their model, the approaching cold front is entirely blocked in a certain parameter regime, for example for strong stratification. In contrast, if the flow is less stratified, the approaching front might be linearly advected by flow over the ridge (Blumen and Gross, 1987; Blumen, 1992). Here the flow over the ridge causes a weakening of the front upstream and a strengthening downstream. The antipodal conceptual models of Davies (1984) and Blumen and Gross (1987) provide the framework within which we will interpret our results.
This study is organized as follows. A description of the underlying data sets, model simulations, and analysis methods (Sect. 2) is followed by a detailed synoptic discussion of the event (Sect. 3). In Sect. 4 we investigate the impact of the Scandes on the storm and address the questions we raised. We close with our summary and conclusions (Sect. 5).
We base our analysis on 3-hourly data from the Norwegian Reanalysis Archive (NORA10; Reistad et al., 2011) as well as on sensitivity experiments using the Weather Research and Forecasting model (WRF; Skamarock et al., 2008). The horizontal resolution of the NORA10 data set varies between 10 and 11 km, with the NORA10 orography and domain boundaries indicated in Fig. 1. In the vertical, the data are interpolated from 40 hybrid model levels to 25 pressure levels, covering the lower troposphere (1000–700 hPa) with a uniform resolution of 25 hPa and a resolution of 50 hPa above.
2.1 WRF control and sensitivity simulations
The WRF model setup parallels that of the NORA10 hindcasts. We use a constant horizontal resolution of 10 km but the WRF standard configuration with 60 hybrid model levels in the vertical. In both models the uppermost grid point is at 10 hPa, and the vertical resolution in the middle troposphere is about 35–40 hPa. The WRF output is interpolated to the same 25 pressure levels as the NORA10 data. The domain horizontally covers an area of 6000 km × 4000 km, including most of the North Atlantic and Scandinavia. The domain fully covers the region shown in Fig. 1. The Norwegian west coast is located centrally in the eastern half of the model domain to minimize the impact of the model boundaries.
The initial state and boundary conditions are derived from 6-hourly ECMWF operational analyses. As the operational analyses for the study period do not include sea-surface temperature, we supplement with those from ERA-Interim (Dee et al., 2011). We initialize the model on 31 December 1991 at 06:00 UTC, roughly 21, 24, and 27 h before the landfall of the warm, cold, and bent-back fronts, respectively. We chose this initialization time as a trade-off between having sufficient model spin-up time and the accuracy of the simulation. We tested initialization dates between 30 December 1991 at 12:00 UTC and 31 December 1991 at 12:00 UTC and find that the earlier the initialization date, the weaker the simulated New Year's Day Storm becomes.
We use WRF version 3.8.1 in a configuration with YSU boundary layer physics, the revised MM5 scheme (based on a Monin–Obukhov surface layer with Carlson–Boland viscous sublayer), and the WRF three-class single-moment cloud microphysics scheme. The parameterization of cumulus convection is enabled, using the Kain–Fritsch scheme updated every 5 min. Radiation is calculated using the Rapid Radiative Transfer Model (RRTM) for long wavelengths and the Dudhia scheme for short wavelengths, both updated every 10 min. The land surface is parameterized using a thermal diffusion model with five layers.
To test the sensitivity of the evolution of the New Year's Day Storm to the Scandinavian orography, we compare a simulation with full orography (“Control”) to (a) a simulation in which the orography is removed and the land surface is replaced by ocean (“Ocean”) and (b) a simulation in which we double the height of the Scandes (“Double”). In the Ocean simulation, sea-surface temperatures over the Scandinavian peninsula are defined by iteratively minimizing the local Laplacian given the observed surface temperatures in the surrounding seas (277–280 K in the Atlantic and North Sea; 275–278 K in the Baltic; 273–275 K in the White Sea).
2.2 Front detection
For our analysis of the landfall, we require a front detection scheme to track and visualize the evolution of the fronts close to orography in the comparatively high-resolution NORA10 hindcasts and WRF simulations. There are different approaches for the automated detection of fronts, but all of them struggle to detect fronts in the vicinity of orography. Many of the difficulties arise from the need of higher derivatives to pinpoint the exact location of a front line (e.g. in Hewson, 1998; Jenkner et al., 2010; Berry et al., 2011). We therefore follow the approach of Spensberger and Sprenger (2018) and detect frontal volumes instead of front lines. Frontal volumes are defined as coherent volumes where the local thermodynamic gradient exceeds a given threshold,
and that exceed a given minimum volume. With this approach, we require only a first derivative of a thermodynamic field.
Spensberger and Sprenger (2018) developed this approach to detect fronts in the ERA-Interim data set. In our comparatively high-resolution data sets, mesoscale processes can lead to locally strong thermodynamic gradients independent of a synoptic-scale frontal system. We are however only interested in local thermodynamic gradients associated with a synoptic-scale front, and therefore we require a minimum thermodynamic gradient both at the native resolution of the input data and in a smoothed version of the thermodynamic field. With this extension, we are able to identify only those mesoscale gradients that belong to a synoptic-scale system and define only those as fronts.
For the thermodynamic field τ, we use equivalent potential temperature θe to include both temperature and moisture gradients in the front definition (see Schemm et al., 2017, and Thomas and Schultz, 2019, for a comprehensive discussion on the merits and drawbacks of θe for objective front detection). We detect frontal volumes between 700 and 950 hPa with a minimum volume of 7500 km2 ⋅ 250 hPa. Furthermore, we use a local threshold of 6.0 K (100 km)−1 and a threshold for the smoothed field of 4.5 K (100 km)−1. The conclusions of this study are independent of the exact values used for these thresholds.
To arrive at the lower-resolution data set, we smooth the θe field by 30 passes of a three-point filter, , in both horizontal dimensions. Here, i is the grid point index and * denotes the new value after one pass of the filter. With 30 passes, this filter largely suppresses waves shorter than 10 grid points (approx. 110 km), while waves longer than approximately 20 grid points retain more than 50 % of their amplitude.
3.1 Explosive deepening over the central North Atlantic
We start following the synoptic evolution at 00:00 UTC on 1 January 1992, corresponding to 18 h lead time of the WRF simulations (Fig. 2). At this point in time, the cyclone underwent an explosive deepening of approximately 40 hPa during the preceding 24 h (Grønås, 1995). Its structure is that of a mature cyclone following the Shapiro and Keyser (1990) conceptual model (Fig. 2a, b). The warm sector is bounded on the northern side by a well-developed bent-back front, and to the west by several cold front segments. On the warm front side, however, the θe gradient is below the detection threshold.

Figure 2Frontal evolution for the New Year's Day Storm at 850 hPa. Equivalent potential temperature shading (K) and geopotential height contours with an interval of 50 m. Detected frontal zones are marked by dark shading. The panels show the development from (top row) 00:00 UTC through (bottom row) 12:00 UTC on 1 January 1992 in 3 h intervals. The left column is based on the NORA10 hindcasts and the right on the Control simulation.
At this point in time, the strongest winds occur along the cold front (Fig. 3a), in agreement with, for example, the low-level jet described in Lackmann (2002). This low-level jet ahead of the cold front transports warm moist air towards the cyclone core, providing the inflow to a warm conveyor belt, as indicated by the broad area of stratiform ascent along the bent-back and warm fronts (vertical wind in Fig. 4a, b; cloud observations in Fig. 5). Although the absolute wind speed is smaller along the developing bent-back front than along the cold front jet, stronger ageostrophic winds indicate considerable flow imbalances along the developing bent-back front (exceeding 20 m s−1 in the NORA10 hindcasts; Fig. 3a). Parts of the wind speed difference between the bent-back and cold fronts might be due to the cyclone's direction of propagation: the winds along the cold front are largely parallel to this direction, whereas the flow along the bent-back front is largely opposite to this direction.
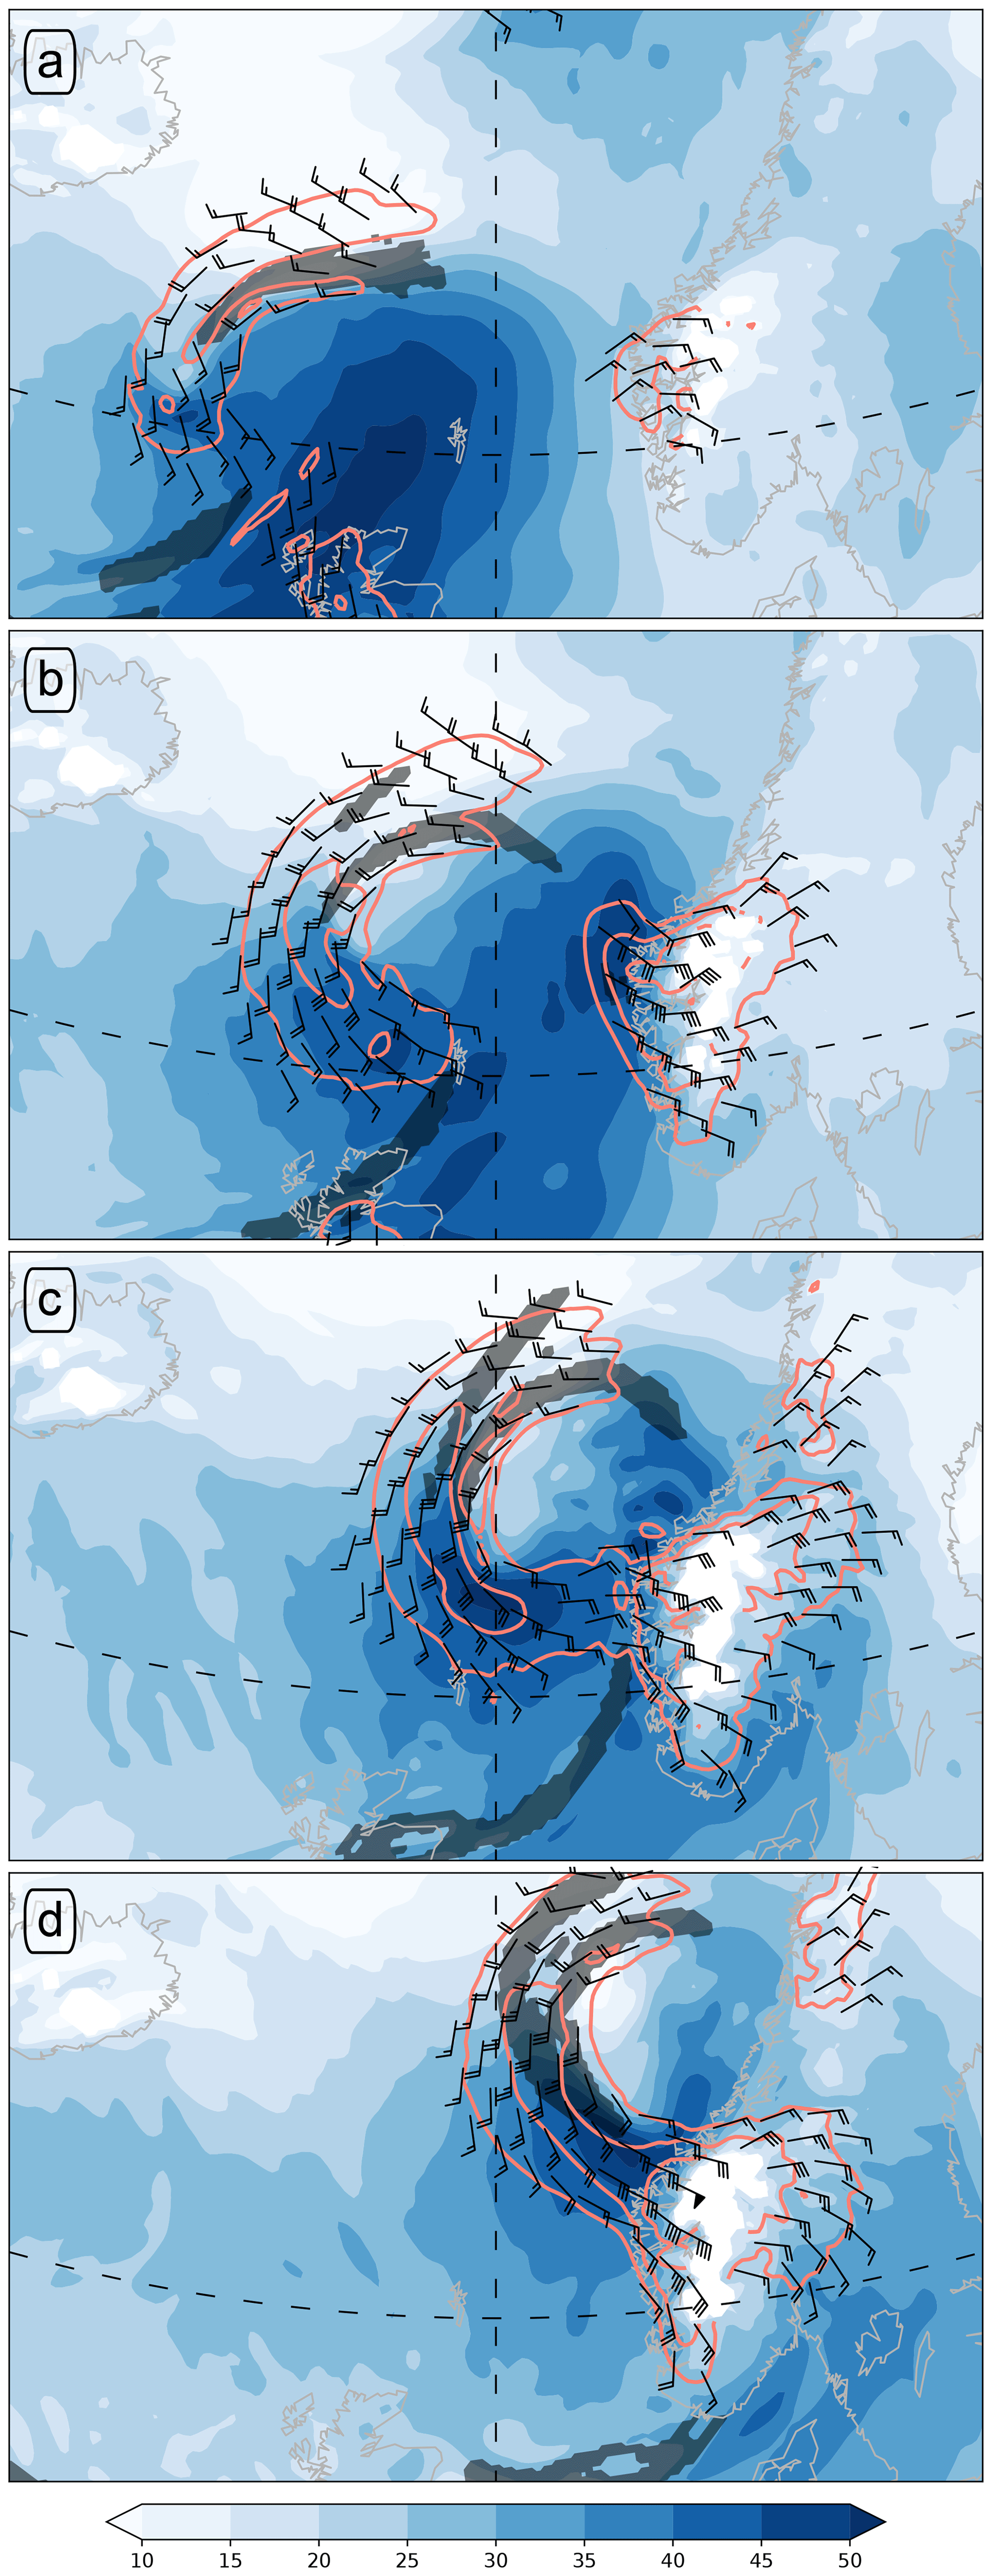
Figure 3Full wind speed (m s−1) at 850 hPa in the NORA10 hindcasts at (a) 00:00 UTC, (b) 03:00 UTC, (c) 06:00 UTC, and (d) 09:00 UTC on 1 January 1992. Barbs and pale red contours show ageostrophic wind with contours at 15, 25, and 35 m s−1. Dark shared regions show the location of front volumes at 850 hPa as in Fig. 2.
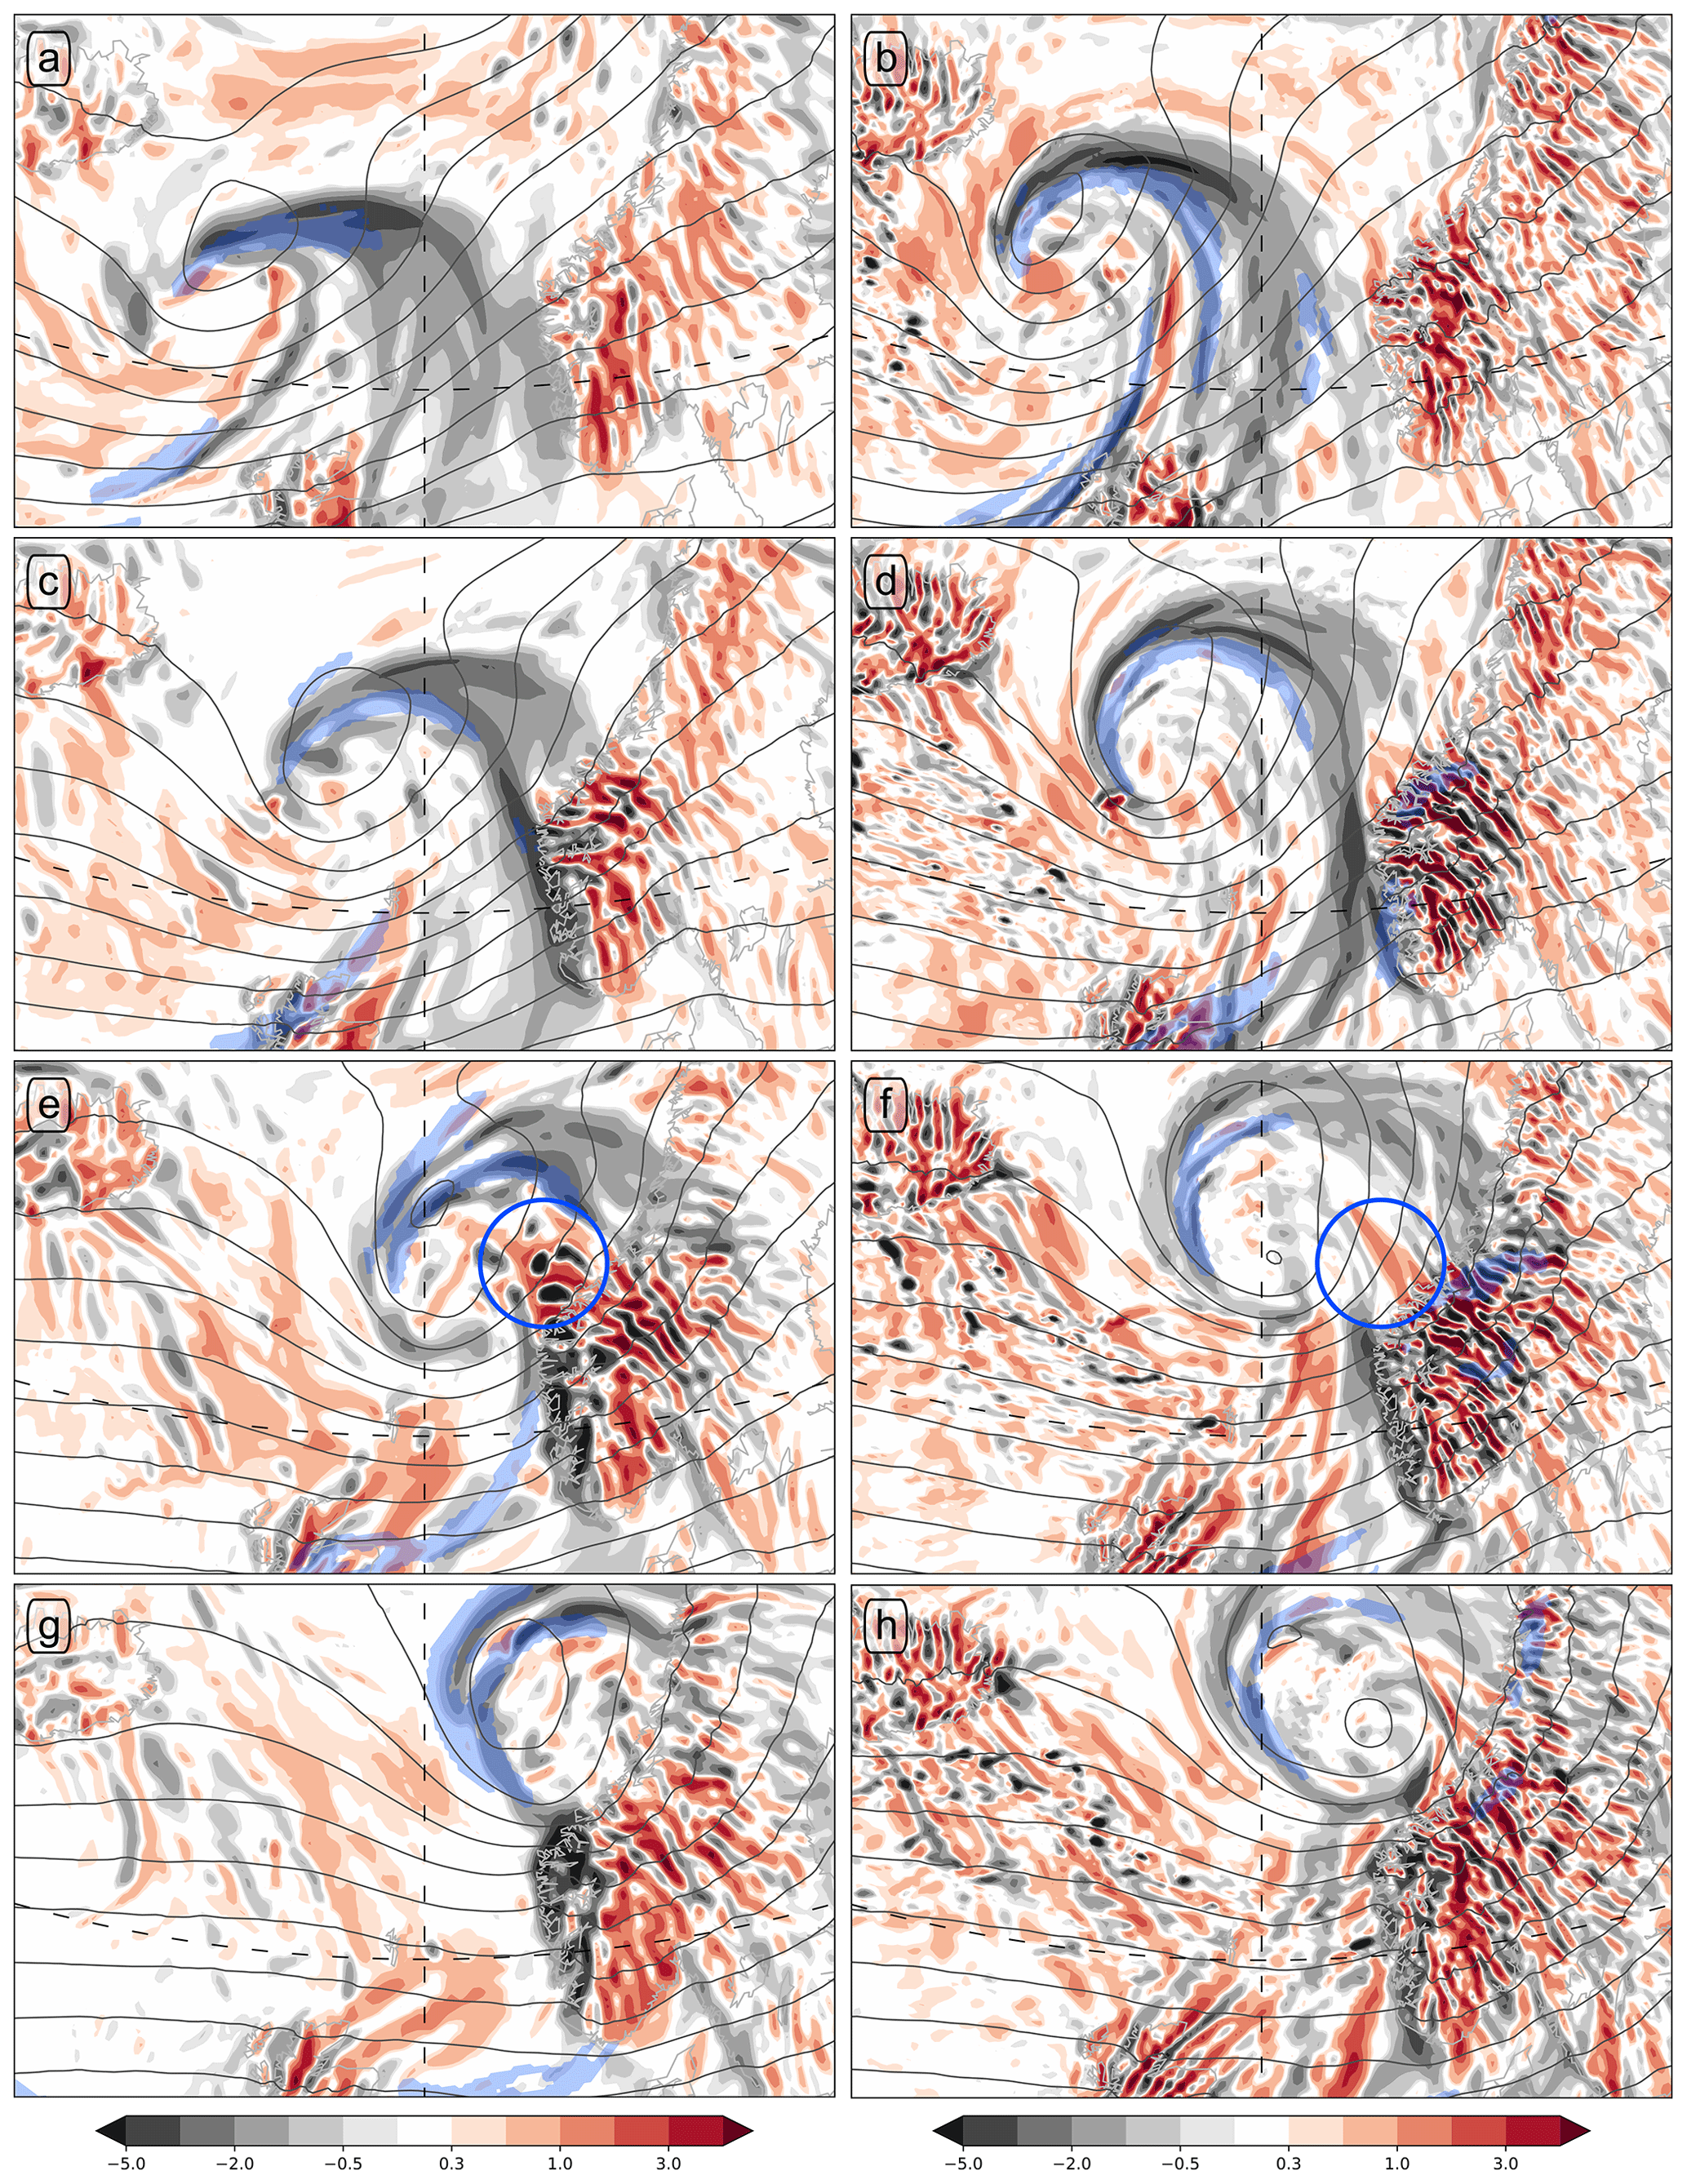
Figure 4Pressure vertical velocity (Pa s−1) at 700 hPa for (a, b) 00:00 UTC, (c, d) 03:00 UTC, (e, f) 06:00 UTC, and (g, h) 09:00 UTC. Dark grey contours show geopotential at 700 hPa, with a contour interval of 50 m, respectively. Blue shaded regions indicate the location of frontal zones at 850 hPa for both columns. The left column is based on the NORA10 hindcasts and the right on the Control simulation. For the blue circles in (e, f), refer to the main text.
3.2 Landfall of the warm sector
At 03:00 UTC on 1 January 1992, the leading edge of the warm sector arrives at the Scandes (Fig. 2c, d). At 850 hPa, the warm front does not fulfil our detection criteria except for a small region close to Svinøy on the northwestern cape of the west coast, but at 925 hPa the temperature gradient exceeds the detection threshold in a line connecting Bergen with the cyclone's bent-back front (not shown). The temperature gradient tightens as the front approaches the coastline, consistent with increased θe frontogenesis at 850 hPa driven by flow deformation (not shown). This flow deformation is consistent with an increase in ascent along the warm front as it approaches the Scandes (Fig. 4c, d).
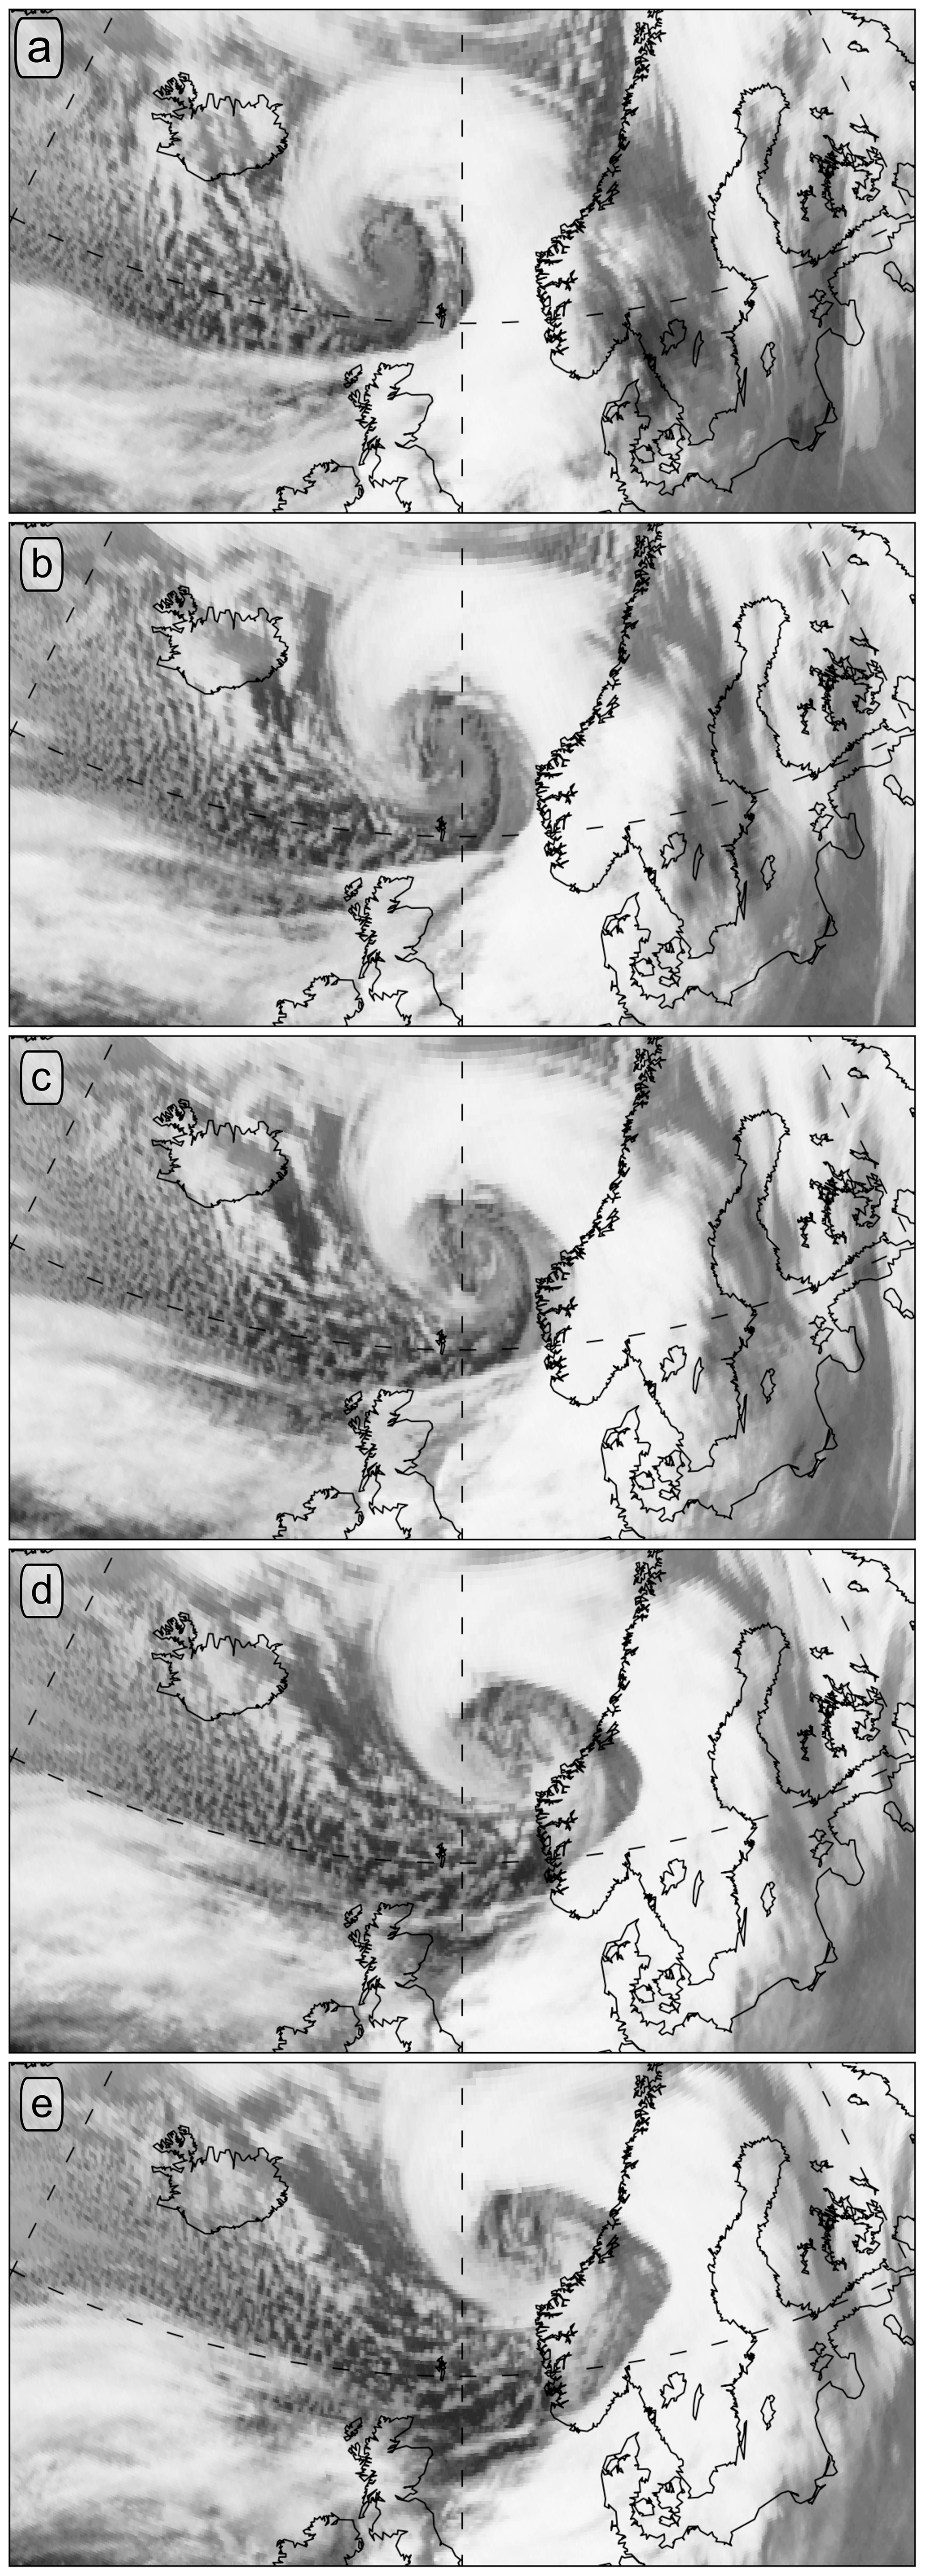
Figure 5Remapped infrared imagery (10.8 µm wavelength, W m−2 sr−1) from Meteosat-4 covering the landfall of the New Year's Day Storm from (a) 01:30 UTC through (e) 07:30 UTC on 1 January 1992 in 1.5 h intervals. Imagery © EUMETSAT 2016.
The intensification of the fronts approaching the Scandes indicates some orographic blocking of the warm air mass that acts frontogenetically. The orographic flow distortion is associated with increasing ageostrophic wind components where the Scandes intersect with the 850 hPa surface (Fig. 3b). In contrast, at 700 hPa, parts of the warm sector already moved over the Scandes (not shown), which reach up to a crest height of about 850–800 hPa. Both the 700 hPa θe distribution and the corresponding cloud cover on the Meteosat-4 satellite imagery show hardly any orographic distortion (Fig. 5a), confirming that only levels below 850 hPa are affected by some degree of orographic blocking.
Between 03:00 and 06:00 UTC, the cold front crosses the North Sea and at 06:00 UTC is about to make landfall on the Norwegian west coast (Fig. 2e, f). With the approaching cold front, the warm sector narrows to a thin filament along the coastline north of Bergen. To the south of Bergen, the Scandes are lower, and the warm sector continues to propagate eastward relatively unaffected by the orography. This north–south difference in propagation speed further indicates that the warm front is partly blocked to the north of Bergen. At 850 hPa and below, the core of the cyclone is already largely cut-off from the warm sector (Fig. 2e, f), while at 700 hPa the core and warm sector remain connected (not shown).
During the landfall of the cold front, between 04:30 and 06:00 UTC, satellite imagery shows the development of a cloud-free area on the eastern side of the Scandes (Fig. 5d). This cloud-free area indicates descending air masses and cloud evaporation. There is however some indication that this descent does not reach the lowest troposphere. First, the southwesterlies in the warm sector at 850 hPa are not evident in the wind field in the lee of the Scandes (Fig. 3c). Second, the 850 hPa temperature in this region remains unchanged between 03:00 and 06:00 UTC (Fig. 2c–f), suggesting that the lowest levels in the lee of the Scandes are still covered by the incipient cold air mass at 06:00 UTC.
Although some of the cold air moved over the Scandes after 09:00 UTC (Fig. 2g–j), the temperature gradient in the lee has become too diffuse to qualify as a cold front following our definition. Further, the previously clear signal in the vertical wind associated with the warm front (Fig. 4c, d) disappears over the Scandes. Over and in the lee of the Scandes, the vertical wind pattern is now dominated by wave structures indicating considerable activity of orographically triggered gravity waves (IGWs; Fig. 4c–h). These waves dominate over the organized vertical wind structure associated with the frontal circulation over the Atlantic and North Sea. The larger-scale structure of the horizontal wind in the warm sector re-emerges in the lee of the Scandes (compare Fig. 3b and d), although the peak wind speed is considerably reduced and features a superposed wavy pattern consistent with IGWs. In contrast, over southern Sweden and Denmark, the cold front could propagate eastward without encountering any orography, leaving the wind structure largely intact (Fig. 3d).
3.3 Evolution of the warm-air seclusion
So far we have focused the synoptic discussion on the landfall of the cold and warm fronts and orographic impacts on the warm sector. In the following, we shift focus towards the remaining frontal structure, the bent-back front, and its evolution in tandem with the warm-air seclusion.
At 09:00 UTC, the warm-air seclusion is fully cut-off from the warm sector at 850 hPa (Fig. 2g, h). The warm sector is located entirely on the eastern side of the Scandes and covers the southern part of Scandinavia (Fig. 2g, h). At 700 hPa, however, the warm-air seclusion is still largely connected with the warm sector, although the warm-air seclusion is now associated with a separate θe maximum close to the bent-back front (Fig. 6a). At 925 hPa, the Scandes separate the warm sector to the south from the warm seclusion to the north (Fig. 6b).
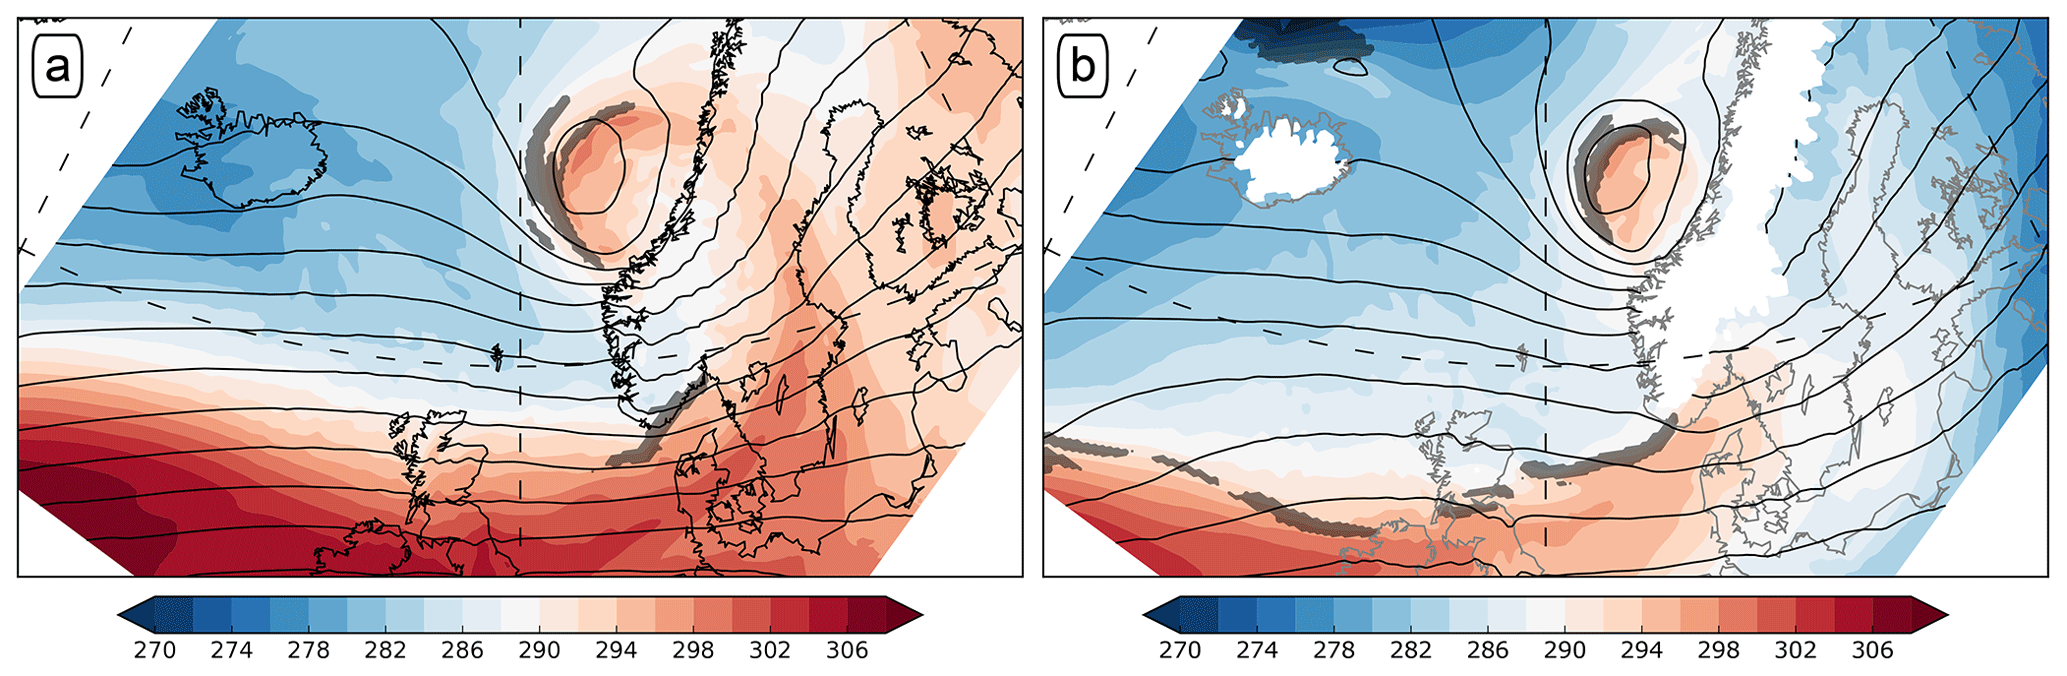
Figure 6As Fig. 2g, but for (a) 700 hPa and (b) 925 hPa.
With the formation of the warm-air seclusion, the cloud cover in the cyclone core starts to change. At 03:00 UTC, the cyclone core is covered by low-level clouds and is even partly cloud-free. From 04:30 UTC onward, the cyclone core is increasingly covered by spots of high-top convective clouds (Fig. 5c–e). The temporal correlation with the formation of the warm-air seclusion suggests that the onset of the convective activity in the cyclone core is dynamically linked with the cut-off of the seclusion from its warm sector. At 07:30 UTC most of the warm-air seclusion is covered by patchy high clouds (Fig. 5e).
From 00:00 to 09:00 UTC, the bent-back front continuously changes orientation. At 00:00 UTC the tip of the bent-back front points to the southwest, at 06:00 UTC to the south, and at 09:00 UTC to the southeast. The change of orientation is particularly pronounced between 06:00 and 09:00 UTC, while the tip of the bent-back front is rapidly approaching the coastline. Between 09:00 and 12:00 UTC, the bent-back front makes landfall and its orientation stops changing. Thus, the low-level jet associated with the bent-back front impinges on the coastline almost perpendicularly (Fig. 3d).
The following hours are characterized by a rapid decay of the warm-core seclusion (not shown). The weakening cyclone core crosses the Scandes between 15:00 and 18:00 UTC at around 65∘ N, where the Scandes are lower than further south. Together with the cyclone core, parts of the warm-air seclusion cross the Scandes, but in this process the temperature gradient along the bent-back front weakens and no longer qualifies as a front following our definition.
3.4 Assessing the WRF Control simulation
Overall, WRF reproduces the synoptic evolution of the New Year's Day Storm well compared to the NORA10 reanalyses and the satellite imagery (Figs. 2, 4, 5). As indicated in the discussion of the synoptic evolution, there are however more or less subtle differences between NORA10 and WRF. Conceptually, the most prominent difference concerns the dynamics of the flow off the Norwegian coastline between Svinøy and Trondheim at 06:00 and 09:00 UTC (blue circles in Fig. 4e, f). Here, WRF simulates a coherent region of descent which might be indicative of a foehn event, while the NORA10 hindcasts exhibit patchy up- and downdrafts indicative of convective activity.
In addition, the NORA10 hindcasts seem to lag behind both the satellite imagery and the WRF simulations. For example, the cold front makes landfall on the Norwegian west coast around 06:00 UTC in NORA10 (Fig. 2e), compared to around 04:30 UTC in the satellite imagery (Fig. 5c) and around 05:00 UTC in the WRF simulation (not shown). These and other differences between NORA10 and WRF are however inconsequential for the following discussion of orographic effects.
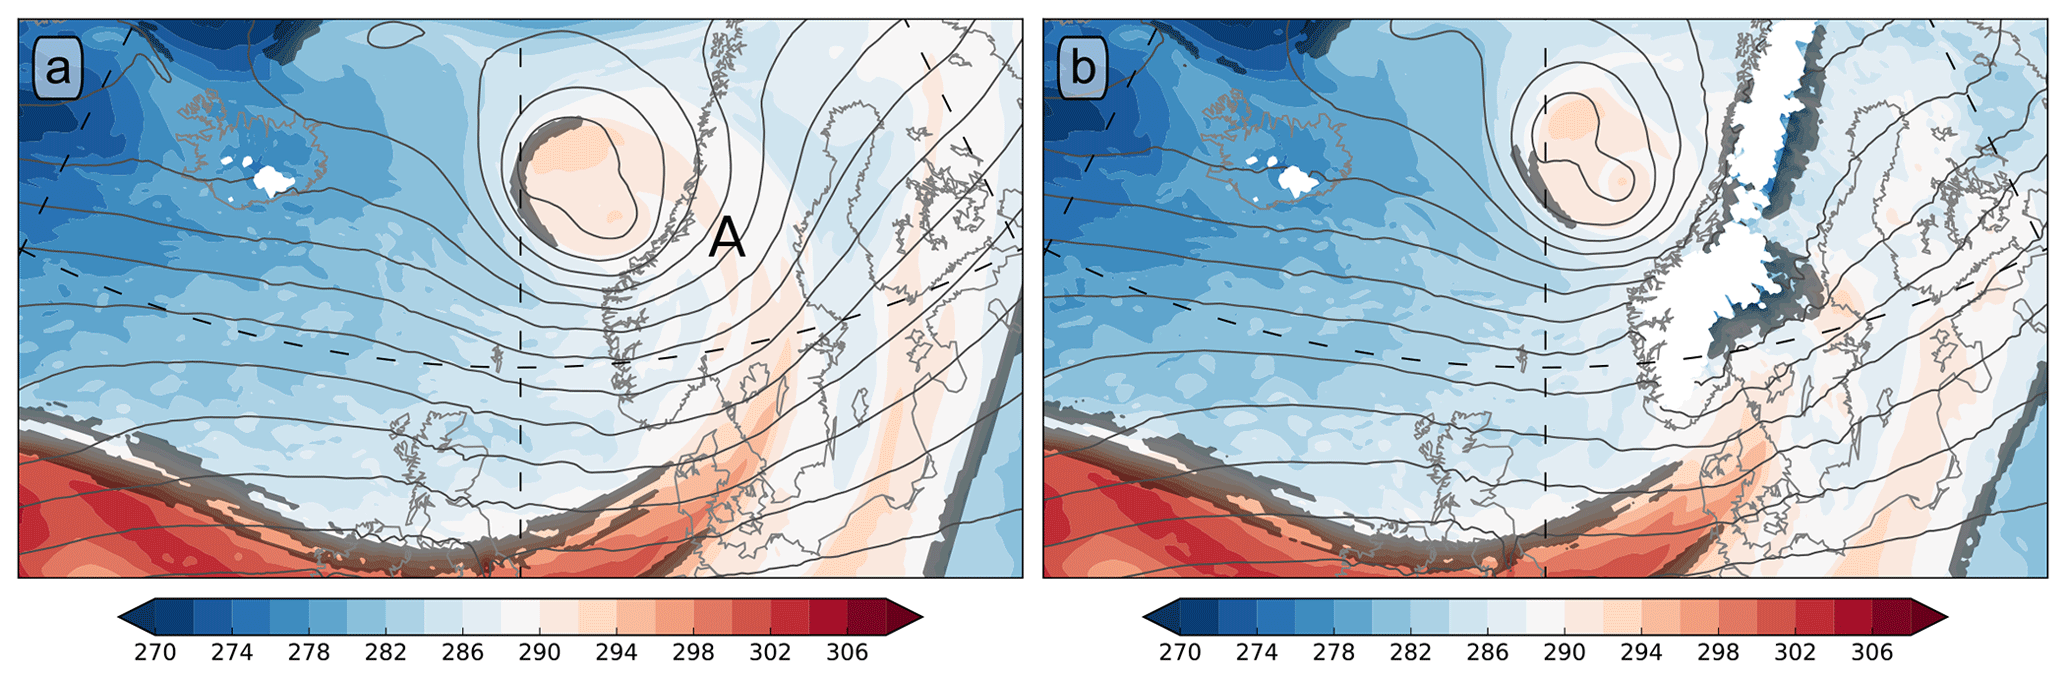
Figure 7As Fig. 2h, but for (a) the Ocean simulation and (b) the Double simulation. For the meaning of “A”, refer to the main text.
4.1 Little impact on the formation of the warm-air seclusion and its poisonous tail
In the synoptic evolution of the New Year's Day Storm in NORA10 and WRF, we observe a clear orographic influence on the storm. In particular, we found a separation of the cyclone core from its warm sector below 850 hPa, a synoptic evolution similar to the one described in Bjerknes and Solberg (1922). However, the extent to which the formation of the warm-air seclusion was forced or accelerated by the orography remains unclear. Levels above 850 hPa did not experience an orographically forced cut-off of a pocket of warm air from the warm sector but still see a warm-air seclusion. To assess the impact of orography on the storm, in the following we compare simulations in which we either replaced the Scandinavian peninsula by ocean, or doubled the height of the Scandes.
These changes to the orography have surprisingly little impact on the evolution of the storm (Fig. 7). In particular, these simulations demonstrate that the warm-air seclusion would have formed even in the absence of orography (Fig. 7a). Without orography, the warm sector would have deformed to a long arched filament at 850 hPa (mark “A” in Fig. 7a), indicating an ongoing occlusion process independent of orography. The Scandes however accelerated this deforming and separation in an orographic occlusion process.
In tandem with the largely unaffected warm-air seclusion, the bent-back front shows hardly any orographic impact prior to its own landfall around 09:00 UTC (Fig. 7). In the Double simulation, the detected bent-back front extends less far around the warm-air seclusion than in the Ocean and Control simulations, indicating a less locally confined θe gradient on the northern side of the seclusion due to orographic influence (Figs. 2h; 7). The structure of the wind field around the poisonous tail however is largely unaffected by the orography (not shown) and in particular unaffected by the landfall and decay of the storm's warm sector.
This insensitivity of the wind field might indicate that the extreme winds in the storm's poisonous tail are part of a sting jet, dynamically arising from downward transport of momentum (Schultz and Browning, 2017; Clark and Gray, 2018). However, in neither the NORA10 hindcasts nor our WRF simulations is there a region of coherent descent that would indicate a sting jet (Fig. 4c–h). We therefore interpret the poisonous tail as predominantly a cold conveyor belt jet (Clark and Gray, 2018). In synthesis with the results of Grønås (1995), we suggest that the dynamics of the poisonous tail are more determined by local moist diabatic effects than the somewhat more remote orographic flow distortions.
In summary, the warm-air seclusion and its poisonous tail exhibit only weak sensitivity to the partial cut-off and rapid decay of the warm sector. This weak sensitivity suggests that the cyclone core and its warm sector hardly interact at this stage in the development. The fronts framing the warm sector decay quickly when moving over the Scandes, and the warm conveyor belt inflow is at least partially interrupted. Yet, the warm-air seclusion evolves largely unaffected. Consequently, it might be most appropriate to regard the seclusion and the warm sector as two dynamically independent entities as soon as the occlusion process started. The evolution of these entities would then be in sync primarily because of a joint history rather than because of a persistent dynamical linkage.
The observation of Bjerknes and Solberg (1922) that secondary cyclogenesis frequently occurs at the occlusion point corroborates our interpretation. Cyclogenetic processes in the warm sector frequently lead to the formation of a secondary core rather than intensifying the pre-existing cyclone. Secondary cyclogenesis thus provides further indication that the dynamical ties between the warm sector and the pre-existing cyclone core tend to weaken considerably with the onset of the occlusion process.
4.2 Northward displacement of the warm-air seclusion
The main impact of the Scandes on the warm-air seclusion is a slight displacement to the north in the presence of orography that goes along with higher pressure on the upstream side of the Scandes. These orographically induced differences in the pressure (and hence mass) distribution are consistent with the orographically impacted mass transports in Fig. 8. Figure 8 shows the mass transport σ at 850 hPa perpendicular to the geopotential isolines at this level. Here,
where ρ is density, v the horizontal wind vector, and ϕ is geopotential.
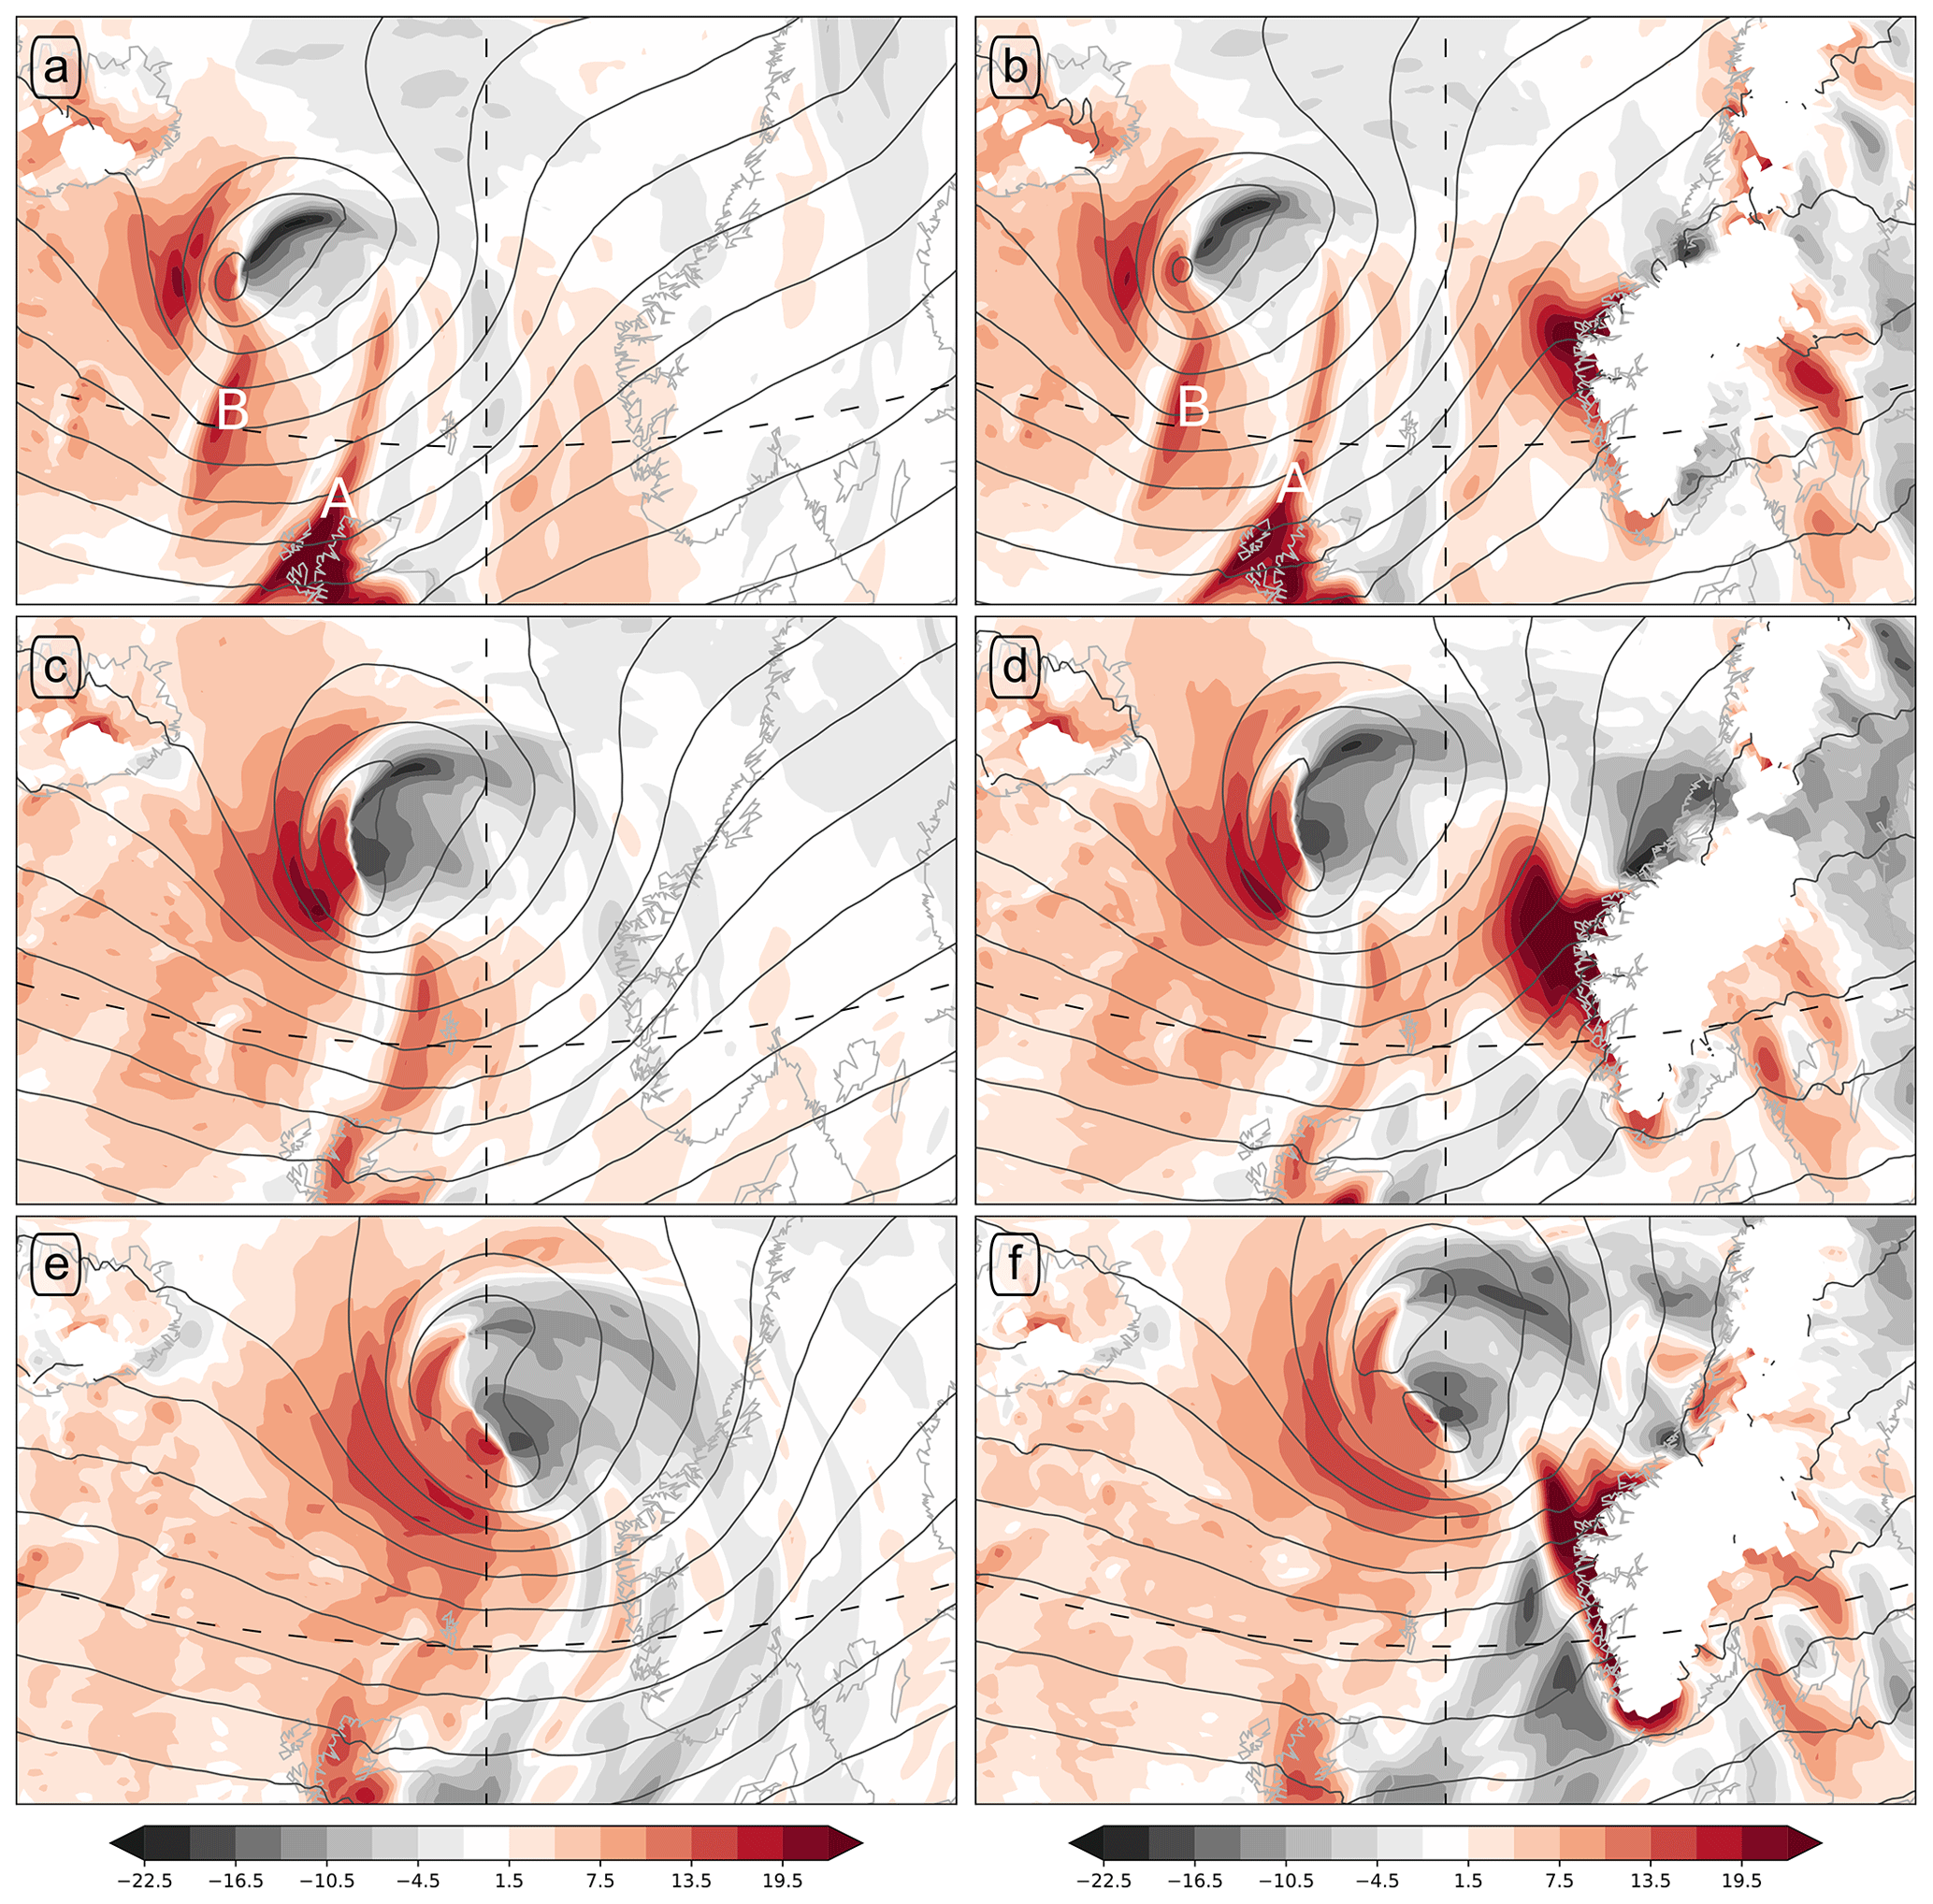
Figure 8Mass transport (kg s−1 m−2) perpendicular to geopotential isolines at 850 hPa, with positive values indicating transport towards lower geopotential. The rows show the time evolution for (a, b) 00:00 UTC, (c, d) 03:00 UTC, and (e, f) 06:00 UTC. Panels (a, c, e) are based on a WRF simulation in which the Scandinavian orography as been removed and converted to ocean. Panels (b, d, f) are based on a WRF simulation in which the Scandinavian orography is twice its original height. For the meaning of “A” and “B”, refer to the main text.
Before landfall, mass transport towards the lower geopotential occurs primarily along the cold front (“A”) as well as a convergence line in the cold sector (“B”; Fig. 8a, b). Further, the mass transport exhibits a pronounced dipole structure around the cyclone core, which we expect mainly reflects the movement of the low-pressure centre.
Even before the landfall of the fronts, the Scandes induce some mass transport towards lower pressure along the Norwegian west coast, peaking close to Svinøy (Fig. 8b). The mass transport peaks around 03:00 UTC (Fig. 8d), the time of the landfall of the warm front and the associated start of the orographic occlusion process. It is still a prominent feature of the mass transport around 06:00 UTC (Fig. 8f), when the orographic occlusion process completed the separation of the cyclone core from its warm sector. It is plausible that this orographically induced mass transport caused both the displacement of the cyclone core to the north and the higher pressures along the Norwegian west coast.
Interestingly, this orographic mass transport is not restricted to the height of the orography. Although it is most pronounced below crest level, it remains visible throughout the troposphere, as for example at 500 hPa, shown in Fig. 9. At this level, the orographic impact is evident in a dipole pattern centred over the Scandes in southern Norway that is consistent with a ridge evolving over the orography.
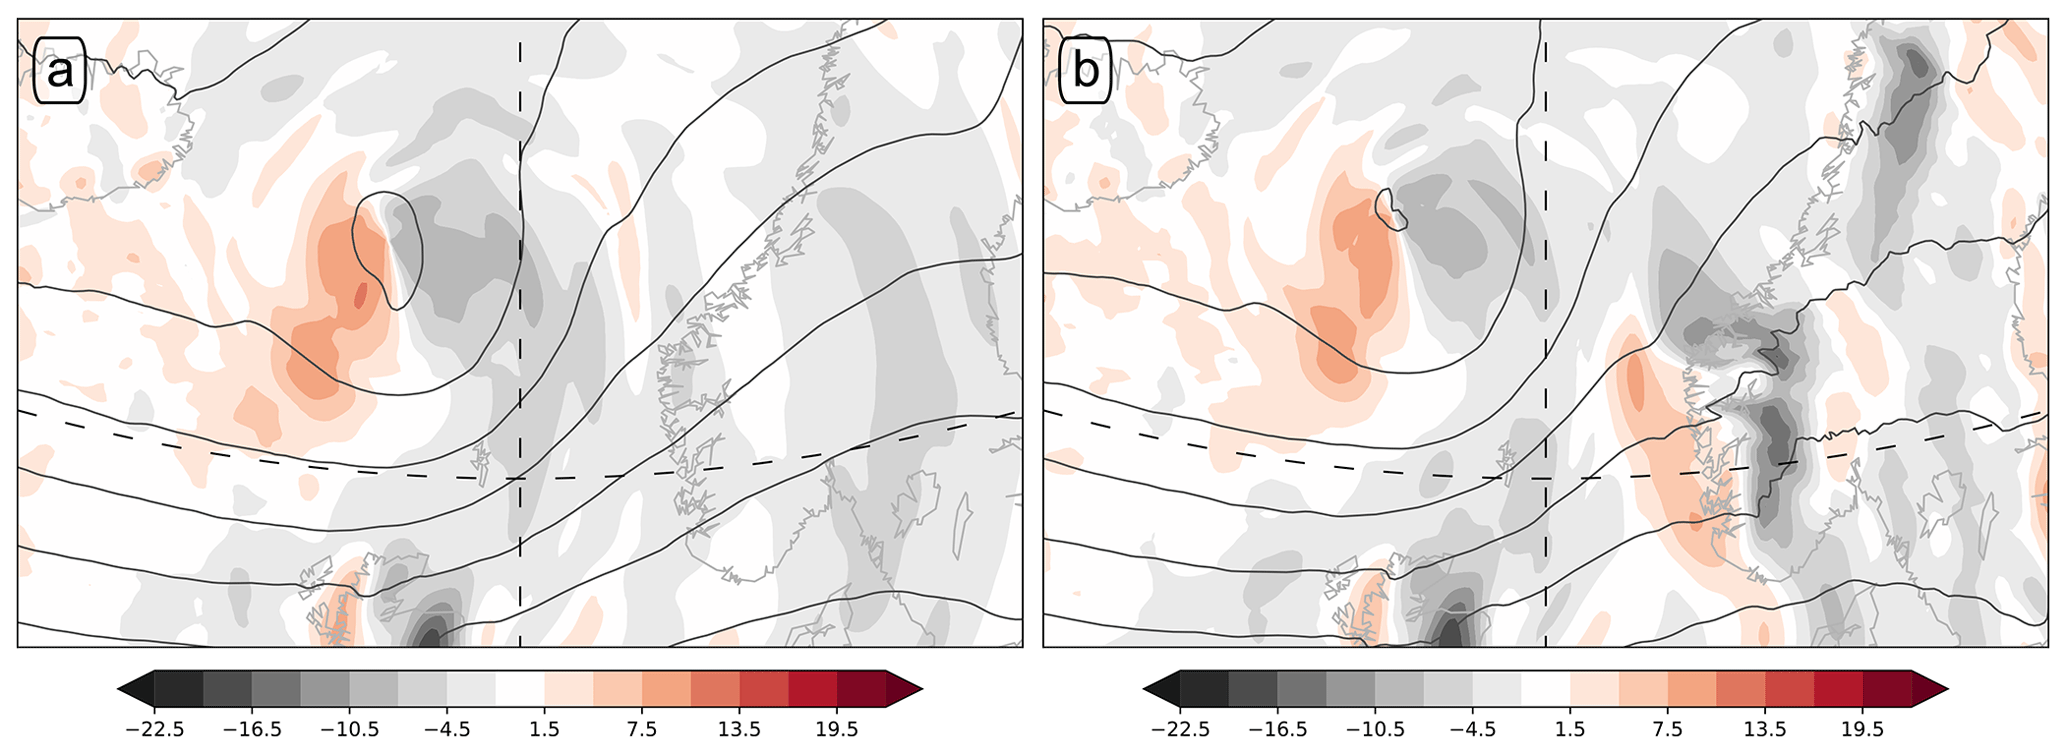
Figure 9As Fig. 8c, d, but for mass transport at 500 hPa.
While the appearance of this orographically induced mass transport in the middle troposphere is hardly surprising, it might be instructive to ask what process causes its appearance. The 500 hPa mass transport evolves in tandem with the one at 850 hPa without discernible delay (shown for 03:00 UTC, compare Figs. 8d, 9b). Whatever does communicate the orographic impact to 500 hPa must hence do so rapidly.
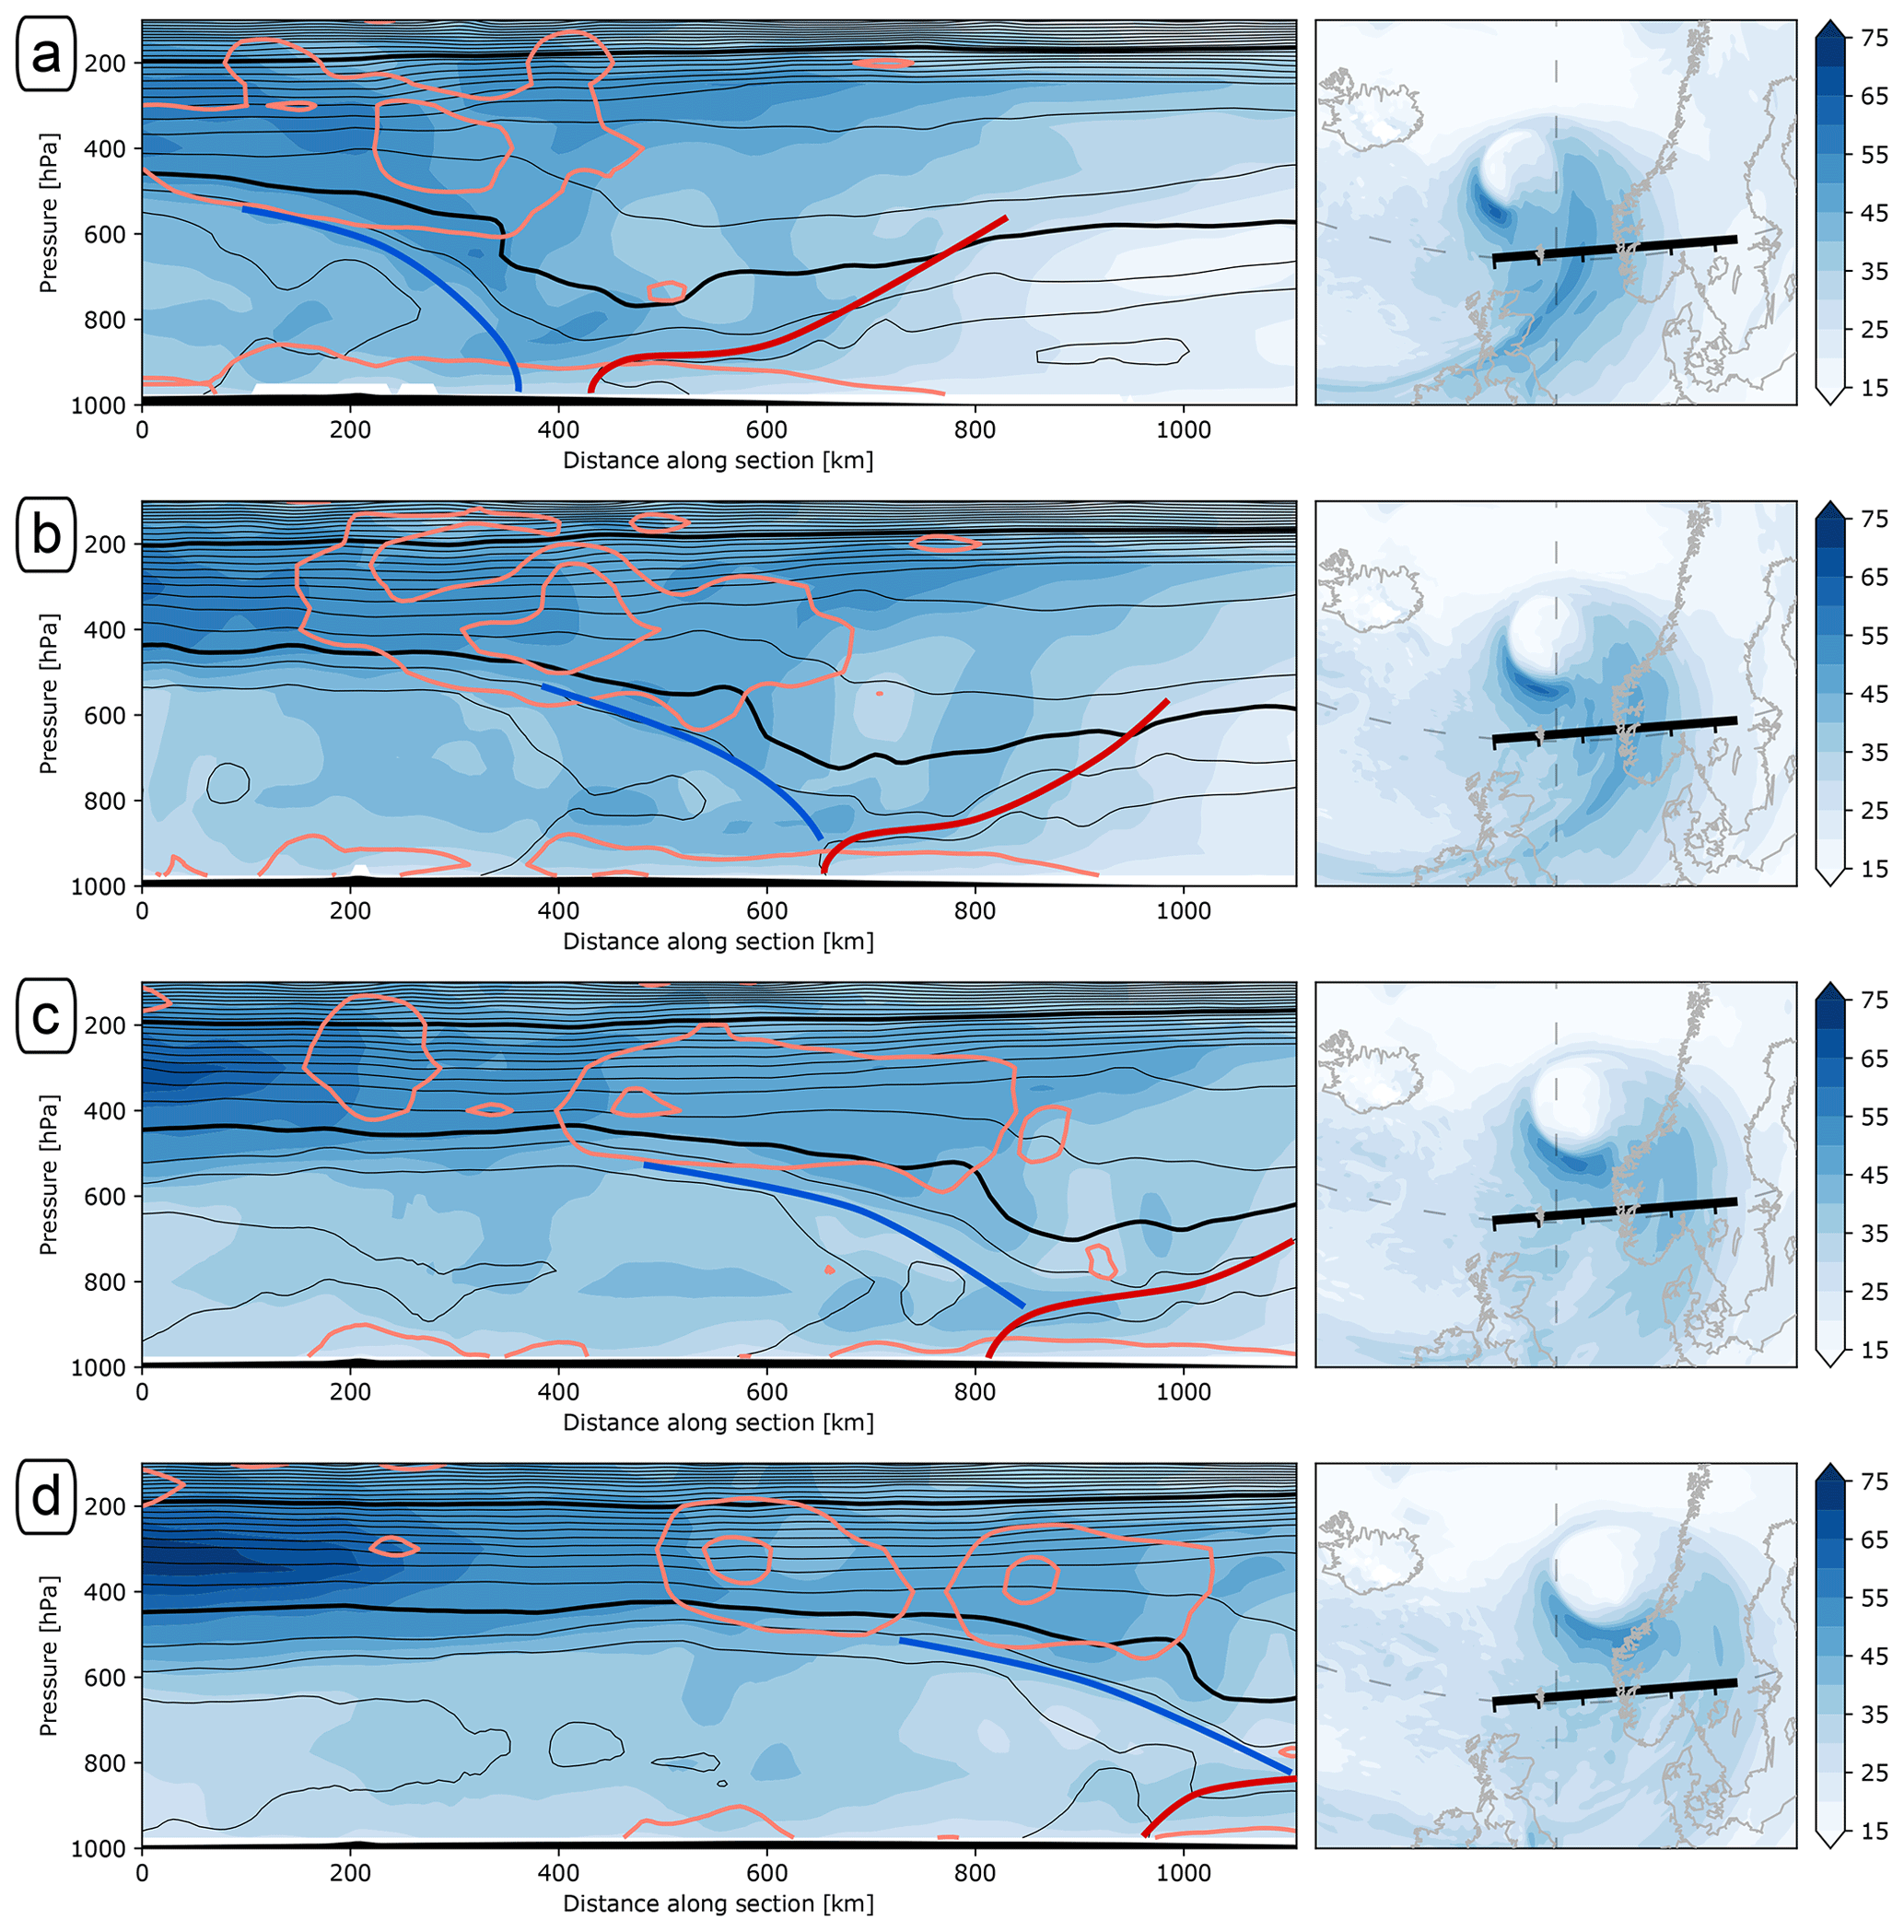
Figure 10Cross section of wind speed (shading, m s−1), equivalent potential temperature (black contours with intervals 5, 300, and 350 K thickened) and ageostrophic horizontal wind with contours at 15, 25, and 35 m s−1. The blue and red lines mark subjectively analysed cold and warm fronts, respectively. The maps in the right column show wind speed at 850 hPa as well as the location of the cross section with ticks every 200 km. The rows show (a) 03:00 UTC, (b) 05:00 UTC, (c) 07:00 UTC, and (d) 09:00 UTC on 1 January 1992 for the Ocean simulation.
4.3 Considerable impact on the warm and cold fronts
In order to investigate further, we follow the evolution of the warm and cold fronts in cross sections through the warm sector in the Ocean and Double simulations (Figs. 10, 11). Without orography, the cold sector catches up with the warm sector around 05:00 UTC, and an occlusion process begins (Fig. 10b). In this simulation ageostrophic winds exceeding 15 m s−1 occur solely in the boundary layer and along the eastward end of a wind maximum in the upper troposphere, around 400 km along the section in Fig. 10b.
In the Double simulation, the equivalent potential temperature and wind structure differ considerably from that in the Ocean simulation (Fig. 11). Most prominently, upstream of the Scandes a cold anomaly exceeding 8 K is evident at both 03:00 and 05:00 UTC. This cold anomaly indicates the orographically retarded propagation of the warm front at 03:00 UTC and a leftover pocket of incipient cold air trapped below 900 hPa at 05:00 UTC (Fig. 11a, b), similar to the one included in the conceptual model of Bjerknes and Solberg (1921). Both at 03:00 and at 05:00 UTC, low-level ageostrophic winds upstream of the Scandes exceed 35 m s−1. Throughout the shown evolution, wavy patterns in the ageostrophic wind component indicate IGW activity over the leeward slopes of the Scandes (Fig. 11). Consistent with this interpretation, these wavy patterns are even more pronounced in the stratosphere and exceed amplitudes of 20 K in θe there.
In the same region, isentropes are pulled down to follow the orographic slope over varying fractions of the troposphere (Fig. 11a–d). These simulated downdrafts are consistent with the appearing cloud-free area observed in the satellite imagery after the passing of the cold front (Fig. 5). Despite these downslope winds, neither the warm nor the cold sector affects the lowest-level temperatures in the lee of the Scandes. This is particularly evident at 07:00 UTC, when the warm sector is located in the region between 800 and 1000 km along the section in the Ocean simulation (Fig. 10c). In the same region, there is a pronounced cold anomaly below crest height in Fig. 11c, showing that the orographically lifted warm sector hardly descends in the lee of the Scandes. This result confirms our previous interpretation of the orographic impact on the warm sector as an orographic occlusion.

Figure 11As Fig. 10, but showing in shading the equivalent potential temperature difference in kelvin between the Double and the Ocean simulations in both the section and the map. Contours show equivalent potential temperature and ageostrophic wind speed as in Fig. 10, but for the Double simulation.
A trajectory analysis based on the NORA10 hindcasts provides further support. Air parcels released in the North Sea upstream of the Norwegian west coast at 925 hPa in (a) the incipient cold air mass, (b) the warm sector, and (c) the cold sector all are first lifted above the Scandes and then either level off or continue their ascent. Only a few trajectories released in the cold sector descend the lee slopes of the Scandes. The warm sector is thus lifted off the surface in the lee of the Scandes.

Figure 12Forward trajectories released from the box 58.0–62.0∘ N, 1.0–4.0∘ E at 925 hPa at (a) 00:00 UTC, (b) 03:00 UTC, and (c) 06:00 UTC. The trajectory segments between the circles each cover 3 h, and they are coloured by pressure (hPa) of the preceding time step. The position of the parcels 9 h after the respective release are red. The grey shading and black contours show θe and geopotential, both at 925 hPa, at the release time of the trajectories with the same contour interval and limits as in Fig. 2. Panel (d) shows the median pressure evolution of the above parcels. Circles indicate time steps shown in the trajectory maps (a)–(c). The respective transparent shading indicates variability between the trajectories by the 15th and 85th percentiles. The trajectories have been calculated using LAGRANTO (Sprenger and Wernli, 2015).
With the flow moving predominantly over the Scandes, our case study differs considerably from previous case studies of cold and warm fronts impinging on the North American west coast (e.g. Braun et al., 1997; Doyle and Bond, 2001; Neiman et al., 2004) and of cold fronts impinging on the Alps (e.g. Kljun et al., 2001). All these case studies document larger degrees of orographic blocking and flow deviation around the orography. Consequently, the cold-air-damming paradigm of Davies (1984) and idealized model of Egger and Hoinka (1992) provide little guidance to interpret our case study.
Although the flow is largely unblocked by the Scandes, the forced ascent over the orography interrupts the lowest part of the warm conveyor belt inflow towards the cyclone core. By cutting this link between the cyclone core (here, the warm-air seclusion) and its warm sector, the orographic impact on the New Year's Day Storm becomes an ideal natural experiment to clarify the dynamical relation between the cyclone core and its warm sector once the occlusion process has started. While the Scandes clearly affect the warm sector by retarding and eroding the fronts that move over the orography, the evolution of the warm-air seclusion is only slightly displaced to the north but otherwise unaffected. This insensitivity of the core to the evolution of the warm sector suggests that the cyclone core at this stage of the life cycle has become a largely independent dynamical entity, which only co-evolves rather than interacts with its warm sector. The observed tendency for secondary cyclogenesis at the occlusion point indicates that this finding for the New Year's Day Storm might apply more generally.
In summary, we followed the synoptic evolution of the New Year's Day Storm from its mature stage and through the landfall of, in sequence, the warm, cold, and bent-back front. Based on our results and discussion, we now return to the questions we posed in the introduction.
-
First, we find that the landfall of the storm hardly affected the formation of the warm-air seclusion and the storm's poisonous tail. This insensitivity is largely due to the cyclone's inherent occlusion process. The Scandes hence did not induce but accelerated the occlusion process without considerably affecting the formation and evolution of the warm-air seclusion. Further, we find that the extreme wind speeds along the bent-back front of the storm, the poisonous tail, formed as a cold conveyor belt jet and would have occurred irrespective of orography. This insensitivity raises the question to which extent the warm-core seclusion and the warm sector are still interacting after the onset of the occlusion process.
-
Second, the landfall affected the track of the warm-air seclusion. The Scandes induced an anomalous mass flux along the Norwegian west coast towards the cyclone core, which is most pronounced in the lowest troposphere but extends up to the tropopause. The anomalous mass flux is consistent with the more northerly track of the storm in the presence of the orography.
-
Third, the warm and cold fronts are strongly impacted by the landfall. While there is some indication of flow deviation around the orography and thus some degree of blocking, a trajectory analysis demonstrates that the flow was primarily moving over the Scandes. In this aspect, our case study deviates considerably from previous case studies in other regions which generally document a larger degree of blocking. For the same reason, the cold-air-damming concept of Davies (1984) is not applicable to our case study. Neither, however, does our case study follow the Blumen and Gross (1987) paradigm of passive advection over the orography, because both the warm and cold front decay rapidly while moving over the Scandes. The rapid decay suggests interactions between the fronts and the orographically distorted flow.
Besides these questions, we observe ubiquitous gravity wave patterns over and in the lee of the Scandes. We will examine the potential role of these waves for both the rapid decay of the warm and cold fronts over the Scandes and the emergence of the anomalous mass flux along the Norwegian coastline in a follow-up study.
Our analyses and simulations are based on data provided by the European Centre for Medium-Range Weather Forecasts, the Norwegian Meteorological Institute, and EUMETSAT. Data availability is subject to the policies of these institutions. The WRF model (http://wrf-model.org/; University Corporation for Atmospheric Research, 2020) and the trajectory tool LAGRANTO (https://iacweb.ethz.ch/staff/sprenger/lagranto/; Atmospheric Dynamics Group, Institute for Atmospheric and Climate, 2020) used in this study are publicly available.
CS initiated the research and performed the WRF simulations. SeS performed the trajectory analysis. Both authors contributed to the remaining analysis and writing of the manuscript.
The authors declare that they have no conflict of interest.
We thank Thomas Spengler, Lukas Papritz, and Heini Wernli for interesting discussions and Suzanne L. Gray and the one anonymous referee for helpful comments on the manuscript. We thank the Norwegian Meteorological Institute for providing the NORA10 reanalysis, the University Cooperation for Atmospheric Research (UCAR) for developing and providing the WRF model, the European Centre for Medium-Range Forecasts (ECMWF) for providing the boundary conditions used for the WRF simulations, and EUMETSAT for the Meteosat-4 imagery.
Clemens Spensberger has been supported by the Research Council of Noway (grant no. 240513).
This paper was edited by Silvio Davolio and reviewed by Suzanne L. Gray and one anonymous referee.
Aune, B. and Harstveit, K.: The Storm of January 1. 1992, Tech. Rep. 23/92 Klima, Det Norske Meteoroligiske Institutt, Oslo, Norway, 1992. a, b
Atmospheric Dynamics Group, Institute for Atmospheric and Climate: LAGRANTO – The Lagrangian Analysis Tool, Science, ETH Zurich available at: https://iacweb.ethz.ch/staff/sprenger/lagranto/, last access: 22 April 2020. a
Berry, G., Reeder, M. J., and Jakob, C.: A global climatology of atmospheric fronts, Geophys. Res. Lett., 38, L04809, https://doi.org/10.1029/2010GL046451, 2011. a
Bjerknes, J. and Solberg, H.: Meteorological conditions for the formation of rain, Geofysiske Publikasjoner, II, 1–59, 1921. a, b
Bjerknes, J. and Solberg, H.: Life cycle of cyclones and the polar front theory of atmospheric circulation, Geofysiske Publikasjoner, III, 1–16, 1922. a, b
Blumen, W.: Propagation of fronts and frontogenesis versus frontolysis over orography, Meteorol. Atmos. Phys., 48, 37–50, https://doi.org/10.1007/BF01029558, 1992. a
Blumen, W. and Gross, B. D.: Advection of a Passive Scalar over a Finite-Amplitude Ridge in a Stratified Rotating Atmosphere, J. Atmos. Sci., 44, 1696–1705, https://doi.org/10.1175/1520-0469(1987)044<1696:AOAPSO>2.0.CO;2, 1987. a, b, c
Braun, S. A., Houze Jr., R. A., and Smull, B. F.: Airborne Dual-Doppler Observations of an Intense Frontal System Approaching the Pacific Northwest Coast, Mon. Weather Rev., 125, 3131–3156, https://doi.org/10.1175/1520-0493(1997)125<3131:ADDOOA>2.0.CO;2, 1997. a, b, c
Braun, S. A., Rotunno, R., and Klemp, J. B.: Effects of Coastal Orography on Landfalling Cold Fronts. Part I: Dry, Inviscid Dynamics, J. Atmos. Sci., 56, 517–533, https://doi.org/10.1175/1520-0469(1999)056<0517:eocool>2.0.co;2, 1999. a
Browning, K. A.: The sting at the end of the tail: Damaging winds associated with extratropical cyclones, Q. J. Roy. Meteorol. Soc., 130, 375–399, https://doi.org/10.1256/qj.02.143, 2004. a, b
Clark, P. A. and Gray, S. L.: Sting jets in extratropical cyclones: a review, Q. J. Roy. Meteorol. Soc., 144, 943–969, https://doi.org/10.1002/qj.3267, 2018. a, b
Clark, P. A., Browning, K. A., and Wang, C.: The sting at the end of the tail: Model diagnostics of fine-scale three-dimensional structure of the cloud head, Q. J. Roy. Meteorol. Soc., 131, 2263–2292, https://doi.org/10.1256/qj.04.36, 2005. a, b
Davies, H.: On the orographic retardation of a cold front, Beiträge zur Physik der Atmosphäre, 57, 409–418, 1984. a, b, c, d
Dee, D. P., Uppala, S. M., Simmons, A. J., Berrisford, P., Poli, P., Kobayashi, S., Andrae, U., Balmaseda, M. A., Balsamo, G., Bauer, P., Bechtold, P., Beljaars, A. C. M., van de Berg, L., Bidlot, J., Bormann, N., Delsol, C., Dragani, R., Fuentes, M., Geer, A. J., Haimberger, L., Healy, S. B., Hersbach, H., Hólm, E. V., Isaksen, L., Kållberg, P., Köhler, M., Matricardi, M., McNally, A. P., Monge-Sanz, B. M., Morcrette, J.-J., Park, B.-K., Peubey, C., de Rosnay, P., Tavolato, C., Thépaut, J.-N., and Vitart, F.: The ERA-Interim reanalysis: configuration and performance of the data assimilation system, Q. J. Roy. Meteorol. Soc., 137, 553–597, https://doi.org/10.1002/qj.828, 2011. a
Doyle, J. D. and Bond, N. A.: Research Aircraft Observations and Numerical Simulations of a Warm Front Approaching Vancouver Island, Mon. Weather Rev., 129, 978–998, https://doi.org/10.1175/1520-0493(2001)129<0978:RAOANS>2.0.CO;2, 2001. a, b, c
Egger, J.: The orographic deformation and retardation of a frontal zone, Meteorol. Atmos. Phys., 48, 131–137, https://doi.org/10.1007/BF01029563, 1992. a
Egger, J. and Hoinka, K.: Fronts and orography, Meteorol. Atmos. Phys., 48, 3–36, https://doi.org/10.1007/BF01029557, 1992. a
Grønås, S.: The seclusion intensification of the New Year's Day Storm 1992, Tellus A, 47, 733–746, https://doi.org/10.1034/j.1600-0870.1995.00116.x, 1995. a, b, c, d, e, f
Hewson, T. D.: Objective fronts, Meteorol. Appl., 5, 37–65, https://doi.org/10.1017/S1350482798000553, 1998. a
Jenkner, J., Sprenger, M., Schwenk, I., Schwierz, C., Dierer, S., and Leuenberger, D.: Detection and climatology of fronts in a high-resolution model reanalysis over the Alps, Meteorol. Appl., 17, 1–18, https://doi.org/10.1002/met.142, 2010. a
Kljun, N., Sprenger, M., and Schär, C.: Frontal modification and lee cyclogenesis in the Alps: A case study using the ALPEX reanalysis data set, Meteorol. Atmos. Phys., 78, 89–105, https://doi.org/10.1007/s007030170008, 2001. a, b, c
Lackmann, G. M.: Cold-Frontal Potential Vorticity Maxima, the Low-Level Jet, and Moisture Transport in Extratropical Cyclones, Mon. Weather Rev., 130, 59–74, https://doi.org/10.1175/1520-0493(2002)130<0059:cfpvmt>2.0.co;2, 2002. a
Neiman, P. J., Martin Ralph, F., Persson, P. O. G., White, A. B., Jorgensen, D. P., and Kingsmill, D. E.: Modification of Fronts and Precipitation by Coastal Blocking during an Intense Landfalling Winter Storm in Southern California: Observations during CALJET, Mon. Weather Rev., 132, 242–273, https://doi.org/10.1175/1520-0493(2004)132<0242:MOFAPB>2.0.CO;2, 2004. a, b, c
Reistad, M., Breivik, Ø., Haakenstad, H., Aarnes, O. J., Furevik, B. R., and Bidlot, J.-R.: A high-resolution hindcast of wind and waves for the North Sea, the Norwegian Sea, and the Barents Sea, J. Geophys. Res.-Oceans, 116, C05019, https://doi.org/10.1029/2010JC006402, 2011. a
Schemm, S., Sprenger, M., and Wernli, H.: When during their life cycle are extratropical cyclones attended by fronts?, B. Am. Meteorol. Soc., 99, 149–165, https://doi.org/10.1175/bams-d-16-0261.1, 2017. a
Schultz, D. M. and Browning, K. A.: What is a sting jet?, Weather, 72, 63–66, https://doi.org/10.1002/wea.2795, 2017. a, b
Shapiro, M. A. and Keyser, D. A.: Extratropical Cyclones, Palmen Memorial Volume, vol. 182, book, microform Fronts, jet streams, and the tropopause, 167–190, American Meteorological Society, 1990. a
Skamarock, W. C., Klemp, J. B., Dudhia, J., Gill, D. O., Barker, D. M., Duda, M. G., Huang, X.-Y., Wang, W., and Powers, J. G.: A Description of the Advanced Research WRF Version 3, Tech. Rep. NCAR/TN-475+STR, NCAR Tech. Note, 2008. a
Spensberger, C. and Sprenger, M.: Beyond cold and warm: an objective classification for maritime midlatitude fronts, Q. J. Roy. Meteorol. Soc., 144, 261–277, https://doi.org/10.1002/qj.3199, 2018. a, b
Sprenger, M. and Wernli, H.: The LAGRANTO Lagrangian analysis tool – version 2.0, Geosci. Model Dev., 8, 2569–2586, https://doi.org/10.5194/gmd-8-2569-2015, 2015. a
Steenburgh, W. J. and Mass, C. F.: Interaction of an Intense Extratropical Cyclone with Coastal Orography, Mon. Weather Rev., 124, 1329–1352, https://doi.org/10.1175/1520-0493(1996)124<1329:IOAIEC>2.0.CO;2, 1996. a
Thomas, C. M. and Schultz, D. M.: What are the Best Thermodynamic Quantity and Function to Define a Front in Gridded Model Output?, B. Am. Meteorol. Soc., 100, 873–895, https://doi.org/10.1175/bams-d-18-0137.1, 2019. a
University Corporation for Atmospheric Research: The Weather Research and Forecasting Model, available at: http://wrf-model.org/, last access: 22 April 2020. a
Yang, Y., Uddstrom, M., Revell, M., Moore, S., and Turner, R.: Damaging southerly winds caused by barrier jets in the Cook Strait and Wellington region of New Zealand, Mon. Weather Rev., 145, 1203–1220, https://doi.org/10.1175/MWR-D-16-0159.1, 2017. a