the Creative Commons Attribution 4.0 License.
the Creative Commons Attribution 4.0 License.
 | 19 Oct 2020
How an uncertain short-wave perturbation on the North Atlantic wave guide affects the forecast of an intense Mediterranean cyclone (Medicane Zorbas)
Raphael Portmann
Juan Jesús González-Alemán
Michael Sprenger
Heini Wernli
Mediterranean cyclogenesis is known to be frequently linked to ridge building over the North Atlantic and subsequent anticyclonic Rossby wave breaking over Europe. But understanding of how this linkage affects the medium-range forecast uncertainty of Mediterranean cyclones is limited, as previous predictability studies have mainly focused on the relatively rare cases of Mediterranean cyclogenesis preceded by upstream extratropical transition of tropical cyclones. This study exploits a European Centre for Medium-Range Weather Forecasts (ECMWF) operational ensemble forecast with an uncertain potential vorticity (PV) streamer position over the Mediterranean that, 3 d after initialization, resulted in an uncertain development of the Mediterranean tropical-like cyclone (Medicane) Zorbas in September 2018. Later initializations showed substantially lower forecast uncertainties over the Mediterranean. An ad hoc clustering of the ensemble members according to the PV streamer position in the Mediterranean is used to study the upstream evolution of the synoptic to mesoscale forecast uncertainties. Cluster differences show that forecast uncertainties were amplified on the stratospheric side of a jet streak over the North Atlantic during the first day of the ensemble prediction. Subsequently, they propagated downstream and were further amplified within a short-wave perturbation along the wave guide, superimposed onto the large-scale Rossby wave pattern. After 3 d, the uncertainties reached the Mediterranean, where they resulted in a large spread in the position of the PV streamer. These uncertainties further translated into uncertainties in the position and thermal structure of the Mediterranean cyclone. In particular, the eastward displacement of the PV streamer in more than a third of the ensemble members resulted in a very different cyclone scenario. In this scenario, cyclogenesis occurred earlier than in the other members in connection to a pre-existing surface trough over the Levantine Sea. These cyclones did not develop the deep warm core typical of medicanes. It is proposed that the eastward-shifted cyclogenesis resulted in reduced values of low-level equivalent potential temperature in the cyclogenesis area. As a result, latent heating was not intense and deep enough to erode the upper-level PV anomaly and allow the formation of a deep warm core. The westward displacement led to surface cyclones that were too weak, and a medicane formed in only half of the members. The central, i.e. correct, PV streamer position resulted in the most accurate forecasts with a strong medicane in most members. This study is the first that explicitly investigates the impact of PV streamer position uncertainty for medicane development. Overall, results extend current knowledge of the role of upstream uncertainties in the medium-range predictability and unsteady forecast behavior of Mediterranean cyclones including medicanes.
- Article
(13899 KB) - Full-text XML
-
Supplement
(2618 KB) - BibTeX
- EndNote


Mediterranean cyclones are major causes of heavy precipitation and strong winds all across the Mediterranean basin and are therefore a leading meteorological threat in this region (e.g., Jansa et al., 2001; Pfahl and Wernli, 2012; Raveh-Rubin and Wernli, 2015). Hence, it is of high societal relevance to study uncertainties in their forecasts. It is widely known that Mediterranean cyclones mostly form from elongated equatorward intrusions of stratospheric high potential vorticity (PV), so-called PV streamers, that are the result of anticyclonic Rossby wave breaking over the North Atlantic–European region (e.g., Tafferner, 1990; Fita et al., 2006; Tous and Romero, 2013; Flaounas et al., 2015). Often, these PV streamers break up into PV cutoffs, which are typically identified as quasi-circular PV anomalies isolated from the main stratospheric reservoir on an isentropic surface (Appenzeller and Davies, 1992; Wernli and Sprenger, 2007). The dynamical forcing and destabilization by the upper-level PV streamer or cutoff are known to favor strong convection and cyclogenesis. Indeed, a range of modeling case studies have established that mesoscale errors in the structure of the upper-level PV streamer or cutoff are relevant sources of errors in the low-level development of Mediterranean cyclones and heavy-precipitation events (Fehlmann and Davies, 1997; Fehlmann and Quadri, 2000; Romero, 2001; Homar and Stensrud, 2004; Argence et al., 2008; Chaboureau et al., 2012). Other case studies have shown that intense latent heating in upstream cyclones over the North Atlantic can enhance anticyclonic Rossby wave breaking and thereby affect the PV streamer formation and, as a result, Mediterranean cyclogenesis and heavy precipitation (e.g., Massacand et al., 2001; Grams et al., 2011; Pantillon et al., 2015). Wiegand and Knippertz (2014) showed that high-amplitude PV streamers over the North Atlantic and Mediterranean are systematically preceded by latent heating upstream. The basic mechanism behind this link is that intense latent heating results in the transport of low-PV air from low levels to the upper troposphere where it contributes to the build-up or amplification of a ridge and, hence, the formation of a PV streamer downstream. Similar situations also occur in other regions, e.g., the North Pacific (Grams and Archambault, 2016). Such substantial latent heat release often occurs in warm conveyor belts (WCBs), which are coherent, rapidly ascending airstreams within extratropical cyclones (Browning, 1990; Madonna et al., 2014). In a systematic analysis, Raveh-Rubin and Flaounas (2017) found that more than 90 % of the 200 strongest Mediterranean cyclones were preceded by North Atlantic cyclones with substantial WCB activity, out of which five were tropical cyclones that underwent extratropical transition (ET; Clark et al., 2017; Keller et al., 2019). Situations with ET result in especially strong WCBs, ridge building, and downstream flow amplification (e.g., Riemer et al., 2008; Torn, 2010; Archambault et al., 2013; Quinting and Jones, 2016). Therefore, in recent years, particular attention has been devoted to cases where the genesis of intense Mediterranean cyclones or heavy precipitation over Europe was preceded by ET in the North Atlantic, thereby establishing a causal link between the two (e.g., Grams et al., 2011; Chaboureau et al., 2012; Pantillon et al., 2013, 2015; Grams and Blumer, 2015).
The Mediterranean cyclone Zorbas in September 2018 led to considerable damage through severe winds, torrential rainfall, major flooding, and even tornadoes (Floodlist, 2020; Severe-weather, 2020). The main affected regions were Libya in the early stages and southern Greece and Turkey later on (Floodlist, 2020). This cyclone belonged to a special class of Mediterranean cyclones that develop visual and structural similarities to tropical cyclones in a process similar to tropical transition (for further details on tropical transition see Davis and Bosart, 2004). These cyclones are often called medicanes (Mediterranean hurricanes; Emanuel, 2005; Tous and Romero, 2013; Cavicchia et al., 2014) or Mediterranean tropical-like cyclones (Miglietta et al., 2013). Medicanes are often associated with strong horizontal pressure gradients, wind, and rainfall, which may result in significant damage, although medicanes rarely attain hurricane intensity. They acquire the typical appearance of a hurricane, with convective cloud bands wrapped around a cloud-free central eye and a typical size of the associated cloud clusters on the order of 300 km in diameter, i.e. smaller than typical hurricanes (Emanuel, 2005). There is not yet a clear definition of medicanes. A common property seems to be the development of a (symmetric) warm-core structure throughout the whole troposphere, often called the deep warm core. The deep warm core of medicanes is not necessarily produced directly by convection but can, especially at lower levels, be promoted by horizontal advection and the seclusion of warm air in the cyclone center (Fita and Flaounas, 2018). The relative role of the positive upper-level PV anomaly and air–sea interaction for the intensification of medicanes is currently debated. In most cases the positive upper-level PV anomaly seems to be important for the initial intensification (Miglietta et al., 2017). This study focuses on uncertainties related to the PV streamer that led to the genesis and initial intensification of Medicane Zorbas.
Using European Centre for Medium-Range Weather Forecasts (ECMWF) operational ensemble forecasts, Pantillon et al. (2013) investigated the predictability of a medicane that was preceded by upstream ET. They found that ensemble members that appropriately forecasted the cyclone track during ET correctly reproduced ridge building and the resulting PV streamer over the Mediterranean, while ridge building was reduced and the PV streamer was absent in the ensemble members that wrongly predicted a southward deflection of the tropical cyclone. At the same time, only a few of the ensemble members with a PV streamer forecasted a downstream medicane, showing that the predictability of the medicane was still strongly limited, even when the representation of upstream ET was roughly correct and a PV streamer was forecasted. This indicates that other synoptic-scale aspects related to the PV streamer, for example uncertainty in its position, shape, or intensity, limited the predictability of the medicane (similar to Maier-Gerber et al., 2019, for a tropical transition over the North Atlantic). The existence of several “stages” in cyclone predictability is consistent with the systematic analysis of the predictability of recent medicanes by Di Muzio et al. (2019), which showed that such “forecast jumps” occur with different lead times for different forecast parameters. For example, rapid increases in the probability of cyclone occurrence can be found with longer lead times (4–7 d before the mature phase of the medicane) than rapid decreases in the spread of cyclone position (2–5 d) and of the strength of the upper-level warm core (initializations after cyclogenesis). While the dynamical link between uncertain upstream ET and uncertainties in the occurrence of Mediterranean cyclones and heavy precipitation is well established, Raveh-Rubin and Flaounas (2017) showed that only a small percentage of the most intense Mediterranean cyclones are preceded by ET in the North Atlantic. Therefore current understanding of the role of upstream processes in uncertainties and jumps in the forecasts of intense Mediterranean cyclones in general, and of medicanes in particular, is limited.
The present study addresses this knowledge gap by presenting a chain of dynamical processes linking ensemble forecast uncertainties in the North Atlantic to an uncertain PV streamer position over the Mediterranean and subsequently to an uncertain position and thermal structure of Medicane Zorbas. It is also one of the first studies that explicitly documents the role of an uncertain PV streamer position in uncertainties in the forecast of a medicane. To this aim, it investigates the ECMWF ensemble prediction initialized 84 h before cyclogenesis of Medicane Zorbas, which was the last initialization before a rapid decrease in ensemble spread of geopotential height at 500 hPa over the Mediterranean (i.e. a forecast jump) the day before cyclogenesis. This suggests that this particular ensemble forecast provides valuable information about the dynamics related to the forecast jump. Previous studies have shown that a detailed analysis of ensemble forecasts, especially of different scenarios in a particular ensemble prediction, can be highly rewarding for better understanding the dynamics and predictability limits involved. As an example, such scenarios have already been used to identify key dynamical elements limiting the predictability of not only medicanes (Pantillon et al., 2013) but also tropical cyclones (Torn et al., 2015; Pantillon et al., 2016; Gonzalez-Aleman et al., 2018; Maier-Gerber et al., 2019) and atmospheric blocking (Quandt et al., 2017).
The remainder of this article is structured as follows. After a description of the data and methods in Sect. 2, an overview of the large-scale situation prior to cyclogenesis and the synoptic evolution of Zorbas is given in Sect. 3. In Sect. 4, uncertainties in Zorbas in the operational ensemble forecast are discussed and a pragmatic clustering is introduced that uses the uncertainty in the PV streamer position to separate the ensemble forecast into three distinct PV streamer scenarios. Section 5 discusses the origin and the dynamical pathway of the forecast uncertainty that lead to the three PV streamer scenarios and, as a result, uncertain position and thermal structure of the Mediterranean cyclone. Finally, the main conclusions are summarized in Sect. 6.
2.1 Data
The basic data for this study are from the ECMWF Integrated Forecasting System (IFS; cycle 45r1; ECMWF, 2018). Operational ensemble forecasts with 50 perturbed members initialized at 00:00 UTC on 22–27 September 2018 and the operational analysis are used. The ECMWF operational ensemble forecast is based on perturbed initial conditions as well as stochastic perturbations of model physics (for details see ECMWF, 2018). The spectral resolution of the operational ensemble is TCo639 (about 18 km) on 91 model levels, and the resolution of the operational analysis is TCo1279 (about 9 km) on 137 model levels. The data are available every 6 h and have been interpolated to a regular grid with a horizontal resolution of 1∘. For the initialization at 00:00 UTC on 24 September 2018, PV on isentropic surfaces (every 5 K) and equivalent potential temperature (θe) on pressure levels (every 25 hPa) are additionally computed from the standard variables. As a measure of forecast skill, anomaly correlation coefficients (ACCs) are calculated for geopotential height at 500 hPa for each ensemble member of the forecasts initialized at 00:00 UTC on 24 September 2018 and 00:00 UTC on 27 September 2018. As a reference, the daily mean ERA-Interim climatology from 1979 to 2014 is used (for details see Sect. S4 in the Supplement). Anomalies of θe at 900 hPa were computed with respect to the September and October ERA-Interim climatology from 1979 to 2017.
In addition, observational data are used from satellite imagery: the infrared channel 9 (10.8 µm) of MSG SEVIRI provided by the European Organisation for the Exploitation of Meteorological Satellites (EUMETSAT) and the satellite-based 3-hourly rainfall intensity estimate Tropical Rainfall Measuring Mission (TRMM) level 3 version 7 on a 0.25∘ regular grid. Accumulated rainfall over a 9 h period is computed using the average intensity (mm h−1) over three subsequent 3-hourly time intervals, consistent with the computation of the daily accumulated TRMM rainfall estimate.
2.2 Trajectory computation and identification of WCBs
Computing trajectories provides insight into the Lagrangian history of air parcels. In this study, the Lagrangian analysis tool LAGRANTO (Wernli and Davies, 1997; Sprenger and Wernli, 2015) is used to identify WCB trajectories in the operational analysis (ascent rate larger than 600 hPa in 48 h; see e.g., Madonna et al., 2014). Intersection points of WCBs with the 325 K level are identified, considering trajectories present within the 322.5 and 327.5 K isentropic layer. Additionally, LAGRANTO was used to compute 24 h forward trajectories of low-level air parcels in the 850–950 hPa layer (every 25 hPa) and in a circle with a 250 km radius around the cyclogenesis position.
2.3 Cyclone phase space and cyclone tracking
The cyclone phase space (CPS; Hart, 2003) is a useful tool to diagnose the thermal structure of cyclones throughout their life cycle. The CPS uses three parameters to define the thermal structure: lower-tropospheric horizontal thermal asymmetry (B), which measures the across-track 900–600 hPa thickness gradient, i.e. frontal nature, and thermal winds in the lower (; 900–600 hPa) and upper (; 600-300 hPa) troposphere, which measure the vertical thermal structure. In this three-dimensional parameter space, cyclones can be classified as frontal (B>10) or nonfrontal (B≤10), cold core ( and ), hybrid ( and ), or deep warm core ( and ). In this study, cyclones that at least once in their life cycle fulfill the deep-warm-core criterion are classified as medicanes. As the frontal nature of the cyclone is not included in the focus of this study, the symmetry parameter B is not considered.
Cyclone tracks at 6-hourly temporal resolution are obtained for each of the 50 ECMWF ensemble members and the operational analysis using the cyclone detection and tracking method described by Picornell et al. (2001). This method was specifically designed to study mesoscale cyclones in the Mediterranean Sea, including medicanes (Gaertner et al., 2018). More specifically, 6-hourly sea level pressure (SLP) fields are used to identify pressure minima after applying a Cressman filter (radius of 200 km; Sinclair, 1997) to smooth out noisy features and small cyclonic structures. Weak cyclones are then filtered with an SLP gradient threshold of 0.5 hPa per 100 km. Cyclone tracks are identified with the aid of the horizontal wind field at 700 hPa, which is considered the steering level for cyclone movement. For one member (member 32) the cyclone track showed an unrealistically large jump during the first 6 h, and therefore the first track point was removed. The CPS is calculated every 6 h based on the track positions, and the CPS values at each time are smoothed using a running-mean filter with a 24 h window. Due to the small size of medicanes, a radius of 150 km is used to calculate the CPS values, consistent with previous studies (e.g., Gaertner et al., 2018) .
2.4 Normalized PV differences
Ensemble members will be grouped into clusters (see Sect. 4.2). To compare the PV of two ensemble clusters with different lead times, it is useful to compute normalized cluster-mean differences (see e.g., Torn et al., 2015):
where σPV is the standard deviation of the full ensemble. Hence, ΔPVAB becomes large when the cluster-mean difference in PV between clusters A and B at a given location is much larger than the ensemble standard deviation at the same location, i.e. when the two clusters contain the members of the ensemble that are most different from each other. Additionally, it allows different lead times to be easily compared. For example, if ΔPVAB increases with lead time, the cluster differences grow faster than the ensemble standard deviation, which means that the clusters become increasingly distinct from each other relative to the full ensemble.
2.5 Statistical significance
In order to be confident that the differences between two ensemble clusters are robust, a two-sided Wilcoxon rank-sum test (Wilks, 2011) for each cluster pair and considered field was applied. With such a test, the null hypothesis is investigated that it is equally likely that at a certain grid point the value of a randomly picked ensemble member in one cluster is larger or smaller than in a randomly picked ensemble member of the other cluster. When applying such a statistical test to a field, the false discovery rate should be controlled in order to avoid overinterpretation of the results (Wilks, 2016). This can be done by correcting the p values of the statistical test taking into account the number of tests. For this study we are only interested in a domain covering the North Atlantic and the Mediterranean and consider a box from 30 to 70∘ N and 80∘ W to 30∘ E. Therefore, a number of 4400 tests is used for the correction. As suggested by Wilks (2016), a Benjamini–Hochberg correction is used in this study and the false discovery rate is set to a rather conservative value of αfdr=0.1 for all analyses. Regions where the null hypothesis is rejected on this level of αfdr can then be used to identify where and when robust differences in the clusters emerge in the ensemble forecast.
This section first provides an overview of the synoptic situation over the Euro-Atlantic region prior to cyclogenesis of Medicane Zorbas. Then cyclogenesis and the initial intensification of Zorbas, during which it acquired a deep warm core, are discussed. A particular focus is given to the link between the evolution of low-level θe and upper-level PV and how it affected the formation of a deep warm core. This is followed by an overview of the full cyclone track and its evolution in the CPS diagram. The section ends with a discussion on satellite-based observations of clouds and precipitation.
The period prior to cyclogenesis, at 00:00 UTC on 24 September 2018 (Fig. 1a), was initially characterized by a large-scale situation with a low-amplitude Rossby wave pattern in the Euro-Atlantic region including a large-scale trough (T), a zonally oriented jet maximum (J) over Newfoundland, and a weak ridge (R) and trough (T2) pattern over northern Europe. In the following 3 d, the wave pattern was strongly amplified, and anticyclonic Rossby wave breaking resulted in a pronounced PV streamer (S2) over the Mediterranean at 00:00 UTC on 27 September 2018 (Fig. 1d). In greater detail, this transition can be split into different phases. First, the trough over Newfoundland and the weak ridge–trough pattern over Europe were amplified and the jet maximum moved over the North Atlantic and became directed northeastward towards Iceland (Fig. 1b). Subsequently, the trough (T) elongated into a PV streamer (S) and then interacted with Hurricane Leslie (L) resulting in substantial WCB activity over the central North Atlantic (black crosses in Fig. 1c, d). At the same time, anticyclonic wave breaking downstream over Europe was accompanied by a strongly amplified ridge and a narrowing of the trough (T2) over eastern Europe. This narrowing trough finally elongated to a PV streamer (S2) reaching the central Mediterranean Sea at 00:00 UTC on 27 September 2018 (see Fig. 1d). Note that in this case the anticyclonic wave breaking over Europe occurred clearly before the inflow of WCB air masses into the upstream ridge, indicating that the ridge amplification was not driven by the WCB related to Leslie. Hence, even if the presence of an upstream tropical cyclone and enhanced WCB activity are reminiscent of situations with Mediterranean cyclogenesis documented in previous studies (e.g., Pantillon et al., 2013; Raveh-Rubin and Flaounas, 2017), the temporal sequence in this case differs from the evolution documented in these studies.
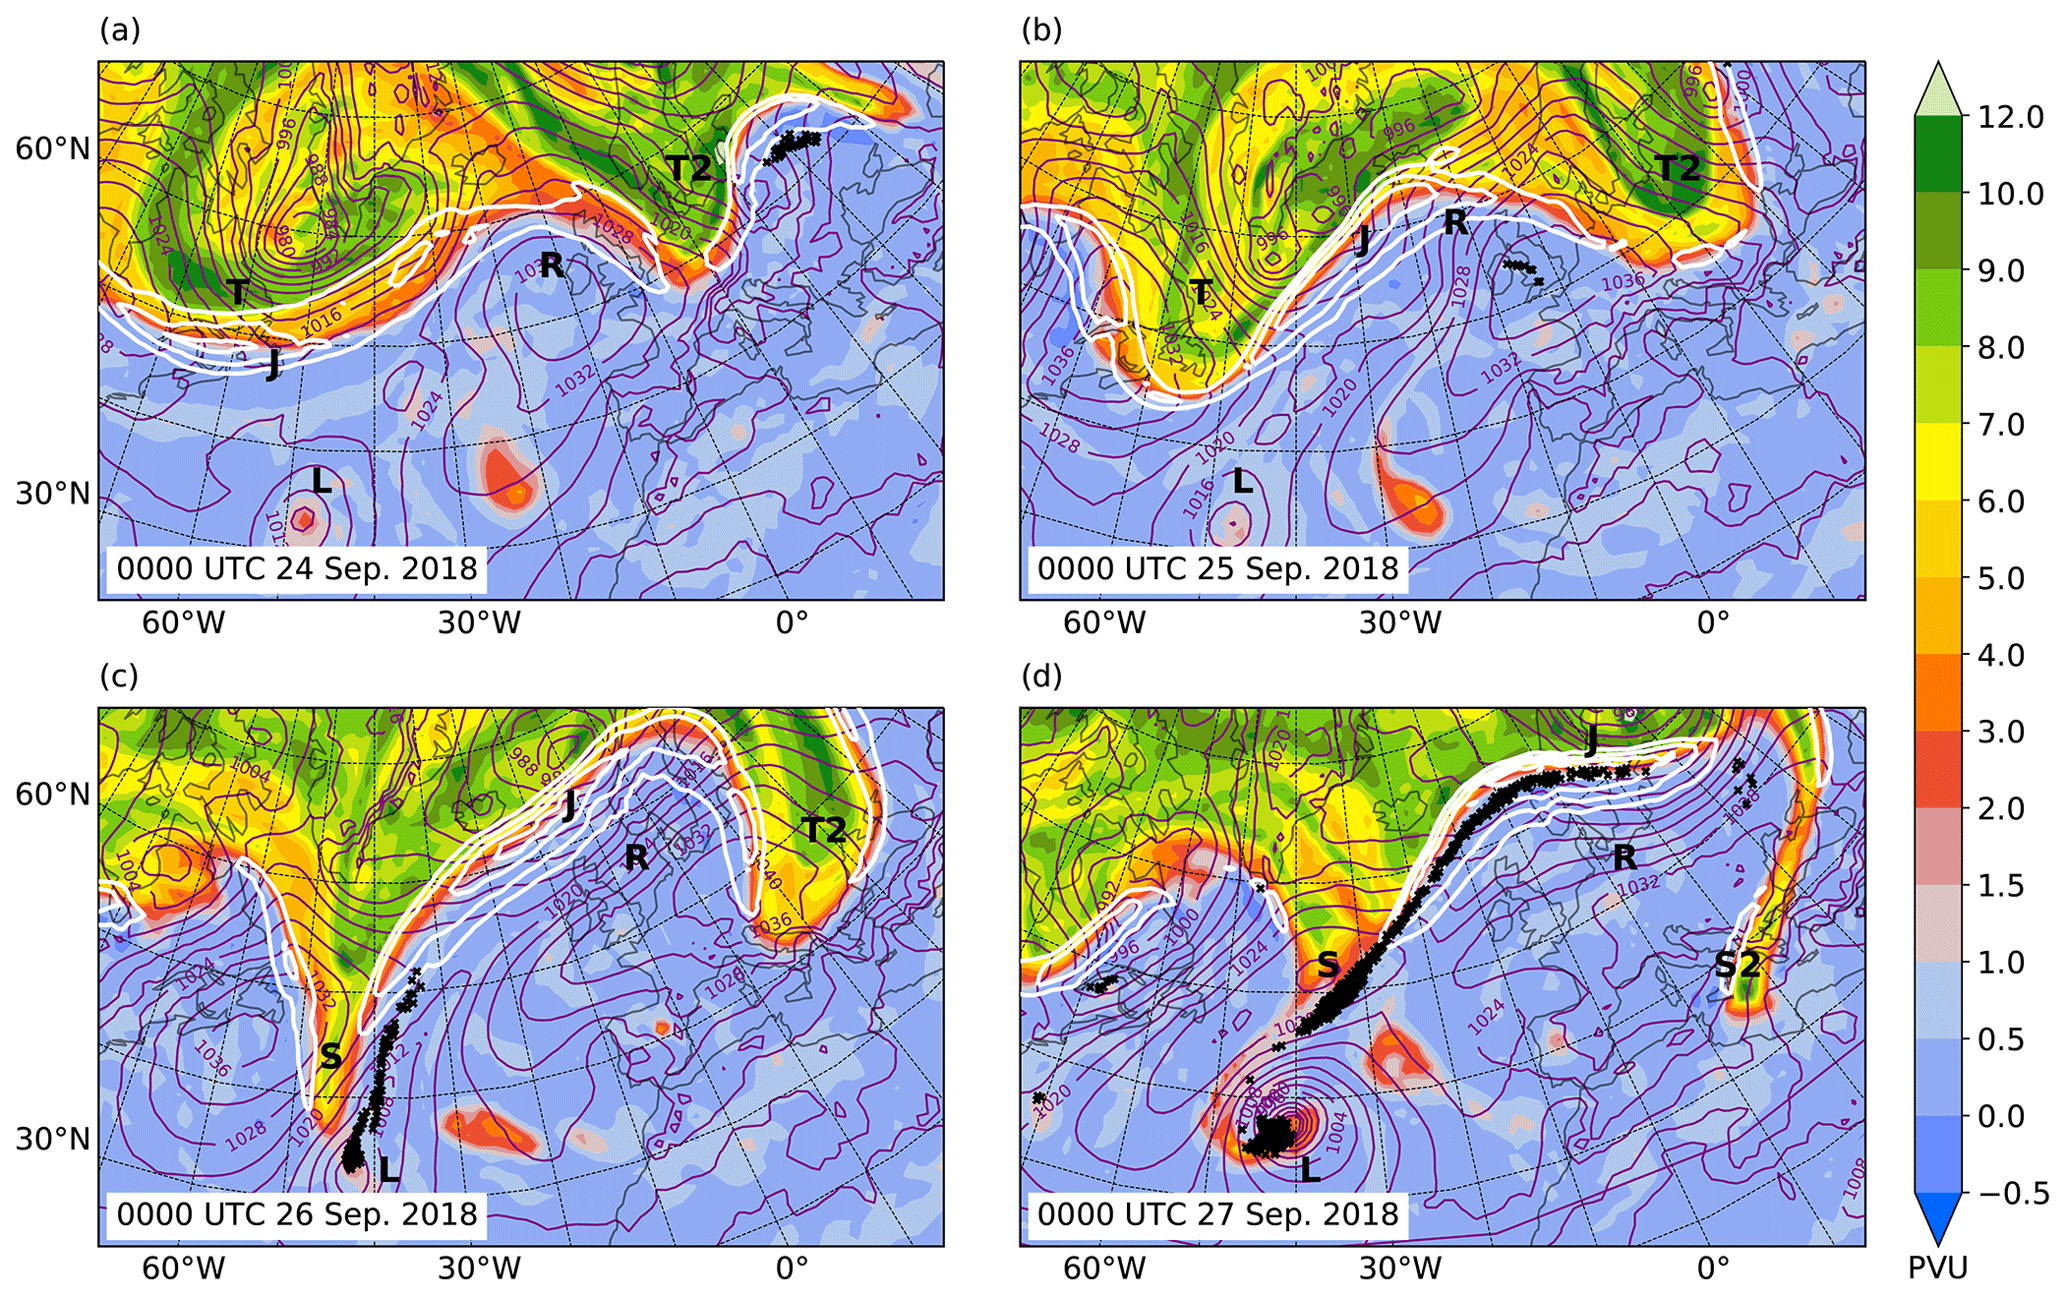
Figure 1Synoptic situation over the Euro-Atlantic sector before the formation of Medicane Zorbas. PV (shaded, in PVU) and wind speed (white contours; 50, 60, 70, 80 m s−1) at 325 K; intersection points of warm conveyor belts (ascent rate of more than 600 hPa in 48 h) with the 325 K isentrope (black crosses); and sea level pressure (purple contours, every 4 hPa) at (a) 00:00 UTC 24 September 2018, (b) 00:00 UTC 25 September 2018, (c) 00:00 UTC 26 September 2018, and (d) 00:00 UTC 27 September 2018. Labels mark relevant flow features (for details see text).
The formation of the PV streamer over the Mediterranean was followed by cyclogenesis of Zorbas at the PV streamer's southeastern flank (Fig. 2a–c). The PV streamer broke up at the time of cyclogenesis, resulting in the formation of a PV cutoff (Fig. 2b). In the subsequent 24 h, the cyclone intensified rapidly, and at the same time the PV cutoff was eroded, indicating the presence of intense diabatic processes. Shortly before cyclogenesis, the large mean sea level pressure gradient between a surface high-pressure system over eastern Europe and a surface low-pressure area over the Levantine Sea resulted in strong low-level advection of air with low θe across the Aegean Sea (Fig. 2a, d; for geographical locations see Fig. 3a). Air with anomalously high θe was present over Libya and at cyclogenesis in immediate proximity to the cyclone center (hatched regions in Fig. 2d, e). A detailed trajectory analysis (see Sect. S1 and Figs. S1, S2, and S3) shows that the low-level air in the 850–950 hPa layer and within a radius of 250 km around the cyclone center at the time of genesis (12:00 UTC 27 September 2018) originated from the Aegean Sea and Black Sea and was substantially moistened by sea-surface fluxes as it traveled across the Aegean Sea. This is consistent with the direction of low-level winds (Fig. 2d, e). The relevance of strong advection of cold and dry air and of moistening by surface fluxes over the Mediterranean has already been pointed out for medicane formation in the western Mediterranean (Miglietta and Rotunno, 2019). A day after cyclogenesis, a low-level θe maximum was present in the cyclone center (Fig. 2f), and, as diagnosed by the CPS, Zorbas had acquired a deep warm core at this time (Fig. 3b). The system acquired an equivalent barotropic structure; i.e. the surface cyclone, the minimum of geopotential height at 500 hPa, and the upper-level PV maximum were vertically aligned (Fig. 2c, f). The upper-level PV cutoff had decayed and the small-scale PV maximum with values around 2 PVU (potential vorticity unit; 1 PVU is equivalent to 10−6 m2 s−1 K kg−1.) above the cyclone center at 12:00 UTC on 28 September 2018 marked the upper end (at around 400 hPa) of a vertically extended diabatic PV maximum above the cyclone center that was disconnected from the stratospheric high-PV reservoir (not shown). The presence of a mid- and low-tropospheric PV maximum and an upper-tropospheric PV minimum are characteristic for many medicanes (Miglietta et al., 2017).
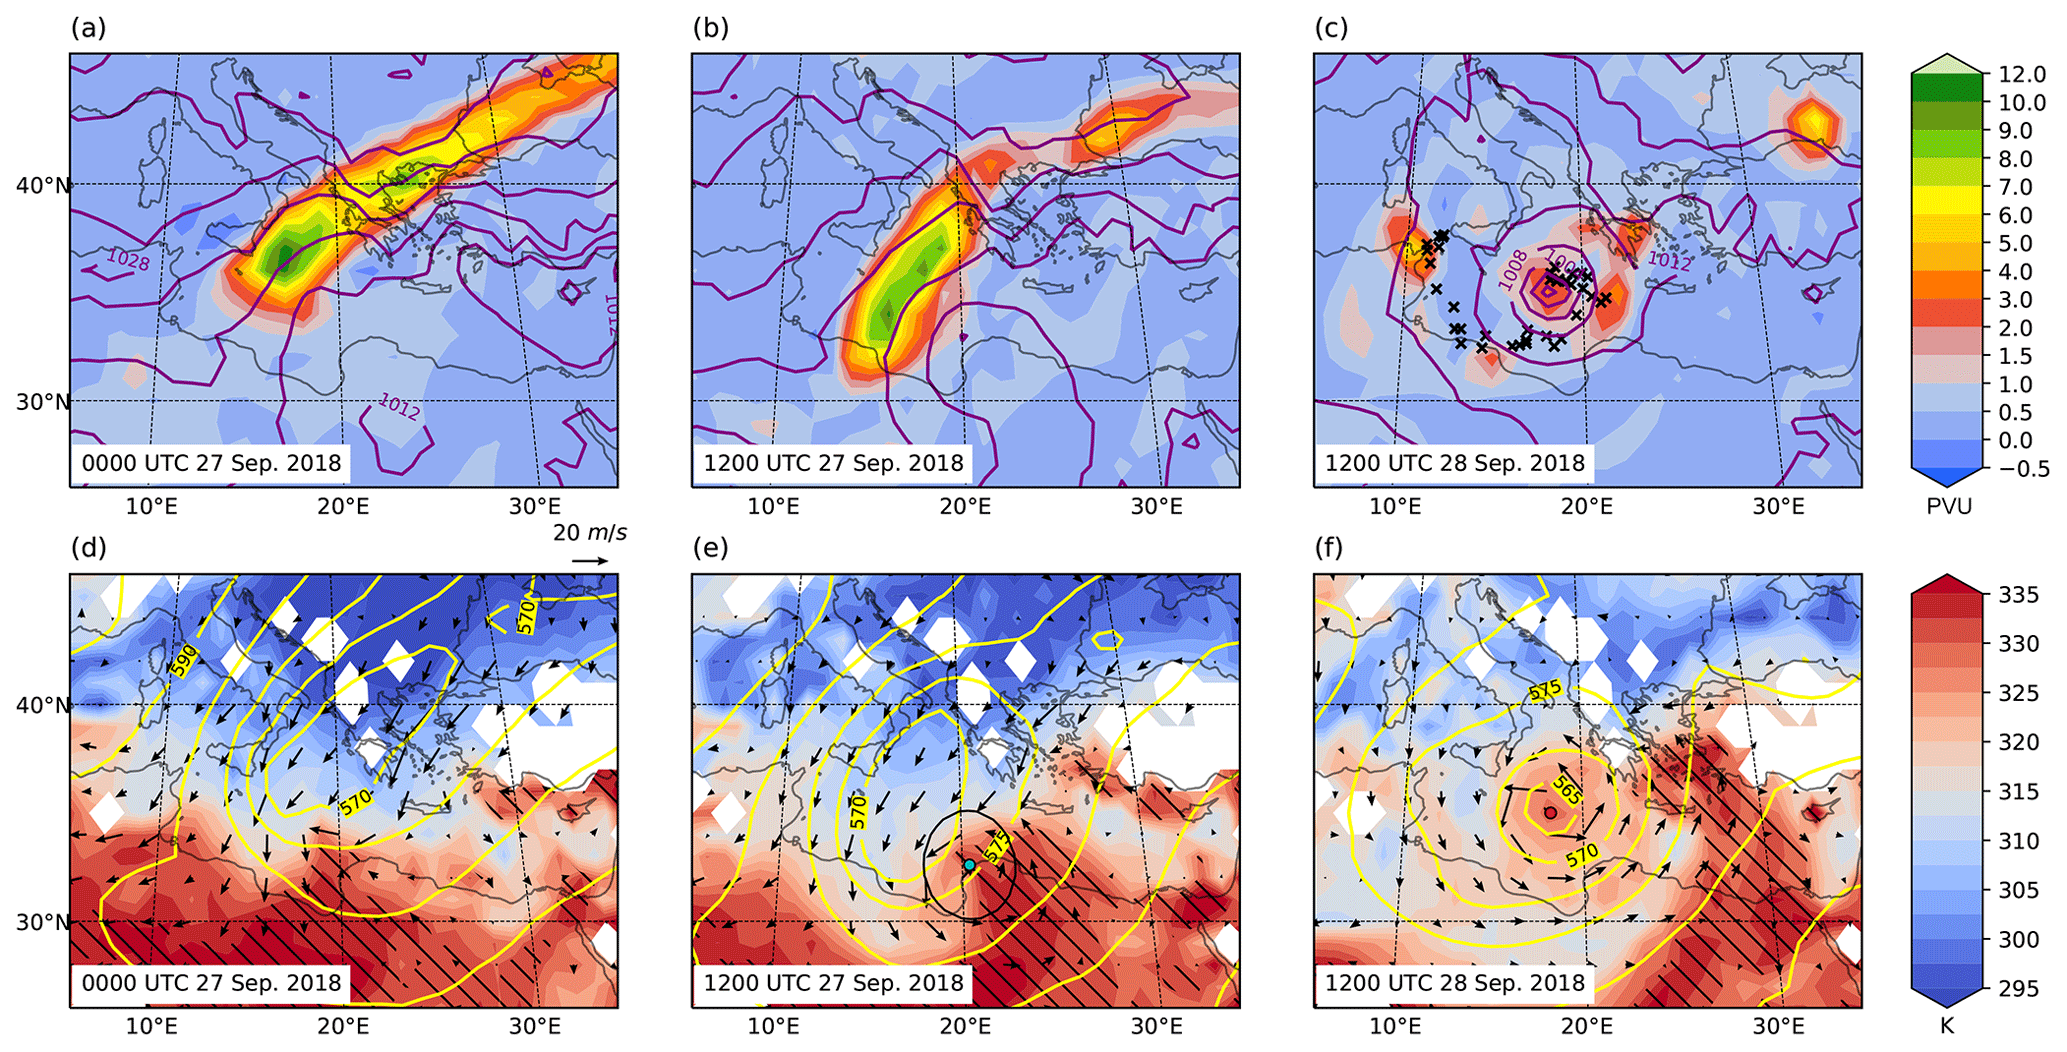
Figure 2Synoptic situation over the Mediterranean after the formation of the PV streamer at (a, d) 00:00 UTC 27 September 2018, (b, e) 12:00 UTC 27 September 2018, and (c, f) 12:00 UTC 28 September 2018. (a–c) PV at 325 K (shaded, in PVU; this level corresponds approximately to the 300–350 hPa pressure levels in this region), sea level pressure (purple contours, every 4 hPa); (d–f) equivalent potential temperature (θe, shaded, in K; white areas are missing values due to orography) and wind vectors at 900 hPa (black arrows, reference vector above panel d), and geopotential height at 500 hPa (yellow contours, every 5 gpdm). The hatched areas in (d–f) show regions where θe at 900 hPa is anomalously high (at least 1 standard deviation larger than climatology) with respect to the Sep–Oct ERA-Interim climatology for the period 1979–2017. In (e), the black circle denotes the circle with radius 250 km from which forward trajectories were started for air parcels with θe>322.5 K, and black crosses in (c) show the position of these air parcels 24 h later if they reached above the 322.5 K isentropic level.
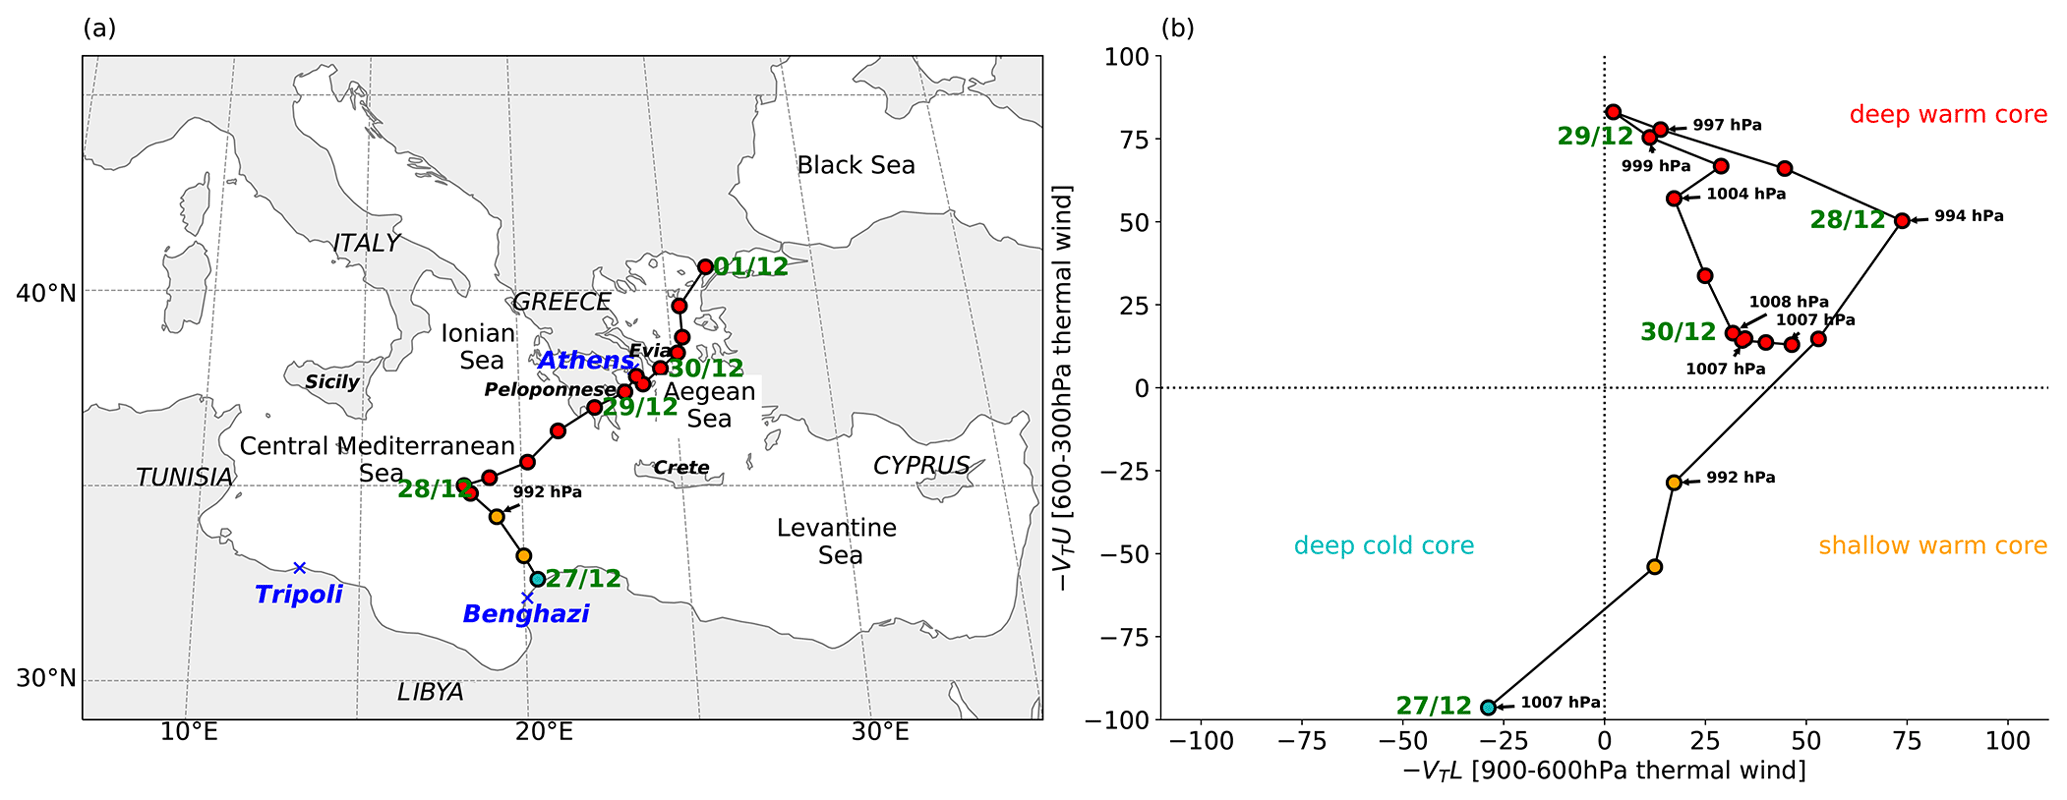
Figure 3(a) Track of Medicane Zorbas (circles and black line) and (b) cyclone phase space diagram derived from the ECMWF operational analyses, at 6-hourly intervals in each panel. Cyclone positions are colored according to the quadrant in the CPS diagram (blue: cold core, orange: shallow warm core, red: deep warm core). Black numbers indicate the minimum sea level pressure (hPa) of the cyclone at this particular time of its life cycle, and green numbers represent the day (in September 2018) and time (hours UTC).
In order for the latent heating to reach high enough and result in the erosion of the upper-level PV anomaly, sufficiently moist and warm air has to be present in the lower troposphere. The larger the θe of the low-level air parcels, the higher they can rise through moist adiabatic ascent (see e.g., Holton, 2004, their Fig. 9.10). In this case, values of θe at 900 hPa in the cyclogenesis area exceeded 330 K. This value provides the approximate maximum isentropic level to which these air masses can ascend upon the release of latent heat. In fact, more than half of the low-level air parcels with θe>322.5 K between 850 and 950 hPa and within a radius of 250 km around the cyclone center experienced strong diabatic heating and rapid cross-isentropic ascent (average diabatic heating of about 30 K) to levels of above 322.5 K during the first 24 h after cyclogenesis (black crosses in Fig. 2c). Hence, they contributed to the erosion of the PV cutoff. This is a strong indication that air with high θe at low levels was a crucial prerequisite for the erosion of the stratospheric PV anomaly and, as a result, the formation of a deep warm core. In fact, the difference between θe at 850 hPa and tropopause potential temperature is a measure of bulk stability and has been shown to be a suitable predictor for the occurrence of tropical transition (so-called coupling index, McTaggart-Cowan et al., 2015). The formation of a deep-warm-core system with an equivalent barotropic structure as a result of high θe values at low tropospheric levels and strong latent heating will become relevant again towards the end of this article when cyclone evolutions in the ensemble members are discussed.
The full track of Medicane Zorbas and the CPS diagram are shown in Fig. 3. Zorbas formed at 12:00 UTC on 27 September 2018 close to Benghazi, moved into the central Mediterranean, and then sharply turned eastward and moved over Greece into the Aegean Sea, where it finally decayed 4 d after its formation. According to the CPS (Fig. 3b), Zorbas formed as a cold-core cyclone and within 18 h acquired a deep warm core that was sustained for more than 3 d. This is comparable to the January 1982 case investigated by Picornell et al. (2014) but substantially longer than for all eight recent medicane cases investigated by Di Muzio et al. (2019) using the same dataset. Zorbas reached its maximum intensity (992 hPa) only 12 h after cyclogenesis. Note that the ECMWF reported a substantial underestimation of the cyclone intensity in the operational analysis in the later stage of its life cycle and estimated the real central pressure at landfall to be below 990 hPa (ECMWF, 2019). Satellite images indicate the formation of an eye-like feature shortly before Zorbas reached Greece on 29 September 2018. However, this aspect of the life cycle is beyond the scope of this study. Instead, we focus on the synoptic aspects prior to cyclogenesis and the subsequent period of initial cyclone intensification and the formation of a deep warm core.
An observational perspective on this period is given in Fig. 4a. Shortly after cyclogenesis, intense rainfall was observed northwest of the cyclone center (Fig. 4a). The dense cloud patch and lightning activity (see Sect. S2 and Fig. S4) at this location are indicative of strong latent heating and the presence of deep convection, which helps to explain the rapid diabatic erosion of the PV cutoff (see e.g., Wirth, 1995; Portmann et al., 2018). At the time when the deep warm core was well established, precipitation was weaker and mainly located near the cyclone center (Fig. 4b). The cloud structure indicates that well-defined fronts were absent; i.e. Zorbas acquired a more tropical-like appearance. According to TRMM, Zorbas lead to extreme daily rainfall (>99th percentile, reference period 1998–2018) in several regions in Libya, the central Mediterranean, and Greece (not shown).
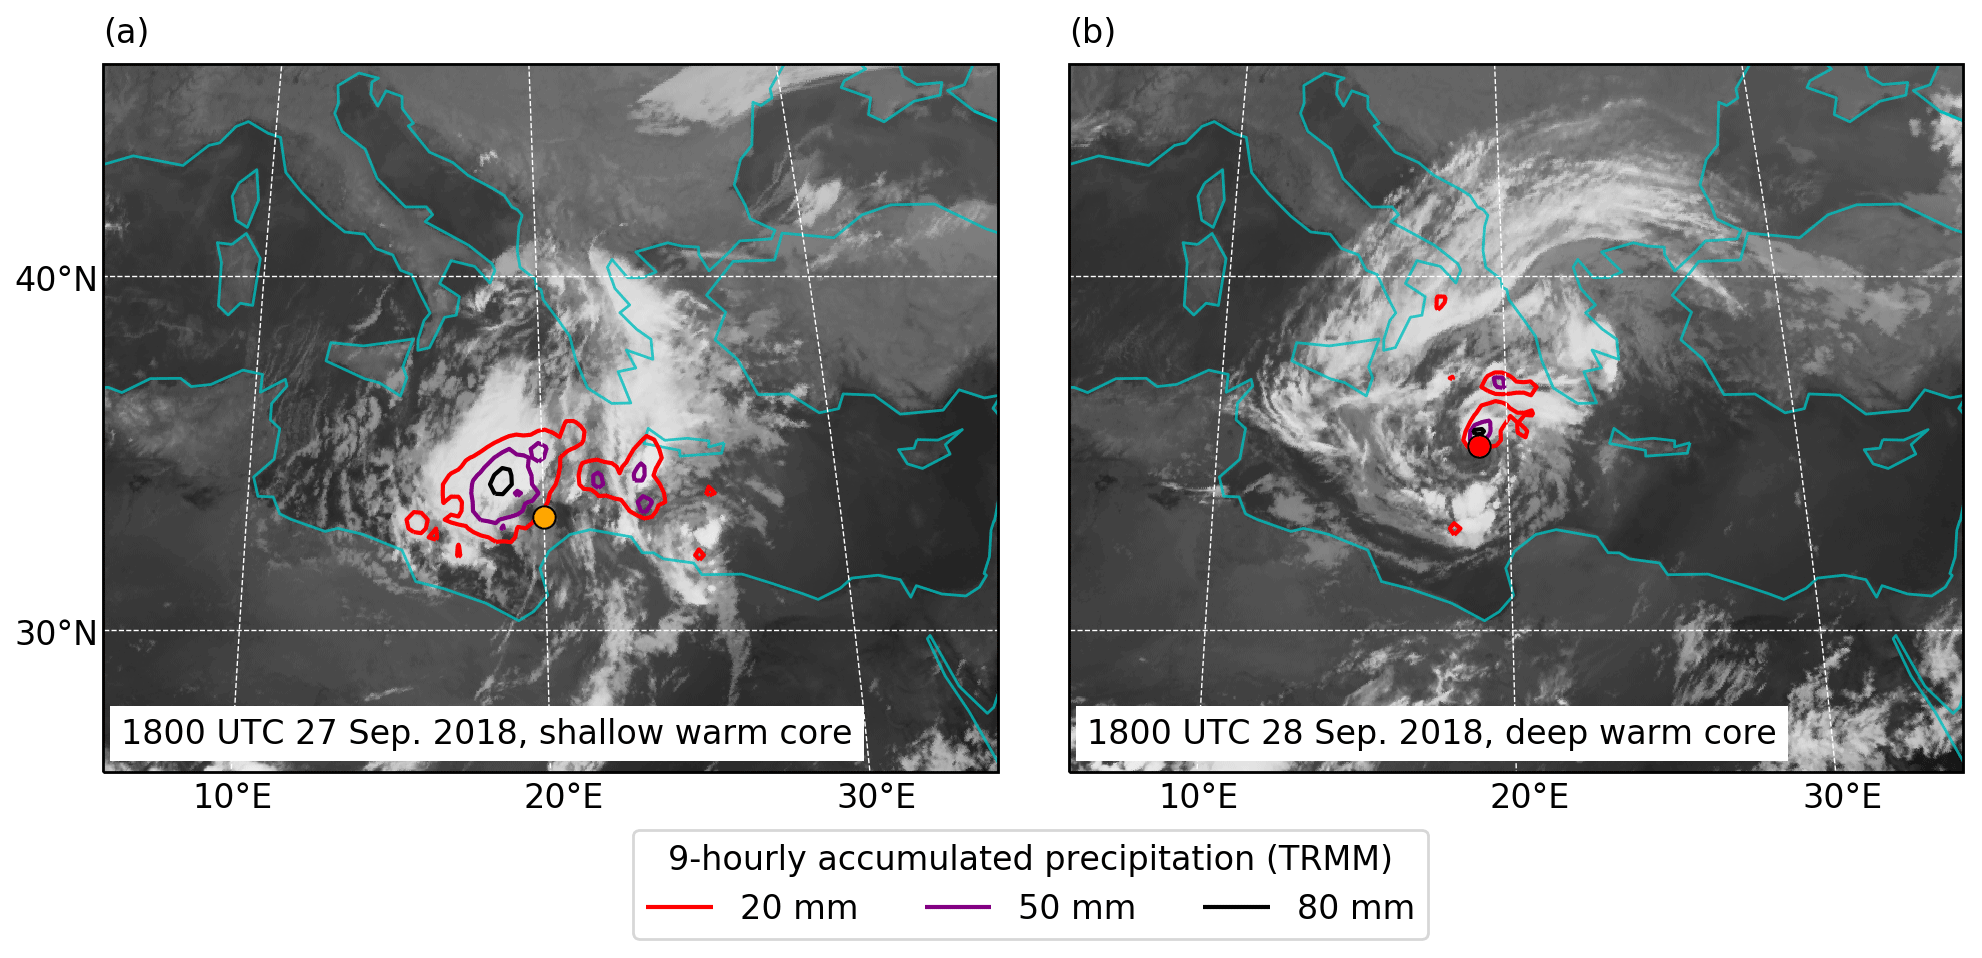
Figure 4Infrared channel 9 (10.8 µm) of MSG SEVIRI provided by EUMETSAT (grey shading) and 9-hourly accumulated TRMM precipitation during the period centered at the indicated time (colored contours) at (a) 18:00 UTC 27 September 2018 and (b) 18:00 UTC 28 September 2018. Cyclone positions based on the ECMWF operational analysis are marked with circles and colored according to the thermal structure of the cyclone (as in Fig. 3).
The evolution of Zorbas in the first day of its life cycle to some extent agrees well with the climatological evolution found for the strongest Mediterranean cyclones around their time of maximum intensity (Flaounas et al., 2015), in particular considering the shape and cyclone-relative position of the upper-level PV anomaly. Remarkable in this case were the anomalously high values of low-level θe. Further, the evolution bears similarities to the first phase of tropical-transition events of strong extratropical cyclones as discussed in Davis and Bosart (2003, 2004). In particular, this is true for the enhanced rainfall to the west of the cyclone center, the diabatic erosion of the stratospheric PV anomaly, the emergence of a tropospheric PV maximum above the storm center, and the formation of an equivalent barotropic vortex.
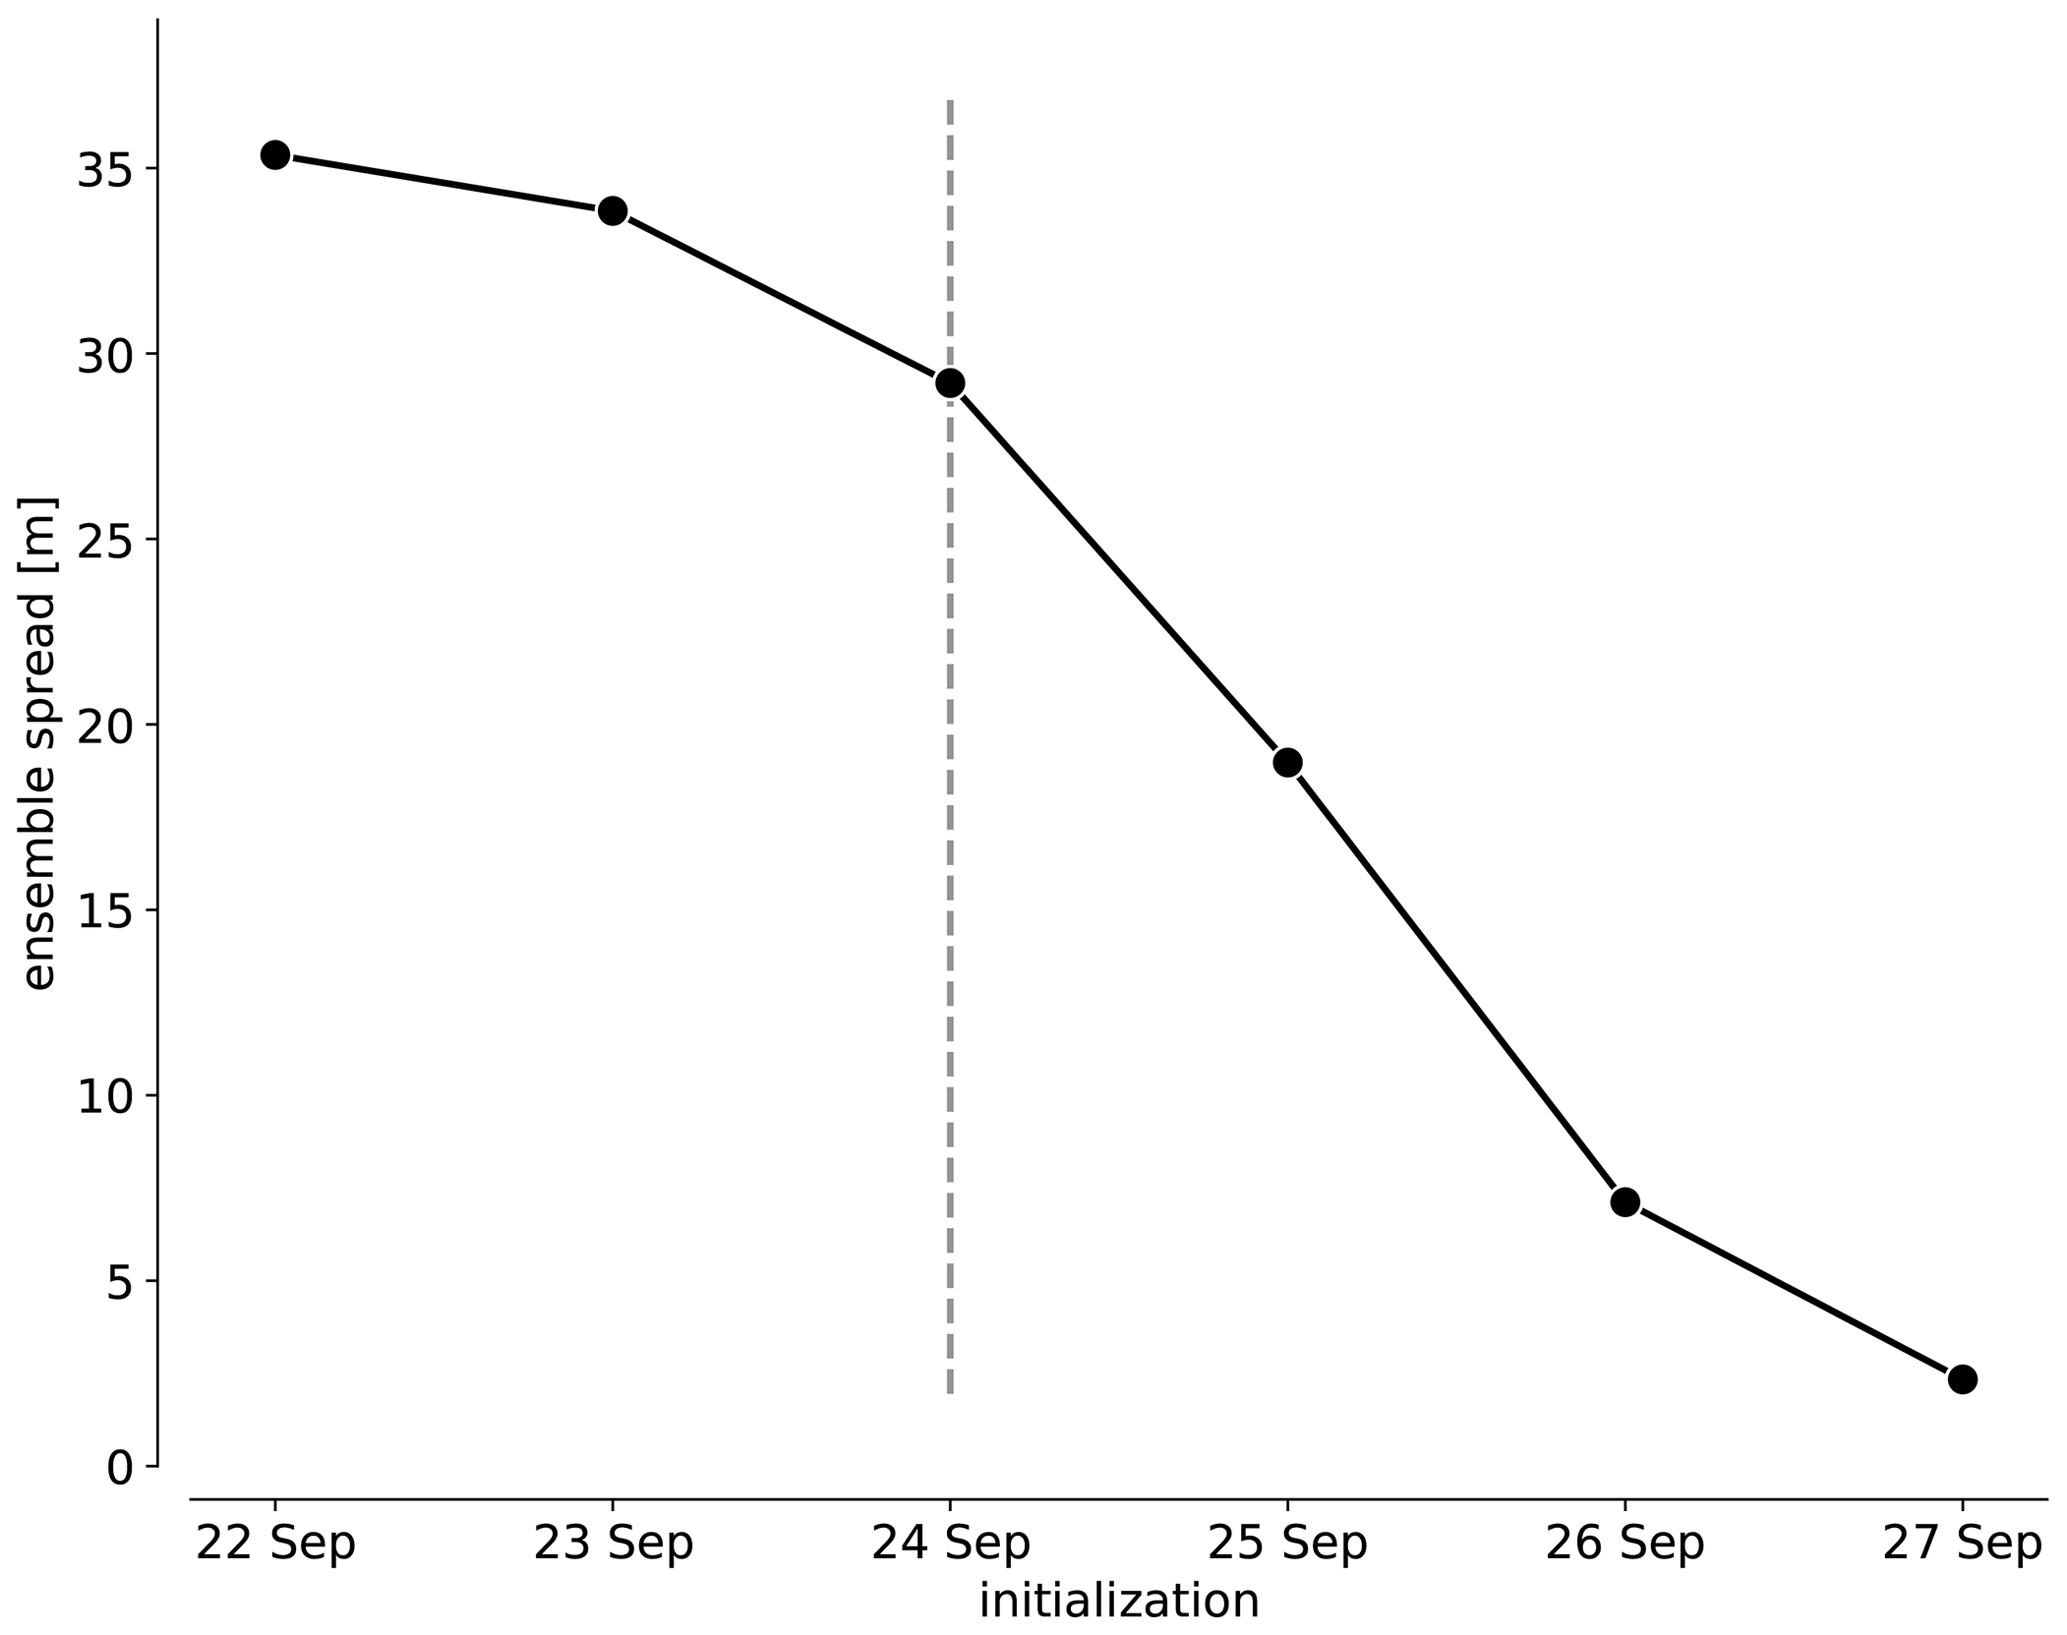
Figure 5Area-averaged ensemble spread of geopotential height at 500 hPa at 00:00 UTC 27 September 2018 in a box over the Mediterranean (30–45∘ N, 5–30∘ E; see black box in Fig. 7) for initializations at 00:00 UTC 22 to 27 September 2018 (black dots and line). The initialization used in this study (00:00 UTC 24 September 2018) is indicated by the dashed line.
4.1 Ensemble spread and uncertainties in the formation of the Mediterranean cyclone
The synoptic situation over the Mediterranean was associated with uncertainties in the operational ECMWF ensemble forecasts, which decreased particularly strongly for initialization later than 3 d prior to genesis of Zorbas. This is shown by the evolution of the ensemble spread of geopotential height at 500 hPa averaged over the Mediterranean at 00:00 UTC on 27 September 2018 for different initializations (Fig. 5). For initializations until 00:00 UTC on 24 September 2018, the spread decreases only marginally, but it does so very rapidly for later initializations, indicating a forecast jump. For the initialization at 00:00 UTC on 24 September 2018, all ensemble members develop a surface cyclone but uncertainties related to cyclone position and its thermal structure were substantial (Fig. 6, ignore colors for this paragraph). While several members forecasted the cyclone at approximately the correct location over Libya at 12:00 UTC on 27 September 2018, some forecasted it too far to the west and some too far northeast in the Aegean Sea (Fig. 6a). This zonal position uncertainty was still present 24 h later, and in four members the cyclone had already disappeared (Fig. 6b). At this time, the uncertainty in the position of the cyclone ranged from the coast of Tunisia to the Aegean Sea. Interestingly, in the members where the cyclone formed too far to the northeast, genesis occurred more than 12 h before cyclogenesis in the operational analysis. In addition, only 21 ensemble members predicted a medicane (markers with white centers), and among the medicanes differences in their strength (as defined by the maximum value; see marker size) were substantial. Also there was a clearly preferred region for medicanes to form near the Libyan coast, indicating a link between cyclone position and thermal structure. Considering these large uncertainties associated with the prediction of the surface cyclone and the timing of the forecast jump, we focus in the following on the 00:00 UTC 24 September 2018 initialization. The rest of this article aims to show that these uncertainties in the Mediterranean cyclone evolution can be traced back to a short-wave perturbation in the wave guide over the North Atlantic initiated during the first day of the forecast and that they were tightly linked to uncertainties in the position of the Mediterranean PV streamer.
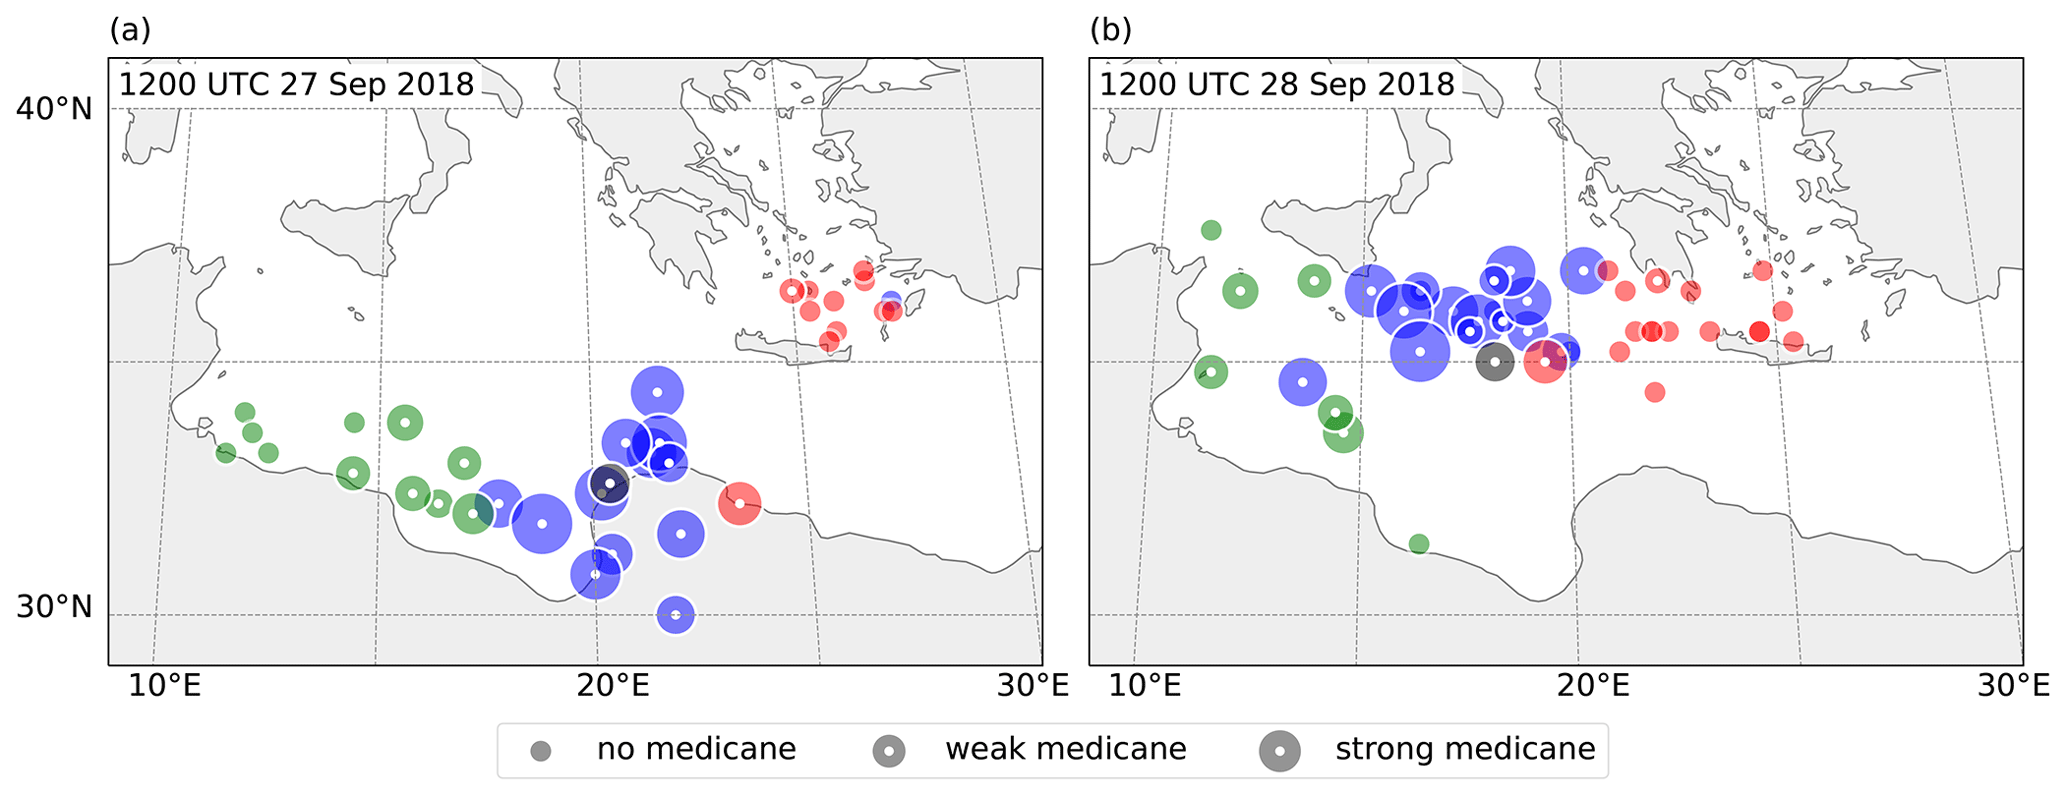
Figure 6Geographical maps of cyclone positions in all ensemble members and the operational analysis at (a) 12:00 UTC 27 September 2018 and (b) 12:00 UTC 28 September 2018. For medicanes (markers with white center), the size of the markers is proportional to the maximum intensity of the upper-level warm core (see legend for comparison; no medicane: , weak medicane: , strong medicane: ). Marker colors indicate the cluster to which the cyclone belongs (W: green, C: blue, E: red, analysis: black; discussed in Sect. 5.2)
4.2 Ensemble clustering according to the position of the PV streamer
In the 00:00 UTC 24 September 2018 forecast, the ensemble spread at 00:00 UTC on 27 September was mainly enhanced because of substantial uncertainty in the position of the Mediterranean PV streamer. To establish the dynamical link between uncertainties in the position (and thus the thermal structure) of the cyclone and upstream uncertainties along the North Atlantic wave guide, a pragmatic clustering procedure is presented that classifies the ensemble members of the 00:00 UTC 24 September 2018 initialization into three clusters based on the position of the Mediterranean PV streamer (S2 in Fig. 1d), at day 3 of the forecast. The three identified PV streamer scenarios (clusters) are the basis for all remaining analyses. For the clustering, a box is defined around the PV streamer identified at 00:00 UTC on 27 September 2018 in the operational analysis (Mediterranean box; 30–45∘ N, 5–30∘ E; see black box in Fig. 7). The clustering uses vertically averaged PV between 320 and 330 K, hereafter called PVav. Before averaging, all PV values with PV <2 PVU are set to zero to remove the contribution of the variability in tropospheric PV values. Hence, PVav is high in areas where the stratospheric PV streamer is strong and deep and is low where it is weak and shallow. The pragmatic clustering is then based on two different steps. First, from all 50 ensemble members the ones are identified for which the area with PVav≥2 PVU in the box has more than 75 % overlap with the corresponding area in the analysis (black contour in Fig. 7). In these 19 members, the streamer has a similar location to that in the analysis, i.e. a central position in the ensemble, and is therefore referred to as cluster C (see blue shading in Fig. 7). The remaining members are separated into two clusters depending on whether the maximum PVav is shifted to the west (cluster W, 12 members, green shading in Fig. 7) or east (cluster E, 18 members, red shading in Fig. 7) relative to the analysis. There is one ensemble member that cannot be attributed to one of the three clusters because its overlap is less than 75 % but the maximum of PVav is located at the same longitude as in the analysis. The histogram of the longitude where the maximum of PVav occurs between 36 and 37∘ N (inset in Fig. 7) shows three clearly distinct peaks, one for each cluster, validating the simple clustering approach. There are a few borderline members, but they do not affect the main results of this study.
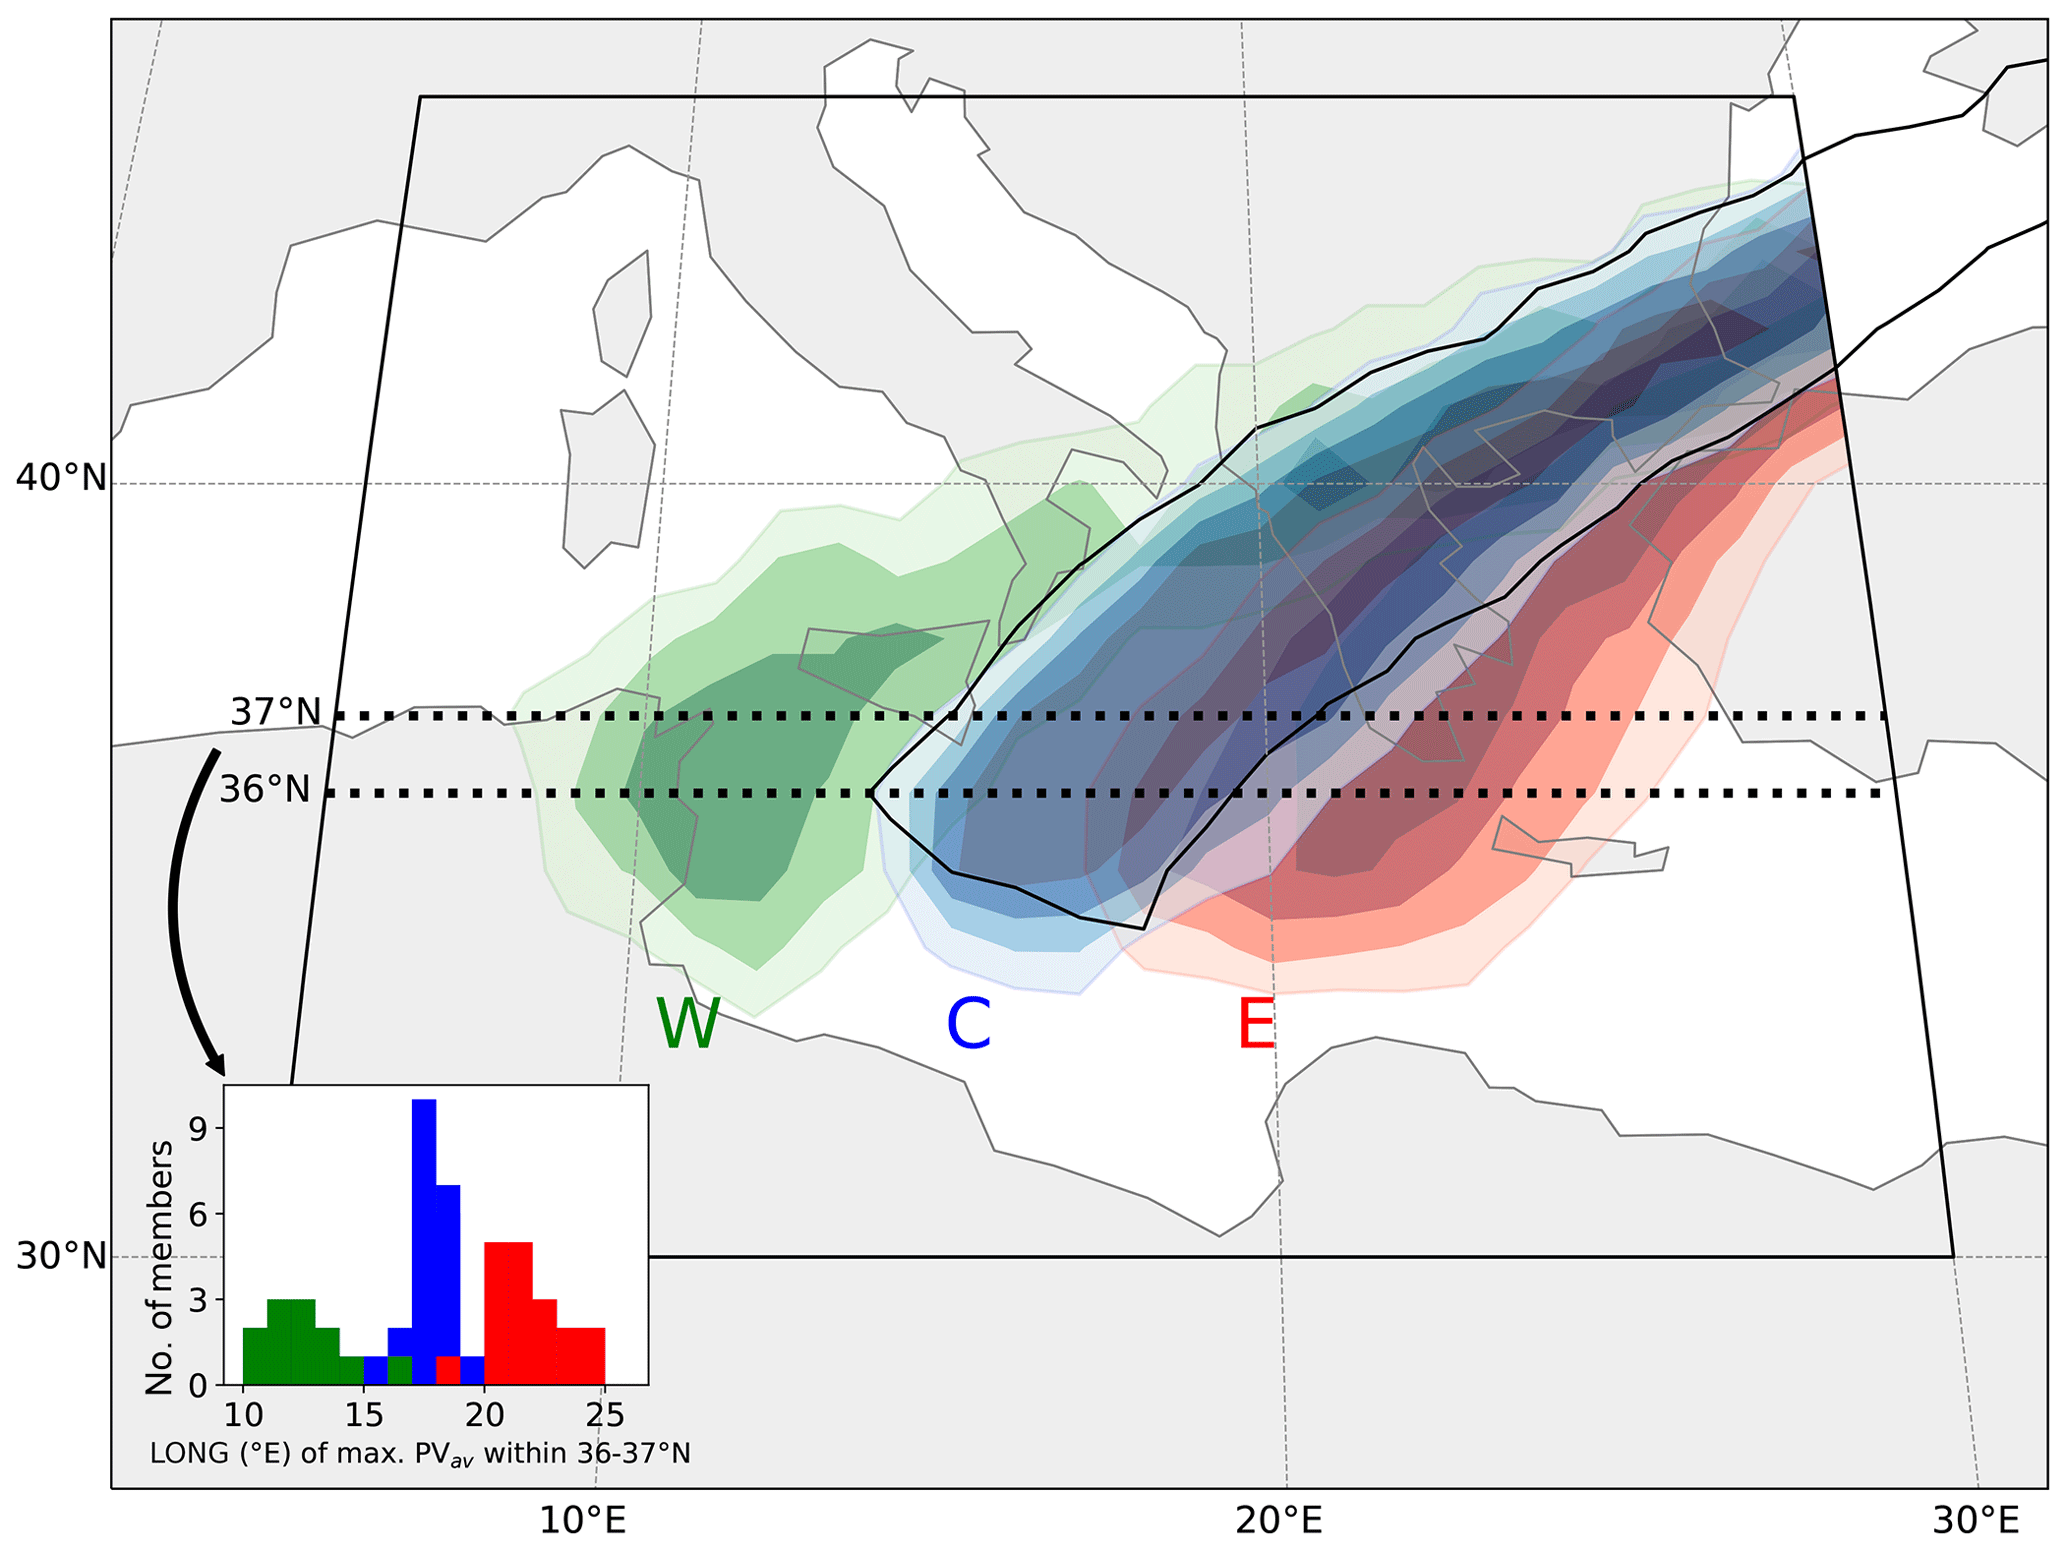
Figure 7Clustering of ensemble members (initialized at 00:00 UTC 24 September 2018) according to the position of the upper-level PV streamer in the Mediterranean at 00:00 UTC 27 September 2018. Colors show frequencies of PVav≥2 PVU (shading, every 20 %) for each cluster (blue: cluster C, green: cluster W, red: cluster E), and the black line shows the contour where PVav=2 PVU in the operational analysis. The region considered for the clustering is shown by the black box. PVav denotes vertically averaged PV between 320 and 330 K with PV values below 2 PVU set to zero (see text for details).
The meaningfulness of this clustering for studying the predictability of this case is further supported by the fact that it helps to explain the temporal development of the ACC averaged in the Mediterranean box. As shown in Fig. 8a, the ACC of geopotential height at 500 hPa in the Mediterranean starts to decrease in the majority of the ensemble members at the time when the PV streamer reaches the Mediterranean on 26 September 2018 and even more after cyclogenesis occurs, while it remains high (close to 1) until 29 September 2018 for most members of cluster C (blue lines in Fig. 8a). After the decrease from 1 to around 0.8, the median ACC (red line) remains fairly constant until 29 September 2018. In comparison, for the ensemble forecast initialized at 00:00 UTC on 27 September 2018, i.e. at the time when the PV streamer has developed, the ACC remains high in all members during the intensification and deepest phase of Zorbas, decreasing only after 29 September 2018 (Fig. 8b), likely due to errors associated with a second PV streamer reaching the Mediterranean in the northern part of the box (not shown). It can be concluded that errors in the position of the PV streamer limited the large-scale predictability as measured by the ACC of geopotential height on 500 hPa in the Mediterranean and that cluster C contains the members with the most accurate forecasts.
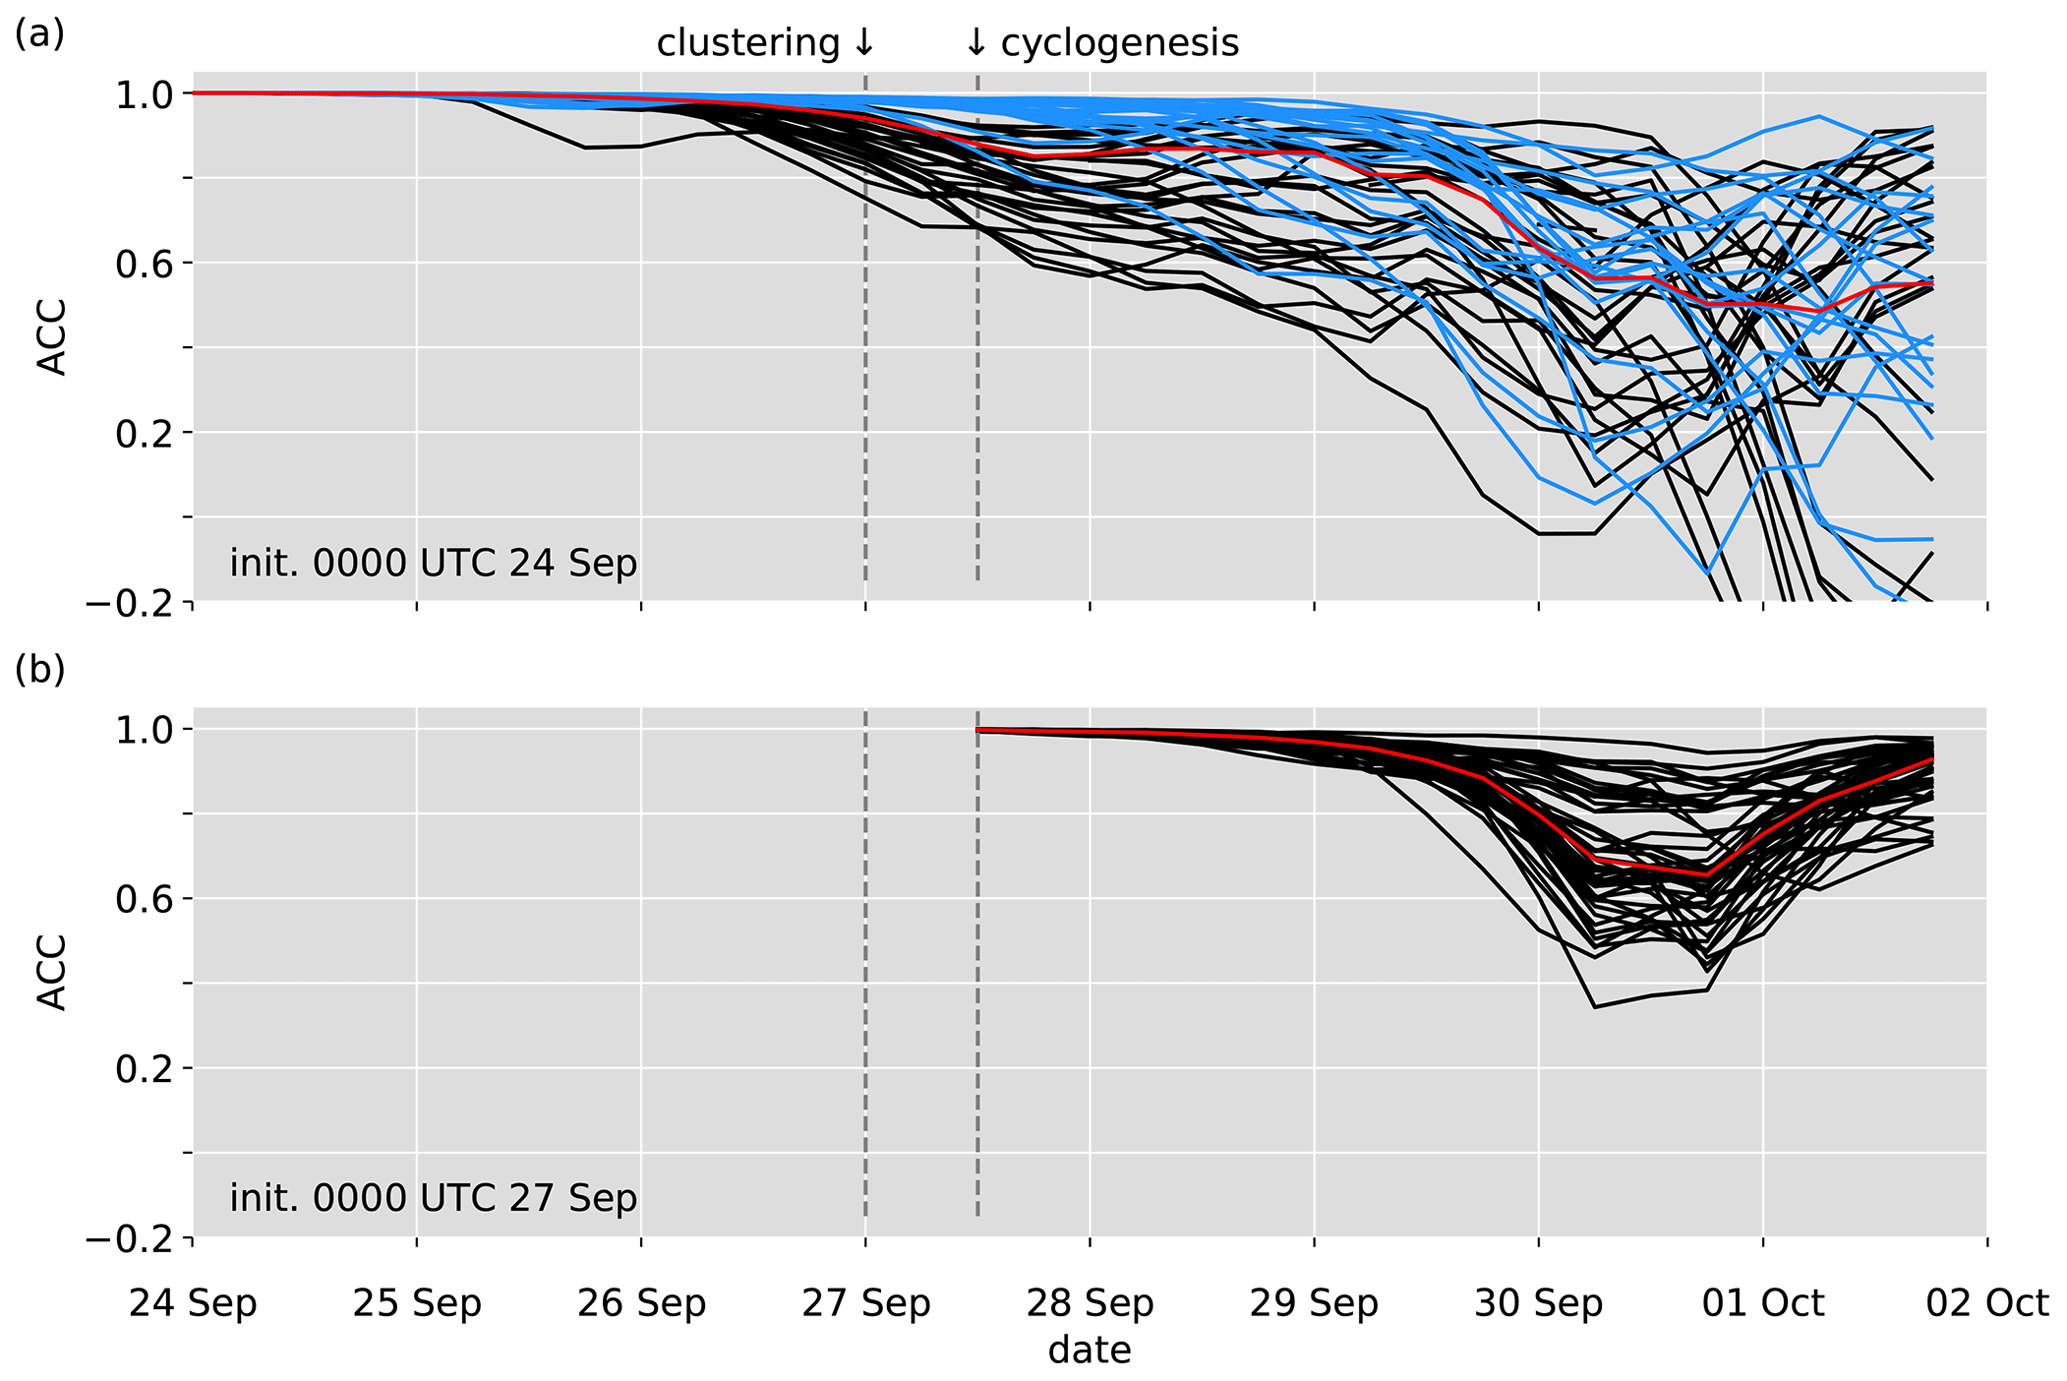
Figure 8Temporal evolution of the anomaly correlation coefficient of geopotential height at 500 hPa in the Mediterranean box (see Fig. 7) for each ensemble member (black lines) and the median (red line) of the ensemble forecasts initialized at (a) 00:00 UTC 24 September 2018 (blue lines show members of cluster C) and (b) 00:00 UTC 27 September 2018.
In the following the chain of dynamical processes is described that enabled the propagation and amplification of forecast uncertainties (here considered as significant differences between cluster means) from the North Atlantic to the Mediterranean cyclone. In a first step, the propagation and amplification of these uncertainties along the North Atlantic wave guide to the Mediterranean PV streamer is considered. Subsequently, the effect of the uncertain PV streamer position on the cyclone position and thermal structure is discussed.
5.1 Uncertainty propagation from the North Atlantic jet streak to the Mediterranean PV streamer
To investigate the first part of the uncertainty propagation, normalized PV differences (see Sect. 2.4) at 325 K between clusters E and W (ΔPVEW) are analyzed, as these are the clusters that deviate the most in terms of the PV streamer position.
During the first day after initialization a short-wave pattern of positive and negative PV differences emerges on the North Atlantic wave guide from an initially very spotty difference field (Figs. 9 and 10a). At 18:00 UTC on 24 September 2018 (Fig. 9d), a positive ΔPVEW with an amplitude larger than 1.5 standard deviations appears on the stratospheric side of the strengthening jet streak (yellow contour, marked as J in Fig. 1b 6 h later) over the North Atlantic. This ΔPVEW is statistically significant (as indicated by the white contours in Fig. 9d; see Sect. 2.5 for the testing procedure). Visually, it seems that this ΔPVEW emerges from a small positive ΔPVEW that propagates from the Gulf of Saint Lawrence at the initial time (Fig. 9a) along the wave guide into the North Atlantic and is amplified (indicated by the grey boxes in Fig. 9). However, these differences early in the forecast are not statistically significant, and other sources of the amplified ΔPVEW at 18:00 UTC 24 September 2018 could be relevant. A substantial contribution of WCBs can be excluded, as there is no WCB activity in the area indicated by the grey boxes (as shown in Fig. 1a, b) and precipitation is weak (not shown). This is in contrast to studies that have shown the relevance of the diabatic low-PV outflow of WCBs for the emergence of upper-tropospheric forecast uncertainties and subsequent downstream propagation (e.g., Pantillon et al., 2013; Grams et al., 2018). However, diabatic processes could still be relevant for the amplification of the forecast uncertainties in this case. Further, an analysis of geostrophic and ageostrophic wind differences between the two clusters and PV gradients in the jet streak region suggests that differences in the ageostrophic circulation are important for this amplification (not shown). A physically plausible cause of the strengthening of the jet streak and the initiation of a wave-like perturbation at the tropopause at 18:00 UTC on 24 September 2018 could be the band of high stratospheric PV that is approaching the tropopause region (green contours in Fig. 9d).
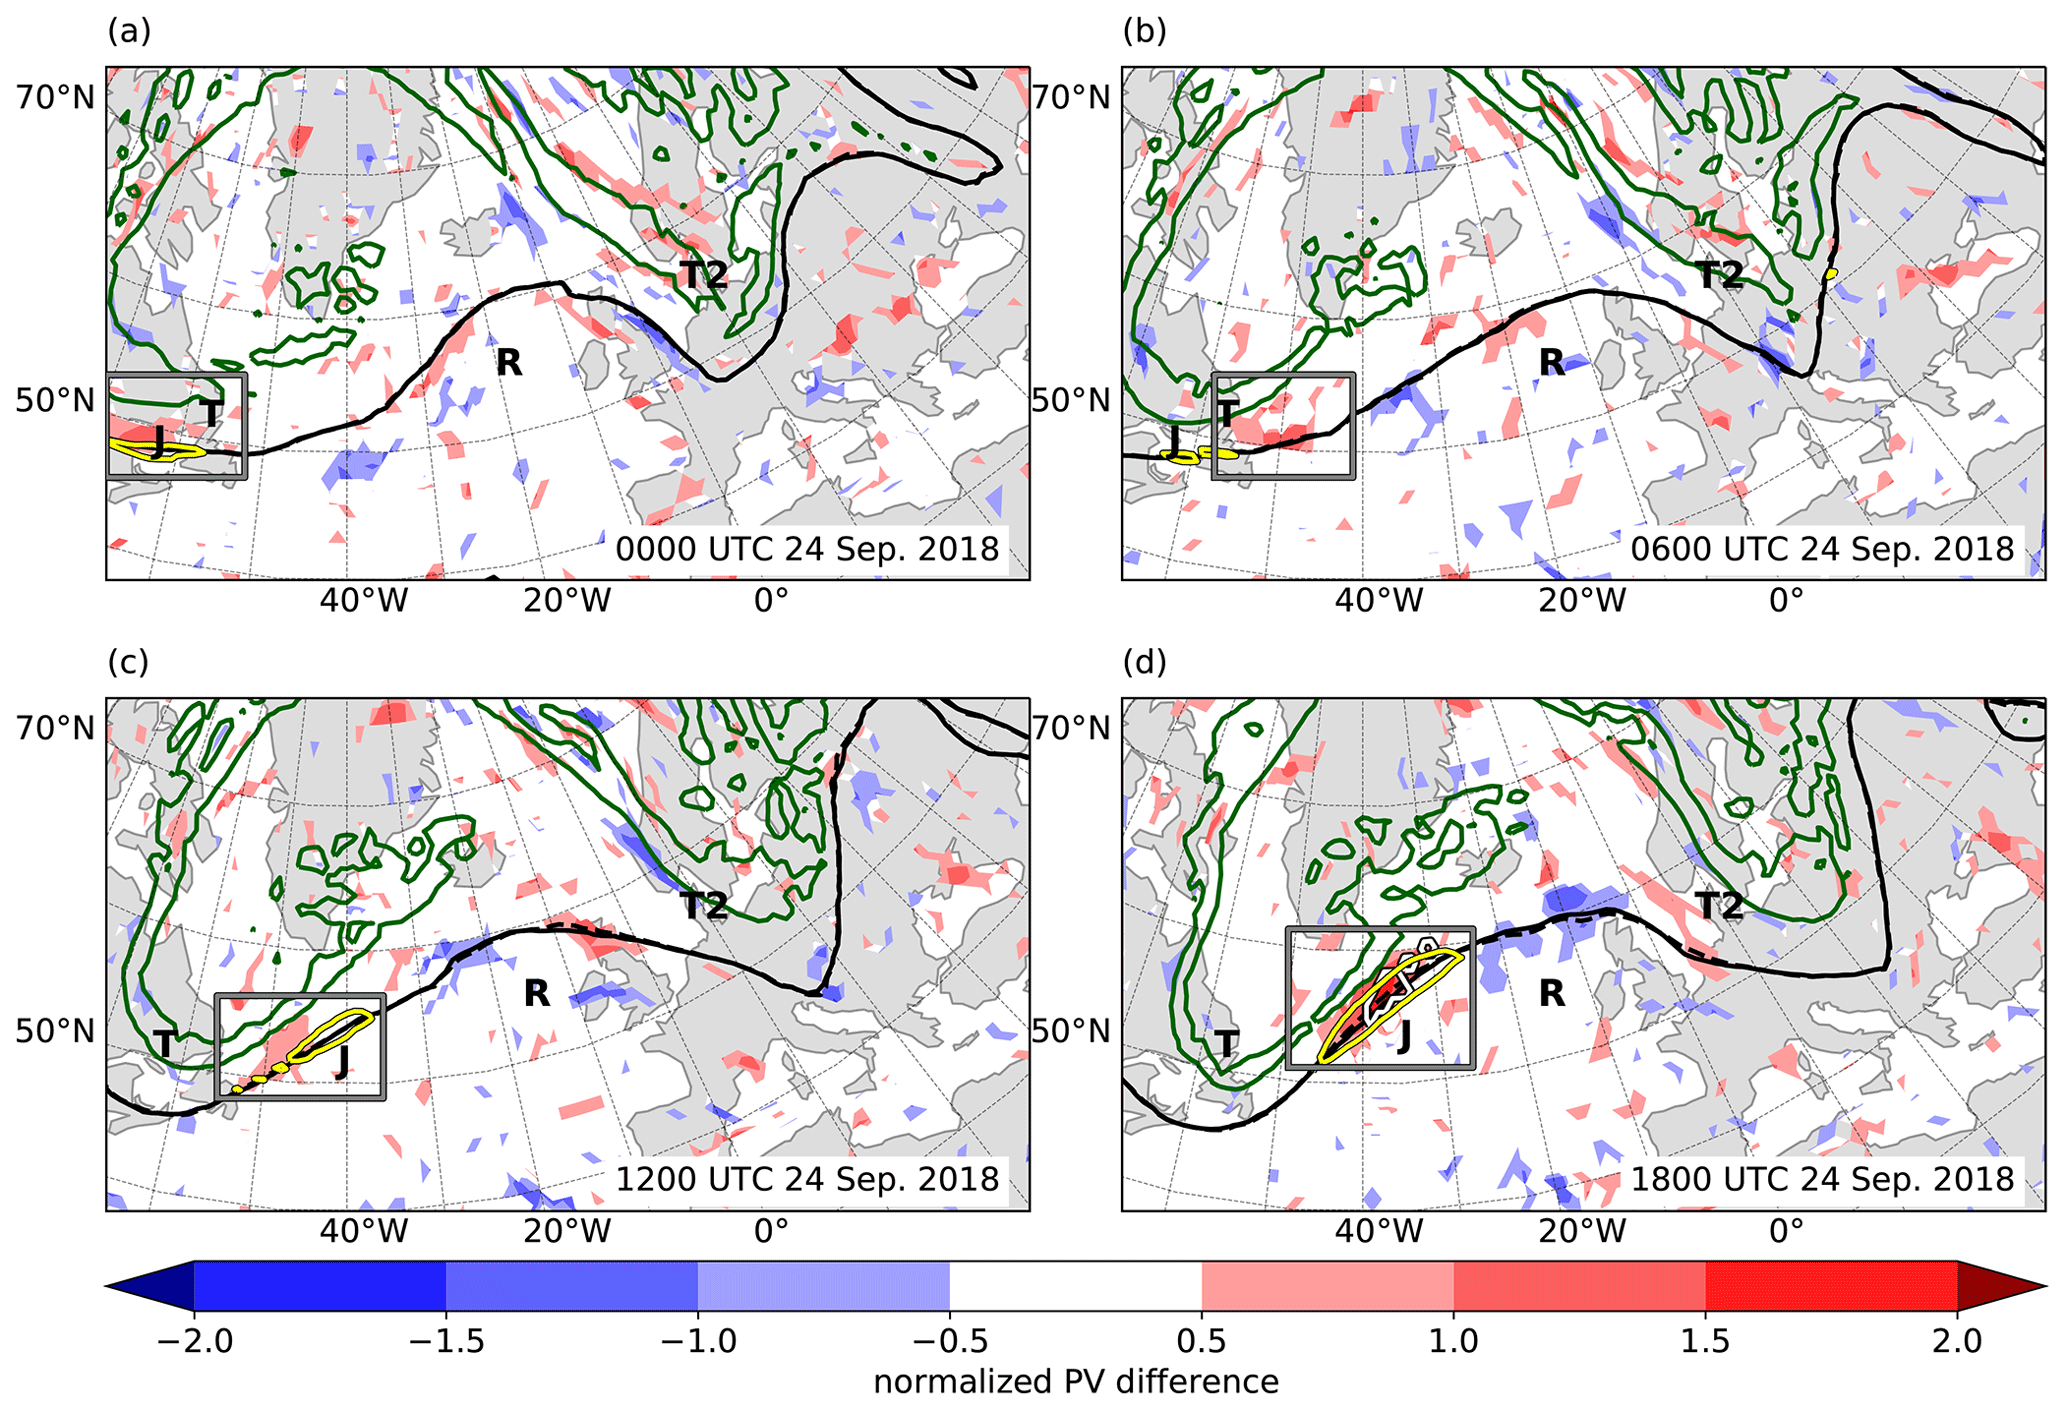
Figure 9Normalized PV differences between clusters E and W (ΔPVEW, shaded), 2 PVU contour (black lines) of clusters E (solid) and W (dashed), 9 PVU contour (green lines) and wind speed (yellow lines, 70 m s−1) in the operational analysis at 325 K from 00:00 UTC 24 September to 18:00 UTC 24 September 2018, every 6 h. Regions with statistically significant PV differences (αfdr<0.1, single isolated significant grid points are removed) are marked with white contours, and grey boxes mark the regions of interest (for details see text).
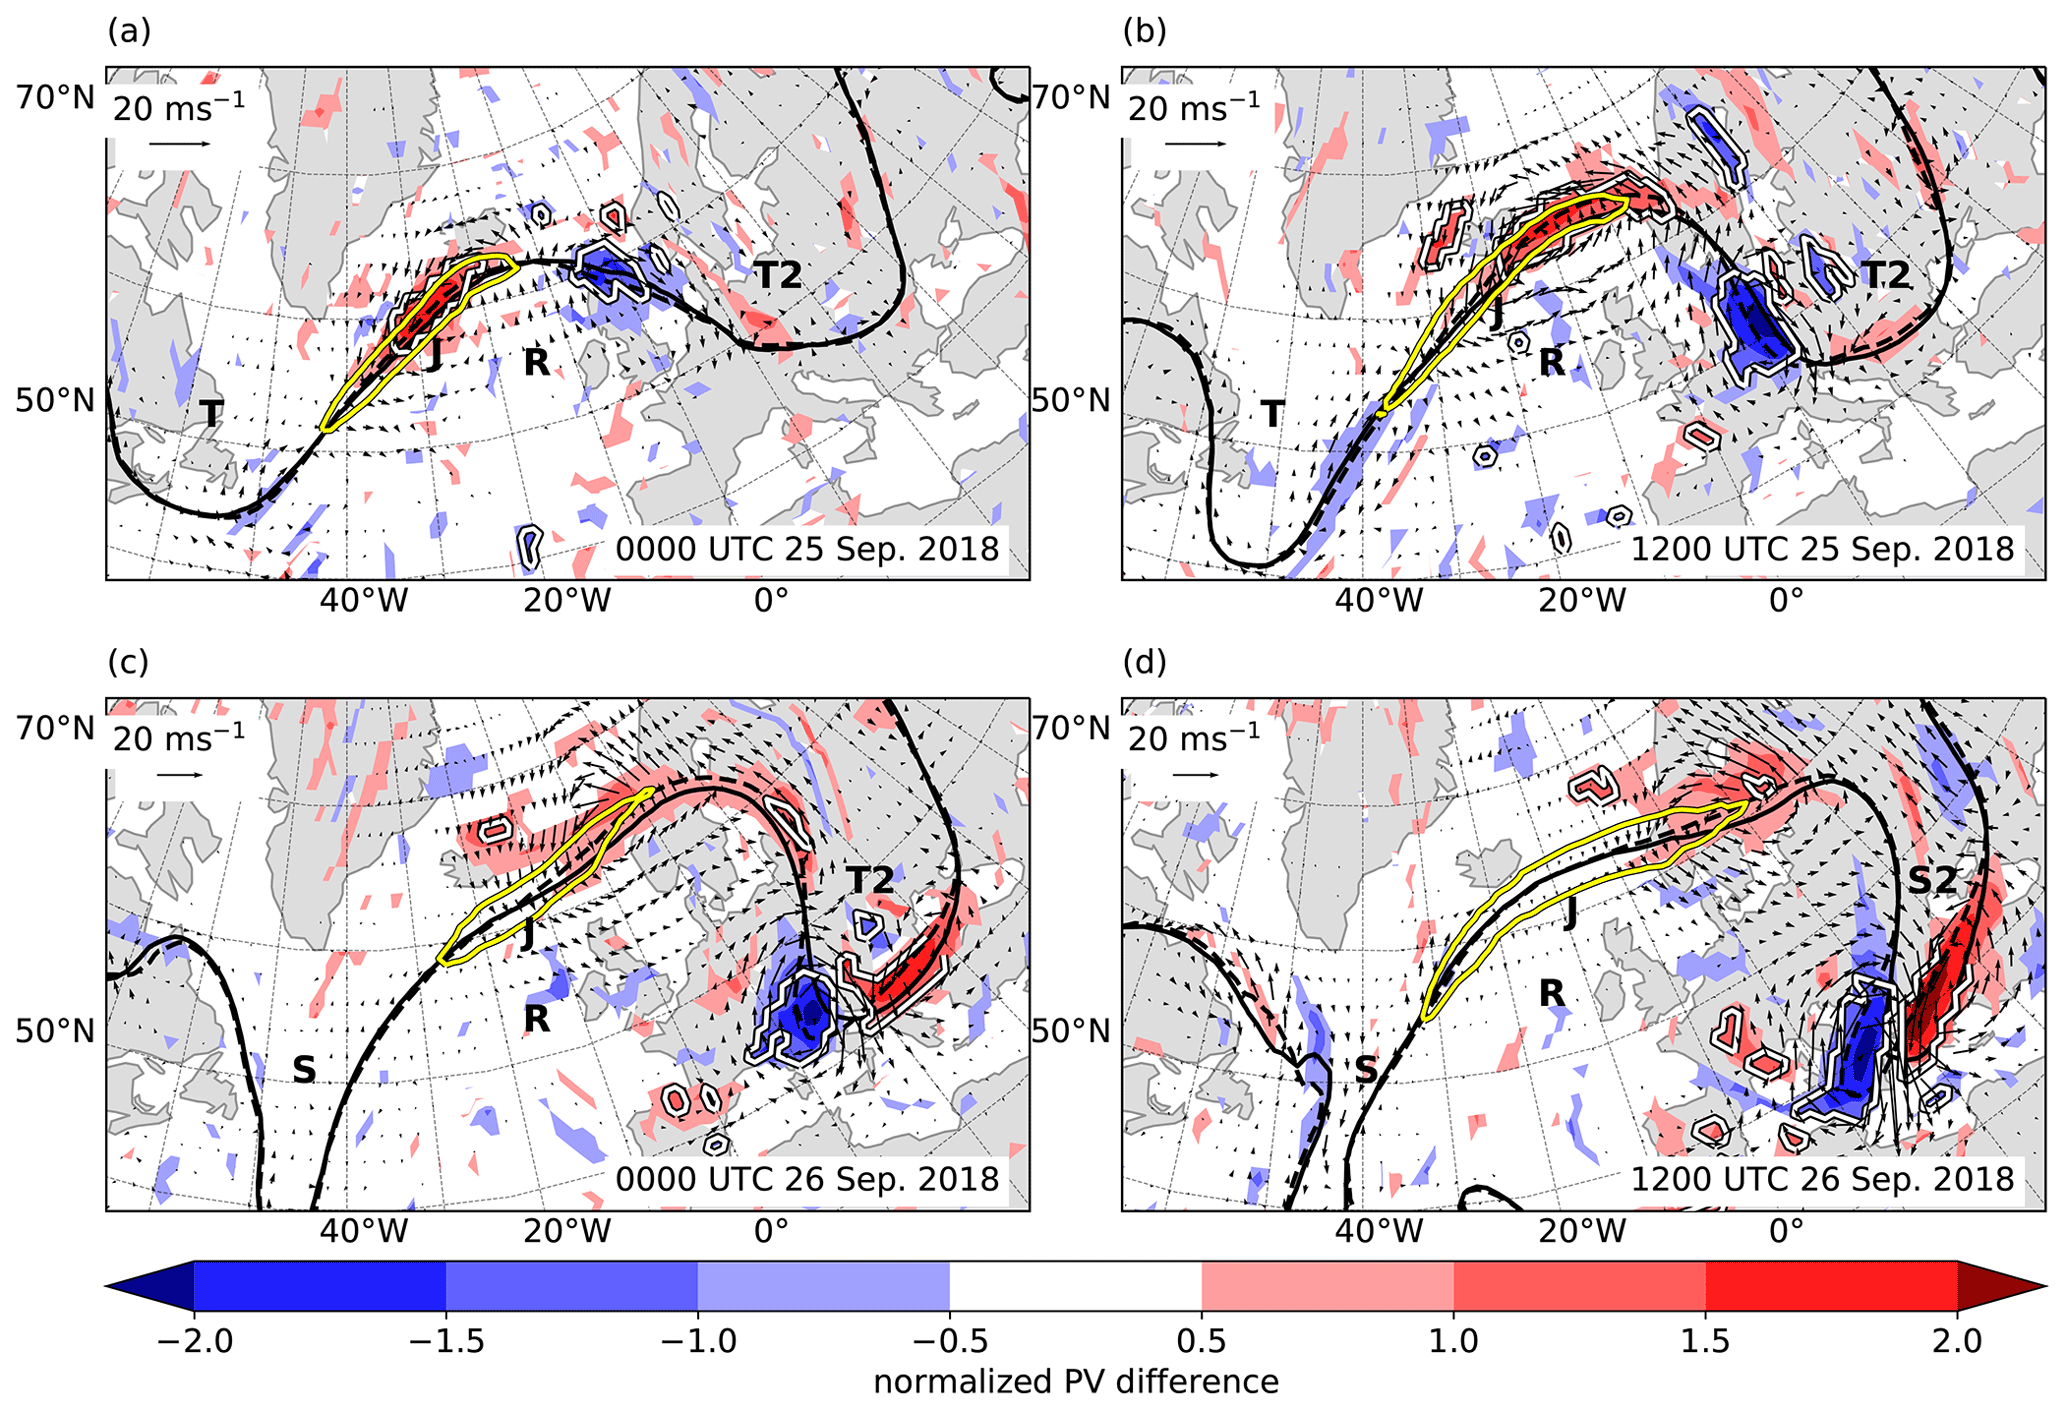
Figure 10As Fig. 9 but with difference winds (arrows, only if larger than 1 m s−1; reference vectors are in top left of panels), without 9 PVU contours and from 00:00 UTC 25 September to 12:00 UTC 26 September every 12 h.
After the emergence of the prominent positive ΔPVEW at 18:00 UTC on 24 September 2018, there is a clear downstream propagation as a short-wave perturbation along the wave guide into the Mediterranean (Fig. 10). First, the positive ΔPVEW is further amplified and a negative ΔPVEW emerges downstream over the North Sea (Fig. 10a). The deviation of the 2 PVU contours shows an increasingly clear short-wave pattern superimposed onto the large-scale Rossby wave pattern, which is particularly pronounced in cluster W (dashed contour). The positive ΔPVEW values are associated with cyclonic difference winds and the negative ones with anticyclonic difference winds, resulting in a westward phase speed of the ΔPVEW relative to the mean flow. During the propagation, the maximum amplitude of the ΔPVEW pattern increases and moves downstream, consistent with an eastward group speed. For example, at 00:00 UTC on 25 September 2018, the negative ΔPVEW has a smaller amplitude than the positive ΔPVEW (Fig. 10a), while 12 h later, the opposite is the case (Fig. 10b). Also, while the negative ΔPVEW becomes increasingly significant, the significance of the positive ΔPVEW decreases after 12:00 UTC on 25 September 2018. The downstream development of the ΔPVEW wave subsequently results in a more progressed anticyclonic Rossby wave breaking in cluster W compared to in cluster E (Fig. 10c, d). Ultimately, this leads to a zonally shifted tip of the narrow trough (T2 in Fig. 1c) and, later, of the PV streamer (S2 in Fig. 1d), as seen in Fig. 10d and consistent with Fig. 7.
Similar wave-like patterns of PV errors that emerge from a localized PV error and result in downstream development have been shown for example by Davies and Didone (2013) and Baumgart et al. (2018) for timescales of several days. Here such a pattern is shown for significant PV differences between ensemble clusters with a particularly fast propagation from 40∘ W to 20∘ E in less than 2 d. The initiation of the short-wave perturbation by a stratospheric PV anomaly is consistent with results of idealized studies looking at the effect of an isolated vortex approaching a strong isentropic PV gradient from the stratospheric side (e.g., Schwierz et al., 2004) and of a climatological analysis of precursor perturbations of Rossby wave initiation events (Röthlisberger et al., 2018, their Fig. 13). The strengthening of the jet streak in such a situation can also be understood as a steepening of the tropopause in this region (e.g., Winters and Martin, 2017). This situation is also reminiscent of the depiction by Davies and Didone (2013), in which a lower-stratospheric PV anomaly approaches the wave guide, initiates a wave train at the tropopause, and results in forecast error growth. In our case, this initiation occurs around 18:00 UTC on 24 September 2018, consistent with the substantial reduction in ensemble spread over the Mediterranean from the 00:00 UTC 24 September to the 00:00 UTC 25 September 2018 initializations (Fig. 5). This indicates that, once the short-wave perturbation was captured properly, the forecast uncertainties associated with the formation of the PV streamer were substantially reduced.
5.2 How the uncertain PV streamer position affects the cyclone's position and thermal structure
In the previous section the dynamical pathway leading to the uncertainty in the position of the PV streamer at day 3 of the ensemble forecast was analyzed. In the following, it is investigated how this uncertainty affects the position and thermal structure of the resulting Mediterranean cyclone.

Figure 11Cluster-mean PV at 325 K (shaded, in PVU); cluster-mean sea level pressure (purple contours, every 4 hPa); 2 PVU analysis contour at 325 K (black); cyclone positions (as identified with the method described in Sect. 2.3) in each ensemble member (black dots), and in the operational analysis (blue star) for clusters W, C, and E (a–c, d–f, and g–i) from 12:00 UTC 26 September to 12:00 UTC 28 September 2018 every 24 h. Insets at the top left of the panels show standard box plots (circles denote outliers) of minimum sea level pressure of the cyclones in each cluster and the value in the operational analysis (blue star); white numerals indicate the number of cyclones. Regions where the differences to cluster C of the PV field at 325 K are statistically significant on the αfdr=0.1 level are shown for clusters W and E as white contours (a–c, g–i; single isolated significant grid points are removed). The statistical significance for differences in sea level pressure are shown in Sect. S3 (Fig. S1).
First, the effect of the PV streamer position on the subsequent PV cutoff formation and surface cyclogenesis is discussed based on synoptic composites for the three clusters (Fig. 11). At 12:00 UTC on 26 September 2018, the position and shape of the PV streamer in cluster C is still very close to that of the analysis, whereas in cluster W the tip of the streamer is thinner and extends more to the west and in cluster E it is shifted to the east (Fig. 11a, d, g), consistent of course with the previous discussion of Fig. 10d. In these regions, clusters W and E significantly differ from cluster C (indicated by the white contours in Fig. 11a, g). This is not surprising as the clustering was specifically designed to focus on these differences. At the time of cyclogenesis in the analysis, 1 d later, a PV cutoff has formed in all clusters (Fig. 11b, e, h) and the differences in the scenarios over the Mediterranean are very prominent. While in cluster C the cutoff is located south of Italy in the central Mediterranean (in excellent agreement with the analysis), cluster W exhibits a much weaker cutoff further to the west over Tunisia and cluster E shows a stronger cutoff shifted to the east. In all clusters the developing surface cyclones are located slightly east of the cutoff (cyclone centers of individual ensemble members are shown by black dots). Hence, in cluster C the cyclones are located close to Benghazi (as in the analysis, indicated by the blue star), in cluster W too far west close to Tripoli, and in cluster E too far east over Crete. The PV cutoff in the analysis has decayed into smaller patches 1 d later (Fig. 11c, f, i). In cluster C, the cutoff has clearly weakened (PV values <3 PVU); in cluster W it has fully decayed; and in cluster E it is still very prominent and strong (PV values >6 PVU), indicating substantial differences in the diabatic modification of the PV cutoff. In cluster W, the absence of clear structures at 12:00 UTC on 28 September 2018 in both upper-level PV and SLP is partially due to the large variability within this cluster at this time. Note again that the cyclone positions in cluster C agree well with the analysis, whereas cyclones in the other clusters have typical position errors of about 400 km.
The surface cyclones in cluster E show a very different behavior than in clusters W and C. First, cyclogenesis occurs earlier and takes place in a pre-existing low-pressure area over the Levantine Sea (Fig. 11g). At 12:00 UTC on 26 September 2018, 9 out of 18 members in this cluster have a cyclone identified in the Levantine Sea close to Cyprus, whereas in clusters W and C most cyclones form later in the southern part of the central Mediterranean Sea, in immediate proximity to the PV cutoff. Second, cyclones in cluster E are on average much weaker than in clusters W and C (see box plots in the individual panels of Fig. 11). The pre-existing cyclones over the Levantine Sea deepen slightly when they interact with the PV cutoff but – with the exception of two cases – weaken again afterwards. It can be concluded that the eastward shift of the PV streamer (cluster E) leads to a particularly strong nonlinear response of the cyclogenesis process and the intensity evolution of the surface cyclone. The westward shift (cluster W) also results in weaker surface cyclones than in cluster C and in the analysis, some with very short lifetimes. Hence, the uncertain surface cyclone positions at the time of cyclogenesis and after 1 d of intensification (i.e. after 84 and 106 h lead time of the forecast; see Fig. 6) can be clearly attributed to the uncertain PV streamer position and the cluster with the best representation of the PV streamer position (cluster C) results in the best forecast of the cyclone position and intensity. This is also supported by Fig. 6, now referring to the colors. They indicate the cluster to which each cyclone belongs, in full agreement with the aforementioned conclusion.

Figure 12(a, b) Diagram of low-level θe vs. upper-level PV for all ensemble members with a cyclone and for the operational analysis at (a) 12:00 UTC 27 September 2018 and (b) 12:00 UTC 28 September 2018; markers and times are as in Fig. 6. (c) Average precipitation intensity within a 250 km radius around the cyclone center between 12:00 UTC 27 September and 12:00 UTC 28 September 2018 for all cyclones present during the full 24 h period as individual data points (colored markers) and standard box plots (black). The observation (OBS) is based on TRMM rainfall data along the track in the operational analysis.
Interestingly, cluster E also results in the lowest fraction of medicanes (i.e. cyclones with a deep warm core, 2 out of 18 members; see also Fig. 6), followed by cluster W (6 out of 19 members) and cluster C (15 out of 19 members). Hence, uncertainties in the cyclone's position are also tightly linked to uncertainties in its thermal structure. Because this link is not straightforward, the final part of this section sketches a potential pathway of how the uncertainties in the positions of the PV streamer and cyclogenesis affect the cyclone's thermal structure. This analysis will not be complete because, as uncertainties reach the mesoscale, we approach the limits of the dataset and methods used in this study. Nonetheless, key elements of this link can be identified by focusing on mesoscale differences at upper and lower levels between cyclones in the three clusters during the 24 h period after cyclogenesis in the operational analysis. As shown in Fig. 11f and i, in both clusters C and E, the upper-level PV cutoff and the surface cyclone are vertically aligned at 12:00 UTC on 28 September 2018; i.e. they have an equivalent barotropic structure. Despite this similarity, the vertical thermal structure of the vortices strongly differs between the clusters. As diagnosed by the CPS, most cyclones in cluster E have an upper-level cold core, whereas most cyclones in cluster C have an upper-level warm core. In essence, this means that the stratospheric PV anomaly in cluster C is eroded (as in the operational analysis; see Sect. 3), while it remains strong in cluster E (consistent with Fig. 11f, i). In the operational analysis, the erosion of the stratospheric PV anomaly was linked to low-level air masses with high θe values near the cyclone center. Here, we investigate the hypothesis that the differences in the modification of the stratospheric PV anomaly in cluster C and E, and thereby the differences in the vertical thermal structure of the cyclones, are linked to differences in low-level θe values. To this aim, θe between 850 and 950 hPa is averaged within a 250 km radius around the cyclone center (as shown for the analysis in Fig. 2e), to quantify low-level θe values for each cyclone. Then, the 50 % grid points with the highest PV values at 325 K within a radius of 750 km around the cyclone center are averaged to quantify the amplitude of the upper-level PV anomaly. The larger radius is chosen because the highest values of upper-level PV are usually expected west of the cyclogenesis area. Each cyclone can now be positioned in a diagram of low-level θe vs. upper-level PV (Fig. 12a, b). At the cyclogenesis time in the operational analysis, cluster C (blue) and W (green) are positioned at moderate upper-level PV values around 2–3 PVU and high low-level θe values between 320 and 330 K (Fig. 12a). Cluster W (red) cyclones tend to have slightly lower upper-level PV and low-level θe values than cluster C cyclones. The operational analysis (black marker) is positioned fairly well within cluster C, albeit with relatively high upper-level PV. Cluster E cyclones exhibit higher upper-level PV values around 3–5 PVU and much lower low-level θe values around 310–315 K. These values are most likely lower because cyclogenesis occurred closer to the northern coast of the Mediterranean, and as a result, the low-level air parcels were less exposed to the sea surface and therefore less strongly moistened by latent heat fluxes compared to the operational analysis (for a discussion of the Lagrangian history of the low-level air parcels at cyclogenesis in the operational analysis, see Sect. S1 and Figs. S1, S2, and S3). Within the subsequent 24 h period of initial intensification and deep-warm-core formation in the operational analysis, cyclones in cluster C and W are associated with substantial precipitation in their centers (Fig. 12c) and a reduction in upper-level PV by about 1 PVU and of low-level θe by about 3–5 K (Fig. 12b), similar to the operational analysis. This behavior is consistent with the necessity of low-level air with high θe values for strong latent heating, cross-isentropic upward transport, and the resulting erosion of the upper-level PV anomaly as observed in the operational analysis (see Sect. 3). Cyclones in cluster E experience an increase in low-level θe and, most importantly, little change in upper-level PV. The slight increase in upper-level PV values in some members might be related to the vertical alignment of the upper-level PV anomaly and the surface cyclone, such that a larger fraction of the upper-level PV anomaly is located within the 750 km radius around the cyclone. Precipitation in the cyclone center is much reduced for the cyclones in cluster E compared to those in clusters C and W and the operational analysis, indicative of a reduction in column-integrated latent heating.
In summary, the results of this analysis are consistent with the following evolution of the forecast uncertainties: in some members, the eastward displacement of the PV streamer position resulted in a strongly northeastward-shifted cyclogenesis position, leading to a reduced supply of low-level air with high θe in the cyclogenesis region. This resulted in weaker and shallower latent heating and no diabatic PV destruction on the 325 K level. Hence, the PV anomaly was not eroded and no upper-level warm core could form. There are a few ensemble members that deviate from this archetype, mostly the ones where the PV streamer position is on the borders between the clusters.
The basis of this study was an ECWMF operational ensemble forecast, which, after 3 d, showed large uncertainties in the position of a PV streamer over the Mediterranean and the subsequent development of Medicane Zorbas in September 2018. These uncertainties were substantially smaller for later forecast initializations, supporting the use of this forecast to gain insight into the dynamics behind this rapid decrease in forecast uncertainty. The ensemble members were clustered into three distinct scenarios according to the position of the PV streamer at day 3 of the forecast. The differences between these scenarios were used to assess how uncertainties originating in a short-wave perturbation in the North Atlantic wave guide influenced a downstream PV streamer and, as a result, the position and thermal structure of the Mediterranean cyclone.
Significant PV differences between clusters first appeared after 18 h of forecast time on the stratospheric side of a strengthening jet streak over the North Atlantic. They were tightly connected to the initiation of a short-wave perturbation superimposed onto the large-scale Rossby wave pattern. This initiation and the strengthening of the jet streak were likely linked to a stratospheric high-PV filament approaching the tropopause region. A significant contribution of WCBs to the emergence of these significant differences between ensemble clusters could be excluded. To some extent, these differences could be traced back to differences in the initial conditions on the stratospheric side of the upper-level jet streak over the Gulf of Saint Lawrence. Subsequently, the differences were further amplified and propagated along the wave guide across the Atlantic into the Mediterranean, where large-scale anticyclonic Rossby wave breaking occurred and triggered the formation of Zorbas. The propagation and amplification of the upstream PV differences resulted in substantial differences in the position of the PV streamer between the three clusters.
The shift in the position of the PV streamer resulted in a shift of cyclogenesis that affected cyclone intensity and the diabatic modification of the upper-level PV anomaly. Ensemble members with the central (i.e. correct) PV streamer position produced cyclones most similar to the operational analysis, while the westward shift of the PV streamer resulted in slightly weaker cyclones too far to the west. In both cases, the upper-level PV anomaly was eroded. The eastward shift of the PV streamer led to a particularly different evolution. In this scenario, the cyclones formed too far northeast and more than 12 h earlier from a pre-existing surface trough in the Levantine Sea. The cyclones remained much weaker and the upper-level PV anomaly much stronger than in the operational analysis and most other ensemble members. The nonlinear response of the eastward shift of the PV streamer is particularly interesting as a comprehensive analysis of the predictability of PV streamers over the North Atlantic and the Mediterranean in the ECWMF ensemble forecasts showed that there is a tendency for eastward displacement in the forecasts compared to the analysis (Wiegand and Knippertz, 2014).
The central PV streamer position provided the best synoptic conditions for the formation of a strong medicane, while the eastward shift resulted in conditions that were most unfavorable for medicane formation. The reason for this was that the eastward-shifted cyclogenesis resulted in significantly reduced low-level equivalent potential temperatures in the cyclogenesis region. This prevented latent heating from being strong enough and reaching high enough to erode the upper-level PV anomaly and form an upper-level warm core.
These results extend our understanding of the role of upstream uncertainties in the formation of Mediterranean cyclones in general and of medicanes in particular. It also provides new insight into the dynamics behind forecast jumps as identified by Di Muzio et al. (2019). Previous studies investigating medium-range predictability of Mediterranean cyclones have mainly focused on the role of upstream uncertainties related to extratropical transition over the North Atlantic and the associated strong diabatic outflow (e.g., Pantillon et al., 2013). This study showed that the uncertainties limiting the predictability of Medicane Zorbas a few days in advance were linked to a short-wave perturbation superimposed onto the large-scale Rossby wave pattern that was initiated in a jet streak over the North Atlantic. Further research is needed to quantify how frequently this mechanism limits the medium-range predictability of Mediterranean PV streamers and, as a result, Mediterranean cyclogenesis.
Building on studies that document the relevance of upper-level PV anomalies for medicane development (e.g., Miglietta et al., 2017), this study also provides the first analysis of the relevance of a PV streamer position for medicane formation and supports the hypothesis that certain regions are more conducive to medicane development than others (Di Muzio et al., 2019). In this case, only members with cyclogenesis in a relatively confined region at the Libyan coast developed a medicane. However, once the uncertainties reach the mesoscale, other factors that were not analyzed in this study can play an important role, such as vertical wind shear and midtropospheric humidity (Tous and Romero, 2013) or the details of the convective processes. In a subsequent study we plan to investigate how these factors limit the predictability of Zorbas' life cycle after cyclogenesis has occurred.
Finally, we note that this study is based on one particular ensemble initialization time when the occurrence of Rossby wave breaking and cyclone formation was already certain (but the exact zonal position of the resulting PV streamer was not). Later initializations are characterized by much lower positional uncertainties in the PV streamer and, hence, a strongly reduced ensemble spread of 500 hPa geopotential height (as shown in Fig. 5). In contrast, earlier initializations have an even larger ensemble spread with high values extending from the Mediterranean to eastern Europe (not shown), indicating uncertainty in the onset of Rossby wave breaking and the overall orientation of the PV streamer. This implies that the uncertainty patterns discussed in this study are not representative of earlier initializations of the ensemble. While in this study the ensemble forecast was used to investigate uncertainties in the PV streamer position and the evolution of the Mediterranean cyclone, similar studies with forecasts initialized earlier could shed light on processes that determine uncertainties in the onset of the wave breaking. However, they would then be less suitable for investigating uncertainties in the formation of the medicane.
All data are available from the authors upon request
The supplement related to this article is available online at: https://doi.org/10.5194/wcd-1-597-2020-supplement.
JJGA sparked this work by discovering the uncertain forecast of Zorbas. RP and JJGA designed the basic idea for the study. JJGA carried out the analyses that required the computation of the CPS, and RP carried out all remaining analyses. MS and HW helped with the data access and handling and gave important guidance and useful inputs during the whole project. HW provided important guidance and support during the review process. RP and JJGA prepared the manuscript, and all authors gave critical feedback that helped to improve the article.
The authors declare that they have no conflict of interest.
We thank the reviewer Ron McTaggart-Cowan and the two anonymous reviewers for their detailed feedback that helped to improve the manuscript. We thank Andries de Vries (ETH Zurich) for providing support with the TRMM data and assessing the extremeness of precipitation. Raphael Portmann thanks Emmanouil Flaounas (ETH Zurich) for insightful discussions about medicanes.
This paper was edited by Michael Riemer and reviewed by Ron McTaggart-Cowan and two anonymous referees.
This research has been supported by ETH Zurich (grant no. ETH-0716-2) and by the Spanish Ministry of Science, Innovation, and Universities, co-funded by the European Regional Development Fund (grant nos. BES-2014-067905, EEBB-I-18-12841, FJC2018-035821-I, and CGL2017-89583-R).
Appenzeller, C. and Davies, H. C.: Structure of stratospheric intrusions into the troposphere, Nature, 358, 570–572, https://doi.org/10.1038/358570a0, 1992. a
Archambault, H. M., Bosart, L. F., Keyser, D., and Cordeira, J. M.: A climatological analysis of the extratropical flow response to recurving western North Pacific tropical cyclones, Mon. Weather Rev., 141, 2325–2346, https://doi.org/10.1175/MWR-D-12-00257.1, 2013. a
Argence, S., Lambert, D., Richard, E., Chaboureau, J.-P., and Soehne, N.: Impact of initial condition uncertainties on the predictability of heavy rainfall in the Mediterranean: a case study, Q. J. Roy. Meteor. Soc., 134, 1775–1788, https://doi.org/10.1002/qj.314, 2008. a
Baumgart, M., Riemer, M., Wirth, V., Teubler, F., and Lang, S. T. K.: Potential vorticity dynamics of forecast errors: A quantitative case study, Mon. Weather Rev., 146, 1405–1425, https://doi.org/10.1175/MWR-D-17-0196.1, 2018. a
Browning, K.: Organization of clouds and precipitation in extratropical cyclones, in: Extratropical cyclones: The Erik Palmen memorial volume, edited by Newton, C. W. and Holopainen, E. O., 129–153, American Meteorological Society, Boston, MA, https://doi.org/10.1007/978-1-944970-33-8_8, 1990. a
Cavicchia, L., von Storch, H., and Gualdi, S.: A long-term climatology of medicanes, Clim. Dynam., 43, 1183–1195, https://doi.org/10.1007/s00382-013-1893-7, 2014. a
Chaboureau, J.-P., Pantillon, F., Lambert, D., Richard, E., and Claud, C.: Tropical transition of a Mediterranean storm by jet crossing, Q. J. Roy. Meteor. Soc., 138, 596–611, https://doi.org/10.1002/qj.960, 2012. a, b
Clark, E., Wood, K. M., Aberson, S. D., Archambault, H. M., Milrad, S. M., Bosart, L. F., Corbosiero, K. L., Davis, C. A., Dias Pinto, J. R., Doyle, J., Fogarty, C., Galarneau, Thomas J., J., Grams, C. M., Griffin, K. S., Gyakum, J., Hart, R. E., Kitabatake, N., Lentink, H. S., McTaggart-Cowan, R., Perrie, W., Quinting, J. F. D., Reynolds, C. A., Riemer, M., Ritchie, E. A., Sun, Y., and Zhang, F.: The extratropical transition of tropical cyclones. Part I: Cyclone evolution and direct impacts, Mon. Weather Rev., 145, 4317–4344, https://doi.org/10.1175/MWR-D-17-0027.1, 2017. a
Davies, H. C. and Didone, M.: Diagnosis and dynamics of forecast error growth, Mon. Weather Rev., 141, 2483–2501, https://doi.org/10.1175/MWR-D-12-00242.1, 2013. a, b
Davis, C. A. and Bosart, L. F.: Baroclinically induced tropical cyclogenesis, Mon. Weather Rev., 131, 2730–2747, https://doi.org/10.1175/1520-0493(2003)131<2730:BITC>2.0.CO;2, 2003. a
Davis, C. A. and Bosart, L. F.: The TT problem: Forecasting the tropical transition of cyclones, B. Am. Meteorol. Soc., 85, 1657–1662, https://doi.org/10.1175/BAMS-85-11-1657, 2004. a, b
Di Muzio, E., Riemer, M., Fink, A., and Maier-Gerber, M.: Assessing the predictability of medicanes in ECMWF ensemble forecasts using an object-based approach, Q. J. Roy. Meteor. Soc., 145, 1202–1217, https://doi.org/10.1002/qj.3489, 2019. a, b, c, d
ECMWF: Tech. rep., available at: https://www.ecmwf.int/en/publications/ifs-documentation (last access: 28 April 2020), 2018. a, b
ECMWF: Severe event catalogue: Zorbas, available at: https://confluence.ecmwf.int/display/FCST/201809+-+Rainfall+-+Zorbas (last access: 28 April 2020), 2019. a
Emanuel, K.: Genesis and maintenance of “Mediterranean hurricanes”, Adv. Geosci., 2, 217–220, https://doi.org/10.5194/adgeo-2-217-2005, 2005. a, b
Fehlmann, R. and Davies, H.: Misforecasts of synoptic systems: Diagnosis via PV retrodiction, Mon. Weather Rev., 125, 2247–2264, https://doi.org/10.1175/1520-0493(1997)125<2247:MOSSDV>2.0.CO;2, 1997. a
Fehlmann, R. and Quadri, C.: Predictability issues of heavy Alpine south-side precipitation, Meteorol. Atmos. Phys., 72, 223–231, https://doi.org/10.1007/s007030050017, 2000. a
Fita, L. and Flaounas, E.: Medicanes as subtropical cyclones: the December 2005 case from the perspective of surface pressure tendency diagnostics and atmospheric water budget, Q. J. Roy. Meteor. Soc., 144, 1028–1044, https://doi.org/10.1002/qj.3273, 2018. a
Fita, L., Romero, R., and Ramis, C.: Intercomparison of intense cyclogenesis events over the Mediterranean basin based on baroclinic and diabatic influences, Adv. Geosci., 7, 333–342, https://doi.org/10.5194/adgeo-7-333-2006, 2006. a
Flaounas, E., Raveh-Rubin, S., Wernli, H., Drobinski, P., and Bastin, S.: The dynamical structure of intense Mediterranean cyclones, Clim. Dynam., 44, 2411–2427, https://doi.org/10.1007/s00382-014-2330-2, 2015. a, b
Floodlist: http://floodlist.com/europe/greece-medicane-zorba-september-2018, last access: 11 September 2020. a, b
Gaertner, M. A., Jesus Gonzalez-Aleman, J., Romera, R., Dominguez, M., Gil, V., Sanchez, E., Gallardo, C., Marcello Miglietta, M., Walsh, K. J. E., Sein, D. V., Somot, S., Dell'Aquila, A., Teichmann, C., Ahrens, B., Buonomo, E., Colette, A., Bastin, S., van Meijgaard, E., and Nikulin, G.: Simulation of medicanes over the Mediterranean Sea in a regional climate model ensemble: impact of ocean-atmosphere coupling and increased resolution, Clim. Dynam., 51, 1041–1057, https://doi.org/10.1007/s00382-016-3456-1, 2018. a, b
Gonzalez-Aleman, J. J., Evans, J. L., and Kowaleski, A. M.: Use of ensemble forecasts to investigate synoptic influences on the structural evolution and predictability of Hurricane Alex (2016) in the midlatitudes, Mon. Weather Rev., 146, 3143–3162, https://doi.org/10.1175/MWR-D-18-0015.1, 2018. a
Grams, C. M. and Archambault, H. M.: The key role of diabatic outflow in amplifying the midlatitude flow: A representative case study of weather systems surrounding western North Pacific extratropical transition, Mon. Weather Rev., 144, 3847–3869, https://doi.org/10.1175/MWR-D-15-0419.1, 2016. a
Grams, C. M. and Blumer, S. R.: European high-impact weather caused by the downstream response to the extratropical transition of North Atlantic Hurricane Katia (2011), Geophys. Res. Lett., 42, 8738–8748, https://doi.org/10.1002/2015GL066253, 2015. a
Grams, C. M., Wernli, H., Boettcher, M., Campa, J., Corsmeier, U., Jones, S. C., Keller, J. H., Lenz, C.-J., and Wiegand, L.: The key role of diabatic processes in modifying the upper-tropospheric wave guide: a North Atlantic case-study, Q. J. Roy. Meteor. Soc., 137, 2174–2193, https://doi.org/10.1002/qj.891, 2011. a, b
Grams, C. M., Magnusson, L., and Madonna, E.: An atmospheric dynamics perspective on the amplification and propagation of forecast error in numerical weather prediction models: A case study, Q. J. Roy. Meteor. Soc., 144, 2577–2591, https://doi.org/10.1002/qj.3353, 2018. a
Hart, R.: A cyclone phase space derived from thermal wind and thermal asymmetry, Mon. Weather Rev., 131, 585–616, https://doi.org/10.1175/1520-0493(2003)131<0585:ACPSDF>2.0.CO;2, 2003. a
Holton, J. R.: An introduction to dynamic meteorology, International geophysics series, vol. 88, Elsevier Academic Press, Amsterdam, 4th edn., 2004. a
Homar, V. and Stensrud, D.: Sensitivities of an intense Mediterranean cyclone: Analysis and validation, Q. J. Roy. Meteor. Soc., 130, 2519–2540, https://doi.org/10.1256/qj.03.85, 2004. a
Jansa, A., Genoves, A., Picornell, M. A., Campins, J., Riosalido, R., and Carretero, O.: Western Mediterranean cyclones and heavy rain. Part 2: Statistical approach, Meteorol. Appl., 8, 43–56, https://doi.org/10.1017/S1350482701001049, 2001. a
Keller, J. H., Grams, C. M., Riemer, M., Archambault, H. M., Bosart, L., Doyle, J. D., Evans, J. L., Galarneau, Thomas J., J., Griffin, K., Harr, P. A., Kitabatake, N., McTaggart-Cowan, R., Pantillon, F., Quinting, J. F., Reynolds, C. A., Ritchie, E. A., Torn, R. D., and Zhang, F.: The extratropical transition of tropical cyclones. Part II: Interaction with the midlatitude flow, downstream impacts, and implications for predictability, Mon. Weather Rev., 147, 1077–1106, https://doi.org/10.1175/MWR-D-17-0329.1, 2019. a
Madonna, E., Wernli, H., Joos, H., and Martius, O.: Warm conveyor belts in the ERA-Interim dataset (1979–2010). Part I: Climatology and potential vorticity evolution, J. Clim., 27, 3–26, https://doi.org/10.1175/JCLI-D-12-00720.1, 2014. a, b
Maier-Gerber, M., Riemer, M., Fink, A. H., Knippertz, P., Di Muzio, E., and McTaggart-Cowan, R.: Tropical transition of Hurricane Chris (2012) over the North Atlantic ocean: A multiscale investigation of predictability, Mon. Weather Rev., 147, 951–970, https://doi.org/10.1175/MWR-D-18-0188.1, 2019. a, b
Massacand, A., Wernli, H., and Davies, H.: Influence of upstream diabatic heating upon an Alpine event of heavy precipitation, Mon. Weather Rev., 129, 2822–2828, https://doi.org/10.1175/1520-0493(2001)129<2822:IOUDHU>2.0.CO;2, 2001. a
McTaggart-Cowan, R., Davies, E. L., Fairman, J. G., Galarneau, T. J., and Schultz, D. M.: Revisiting the 26.5 °C sea surface temperature threshold for tropical cyclone development, B. Am. Meteorol. Soc., 96, 1929–1943, https://doi.org/10.1175/BAMS-D-13-00254.1, 2015. a
Miglietta, M. M. and Rotunno, R.: Development mechanisms for Mediterranean tropical-like cyclones (medicanes), Q. J. Roy. Meteor. Soc., 145, 1444–1460, https://doi.org/10.1002/qj.3503, 2019. a
Miglietta, M. M., Laviola, S., Malvaldi, A., Conte, D., Levizzani, V., and Price, C.: Analysis of tropical-like cyclones over the Mediterranean Sea through a combined modeling and satellite approach, Geophys. Res. Lett., 40, 2400–2405, https://doi.org/10.1002/grl.50432, 2013. a
Miglietta, M. M., Cerrai, D., Laviola, S., Cattani, E., and Levizzani, V.: Potential vorticity patterns in Mediterranean “hurricanes”, Geophys. Res. Lett., 44, 2537–2545, https://doi.org/10.1002/2017GL072670, 2017. a, b, c
Pantillon, F., Chaboureau, J.-P., and Richard, E.: Remote impact of North Atlantic hurricanes on the Mediterranean during episodes of intense rainfall in autumn 2012, Q. J. Roy. Meteor. Soc., 141, 967–978, https://doi.org/10.1002/qj.2419, 2015. a, b
Pantillon, F., Chaboureau, J.-P., Mascart, P. J., and Lac, C.: Predictability of a Mediterranean tropical-like storm downstream of the extratropical transition of Hurricane Helene (2006), Mon. Weather Rev., 141, 1943–1962, https://doi.org/10.1175/MWR-D-12-00164.1, 2013. a, b, c, d, e, f
Pantillon, F., Chaboureau, J.-P., and Richard, E.: Vortex-vortex interaction between Hurricane Nadine (2012) and an Atlantic cut-off dropping the predictability over the Mediterranean, Q. J. Roy. Meteor. Soc., 142, 419–432, https://doi.org/10.1002/qj.2635, 2016. a
Pfahl, S. and Wernli, H.: Quantifying the relevance of cyclones for precipitation extremes, J. Climate, 25, 6770–6780, https://doi.org/10.1175/JCLI-D-11-00705.1, 2012. a
Picornell, M., Jansa, A., Genoves, A., and Campins, J.: Automated database of mesocyclones from the HIRLAM(INM)-0.5 degrees analyses in the western Mediterranean, Int. J. Climatol., 21, 335–354, https://doi.org/10.1002/joc.621, 2001. a
Picornell, M. A., Campins, J., and Jansà, A.: Detection and thermal description of medicanes from numerical simulation, Nat. Hazards Earth Syst. Sci., 14, 1059–1070, https://doi.org/10.5194/nhess-14-1059-2014, 2014. a
Portmann, R., Crezee, B., Quinting, J., and Wernli, H.: The complex life-cycles of two long-lived potential vorticity cutoffs over Europe, Q. J. Roy. Meteor. Soc., 144, 701–719, https://doi.org/10.1002/qj.3239, 2018. a
Quandt, L.-A., Keller, J. H., Martius, O., and Jones, S. C.: Forecast variability of the blocking system over Russia in summer 2010 and its impact on curface conditions, Wea. Forecasting, 32, 61–82, https://doi.org/10.1175/WAF-D-16-0065.1, 2017. a
Quinting, J. F. and Jones, S. C.: On the impact of tropical cyclones on Rossby wave packets: A climatological perspective, Mon. Weather Rev., 144, 2021–2048, https://doi.org/10.1175/MWR-D-14-00298.1, 2016. a
Raveh-Rubin, S. and Flaounas, E.: A dynamical link between deep Atlantic extratropical cyclones and intense Mediterranean cyclones, Atmos. Sci. Lett., 18, 215–221, https://doi.org/10.1002/asl.745, 2017. a, b, c
Raveh-Rubin, S. and Wernli, H.: Large-scale wind and precipitation extremes in the Mediterranean: a climatological analysis for 1979–2012, Q. J. Roy. Meteor. Soc., 141, 2404–2417, https://doi.org/10.1002/qj.2531, 2015. a
Riemer, M., Jones, S. C., and Davis, C. A.: The impact of extratropical transition on the downstream flow: An idealized modelling study with a straight jet, Q. J. Roy. Meteor. Soc., 134, 69–91, https://doi.org/10.1002/qj.189, 2008. a
Romero, R.: Sensitivity of a heavy-rain-producing western Mediterranean cyclone to embedded potential-vorticity anomalies, Q. J. Roy. Meteor. Soc., 127, 2559–2597, https://doi.org/10.1002/qj.49712757805, 2001. a
Röthlisberger, M., Martius, O., and Wernli, H.: Northern Hemisphere Rossby wave initiation events on the extratropical Jet—A climatological analysis, J. Climate, 31, 743–760, https://doi.org/10.1175/JCLI-D-17-0346.1, 2018. a
Schwierz, C., Dirren, S., and Davies, H.: Forced waves on a zonally aligned jet stream, J. Atmos. Sci., 61, 73–87, https://doi.org/10.1175/1520-0469(2004)061<0073:FWOAZA>2.0.CO;2, 2004. a
Severe-weather: available at: https://www.severe-weather.eu/event-analysis/medicane-aftermath-in-greece-and-turkey-severe-winds-torrential-rainfall-major-flooding-and-tornadoes/, last access: 11 September 2020. a
Sinclair, M.: Objective identification of cyclones and their circulation intensity, and climatology, Wea. Forecasting, 12, 595–612, https://doi.org/10.1175/1520-0434(1997)012<0595:OIOCAT>2.0.CO;2, 1997. a
Sprenger, M. and Wernli, H.: The LAGRANTO Lagrangian analysis tool – version 2.0, Geosci. Model Dev., 8, 2569–2586, https://doi.org/10.5194/gmd-8-2569-2015, 2015. a
Tafferner, A.: Lee cyclogenesis resulting from the combined outbreak of cold air and potential vorticity against the Alps, Meteorol. Atmos. Phys., 43, 31–47, https://doi.org/10.1007/BF01028107, 1990. a
Torn, R. D.: Diagnosis of the downstream ridging associated with extratropical transition using short-term ensemble forecasts, J. Atmos. Sci., 67, 817–833, https://doi.org/10.1175/2009JAS3093.1, 2010. a
Torn, R. D., Whitaker, J. S., Pegion, P., Hamill, T. M., and Hakim, G. J.: Diagnosis of the source of GFS medium-range track errors in Hurricane Sandy (2012), Mon. Weather Rev., 143, 132–152, https://doi.org/10.1175/MWR-D-14-00086.1, 2015. a, b
Tous, M. and Romero, R.: Meteorological environments associated with medicane development, Int. J. Climatol., 33, 1–14, https://doi.org/10.1002/joc.3428, 2013. a, b, c
Wernli, H. and Davies, H. C.: A Lagrangian-based analysis of extratropical cyclones.1. The method and some applications, Q. J. Roy. Meteor. Soc., 123, 467–489, https://doi.org/10.1256/smsqj.53810, 1997. a
Wernli, H. and Sprenger, M.: Identification and ERA-15 climatology of potential vorticity streamers and cutoffs near the extratropical tropopause, J. Atmos. Sci., 64, 1569–1586, https://doi.org/10.1175/JAS3912.1, 2007. a
Wiegand, L. and Knippertz, P.: Equatorward breaking Rossby waves over the North Atlantic and Mediterranean region in the ECMWF operational ensemble prediction system, Q. J. Roy. Meteor. Soc., 140, 58–71, https://doi.org/10.1002/qj.2112, 2014. a, b
Wilks, D. S.: Statistical Methods in the Atmospheric Sciences, vol. 100, Academic Press, 3 edn., Oxford, Waltham, MA, 2011. a
Wilks, D. S.: “The stippling shows statistically significant grid points”: How research results are routinely overstated and overinterpreted, and what to do about it, B. Am. Meteorol. Soc., 97, 2263–2273, https://doi.org/10.1175/BAMS-D-15-00267.1, 2016. a, b
Winters, A. C. and Martin, J. E.: Diagnosis of a North American Polar–Subtropical Jet Superposition Employing Piecewise Potential Vorticity Inversion, Mon. Weather Rev., 145, 1853–1873, https://doi.org/10.1175/MWR-D-16-0262.1, 2017. a
Wirth, V.: Diabatic heating in an axisymmetrical cutoff cyclone and related stratosphere-troposphere exchange, Q. J. Roy. Meteor. Soc., 121, 127–147, https://doi.org/10.1002/qj.49712152107, 1995. a
- Abstract
- Introduction
- Data and methods
- Synoptic overview
- ECMWF ensemble forecasts
- Propagation of forecast uncertainties along the North Atlantic wave guide to the Mediterranean cyclone
- Summary and conclusions
- Data availability
- Author contributions
- Competing interests
- Acknowledgements
- Review statement
- Financial support
- References
- Supplement