the Creative Commons Attribution 4.0 License.
the Creative Commons Attribution 4.0 License.
 | 03 Dec 2020
Increasing frequency in off-season tropical cyclones and its relation to climate variability and change
José J. Hernández Ayala
Rafael Méndez-Tejeda
This article analyzes the relationship between off-season tropical cyclone (TC) frequency and climate variability and change for the Pacific Ocean and Atlantic Ocean basins. TC track data were used to extract the off-season storms for the 1900–2019 period. TC counts were aggregated by decade, and the number of storms for the first 6 decades (presatellite era) was adjusted. Mann–Kendall nonparametric tests were used to identify trends in decadal TC counts and multiple linear regression (MLR) models were used to test if climatic variability or climate change factors explained the trends in off-season storms. MLR stepwise procedures were implemented to identify the climate variability and change factors that explained most of the variability in off-season TC frequency. A total of 713 TCs were identified as occurring earlier or later than their peak seasons, most during the month of May and in the West Pacific and South Pacific basins. The East Pacific (EP), North Atlantic (NA) and West Pacific (WP) basins exhibit significant increasing trends in decadal off-season TC frequency. MLR results show that trends in sea surface temperature, global mean surface temperature and cloud cover explain most of the increasing trend in decadal off-season TC counts in the EP, NA and WP basins. Stepwise MLR results also identified climate change variables as the dominant forces behind increasing trends in off-season TC decadal counts, yet they also showed that climate variability factors like El Niño–Southern Oscillation, the Atlantic Multidecadal Oscillation and the Interdecadal Pacific Oscillation also account for a portion of the variability.
- Article
(4879 KB) - Full-text XML
- BibTeX
- EndNote


Increasingly, scientific evidence has shown a link between tropical cyclones (TCs) and global warming, especially following the dramatic rise in both the intensity and the frequency of storms during the first 2 decades of the present century (Goldenberg et al., 2001; Holland and Webster, 2007). Scientific studies (Landsea, 2005; Emanuel, 2005; Trenberth and Shea, 2006; Trenberth, 2007) are not in agreement as to whether sea surface temperatures have a measurable effect on the frequency of tropical cyclones, and other studies (Camargo and Sobel, 2005; Mahala et al., 2015; Zhao et al., 2018) have evaluated cyclonic activity on a timescale longer than interannual and have associated it with variability in the El Niño–Southern Oscillation (ENSO), the Atlantic Multidecadal Oscillation (AMO) and the Interdecadal Pacific Oscillation (IPO). However, little is known about the changes in the frequency of off-season TCs, storms that occur before and after the peak TC season months, and their connections to climate variability and change.
A number of recent papers (Wang and Lee, 2008; Knutson et al., 2010; Emanuel, 2013) have documented global increases in the proportion of very intense cyclones as well as latitudinal trends in maximum tropical cyclone (TC) intensity, which are consistent with future climate projections. A detailed review of the behavior of TCs (Walsh et al., 2019) concluded that it remains uncertain whether past changes in TC activity have exceeded the variability expected from natural causes, while concerns remain about the temporal homogeneity of the best record (Landsea et al., 2006; Mann et al., 2007). Another study (Mann et al., 2009) found that recent increases in the frequency of intense TCs in the North Atlantic (NA) were the product of reinforcing effects, such as La Niña-like climate conditions and relative tropical Atlantic warming. Yet no study has focused on examining changing trends in off-season TC frequency and its relation to natural variability or climate change.
A synthesis (Christensen et al., 2013) of the then-available regional projections of future TC climatology for 2081–2100 in relation to 2000–2019, for a business-as-usual emissions scenario similar to A1B, shows that worldwide the consensus projection was for decreases in TC numbers by approximately 5 %–30 %, increased frequency of Category 4 and 5 storms between 0 % and 25 %, an increase by a small percentage in the typical maximum intensity of life, and an increase in TC rainfall amounts by 5 %–20 %. Nevertheless, it is clear that there is great uncertainty about these projections. Such projections do not consider changes in off-season TC development in any of the basins where TCs form
Several climatic reconstructions have been performed (Bradley et al., 2006; Mann et al., 2009) using proxy data by collecting sediments from the impact of hurricanes in the period 500–1850 and then calculating estimates from the statistical model of the activity of tropical cyclones based on modern instrumental weather indexes for the period (1851–2006). In analyzing these results and comparing them with the cyclone seasons fixed by the World Meteorological Organization, the hurricane season (tropical depressions, tropical storms and hurricanes) in the Atlantic Ocean was fixed as 1 June to 30 November in 1960, yet we observe a significant variability in off-season TC occurrence before and after the hurricane season after the 1960s.
Even though it not uncommon for TCs to develop outside of their peak TC season months, there is a need to examine trends in the number of storms that are forming during low-activity months. The formation of the extratropical storm Andrea on 20 May 2019 marks the decade of 2010 as that with the greatest number of tropical cyclones in the Atlantic Ocean before or after the hurricane season dates established by official bodies like the World Meteorological Organization (WMO) and the National Oceanic and Atmospheric Administration (NOAA). The frequency of TCs in the North Atlantic basin has been found to be influenced by fluctuations in teleconnections such as the ENSO and AMO (Trenberth and Shea, 2006; Nogueira et al., 2013). However, human-induced climate change manifested as higher sea surface temperatures (SSTs) and increasing evaporation rates in the tropical and subtropical North Atlantic basin could also be related to the higher frequency of off-season tropical or extratropical cyclone occurrences in more recent decades. That increasing trend in SSTs in the Atlantic and other ocean basins and its relation to out off-season TC occurrences during the last century has not been thoroughly examined by the scientific community.
This study aims to determine if off-season TCs have increased in their frequency since 1900 and if that increment in the number of off-season storms, both preseason and postseason, could be associated with normal climatic variability or climate change. The total number of off-season TCs per decade for the North Atlantic (NA), West Pacific (WP), East Pacific (EP) and South Pacific (SP) ocean basins were analyzed to determine if any of the basins experienced an increase in the number of off-season tropical or extratropical cyclones over time that could be associated with climatic variability or climate change. The Indian Ocean basins were not included in this analysis due to limited data availability. Ocean basins that were found to have statistically significant trends were then analyzed further with multiple liner regression (MLR) models and regression stepwise procedures to determine if climate variability or change factors could explain increasing trends in off-season TC frequency over time.
Six-hourly TC track data for all storms across all ocean basins were obtained from the International Best Track Archive for Climate Stewardship (IBTrACS; Knapp et al., 2018), and all TCs that occurred in or after 1900 were extracted. The TC tracks were then extracted for the Northern Hemisphere basins that include the East Pacific (EP), the North Atlantic (NA) and the West Pacific (WP) and for the Southern Hemisphere basin in the South Pacific (SP; Fig. 1a). The off-season TCs were then aggregated by decade in order to identify decadal variability or trends in total storm counts at the individual basin scales. Off-season TCs were defined as storms that occurred in the 3 months before and after the 6-month period of peak cyclone activity in the basin.
The monthly frequency of TCs for each basin were analyzed for the entire period, and based on that analysis we determined that off-season TCs that occurred during the 3 months (March–April–May) before 1 June were preseason and the 3 months (December–January–February) after 30 November were postseason in the Northern Hemisphere basins (NA, EP and WP). In the Southern Hemisphere, the 3 months (August–September–October) before 1 November were classified as preseason and the 3 months (May–June–July) after 30 April were classified as postseason in the Southern Hemisphere basins (SP; Fig. 1b). Preseason and postseason decadal time series for the Northern Hemisphere, Southern Hemisphere, and individual basins were then constructed to calculate the total number of TCs per decade from 1900 to 2019.
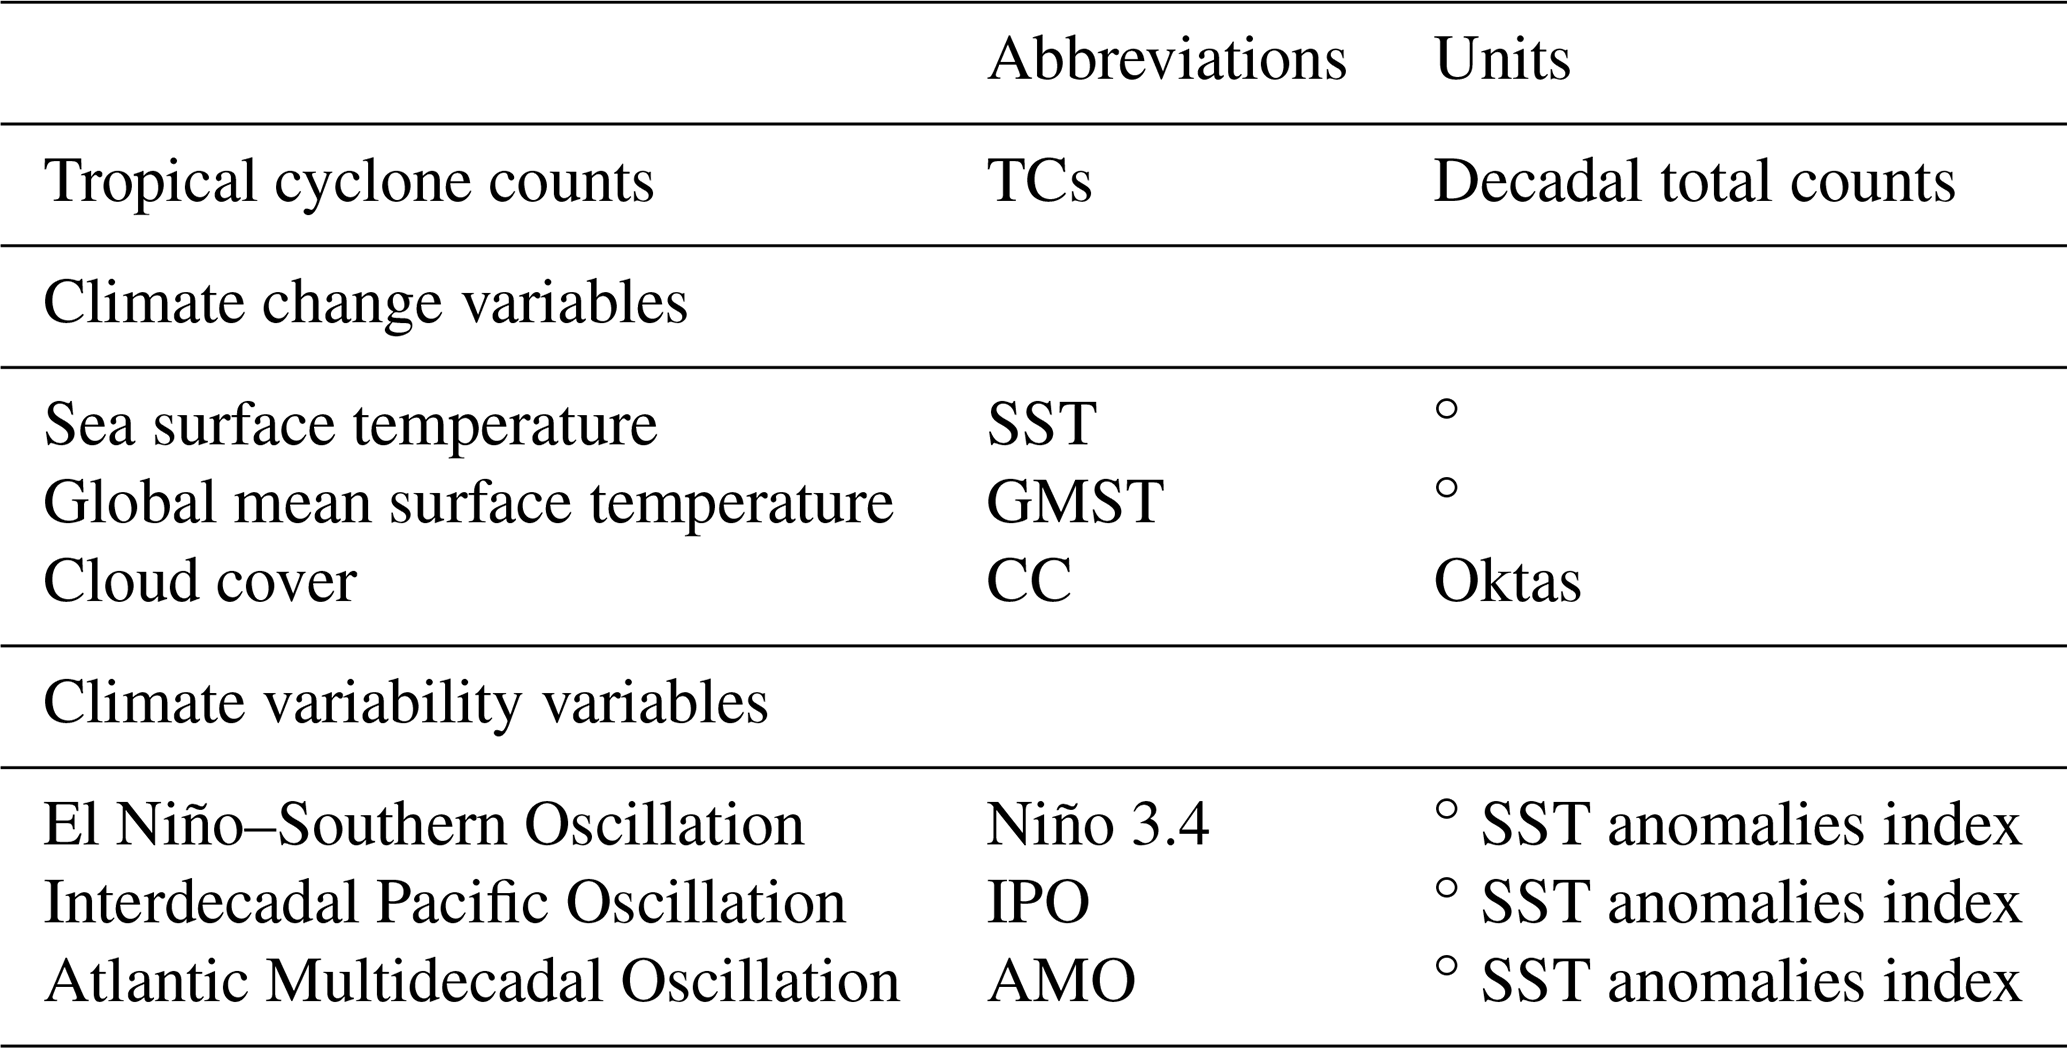
The climate variability indexes of the ENSO (Niño 3.4) and AMO (Trenberth et al., 2019) were obtained from the National Oceanic and Atmospheric Administration (NOAA) Physical Sciences Laboratory and the National Center for Atmospheric Research respectively. The IPO index was obtained from the NOAA Physical Sciences Laboratory (Henley et al., 2015). The variables associated with anthropogenic climate change used in this study were sea surface temperature (SST), global mean surface temperature (GMST) and cloud cover (CC). SST data were obtained from the HadISST1 1∘ reconstruction, GMST data were accessed from GISTEMP v4 and CC data were acquired from the International Comprehensive Ocean-Atmosphere Data Set (ICOADS) v2.5, all for the 1900–2019 period. The CC estimates from ICOADS are obtained from voluntary observing ships that report CC in octas (eighths) ranging from 0 (completely clear sky) to 8 (completely overcast). These CC estimates are known to be temporally and spatially heterogenous with relatively high observational errors in some areas, yet increases in ocean coverage for clouds after 1900 have been noted in the latest ICOADS 3.0 release (Eastman et al., 2011; Freeman et al., 2017; Aleksandrova et al., 2018). A decadal average was calculated for all of the climate variability and change variables to use them as predictors of decadal TC total counts (Table 1).
Table 1Tropical cyclone, climate change and variability variables used in this study.
TC counts before 1966 (presatellite era) are incomplete (Mann et al., 2007; Landsea, 2007) since a lot of storms that did not make landfall were not recorded, so in order to make any comparisons between the earlier and later decades, the series for each basin need to be adjusted accordingly. Another issue related to presatellite-era TC track data is the undercount of weaker tropical depressions, since the detection and classification of those weaker storms that showed poor organization was probably more difficult before 1966 (Moon et al., 2019). The average landfall percentage of TCs was calculated for the periods 1900–1965 (presatellite) and 1966–2019 (satellite era and new TC monitoring technologies available) in order to determine the share of storms that made landfall in both periods. The percentage of landfalling TCs is expected to be higher in the 1900–1965 period since a higher number of storms that remained over the ocean were not reported, so the landfall percentage of the presatellite period is then adjusted so that it matches the 1966–2019 postsatellite period.
To obtain the estimated number of missing TCs for the 1900–1965 period, the number of total storms in the presatellite period is increased until its landfall percentage is equal to the one in the postsatellite era. The total number of additional TCs that resulted in the landfall percentages between the two periods to be the same or near equal is then divided by the 7 decades of the presatellite era, and then the number of extra storms for each decade is multiplied by the percentage of off-season storms for each basin, and that resulting number is then added to each of the individual decades between 1900 and 1969. In a previous study (Landsea, 2007), this method was applied to adjust TC counts in the North Atlantic to determine if the basin had experienced an increasing trend in annual TC frequency since 1900, and the results show that after adjusting the tropical storm counts no trends were found.
Here we show how this TC series adjustment method was applied to the total TC count for the NA basin for the 1900–2019 period. First, we calculate the landfall percentage for the presatellite period 1900–1965 by dividing the number of landfalling TCs (LFTCs) by the total number of storms (TTCs) and multiplying by 100 to obtain the landfall percentage; check the equations below:
Then calculate the landfall percentage for the postsatellite period 1966–2019:
Then artificially increase the number of TCs (+83 for the NA basin) until the landfall percentage of the 1900–1965 period is equal to the landfall percentage of 1966–2019:
Then calculate the percentage (OffP) of off-season TCs (OffTCs) by dividing it by total number of TCs:
Then divide additional TCs (83) by the number of decades between 1900 and 1969 (7) and multiply by the off-season TC percentage (0.0461):
In the case of the NA, we determined that by using the above TC series adjustment method the basin would receive an additional 0.54 off-season TCs for each of the 7 decades that go from 1900 to 1969. Finally, the additional 0.54 TCs per decade is divided between pre- and postseason TCs by multiplying the added storms with the respective percentage of pre- and postseason cyclones:
The preseason decades of the NA basin before 1970 will receive an additional 0.33 TCs, and the postseason decades will receive 0.21 more storms. This off-season TC adjustment method was applied to the other five basins. It is important to note that this TC adjustment method has been only implemented in the NA basin and that this study is the first attempt to apply the technique in other ocean basins. This technique is in no way capable of detecting all TCs that formed before the satellite era, yet it offers us the opportunity to estimate missed storms by comparing the TC landfall percentage of the pre- and postsatellite eras.
Mann–Kendall (MK) tests for trends (Mann, 1945; McLeod, 2005) were applied to all the off-season TC decadal series for all basins in order to determine if the frequency of storms has increased or decreased over time. This test has the advantage of not assuming any special form for the distribution function of the data while having a power nearly as high as their parametric equivalents, and that is why its use is highly recommended by the World Meteorological Organization (Hipel and McLeod, 2005).
The decadal series that were then found to have a significant trend based on the MK results were then further analyzed by applying a series of multiple linear regression (MLR) models. MLR models were used to model the decadal count of off-season TCs for basins that showed increasing or decreasing trends in storm numbers to test if covariates associated with climatic variability and climate change explained off-season TC frequency. MLR attempts to model the relationship between two or more explanatory variables and a response variable by fitting a linear equation to observed data.
Three different MLR models were run for each off-season TC series that exhibited a statistically significant trend: one MLR model with the climate change variables (SST, GMST and CC) as predictors, another model with just the climate variability factors (ENSO, AMO and IPO) and a final model with all of the variables included. Then the three MLR models (preseason, postseason and off-season) were run for each of the basins with increasing trends in off-season TCs; the best models (highest adjusted R2 and lowest p value) were then selected for each of the series. The MLR models were run in The R Project for Statistical Computing using the biglm package.
Finally, stepwise selection MLR models were used to identify the climate variability or change factors making the most statistically significant contributions to off-season increasing TC frequency. Here we use stepwise selection which is a combination of the forward and backward procedures where you start with no predictors and then sequentially add the most contributive predictors. After adding each new variable, this method removes the variables that no longer provide an improvement in the model fit (Bruce and Bruce, 2017). The MLR and stepwise selection for the off-season TC count series for each of the basins with significant increasing trends were run in The R Project for Statistical Computing using the MASS package (Venables and Ripley, 2002; Gareth et al., 2014).
When analyzing the number of TCs for all basins for the 1900–2019 period we found that 713 off-season storms occurred during that time, most during the months of May (NH preseason and SH postseason) with 430 and December (NH postseason) with 341 (Fig. 1a, b). When looking at the count of off-season TCs per basin we found that as expected the West Pacific (611) and South Pacific (85) accounted for 81.3 % of all off-season storm occurrences. When grouping the basins into the Northern and Southern hemispheres, we find that 89 % of all off-season TCs occurred north of the Equator for the 1900–2019 period (Fig. 1a, b). The North Atlantic and East Pacific basins were found to be the ones with the lowest numbers of off-season TCs when compared to the other two Pacific basins.
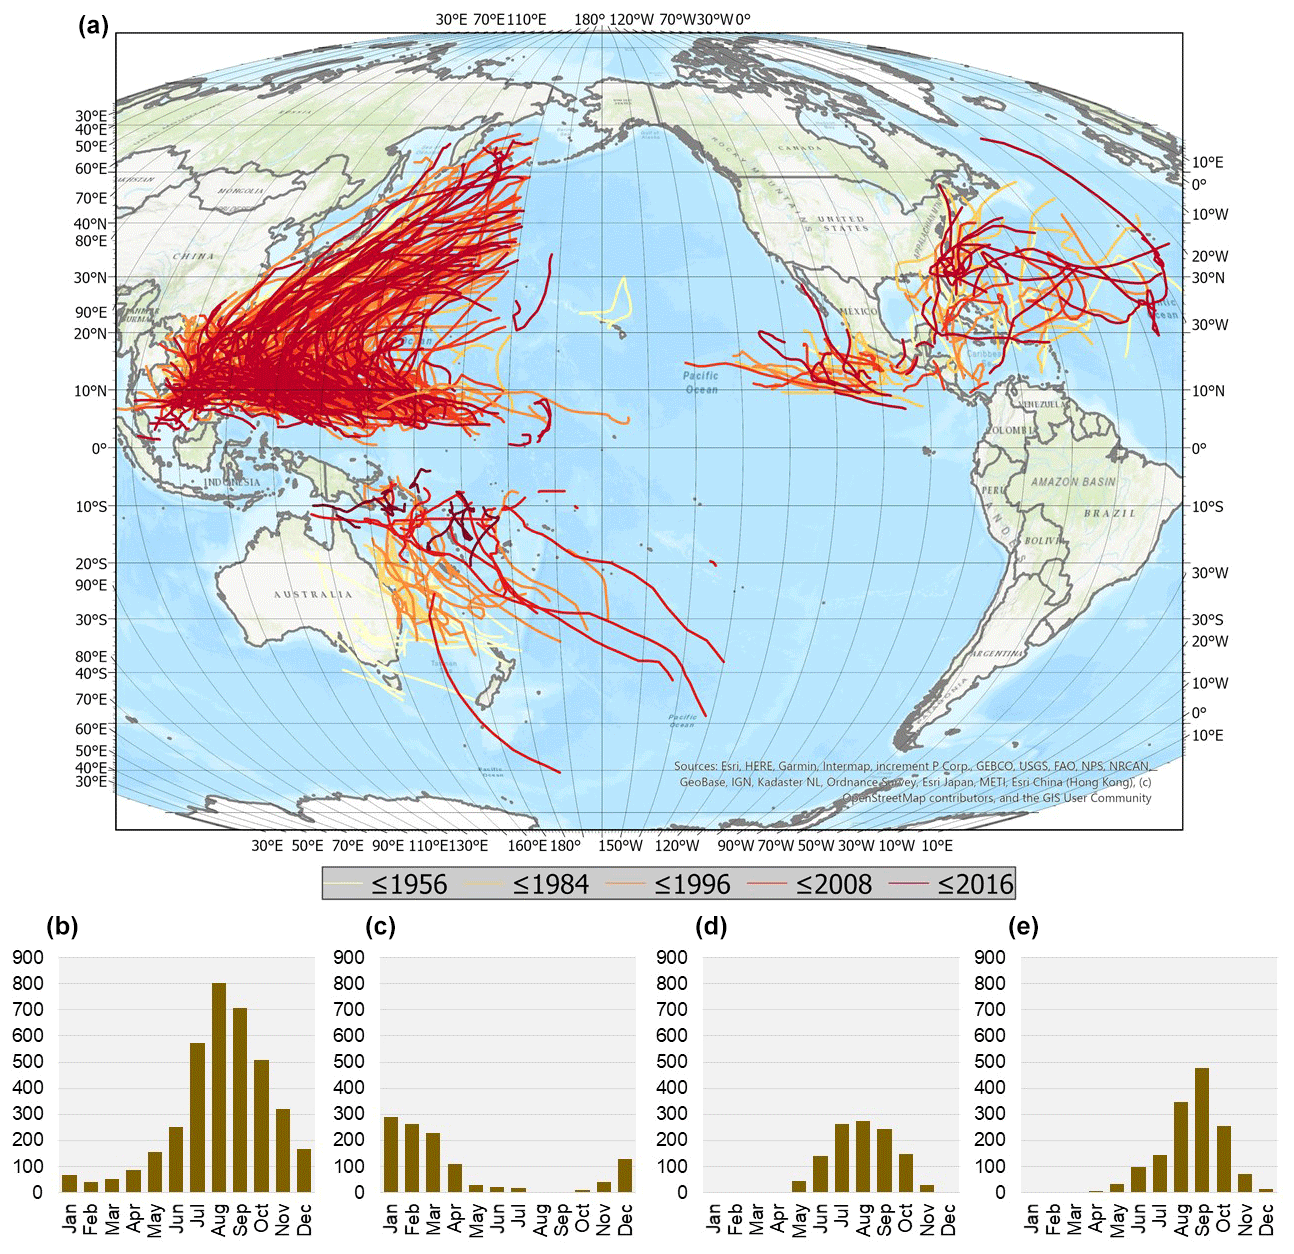
Figure 1Tracks of all off-season TCs (a) and the number of storms per month for the WP (b), SP (c), EP (d) and NA (e) basins for the 1900–2019 period.
As shown in Fig. 2, even after adding the estimated missing storms before the 1970s decade, most basins experienced their highest number of off-season TCs (pre- or postseason) in decades from 1960. The 1960–1969 decade for the Northern Hemisphere basins (WP, NA and EP) was found to be the one with the highest number of preseason TCs with 69, and the 1950–1959 decade was identified as the one with the most postseason storms with 68 (Fig. 2a, b, c and d). When examining TC counts for all basins individually, we found that the NA and EP basins had their most active decades after 1970 and that the WP and SP basins experienced their highest-storm-count decade after 1960 (Fig. 2c, d). It is important to note that these results already reflect the additional TCs that were added to the presatellite era.
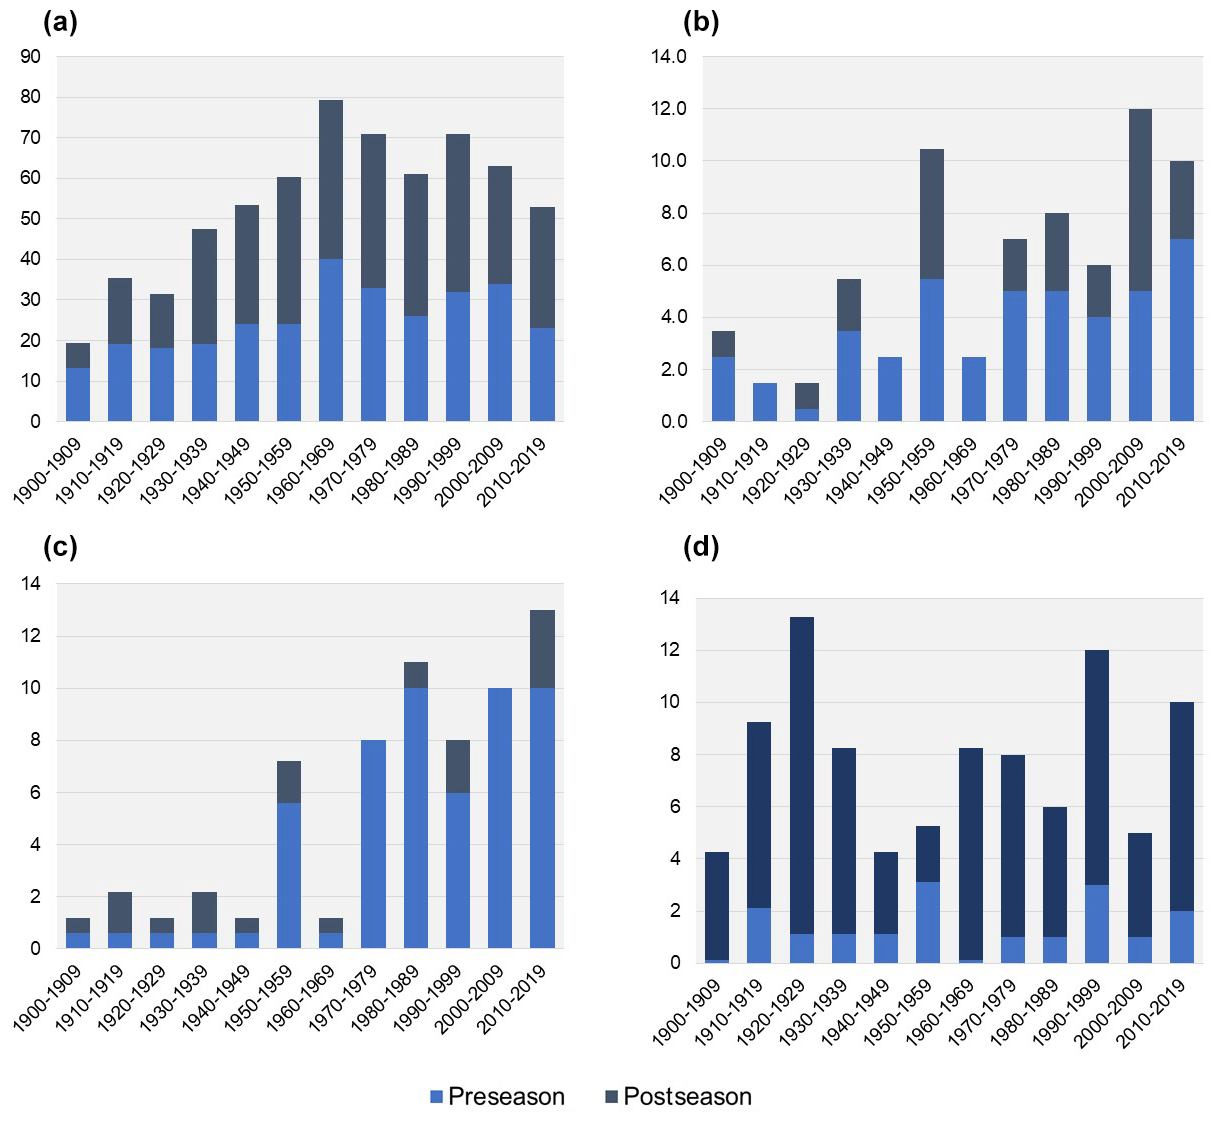
Figure 2Adjusted decadal count of all observed and estimated off-season TCs for the WP (a), NA (b), EP (c) and SP (d) ocean basins for the 1900–2019 period.
The Mann–Kendall nonparametric tests for trends for all basins show that three basins exhibited statistically significant increasing trends in adjusted decadal off-season TC counts for the 1900–2019 period (Table 2). The basins with statistically significant increasing trends for the entire time period were the EP (pre- and off-season), NA (pre-, post- and off-season) and the WP (pre-, post- and off-season). The EP basin shows an increasing trend in pre- and off-season TCs that is more evident from the 1950s to the present (Fig. 2d), while the increasing trend in the NA basin can be observed from the 1970s to 2019. The NA and EP basins also exhibit positive trends when the analysis is carried out only considering the postsatellite era, yet the results are not statistically significant (Table 2).
The increasing trend in off-season TCs in the WP basin is more evident from 1900 to 1969 (Fig. 2a), which was during the presatellite era for which missing TCs were added to the series. However, a negative trend is found in the WP basin if the decadal counts are analyzed from the 1960s to the present, yet those results were not statistically significant. In the postsatellite era in the WP basin, the 1990–1999 decade was identified as the one with the most off-season TCs, however the 2 following decades exhibited a decreasing trend. The EP and NA basins show significant increasing trends in off-season TC counts (Table 2). Opposite to the trends identified in the WP basin, the EP and NA also show increasing decadal counts after the 1960s and 1970s. The SP basin also exhibited a positive τ coefficient, yet it was statistically insignificant for the entire period and the postsatellite era (Fig. 2d).
Table 2Results of Mann–Kendall trend tests for the 1900–2019 period for all ocean basins where TCs form.
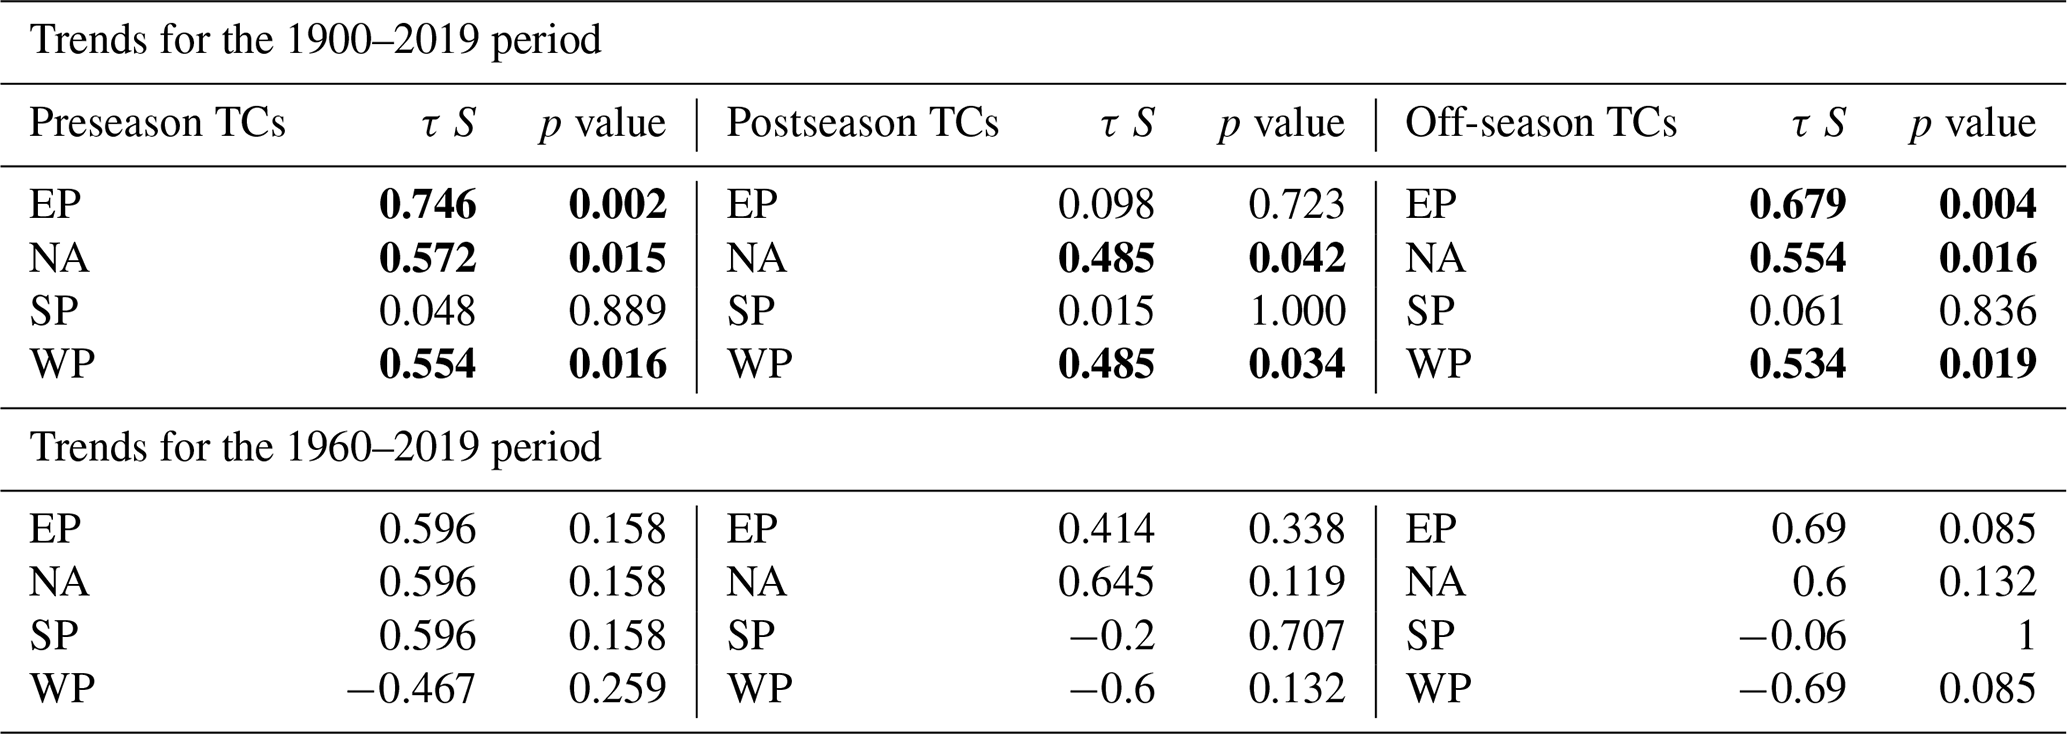
Significant trends are in bold.
MLR models were run on the basins that exhibited statistically significant (< 0.05) increasing trends in decadal total off-season TC counts over time, and here we report the best models for each of the series. The MLR results show that the statistically significant increasing trends in TC frequency for the EP (pre- and off-season) and WP basins are best explained by climate change factors SST, GMST and CC in both the normal and detrended series at the 0.05 significance level (Table 3). Climate change factors accounted for 56 % (preseason) and 52 % (off-season) of the increasing trend in TC counts for the EP basin. In the WP basin climate change factors explained 55 % (preseason), 64 % (postseason) and 68 % (off-season) of the trends in off-season TCs, yet lower R2 values were found when the analysis was carried out with the detrended series. Increasing trends in SST, GMST and moisture (CC) outside of the prime months of tropical storm development could promote better conditions for higher off-season TC occurrences (Klozbach, 2006; Hansen et al., 2010).
Table 3Best multiple linear regression (MLR) models for basins with statistically significant increasing trends in off-season TCs with detrended climate indices.
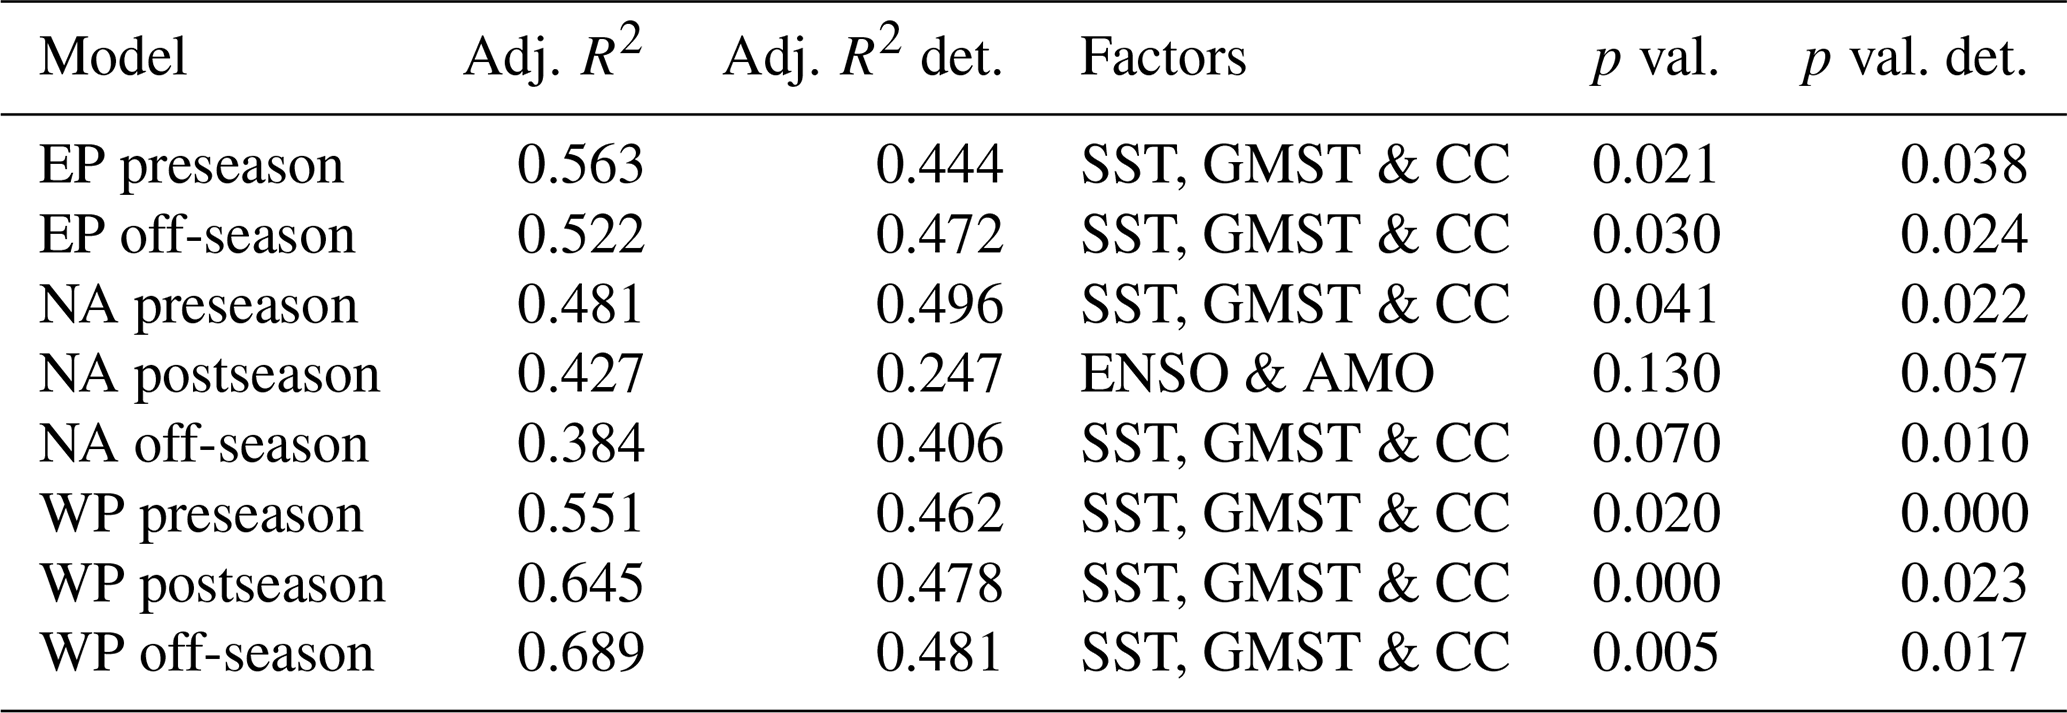
The climate variability factors (ENSO, AMO and IPO) did not exhibit statistically significant relationships with increasing off-season TC counts, which shows that natural variability does not explain the incremental number of storms in the EP and WP basins. MLR model results for the NA basin also showed the climate change variables accounting for 48 % (preseason) and 38 % (off-season) of the increasing trend in TCs (Table 3). However, the MLR model results for the postseason months in the NA basin showed that the climate variability variables (ENSO and AMO) accounted for 42 % of the increasing trend in TCs (25 % in the detrended series), yet the model was not found to be statistically significant in both the normal and detrended series. It is well known that cold phases of the ENSO (La Niña) and warm phases of the AMO tend to be associated with higher TC frequency in the North Atlantic Ocean (Tang and Neelin, 2004; Briggs, 2008), and this could explain why those teleconnections were found to have the most significant influence on postseason TC frequency in the NA basin. When the MLR results of the original and detrended series are compared (Table 3), we find that the models with the detrended series exhibit lower R2 values than the MLR models with the original series, yet those models were still found to be statistically significant which suggests that the correlation between off-season TCs and climate change factors is strong even after decadal trends are removed.
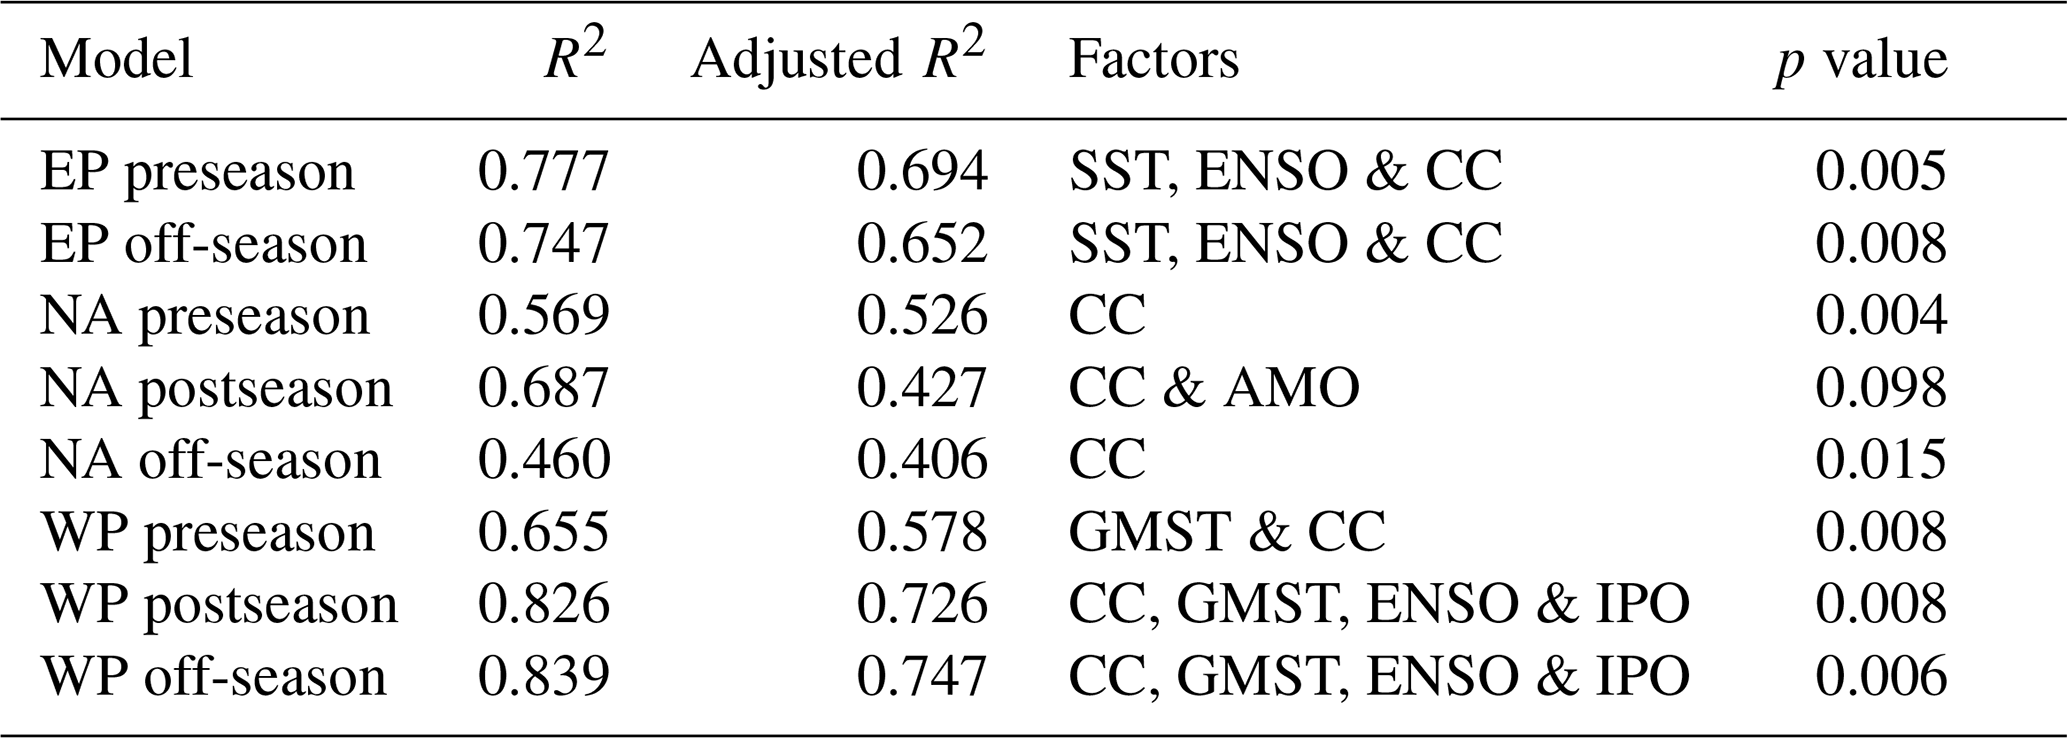
Stepwise MLR model results showed that climate change factors (SST, GMST and CC) were among the selected variables that explained most of the increasing trend in off-season TCs for all basins analyzed (Table 4). In the EP basin, SST, the ENSO and CC accounted for 69 % (preseason) and 65 % (off-season) of the increasing trend in TCs. In the NA basin, the stepwise procedure selected CC as the sole climate change factor that explained 52 % (preseason) and 40 % (off-season) of the rising frequency in TC counts. However, CC and the AMO were selected as the variables that explained most (43 %) of the variability in TC frequency during the postseason months in the NA basin. Stepwise procedure results for the WP basin show that climate change and variability factors were selected as the best predictors of TC frequency, with GMST and CC accounting for 57 % (preseason) and CC, GMST, the ENSO and the IPO explaining 72 % (postseason) and 74 % (off-season) of the variability in TCs.
Table 4Stepwise multiple linear regression (MLR) models for basins with statistically significant increasing trends in off-season TCs.
The EP experienced a steady increase in off-season TC total counts from 1900 to 2019 at a rate of 1.1 additional storms per decade. The decadal off-season total TC count series for the EP basin closely resembles the increasing trend in average SSTs and CC (Fig. 3a, c). When the EP off-season TC tracks are examined, they show that most storms have formed in areas that have experienced statistically significant increasing trends in SST and CC, yet no changes in track or genesis location were detected over time (Fig. 3d, e). The correlation between off-season TCs in the EP basin and the ENSO is not as clear as the one between SST and CC, with some mostly warm ENSO decades like 1990–1999 exhibiting lower storm counts and other periods with cooler phases dominating showing a higher number of cyclones. When SST patterns for areas in the EP basin where TCs develop are examined over time, we find that most tropical or subtropical ocean waters have experienced a statistically significant increasing trend in ocean surface temperatures from 1900 to 2019 (Fig. 3d). Similarly to other studies (Hansen et al., 2010), we find that the EP tropical ocean surfaces have increased by 0.051 ∘C per decade. When CC patterns are examined, we find that they have also experienced a statistically significant increasing trend in some areas in the EP basin (Fig. 3e).
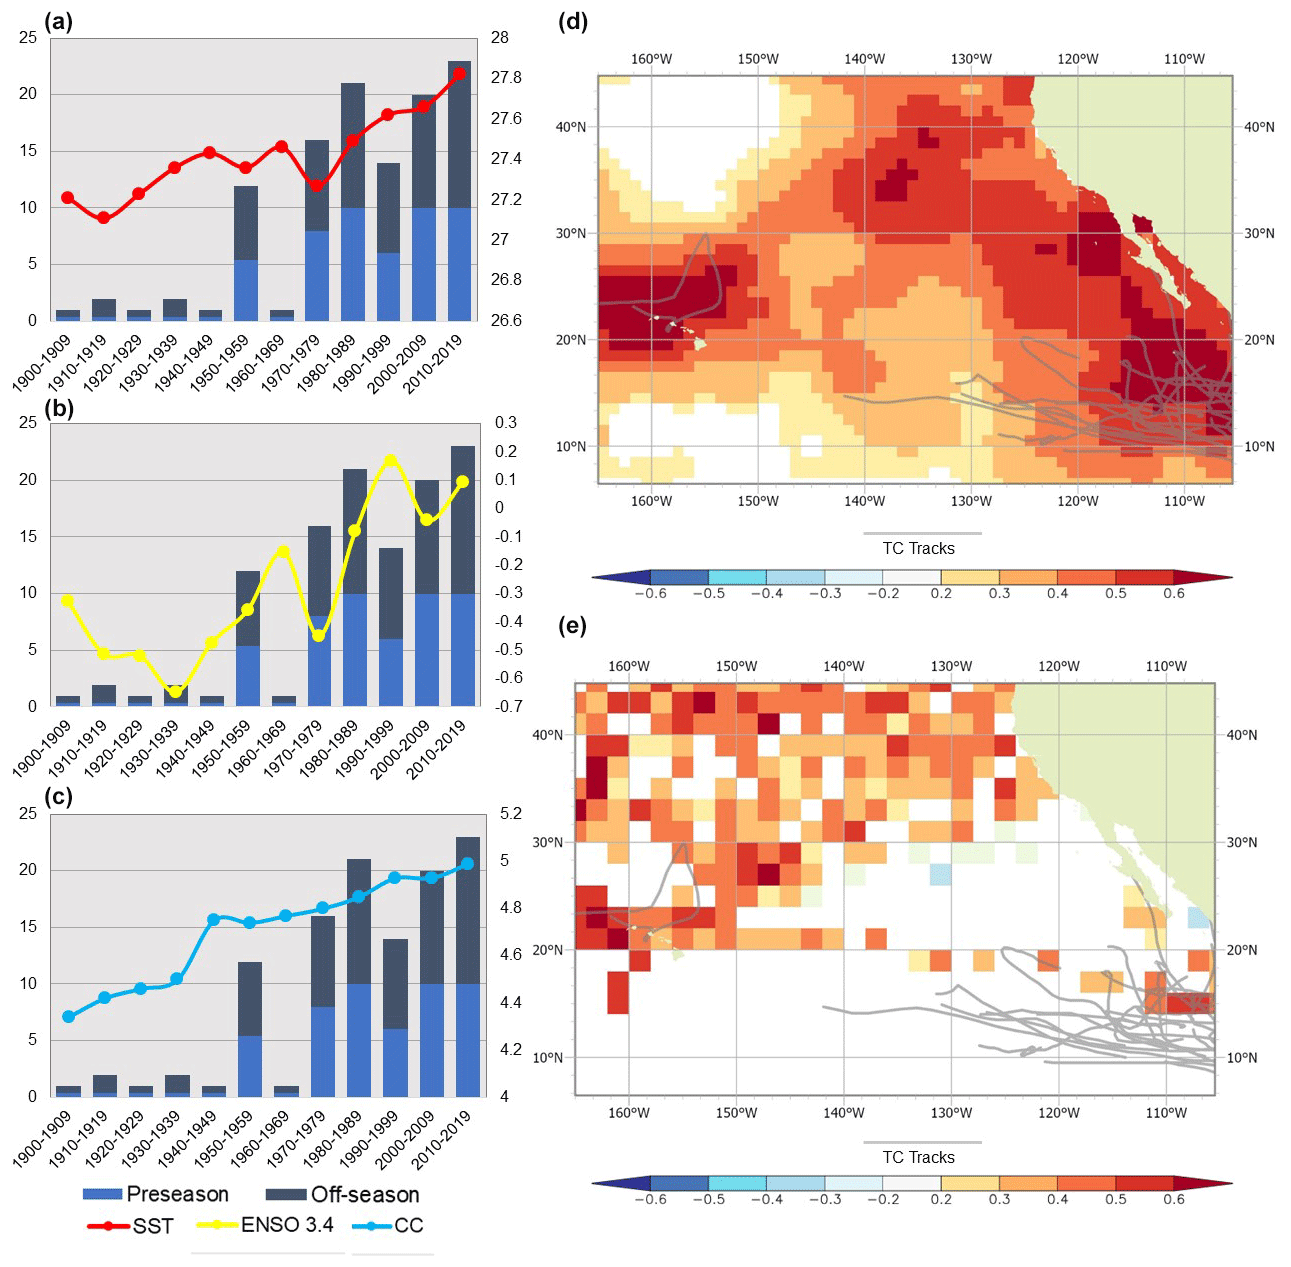
Figure 3Decadal TC counts for the EP off-seasons and decadal average SSTs (a); decadal TC counts for the EP off-seasons and decadal average Niño 3.4 (b); decadal TC counts for the EP off-seasons and decadal average correlation between time and December–May-averaged CC (c); correlation between time and December–May-averaged SST (C∘) and the off-season TC tracks for the 1900–2019 period (d); and correlation between time and December–May-averaged CC (oktas) and the off-season TC tracks for the 1900–2019 period.
The decadal off-season total TC count series for the NA basin closely resembles the increasing trend in average SSTs and CC (Fig. 4a, c). The NA decadal series shows a steady increase in off-season TC total counts from 1900 to 2019 at a rate of 0.7 additional storms per decade and an SST increasing trend of 0.055 ∘C per decade. Both the average decadal SST and the average decadal CC series coincide with the peaks and valleys in off-season TC counts for the NA basin, with 1950–1959 showing a high number of storms associated with high mean SSTs and CC, while the drop in storm counts in the 1960–1969 decade matches a drastic drop in ocean surface temperatures (Fig. 4a, c). The off-season TC tracks in the NA basin also formed in areas that exhibited increasing trends in SST and CC; however no changes in track or genesis location were detected over time (Fig. 4d, e). Even though average SSTs increase to 0.135 C∘ per decade from 1970 to 2019, off-season TC total counts went down in the 1990–1999 and 2010–2019 decades, with the decade in between (2000–2009) exhibiting the highest number of off-season TCs (14) of all decades examined. However, it is important to note that 5 out of the 6 decades with the most off-season TCs in the NA basin occurred after the 1970s.
When North Atlantic SSTs are examined in areas where TCs form, we found that ocean surface temperatures have increased at a rate of 0.055 ∘C per decade for the off-season months of December–March (Fig. 4d). When CC patterns are examined, we find that it has also experienced a statistically significant increasing trend of 0.06 oktas (eighths of the sky that are covered in clouds) per decade in the North Atlantic basin since 1900 (Fig. 4e). If the NA pre- and postseason series are modified to begin in the 1960s, we find that SSTs have increased at a decadal rate of 0.082 ∘C per decade at a rate of 1.2 additional storms per decade. Overall, these results suggest that increasing trends in SSTs, which also drive increasing trends in evaporation rates associated with high CC, are the physical mechanisms behind most of the recent increase in the total number of out of season TCs in the NA basin. The correlation between off-season TCs in the NA basin and the AMO is not as clear as the one between SST and CC, with some warm AMO phases between 1930 and 1959 exhibiting lower storm counts, while some cooler phases (1970–1989) show a higher number of cyclones.
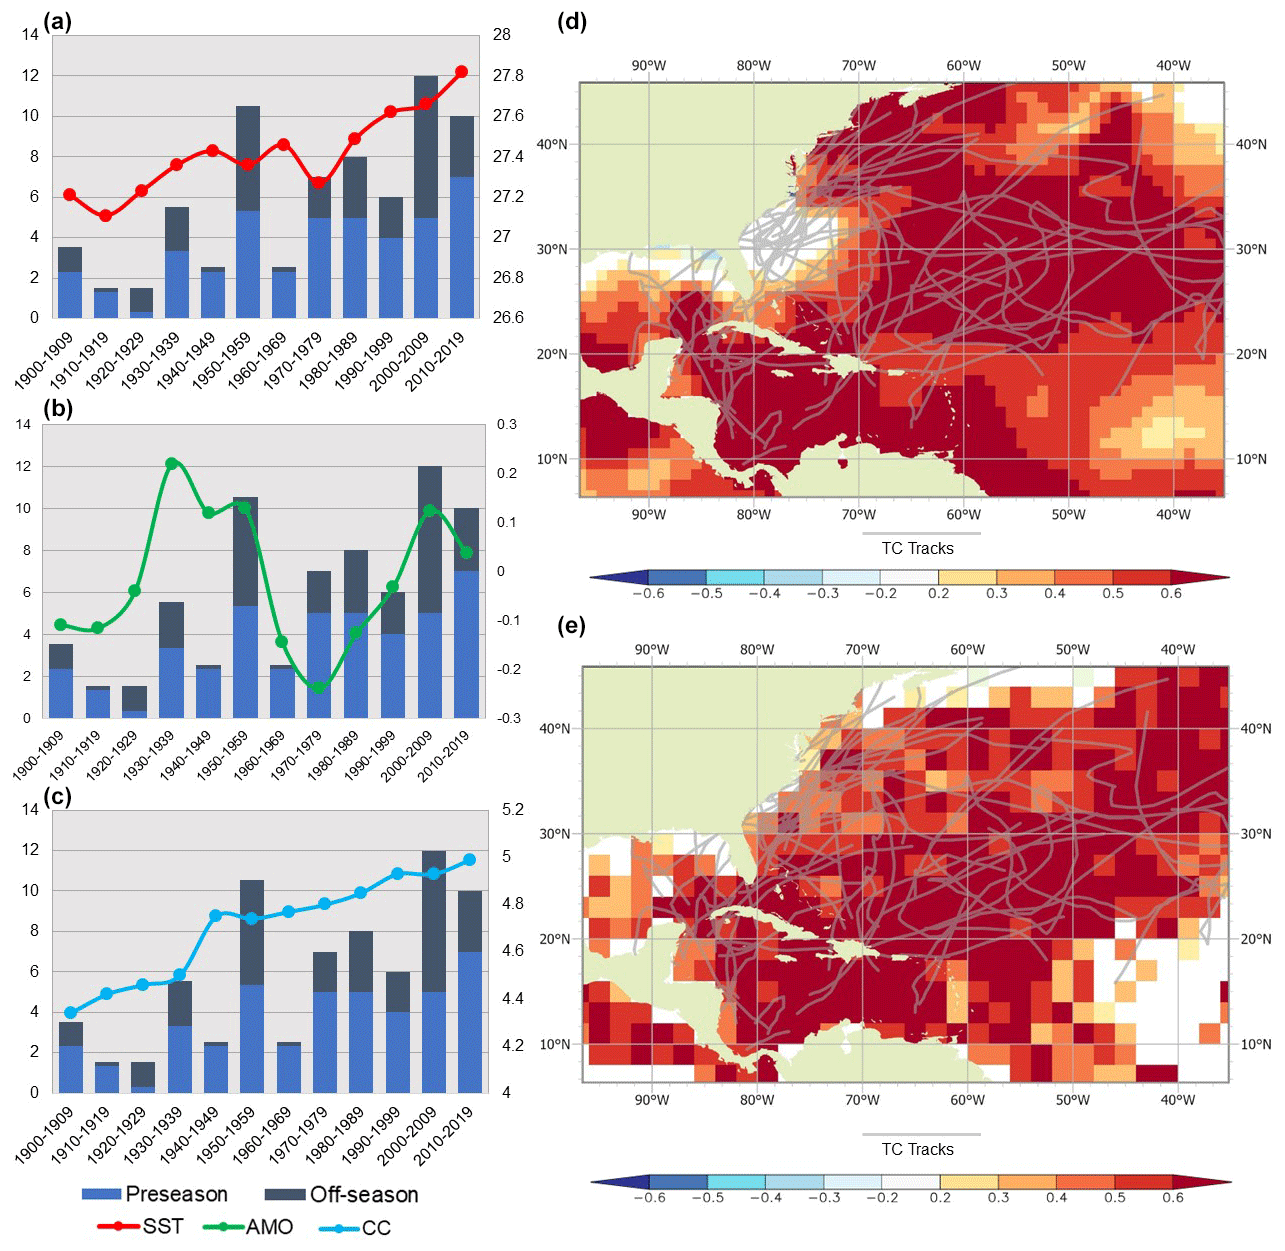
Figure 4Decadal TC counts for the NA off-seasons and decadal average SSTs (a); decadal TC counts for the NA off-seasons and decadal average AMO (b); decadal TC counts for the NA off-seasons and decadal average correlation between time and December–May-averaged CC (c); correlation between time and December–May-averaged SST (∘C) and the off-season TC tracks for the 1900–2019 period (d); and correlation between time and December–May-averaged CC (oktas) and the off-season TC tracks for the 1900–2019 period (e).
The decadal off-season total TC count series for the WP basin closely resembles the increasing trend in GMST (Fig. 5a). However, the WP basin experienced the highest count of off-season TCs in the 1960–1969 decade and not in the more recent decades like the EP and NA basins. More importantly, if trend analysis for off-season TC counts is carried out from 1960 to 2019 in the WP basin, we find a nonstatistically significant decreasing trend. However, it is important to note that 4 out of the 5 decades with the most off-season TCs in the WP basin occurred after 1960. However, the 2010–2019 decade was identified as the period with the lowest total number of off-season TCs even though increasing trends in mean SST, GMST and CC continued (Fig. 5a, d and e). Off-season TC tracks in the WP basin also correlate spatially with areas that show increasing trends in SST and CC (Fig. 5d, e), yet no changes in TC genesis or tracks were identified over time. The decreasing number of off-season TCs in the last 2 decades have coincided with a negative phase of the IPO, which suggests that TC frequency in the WP basin is influenced by fluctuations in the IPO (Fig. 5c), whose recent negative phase since 1998 has resembled La Niña-like SST anomaly patterns (Zhao et al., 2018). Even though most of the variability in off-season TC frequency in the WP basin can be explained by climate change trends in GMST, SST and CC, the rest of the variance in TCs is accounted for by fluctuations in the IPO and ENSO teleconnections.
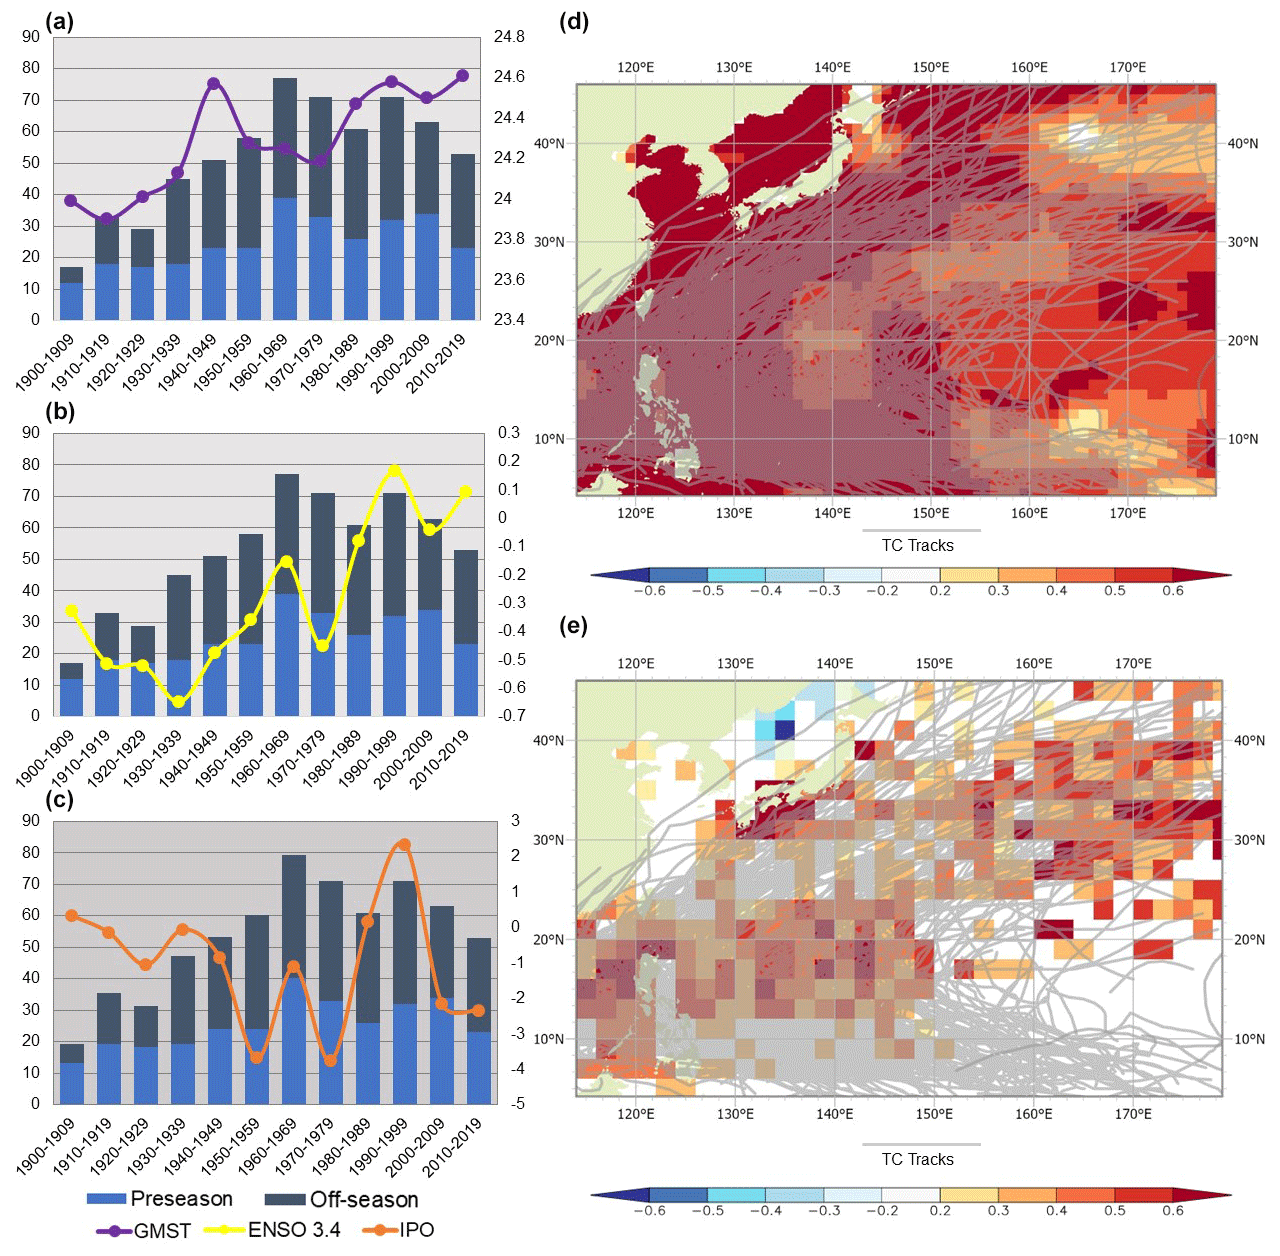
Figure 5Decadal TC counts for the WP off-seasons and decadal average SSTs (a); decadal TC counts for the WP off-seasons and decadal average AMO (b); decadal TC counts for the WP off-seasons and decadal average correlation between time and December–May-averaged CC (c); correlation between time and December–May-averaged SST (∘C) and the off-season TC tracks for the 1900–2019 period (d); and correlation between time and December–May-averaged CC (oktas) and the off-season TC tracks for the 1900–2019 period (e).
Studies that have examined TC frequency overall have found increases in the number of the most intense hurricanes (Wang and Lee, 2008; Knutson et al., 2010; Emanuel, 2013), yet no clear trend has been found when lower-intensity TCs have been examined (Landsea, 2007). The results of other studies show that there is no overall agreement on the relationship between SSTs and TC frequency (Landsea, 2005; Emanuel, 2005; Trenberth and Shea, 2006; Trenberth, 2007), yet some have found strong associations between TC variability and the ENSO, AMO and IPO (Camargo and Sobel, 2005; Mahala et al., 2015; Zhao et al., 2018). In this study we analyzed off-season TCs and our results differ from those that have found no trend in overall TC frequency, since we found decadal increasing trends in the NA and EP basin in both the pre- and postsatellite eras. The results presented here suggest that climate change trends like increasing SSTs and more favorable moisture environments (CC) between the months of December and May in the NA and EP basins seem to be the major factors behind decadal increasing trends in off-season TCs.
The frequency of TCs that developed outside of their prime-season months was analyzed to determine if trends in higher storm totals in the Pacific Ocean and Atlantic Ocean basins were associated with natural variability, climate change or both. Adjusted off-season decadal TC total counts for six ocean basins were analyzed for the 1900–2019 period in order to determine if the number of storms have been increasing over time. Mann–Kendall tests for trends were carried out, and the basins that exhibited statistically significant increasing trends were then further analyzed using multiple linear regression models and stepwise procedures to determine if those trends could be explained by fluctuations associated with climate variability, climate change trends or a combination of both.
The main results of this study suggest that decadal total off-season (pre- and postseason) TC counts have significantly increased over time since 1900 in the East Pacific (EP), North Atlantic (NA) and West Pacific (WP) basins. The EP and NA basins exhibited statistically significant increasing trends even if the analysis was carried out from the 1960s instead of 1900. The WP basin showed an overall increasing trend in the total number of off-season TCs per decade, yet if the analysis is done from the 1960s to the present, no statistically significant increasing trend is found. However, the three basins that reflected an overall increase in decadal off-season TC frequency had their most active decades after the 1970s.
Results from the best multiple linear regression (MLR) models show that the increasing decadal count of off-season TCs has been found to be strongly associated with climate change trends in sea surface temperature (SST), global mean surface temperature (GMST) and cloud cover (CC) in all three basins (EP, NA and WP). The MLR model where climate variability variables (ENSO and AMO) explained most of the variance in off-season TC counts was in the storm decadal counts for the postseason months of the NA basin.
Results of the MLR stepwise procedures showed that the selected variables that accounted for most of the variability in off-season TCs for the EP basin were SST, CC and the ENSO, while CC (preseason and off-season) and the AMO (postseason) were chosen as the best variables for the NA basin. The stepwise procedure identified the climate change trends in GMST and CC and fluctuations in the ENSO and IPO as the variables that accounted for most of the variability in decadal off-season total TC counts in the WP basin,
The findings of this study suggest that trends in SST, GMST and CC associated with climate change are not only altering the frequency (Klotzbach, 2006; Saunders and Lea, 2008; Hansen et al., 2010) and intensity of TCs that develop during the peak months of the season; they are also altering the total number of storms that form in the off-season months (December–May), especially in the EP and NA basins. The results of this study have important implications for the NA and EP basins: if off-season TCs have been increasing in frequency since 1900, we can expect that this trend associated with climate change will continue in future decades. This increasing number of off-season TCs could potentially impact societies in their paths during times of the year when storms are least expected, possibly increasing environmental and economic impacts in areas that are already experiencing the effects of climate-change-exacerbated phenomena.
One of the main limitations of this work was the inclusion of tropical depressions in the off-season TC analysis. If data on TC intensity were widely available for all off-season TCs, it would have been possible to exclude weaker tropical depressions from the analysis since the detection and classification of those storms was more difficult in the presatellite era. Other limitations of this study include the issues of worse data quality in the presatellite era; the problem of applying a universal missed-TC adjustment method to all basins analyzed; and the lack of information on TC intensity for many storms, especially in the presatellite era.
The 6-hourly tropical cyclone track data supporting this article are based on publicly available measurements from the International Best Track Archive for Climate Stewardship (IBTrACS; https://www.ncdc.noaa.gov/ibtracs/, Knapp et al., 2020). The sea surface temperature (HadISST1 1∘ reconstruction) and cloud cover (ICOADS Release 3.0 1∘; Freeman et al., 2017) datasets supporting this article are based on publicly available measurements that can be accessed from the Royal Netherlands Meteorology Institute (KMNI; https://climexp.knmi.nl/start.cgi, Rayner et al., 2003). The global mean surface temperature (GISTEMP v4) data supporting this article are based on publicly available measurements from the NASA Goddard Institute for Space Studies (GISS; https://climatedataguide.ucar.edu/climate-data/global-surface-temperature-data-gistemp-nasa-goddard-institute-space-studies-giss, Hansen et al., 2010). The El Niño–Southern Oscillation (Niño 3.4) data supporting this article are based on publicly available measurements from the National Oceanic and Atmospheric Administration Physical Sciences Laboratory (PSL; https://psl.noaa.gov/gcos_wgsp/Timeseries/Data/nino34.long.data, Trenberth and Stepaniak, 2001). The Atlantic Multidecadal Oscillation data supporting this article are based on publicly available measurements from the National Center for Atmospheric Research (NCAR; https://climatedataguide.ucar.edu/climate-data/atlantic-multi-decadal-oscillation-amo, Trenberth et al., 2019). The Interdecadal Pacific Oscillation data supporting this article are based on publicly available measurements from the National Oceanic and Atmospheric Administration Physical Sciences Laboratory (PSL; https://psl.noaa.gov/data/timeseries/IPOTPI/, Hensley et al., 2015).
JJHA analyzed the data and led the writing. JJHA and RMT designed the study and contributed to the writing.
The authors declare that they have no conflict of interest.
Acknowledgements go to Roberto García, Director of the National Weather Service of San Juan, Puerto Rico, for his suggestions during the discussion of this paper.
This paper was edited by Peter Knippertz and reviewed by Jhordanne Jones and one anonymous referee.
Aleksandrova, M., Gulev, S. K., and Belyaev, K.: Probability distribution for the visually observed fractional cloud cover over the ocean, J. Climate, 31, 3207–3232, https://doi.org/10.1175/JCLI-D-17-0317.1, 2018.
Bradley, R. S., Hughes, M. K., and Mann, M. E.: Authors were clear about hockey-stick uncertainties, Nature, 442, 627, https://doi.org/10.1038/442627b, 2006.
Briggs, W. M.: On the changes in the number and intensity of North Atlantic tropical cyclones, J. Climate, 21, 1387–1402, 2008.
Bruce, P. and Bruce, A.: Practical Statistics for Data Scientists, O'Reilly Media, MA, USA, 2017.
Camargo, S. J. and Sobel, A. H.: Western North Pacific tropical cyclone intensity and ENSO, J. Climate, 18, 2996–3006, https://doi.org/10.1175/JCLI3457.1, 2005.
Christensen, J. H., Kanikicharla, K. K., Aldrian, E., An, S. I., Albuquerque Cavalcanti, I. F., de Castro, M., Dong, W., Goswami, P., Hall, A., Kanyanga, J. K., Kitoh, A., Kossin, J., Lau, N. C., Renwick, J., Stephenson, D. B., Xie, S. P., Zhou, T., Abraham, L., Ambrizzi, T., Anderson, B., Arakawa, O., Arritt, R., Baldwin, M., Barlow, M., Barriopedro, D., Biasutti, M., Biner, S., Bromwich, D., Brown, J., Cai, W., Carvalho, L. V., Chang, P., Chen, X., Choi, J., Christensen, O. B., Deser, C., Emanuel, K., Endo, H., Enfield, D. B., Evan, A., Giannini, A., Gillett, N., Hariharasubramanian, A., Huang, P., Jones, J., Karumuri, A., Katzfey, J., Kjellström, E., Knight, J., Knutson, T., Kulkarni, A., Kundeti, K. R., Lau, W. K., Lenderink, G., Lennard, C., Leung, L. Y., Lin, R., Losada, T., Mackellar, N. C., Magaña, V., Marshall, G., Mearns, L., Meehl, G., Menéndez, C., Murakami, H., Nath, M. J., Neelin, J. D., van Oldenborgh, G. J., Olesen, M., Polcher, J., Qian, Y., Ray, S., Reich, K. D., Rodriguez de Fonseca, B., Ruti, P., Screen, J., Sedláček, J., Solman, S., Stendel, M., Stevenson, S., Takayabu, I., Turner, J., Ummenhofer, C., Walsh, K., Wang, B., Wang, C., Watterson, I., Widlansky, M., Wittenberg, A., Woollings, T., Yeh, S. W., Zhang, C., Zhang, L., Zheng, X., and Zou, L.: Climate phenomena and their relevance for future regional climate change. In Climate Change 2013 the Physical Science Basis: Working Group I Contribution to the Fifth Assessment Report of the Intergovernmental Panel on Climate Change, Cambridge University Press, Vol. 9781107057999, 1217-1308, https://doi.org/10.1017/CBO9781107415324.028, 2013.
Eastman, R., Warren, S. G., and Hahn, C. J.: Variations in cloud cover and cloud types over the ocean from surface observations, 1954–2008, J. Climate, 24, 5914–5934, 2011.
Emanuel, K. A.: Increasing destructiveness of tropical cyclones over the past 30 years, Nature, 436, 686–688, https://doi.org/10.1038/nature03906, 2005.
Emanuel, K. A.: Downscaling CMIP5 climate models shows increased tropical cyclone activity over the 21st century, P. Natl. Acad. Sci. USA, 110, 12219–12224, https://doi.org/10.1073/pnas.1301293110, 2013.
Freeman, E., Woodruff, S. D., Worley, S. J., Lubker, S. J., Kent, E. C., Angel, W. E., Berry, D. I., Brohan, P., Eastman, R., Gates, L., Gloeden, W., Ji, Z., Lawrimore, J., Rayner, N. A., Rosenhagen, G., and Smith, S. R.: ICOADS Release 3.0: a major update to the historical marine climate record, Int. J. Climatol., 37, 2211–2232, 2017.
Goldenberg, S. B., Landsea, C. W., Mestas-Nuñez, A. M., and Gray, W. M.: The recent increase in Atlantic hurricane activity: Causes and implications, Science, 293, 474–478, https://doi.org/10.1126/science.1060040, 2001.
Hansen, J., Ruedy, R., Sato, M., and Lo, K.: Global surface temperature change, Rev. Geophys., 48, RG4004, https://doi.org/10.1029/2010RG000345, 2010 (data available at: https://climatedataguide.ucar.edu/climate-data/global-surface-temperature-data-gistemp-nasa-goddard-institute-space-studies-giss, last access: 15 November 2020).
Henley, B. J., Gergis, J., Karoly, D. J., Power, S. B., Kennedy, J., and Folland, C. K.: A Tripole Index for the Interdecadal Pacific Oscillation, Clim. Dynam., 45, 3077–3090, https://doi.org/10.1007/s00382-015-2525-1, 2015 (data available at: https://psl.noaa.gov/data/timeseries/IPOTPI/, last access: 15 November 2020).
Hipel, K. W. and McLeod, A. I.: Time Series Modelling of Water Resources and Environmental Systems, available at: http://www.stats.uwo.ca/faculty/aim/1994Book/ (last access: 15 January 2020), 2005.
Holland, G. J. and Webster, P. J.: Heightened tropical cyclone activity in the North Atlantic: Natural variability or climate trend?, Philos. T. Roy. Soc., 365, 2695–2716, https://doi.org/10.1098/rsta.2007.2083, 2007.
Gareth, J., Witten, D., Hastie, T., and Tibshirani, R.: An Introduction to Statistical Learning: With Applications in R. Springer Publishing Company, Incorporated, NY, USA, 2014.
Knapp, K. R., Diamond, H. J., Kossin, J. P., Kruk, M. C., and Schreck, C. J.: International Best Track Archive for Climate Stewardship (IBTrACS) Project, Version 4. [indicate subset used], NOAA National Centers for Environmental Information, non-gonvernment domain, https://doi.org/10.25921/82ty-9e16, 2018.
Knapp, K. R., Kruk, M. C., Levinson, D. H., Diamond, H. J., and Neumann, C. J.: The International Best Track Archive for Climate Stewardship (IBTrACS), Unifying tropical cyclone best track data, available at: https://www.ncdc.noaa.gov/ibtracs/, last access: November 2020.
Knutson, T. R., McBride, J. L., Chan, J., Emanuel, K., Holland, G., Landsea, C., Held, I., Kossin, J. P., Srivastava, A. K., and Sugi, M.: Tropical cyclones and climate change, Nat. Geosci., 3, 157–163, https://doi.org/10.1038/ngeo779, 2010.
Klotzbach, P. J.: Trends in global tropical cyclone activity over the past twenty years (1986–2005), Geophys. Res. Lett., 33, L10805, https://doi.org/10.1029/2006GL025881, 2006.
Landsea, C. W.: Meteorology: Hurricanes and global warming, Nature, 438, E11–E12, https://doi.org/10.1038/nature04477, 2005.
Landsea, C. W.: Counting Atlantic tropical cyclones back to 1900, EOS T. Am. Geophys. Un., 88, 197–202, https://doi.org/10.1029/2007EO180001, 2007.
Landsea, C. W., Harper, B. A., Hoarau, K., and Knaff, J. A.: Can we detect trends in extreme tropical cyclones?, Science, 313, 452–454, https://doi.org/10.1126/science.1128448, 2006.
Mahala, B. K., Nayak, B. K., and Mohanty, P. K.: Impacts of ENSO and IOD on tropical cyclone activity in the Bay of Bengal, Nat. Hazards, 75, 1105–1125, https://doi.org/10.1007/s11069-014-1360-8, 2015.
Mann, H. B.: Nonparametric tests against trend, Econometrica, 13, 245–259, 1945.
Mann, M. E., Sabbatelli, T. A., and Neu, U.: Evidence for a modest undercount bias in early historical Atlantic tropical cyclone counts, Geophys. Res. Lett., 34, L22707, https://doi.org/10.1029/2007GL031781, 2007.
Mann, M. E., Woodruff, J. D., Donnelly, J., and Zhihua, Z.: Atlantic hurricanes and climate over the past 1,500 years, Nature, 460, 880–883, https://doi.org/10.1038/nature08219, 2009.
McLeod, A. I.: Kendall rank correlation and Mann-Kendall trend test, R Package Kendall, available at: http://btr0x2.rz.uni-bayreuth.de/math/statlib/R/CRAN/doc/packages/Kendall.pdf (last access: 18 November 2020), 2005.
Moon, I. J., Kim, S. H., and Chan, J. C.: Climate change and tropical cyclone trend, Nature, 570, E3–E5, 2019.
Nogueira, R. C., Keim, B. D., Brown, D. P., and Robbins, K. D.: Variability of rainfall from tropical cyclones in the eastern USA and its association to the AMO and ENSO, Theor. Appl. Climatol., 112, 273–283, https://doi.org/10.1007/s00704-012-0722-y, 2013.
Rayner, N. A. A., Parker, D. E., Horton, E. B., Folland, C. K., Alexander, L. V., Rowell, D. P., Kent, E. C., and Kaplan, A.: Global analyses of sea surface temperature, sea ice, and night marine air temperature since the late nineteenth century, J. Geophys. Res.-Atmos., 108, 4407, https://doi.org/10.1029/2002JD002670, 2003 (data available at: https://climexp.knmi.nl/start.cgi, last access: 15 November 2020).
Saunders, M. and Lea, A.: Large contribution of sea surface warming to recent increase in Atlantic hurricane activity, Nature, 451, 557–560, https://doi.org/10.1038/nature06422, 2008.
Tang, B. H. and Neelin, J. D.: ENSO influence on Atlantic hurricanes via tropospheric warming, Geophys. Res. Lett., 31, L24204, https://doi.org/10.1029/2004GL021072, 2004.
Trenberth, K. E.: Warmer oceans, stronger hurricanes, Sci. Am., 297, 44–51, 2007.
Trenberth, K. E. and Stepaniak, D. P.: Indices of El Niño Evolution, J. Climate, 14, 1697–1701, https://doi.org/10.1175/1520-0442(2001)014<1697:LIOENO>2.0.CO;2, 2001 (data available at: https://psl.noaa.gov/gcos_wgsp/Timeseries/Data/nino34.long.data, last access: 15 November 2020).
Trenberth, K. E. and Shea, D. J.: Atlantic hurricanes and natural variability in 2005, Geophys. Res. Lett., 33, L12704, https://doi.org/10.1029/2006GL026894, 2006.
Trenberth, K. E., Zhang, R., and the National Center for Atmospheric Research Staff (Eds.): The Climate Data Guide: Atlantic Multi-decadal Oscillation (AMO), available at: https://climatedataguide.ucar.edu/climate-data/atlantic-multi-decadal-oscillation-amo, last access: 10 January 2019.
Venables, W. N. and Ripley, B. D.: Modern Applied Statistics with S. Fourth edition, Springer, NY, USA, 2002.
Walsh, K. J., Camargo, S. J., Knutson, T. R., Kossin, J., Lee, T. C., Murakami, H., and Particular, C.: Tropical cyclones and climate change, Tropical Cyclone Research and Review, 8, 240–250, 2019.
Wang, C. and Lee, S. K.: Global warming and United States landfalling hurricanes, Geophys. Res. Lett., 35, L02708, https://doi.org/10.1029/2007GL032396, 2008.
Zhao, J., Zhan, R., Wang, Y., and Xu, H.: Contribution of the interdecadal Pacific oscillation to the recent abrupt decrease in tropical cyclone genesis frequency over the western North Pacific since 1998, J. Climate, 31, 8211–8224, https://doi.org/10.1175/JCLI-D-18-0202.1, 2018.