the Creative Commons Attribution 4.0 License.
the Creative Commons Attribution 4.0 License.
 | 14 Jan 2021
Lagrangian detection of precipitation moisture sources for an arid region in northeast Greenland: relations to the North Atlantic Oscillation, sea ice cover, and temporal trends from 1979 to 2017
Lilian Schuster
Fabien Maussion
Lukas Langhamer
Gina E. Moseley
Temperature in northeast Greenland is expected to rise at a faster rate than the global average as a consequence of anthropogenic climate change. Associated with this temperature rise, precipitation is also expected to increase as a result of increased evaporation from a warmer and ice-free Arctic Ocean. In recent years, numerous palaeoclimate projects have begun working in the region with the aim of improving our understanding of how this highly sensitive region responds to a warmer world. However, a lack of meteorological stations within the area makes it difficult to place the palaeoclimate records in the context of present-day climate. This study aims to improve our understanding of precipitation and moisture source dynamics over a small arid region located at 80∘ N in northeast Greenland. The origin of water vapour for precipitation over the study region is detected by a Lagrangian moisture source diagnostic, which is applied to reanalysis data from the European Centre for Medium-Range Weather Forecasts (ERA-Interim) from 1979 to 2017. While precipitation amounts are relatively constant during the year, the regional moisture sources display a strong seasonality. The most dominant winter moisture sources are the North Atlantic above 45∘ N and the ice-free Atlantic sector of the Arctic Ocean, while in summer the patterns shift towards local and north Eurasian continental sources. During the positive phases of the North Atlantic Oscillation (NAO), evaporation and moisture transport from the Norwegian Sea are stronger, resulting in larger and more variable precipitation amounts. Testing the hypothesis that retreating sea ice will lead to an increase in moisture supply remains challenging based on our data. However, we found that moisture sources are increasing in the case of retreating sea ice for some regions, in particular in October to December. Although the annual mean surface temperature in the study region has increased by 0.7 ∘C per decade (95 % confidence interval [0.4, 1.0] ∘C per decade) according to ERA-Interim data, we do not detect any change in the amount of precipitation with the exception of autumn where precipitation increases by 8.2 [0.8, 15.5] mm per decade over the period. This increase is consistent with future predicted Arctic precipitation change. Moisture source trends for other months and regions were non-existent or small.
- Article
(16235 KB) - Full-text XML
- BibTeX
- EndNote


The Arctic is known to be highly sensitive to changes in climate as a result of Arctic amplification, a process in which positive feedbacks act to amplify changes compared to the rest of the Northern Hemisphere (e.g. Dahl-Jensen et al., 1998; Miller et al., 2010). Between 1875 and 2008, surface air temperature north of 60∘ N increased at twice the pace of the Northern Hemisphere average (e.g. Bekryaev et al., 2010), with the winter season being the most affected because of the delayed onset of sea ice resulting in a loss of heat from the open ocean to the atmosphere (e.g. Screen and Simmonds, 2010; Bintanja and Van der Linden, 2013).
These temperature changes are expected to be accompanied by precipitation changes (e.g. Collins et al., 2013; Bintanja and Andry, 2017). Within the Arctic, the greatest increases in precipitation are simulated over the Arctic Ocean and northeast Greenland by the end of this century, with up to 50 % increase in an RCP8.5 scenario (Bintanja and Selten, 2014). Generally, enhanced precipitation predictions in the Arctic may be explained by the increase in surface temperature (Collins et al., 2013), which is accompanied by a predicted increase in moisture transport towards the Arctic that reaches a maximum during summer months, when meridional temperature and moisture gradients are at their maximum (e.g. Bintanja and Selten, 2014). However, whilst the absolute values of moisture transported to the Arctic are expected to increase, the relative contribution of remote sources will diminish in comparison to locally sourced moisture, which will be enhanced due to increased surface evaporation from open ice-free Arctic waters in late autumn–winter (e.g. Bintanja and Selten, 2014).
Strong sea ice loss in the Greenland Sea (Onarheim et al., 2018; Bliss et al., 2019) and the expected changes in local evaporation and temperature are likely to impact the climate of northeast Greenland. Average winter surface temperatures there have risen by as much as 4 to 5 ∘C over the last 50 years (GISTEMP Team, 2016; Shepherd, 2016), and model projections indicate that northeast Greenland will be one of the terrestrial areas with the highest temperature changes (Koenigk et al., 2013; GISTEMP Team, 2016; Shepherd, 2016). Simulations of the Greenland Ice Sheet during the last interglacial suggest that the northeast sector is most vulnerable to increases in temperature because of a strong ice–elevation feedback that is further hampered by low accumulation rates (Born and Nisancioglu, 2012).
Therefore, climate and palaeoclimate research activities in northeast Greenland have increased in recent years in response to various needs to improve fundamental understanding of the climate and environment of this highly sensitive region. For example the dynamics of the Northeast Greenland Ice Stream and its interaction with the Atlantic Ocean via freshwater forcing are investigated with the NEGIS project (NEGIS project, 2020). “EastGRIP” (EastGRIP, 2018) has been drilling and analysing an ice core in order to improve understanding of ice stream dynamics and their role in future sea-level change. Finally, new research into speleothems in northeast Greenland by the Greenland Caves Project is aiming to improve knowledge of past climates and environments in this region in a warmer world (Moseley, 2016).
Unfortunately, a lack of stations north of 70∘ N does, however, limit our understanding of the evolving hydrological regime (e.g. Kattsov and Walsh, 2000; Kurita, 2011; Bintanja and Selten, 2014). Climatological moisture source studies have thus far tended to concentrate on the Greenland Ice Sheet (30 selected winter months; Sodemann et al., 2008a, b) using the ERA-40 dataset, whereas Nusbaumer et al. (2019) separated Greenland moisture sources into four sectors but focused mainly on northwest Greenland using water tracers from the Goddard Institute for Space Studies climate model and MERRA2 horizontal winds (mean of 1980–2015). Therefore, the purpose of this study is to specifically analyse precipitation and moisture sources over one of the most sensitive areas of the Arctic, northeast Greenland. Although this study focuses on an arid study region around the field site of the Greenland Caves Project (80∘ N, 22∘ W, 740 m a.s.l.) and hence gives a direct background for interpreting palaeoclimate data from these caves, its results will also address a fundamental knowledge gap for many other research activities in the region.
Methodologically, moisture sources are diagnosed from the European Centre for Medium-Range Weather Forecasts (ECMWF) ERA-Interim reanalysis dataset applying the Lagrangian moisture source diagnostic by Sodemann et al. (2008a) with the adjustment of the planetary boundary layer (PBL) height according to Langhamer et al. (2018). In addition, we analyse the annual cycle of precipitation amount and moisture source and investigate whether or not distinctive changes can be detected in relation to the North Atlantic Oscillation, in the changing sea ice cover and temperature over the 39-year period, 1979–2017. Given the predicted increase in precipitation, the increase in temperature, and the reduction in sea ice that have already taken place within the Arctic, we attempt to establish whether noticeable changes in precipitation amount and moisture source can already be detected as well.
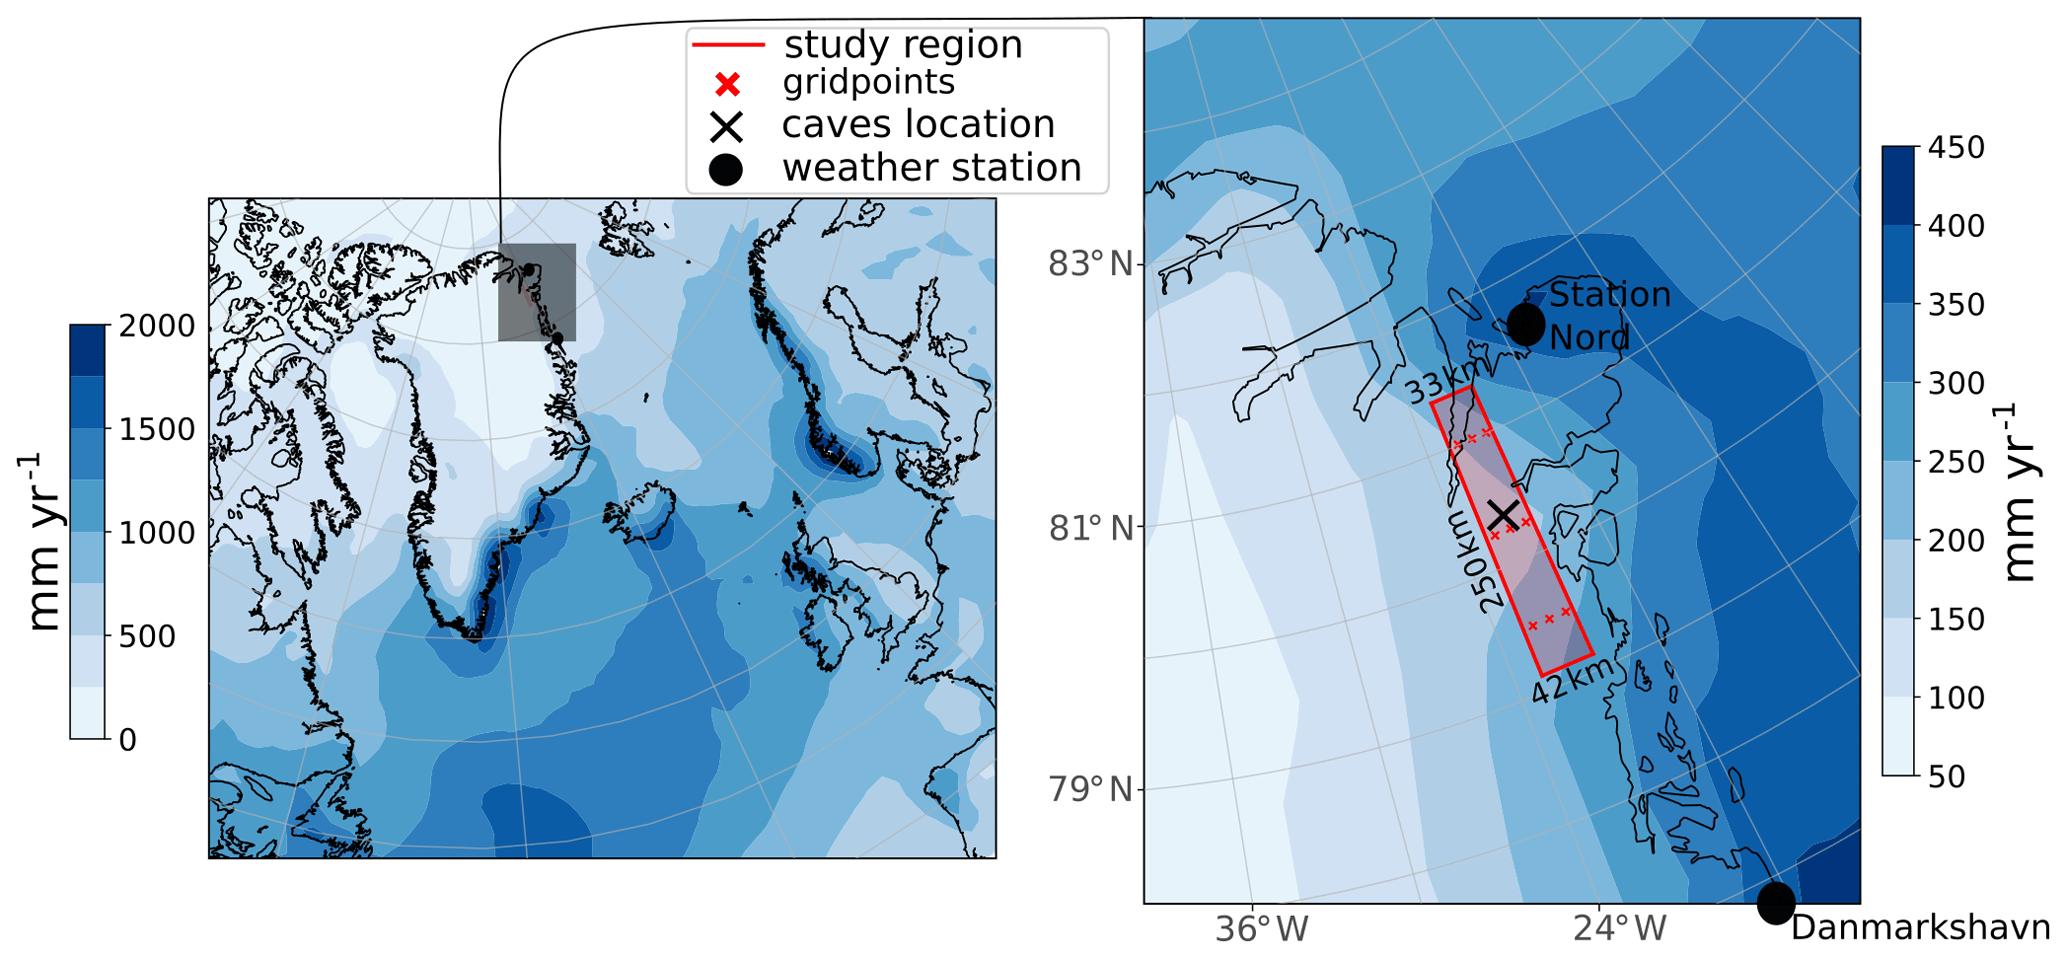
Figure 1Average of yearly ERA-Interim precipitation (1979–2018). The study region is depicted with the nine grid points located between 22.5 and 21∘ W and between 79.5 and 81∘ N. The exact location of the studied caves is (80.3745∘ N, 21.7419∘ W). Average precipitation in the study region is 207 mm yr−1 (95 % confidence interval of [192, 224] mm yr−1).
2.1 Reanalysis data
In this study, reanalysis data from the European Centre for Medium-Range Weather Forecasts (ERA-Interim) were used (Berrisford et al., 2011; Dee et al., 2011; Owens and Hewson, 2018) for both precipitation and moisture source estimates. ERA-Interim has a fully revised humidity scheme and higher spatial resolution (∼79 km) than ERA-40, which was used by Sodemann et al. (2008a) to compute Greenland winter precipitation sources. The even newer ERA5 reanalysis data were not yet available at the time we conducted these analyses. The study region (79.5–81∘ N, 21–22.5∘ W, Figs. 1 and 2) consists of nine grid points with a horizontal resolution of 0.75∘, which are located around the caves in northeast Greenland. Several grid points were chosen to smooth out local inhomogeneities. The ERA-Interim dataset is used in the time span of February 1979–May 2017 for which we computed the Lagrangian diagnostics. For the temporal precipitation trends and for the total average precipitation the time period was extended to January 1979–December 2018. For the estimates of moisture source trends, the period was shortened to January 1980–December 2016 in order to cover full years only. To estimate the moisture sources of the study region by the Lagrangian moisture source diagnostic (Sect. 2.2), 6-hourly specific humidity, 3D-wind field, surface pressure, PBL height, and 2 m temperature were used. Moisture sources over land and ocean are distinguished by using the land–sea mask of ERA-Interim on the same 0.75∘ grid. For each grid point, the monthly sea ice area was computed by multiplying the ERA-Interim sea ice fraction (0–1) by the latitudinally weighted grid point area. To classify grid points into land, ocean, and sea ice, a threshold of 0.5 was set for the fractional land–sea mask and sea ice fraction.
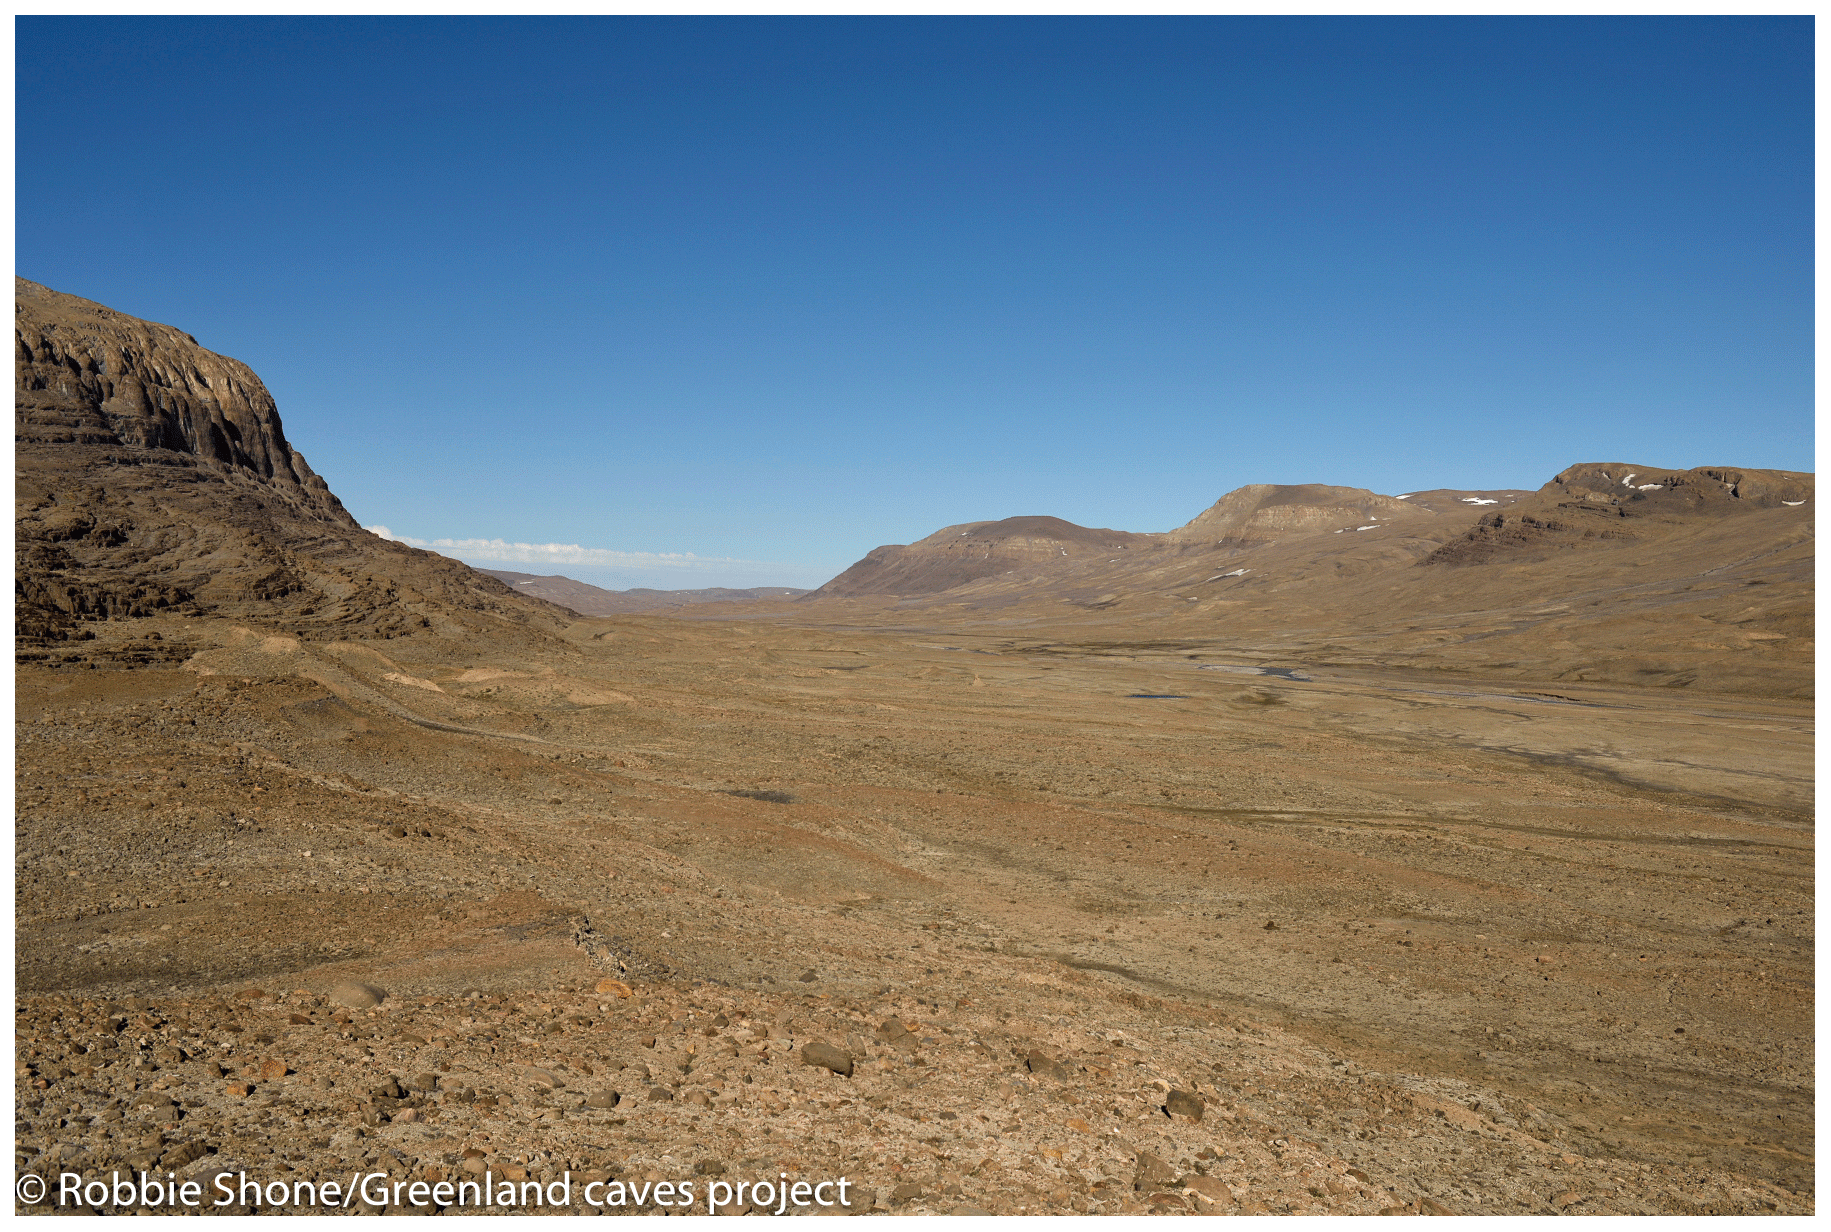
Figure 2Photograph from the arid study region near to the location of the caves, © Robbie Shone/Greenland Caves Project (August 2015).
In addition, relations between precipitation and its moisture sources to other ERA-Interim parameters were examined. These are the sea ice area, the mean 500 hPa geopotential height, and the vertically integrated water vapour transport (sum of the integrated northward and eastward cloud liquid, cloud frozen, and water vapour transport). To relate precipitation and moisture source variability to large-scale teleconnection patterns, we computed correlations to the monthly NAO index data from the National Oceanic and Atmospheric Administration climate prediction centre (NOAA, 2020a).
2.2 Trajectory calculation and Lagrangian moisture source diagnostic
To compute the motion of air parcels, 15 d backward trajectory calculations by the Lagrangian Analysis tool LAGRANTO version 2.0 (Sprenger and Wernli, 2015), first version by Wernli and Davies (1997), were realised every 6 h from February 1979 to May 2017 based on the ERA-Interim dataset. Trajectories start at the node of the 0.75∘ regular grid of the study region (nine grid points, Fig. 1) on 11 vertical levels from the surface to a height of 500 hPa (Δp=49.9 hPa). This corresponds to 99 trajectories per time step. Afterwards, the trajectories that are not leading to precipitation in the study region were filtered out. The requirements for the selected trajectories were that relative humidity exceeded 80 % and specific humidity (q) decreased in the last time step (Sodemann et al., 2008a).
Evaporation and precipitation of precipitation trajectories are identified by temporal changes in specific humidity (Δq). Using the assumption of a well-mixed PBL, the moisture content of air parcels increases within the PBL in case of a positive Δq. According to Sodemann et al. (2008a), moisture uptakes that occur above the PBL, however, are detached from the surface and are assumed to be explained by physical or numerical processes, e.g. convection, evaporation of precipitating hydro-meteors, change of liquid water content or ice water content, subgrid-scale turbulent fluxes, numerical diffusion, and errors or physical inconsistencies. Along each trajectory, moisture uptake locations inside the PBL are weighted by their contribution to the total precipitation in the study region by taking en route precipitation into account. Each moisture uptake is interpolated on a 1∘ grid and we calculate the monthly means on this basis.
The marine PBL height can vary on small scales and is often underestimated in numerical weather prediction models (Zeng et al., 2004). Therefore, the same as in Sodemann et al. (2008a), the threshold for a moisture source location inside the PBL height is lifted by a factor of 1.5. Similar to Langhamer et al. (2018), the height of the PBL was converted in our study into pressure coordinates by applying the barometric formula with surface pressure and temperature as free variables (and a constant temperature lapse rate of 0.0065 K m−1) and we also did not use any minimum moisture uptake threshold in contrast to Sodemann et al. (2008a).
The Lagrangian evaporation sum that contributed to precipitation in the study region correlates very well with the total precipitation over the study region from ERA-Interim, indicating that the method is able to reproduce the variability of precipitation with the detection efficiency being roughly independent of the monthly precipitation (Fig. 3). A total of 48 % of the total moisture sources could be assigned to specific evaporation locations with the applied Lagrangian moisture source diagnostic. For comparison, similar studies by Sodemann and Zubler (2010) in the European Alps and Langhamer et al. (2018) in Patagonia reached 50 % and 71 % attribution, respectively. The remaining moisture sources could not be identified to evaporation at the surface (moisture uptake above PBL) or were unidentifiable. There is no clear annual cycle visible in the attribution: the fraction ranges from a minimum of 41 % in August to a maximum of 57 % in June (Fig. 4). Specifically in summer, precipitation in the study region varies more than its attributed moisture sources. We discuss the possible implications of these uncertainties in Sect. 5.4.
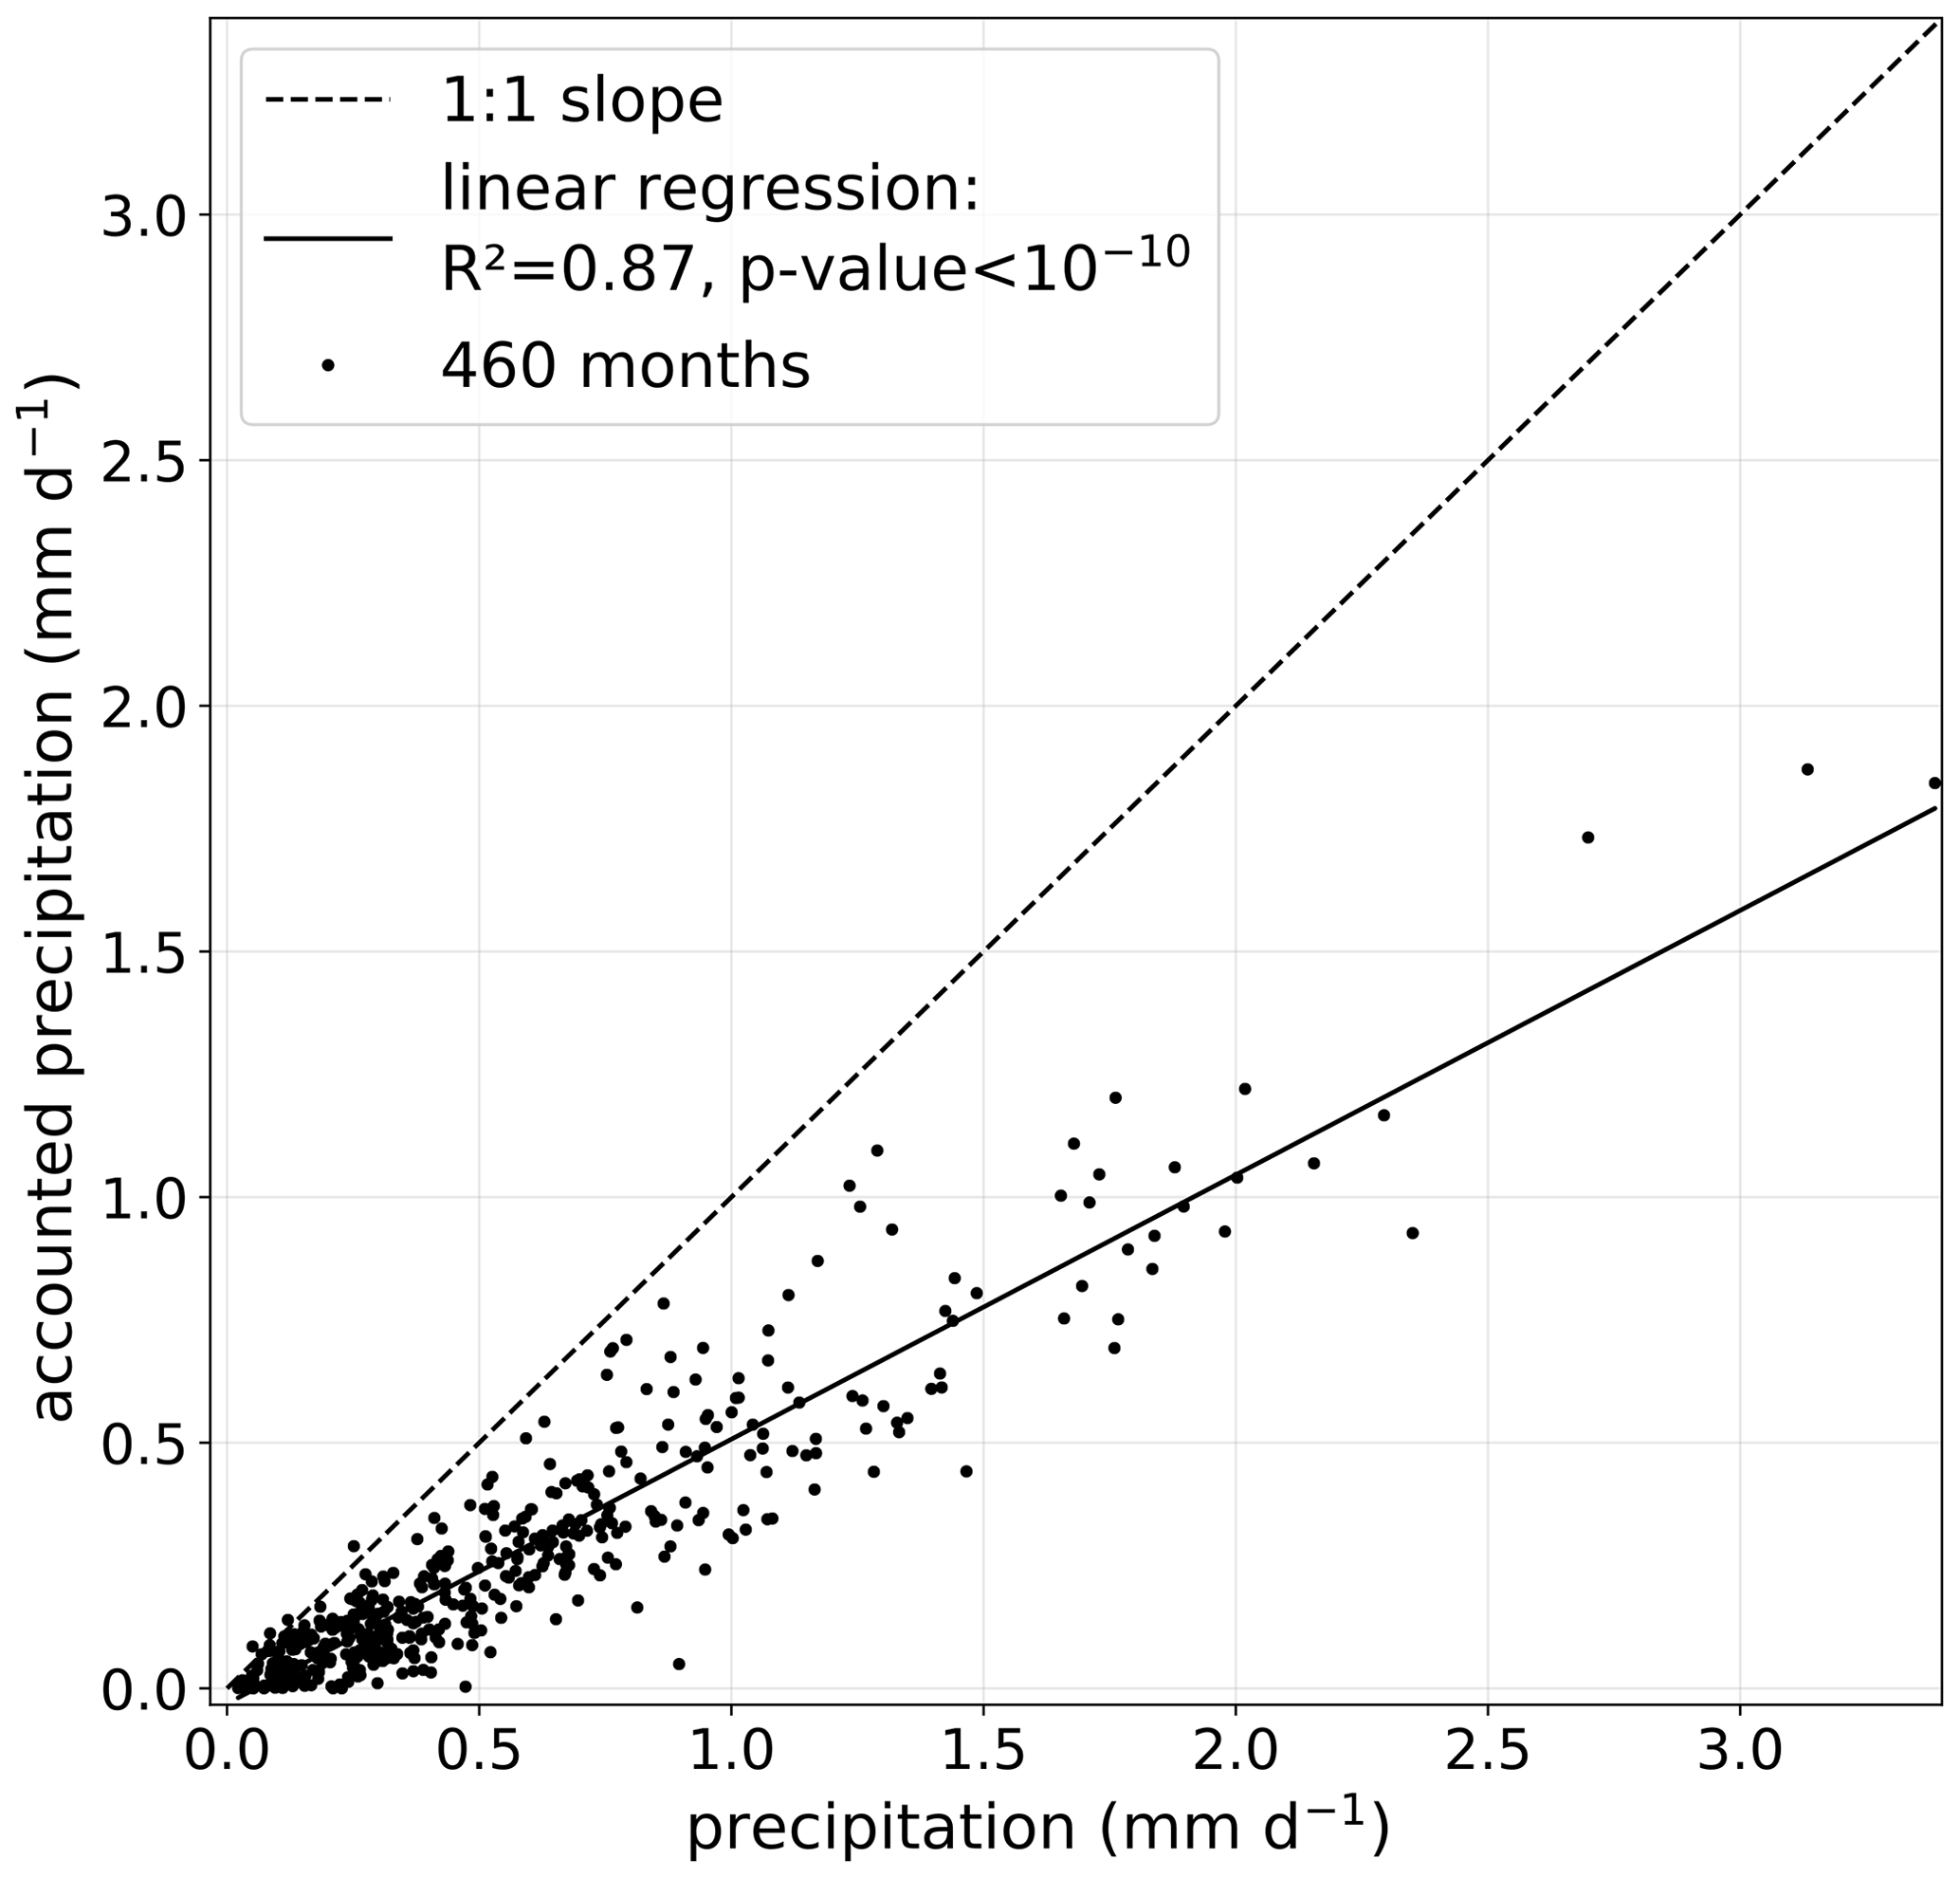
Figure 3Scatterplot of accounted precipitation (summed-up attributed contributing evaporation from the Lagrangian moisture source diagnostic, mean: 0.27 [0.25, 0.30] mm d−1) against total precipitation in study region (mean: 0.56 [0.52, 0.61] mm d−1) for all months (February 1979–May 2017 using ERA-Interim).
2.3 Statistical methods
To compute confidence intervals of our trends and averages, we estimate the 95 % confidence intervals of the mean or median (significance level of 0.05) without assuming a parametric distribution by using the bootstrapping method (Wilks, 2011). This is done because some subsets of daily precipitation averaged over a month as well as other related parameters reject the null hypothesis that their distributions are drawn from a normal distribution using a Shapiro–Wilk normality test (Wilks, 2011). To describe the uncertainties, these 95 % confidence intervals of the values are indicated in brackets [ , ] behind the actual value. Therefore, significant differences in the mean of two values occur at the 5 % significance level if the 95 % confidence intervals do not overlap.
For the climate indices, months with exceptionally low NAO values (below the 25th percentile) are herein referred to as NAO−. Months with exceptionally high NAO values (above the 75th percentile) are herein referred to as NAO+. NAO values that fall between the lower and upper quartile are referred to as NAO neutral. This classification is either done for all months together (NAO 25 % and 75 % threshold: [−0.67, 0.77]), or in the case of the annual cycle separate thresholds for each month of the year were computed (e.g. for August [−1.17, 0.67], for December [−0.46, 0.84], for April [−0.63, 1.01], and for May [−0.92, 0.57]). To measure the association between two variables, we mostly use Spearman's rank correlation coefficient instead of the Pearson correlation coefficient, as it reflects the strength of a monotonic relationship instead of a linear relationship and is therefore more robust to outliers (Wilks, 2011).
3.1 Mean and annual cycle of precipitation
According to ERA-Interim, for the period February 1979–May 2017, the mean precipitation is 207 [192, 224] mm yr−1 averaged over the study region. At the nearest grid point to the caves, it is slightly drier with 171 [158, 185] mm yr−1. The North Atlantic cyclone track decays northward (Serreze and Barry, 2014), and up to 10 times less precipitation occurs in northeast Greenland than on the southeast coast (Fig. 1). As is typical for regions with little precipitation (e.g. Pendergrass and Knutti, 2018), few events bring most of the total precipitation. On average, the 5 wettest days in a year produce 24 % and around 16 d produce 50 % of the total annual precipitation in the study region. Precipitation can happen throughout the year, but May and June are slightly drier on average whereas September is wettest (Fig. 4). September is the wettest month for 9 of 40 years, June is the driest month for 6 of 40 years, and April is the driest month for 8 of 40 years. September (as the wettest month) has the greatest variability (interquartile range of 0.30–1.24 mm d−1), whereas June (as the driest month) displays the least variability (interquartile range of 0.14–0.30 mm d−1). April also shows a large variability (interquartile range of 0.10–0.80 mm d−1) and is the month with the most positively skewed monthly precipitation distribution.
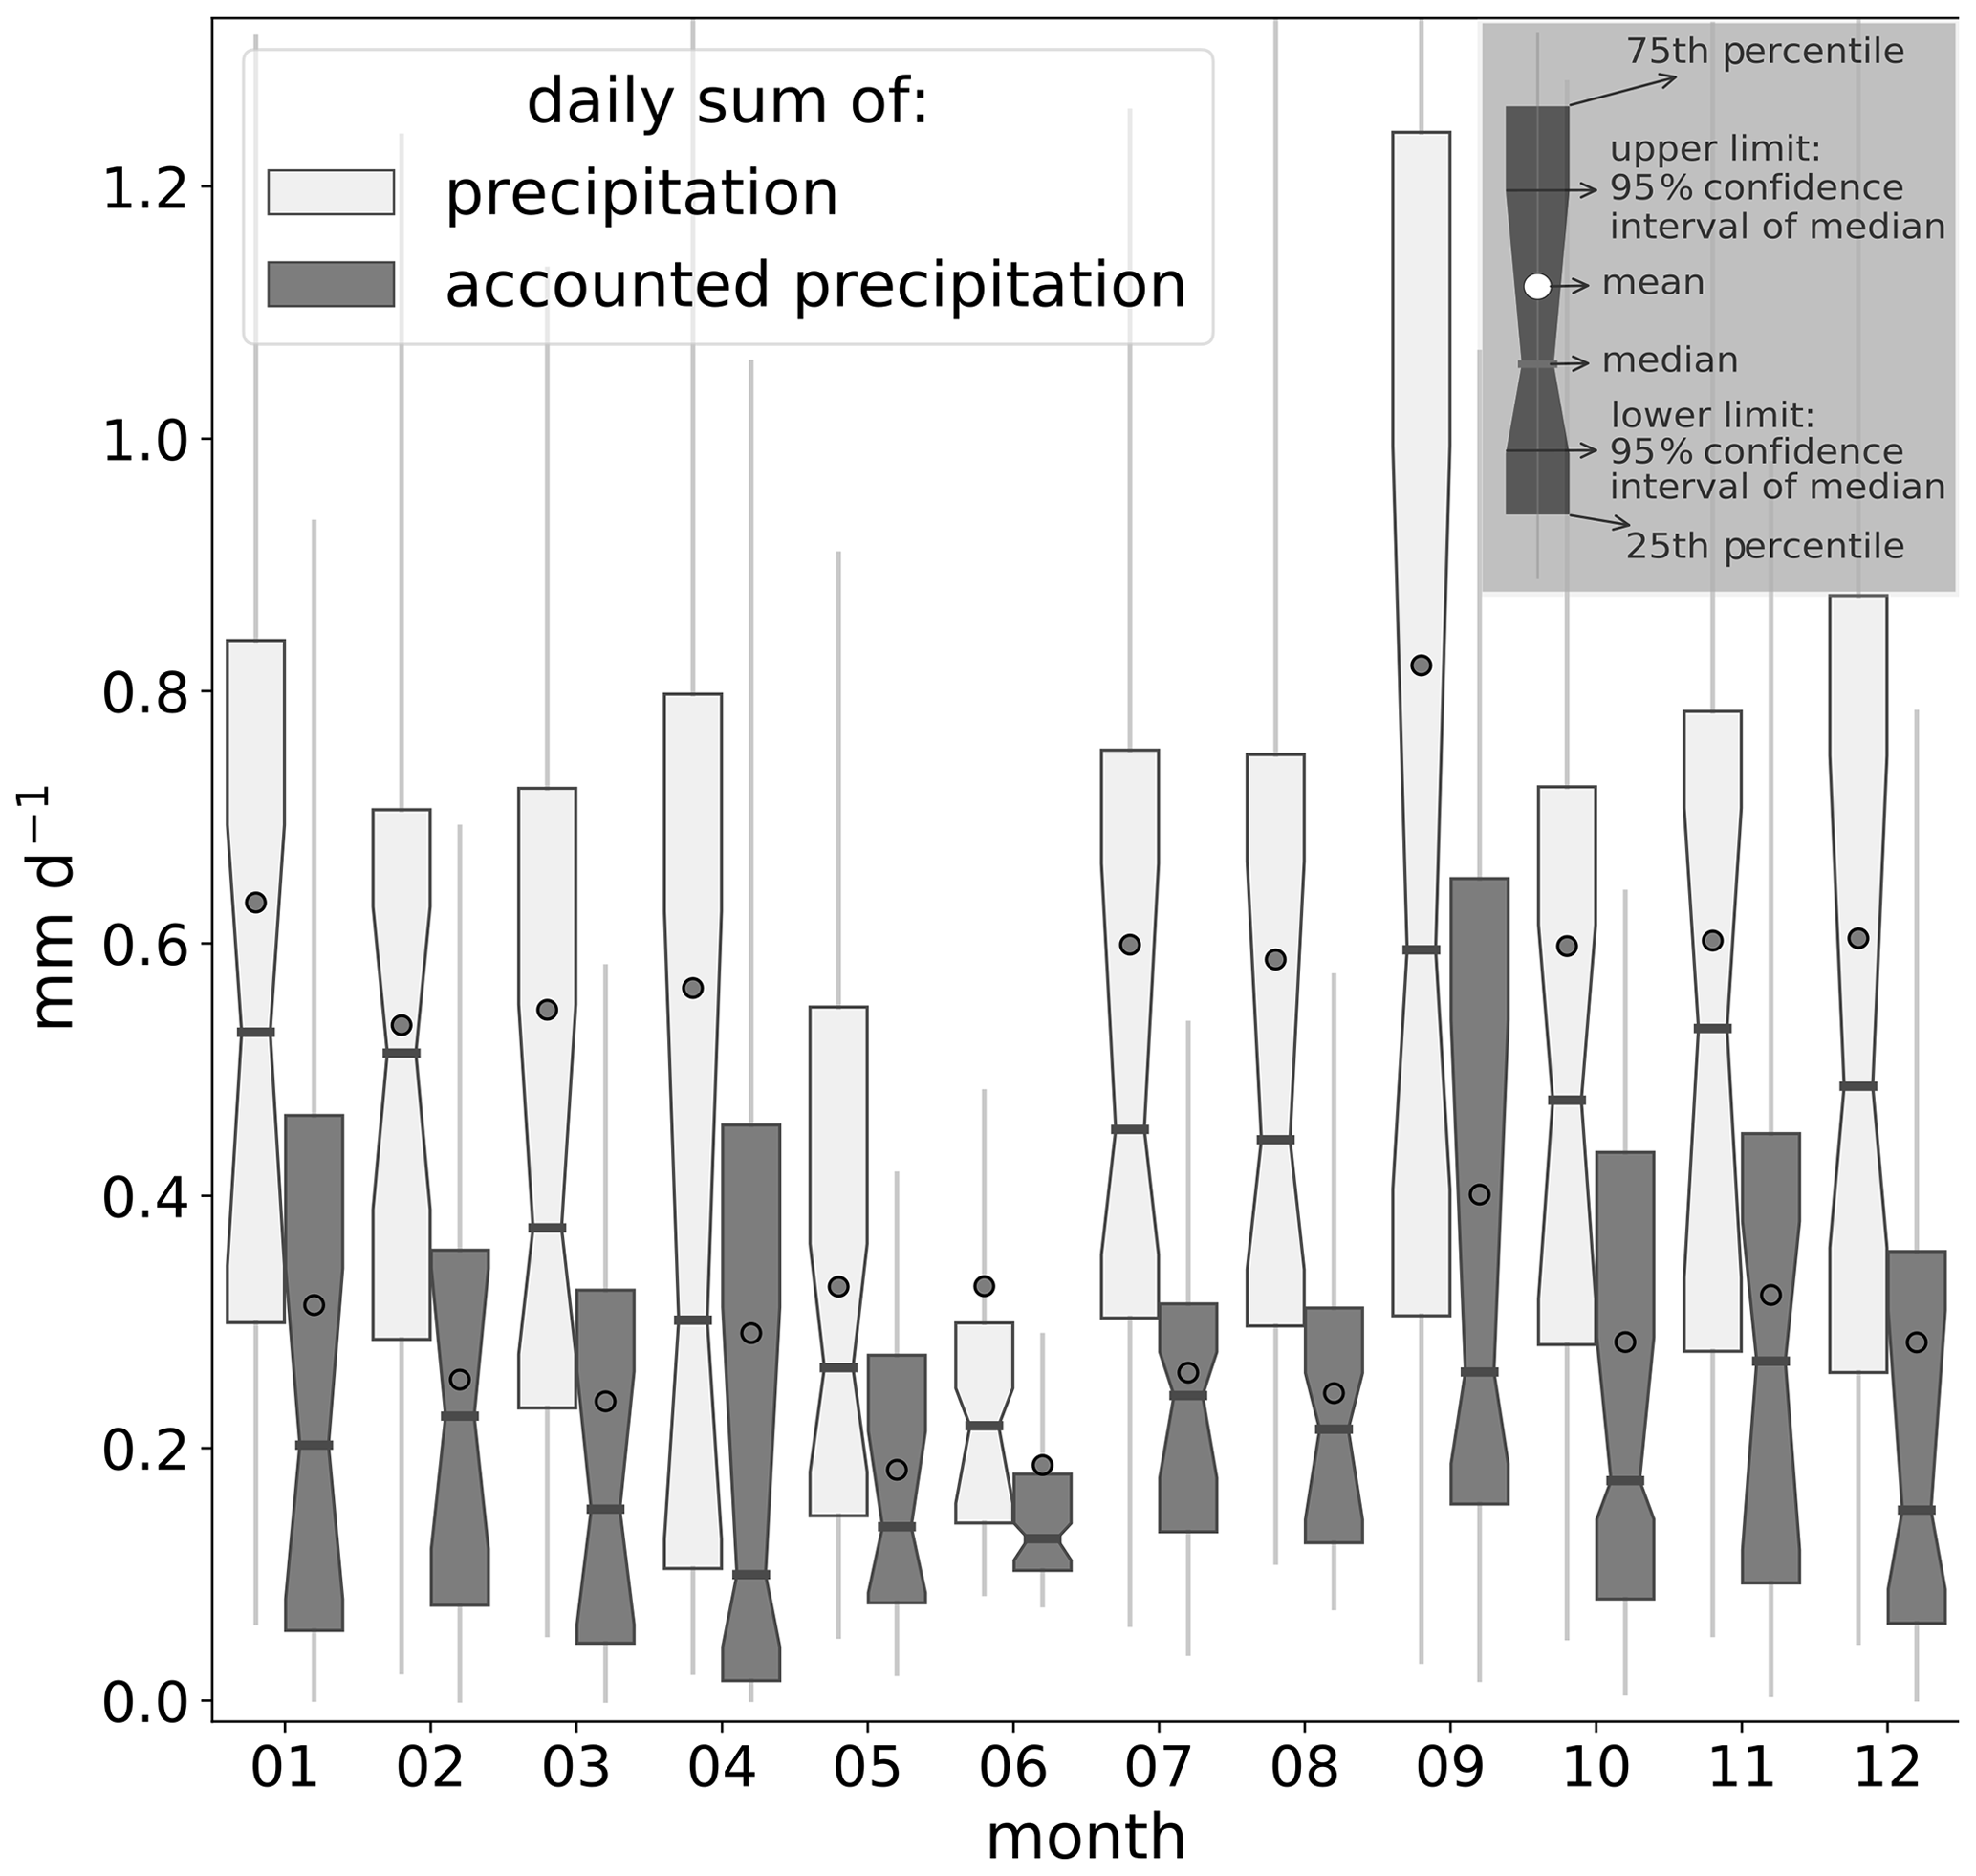
Figure 4Box plots show the annual cycle of precipitation and accounted precipitation (summed-up attributed contributing evaporation from the Lagrangian moisture source diagnostic) in the study region for all months (February 1979–May 2017 using ERA-Interim).
3.2 Mean and annual cycle of moisture sources
Contributing moisture sources display a strong seasonality in magnitude and location (Fig. 5). In winter, most moisture sources are located over the North Atlantic above 45∘ N and the ice-free Atlantic sector of the Arctic Ocean with a maximum between Scandinavia and Svalbard. This maximum is most pronounced in January and then gradually diminishes until May. Starting with May, local moisture sources (from the study region or its direct surrounding) begin to contribute to precipitation and peak in June. In July, moisture sources mostly come from land areas over the north Eurasian continent. September has the minimum amount of sea and land ice and represents a transitional phase, where there are both land sources over Scandinavia and the majority of ocean sources over the North Atlantic. This could be a possible indicator why precipitation is strongest in September (Fig. 4). From October, the pronounced maximum over the Norwegian Sea appears again with minimal contributions from land.
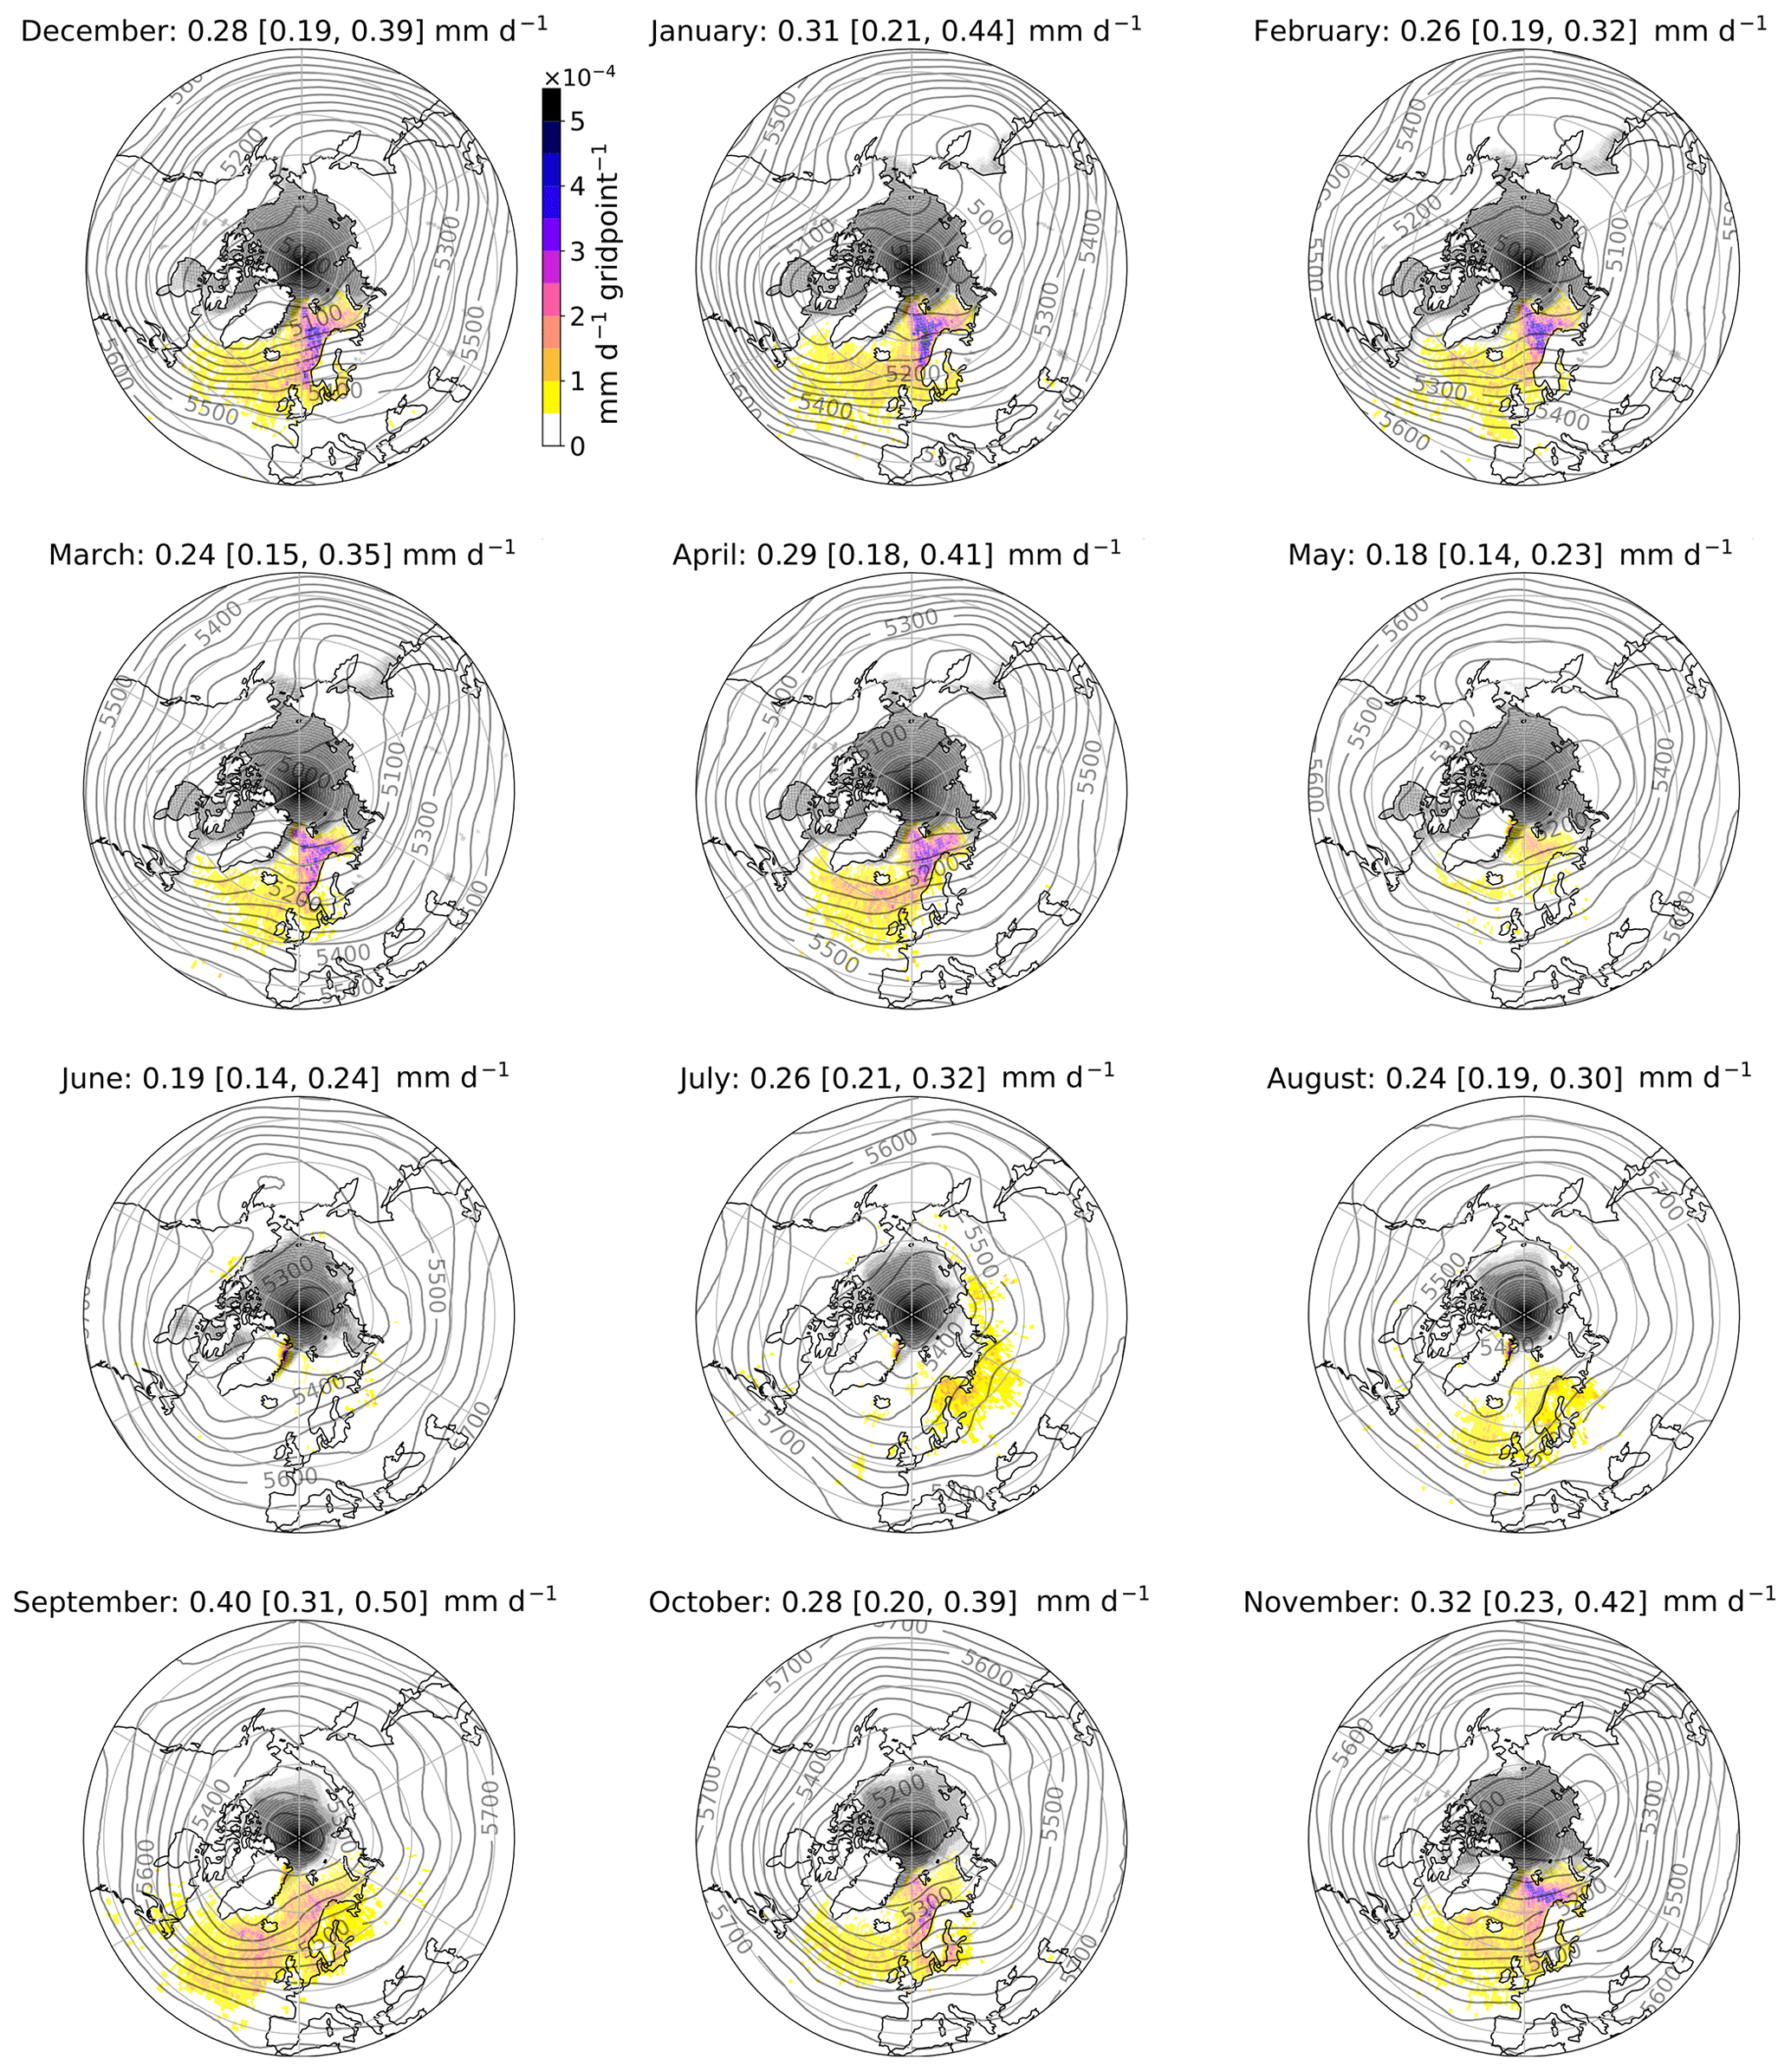
Figure 5Annual cycle of mean monthly attributed moisture sources contributing to precipitation in study region over the period February 1979–May 2017 (grid points coloured after their contribution between 35–90∘ N, contributions <3 % further southward). The mean sum of moisture sources over all grid points (i.e. accounted precipitation) is given for each month with its 95 % confidence interval and is only a part of the total precipitation (Fig. 4). Mean 500 hPa geopotential height (grey lines) and mean ice area cover (grey shaded area) are depicted.
The gradual transition from more North Atlantic, North Sea, Norwegian Sea, and Barents Sea contributing moisture sources in winter to more local and continental Scandinavian and Eurasian contributions in summer can be partially explained by changes in the geopotential height of the 500 hPa surface (Fig. 5). The zonal geostrophic flow south of Greenland is stronger in winter than in summer, as shown by the stronger gradient of the geopotential height. The westerly zonal flow weakens in summer, specifically in June, which could explain why June has the smallest and least variable precipitation.
Another way to describe moisture transport is to look at the integrated water vapour transport (IVT, mean annual cycle in Fig. 6). Moist air masses from the North Atlantic are transported northeastward to the Scandinavian coast. By the influence of polar easterlies, moist air masses over the Norwegian Sea seem to be transported in the direction of northeast Greenland. This emphasises why the maximum of moisture source contribution is diagnosed over the Norwegian Sea for most months. Evaporation over the Arctic Ocean seems to be prevented by sea ice, and in summer, a gradual transition occurs towards more IVT in the Arctic. In June, IVT is larger close to the study region, which is an indicator for the more local moisture sources found by the Lagrangian moisture source diagnostic (Fig. 5). Furthermore, from July till September there is generally larger IVT over the Eurasian continent. This coincides with the large fraction of contributing moisture sources over the north Eurasian continent found by the Lagrangian diagnostic in these months.
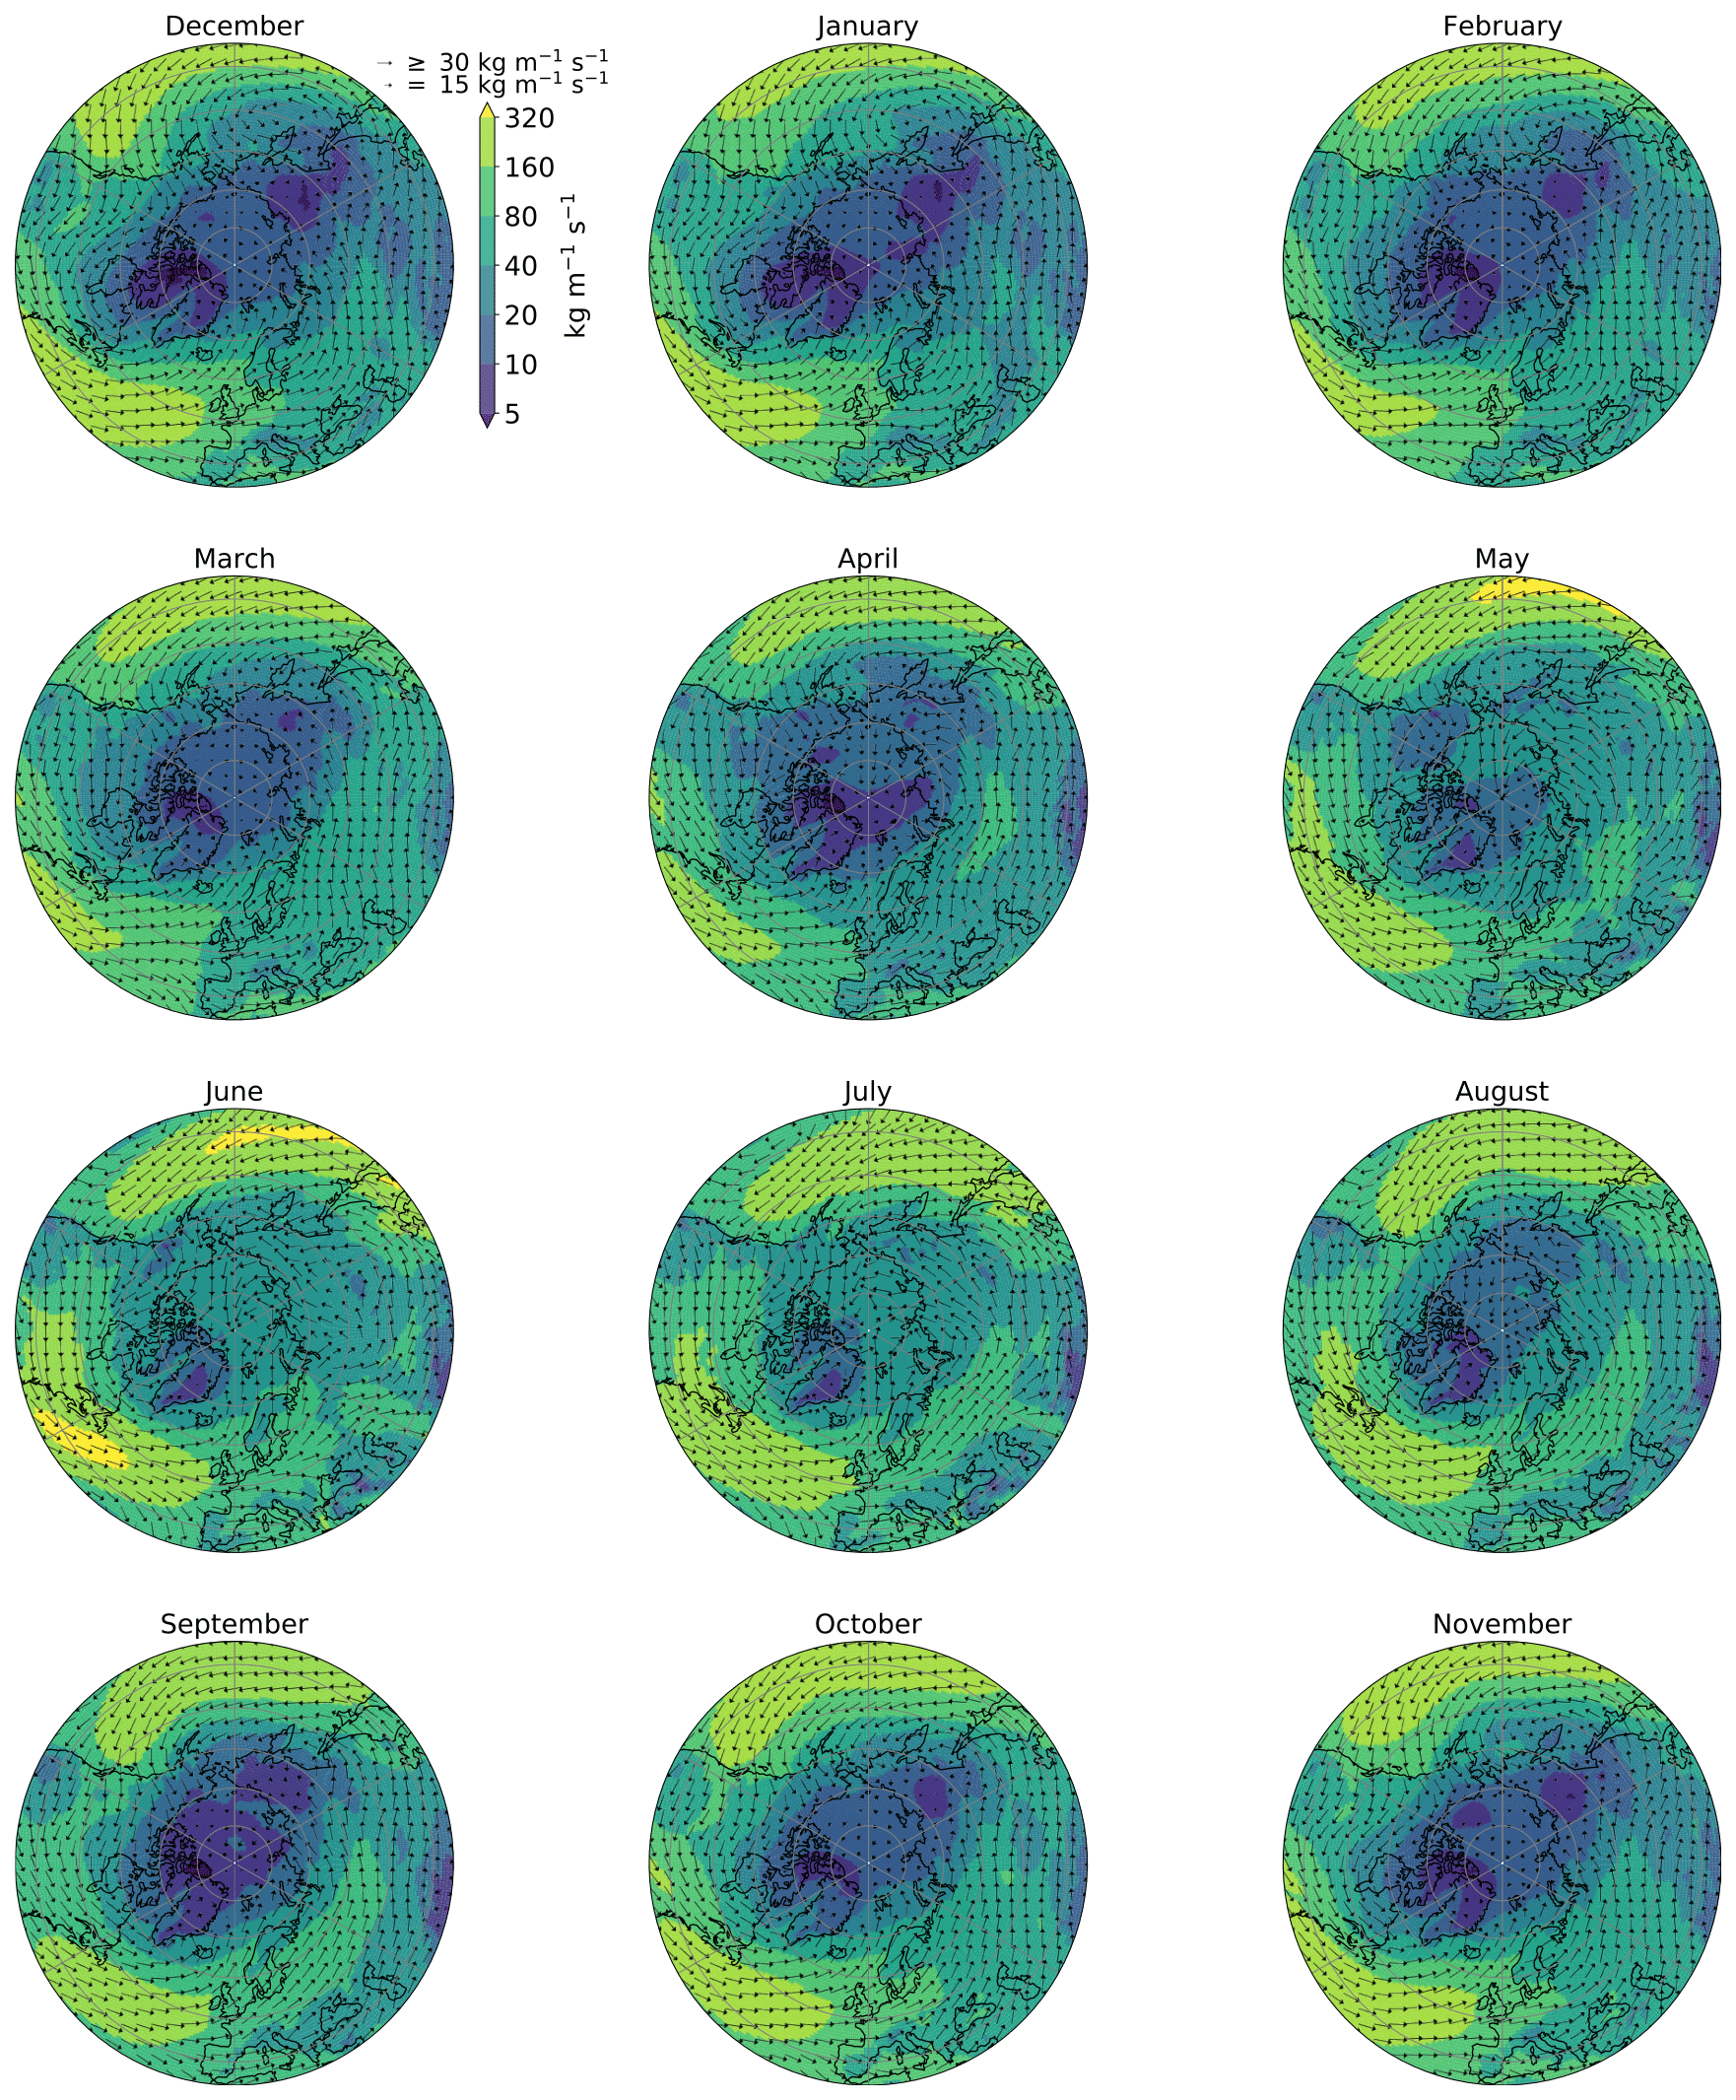
Figure 6Annual cycle of integrated water vapour transport (ERA-Interim monthly mean of February 1979–May 2017) (35–90∘ N). The magnitude of IVT is depicted by the colours (note the uneven colour scale) and the arrows indicate the IVT direction. The same scale is applied for each month. For grid points with IVT < 30 kg m−1 s−1 only, the arrow length also depicts the IVT magnitude.
3.2.1 K-means clustering of moisture contributions
To analyse regional contributions of moisture sources, different moisture source regions were defined by applying a classification algorithm (K-means clustering; e.g. Wilks, 2011). K-means clustering separates data in samples grouped after their similarities. In our case, we estimated similarity by first selecting the grid points that have contributed moisture sources over the study period and then computing the percentage of each grid point's moisture source contribution to the total mean precipitation for each month of the year. Therefore, a table of 24 051 grid points × 12 months (where ∑ grid points = 100 %) was fed to the algorithm (here sklearn; Pedregosa et al., 2011). The algorithm then separates the grid points in a user-chosen number of clusters, here based on the annual cycle of relative moisture source contribution to precipitation in the study region.
The raw output of the K-means clustering is plotted in Fig. 7a. Although the grid points' locations were not included in the algorithm, the clusters mostly cover homogeneous areas, which means that grid points that are close to one another display a similar behaviour in the relative moisture source contribution throughout the year. The algorithm recognises the features of cluster formations from Fig. 5: the green-coloured cluster corresponds to the area of a pronounced maximum in moisture sources for most months, and the cyan-coloured cluster corresponds to the local sources in summer directly above the study region. The K-means clustering algorithm separated the grid points into clusters displaying significantly different behaviour with respect to the 95 % confidence interval (Fig. 7b and c). The number of five distinct clusters shown here was chosen because it produced the best compromise between differentiating behaviour patterns and still having significantly different clusters. Another algorithm, spectral clustering (also available in sklearn; Pedregosa et al., 2011), produced similar results.
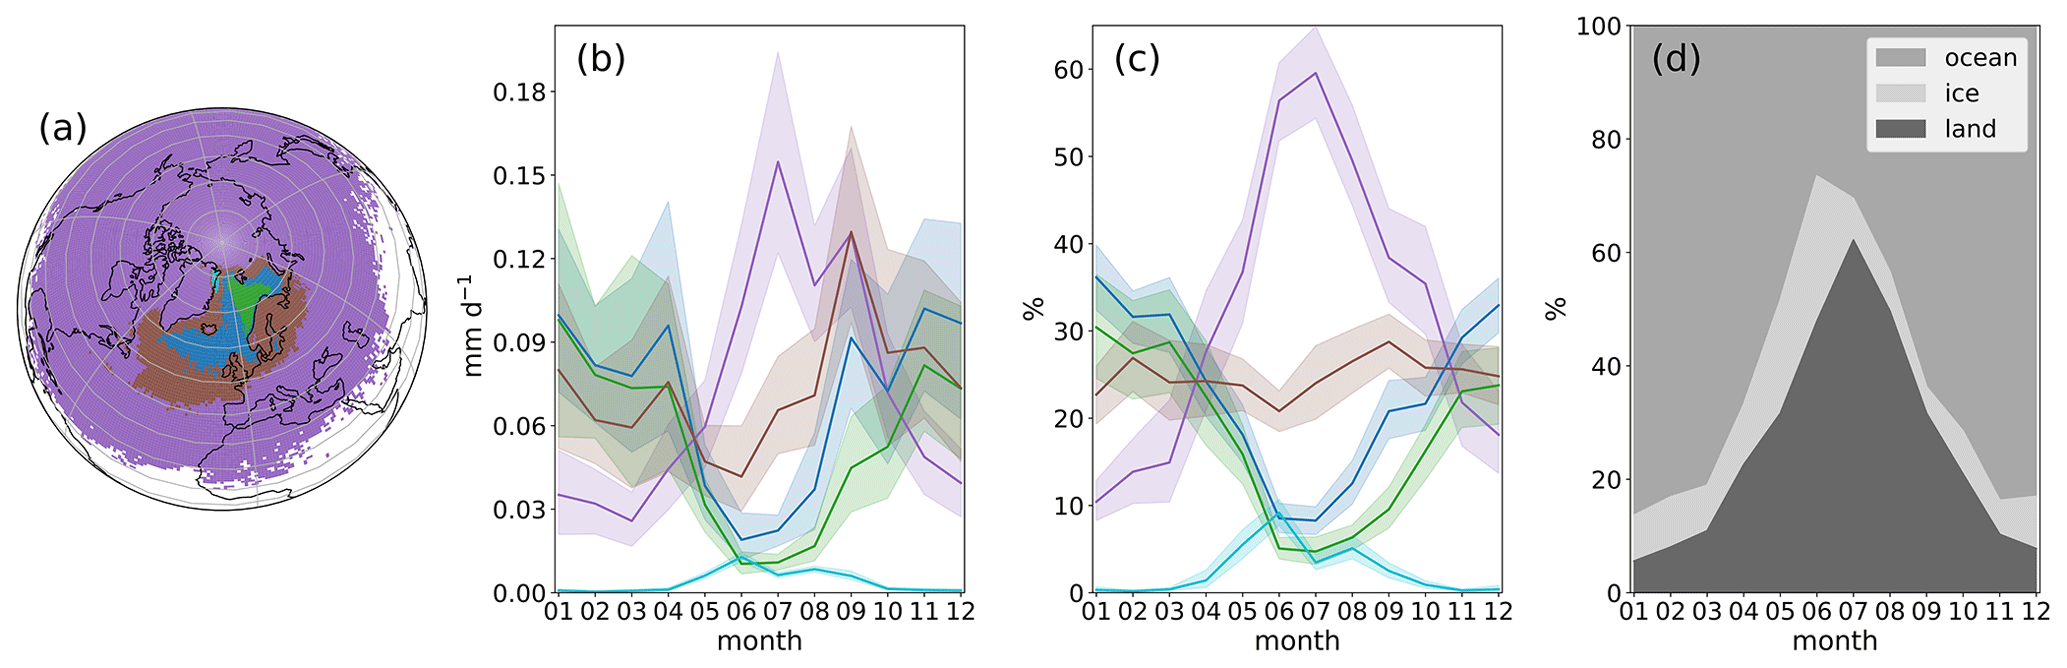
Figure 7(a) K-means clustering of grid points into five clusters. The annual cycle of mean contributing moisture sources to the precipitation in the study region is plotted for each cluster in (b) absolute and (c) relative number. Shaded areas represent the 95 % confidence interval of the mean. In (d), relative moisture source contributions from the ice-free ocean (sea ice concentration < 0.5), the sea ice (sea ice concentration ≥ 0.5), and the land areas (same thresholds for land–sea mask) are depicted. The values for the sea ice concentration and hence the sea ice areas change throughout the months and years.
In winter, moisture sources over land contribute minimally (in January ∼6 %); however, in summer, the majority of moisture sources come from land regions (in July ∼62 %, Fig. 7d). The moisture source contribution of sea ice areas is relatively low but highest in June (23 %, Fig. 7d). As June is the driest month with the highest contribution of local moisture sources (Fig. 7), there is an indication that evaporation over sea ice close to the study region is contributing to precipitation in the study region. However, if those grid points are chosen that are defined with a sea ice concentration equal to or above 0.9 (instead of 0.5; see Sect. 2.1), the contributions in all months decrease to a maximum of 15 % in June and are in most other months around 3 % (not plotted). Hence, large parts of contributing evaporation over a defined sea ice area occur over those grid points where the total area of the grid point is partially sea ice covered. Note that sea ice areas as defined in Fig. 7d (grid points with sea ice concentration ≥ 0.5) change from month to month.
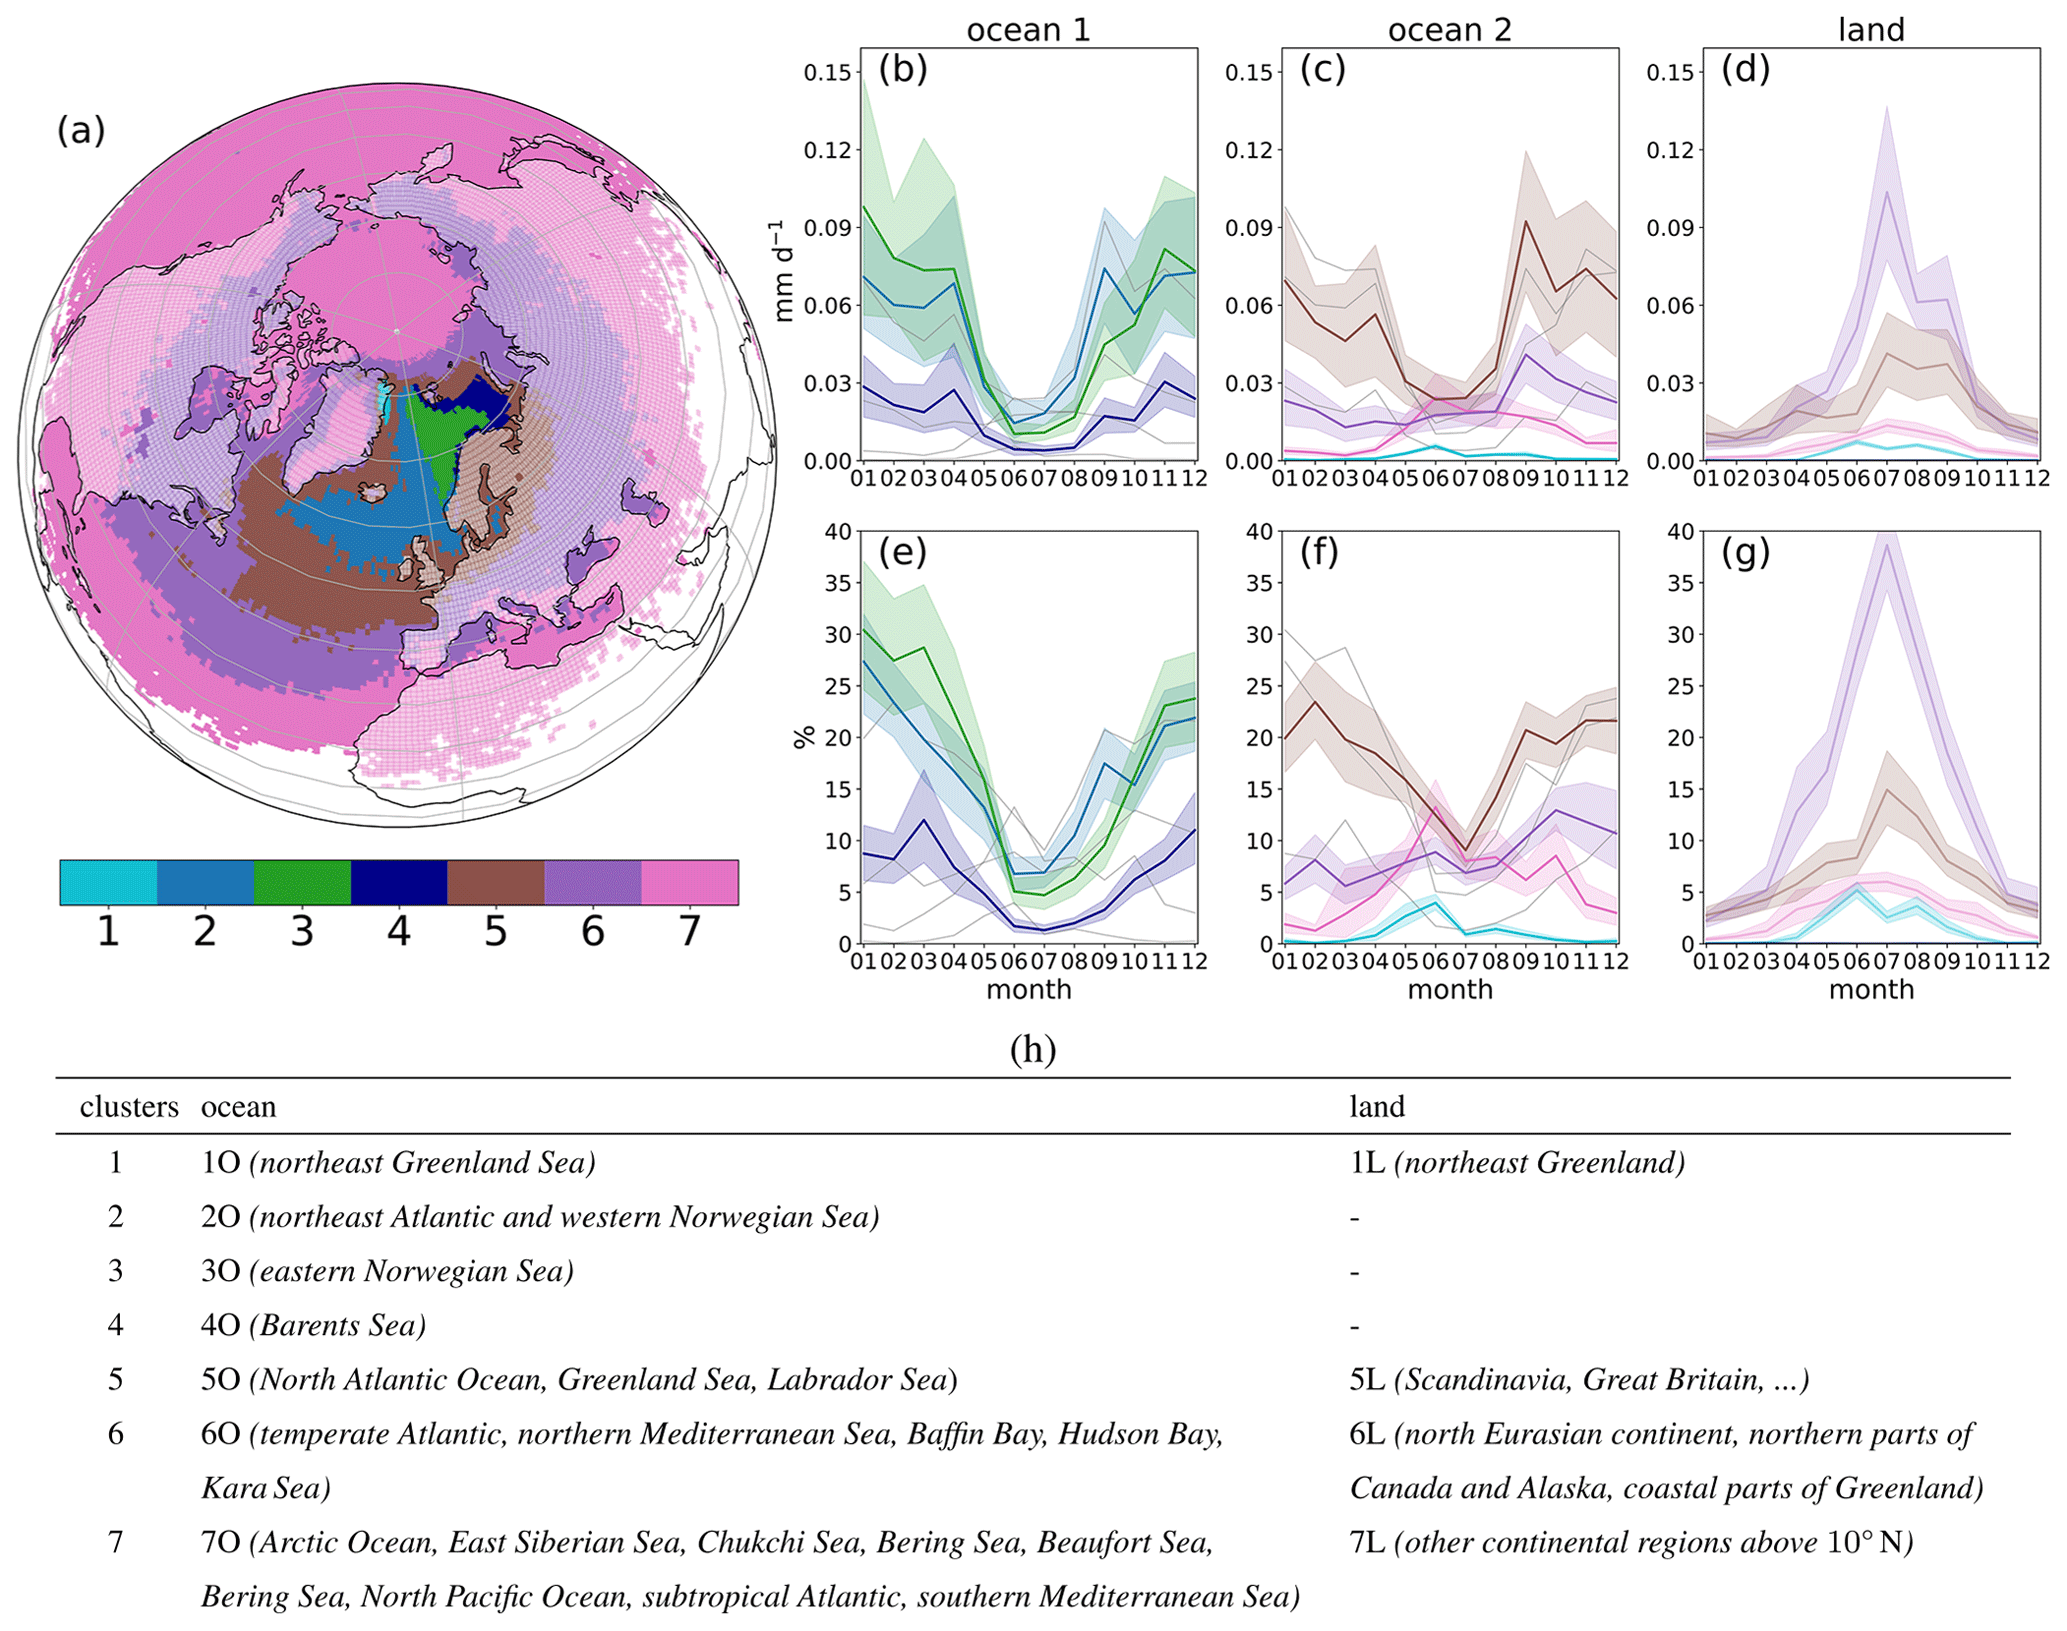
Figure 8(a) K-means clustering with additional manual separation. The annual cycle of moisture sources contributing to precipitation in the study region is plotted for each cluster in (b)–(d) as absolute number and in (e)–(g) as relative number in percent of the total diagnosed moisture source amount. The ocean (with sea ice) regions in (b), (c), (e), and (f) are separated from the land regions in (d) and (g), and land regions have more transparent colours in (a). We use two graphs for the ocean regions for readability; grey lines in (b), (c), (e), and (f) correspond to the missing ocean regions for comparison. Shaded areas represent the 95 % confidence interval of the mean. Summing up the different regions of relative contribution for ocean (e, f) and for land (g) would give the total land or ocean (with and without sea ice) contribution shown in Fig. 7d. In (h), the used cluster abbreviations and descriptions of approximate geographical regions of the K-means clusters of (a) are listed.
For more detailed analyses (and because the clustering algorithm cannot separate ocean from land sources), we now further refine the automated clusters with manual intervention. We distinguished between ocean (with sea ice) and land regions (compare Figs. 7a and 8a). The blue-coloured ocean cluster in Fig. 7a does not differ between the Norwegian–Greenland and the Barents Sea moisture sources. To interpret the results in the context of NAO, we split the former blue coloured region into two ocean regions (2O and 4O). Moreover, we divided the large former violet-coloured cluster of Fig. 7a into two new groups: the 7O–7L cluster that contributed least (in total only 10 % of the former violet-coloured cluster area) and into the 6O–6L cluster that contributed most (in total 90 % of the former violet-coloured cluster area). This gives a better impression of areas contributing that are far away from the study region. Hence, the new separation results in seven ocean and four land clusters (Fig. 8a, the small 4L cluster area is not a significant contributor and therefore neglected).
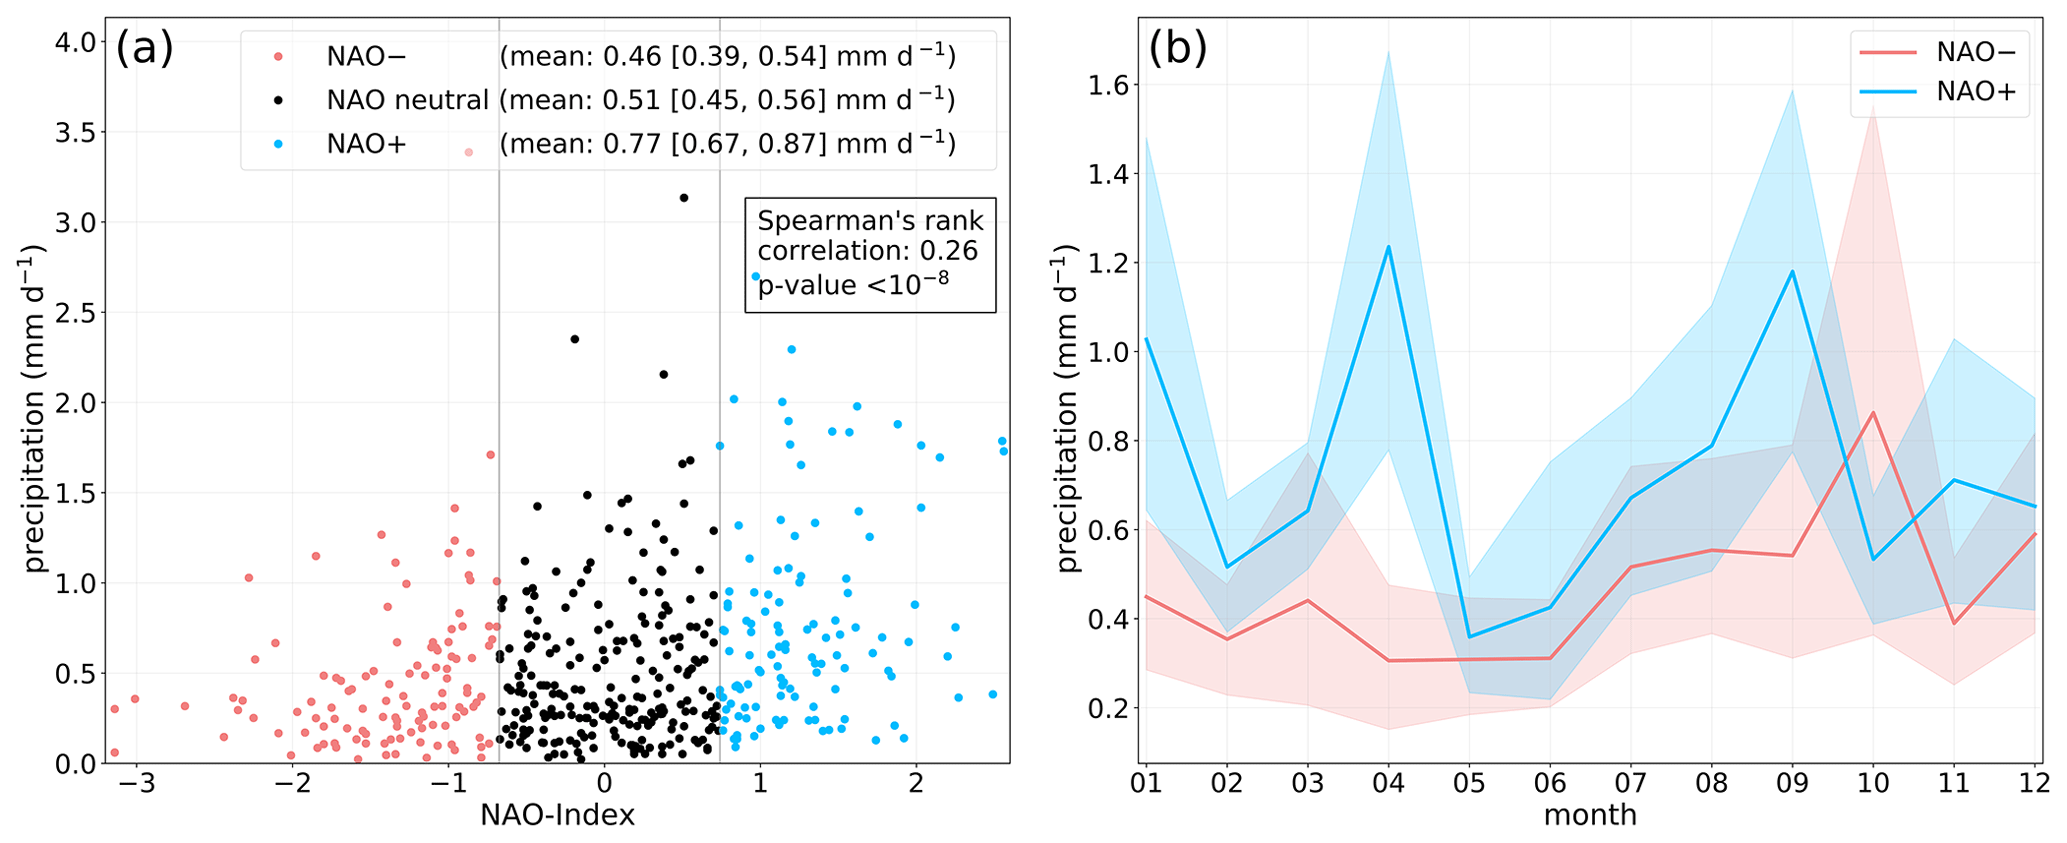
Figure 9(a) Scatterplot of precipitation in study region against the NAO index for in total 460 months (February 1979–May 2017). Months were separated into months with NAO indices below or equal to the 25th percentile (NAO−), above or equal to the 75th percentile (NAO+), or in between the 25th and 75th percentiles (NAO neutral). (b) Mean annual cycle of precipitation in study region for months with NAO being below or equal to the 25th percentile (NAO−) and above or equal to the 75th percentile (NAO+). For each month of the year, month-specific 25th and 75th percentile thresholds were computed. The shaded areas represent the 95 % confidence interval of the mean.
For the ocean clusters 2O, 3O, 4O, and 5O, the relative maximum is in winter while the minimum is in summer (Fig. 8e). The Norwegian Sea (3O, Fig. 8) is one of the main moisture sources, specifically during winter. The Norwegian Sea is located below the North Atlantic storm track and is a main region for convective warming (Tsukernik et al., 2004) because of the relatively warm ice-free ocean and the relatively dry and cold air above resulting in the highest total column vapour (precipitable water) in the Arctic. In addition, in the colder seasons, more evaporation in 2O, 3O, 4O, and 5O occurs because of larger vertical humidity gradients and stronger moisture transport due to higher temperature gradients between the subtropics and the Arctic (Serreze and Barry, 2014). The ocean clusters 1O and 7O peak in June, and the 6O cluster peaks in October possibly as a consequence of more sea-ice-free areas in October.
All land clusters have their maximum contribution in July except for the local 1L cluster where the maximum occurs in June (Fig. 8d and g). A large part of summer Arctic precipitation comes from evapotranspiration over nearby land regions by regional recycling of water vapour that peaks in summer due to enhanced convection from stronger solar insolation (Serreze and Barry, 2014). The moist continental air masses from non-local regions over the north Eurasian continent are transported in summer towards northeast Greenland by a cyclone with a trough axis between Iceland and Svalbard (see 500 hPa geopotential height in Fig. 5 and IVT of Fig. 6). Large parts of these land clusters (1L, 5L, 6L, Fig. 8a) and the study region itself are located in the continuous permafrost zone (Brown et al., 1998). Thus, enhanced evapotranspiration in summer could also be explained by thawing of the uppermost permafrost layers (Biskaborn et al., 2019).
4.1 Interannual variability from the North Atlantic Oscillation (NAO)
The NAO is one of the most important patterns of atmospheric circulation variability over the middle and high latitudes, specifically in the cold season (November–April; Hurrell et al., 2003). In its negative phase (NAO−), there is a weaker subpolar low over Iceland and a less pronounced subtropical high over the Azores, while in its positive phase (NAO+), a larger pressure gradient leads to stronger southwesterly surface winds over the North Atlantic. In the following, we assess whether variability in the NAO affects the inter-annual variability of precipitation and moisture sources of the study region.
4.1.1 Relationship between NAO and precipitation
Generally, precipitation in the study region increases with increasing NAO index and is more variable (Fig. 9a). Mean precipitation with NAO+ is larger than with NAO− (Fig. 9a), specifically for January and April (Fig. 9b). As expected, variability in summer precipitation is not driven by NAO variability (when NAO is weakest and hence most negative). The month with the largest variability, September (Fig. 4), shows a non-significant increase in precipitation for months with NAO+ compared to those with NAO− (Fig. 9b).
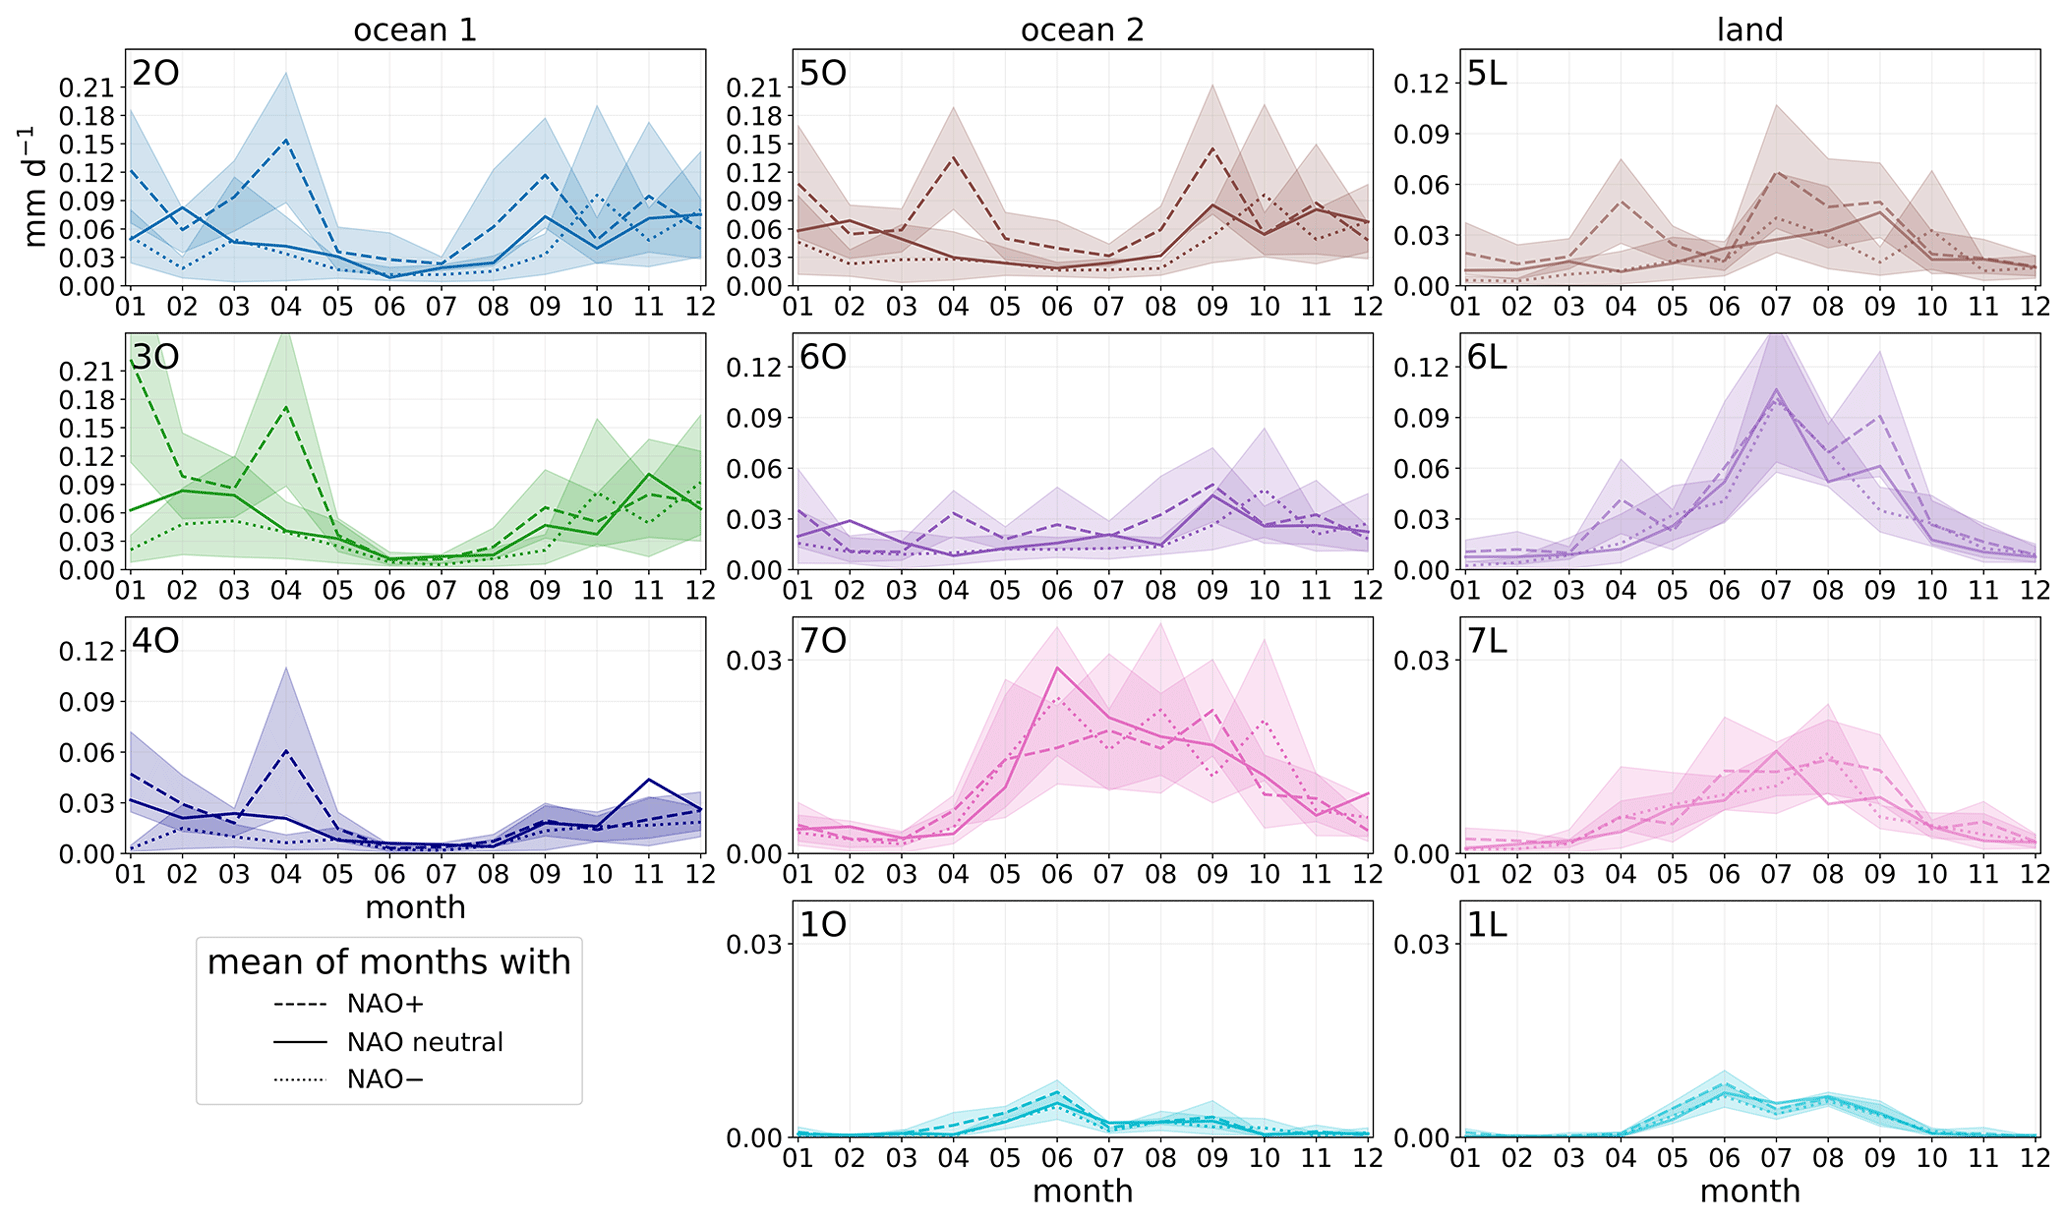
Figure 10Mean annual cycle of contributing moisture sources distinguishing between months with NAO indices above or equal to the 75th percentile (NAO+), below or equal to the 25th percentile (NAO−), and those in between (NAO neutral) for the different clusters. The same thresholds as in Fig. 9b were chosen. Shaded areas represent the 95 % confidence interval of the mean of months for the highest and lowest NAO index quartiles (February 1979–May 2017). The legend for the used cluster abbreviations is in Fig. 8a and h.

Figure 11Normalised moisture source deviation between months with NAO indices being above or equal to the 75th percentile (NAO+) and months being below or equal to the 25th percentile (NAO−). The same thresholds as in Fig. 9b were chosen. To better compare the moisture source deviations they were normalised by dividing each grid point by the maximum difference between the months with NAO+ and the months with NAO−, which gives the grid point with the largest positive difference a normalised deviation of 1.
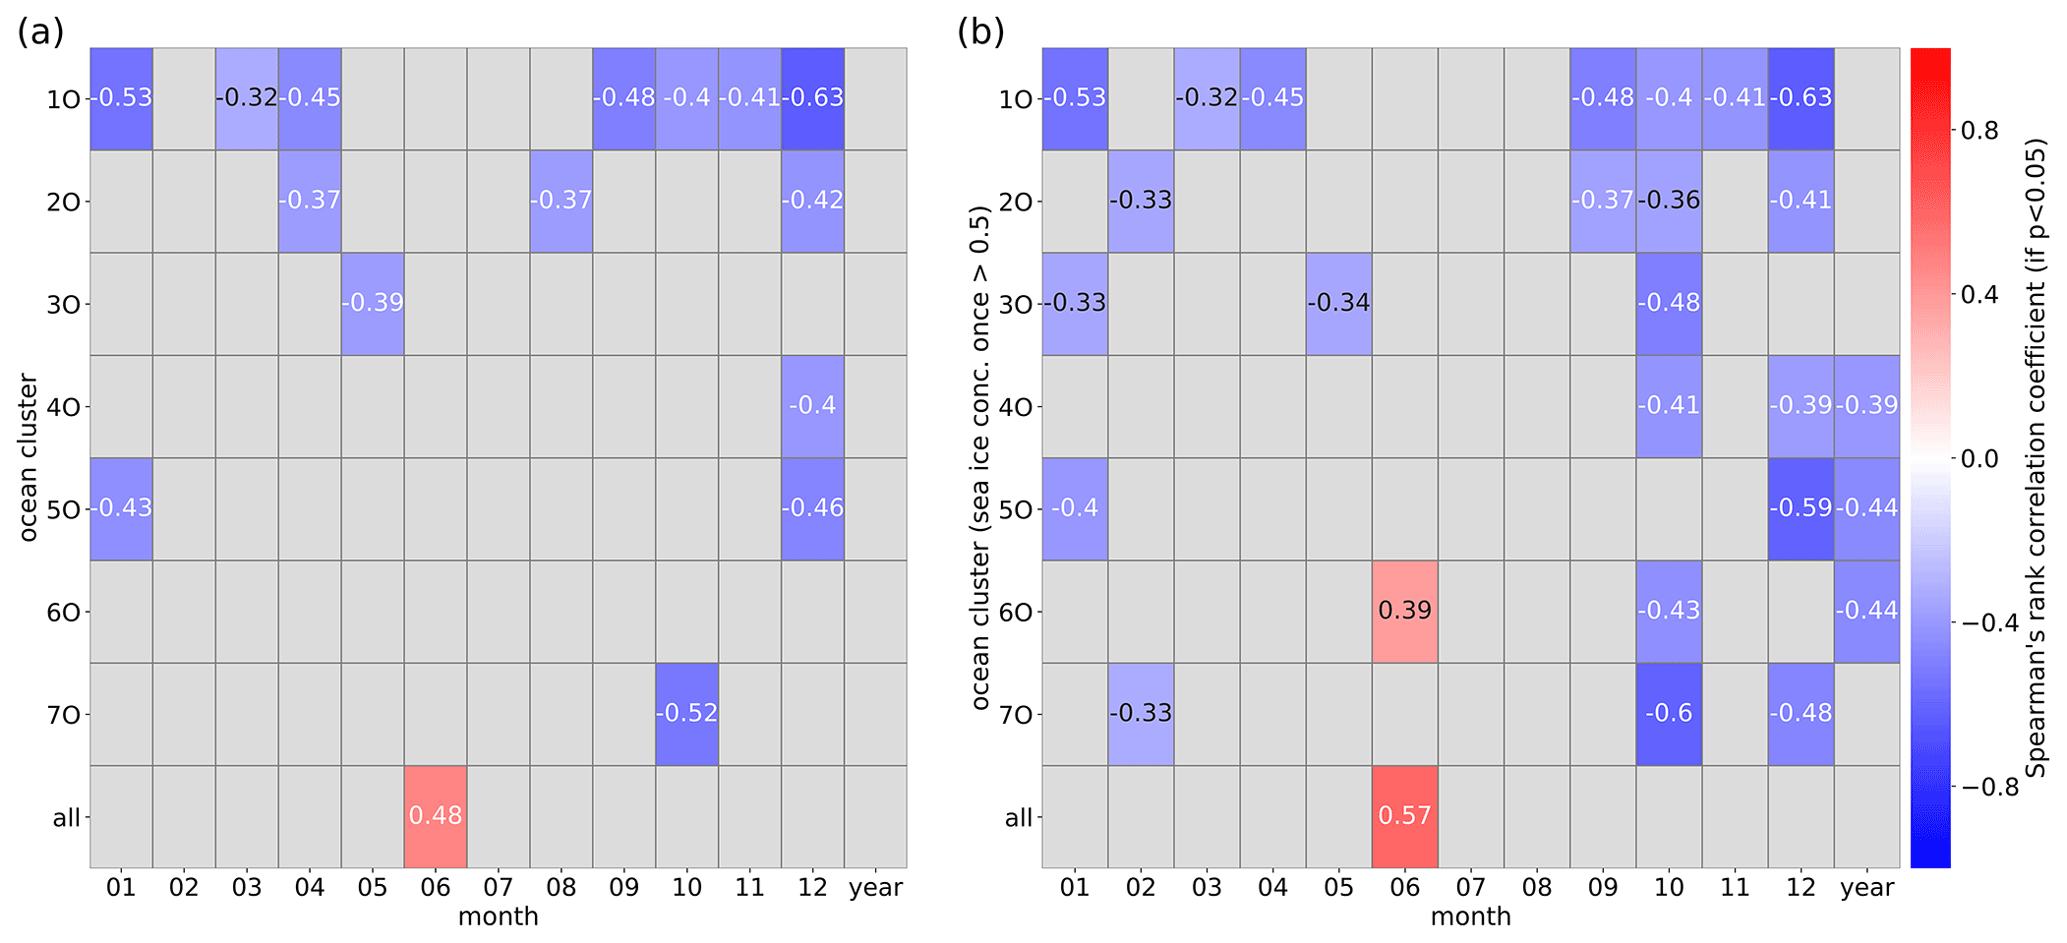
Figure 12(a) Spearman's rank correlation coefficients between moisture sources from each ocean cluster against relative ice area for each month and year. If there is no significant correlation (p value ≥ 0.05), the corresponding box is shaded in grey. (b) Same as in (a) but looking only at the area of those ocean grid points that had a sea ice concentration of above 0.5 during the study period (effectively reducing each cluster's area to the sea-ice-relevant areas). The legend for the used cluster abbreviations is in Fig. 8a and h.
4.1.2 Relationship between NAO and moisture sources
We start by analysing whether there are differences in the contributing moisture sources of the study region for NAO+ versus NAO− months for each individual cluster region separately over the annual cycle (Fig. 10). Significant differences between the NAO phases could only be found for some regions in January, April, and September (Fig. 10); thus, these months were investigated in more detail (Fig. 11). For January NAO+ months, evaporation and moisture transport to the study region were stronger from the eastern Norwegian Sea and Barents Sea (Fig. 11a), which corresponds mainly to the 3O and 4O clusters (Fig. 8a). In those clusters, significant differences between NAO− and NAO+ were found only for January (Fig. 10). For April and September NAO+ months, evaporation and moisture transport to the study region were enhanced from large parts of the North Atlantic above 45∘ N and of the ice-free Atlantic sector of the Arctic Ocean (Fig. 11b and c). Moisture source dependence on NAO in April was largest in the 2O, 3O, 4O, and 5O ocean clusters and the 5L land cluster (Fig. 10). In September, the 2O ocean as well as the 5L and 6L land moisture source clusters contributed significantly more for NAO+ than for NAO− months (Fig. 10). The larger NAO dependency of the 4O cluster, part of Barents Sea, compared to the 2O cluster, part of the northeast Atlantic and western Norwegian Sea (Fig. 10), is another justification for the manual splitting of these areas that were clustered as one region by the K-means clustering (compare Figs. 7a and 8a). To conclude, there was an increased moisture uptake and transport to the study region for NAO+ months in January, April, and September from the North Atlantic above 45∘ N and the ice-free Atlantic sector of the Arctic Ocean, specifically from the Norwegian Sea, which resulted in more precipitation over the study region for these months in the NAO+ phase.
4.2 Relationship to sea ice
A clear decreasing sea ice trend north of 30∘ N has been observed for the last 40 years. From ERA-Interim data, we compute 0.35 [0.26, 0.43] million square kilometres per decade yearly minimum sea ice area decrease (mostly September) and 0.67 [0.54, 0.80] million square kilometres per decade yearly maximum sea ice area decrease (mostly March). Bintanja and Selten (2014) showed that decreasing sea ice will enhance future evaporation in the Arctic, as open water at freezing point will replace ice at temperatures far below zero. We now test the working hypothesis that reduced sea ice results in larger contributing moisture sources for our study region.
Generally, there is no significant correlation, between precipitation in the study region and Arctic sea ice area when looking at each month of the year separately. Adding a time lag between sea ice and resulting precipitation of plus 1 or 2 months also resulted in no significant correlation. When comparing the seasonal mean precipitation against the maximum sea ice area of that year, we found some significant but small relations of increasing precipitation in autumn and winter for decreasing maximum sea ice (R2 values of 0.14 and 0.13). The moisture uptake region 3O (mainly Norwegian Sea) is one of the major moisture source contributors; however it is also mostly sea-ice-free, which might explain why we could not find strong relations between precipitation in the study region and Arctic sea ice area.
A clearer insight might emerge when looking at the relation of each ocean cluster's attributed moisture sources against the respective relative sea ice area. When considering the total attributed moisture sources for each ocean cluster across the whole year, no significant correlations (Spearman's rank correlation with p value < 0.05) between moisture sources and relative sea ice area are found (Fig. 12a). If individual months are considered for each ocean region, then few significant correlations are observed. The main exception is for December, where the majority of regions display a significant correlation with relative sea ice area (Fig. 12a). Changes in the sea ice area can only poorly describe the variance in the moisture sources of entire ocean cluster areas (Fig. 12a) because large parts of them never had sea ice from 1980 till 2016 (for that month of the year or even at all). Thus, the effect of sea ice in a given area on the attributed moisture source was further investigated by considering sub-regions of clusters with only those grid points that had a sea ice concentration of above 0.5 over the study period (Fig. 12b). As this is different for each month of the year, for each month a different fraction of the ocean cluster was analysed. Compared to Fig. 12a, Fig. 12b shows that the annual contribution from sea-ice-related fractions of the 4O, 5O, and 6O clusters is significantly correlated to decreasing sea ice. In addition, some more correlations for individual months were found over those specific fractions of the clusters (strongest in autumn–winter months, Fig. 12b). However, moisture sources over the sea-ice-related sub-regions as defined in Fig. 12b contribute on average only 16 % to all the diagnosed moisture sources. Hence, the correlations of moisture sources against sea ice (Fig. 12b) describe only a very small fraction of the entire moisture sources for the study region, which also explains why we did not find correlations between Arctic sea ice area and precipitation in the study region.
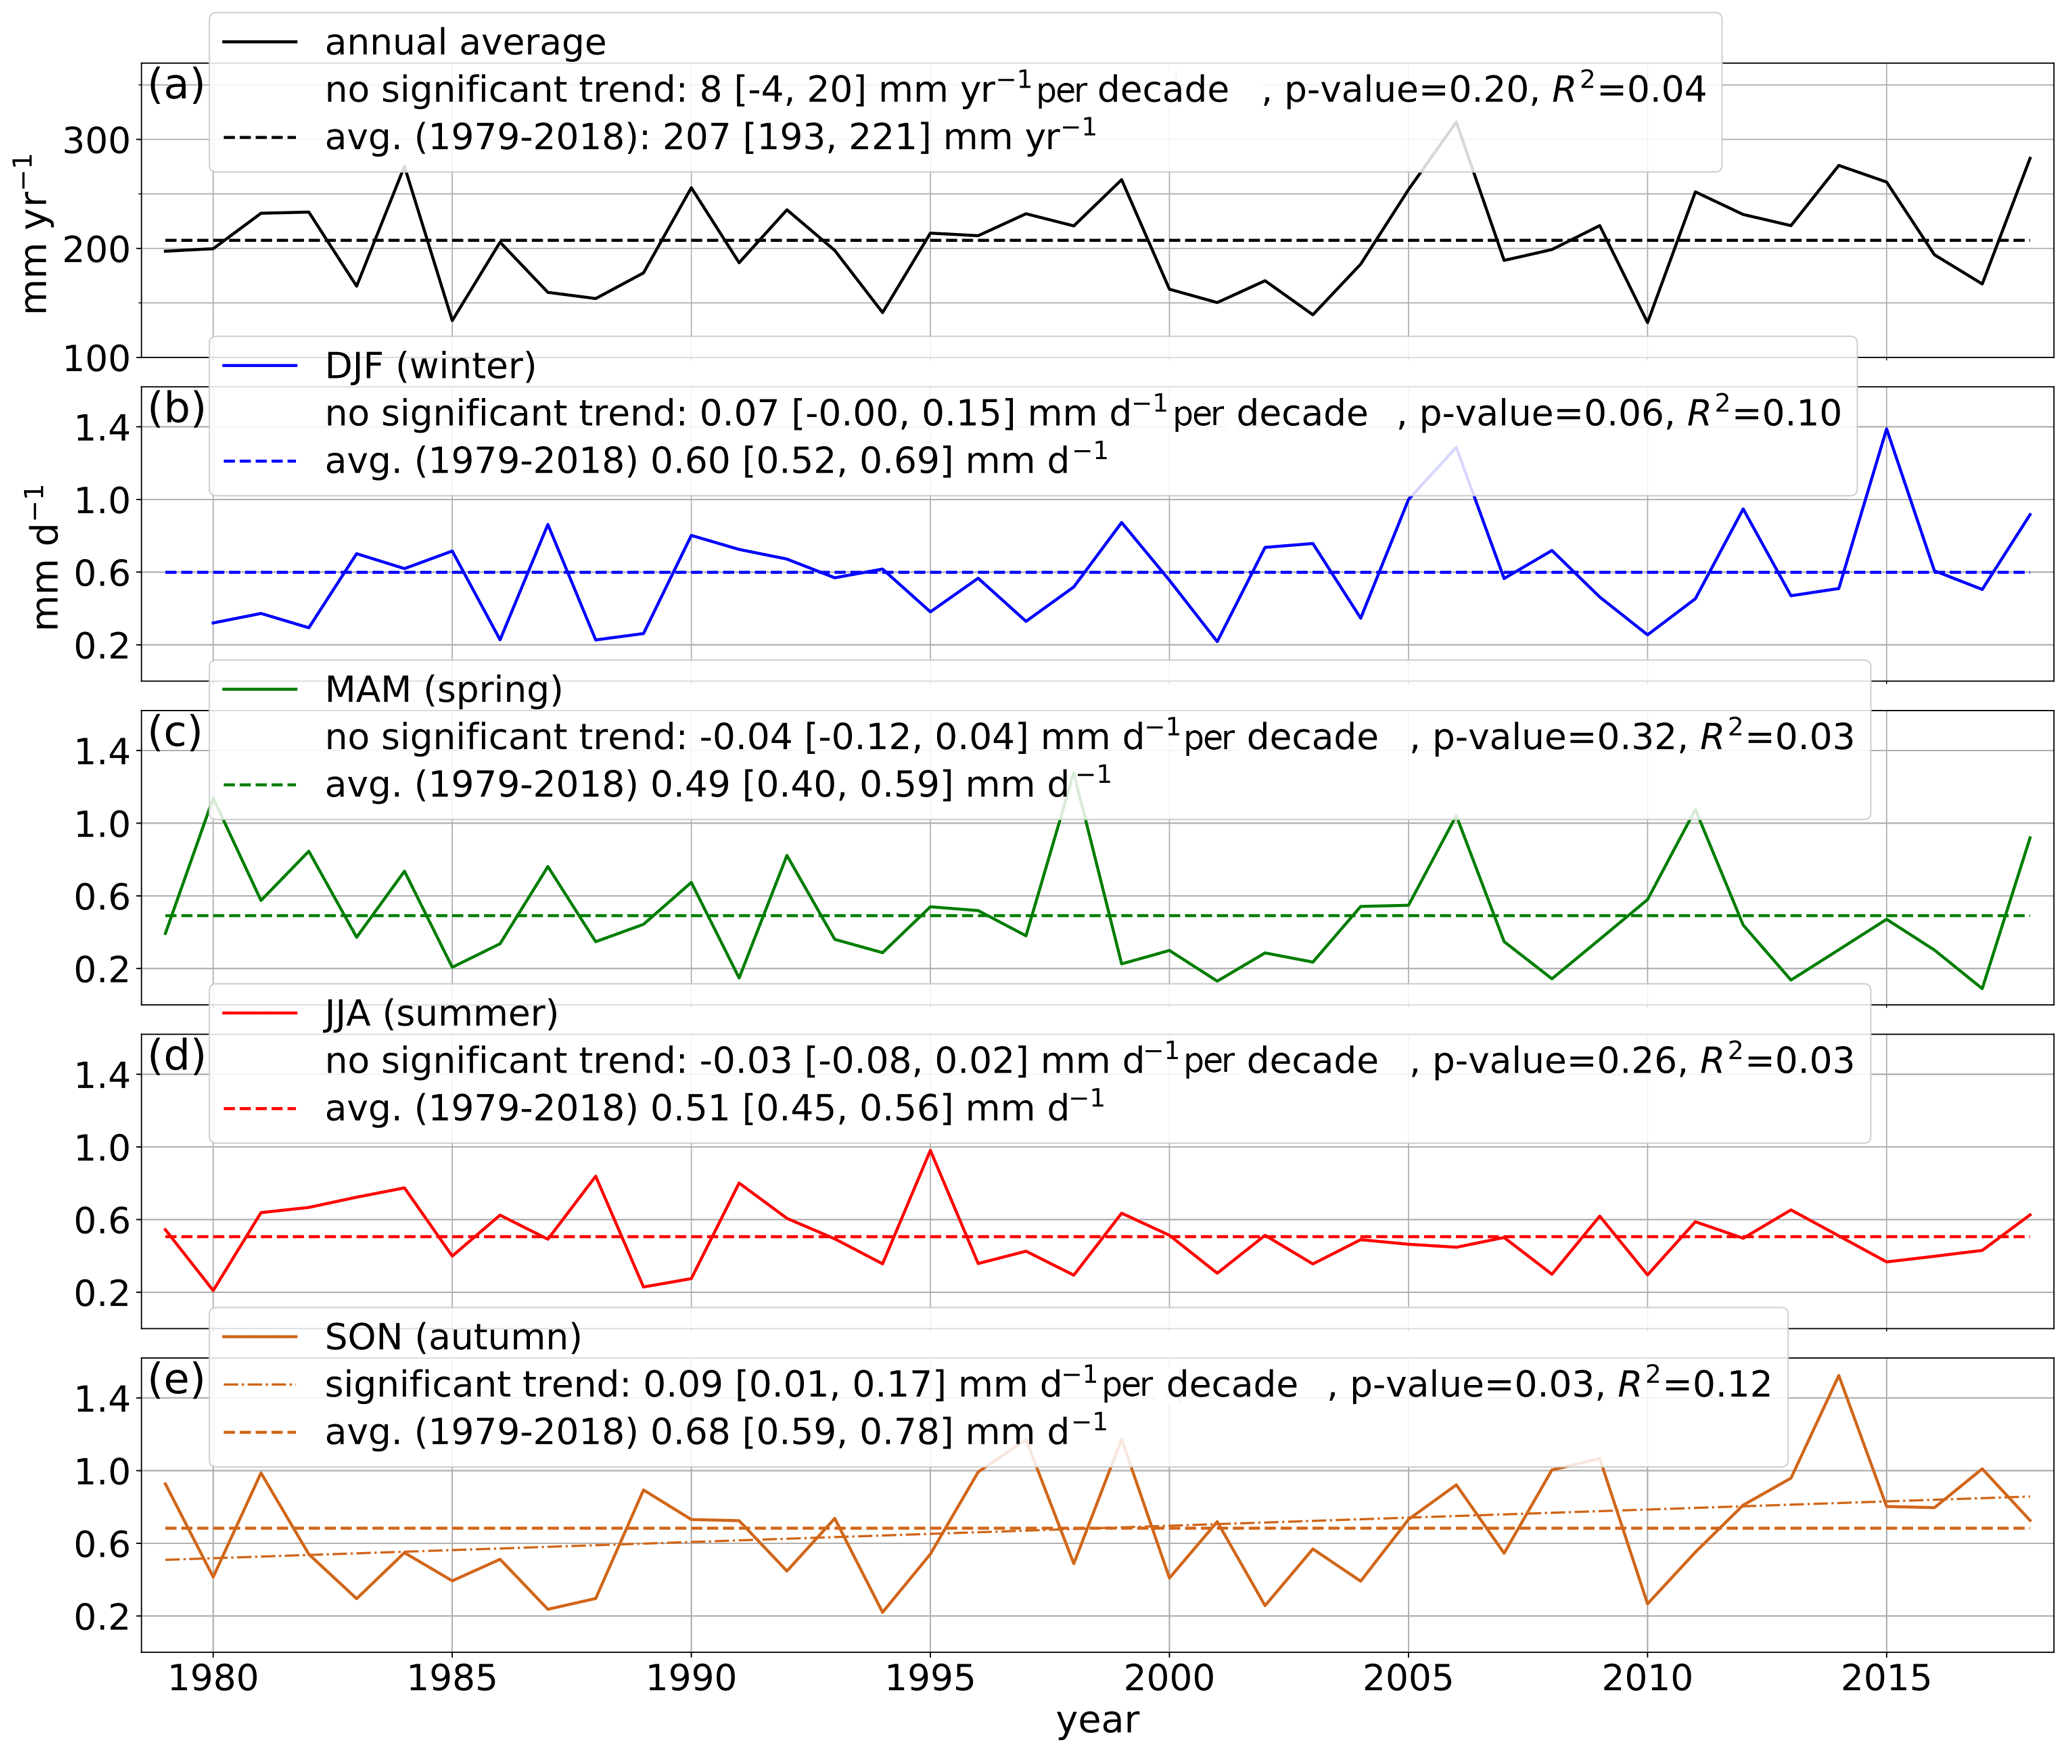
Figure 13(a) Annual and (b–e) seasonal temporal evolution of precipitation amount in the study region from ERA-Interim with estimates of a possible linear trend and its corresponding p values. In autumn (SON), the existence of a positive upward linear trend can not be rejected under the 6 % level.
When specifically considering moisture source regions, the 1O ocean cluster (closest to the study region) displays significant correlations for 7 months (September till April) with increasing attributed moisture sources over 1O for decreasing relative sea ice area (Fig. 12a and b). Changes in the sea ice amount in 1O change the general evaporation over the area, possibly directly influencing precipitation in the study region. For clusters located further away, changing sea ice might also directly effect the evaporation over that area. However, contributing moisture sources also depend on the moisture transport to the study region, which changes with decreasing sea ice as well. This might be one reason for the weak relations that we found. Looking at all ocean clusters together, we only found a correlation for June, which was positive: this is not expected and is likely a statistical coincidence.
4.3 Temporal evolution
According to ERA-Interim, the study region has warmed by 2.8 [1.6, 4.0] ∘C (2 m temperature) in the 40-year period 1979–2018. We now test whether such a trend is also detectable for precipitation (or regional moisture sources) by looking at its temporal evolution (Fig. 13a). A possible trend was tested by computing the Pearson correlation coefficient through a linear fit between time and precipitation or moisture sources. Linear regression analysis requires that residuals from the fitted regression line are normally distributed, which is not always the case for monthly data. Therefore, the more robust non-parametric Mann–Kendall trend test was also applied to detect whether a monotonic upward (downward) trend had occurred, which does not necessarily need to be linear (Wilks, 2011). The yearly, winter, spring, and summer precipitation from 1979 to 2018 in the study region do not show a significant trend. There is a small increasing trend in autumn precipitation of 0.09 [0.01, 0.17] mm d−1 per decade (significant at the 5 % level for both the linear regression and Mann–Kendall trend tests).
Of specific interest is the changing contribution of different moisture source regions to the precipitation of the study region over time (1980–2016). Over the annual mean, no temporal trends were identified from any of the land or ocean clusters and also not from the relative land–ocean moisture source contribution. When looking at the monthly time series, some sporadic slight trends are visible; however, they are too small in absolute numbers to be further considered. For example, in October, the only month with a small overall detectable increasing precipitation trend, very small significant trends of increasing contributing moisture sources with time were detected for the 7O cluster and for the overall land contributions. This is also in line with the increasing attributed moisture sources that were found for decreasing sea ice over the 7O cluster in October (Fig. 12a and b).
The possible reasons for the absence of precipitation trends, despite the observed increase in temperature and loss of Arctic sea ice during recent decades (Comiso and Hall, 2014), are discussed in Sect. 5.3.
5.1 Moisture source regions, relation to the NAO and GBI
In Sodemann et al. (2008a), the majority of moisture sources (>85 %) of the northern and east-central Greenland Ice Sheet are over the North Atlantic Ocean and Nordic Seas above 35∘ N, similar to our findings. In Nusbaumer et al. (2019), Greenland moisture sources were estimated by water tracers using the Goddard Institute for Space Studies climate model and MERRA2 horizontal winds (mean of 1980–2015). They also found similar results: the dominant moisture source in northeast Greenland is the North Atlantic and the ice-free Atlantic sector of the Arctic Ocean except for summer (JJA) where continental sources are substantial.
For NAO+ winter months, Sodemann et al. (2008a) found that moisture sources for the northern and east-central Greenland Ice Sheet are larger over the Norwegian Sea, which is qualitatively similar to our findings. In case of NAO− winter months, moisture sources were found to be further southward (maximum over 40–60∘ N), which does not agree with our study, possibly because of the different regions considered. The same general relationship of increasing precipitation for higher NAO indices was found over the ice sheet by Sodemann et al. (2008a) and Koyama and Stroeve (2019). With a high NAO index, the pressure gradient between the subpolar low and subtropical high is larger, specifically in winter months, which results in stronger westerlies and increased intensity and number of storms in Iceland and the Norwegian Sea (Hurrell et al., 2003). This shift in the North Atlantic storm activity explains the larger moisture sources over the Norwegian Sea for NAO+ and the positive correlation between NAO index and precipitation amount.
We repeated the analysis of the NAO index for the Greenland Blocking Index (GBI, dataset from NOAA, 2020b, based on Hanna et al., 2016) that is defined by the mean 500 hPa geopotential height for the 60–80∘ N, 20–80∘ W region (e.g. Hanna et al., 2016). The higher the GBI, the weaker and less variable the precipitation, specifically in January and April (not shown). Due to the strong negative correlations between the NAO index and the GBI with Pearson correlation coefficients of minimum −0.96 in June and maximum −0.74 in December, we get relations between GBI and precipitation or moisture sources that are very similar but reversed to those from the NAO index, which is in line with Hanna et al. (2016) and Nusbaumer et al. (2019).
5.2 Relation to temperature and sea ice
Bintanja and Selten (2014) predicted a relative change of Arctic precipitation per degree surface temperature warming of 4.5 % K−1 in the 21st century, which is larger than the global rate (1.6–1.9 % K−1), due to feedback mechanisms associated with retreating winter sea ice. For our study region, we did not yet observe significant amplified precipitation sensitivity for the recent decades, but our estimates of 3.8 [−1.6, 9.3] % K−1 over the annual mean do not contradict those of Bintanja and Selten (2014). We also found slight significant correlations of increasing precipitation for higher surface temperatures for January, February, March, September, and November. A more in-depth analysis could look at temperature changes from the top of the inversion height or from the actual moisture source location.
The study region in northeast Greenland is in close proximity of the Greenland Sea that has lost sea ice rapidly in the last decades, specifically in winter (Onarheim et al., 2018; Bliss et al., 2019). While the Greenland Sea has lost around a third of its initial winter sea ice extent, the Barents Sea has even lost half of its winter sea ice extent (compared to ice conditions of 1979–1989; Stroeve and Notz, 2018). According to our analyses, only 16 % of the diagnosed moisture sources come from the sea-ice-relevant sub-regions, which might explain why we found only weak correlations between precipitation and sea ice extent. In Svalbard, for example, more moisture comes from regions where sea ice loss over the last decades was largest, e.g. Barents–Kara Sea (Faber et al., 2017), and the influence of changing sea ice might be stronger there.
5.3 Temporal trend of precipitation and moisture sources
According to Bintanja and Selten (2014), precipitation will increase around 50 % (RCP8.5 scenario, 25 % for RCP4.5) in northeast Greenland based on the differences between the means for 2006–2015 and 2091–2100. The reasons are a strong increase in local surface evaporation through Arctic warming and retreating sea ice and to a lesser degree enhanced moisture inflow from lower latitudes. We did not find a temporal trend in annual precipitation for the 40-year period 1979–2018. At Danmarkshavn (Fig. 1), no precipitation trend was found for the period 1981–2012 either, but a significant trend (p value < 0.05) was found for 1971–2000 with 36 mm yr−1 per decade and for 1961–1990 with 48 mm yr−1 per decade (Mernild et al., 2015). From the reanalysis products ASRv1 and ASRv2 for 2000–2012, no precipitation trend was visible for northeast Greenland and also not from observations for Danmarkshavn or Station Nord for 2000–2007 (Bromwich et al., 2016; Koyama and Stroeve, 2019).
Some of the inter-annual variability of precipitation occurs because of variability in the NAO. NAO has decreased in summer since the 1990s, and winter NAO variability has increased (Hanna et al., 2015). This might be a reason why a significant annual temporal trend in the precipitation of the study region is not yet visible (Fig. 13a). According to Hurrell and Deser (2010), since 2001, there have been more winter days with strong anticyclonic ridges over Scandinavia (“blocking”) and over western Europe (“Atlantic Ridge” regime) compared to NAO+ or NAO−; hence, differentiating between four regimes could improve the analysis.
We found a small trend of increasing precipitation over the 40-year period 1979–2018 for autumn (Fig. 13e). October is among the months where relations were observed between increasing moisture source contributions and decreasing sea ice in some of the ocean clusters (Fig. 12b). It is also the month with the largest temperature increase of 1.5 [0.9, 2.1] ∘C per decade compared to 0.7 [0.4, 1.0] ∘C per decade in the annual mean for 1979–2018. This is consistent with future predictions of Bintanja and Selten (2014) where autumn is the most sensitive season with the largest predicted precipitation increase.
5.4 Limitations
Precipitation is difficult to quantify, specifically at higher latitudes and in remote areas (Serreze and Barry, 2014). No direct precipitation measurements exist that could have been compared to the reanalysis data. The nearest observational stations are exposed to a more maritime climate (Station Nord and Danmarkshavn, Fig. 1), but the study region is inland over heterogeneous terrain at around 740 m a.s.l., where orographic uplift of moist air masses might alter local precipitation (Serreze and Barry, 2014). Precipitation measurements (corrected for undercatch) of Station Nord and Danmarkshavn show a good agreement with the Arctic System Reanalysis (ASRv1; Koyama and Stroeve, 2019). ASRv1 and ERA-Interim have similar precipitation estimates in the study region (December 2006–November 2007; Bromwich et al., 2016), providing some confidence in the ERA-Interim estimates. Instead of using only the NAO index or GBI, a more sophisticated classification into four to seven weather patterns (e.g. Ortega et al., 2014; Grams et al., 2017; Falkena et al., 2020) together with a case study analysis of the pathway of moisture source transport for each weather pattern could be done in a subsequent study to better understand the dominant drivers and sources of precipitation in our study region.
The K-means clustering algorithm was used as a simple tool to construct different regions in which each grid point shares a common feature, i.e. the mean annual cycle of relative moisture source contributions. By dividing the time series in half and repeating the K-means clustering approach for these two time series separately, we found almost no differences in the classification of the clusters (not shown), which gives a hint that the clusters are stable over time. Incorporating a more complex clustering approach that takes the annual cycle, NAO, and sea ice into account could, however, give interesting new insights.
Besides the uncertainties from precipitation estimates, there are also limitations from the Lagrangian moisture source diagnostic. We showed in Sect. 2.2 that only 48.3 % of precipitation could be attributed to moisture sources. The remaining sources were detached from the surface (moisture uptake above the PBL) or were unidentifiable. This number is lower than in comparable studies and could be explained by the dry conditions in the region. Parameterised convection could also be responsible for a significant amount of vertical moisture transport and increases the non-accounted moisture uptake during summer (Sodemann and Zubler, 2010). In the moisture source diagnostic, either evaporation or precipitation can occur in each time step of 6 h. Therefore, using shorter time steps and a finer grid resolution (e.g. using the ERA5 reanalysis dataset instead of ERA-Interim) could influence the diagnostic. Not distinguishing between moisture uptake below and above PBL height could be a way to increase the attribution (e.g. Baker et al., 2015; Fremme and Sodemann, 2019; Hu et al., 2020), at the cost of larger uncertainties since moisture uptake above the PBL cannot be assigned to a specific location. For this climatological study, we had to use a Lagrangian approach instead of a more comprehensive Eulerian tagging approach to keep the computational costs low. Although the case study of Winschall et al. (2014) found similar moisture source regions for both approaches, a direct comparison to other models would be necessary to estimate uncertainties resulting from the choice of the Lagrangian model itself (Van Der Ent and Tuinenburg, 2017).
We analysed the present-day moisture sources for a region in northeast Greenland at 80∘ N, a polar desert with a mean annual precipitation of 207 [192, 224] mm yr−1 (1979–2018, ERA-Interim, Fig. 1). We used the Lagrangian moisture source diagnostic of Sodemann et al. (2008a) to estimate the origin of water vapour for precipitation over the study region between February 1979 and May 2017. We applied a classification algorithm (K-means clustering) to group grid points into clusters after their similarities based on the annual cycle of relative moisture source contributions.
The main moisture source region is the North Atlantic above 45∘ N and the ice-free Atlantic sector of the Arctic Ocean with a maximum over the Norwegian Sea (30 % in the mean in January, Fig. 8e), which is largest for months in the NAO+ phase, specifically in January and April (Figs. 10 and 11). This leads to stronger and more variable precipitation in the study region for these months (Fig. 9). While the main moisture sources are over the ocean in winter months, in summer the contributions from land regions (locally or north Eurasian continent) are largest (60 % in July, Fig. 7d). The month with the highest precipitation is September (contributions from both land and ocean moisture sources), whereas the month with the least precipitation is June (mostly land sources, Figs. 4 and 5).
The study region has warmed by 2.8 [1.6, 4.0] ∘C and surrounding Arctic sea ice has retreated for the 40-year period considered. The amount of moisture uptake (and transport) from sea-ice-related regions increased with decreasing sea ice for the study region, specifically in October and December (Fig. 12). Thus, one might expect to already see an increasing trend in precipitation in the study period. However, as most moisture source contributions come from permanently ice-free ocean regions and because of the large inter-annual variability from the NAO, we could not detect considerable trends in precipitation in the study region with the exception of autumn where precipitation increases by 8.2 [0.8, 15.5] mm per decade over the period. To better understand the underlying mechanisms, future studies could focus on the pathway of moisture source transport during extreme precipitation events, which account for a large part of total precipitation.
Longer time periods need to be considered for more robust results. The acquisition and analysis of palaeoclimate proxies might yield further insights into the long-term climate dynamics of the region, thus further providing a baseline and enabling improved predictions in this highly sensitive region in the future.
The ERA-Interim reanalysis data used in this study can be accessed from the European Centre for Medium-Range Weather Forecasts (ECMWF; https://www.ecmwf.int/en/forecasts/datasets/reanalysis-datasets/era-interim Dee et al., 2011). The monthly moisture source estimates from the Lagrangian diagnostic (February 1979–May 2017) are made publicly available via Zenodo: https://doi.org/10.5281/zenodo.3972882 (Schuster et al., 2020).
LS undertook the majority of the analyses, interpreted the data, and wrote the majority of the manuscript. LL undertook the computation of the Lagrangian moisture source diagnostic. GEM and FM conceived the project and wrote parts of the manuscript. All authors directly contributed to the manuscript through discussion or writing.
The authors declare that they have no conflict of interest.
We would like to thank Harald Sodemann for helpful discussions during the planning phase. We would like to thank the two anonymous reviewers whose comments much improved the first draft of this paper.
This research has been supported by the Austrian Science Fund (Austria) (grant no. Y 1162-N3) and with start-up funding from the University of Innsbruck Research Centre for Climate – Cryosphere and Atmosphere, both to Gina E. Moseley. Lilian Schuster has also received funding from the University of Innsbruck's “Exzellenzstipendien für Doktoratskollegs” fellowship programme (grant no. 2020/GEO-37).
This paper was edited by Stephan Pfahl and reviewed by two anonymous referees.
Baker, A. J., Sodemann, H., Baldini, J. U., Breitenbach, S. F., Johnson, K. R., van Hunen, J., and Pingzhong, Z.: Seasonality of westerly moisture transport in the East Asian summer monsoon and its implications for interpreting precipitation δ18O, J. Geophys. Res., 120, 5850–5862, https://doi.org/10.1002/2014JD022919, 2015. a
Bekryaev, R. V., Polyakov, I. V., and Alexeev, V. A.: Role of polar amplification in long-term surface air temperature variations and modern Arctic warming, J. Climate, 23, 3888–3906, https://doi.org/10.1175/2010JCLI3297.1, 2010. a
Berrisford, P., Kållberg, P., Kobayashi, S., Dee, D., Uppala, S., Simmons, A. J., Poli, P., and Sato, H.: Atmospheric conservation properties in ERA-Interim, Q. J. Roy. Meteorol. Soc., 137, 1381–1399, https://doi.org/10.1002/qj.864, 2011. a
Bintanja, R. and Andry, O.: Towards a rain-dominated Arctic, Nat. Clim. Change, 7, 263–267, https://doi.org/10.1038/nclimate3240, 2017. a
Bintanja, R. and Selten, F.: Future increases in Arctic precipitation linked to local evaporation and sea-ice retreat, Nature, 509, 479–482, https://doi.org/10.1038/nature13259, 2014. a, b, c, d, e, f, g, h, i
Bintanja, R. and Van der Linden, E.: The changing seasonal climate in the Arctic, Scient. Rep., 3, 1556, https://doi.org/10.1038/srep01556, 2013. a
Biskaborn, B. K., Smith, S. L., Noetzli, J., Matthes, H., Vieira, G., Streletskiy, D. A., Schoeneich, P., Romanovsky, V. E., Lewkowicz, A. G., Abramov, A., Allard, M., Boike, J., Cable, W. L., Christiansen, H. H., Delaloye, R., Diekmann, B., Drozdov, D., Etzelmüller, B., Grosse, G., Guglielmin, M., Ingeman-Nielsen, T., Isaksen, K., Ishikawa, M., Johansson, M., Johannsson, H., Joo, A., Kaverin, D., Kholodov, A., Konstantinov, P., Kröger, T., Lambiel, C., Lanckman, J.-P., Luo, D., Malkova, G., Meiklejohn, I., Moskalenko, N., Oliva, M., Phillips, M., Ramos, M., Sannel, A. B. K., Sergeev, D., Seybold, C., Skryabin, P., Vasiliev, A., Wu, Q., Yoshikawa, K., Zheleznyak, M., and Lantuit, H.: Permafrost is warming at a global scale, Nat. Commun., 10, 264, https://doi.org/10.1038/s41467-018-08240-4, 2019. a
Bliss, A. C., Steele, M., Peng, G., Meier, W. N., and Dickinson, S.: Regional variability of Arctic sea ice seasonal change climate indicators from a passive microwave climate data record, Environ. Res. Lett., 14, 045003, https://doi.org/10.1088/1748-9326/aafb84, 2019. a, b
Born, A. and Nisancioglu, K. H.: Melting of Northern Greenland during the last interglaciation, The Cryosphere, 6, 1239–1250, https://doi.org/10.5194/tc-6-1239-2012, 2012. a
Bromwich, D. H., Wilson, A. B., Bai, L.-S., Moore, G. W. K., and Bauer, P.: A comparison of the regional Arctic System Reanalysis and the global ERA-Interim Reanalysis for the Arctic, Q. J. Roy. Meteorol. Soc., 142, 644–658, https://doi.org/10.1002/qj.2527, 2016. a, b
Brown, J., Ferrians Jr., O., Heginbottom, J., and Melnikov, E.: Circum-Arctic map of permafrost and ground-ice conditions, National Snow and Ice Data Center, Boulder, Colorado, USA, 1998. a
Collins, M., Knutti, R., Arblaster, J., Dufresne, J.-L., Fichefet, T., Friedlingstein, P., Gao, X., Gutowski, W., Johns, T., Krinner, G., Shongwe, M., Tebaldi, C., Weaver, A., Wehner, M., Allen, M., Andrews, T., Beyerle, U., Bitz, C., Bony, S., and Booth, B.: Long-term Climate Change: Projections, Commitments and Irreversibility, pp. 1029–1136, Intergovernmental Panel on Climate Change, Cambridge University Press, Cambridge, K, 2013. a, b
Comiso, J. C. and Hall, D. K.: Climate trends in the Arctic as observed from space, Wiley Interdisciplin. Rev.: Clim. Change, 5, 389–409, https://doi.org/10.1002/wcc.277, 2014. a
Dahl-Jensen, D., Mosegaard, K., Gundestrup, N., Clow, G. D., Johnsen, S. J., Hansen, A. W., and Balling, N.: Past Temperatures Directly from the Greenland Ice Sheet, Science, 282, 268–271, https://doi.org/10.1126/science.282.5387.268, 1998. a
Dee, D. P., Uppala, S., Simmons, A., Berrisford, P., Poli, P., Kobayashi, S., Andrae, U., Balmaseda, M., Balsamo, G., Bauer, P., Bechtold, P., Beljaars, A. C. M., van de Berg, L., Bidlot, J., Bormann, N., Delsol, C., Dragani, R., Fuentes, M., Geer, A. J., Haimberger, L., Healy, S. B., Hersbach, H., Hólm, E. V., Isaksen, L., Kållberg, P., Köhler, M., Matricardi, M., McNally, A. P., and Monge-Sanz, B. M., Morcrette, J.-J., Park, B.-K., Peubey, C., de Rosnay, P., Tavolato, C., Thépaut, J.-N., and Vitart, F.: The ERA-Interim reanalysis: Configuration and performance of the data assimilation system, Q. J. Roy. Meteorol. Soc., 137, 553–597, https://doi.org/10.1002/qj.828, 2011. a, b
EastGRIP: East Greenland Ice-core Project, available at: https://eastgrip.nbi.ku.dk/ (last access: 13 July 2020), 2018. a
Faber, A.-K., Møllesøe Vinther, B., Sjolte, J., and Anker Pedersen, R.: How does sea ice influence δ18O of Arctic precipitation?, Atmos. Chem. Phys., 17, 5865–5876, https://doi.org/10.5194/acp-17-5865-2017, 2017. a
Falkena, S. K., Wiljes, J., Weisheimer, A., and Shepherd, T. G.: Revisiting the identification of wintertime atmospheric circulation regimes in the Euro‐Atlantic sector, Q. J. Ro. Meteorol. Soc., 146, 2801–2814, https://doi.org/10.1002/qj.3818, 2020. a
Fremme, A. and Sodemann, H.: The role of land and ocean evaporation on the variability of precipitation in the Yangtze River valley, Hydrol. Earth Syst. Sci., 23, 2525–2540, https://doi.org/10.5194/hess-23-2525-2019, 2019. a
GISTEMP Team: GISS Surface temperature analysis, available at: https://data.giss.nasa.gov/gistemp/ (last access: 24 March 2020), 2016. a, b
Grams, C. M., Beerli, R., Pfenninger, S., Staffell, I., and Wernli, H.: Balancing Europe's wind-power output through spatial deployment informed by weather regimes, Nat. Clim. Change, 7, 557–562, https://doi.org/10.1038/nclimate3338, 2017. a
Hanna, E., Cropper, T. E., Jones, P. D., Scaife, A. A., and Allan, R.: Recent seasonal asymmetric changes in the NAO (a marked summer decline and increased winter variability) and associated changes in the AO and Greenland Blocking Index, Int. J. Climatol., 35, 2540–2554, https://doi.org/10.1002/joc.4157, 2015. a
Hanna, E., Cropper, T. E., Hall, R. J., and Cappelen, J.: Greenland Blocking Index 1851–2015: a regional climate change signal, Int. J. Climatol., 36, 4847–4861, https://doi.org/10.1002/joc.4673, 2016. a, b, c
Hu, Q., Jiang, D., Lang, X., and Yao, S.: Moisture sources of summer precipitation over eastern China during 1979–2009: A Lagrangian transient simulation, Int. J. Climatol., https://doi.org/10.1002/joc.6781, in press, 2020. a
Hurrell, J. W. and Deser, C.: North Atlantic climate variability: the role of the North Atlantic Oscillation, J. Mar. Syst., 79, 231–244, https://doi.org/10.1016/j.jmarsys.2009.11.002, 2010. a
Hurrell, J. W., Kushnir, Y., Ottersen, G., and Visbeck, M.: An Overview of the North Atlantic Oscillation, American Geophysical Union (AGU), 134, 1–35, 2003. a, b
Kattsov, V. M. and Walsh, J. E.: Twentieth-century trends of Arctic precipitation from observational data and a climate model simulation, J. Climate, 13, 1362–1370, https://doi.org/10.1175/1520-0442(2000)013<1362:TCTOAP>2.0.CO;2, 2000. a
Koenigk, T., Brodeau, L., Graversen, R. G., Karlsson, J., Svensson, G., Tjernström, M., Willén, U., and Wyser, K.: Arctic climate change in 21st century CMIP5 simulations with EC-Earth, Clim. Dynam., 40, 2719–2743, https://doi.org/10.1007/s00382-012-1505-y, 2013. a
Koyama, T. and Stroeve, J.: Greenland monthly precipitation analysis from the Arctic System Reanalysis (ASR): 2000–2012, Polar Sci., 19, 1–12, https://doi.org/10.1016/j.polar.2018.09.001, 2019. a, b, c
Kurita, N.: Origin of Arctic water vapor during the ice-growth season, Geophys. Res. Lett., 38, L02709, https://doi.org/10.1029/2010GL046064, 2011. a
Langhamer, L., Sauter, T., and Mayr, G. J.: Lagrangian Detection of Moisture Sources for the Southern Patagonia Icefield (1979–2017), Front. Earth Sci., 6, 219, https://doi.org/10.3389/feart.2018.00219, 2018. a, b, c
Mernild, S. H., Hanna, E., McConnell, J. R., Sigl, M., Beckerman, A. P., Yde, J. C., Cappelen, J., Malmros, J. K., and Steffen, K.: Greenland precipitation trends in a long-term instrumental climate context (1890–2012): evaluation of coastal and ice core records, Int. J. Climatol., 35, 303–320, https://doi.org/10.1002/joc.3986, 2015. a
Miller, G. H., Alley, R. B., Brigham-Grette, J., Fitzpatrick, J. J., Polyak, L., Serreze, M. C., and White, J. W.: Arctic amplification: can the past constrain the future?, Quaternary Sci. Rev., 29, 1779–1790, https://doi.org/10.1016/j.quascirev.2010.02.008, 2010. a
Moseley, G. E.: Report on the findings of the Northeast Greenland Caves Project 2015 expedition to Kronprins Christian Land, Northeast Greenland, Northeast Greenland Caves Project, Innsbruck, Austria, 96 pp., ISBN 978-3-9504355-0-4, 2016. a
NEGIS project: Greenland in a Warmer Climate, available at: http://community.dur.ac.uk/negis/, last access: 13 July 2020. a
NOAA: NAO-index: National Oceanic and Atmospheric Administration climate prediction centre, available at: https://ftp.cpc.ncep.noaa.gov/wd52dg/data/indices/nao_index.tim (last access: 24 January 2020), 2020a. a
NOAA: GBI: from the U of Lincoln based on Hanna et al. (2016), National Oceanic and Atmospheric Administration climate prediction centre, available at: https://psl.noaa.gov/gcos_wgsp/Timeseries/Data/gbi.mon.data (last access: 11 November 2020), 2020b. a
Nusbaumer, J., Alexander, P. M., LeGrande, A. N., and Tedesco, M.: Spatial Shift of Greenland Moisture Sources Related to Enhanced Arctic Warming, Geophys. Res. Lett., 46, 14723–14731, https://doi.org/10.1029/2019GL084633, 2019. a, b, c
Onarheim, I. H., Eldevik, T., Smedsrud, L. H., and Stroeve, J. C.: Seasonal and regional manifestation of Arctic sea ice loss, J. Climate, 31, 4917–4932, https://doi.org/10.1175/JCLI-D-17-0427.1, 2018. a, b
Ortega, P., Swingedouw, D., Masson-Delmotte, V., Risi, C., Vinther, B., Yiou, P., Vautard, R., and Yoshimura, K.: Characterizing atmospheric circulation signals in Greenland ice cores: insights from a weather regime approach, Clim. Dynam., 43, 2585–2605, https://doi.org/10.1007/s00382-014-2074-z, 2014. a
Owens, R. G. and Hewson, T.: ECMWF Forecast User Guide, ECMWF, Reading, https://doi.org/10.21957/m1cs7h, 2018. a
Pedregosa, F., Varoquaux, G., Gramfort, A., Michel, V., Thirion, B., Grisel, O., Blondel, M., Prettenhofer, P., Weiss, R., Dubourg, V., Vanderplas, J., Passos, A., Cournapeau, D., Brucher, M., Perrot, M., and Duchesnay, E.: Scikit-Learn: Machine Learning in Python, J. Mach. Learn. Res., 12, 2825–2830, 2011. a, b
Pendergrass, A. G. and Knutti, R.: The Uneven Nature of Daily Precipitation and Its Change, Geophys. Res. Lett., 45, 11980–11988, https://doi.org/10.1029/2018GL080298, 2018. a
Schuster, L., Maussion, F., Langhamer, L., and Moseley, G. E.: Lagrangian moisture sources for an arid region in northeast Greenland, Zenodo, https://doi.org/10.5281/zenodo.3972882, 2020. a
Screen, J. A. and Simmonds, I.: The central role of diminishing sea ice in recent Arctic temperature amplification, Nature, 464, 1334, https://doi.org/10.1038/nature09051, 2010. a
Serreze, M. C. and Barry, R. G.: The Arctic Climate System, in: Cambridge Atmospheric and Space Science Series, 2nd Edn., Cambridge University Press, Cambridge, https://doi.org/10.1017/CBO9781139583817, 2014. a, b, c, d, e
Shepherd, T. G.: Effects of a warming Arctic, Science, 353, 989–990, https://doi.org/10.1126/science.aag2349, 2016. a, b
Sodemann, H. and Zubler, E.: Seasonal and inter-annual variability of the moisture sources for Alpine precipitation during 1995–2002, Int. J. Climatol., 30, 947–961, https://doi.org/10.1002/joc.1932, 2010. a, b
Sodemann, H., Schwierz, C., and Wernli, H.: Interannual variability of Greenland winter precipitation sources: Lagrangian moisture diagnostic and North Atlantic Oscillation influence, J. Geophys. Res.-Atmos., 113, D03107, https://doi.org/10.1029/2007JD008503, 2008a. a, b, c, d, e, f, g, h, i, j, k
Sodemann, H., Masson-Delmotte, V., Schwierz, C., Vinther, B. M., and Wernli, H.: Interannual variability of Greenland winter precipitation sources: 2. Effects of North Atlantic Oscillation variability on stable isotopes in precipitation, J. Geophys. Res.-Atmos., 113, D12111, https://doi.org/10.1029/2007JD009416, 2008b. a
Sprenger, M. and Wernli, H.: The LAGRANTO Lagrangian analysis tool – version 2.0, Geosci. Model Dev., 8, 2569–2586, https://doi.org/10.5194/gmd-8-2569-2015, 2015. a
Stroeve, J. and Notz, D.: Changing state of Arctic sea ice across all seasons, Environ. Res. Lett., 13, 103001, https://doi.org/10.1088/1748-9326/aade56, 2018. a
Tsukernik, M., Chase, T. N., Serreze, M. C., Barry, R. G., Pielke, R., Herman, B., and Zeng, X.: On the regulation of minimum mid-tropospheric temperatures in the Arctic, Geophys. Res. Lett., 31, L06112, https://doi.org/10.1029/2003GL018831, 2004. a
Van Der Ent, R. J. and Tuinenburg, O. A.: The residence time of water in the atmosphere revisited, Hydrol. Earth Syst. Sci., 21, 779–790, https://doi.org/10.5194/hess-21-779-2017, 2017. a
Wernli, B. H. and Davies, H. C.: A Lagrangian-based analysis of extratropical cyclones. I: The method and some applications, Q. J. Roy. Meteorol. Soc., 123, 467–489, https://doi.org/10.1002/qj.49712353811, 1997. a
Wilks, D. S.: Statistical methods in the atmospheric sciences, vol. 100, Academic Press, available at: https://www.elsevier.com/books/statistical-methods-in-the-atmospheric-sciences/wilks/978-0-12-385022-5 (last access: 5 January 2021), 2011. a, b, c, d, e
Winschall, A., Pfahl, S., Sodemann, H., and Wernli, H.: Comparison of Eulerian and Lagrangian moisture source diagnostics – the flood event in eastern Europe in May 2010, Atmos. Chem. Phys., 14, 6605–6619, https://doi.org/10.5194/acp-14-6605-2014, 2014. a
Zeng, X., Brunke, M. A., Zhou, M., Fairall, C., Bond, N. A., and Lenschow, D. H.: Marine atmospheric boundary layer height over the eastern Pacific: Data analysis and model evaluation, J. Climate, 17, 4159–4170, https://doi.org/10.1175/JCLI3190.1, 2004. a