the Creative Commons Attribution 4.0 License.
the Creative Commons Attribution 4.0 License.
 | 01 Feb 2021
Extreme wet seasons – their definition and relationship with synoptic-scale weather systems
Emmanouil Flaounas
Matthias Röthlisberger
Maxi Boettcher
Michael Sprenger
Heini Wernli
An extreme aggregation of precipitation on the seasonal timescale, leading to a so-called extreme wet season, can have substantial environmental and socio-economic impacts. This study has a twofold aim: first to identify and statistically characterize extreme wet seasons around the globe and second to elucidate their relationship with specific weather systems.
Extreme wet seasons are defined independently at every grid point of ERA-Interim reanalyses as the consecutive 90 d period with the highest accumulated precipitation in the 40-year period of 1979–2018. In most continental regions, the extreme seasons occur during the warm months of the year, especially in the midlatitudes. Nevertheless, colder periods might be also relevant, especially in coastal areas. All identified extreme seasons are statistically characterized in terms of climatological anomalies of the number of wet days and of daily extreme events. Results show that daily extremes are decisive for the occurrence of extreme wet seasons in regions of frequent precipitation, e.g., in the tropics. This is in contrast to arid regions where wet seasons may occur only due to anomalously frequent wet days. In the subtropics and more precisely within the transitional zones between arid areas and regions of frequent precipitation, both an anomalously high occurrence of daily extremes and of wet days are related to the formation of extreme wet seasons.
A novel method is introduced to define the spatial extent of regions affected by a particular extreme wet season and to relate extreme seasons to four objectively identified synoptic-scale weather systems, which are known to be associated with intense precipitation: cyclones, warm conveyor belts, tropical moisture exports and breaking Rossby waves. Cyclones and warm conveyor belts contribute particularly strongly to extreme wet seasons in most regions of the globe. But interlatitudinal influences are also shown to be important: tropical moisture exports, i.e., the poleward transport of tropical moisture, can contribute to extreme wet seasons in the midlatitudes, while breaking Rossby waves, i.e., the equatorward intrusion of stratospheric air, may decisively contribute to the formation of extreme wet seasons in the tropics. Three illustrative examples provide insight into the synergetic effects of the four identified weather systems on the formation of extreme wet seasons in the midlatitudes, the Arctic and the (sub)tropics.
- Article
(12746 KB) - Full-text XML
-
Supplement
(2862 KB) - BibTeX
- EndNote


This study focuses on extreme precipitation, albeit not on short timescales of single weather systems like thunderstorms or cyclones, but on the seasonal timescale. The analysis of extreme precipitation events on timescales of hours to a few days has long been a centerpiece of weather and climate research due to their relevance for a variety of socio-economic aspects including damages to infrastructures and loss of life. Indeed, many studies investigated single extreme precipitation events to identify the key dynamical and physical processes involved (e.g., Doswell et al., 1998; Massacand et al., 1998; Delrieu et al., 2005; Holloway et al., 2012; Moore et al., 2012; Winschall et al., 2012; Flaounas et al., 2016). In addition, climatological studies quantified the relationship of extreme precipitation events with specific synoptic-scale flow systems like cyclones (Pfahl and Wernli, 2012), fronts (Catto and Pfahl, 2013) and warm conveyor belts (Pfahl et al., 2014). Finally, another important strand of research addressed the future evolution of extreme precipitation events in a changing climate, using a plethora of simulation ensembles, reanalysis datasets and observations (e.g., Easterling et al., 2000; Shongwe et al., 2011; Pfahl et al., 2017). However, socio-economic impacts related to precipitation are not limited to the occurrence of single, outstanding extreme precipitation events, but they are also potentially related to accumulated precipitation on longer timescales. For instance, the costliest, hyperactive North Atlantic hurricane season of 2017 had a significant impact on the coastal population of the US due to an anomalous sequence of tropical cyclones that made landfall, causing damages of the order of USD 370 billion and loss of human life (Halverson, 2018; Taillie et al., 2020). The 2017 hurricane season did not include any record-breaking intense hurricanes, although it included several hurricanes producing extreme precipitation. Another example of seasonal-scale environmental risk is the direct relationship between the seasonal rainfall over the Sahel and the epidemics of meningitis (Sultan et al., 2005). In fact, an anomalously wet African monsoon season may have a detrimental impact on public health on continental scales (Polcher et al., 2011).
The factors contributing to the formation of extreme seasons may not be linked directly to the anomalous occurrence of extreme events as intuitively expected. Röthlisberger et al. (2020) showed that an extreme hot or cold season may not be always provoked by the repetitive occurrence of exceptionally high or low temperatures, respectively. In contrast, an extremely warm summer can also occur due to its coldest days being anomalously mild. Therefore, the seasonal distribution of weather variables plays an important role in characterizing a season. Despite their high socio-economic relevance, the analysis of extreme wet seasons has not gained high visibility in climate research so far. This study addresses this research gap and aims to contribute to a better understanding of the characteristics of extreme wet seasons around the globe and to provide insight into the responsible weather systems.
The definition and identification of distinct precipitation seasons is a delicate issue and highly dependent on the region of interest. Monsoon-affected regions typically experience a clear onset date that signals the beginning of the precipitation period (Bombardi et al., 2017, 2019), while several midlatitude areas experience more than one rainy season, or they are characterized by wet conditions year-round. On the other hand, semi-arid and arid areas do not have clearly preferred precipitation periods due to the scarcity of wet days, and thus the definition of a precipitation season becomes less meaningful in these areas (Wu et al., 2007). Regardless, if a region experiences an extreme seasonal accumulation of precipitation, e.g., due to an anomalous frequency of daily extreme events, this has a potentially hazardous effect. Indeed, the above examples about hurricane and monsoon seasons illustrate that significant seasonal precipitation anomalies may be related to both an anomalous frequency and intensity of precipitation events. Depending on the region, seasonal precipitation extremes may be related to a well-defined, unique and recurrent weather system, such as tropical cyclones, or they may be related to a variety of weather systems that occur sequentially in the considered season, favored by regional- or global-scale atmospheric conditions. For instance, Davies (2015) and Röthlisberger et al. (2019) showed that the anomalously wet and stormy European winter of 2013–2014 was related to recurrent upper-tropospheric flow conditions that triggered a succession of high-impact weather systems. Priestley et al. (2017) showed that this was due to anomalous Rossby wave activity leading to cyclone clustering that affected in the UK in particular with a frequency of about 2.5 cyclones per day. Climatological influences might be also important for seasonal precipitation, for instance in the Mediterranean. A large majority of precipitation in this region is due to intense cyclones (Flaounas et al., 2018); however, the intensity of cyclones and related rainfall is influenced by the North Atlantic Oscillation and the El Niño–Southern Oscillation (Mariotti et al., 2002; Raible, 2007). Seasonal precipitation has been the theme of numerous studies in the past; however, in this study we add to the scientific understanding of this topic by focusing on extreme wet seasons and performing a systematic analysis of how individual weather systems contribute to their occurrence.
Weather systems on different spatial scales may interact to give rise to extreme wet seasons. For instance, synoptic-scale atmospheric conditions may favor the occurrence of and intensify mesoscale weather systems, which in turn may lead to variable amounts of precipitation depending on their physical characteristics, e.g., water vapor content, precipitation efficiency. It is a scientific challenge to delineate and objectively identify all links in the chain of events governing precipitation in climatological datasets. As mentioned above, several studies have quantified the role of specific weather systems such as cyclones (Hawcroft et al., 2012; Pfahl and Wernli, 2012; Flaounas et al., 2016), fronts (Catto et al., 2012), warm conveyor belts (Pfahl et al., 2014), tropical moisture exports (Knippertz and Wernli, 2010), troughs, cutoff systems and breaking Rossby waves (e.g., Martius et al., 2006; de Vries et al., 2018; Moore et al., 2019; De Vries, 2020) for precipitation on regional and global scales. Nevertheless, it is an open question whether these weather systems occur successively or act synergistically to form an extreme wet season in a certain region. Moreover, it is an open question whether extreme wet seasons may be produced by more frequent daily extreme events, more intense daily extremes, or by higher persistence of moderate rainfall – or a combination of these options. In fact, the aggregated contribution of a weather system to seasonal precipitation may be statistically characterized by the frequency and intensity of the precipitation it produces (e.g., Toreti et al., 2010; Moon et al., 2019). This study uses these concepts to statistically characterize extreme wet seasons, to address their spatial coherence, and to quantify the contributions of specific weather systems. In this way, we aim to provide novel insight into the relationship between the statistical characteristics of extreme wet seasons and their dynamical origin.
In the next section, we present the datasets and methods used to define extreme wet seasons and to objectively identify the contributing weather systems. In Sect. 3, we perform a statistical approach at every grid point to characterize extreme wet seasons by the number of daily extreme precipitation events and by the number of wet days that occur in this season. The spatial coherence of extreme wet seasons is then analyzed in Sect. 4. Section 5 shows examples of the complexity of how different weather systems contribute to extreme wet seasons, and Sect. 6 provides a global overview of these contributions. Finally, Sect. 7 provides the summary and conclusions.
2.1 Identification of extreme wet seasons
We use daily accumulated precipitation fields from the ERA-Interim (ERAI) reanalysis of the European Centre for Medium-Range Weather Forecasts (Dee et al., 2011) for the period of 1979–2018, on a global grid with 1∘ spacing in both longitude and latitude. Using a model-based instead of an observation-based dataset has the advantage of providing daily fields with continuous spatial coverage over both land and maritime areas. In addition, it assures consistent precipitation fields with atmospheric dynamics. On the other hand, global reanalyses have a rather coarse grid spacing, permitting only the analysis of precipitation related to synoptic-scale weather systems. Forty years is a rather short period to analyze extreme wet seasons climatologically, with roughly 40 precipitation seasons in most regions of the globe (Bombardi et al., 2017). Our overarching objective is to provide insights into their link with weather systems. Therefore, “extremeness” is used in this study as a term with impact-related content, rather than to characterize wet seasons statistically as periods with a low probability of occurrence. Extreme wet seasons (in the following just referred to as extreme seasons) have been defined separately at every grid point, as the consecutive 90 d period with the highest amount of accumulated precipitation in the 40-year period of 1979–2018. Prior to identifying extreme seasons, daily precipitation amounts less than 1 mm have been set to zero. This was done to avoid characterizing days with very low model-produced accumulations as wet days. Choosing any consecutive 90 d period instead of the standard astronomical definition of seasons was motivated by variations of well-defined precipitation seasons at different latitudes (Bombardi et al., 2019). However, considering only the top 90 d period of accumulated precipitation risks neglecting other periods that present almost equally high precipitation amounts. Such periods fall within the scope of this study, which is to characterize seasons with potentially high-impact accumulations of precipitation. Therefore, secondary extreme seasons have been also considered at every grid point even if these seasons may not be statistically considered as extreme. They correspond to 90 d periods with accumulated precipitation exceeding 90 % of the precipitation in the primary extreme season at the same grid point. All primary and secondary extreme seasons at one grid point were forced to not overlap in time. The result of this first step is, for every grid point, a list with the primary extreme season and a number of secondary extreme seasons (zero to 28 with a median of 2). Each of these seasons is characterized by their time period and precipitation amount. All results in Sect. 3 are based on this dataset.
2.2 Spatial and temporal coherence of extreme wet seasons
After identifying primary and secondary extreme seasons at every grid point, we examine their spatial coherence. To this end, we consider that two neighboring grid points are experiencing the same extreme season if their corresponding 90 d periods overlap temporally by at least 75 %, i.e., if they have at least 68 d in common. Figure 1 illustrates an example of our approach for an idealized one-dimensional space–time grid, where extreme seasons with differing time periods have been identified at six neighboring grid points. According to our methodology, the extreme seasons identified at grid points 1–3 fulfill the time overlap criterion and form a spatially coherent extreme season, which we refer to as a “patch” in the following. Analogously, grid points 4 and 5 form an extreme season patch, but this patch is distinct from the patch formed by grid points 1–3. Note that as an effect of this approach, a patch eventually extends over a time period that is longer than 90 d; we will address this issue in detail in Sect. 4.2. Because every grid point may have several secondary extreme seasons, the same grid point can be part of several patches. To identify all possible patches, we repeated the procedure illustrated in Fig. 1 using as the starting point every identified extreme season at every grid point (the primary and any secondary ones). This resulted in a high number of patches, with many (almost) identical patches. After removing duplicates, i.e., patches with at least 90 % of common points in space and time, we ended up with a total of 3734 patches, each representing a spatially and temporally coherent extreme season. For all patches, the coordinates of their grid points and their time periods are available in the Supplement.
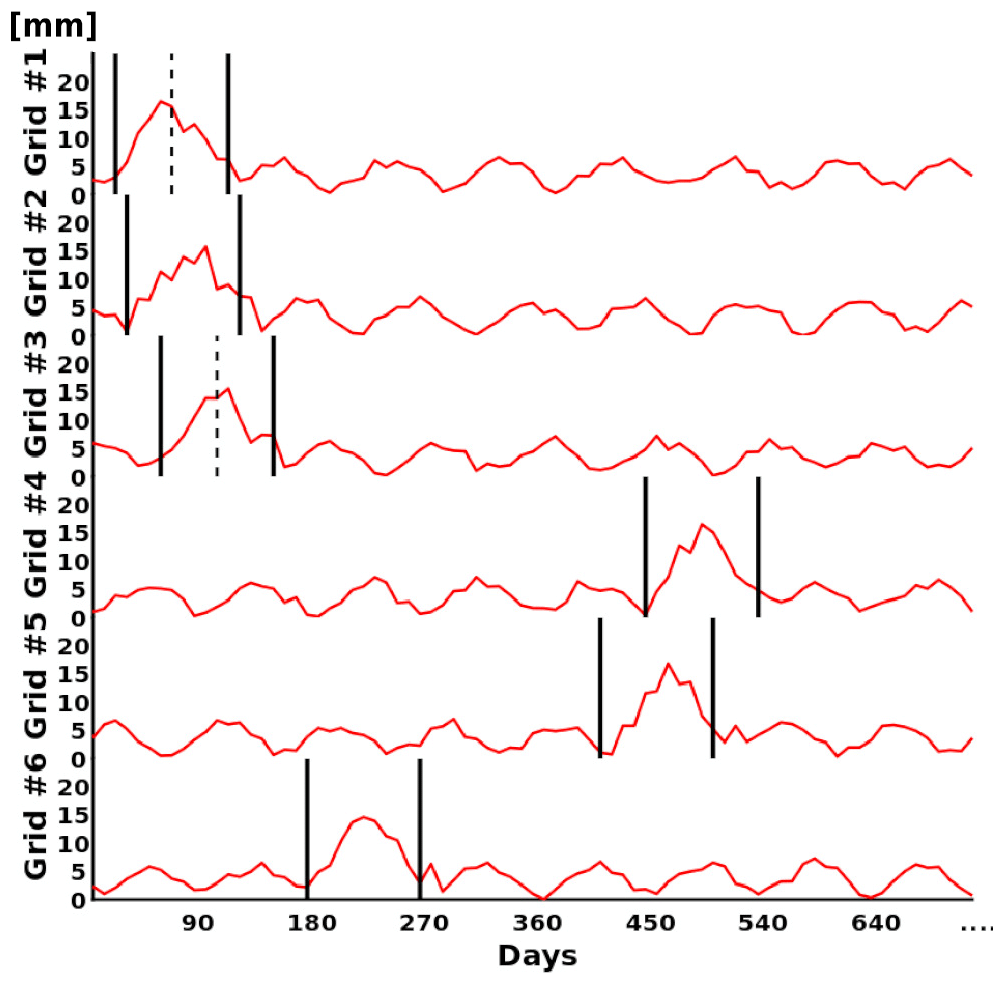
Figure 1Methodological approach in an idealized one-dimensional grid to identify spatial coherences of extreme seasons. Red lines show precipitation time series per grid point, vertical black lines delineate the identified extreme season per grid point and vertical dotted lines depict their central date (only for two seasons, to be used as an example in text).
2.3 Relating weather systems with extreme seasons
The relationship between extreme wet season patches and individual weather systems is examined for cyclones, warm conveyor belts (WCBs), tropical moisture exports (TMEs) and events of Rossby wave breaking (RWB). All these weather systems are objectively identified in the 40-year ERAI dataset using 6-hourly atmospheric fields and the methods described in Sprenger et al. (2017) and references therein. In essence, at every 6-hourly time step of ERAI and for every weather system, the algorithms identify spatially coherent clusters of grid points that belong to the same weather system, very much like the patches of the extreme wet seasons. Table 1 provides a summary of the identification criteria and algorithms used.
Table 1Short description of the six objectively identified weather systems.
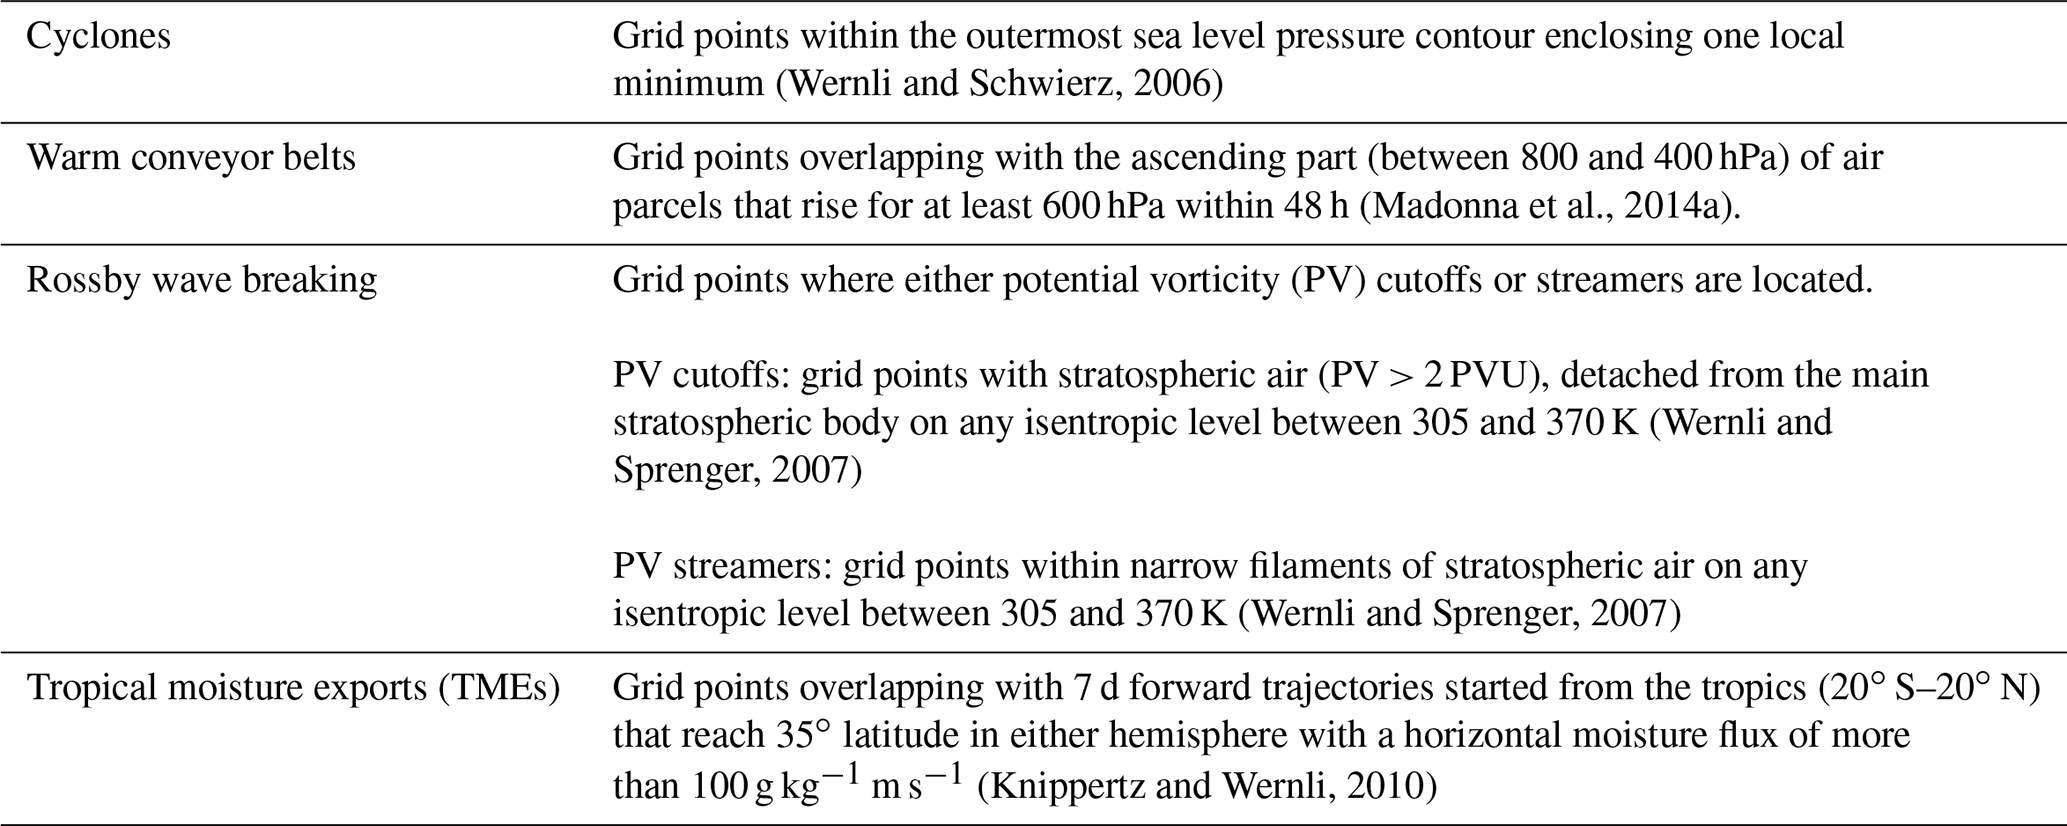
All four weather systems are well known to be related to heavy precipitation. Precipitation in the vicinity of these systems is the outcome of a rather complex interaction of dynamical processes that differ between the four systems. For instance, cyclones are known to be responsible for a large part of global precipitation (Hawcroft et al., 2012; Pfahl and Wernli, 2012). The precipitation within cyclones may be attributed to a variety of processes such as deep convection in their center (e.g., in the eyewall of tropical cyclones) and to a combination of convective and stratiform precipitation along the frontal structures of extratropical cyclones (Catto and Pfahl, 2013). Especially concerning frontal structures, WCBs can be identified as distinct ascending airstreams extending through a cyclone warm sector that produce high amounts of stratiform and in some cases also convective precipitation (Browning et al., 1973; Flaounas et al., 2017; Oertel et al., 2019). Precipitation due to WCBs affects both the central region of a cyclone and the associated fronts (Catto et al., 2013; Catto and Pfahl, 2013; Pfahl et al., 2014). TMEs foster precipitation indirectly by supplying moisture that may rain out when reaching a region with dynamical or orographic forcing for ascent. Finally, RWB can also lead to long-range transport of water vapor, impose large-scale lifting, and reduce static stability in the lower and middle troposphere, thus favoring intense precipitation (Martius et al., 2006; de Vries et al., 2018; De Vries, 2020). Sometimes these weather systems occur simultaneously. For instance, RWB may lead to the formation of cyclones that in turn may include WCBs. Therefore, it is an ill-posed problem to determine the separate contribution of these weather systems to total precipitation. However, the objective identification of these weather systems in gridded datasets and counting their seasonal frequency of occurrence may provide interesting insights into their role in extreme wet seasons.
A common framework has been applied to quantify the co-occurrence of these weather systems and extreme season patches. This co-occurrence is defined for each patch as the number of grid points of the patch that overlap with a specific weather system (note that all our weather systems are defined as two-dimensional objects), averaged during the core period (see Sect. 4.2) of the patch. We then show ratios of this co-occurrence during the core period of the considered extreme season (e.g., from 10 February to 22 May 1993) with respect to the climatological co-occurrence (40-year average for periods from 10 February to 22 May). A more detailed method to quantify co-occurrence would require a direct attribution of precipitation to each weather feature, as done, for example, by Moore et al. (2019) and De Vries (2020). Nevertheless, this would increase the complexity, since several weather systems may interact to synergistically produce high precipitation amounts, as explained above. Our method thus simply quantifies the co-occurrence of weather systems and extreme wet seasons in the regions identified as wet season patches. Nevertheless, due to the direct relevance of the four weather systems for precipitation, our approach provides insight into the role of weather systems in forming extreme seasons.
Figure 2a shows the number of extreme seasons identified at each grid point, while Fig. 2b shows, as a reference, the global distribution of annual mean precipitation during the 40-year period in ERAI. Most regions, in particular most land and climatologically drier regions, show no more than one to five extreme wet seasons. However, the number of identified extreme seasons increases to 5–20 in areas where the annual precipitation amount is high, in particular in the inter-tropical convergence zone (ITCZ) and the midlatitude storm tracks over the eastern North Pacific, the North Atlantic and in the Southern Ocean along 60∘ S. This suggests that in these regions, seasonal precipitation typically varies only by fractions rather than multiples of the climatological mean. Therefore, numerous 90 d periods fall within our definition of secondary “extreme wet seasons”. These periods reach almost the same accumulated precipitation as the locally wettest period and, therefore, we also choose to use the terminology “extreme wet seasons” for these periods throughout this paper.
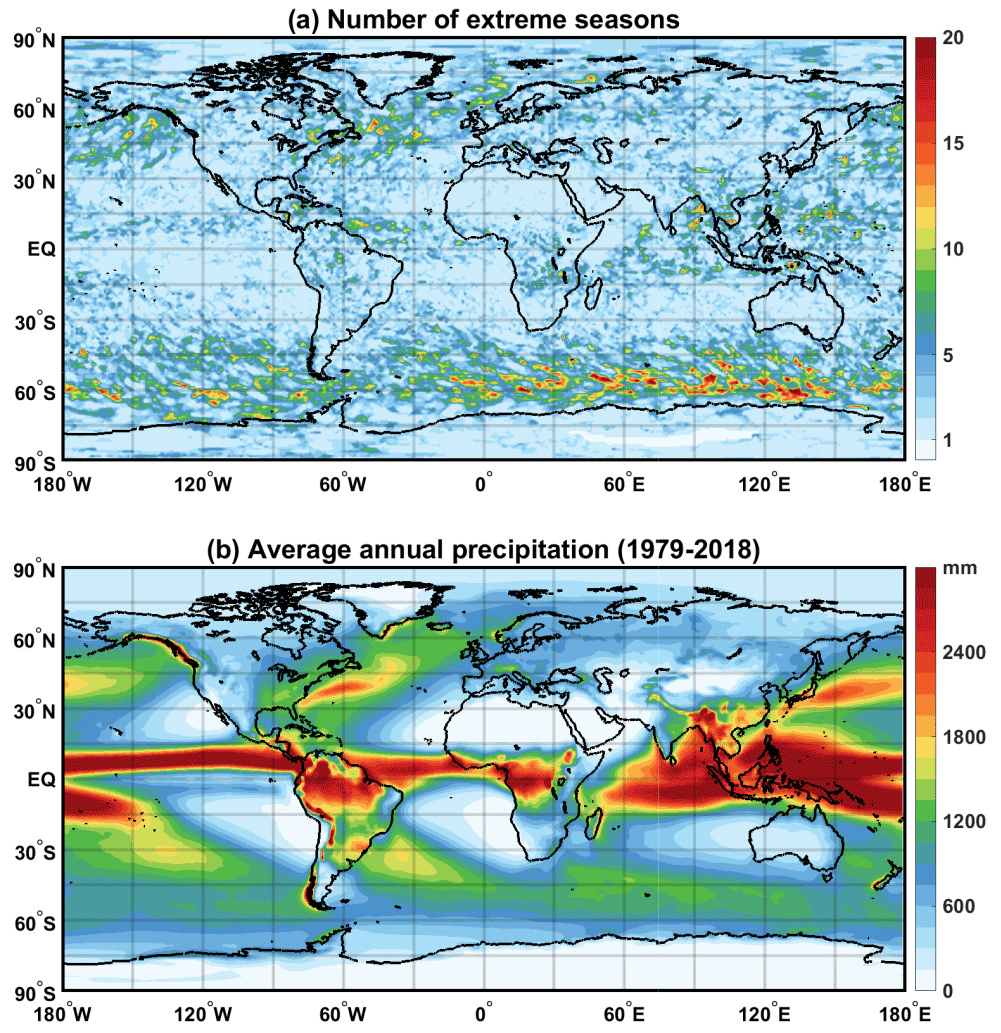
Figure 2(a) Global distribution of the number of extreme seasons. (b) Average annual precipitation in a 40-year period (1979–2018).

Figure 3Month during which the central day of the primary extreme season occurred at each grid point.
Figure 3 shows the seasonality of the primary extreme seasons. Color assignment is done according to the month that includes the central date of each primary extreme season. In both hemispheres there is a clear shift in seasonality from oceanic to land regions. Over midlatitude continental areas, extreme wet seasons occur predominantly during boreal and austral summer, when convection triggered by strong solar radiation becomes important (see, for example, Rüdisühli et al., 2020, for Europe). Over midlatitude maritime areas, the extreme seasons occur mainly in boreal and austral winter, when storm tracks are fully developed and extratropical cyclones tend to be most intense and occur most frequently. In regions where tropical cyclones occur frequently (e.g., in the Caribbean and southern Indian Ocean), the wettest seasons occur in the respective autumn season. For the Arctic, extreme seasons occur in late summer and early autumn when sea ice coverage is at its minimum; for Antarctica, however, the pattern is very heterogeneous. In the tropics, extreme seasons are most frequent in regions affected by the latitudinal displacements of the ITCZ. However, Fig. 3 shows that the land–sea distinction is not equally sharp in all regions. For instance, the west coast of the US, the Iberian Peninsula and the north African coast, as well as Chile and eastern Australia, all experience primary extreme wet seasons in winter. This suggests that such regions are influenced by systems that made landfall, such as extratropical cyclones and atmospheric rivers (Rutllant and Fuenzalida, 1991; Leung and Qian, 2009; Lavender and Abbs, 2012; Flaounas et al., 2017). Other exceptions from the dominant summer occurrence of extreme wet seasons over land are several regions in the Northern Hemisphere where extreme seasons occur in spring, in contrast to summer for their neighboring continental areas. This is especially observed near Iran, in the southern part of the Arabian Peninsula, and in eastern China and the eastern US. Especially for the east coast of the US, springtime extreme seasons are conceivably related to anomalously frequent occurrences of daily extreme precipitation events (Li et al., 2018).
Next, the extreme seasons are statistically characterized. To this end, Fig. 4a shows the ratio of precipitation amounts during these seasons to climatological, i.e., 40-year-averaged, values for the same 90 d. Only results for primary extreme seasons are presented, while results are similar for secondary seasons. For instance, if a grid point experiences an extreme season from 10 February to 9 May 1991, then the value in Fig. 4a corresponds to the ratio of the total precipitation in this specific period with the precipitation in all periods in the 40 years from 10 February to 9 May. By definition, extreme seasons have larger precipitation amounts than the climatology and therefore the amount ratio is everywhere larger than 1. However, Fig. 4a shows that this ratio strongly varies from close to 1 to more than 6. Comparison with the climatology in Fig. 2b shows that lower ratios are found in areas where annual precipitation is high, such as within the ITCZ (where annual precipitation exceeds, on average, 2500 mm; see Fig. 2b) and along the midlatitude storm tracks (roughly between 30 and 60∘ latitude in both hemispheres, where averaged annual precipitation in Fig. 2b is of the order of 1500 mm). These low precipitation amount ratios are consistent with the high numbers of extreme seasons in these regions (Fig. 2a). In contrast, high ratios of precipitation amounts are observed in areas where annual amounts are low, such as near the poles and in the arid subtropical areas along 30∘ latitude in both hemispheres. The latter areas are climatologically affected by the descending branch of the Hadley cell, typically inhibiting precipitation occurrence, and therefore an anomalously high seasonal precipitation amount has the potential to exceed climatological values by a large factor. Finally, Fig. 4a shows that areas characterized by extreme seasons with amount ratios between 2 and 4 are located between strongly contrasting regions in terms of annual precipitation amounts (Fig. 2b). It is in these regions where spatial anomalies in the occurrence of precipitating weather systems (e.g., due to anomalous cyclone tracks) may play a crucial role in forming extreme seasons. This will be discussed in more detail in Sect. 6.
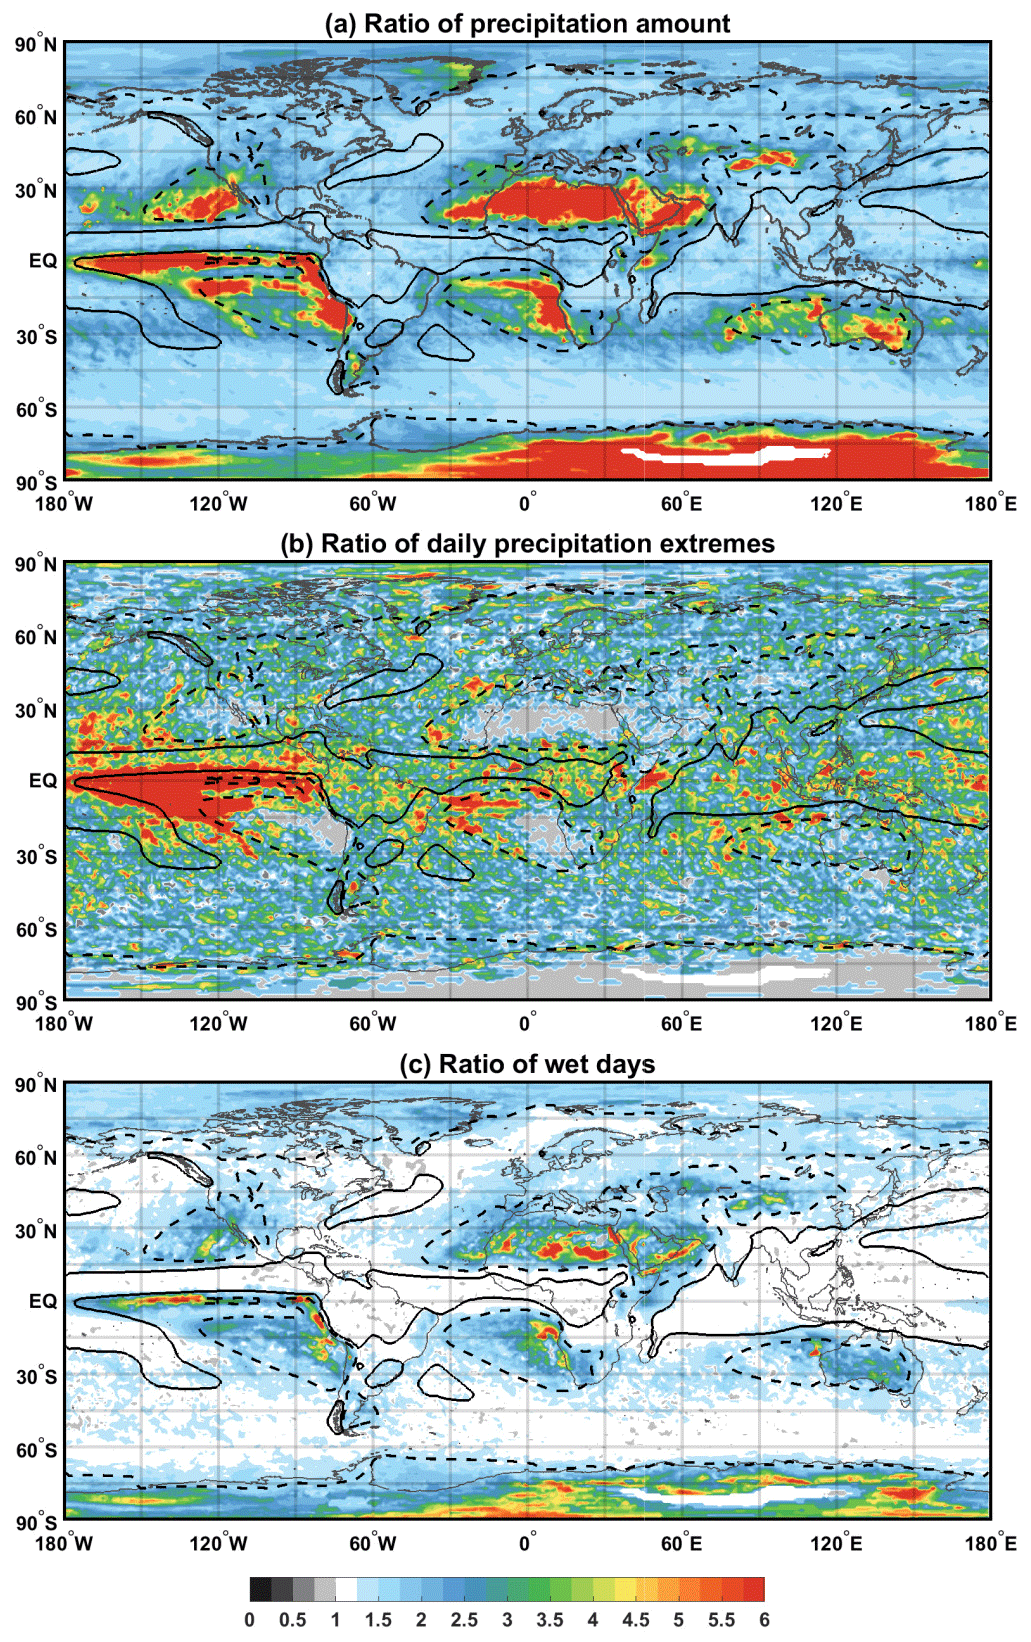
Figure 4(a) Ratio of precipitation amount of extreme seasons with respect to the seasonal average, and (b) the ratio of the number of daily precipitation extremes included in an extreme season with respect to the seasonal average. (c) As (b) but for the number of wet days. Dashed and solid contours depict annual average precipitation of 500 and 1500 mm.
To gain more statistical insight into the factors that lead to extreme seasons, Fig. 4b and c show the ratios of extreme daily precipitation events and wet days in extreme seasons with respect to climatology (evaluated for the same 90 d periods as the extreme seasons but in all 40 years). Daily extremes are defined individually at each grid point as daily precipitation values exceeding the 98th percentile of all wet days in the 40-year dataset, while wet days are defined by daily accumulations that exceed 1 mm. Comparing Fig. 4b and c, it appears that the ratios of daily precipitation extremes and wet days show a contrasting pattern: a high ratio of daily precipitation extremes tends to co-occur with a low ratio of wet days, and vice versa. This is especially evident in areas that feature particularly large and small precipitation amounts. For instance, in the ITCZ where precipitation is climatologically very frequent, an extreme season may occur due to increased rainfall amounts. This is reflected in the anomalously high ratios of daily precipitation extremes in extreme seasons (Fig. 4b). In contrast, in arid areas where rainfall occurs rarely (outlined by dashed contours in all panels of Fig. 4), a small increase in the number of wet days can be responsible for a dramatic increase in seasonally accumulated precipitation. It is thus plausible that the lower the climatological precipitation amounts in an area, the more an extreme season is characterized by an anomalously high frequency of wet days. On the other hand, in climatologically wet regions (such as in the tropics, within the solid contours of Fig. 4), extreme seasons are related to an anomalously high frequency of daily extremes. Apart from this contrast between climatologically wet and dry areas on the globe, some regions have relatively high ratios of both daily extremes and wet days. Indeed, when comparing Fig. 4b and c, areas with a high ratio of daily extremes are spatially less constrained than areas with a high wet-day ratio. This is especially true in the tropics and midlatitudes (up to 60∘ of latitude), suggesting that daily precipitation extremes may play a more widespread role in the occurrence of extreme wet seasons than the number of wet days.
In both Fig. 4b and c, a large majority of ratios exceeds the value of 1, suggesting that an extreme season typically occurs if there is a combination of both more wet days and more extreme events compared to the seasonal climatology. Indeed, Fig. 5a shows the probability density functions of the ratios of daily precipitation extremes and of wet days for all extreme seasons at all grid points. Clearly the spread of ratios of daily extremes is larger than the spread of ratios of wet days, with values between 1 and 5 and a median of 2.3 for daily extremes and a much narrower distribution with a median of 1.3 for wet days. Interestingly, the distribution for the daily extremes is bimodal with peaks near values of 1 and 2, respectively, where the first peak is related to arid areas. To combine information provided by the two ratios (mean values shown in Fig. 4b and c) and their variability (shown in Fig. 5a), we subjectively defined three ranges for the two distributions in Fig. 5a. These ranges are delimited by the peaks and the 75th percentile of the distributions (depicted by dashed lines in Fig. 5a). This forms a total of nine bins that serve to characterize each grid point according to the ratios of daily extremes and wet days required to form an extreme season (Fig. 5b). For instance, equatorial Africa and the Sahara are two contrasting regions of frequent and scarce precipitation, respectively. Cyan and light green colors in equatorial Africa indicate a low wet-day ratio of less than 1.2 and a daily extreme ratio of more than 2. Therefore, in this region, an extreme season requires only slightly more wet days than in the climatology but at least 2 times more daily extremes. Before further discussing these patterns, it is noteworthy that 13 % of all grid points feature ratios of daily precipitation extremes below 1 (Fig. 5a). These values are concentrated in areas of scarce precipitation and are depicted by grey colors in Fig. 4b. For wet days, ratios below 1 are even less common: they occur only for 3 % of all grid points and typically exhibit values between 0.9 and 1 (Fig. 5a). In contrast to daily precipitation extremes, these grid points are scattered across areas of frequent precipitation (e.g., ITCZ and storm tracks), where wet-day ratios are close to 1, i.e., where extreme seasons occur with roughly the climatological value of wet days.
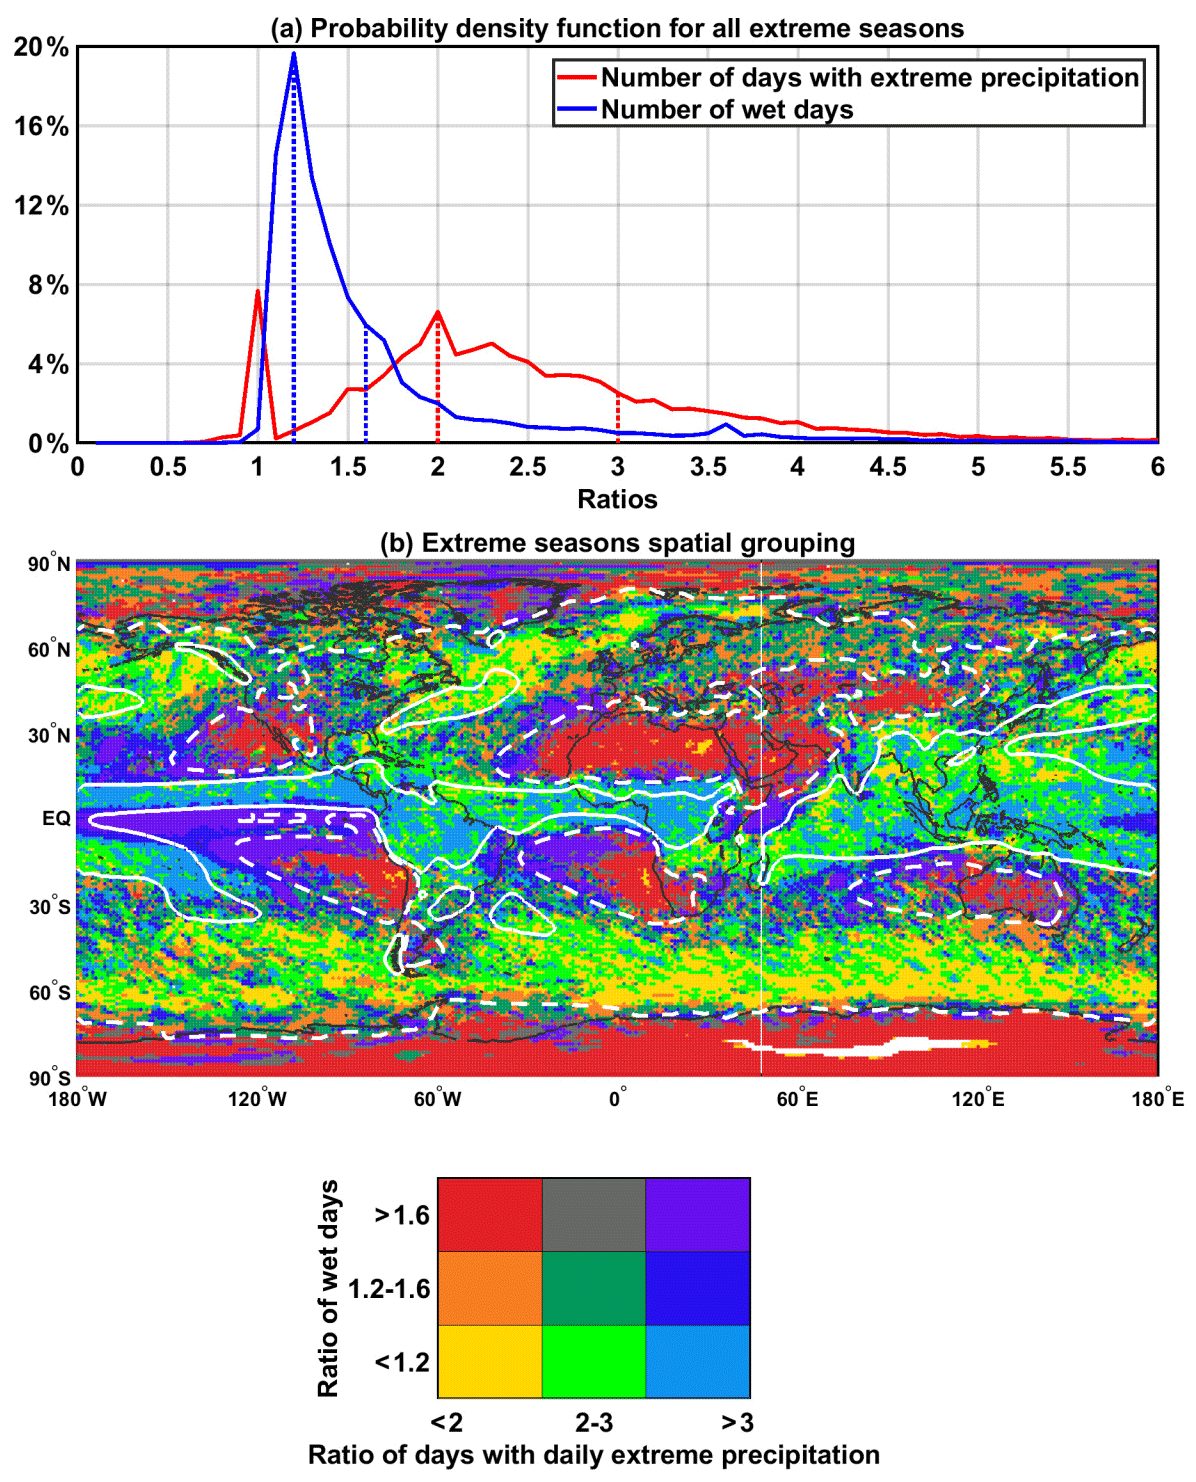
Figure 5(a) Probability density function of the number of ratios of daily precipitation extremes and wet days for all extreme seasons and for all grid points (ratios with respect to the seasonal average). Vertical dotted lines correspond to ratios of 1.2, 1.6, 2 and 3. (b) Attribution of grid points to nine categories of pairs of ratios of the number of wet days and of daily precipitation extremes. Dashed and solid white contours depict annual average precipitation of 500 and 1500 mm, respectively. Dotted lines in (a) show the category boundaries used in (b).
Despite the high spatial variability in Fig. 5b, several regional patterns can be distinguished. Areas related to high precipitation amounts (Fig. 2b) and a large number of extreme seasons (Fig. 2a), such as the storm tracks, are depicted by yellow colors in Fig. 5b (e.g., along 60∘ S). These areas are characterized by wet-day ratios of less than 1.2 and daily extreme ratios of less than 2. As discussed before, the identification of a high number of extreme seasons makes it difficult for these seasons to strongly exceed climatology. Other regions that experience high precipitation amounts due to the ITCZ have a daily extreme ratio exceeding 3 and a low wet-day ratio of less than 1.2 (cyan color), in agreement with the previous discussion of extreme seasons in this region. Extreme seasons with high wet-day and daily extreme ratios (purple colors) mostly occur in the transition between areas of high and low climatological amounts of precipitation (Fig. 2b), for instance in subtropical maritime areas in both hemispheres (e.g., the eastern Atlantic and Pacific oceans), but also in the eastern tropical Pacific. Especially the latter experiences major El Niño–Southern Oscillation (ENSO) events, which lead to a strong increase in wet days and daily extremes. Continental regions in the midlatitudes are mostly characterized by dark green and orange colors, suggesting that extreme seasons are characterized by 1.2 to 1.6 more wet days and less than 3 times as many daily extremes than in the climatology. It is, however, noteworthy that several coastal areas have extreme seasons characterized by the highest ratios of wet days and daily extremes (purple colors), for instance Portugal, eastern Australia and Greenland.
4.1 The 100 largest patches
The methodology to build patches of grid points with coherent extreme seasons (see Sect. 2.2) has been applied to all primary and secondary extreme seasons. Figure 6 shows the 100 largest patches in three panels to avoid overlapping. In these panels, patches are labeled by the month and year of the average date of all 90 d periods that compose the patches. The size of the patches in Fig. 6 varies between 1.75×10⁶ and 1.86×10⁷ km2. The largest one occurred from January to March 1983 in the eastern tropical Pacific (Fig. 6a).
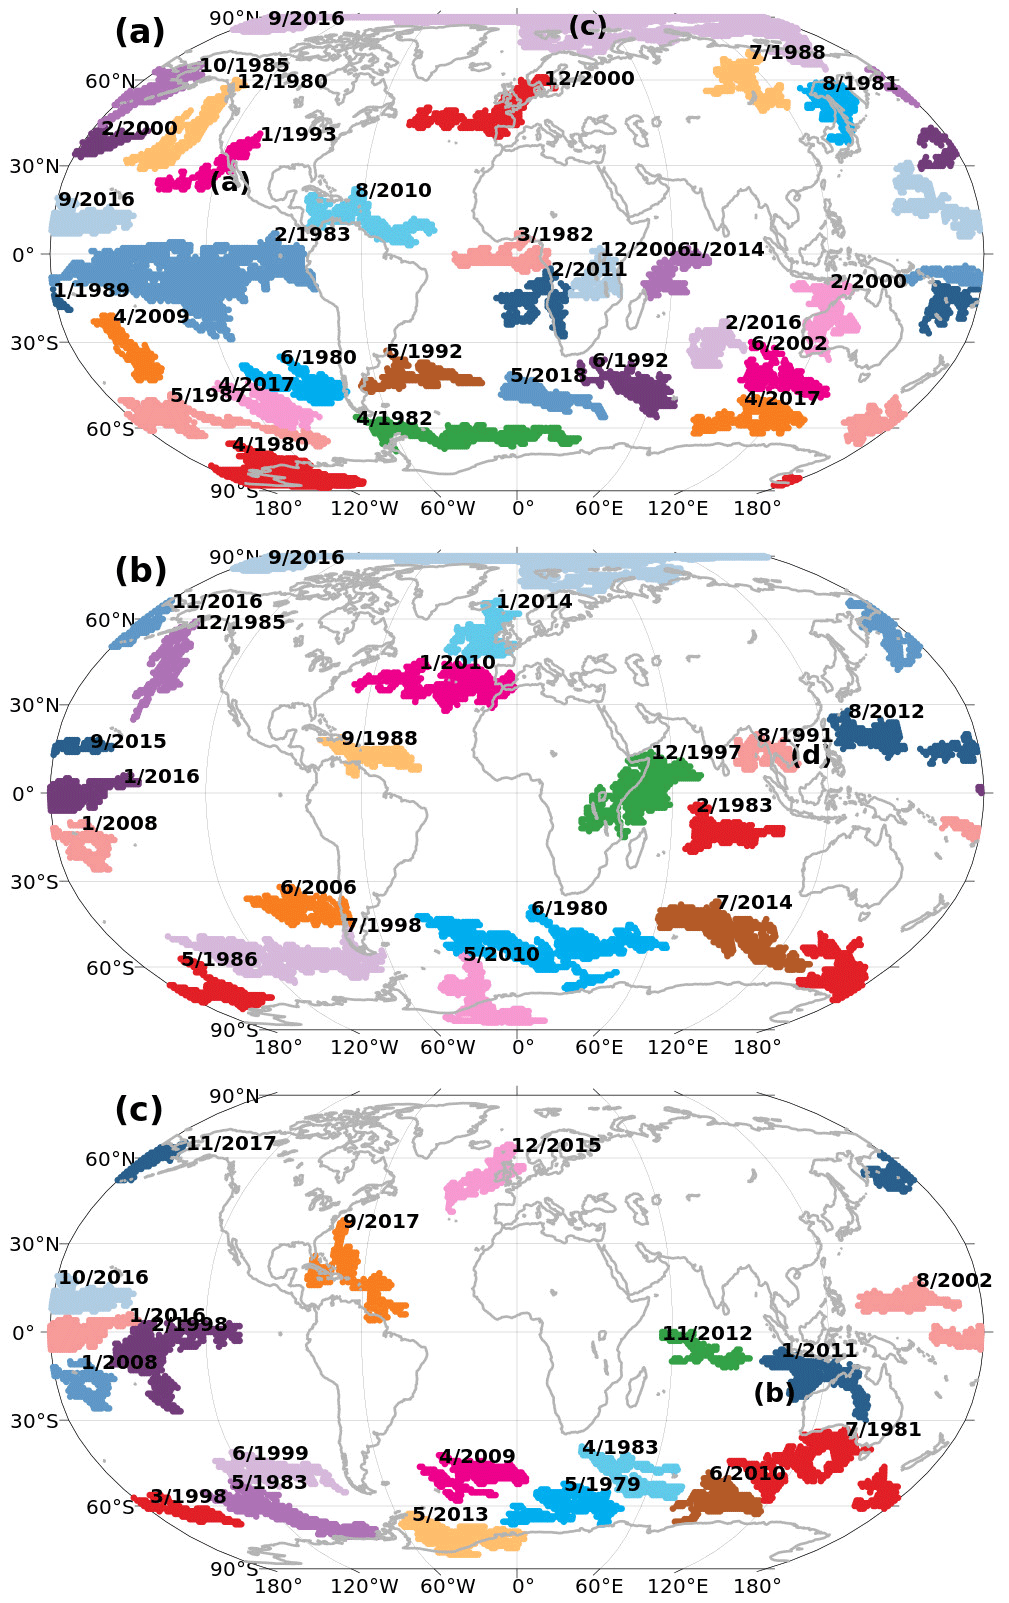
Figure 6The 100 largest patches, labeled with the central month and year of all included extreme seasons. For clarity reasons, all areas are distributed in three panels and are depicted by different random colors. Four patches are also labeled by a black letter in parenthesis that corresponds to panels in Fig. 7.
Several patches correspond to or include well-documented periods of anomalously high precipitation, and some of them also reflect singular weather events that produced enough precipitation to characterize a whole 90 d period as an extreme season. For instance, the patches in the western North Atlantic in Fig. 6a and c correspond to the anomalously active hurricane seasons of 2010 and 2017. In contrast to these active hurricane seasons, the patch in the same region in September 1988 (Fig. 6b) does not correspond to one of the most active hurricane seasons, but rather corresponds to the extremely intense Hurricane Gilbert (1988), one of the deepest hurricanes ever documented with a central pressure of 888 hPa. Other patches in the tropics agree with major El Niño and La Niña phases, such as the ones in 1982–1983, 1997–1998 and 2015–2016 in the central Pacific (Fig. 6a–c), and with ENSO-related extreme wet seasons in austral summer 2010–2011 (Fig. 6c; Ratna et al., 2014).
Within the storm tracks of the Northern Hemisphere, Fig. 6b shows two patches that are associated with anomalous variability of the polar jet: the first one corresponds to the extremely wet winter in the UK in 2013–2014, when an anomalously strong and persistent jet stream led to a series of extratropical cyclones hitting the region (Davies, 2015; McCarthy et al., 2016; Priestley et al., 2017). The second patch in the central North Atlantic along 35∘ N in winter 2009–2010 is associated with an anomalous southward deviation of the North Atlantic jet that led to a high frequency of TMEs and enhanced precipitation over the western Mediterranean (Harnik et al., 2014; Sprenger et al., 2017). Other patches that depict known cases affected northwestern Australia in 2000 and 2011 (Fig. 6a and c), associated with enhanced cyclone activity and a strong Mascarene high (Feng et al., 2013). Another example is discernible in the eastern Antarctic where anomalously high precipitation occurred in autumn 1980 (Fig. 6a) as discussed by van Ommen and Morgan (2010). All these examples provide insight into the variability of the specific weather systems and/or climatological features that can lead to extreme wet seasons. This relationship will be analyzed more systematically in the following sections.
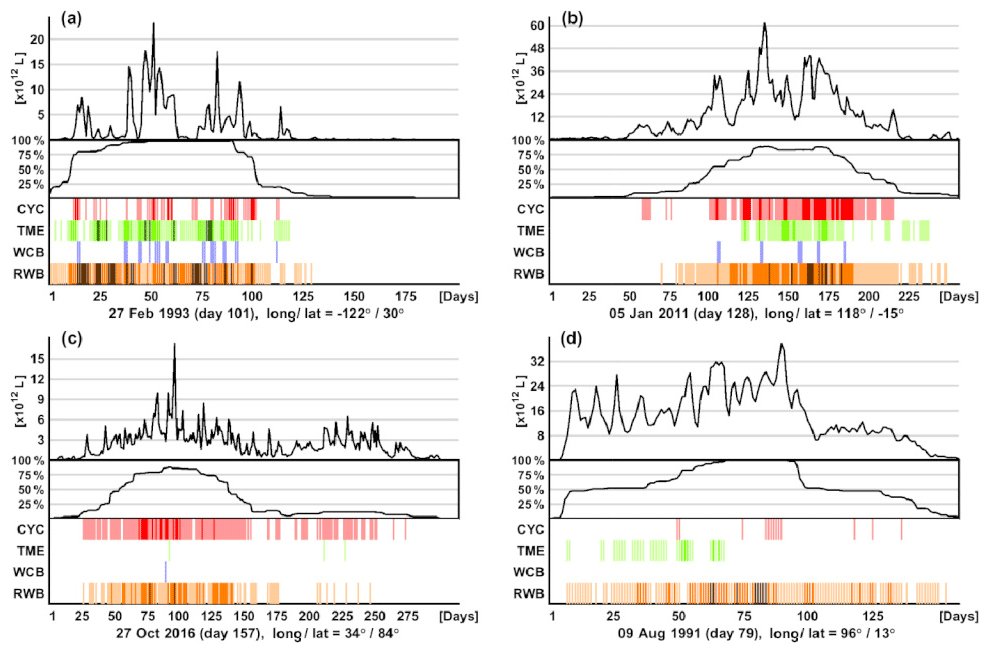
Figure 7Panels (a–d) depict exemplary patches, with each label corresponding to the respective panel's letter in Fig. 6. Time periods on the abscissa span from the earliest (day 1) to the latest date (e.g., day 170 in a) of all extreme seasons of the grid points that compose each patch. The upper part of each panel shows time series of daily precipitation, accumulated for all grid points that compose the patch. Given that the patch period on the abscissa is composed by non-identical extreme seasons per grid point, the time series in the middle of each panel shows the fraction of the extreme season patch that includes the respective day. The lower part of the panel marks each day by a vertical line if a weather system overlapped with the patch (see text): red for cyclones, blue for WCBs, green for TMEs and brown for RWB. Central date and average latitude and longitude of each of the four patches are shown under the panels.
4.2 Four example patches and definition of their core period
The patches provide a spatial dimension to the identified extreme seasons. However, with our approach (see Sect. 2.2) and especially for patches with many grid points, the combined period of extreme seasons (identified at every grid point) can extend over a significantly longer period than 90 d. Such patches tend to be located in regions where many secondary extreme seasons were identified, such as in the Southern Ocean. This is plausibly due to numerous secondary extreme season periods at neighboring grid points that can fulfill the temporal overlap criterion of 68 d (Sect. 2.2). In order to make the attribution to weather systems comparable across patches, the aim is here to define for each patch a “core period” that contains most of the area-integrated precipitation.
To illustrate this approach, we show detailed information about four selected example patches (labeled as a–d in Fig. 6) in Fig. 7. The central date, latitude and longitude of these patches are shown at the bottom of each panel. Figure 7a provides information on an elongated, tongue-like-shaped patch that affected the US west coast in winter 1992–1993 (label a in Fig. 6a). Figure 7b corresponds to a rather large patch that covers parts of Australia in summer 2010–2011 (label b in Fig. 6c). Figure 7c is for a patch in the Arctic in late summer 2016 (label c in Fig. 6a), and Fig. 7d presents an example in the Asian summer monsoon region in 1991 (label d in Fig. 6b). The time period in each panel of Fig. 7 spans the earliest day (referred to as day 1) and the latest day (e.g., day 200 in panel a) from all 90 d extreme season periods that contribute to the considered patch. For each patch, three time series are shown in the panels of Fig. 7: (i) the upper graphs show time series of daily precipitation summed over all grid points that include the same day within their corresponding 90 d extreme seasons. For instance, let a certain day in the abscissa be included in the 90 d extreme seasons of 15 out of 30 grid points that compose a patch. Then the upper graph of Fig. 7 shows the sum of daily precipitation in these 15 grid points for that certain date. (ii) The middle graphs show what we call the “percentage of contributing grid points”, i.e., the percentage of grid points of the patch that contain the considered day in their 90 d extreme season period. (iii) The bottom graphs indicate the occurrence of weather systems, as discussed below. For instance, the patch in the western US has a peak of area-integrated precipitation of L on day 52. This value corresponds to the sum of daily precipitation from all grid points of the patch (the percentage of contributing grid points is 100 %); i.e., this day is included in all 90 d extreme season periods of the grid points that compose this patch.
This visualization is now helpful to explain how a “core period” can be determined for each patch. All four examples show that at the beginning and near the end of a patch period, only a few grid points contribute to the patch and the area-integrated precipitation values are lower in these periods. Also, in all cases, there is a more or less central time interval when (almost) all grid points contribute to the patch, and in these intervals the integrated precipitation is largest. We therefore define the core period as the longest period during which at least 25 % of the respective grid points contribute to the patch. Considering again the western US patch (Fig. 7a), the so-defined core period extends from day 8 to day 104; for the monsoon patch (Fig. 7d) it becomes much longer from day 6 to day 141. It is noteworthy that core periods may not include days with locally intense precipitation events that do not affect a large fraction of the patch area. The intention of the core period is to consider precipitation in the entire larger-scale area of the extreme season patch, and to identify the time period that is most important for precipitation in the patch as a whole. Core periods of patches may last longer than 90 d, i.e., the default time period that was initially used to define extreme seasons at individual grid points. In fact, further analysis shows that for all 3734 patches, the median and the 75th and 95th percentile values of the core period durations amount to 99, 114 and 147 d, respectively. Assigning a flexible core period duration to each patch allows extreme wet season patches to take into account the climatological characteristics of the different regions on the globe. For instance, core periods in the tropics (Fig. 7d) may last for more than 100 d, corresponding to the duration of an intense monsoon season.
Finally, we now investigate the occurrence of the four objectively identified weather systems (Table 1) during the core periods of the four example patches. The bottom graphs in the panels of Fig. 7 show colored lines for each weather system type indicating the days when a system overlaps with parts of the patch. Three shadings of colors are used to indicate whether 5 % to 33 % of the grid points of the patch overlap with the weather system (light shading), or whether this percentage amounts to 33 %–66 % (medium shading), or to more than 66 % (dark shading). For instance, dark green bars in Fig. 7a denote days when TMEs overlap with more than 66 % of the western US patch. WCBs never exceed 33 % in Fig. 7 and thus only light blue shading is visible. This provides qualitative information about the occurrence and relevance of a weather system to the precipitation in the patch. Indeed, all four identified weather systems are known to be climatologically highly relevant for heavy rainfall. It is, however, noteworthy that large patches may exhibit several local maxima of precipitation on a given day, but not all of them necessarily overlap with one of the weather systems. In the following, we further investigate the exemplary patches of Fig. 7a–c to better understand the contribution of the four weather systems to the precipitation in these extreme season patches.
5.1 Cold season patches in the subtropical–midlatitude transition zone
The time series for the subtropical-to-midlatitude patch in Fig. 7a exhibits distinct peaks in the 96 d core period. Several of these peaks coincide with cyclones and TMEs, as shown in the bottom graph by the red and green lines, respectively. Figure 8 provides insight into the complex relationship between precipitation, cyclones and TMEs for this patch, but also for another patch of similar latitudinal extent and orientation that affected the Iberian Peninsula in late autumn 1989 (note that this additional patch is not depicted in Fig. 7). Figure 8a and b show that the patches present core period precipitation amounts that exceed climatological values by a factor that varies from 2 to 5. In fact, the northern parts of the patches are related to positive anomalies of cyclone occurrence of 5 % to 15 %. On the other hand, the southern parts of both patches are co-located with climatological anomalies of northern extensions of TME occurrences of the same order as for cyclones. It thus seems that cyclones act in synergy with TMEs to produce the large amounts of precipitation within the patch. Blue lines in the lower graph of Fig. 7a coincide with prominent peaks of area-integrated precipitation in the US patch, for instance on day 40. Hence, despite their rather infrequent occurrence, WCBs may still constitute a key dynamical ingredient to extreme seasonal precipitation amounts. To underline this point, Fig. 8c and d show daily precipitation, sea level pressure, and the spatial extent of TMEs and of ascending WCBs for peak precipitation days during the US patch (day 40, i.e., 29 December 1992) and the Iberian patch (26 December 1989), respectively. In both cases, the local maxima of daily precipitation exceeding 50 mm coincide with WCBs in the warm sectors of deep cyclones. Such amounts represent large contributions to the total precipitation during the patches' core period, and thus the two examples suggest links between processes on the weather timescale (extratropical cyclones and their associated WCBs) and seasonal-scale extreme precipitation. In fact, both these extreme wet season patches are in areas where cyclones and WCBs contribute frequently to intense precipitation (Pfahl et al., 2014; their Fig. 8).
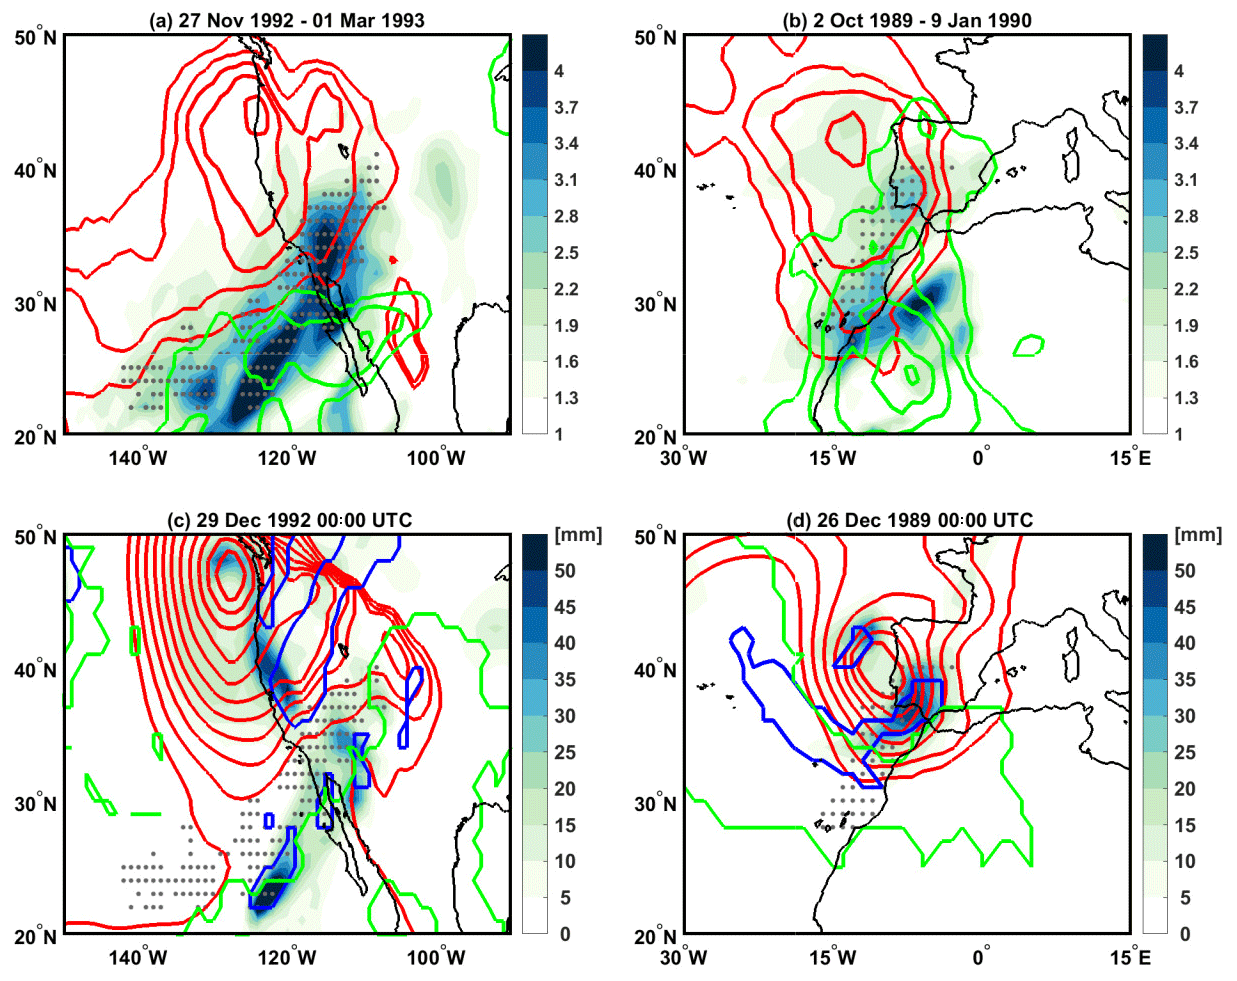
Figure 8(a) Ratio of accumulated precipitation during the period 27 November 1992 to 1 March 1993 with respect to climatological values for the same time period (in color) for an extreme wet season patch affecting the US west coast (dotted area). Red (green) contours show areas with positive anomalies of cyclone (TME) occurrences with respect to climatology. Contours start from 5 % and have a 5 % interval. (b) As (a) but for the period 2 October 1989 to 9 January 1990 for an extreme wet season patch affecting the Iberian Peninsula (dotted area). (c) 24 h accumulation of precipitation from 12:00 UTC on 28 December to 12:00 UTC on 29 December 1992 (in color). Red contours show sea level pressure at 00:00 UTC on 29 December 1992 (starting from 1015 hPa and with a step of −3 hPa). Green contours show areas with TMEs and blue contours show areas with WCB ascent. (d) As in (c) but at 00:00 UTC on 26 December 1989.
5.2 Warm season patch in the tropical–subtropical transition zone
Figure 9a provides more information about the northern Australian patch in summer 2010–2011, previously introduced in Fig. 7b. This patch covers large parts of the maritime areas northwest of Australia and includes a tongue-like extension to the center of the continent. Large parts of the patch overlap with areas with high cyclone frequencies, especially close to the west coast at 115∘ E, 20∘ S. In this part of the patch, a positive cyclone frequency anomaly of 10 % to 20 % is collocated with seasonal precipitation amounts of more than 5 times the climatological value. On the other hand, the northern part of the patch is located within the ITCZ of the Australian summer, a region where Coriolis forces are too weak to favor cyclogenesis. However, Fig. 9a shows that RWB events along the northern part of the patch took place during its core period with an anomalous occurrence of 20 % with respect to climatology. These RWB events can significantly contribute to the formation of precipitation by reducing the static stability beneath and forcing vertical ascent.
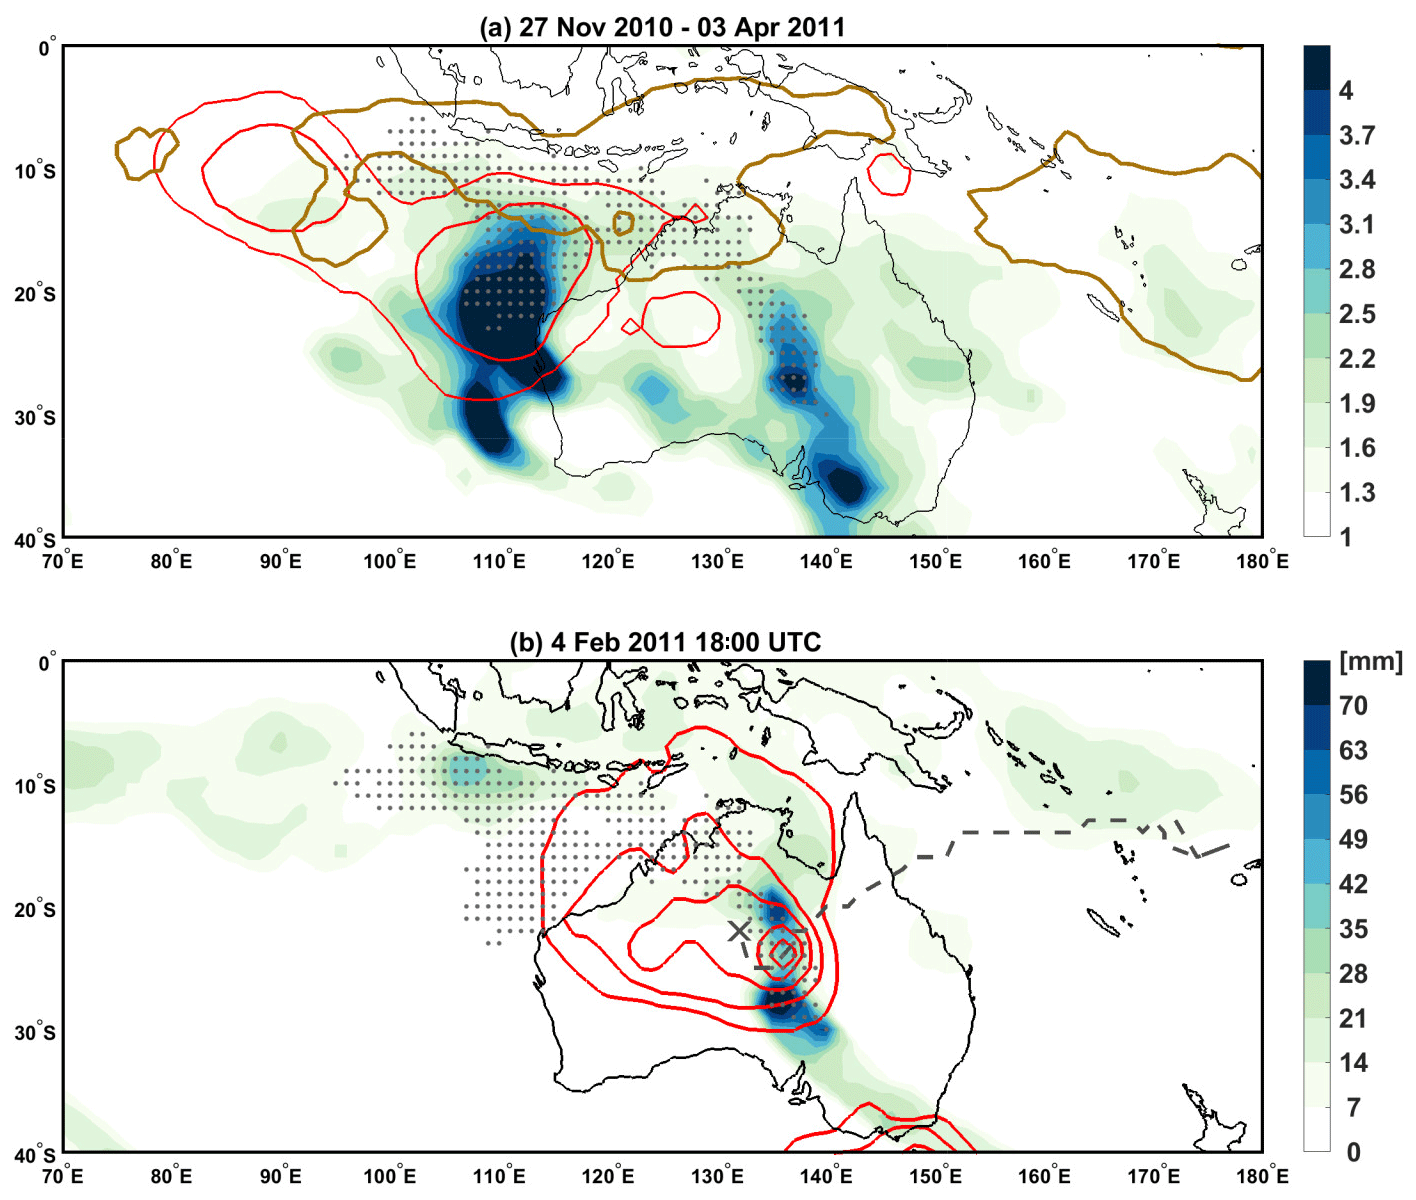
Figure 9(a) Ratio of accumulated precipitation during the period 27 November 2010 to 3 April 2011 with respect to climatological values for the same time period (in color) for an extreme wet season patch affecting Australia (dotted area). Red (brown) contours show areas with positive anomalies of cyclone (RWB) occurrences with respect to climatology (shown are anomalies of 10 % and 20 % for cyclones and 20 % for RWB). (b) 24 h accumulation of precipitation from 18:00 UTC on 3 February to 18:00 UTC on 4 February 2011 (in color). Red contours show sea level pressure at 18:00 UTC on 4 February 2011 (starting from 1006 hPa and with steps of −2 hPa). The grey dashed line shows the track of Tropical Cyclone Yasi, while its position of cyclolysis is represented by the cross symbol.
Further analysis showed that the narrow continental tongue of the patch is associated with a specific event: the landfall of Tropical Cyclone Yasi (track is shown in Fig. 9b). Yasi made landfall at the Australian east coast and moved into the continent in February 2011, contributing strongly to the precipitation peak around day 165 in Fig. 7b. Consequently, this Australian patch has been formed through the combined contribution of climatological features (the ITCZ) and enhanced precipitation by RWB, but also due to the frequent occurrence of cyclones in the northwest of Australia plus the single, prominent system of Tropical Cyclone Yasi. Therefore, the spatial extension of extreme season patches can be due to a combination of specific weather systems that occur in different subregions of the patch.
5.3 The summer 2016 patch in the Arctic
Figure 7c depicts a large patch that covers the eastern Arctic in late summer 2016 (dotted area in Fig. 10). Figure 10 shows that a large part of this patch is related to an anomalous occurrence of cyclones of 5 % to 10 % with respect to climatology. The region with anomalously frequent cyclones (red contour) agrees with the southward extension of the patch into Siberia near 150∘ E and with an anomalously high precipitation excess compared to climatology, with a ratio of more than 1.7. Figure 7c shows that several prominent peaks in the precipitation time series coincide with WCBs and RWB events, similarly to the subtropical patch in Fig. 7a. The year 2016 has been recorded as the warmest in the last decades in the Arctic and was characterized by anomalously low sea-ice extent and overall positive sea surface temperature anomalies that enhanced evaporation and consequently precipitation (Simpkins, 2017; Overland et al., 2019; Petty, 2018). Evidently, such conditions can lead to extreme wet seasons in the eastern Arctic and are similar to the ones leading to a rainier future regime in the Arctic region (Bintanja and Andry, 2017).
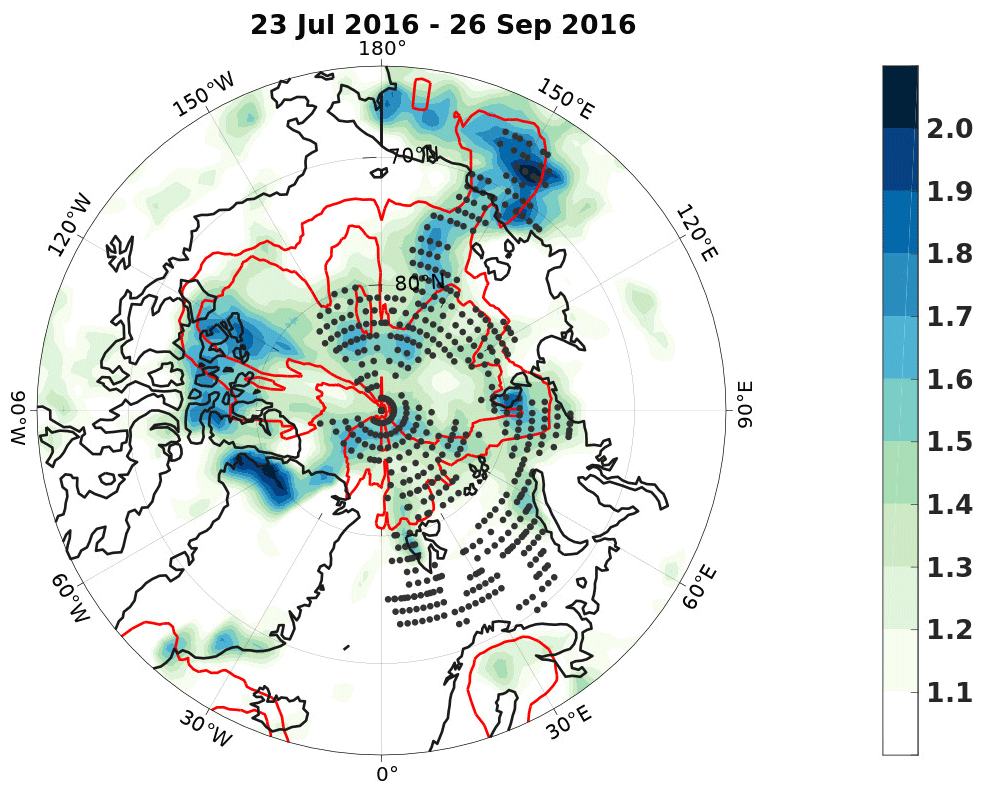
Figure 10Ratio of accumulated precipitation during the period 23 July to 26 September 2016 with respect to climatological values for the same time period (in color). Red contours show areas with positive anomalies of cyclone occurrences with respect to climatology (shown are contours of 5 % and 10 %). The spatial extent of the patch is represented by the dotted area.
Following the three examples of the previous section, we quantified the occurrence of the four objectively identified weather systems during all the 3734 identified patches. To this end, we counted the number of days with an overlap of each weather system with the patch during its core period. In order to then estimate whether these numbers are anomalous compared to climatology, this process was repeated for the same dates and grid points as for the core period, but for all 40 years of our dataset. The ratio then defines the overlapping frequency ratio of a patch with respect to climatology, and results are presented in Fig. 11. For instance, orange patches in Fig. 11a are overlapping about 2.5 times more often with cyclones during their core periods than in the climatology. In addition, the right-hand panels of Fig. 11 show the latitudinal distribution of the overlapping frequency ratios. They were calculated by zonally averaging the ratios of all patches within ±7.5∘ of each latitude degree. Figure 11 provides a global view of the relationship between patches and the occurrence of the identified weather systems. To provide a seasonal perspective of Fig. 11, but also to increase the figure clarity, we include in the Supplement four versions of Fig. 11, each showing only patches with a central date of their core period in boreal winter (DJF), spring (MAM), summer (JJA) and autumn (SON).

Figure 11All extreme wet season patches are colored according to their overlapping frequency ratios with specific weather systems (relative to the climatology). Panels in the right column show the latitudinal distribution of the overlapping ratios, as zonal averages within ±7.5∘ latitude. Patches may overlap between each other; to allow higher visibility for patches with highest ratios, the overlay of the patches in all panels started from the patch with the lowest ratio.
Figure 11a reveals the importance of cyclones for the formation of precipitation in extreme wet seasons. Most latitudes, except those in the tropics, are covered by patches with frequency ratios of at least 1.2. The latitudinal distribution of these ratios shows two local maxima in the subtropics close to 30∘ latitude. The origin of these maxima cannot be attributed clearly to tropical, subtropical or extratropical cyclones. Nevertheless, Fig. 3 shows that these regions experience their extreme seasons in the colder months of the year, and thus it is rather unlikely that tropical cyclones may contribute to their formation. Indeed, Fig. 11a shows that several patches in the subtropics have cyclone frequency ratios of more than 2, and in some cases even more than 4. Patches with high ratios occur in particular in subtropical oceanic regions, in transitional areas between climatologically high and low precipitation amounts (Fig. 2a). These regions are also characterized by an anomalously high number of wet days and daily extremes (Fig. 5b). This result suggests that cyclones occurring equatorward of the climatological storm tracks are a key ingredient for extreme wet seasons since they trigger anomalously frequent precipitation extremes in these regions (see also Pfahl and Wernli, 2012). Low ratios in Fig. 1a occur along the Equator due to the absence of cyclones, but also within the storm track regions (e.g., along 60∘ S). Especially in the Southern Hemisphere, the right panel of Fig. 11a shows that ratios decrease monotonically from 1.45 at 30∘ S, to 1.1 at 60∘ S. This result suggests that the closer a patch is located to a climatological storm track, the more unlikely it is for this patch to overlap with more cyclones than in the climatology. The same also holds in the Northern Hemisphere in the western North Atlantic and in the eastern North Pacific between 30 and 60∘ N.
WCBs are directly related to the occurrence of cyclones and can contribute significantly to extreme precipitation events (e.g., Pfahl et al., 2014; Oertel et al., 2019). Therefore, Fig. 11a and b are expected to be similar. This is partly confirmed by the latitudinal distribution of WCB ratios with peaks in the subtropics at 30∘ S and 25∘ N, similarly to the zonal averages of cyclone ratios. However, Fig. 11a and b also present considerable differences. For instance, the frequency ratio of WCBs along 60∘ S (Fig. 11b) is significantly higher than the one of cyclones (Fig. 11a). This suggests that extreme seasons within the storm tracks are not formed due to a higher frequency of cyclones but due to a higher frequency of WCBs. Indeed, WCBs essentially contribute to the enhancement of seasonal precipitation and thus to the formation of extreme seasons in midlatitude oceanic regions, but also in continental and polar regions. However, it is noteworthy that the climatological infrequency of WCBs, especially in the polar regions (e.g., Fig. 7c; see also Madonna et al., 2014a), can result in the high ratios in Fig. 11b, even if few WCBs occurred during the extreme season.
TMEs correspond to the transport of moist air from the tropics into the extratropics. Therefore, TMEs are expected to favor higher amounts of precipitation whenever they reach areas of strong ascending motion in higher latitudes. Indeed, Fig. 11c shows several patches with high TME frequency ratios, especially along 60∘ S, but also in the continental areas of Asia and North America. A quasi-constant zonal average of 1.1 is observed in the midlatitudes (right panel of Fig. 11c), suggesting that TMEs may contribute to the formation of extreme seasons in the extratropics. However, this contribution is expected to be weaker than the one from cyclones and WCBs. Occasionally, TMEs contribute to the formation of extreme seasons in the Arctic, but the high ratios in this region (Fig. 11c) result from only a few events during the extreme seasons and even fewer in the climatology.
Finally, Fig. 11d shows generally low values of overlapping ratios of RWB, rarely exceeding values of 1.5. This is a consequence of the fact that RWB is climatologically frequent, and thus the RWB frequency ratios cannot be as large as the ones of cyclones and WCBs, two weather systems with a lower climatological frequency. The latitudinal profile of RWB frequency ratios (right panel of Fig. 11d) presents two local minima, both in the midlatitudes of the two hemispheres where RWB is particularly frequent. However, when elongated RWB-related PV streamers occasionally intrude into the tropics, then extreme precipitation may be triggered (Knippertz, 2007). Because such events are rare and intense, a maximum of RWB ratios occurs in the tropics. It is plausible that extensions of PV streamers into the tropics lead to daily extreme events, a necessary ingredient for the formation of extreme seasons in these latitudes (e.g., Figs. 4b and 5b). Nevertheless, other weather systems or conditions than RWBs, cyclones and WCBs might be also involved in forming daily precipitation extremes in the tropics and thus be responsible for the formation of extreme seasons (e.g., a very strong ITCZ or warmer sea surface temperatures). Finally, in polar latitudes there are relatively high frequency ratios of RWB that may be directly related to the high frequency ratios of WCBs in the same areas (Fig. 11b), especially in the Southern Hemisphere. Indeed, WCBs are known to deepen the ridges in a poleward direction and thus to significantly contribute to RWB (e.g., Grams et al., 2011; Madonna et al., 2014b).
It is noteworthy that in all panels of Fig. 11 there are several patches where the ratios are below 1. This indicates that in the core periods of these patches fewer weather systems occurred than in the climatology. This can plausibly occur if the considered system is not decisive for extreme seasonal precipitation. In such a case, the frequency of occurrence in extreme seasons might be close to the climatological average; i.e., the ratio varies randomly around 1. For instance, the patch covering large parts of the great Australian Bight, at the central–south side of Australia, has a ratio below 1 for TMEs (Fig. 11c), whereas cyclones and WCBs have relatively high ratios of 1.6 and 2.2. It is plausible that TMEs do not play a crucial role in the formation of this extreme season compared to other more important contributions from cyclones and WCBs. It is finally noteworthy that we adopted a phenomenological approach to assess the contribution of specific weather systems to the extreme seasons, which only considers the occurrence of a weather system (categorical yes or no) but not specifically its associated precipitation. As a result, it cannot be excluded that a specific weather system might strongly contribute to the formation of an extreme season, even if its seasonal occurrence frequency is lower than in the climatology.
This study investigated extreme wet seasons globally and introduced them as a new concept at the interface of weather and climate research. First, we defined primary extreme wet seasons separately at every grid point of ERAI as the 90 d period with the largest accumulated precipitation in the last 40 years. To also account for 90 d periods with only slightly less precipitation, we also considered periods that exhibit at least 90 % of accumulated precipitation of the primary extreme season and called them secondary extreme seasons. Our results show that the definition of extreme wet seasons becomes a delicate issue in some areas. For instance, at some grid points in the Southern Hemisphere storm tracks up to 20 extreme seasons have been identified. In these regions where the variability is small compared to the mean, 90 d accumulated precipitation amounts show a rather small variability, rendering the label “extreme” for some of the identified seasons less meaningful from a statistical point of view. However, in many regions the identified extreme seasons exceed the climatologically expected precipitation amounts by large factors and several of them have been reported in the literature as particularly impactful.
Further analyses focused on the statistical characterization of extreme seasons by counting the number of wet days and daily precipitation extremes during the extreme seasons. The grand majority of extreme seasons include both more wet days and more daily extremes than in the climatology. Nevertheless, these two metrics allow different precipitation regimes to be delineated with two contrasting scenarios: regions of scarce precipitation (e.g., arid regions) where extreme seasons may only occur due to just a few more wet days, and regions with frequent precipitation (e.g., along the ITCZ) where daily extremes are pivotal for the occurrence of extreme seasons. Our results show that only extreme wet seasons in subtropical regions, i.e., located in the transition between rainy and arid areas, include significantly more wet days and daily extremes. A method was next applied to concatenate extreme seasons at individual grid points to patches, where each patch is affected by the same extreme season. Large patches were related to planetary-scale events such as extreme El Niño years, or the ITCZ, but also to single weather systems such as RWB and major extratropical cyclones and hurricanes making landfall in North America.
Four weather systems, known to be related to (extreme) daily precipitation events, were used to understand the role of synoptic-scale dynamics in forming extreme wet seasons. These systems were objectively identified in the 40-year dataset in order to quantify their overlap with the extreme wet season patches. To illustrate the complex interactions between these four weather systems and extreme season patches, we first investigated in detail three example patches in the midlatitudes, the (sub)tropics and the Arctic, respectively. Furthermore, we analyzed the global distribution of patches along with their relationship to the four objectively identified weather systems. Results highlighted the anomalously high occurrence of cyclones as a crucial element for the formation of most extreme seasons, except in the tropics and the storm tracks where cyclones are either unlikely to occur or very common. However, our results showed that extreme seasons in the storm track regions are related to an anomalously frequent occurrence of WCBs. Finally, RWB events have been found to contribute to the formation of extreme seasons at low latitudes, while TMEs were found to contribute to extreme seasons in the midlatitudes and the subtropics. Consequently, weather systems of different latitudinal origin may be important for the formation of extreme seasons. In fact, our overall results showed that extreme wet seasons can be either related to a higher occurrence of similar weather systems (e.g., the hyperactive hurricane season of 2017), to the contribution of single exceptional events (e.g., the landfall of Hurricane Yasi for the Australian extreme season in summer 2011) and/or to the influence of weather systems that are climatologically uncommon in specific regions (e.g., RWB in the tropics).
The variability of atmospheric dynamics within a 90 d period is large, and therefore it is a challenge to perform a detailed quantification of the contribution of weather systems to extreme wet seasons. Nevertheless, our results show that valuable conclusions can be reached by combining the objective identification of weather systems, together with a grid-point-based statistical analysis of precipitation. In this context, a high number of patches, especially the ones shown in Fig. 6, may be considered as interesting cases of highly anomalous seasonal precipitation that merit further investigation. Therefore, future research could focus on such case studies to better determine the degree of complexity of the dynamics involved, to develop new statistical characterizations of seasonal precipitation, or even to bridge more efficiently climate and weather perspectives on extreme wet seasons.
ERA-Interim is publicly available for download via the ECMWF archive at https://apps.ecmwf.int/datasets/ (last access: January 2021) (ECMWF, 2021). The cyclone track data are made available on request.
The supplement related to this article is available online at: https://doi.org/10.5194/wcd-2-71-2021-supplement.
EF and HW conceived the study and methods. EF wrote a major part of the paper and performed the analysis. MS provided technical support and all co-authors contributed to writing the paper and commented on its earlier versions.
The authors declare that they have no conflict of interest.
The authors are thankful to the two anonymous reviewers who helped to improve the quality of this paper with their constructive comments.
Emmanouil Flaounas, Matthias Röthlisberger and Maxi Boettcher acknowledge funding of the INTEXseas project from the European Research Council (ERC) under the European Union's Horizon 2020 research and innovation programme (grant agreement no. 787652).
This paper was edited by Juliane Schwendike and reviewed by two anonymous referees.
Bintanja, R. and Andry, O.: Towards a rain-dominated Arctic, Nat. Clim. Change, 7, 263–267, https://doi.org/10.1038/nclimate3240, 2017.
Bombardi, R. J., Pegion, K. V., Kinter, J. L., Cash, B. A., and Adams, J. M.: Sub-seasonal Predictability of the Onset and Demise of the Rainy Season over Monsoonal Regions, Front. Earth Sci., 5, 14, https://doi.org/10.3389/feart.2017.00014, 2017.
Bombardi, R. J., Kinter III, J. L., and Frauenfeld, O. W.: A Global Gridded Dataset of the Characteristics of the Rainy And Dry Seasons, B. Am. Meteorol. Soc., 100, 1315–1328, https://doi.org/10.1175/bams-d-18-0177.1, 2019.
Browning, K. A., Hardman, M. E., Harrold, T. W., and Pardoe, C. W.: The structure of rainbands within a mid-latitude depression, Q. J. Roy. Meteorol. Soc., 99, 215–231, https://doi.org/10.1002/qj.49709942002, 1973.
Catto, J. L., Jakob, C., and Nicholls, N.: A global evaluation of fronts and precipitation in the ACCESS model, Aust. Meteorol. Oceanogr. Soc. J., 63, 191–203, 2013.
Catto, J. L. and Pfahl, S.: The importance of fronts for extreme precipitation, J. Geophys. Res.-Atmos., 118, 10791–10801, https://doi.org/10.1002/jgrd.50852, 2013.
Catto, J. L., Jakob, C., Berry, G., and Nicholls, N.: Relating global precipitation to atmospheric fronts, Geophys. Res. Lett., 39, L10805, https://doi.org/10.1029/2012gl051736, 2012.
Davies, H. C.: Weather chains during the 2013/2014 winter and their significance for seasonal prediction, Nat. Geosci., 8, 833–837, https://doi.org/10.1038/ngeo2561, 2015.
Dee, D. P., Uppala, S. M., Simmons, A. J., Berrisford, P., Poli, P., Kobayashi, S., Andrae, U., Balmaseda, M. A., Balsamo, G., Bauer, P., Bechtold, P., Beljaars, A. C. M., van de Berg, L., Bidlot, J., Bormann, N., Delsol, C., Dragani, R., Fuentes, M., Geer, A. J., Haimberger, L., Healy, S. B., Hersbach, H., Hólm, E. V., Isaksen, L., Kållberg, P., Köhler, M., Matricardi, M., McNally, A. P., Monge-Sanz, B. M., Morcrette, J.-J., Park, B.-K., Peubey, C., de Rosnay, P., Tavolato, C., Thépaut, J.-N., and Vitart, F.: The ERA-Interim reanalysis: configuration and performance of the data assimilation system, Q. J. Roy. Meteorol. Soc., 137, 553–597, https://doi.org/10.1002/qj.828, 2011.
Delrieu, G., Nicol, J., Yates, E., Kirstetter, P.-E., Creutin, J.-D., Anquetin, S., Obled, C., Saulnier, G.-M., Ducrocq, V., Gaume, E., Payrastre, O., Andrieu, H., Ayral, P.-A., Bouvier, C., Neppel, L., Livet, M., Lang, M., du-Châtelet, J. P., Walpersdorf, A., and Wobrock, W.: The Catastrophic Flash-Flood Event of 8–9 September 2002 in the Gard Region, France: A First Case Study for the Cévennes–Vivarais Mediterranean Hydrometeorological Observatory, J. Hydrometeorol., 6, 34–52, https://doi.org/10.1175/jhm-400.1, 2005.
De Vries, A. J.: A global climatological perspective on the importance of Rossby wave breaking and intense moisture transport for extreme precipitation events, Weather Clim. Dynam. Discuss. [preprint], https://doi.org/10.5194/wcd-2020-44, in review, 2020.
de Vries, A. J., Ouwersloot, H. G., Feldstein, S. B., Riemer, M., El Kenawy, A. M., McCabe, M. F., and Lelieveld, J.: Identification of Tropical-Extratropical Interactions and Extreme Precipitation Events in the Middle East Based On Potential Vorticity and Moisture Transport, J. Geophys. Res.-Atmos., 123, 861–881, https://doi.org/10.1002/2017jd027587, 2018.
Doswell, C. A., Ramis, C., Romero, R., and Alonso, S.: A Diagnostic Study of Three Heavy Precipitation Episodes in the Western Mediterranean Region, Weather Forecast., 13, 102–124, https://doi.org/10.1175/1520-0434(1998)013<0102:ADSOTH>2.0.CO;2, 1998.
Easterling, D. R.: Climate Extremes: Observations, Modeling, and Impacts, Science, 289, 2068–2074, https://doi.org/10.1126/science.289.5487.2068, 2000.
Easterling, D. R., Meehl, G. A., Parmesan, C., Changnon, S. A., Karl, T. R., and Mearns, L. O.: Climate extremes: observations, modeling, and impacts, Science, 289, 2068–2074, https://doi.org/10.1126/science.289.5487.2068, 2000.
ECMWF: Public Datasets, available at: https://apps.ecmwf.int/datasets/, last access: January 2021.
Feng, J., Li, J., and Xu, H.: Increased summer rainfall in northwest Australia linked to southern Indian Ocean climate variability, J. Geophys. Res.-Atmos., 118, 467–480, https://doi.org/10.1029/2012jd018323, 2013.
Flaounas, E., Lagouvardos, K., Kotroni, V., Claud, C., Delanoe, J., Flamant, C., Madonna, E., and Wernli, H.: Processes leading to heavy precipitation associated with two Mediterranean cyclones observed during the HyMeX SOP1, Q. J. Roy. Meteorol. Soc., 142, 275–286, https://doi.org/10.1002/qj.2618, 2016.
Flaounas, E., Kotroni, V., Lagouvardos, K., Gray, S. L., Rysman, J.-F., and Claud, C.: Heavy rainfall in Mediterranean cyclones. Part I: contribution of deep convection and warm conveyor belt, Clim. Dynam., 50, 2935–2949, https://doi.org/10.1007/s00382-017-3783-x, 2017.
Flaounas, E., Kotroni, V., Lagouvardos, K., Gray, S. L., Rysman, J.-F., and Claud, C.: Heavy rainfall in Mediterranean cyclones. Part 1: contribution of deep convection and warm conveyor belt, Clim. Dynam., 50, 2935–2949, https://doi.org/10.1007/s00382-017-3783-x, 2018.
Grams, C. M., Wernli, H., Böttcher, M., Čampa, J., Corsmeier, U., Jones, S. C., Keller, J. H., Lenz, C.-J., and Wiegand, L.: The key role of diabatic processes in modifying the upper-tropospheric wave guide: a North Atlantic case-study, Q. J. Roy. Meteorol. Soc., 137, 2174–2193, https://doi.org/10.1002/qj.891, 2011.
Halverson, J. B.: The Costliest Hurricane Season in U.S. History, Weatherwise, 71, 20–27, https://doi.org/10.1080/00431672.2018.1416862, 2018.
Harnik, N., Galanti, E., Martius, O., and Adam, O.: The anomalous merging of the African and North Atlantic jet streams during the northern hemisphere Winter of 2010, J. Climate, 27, 7319–7334, https://doi.org/10.1175/JCLI-D-13-00531.1, 2014.
Hawcroft, M. K., Shaffrey, L. C., Hodges, K. I., and Dacre, H. F.: How much Northern Hemisphere precipitation is associated with extratropical cyclones?, Geophys. Res. Lett., 39, L24809, https://doi.org/10.1029/2012gl053866, 2012.
Holloway, C. E., Woolnough, S. J., and Lister, G. M. S.: Precipitation distributions for explicit versus parametrized convection in a large-domain high-resolution tropical case study, Q. J. Roy. Meteorol. Soc., 138, 1692–1708, https://doi.org/10.1002/qj.1903, 2012.
Knippertz, P.: Tropical–extratropical interactions related to upper-level troughs at low latitudes, Dynam. Atmos. Ocean, 43, 36–62, https://doi.org/10.1016/j.dynatmoce.2006.06.003, 2007.
Knippertz, P. and Wernli, H.: A Lagrangian climatology of tropical moisture exports to the Northern Hemispheric extratropics, J. Climate, 23, 987–1003, https://doi.org/10.1175/2009JCLI3333.1, 2010.
Lavender, S. L. and Abbs, D. J.: Trends in Australian rainfall: contribution of tropical cyclones and closed lows, Clim. Dynam., 40, 317–326, https://doi.org/10.1007/s00382-012-1566-y, 2012.
Leung, L. R. and Qian, Y.: Atmospheric rivers induced heavy precipitation and flooding in the western U.S. simulated by the WRF regional climate model, Geophys. Res. Lett., 36, L03820, https://doi.org/10.1029/2008gl036445, 2009.
Li, L., Schmitt, R. W., and Ummenhofer, C. C.: The role of the subtropical North Atlantic water cycle in recent US extreme precipitation events, Clim. Dynam., 50, 1291–1305, https://doi.org/10.1007/s00382-017-3685-y, 2017.
Li, L., Schmitt, R. W., and Ummenhofe, C. C.: The role of the subtropical North Atlantic water cycle in recent US extreme precipitation events, Clim. Dynam., 50, 1291–1305, https://doi.org/10.1007/s00382-017-3685-y, 2018.
Madonna, E., Wernli, H., Joos, H., and Martius, O.: Warm Conveyor Belts in the ERA-Interim Dataset (1979–2010). Part I: Climatology and Potential Vorticity Evolution, J. Climate, 27, 3–26, https://doi.org/10.1175/jcli-d-12-00720.1, 2014a.
Madonna, E., Limbach, S., Aebi, C., Joos, H., Wernli, H., and Martius, O.: On the co-occurrence of warm conveyor belt outflows and PV streamers, J. Atmos. Sci., 71, 3668–3673, https://doi.org/10.1175/JAS-D-14-0119.1, 2014b.
Mariotti, A.: Euro-Mediterranean rainfall and ENSO – a seasonally varying relationship, Geophys. Res. Lett., 29, 1621, https://doi.org/10.1029/2001gl014248, 2002.
Martius, O., Zenklusen, E., Schwierz, C., and Davies, H. C.: Episodes of alpine heavy precipitation with an overlying elongated stratospheric intrusion: a climatology, Int. J. Climatol., 26, 1149–1164, https://doi.org/10.1002/joc.1295, 2006.
Massacand, A. C., Wernli, H., and Davies, H. C.: Heavy precipitation on the alpine southside: An upper-level precursor, Geophys. Res. Lett., 25, 1435–1438, https://doi.org/10.1029/98gl50869, 1998.
McCarthy, M., Spillane, S., Walsh, S., and Kendon, M.: The meteorology of the exceptional winter of 2015/2016 across the UK and Ireland, Weather, 71, 305–313, https://doi.org/10.1002/wea.2823, 2016.
Moon, H., Gudmundsson, L., Guillod, B. P., Venugopal, V., and Seneviratne, S. I.: Intercomparison of daily precipitation persistence in multiple global observations and climate models, Environ. Res. Lett., 14, 105009, https://doi.org/10.1088/1748-9326/ab4169, 2019.
Moore, B. J., Neiman, P. J., Ralph, F. M., and Barthold, F. E.: Physical processes associated with heavy flooding rainfall in Nashville, Tennessee, and vicinity during 1–2 May 2010: The role of an atmospheric river and mesoscale convective systems, Mon. Weather Rev., 140, 358–378, https://doi.org/10.1175/MWR-D-11-00126.1, 2012.
Moore, B. J., Keyser, D., and Bosart, L. F.: Linkages between extreme precipitation events in the central and Eastern United States and Rossby wave breaking, Mon. Weather Rev., 147, 3327–3349, https://doi.org/10.1175/mwr-d-19-0047.1, 2019.
Oertel, A., Boettcher, M., Joos, H., Sprenger, M., Konow, H., Hagen, M., and Wernli, H.: Convective activity in an extratropical cyclone and its warm conveyor belt – a case-study combining observations and a convection-permitting model simulation, Q. J. Roy. Meteorol. Soc., 145, 1406–1426, https://doi.org/10.1002/qj.3500, 2019.
Overland, J., Dunlea, E., Box, J. E., Corell, R., Forsius, M., Kattsov, V., Olsen, M. S., Pawlak, J., Reiersen, L.-O., and Wang, M.: The urgency of Arctic change, Polar Sci., 21, 6–13, https://doi.org/10.1016/j.polar.2018.11.008, 2019.
Petty, A. A.: A possible link between winter Arctic Sea ice decline and a collapse of the Beaufort high?, Geophys. Res. Lett., 45, 2879–2882, https://doi.org/10.1002/2018GL077704, 2018.
Pfahl, S. and Wernli, H.: Quantifying the relevance of cyclones for precipitation extremes, J. Climate, 25, 6770–6780, https://doi.org/10.1175/JCLI-D-11-00705.1, 2012.
Pfahl, S., Madonna, E., Boettcher, M., Joos, H., and Wernli, H.: Warm conveyor belts in the ERA-Interim dataset (1979–2010). Part II: Moisture origin and relevance for precipitation, J. Climate, 27, 27–40, https://doi.org/10.1175/JCLI-D-13-00223.1, 2014.
Pfahl, S., O'Gorman, P. A., and Fischer, E. M.: Understanding the regional pattern of projected future changes in extreme precipitation, Nat. Clim. Change, 7, 423–427, https://doi.org/10.1038/nclimate3287, 2017.
Polcher, J., Parker, D. J., Gaye, A., Diedhiou, A., Eymard, L., Fierli, F., Genesio, L., Höller, H., Janicot, S., Lafore, J.-P., Karambiri, H., Lebel, T., Redelsperger, J.-L., Reeves, C. E., Ruti, P., Sandholt, I., and Thorncroft, C.: AMMA's contribution to the evolution of prediction and decision-making systems for West Africa, Atmos. Sci. Lett., 12, 2–6, https://doi.org/10.1002/asl.320, 2011.
Priestley, M. D. K., Pinto, J. G., Dacre, H. F., and Shaffrey, L. C.: The role of cyclone clustering during the stormy winter of 2013/2014, Weather, 72, 187–192, https://doi.org/10.1002/wea.3025, 2017.
Raible, C. C.: On the relation between extremes of midlatitude cyclones and the atmospheric circulation using ERA40, Geophys. Res. Lett., 34, L07703, https://doi.org/10.1029/2006GL029084, 2007.
Ratna, S. B., Ratnam, J. V., Behera, S. K., de Rautenbach, C. J. W., Ndarana, T., Takahashi, K., and Yamagata, T.: Performance assessment of three convective parameterization schemes in WRF for downscaling summer rainfall over South Africa, Clim. Dynam., 42, 2931–2953, https://doi.org/10.1007/s00382-013-1918-2, 2014.
Röthlisberger, M., Frossard, L., Bosart, L. F., Keyser, D., and Martius, O.: Recurrent synoptic-scale Rossby wave patterns and their effect on the persistence of cold and hot spells, J. Climate, 32, 3207–3226, https://doi.org/10.1175/JCLI-D-18-0664.1, 2019.
Röthlisberger, M., Sprenger, M., Flaounas, E., Beyerle, U., and Wernli, H.: The substructure of extremely hot summers in the Northern Hemisphere, Weather Clim. Dynam., 1, 45–62, https://doi.org/10.5194/wcd-1-45-2020, 2020.
Rüdisühli, S., Sprenger, M., Leutwyler, D., Schär, C., and Wernli, H.: Attribution of precipitation to cyclones and fronts over Europe in a kilometer-scale regional climate simulation, Weather Clim. Dynam., 1, 675–699, https://doi.org/10.5194/wcd-1-675-2020, 2020.
Rutllant, J. and Fuenzalida, H.: Synoptic aspects of the central Chile rainfall variability associated with the southern oscillation, Int. J. Climatol., 11, 63–76, 1991.
Rutllant, J. and Fuenzalida, H.: Synoptic aspects of the central Chile rainfall variability associated with the southern oscillation, Int. J. Climatol., 11, 63–76, https://doi.org/10.1002/joc.3370110105, 2007.
Shongwe, M. E., van Oldenborgh, G. J., van den Hurk, B., and van Aalst, M.: Projected changes in mean and extreme precipitation in Africa under global warming. Part II: East Africa, J. Climate, 24, 3718–3733, https://doi.org/10.1175/2010JCLI2883.1, 2011.
Simpkins, G.: Extreme Arctic heat, Nat. Clim. Change, 7, 95–95, https://doi.org/10.1038/nclimate3213, 2017.
Sprenger, M., Fragkoulidis, G., Binder, H., Croci-Maspoli, M., Graf, P., Grams, C. M., Knippertz, P., Madonna, E., Schemm, S., Škerlak, B., and Wernli, H.: Global climatologies of eulerian and lagrangian flow features based on ERA-Interim, B. Am. Meteorol. Soc., 98, 1739–1748, https://doi.org/10.1175/BAMS-D-15-00299.1, 2017.
Sultan, B., Labadi, K., Guégan, J.-F., and Janicot, S.: Climate drives the meningitis epidemics onset in West Africa, edited by: Hales, S., PLoS Med., 2, e6, https://doi.org/10.1371/journal.pmed.0020006, 2005.
Taillie, P. J., Roman-Cuesta, R., Lagomasino, D., Cifuentes-Jara, M., Fatoyinbo, T., Ott, L. E., and Poulter, B.: Widespread mangrove damage resulting from the 2017 Atlantic mega hurricane season, Environ. Res. Lett., 15, 064010, https://doi.org/10.1088/1748-9326/ab82cf, 2020.
Toreti, A., Xoplaki, E., Maraun, D., Kuglitsch, F. G., Wanner, H., and Luterbacher, J.: Characterisation of extreme winter precipitation in Mediterranean coastal sites and associated anomalous atmospheric circulation patterns, Nat. Hazards Earth Syst. Sci., 10, 1037–1050, https://doi.org/10.5194/nhess-10-1037-2010, 2010.
van Ommen, T. D. and Morgan, V.: Snowfall increase in coastal East Antarctica linked with southwest Western Australian drought, Nat. Geosci., 3, 267–272, https://doi.org/10.1038/ngeo761, 2010.
Wernli, H. and Schwierz, C.: Surface cyclones in the ERA-40 dataset (1958–2001). Part I: Novel identification method and global climatology, J. Atmos. Sci., 63, 2486–2507, https://doi.org/10.1175/JAS3766.1, 2006.
Wernli, H. and Sprenger, M.: Identification and ERA-15 Climatology of potential vorticity streamers and cutoffs near the Extratropical Tropopause, J. Atmos. Sci., 64, 1569–1586, https://doi.org/10.1175/JAS3912.1, 2007.
Winschall, A., Pfahl, S., Sodemann, H., and Wernli, H.: Impact of North Atlantic evaporation hot spots on southern Alpine heavy precipitation events, Q. J. Roy. Meteorol. Soc., 138, 1245–1258, https://doi.org/10.1002/qj.987, 2012.
Wu, H., Svoboda, M. D., Hayes, M. J., Wilhite, D. A., and Wen, F.: Appropriate application of the standardized precipitation index in arid locations and dry seasons, Int. J. Climatol., 27, 65–79, https://doi.org/10.1002/joc.1371, 2007.
- Abstract
- Introduction
- Dataset and methods
- Statistical characterization of extreme wet seasons
- Portrayal of extreme wet season patches
- Examples of how weather systems contribute to extreme wet seasons
- The contribution of weather systems to extreme wet seasons: a global view
- Summary and conclusions
- Data availability
- Author contributions
- Competing interests
- Acknowledgements
- Financial support
- Review statement
- References
- Supplement