the Creative Commons Attribution 4.0 License.
the Creative Commons Attribution 4.0 License.
 | 31 Aug 2021
Oceanic moisture sources contributing to wintertime Euro-Atlantic blocking
Ayako Yamamoto
Masami Nonaka
Patrick Martineau
Akira Yamazaki
Young-Oh Kwon
Hisashi Nakamura
Bunmei Taguchi
Although conventionally attributed to dry dynamics, increasing evidence points to a key role of moist dynamics in the formation and maintenance of blocking events. The source of moisture crucial for these processes, however, remains elusive. In this study, we identify the moisture sources responsible for latent heating associated with the wintertime Euro-Atlantic blocking events detected over 31 years (1979–2010). To this end, we track atmospheric particles backward in time from the blocking centres for a period of 10 d using an offline Lagrangian dispersion model applied to atmospheric reanalysis data. The analysis reveals that 28 %–55 % of particles gain heat and moisture from the ocean over the course of 10 d, with higher percentages for the lower altitudes from which particles are released. Via large-scale ascent, these moist particles transport low-potential-vorticity (PV) air of low-altitude, low-latitude origins into the upper troposphere, where the amplitude of blocking is the most prominent, in agreement with previous studies. The PV of these moist particles remains significantly lower compared to their dry counterparts throughout the course of 10 d, preferentially constituting blocking cores.
Further analysis reveals that approximately two-thirds of the moist particles source their moisture locally from the Atlantic, while the remaining one-third of moist particles source it from the Pacific. There is also a small fraction of moist particles that take up moisture from both the Pacific and Atlantic basins, which undergo a large-scale uplift over the Atlantic using moisture picked up over both basins. The Gulf Stream and Kuroshio and their extensions as well as the eastern Pacific northeast of Hawaii not only provide heat and moisture to moist particles but also act as “springboards” for their large-scale, cross-isentropic ascent, where its extent strongly depends on the humidity content at the time of the ascent. While the particles of Atlantic origin swiftly ascend just before their arrival at blocking, those of Pacific origin begin their ascent a few days earlier, after which they carry low-PV air in the upper troposphere while undergoing radiative cooling just as dry particles. A previous study identified a blocking maintenance mechanism, whereby low-PV air is selectively absorbed into blocking systems to prolong blocking lifetime. As they used an isentropic trajectory analysis, this mechanism was regarded as a dry process. We found that these moist particles that are fuelled over the Pacific can also act to maintain blocks in the same manner, revealing that what appears to be a blocking maintenance mechanism governed by dry dynamics alone can, in fact, be of moist origin.
- Article
(22391 KB) - Full-text XML
- BibTeX
- EndNote


An atmospheric block is a large-scale, quasi-stationary anticyclonic circulation system, which acts to effectively “block” the prevailing westerlies (Rex, 1950) and divert synoptic disturbances (Booth et al., 2017). Blocking has garnered much attention due to its close association with extreme weather events, such as cold spells in wintertime and heat waves and droughts in summertime, owing to its persistent nature. Despite these large socio-economic impacts, a comprehensive theory of the governing physical mechanisms behind the blocking life cycle remains elusive (Davini and D'Andrea, 2016; Woollings et al., 2018), and there remain biases in most climate models, leading to uncertainties in future projections of blocking activity (Woollings et al., 2018).
The dynamical processes behind blocking events have conventionally been attributed to dry processes. Previous studies demonstrate that the onset and maintenance of blocking often result from quasi-stationary Rossby wave propagation (Nakamura, 1994; Nakamura et al., 1997) and breaking (e.g., Pelly and Hoskins, 2003; Nakamura and Fukamachi, 2004; Masato et al., 2012), while the blocking longevity is maintained by feedbacks from the synoptic-scale migratory eddies (e.g., Shutts, 1983; Nakamura et al., 1997; Yamazaki and Itoh, 2013a).
A growing body of evidence from recent studies, however, points towards the importance of diabatic processes. In particular, a key role of latent heating associated with cloud formation in both the formation and maintenance stages of the blocking events has been highlighted. Latent heating augments vertical motion such that low-potential-vorticity (PV) air of low-altitude, low-latitude origin is efficiently transported to a high-altitude, high-latitude domain with high background PV, where blocking forms (Wernli and Davies, 1997; Croci-Maspoli and Davies, 2008; Grams et al., 2011). This transport of low-PV air into the upper troposphere that generates negative PV anomalies can act to initiate an upper-level ridge and thereby modify Rossby wave propagation (Grams et al., 2011; Methven, 2015), which may trigger the formation of a block. The most vigorous latent heating in the mid-latitude typically takes place in a warm conveyor belt (WCB), a rapidly ascending airstream associated with extratropical cyclones (Madonna et al., 2014). This cross-isentropic transport by the WCB can effectively inject low-PV air into the upper troposphere, thereby intensifying blocks (Pfahl et al., 2015; Steinfeld and Pfahl, 2019). Recent studies have demonstrated that forecast skill of the location and intensity of an extratropical cyclone with a WCB tends to influence the subsequent forecast of blocking onset as well as of the downstream atmospheric flow (Maddison et al., 2019; Berman and Torn, 2019; Grams et al., 2018; Baumgart et al., 2018). This direct diabatic effect on blocking events has been shown to be of comparable importance to the dry processes in blocking dynamics (Pfahl et al., 2015), in particular for the wintertime Euro-Atlantic blocking systems (Steinfeld and Pfahl, 2019). In addition to this direct diabatic effect there is also an indirect diabatic effect on blocking, in which the vertical motion amplified by latent heating acts to enhance divergent outflow on the western flank of blocks (Ahmadi-Givi et al., 2004; Steinfeld and Pfahl, 2019). This augmented divergent outflow in turn advects low-PV anomalies on the western flank of blocking, thereby promoting the blocking amplification and the westward expansion (Steinfeld and Pfahl, 2019). Thus, these previous studies have elucidated the key role of latent heating in blocking systems. The source of moisture imperative to latent heating, however, is yet to be identified.
The largest source of atmospheric water vapour is irrefutably the ocean, and previous studies have uncovered its crucial role in blocking. For instance, Croci-Maspoli and Davies (2008) illustrated the high sensitivity of the formation of European blocking to the imposed sea surface temperature (SST) and humidity over the North Atlantic basin in a high-resolution model, such that higher SST and humidity content promote larger-scale block formation. In line with this result, Scaife et al. (2011) found that a reduced mean Atlantic SST bias considerably improves blocking climatology over the Atlantic in a coupled climate model, although this improvement may be model-dependent (Davini and D'Andrea, 2016). A recent study by Kwon et al. (2020) further corroborated the role of SST by showing that the multidecadal North Atlantic SST variability modulates the frequency of wintertime European blocking, whose covariability with the North Atlantic SST was first identified by Häkkinen et al. (2011). Kwon et al. (2020) suggested that this modulation of blocking is achieved through the mechanism discussed in Novak et al. (2015), in which poleward transient eddy heat flux in the lower troposphere is regulated by the underlying sharp SST gradients, resulting in the shift in the eddy-driven jet and a change in the dominant type of Rossby wave breaking.
Other studies have attributed the oceanic influence on blocking specifically to the western boundary currents. Western boundary currents, such as the Gulf Stream in the North Atlantic and Kuroshio in the North Pacific, are the swift ocean currents (>1 m s−1 at their cores) that transport a massive amount of heat poleward. Consequently, these are the regions where exceptionally strong air–sea interactions take place by giving off large amounts of heat and moisture to the overlying atmosphere (e.g., Kwon et al., 2010). By forcing an atmospheric general circulation model with realistic and smoothed Gulf Stream SST, O'Reilly et al. (2016) found that the sharp gradient of SST associated with the Gulf Stream acts to significantly amplify wintertime Atlantic blocking by reinforcing both the lower-tropospheric meridional eddy heat transport over the Gulf Stream region and the upper-tropospheric eddy kinetic energy. Using an analogous experimental setup, Sheldon et al. (2017) showed that the Gulf Stream amplifies the deep cross-isentropic ascent, enabling a more efficient low-PV transport from low-latitude, low-altitude regions. Furthermore, both Atlantic and Pacific blocks have been shown to sensitively respond to the interannual to decadal meridional shifts in the Gulf Stream (Joyce et al., 2019) and Kuroshio Extension (O'Reilly and Czaja, 2015), respectively. Thus, it is anticipated that the ocean and, in particular, western boundary currents can play an important role in blocking events through moist processes.
The goal of the current study is to identify the oceanic sources of moisture fuelling wintertime Euro-Atlantic blocking events as a direct diabatic effect. To this end, we employ a Lagrangian method where we track atmospheric particles from the Euro-Atlantic blocking systems following three-dimensional wind fields backward in time. Unlike previous studies, we utilize an atmospheric Lagrangian dispersion model that allows us to investigate processes taking place within the turbulent planetary boundary layer. In doing so, we aim to gain further insights into the moist processes affecting blocking events.
The rest of the paper is organized as follows. The dataset and methods used in this study are described in Sect. 2. In Sect. 3 we classify the particles released from blocking regions into moist and dry particles and examine their properties, while in Sect. 4 we further classify moist particles based on their moisture sources and investigate their characteristics. Finally, a discussion and conclusions are in Sect. 5.
2.1 Dataset
We use the Climate Forecast System Reanalysis (CFSR; Saha et al., 2010a) datasets from the US National Centers for Environmental Prediction (NCEP) for the period of 1979 through 2010 for our analyses. The CFSR data provide an adequate input for our Lagrangian method due to their high temporal and spatial resolutions of an hourly output with 0.5∘ horizontal resolution and 37 vertical levels.
2.2 Blocking index
In the current study, we identify blocks using a hybrid index introduced by Dunn-Sigouin et al. (2013). This index combines two classical blocking definitions, whereby it searches for persistent, adjoining areas of positive 500 hPa geopotential height anomalies that are accompanied by a reversal of the meridional geopotential height gradient (see Appendix A for more details). Thus, this index ensures the identified blocking manifests the well-recognized properties of anticyclonic circulation anomalies with the associated wind reversal while suppressing erroneous detection of quasi-stationary ridges and immature systems as blocking events (Dunn-Sigouin et al., 2013). Note that this detection method identifies blocking events as they reach maturity; thus, our analysis emphasizes processes involved in their maintenance during their mature stage rather than in their development.
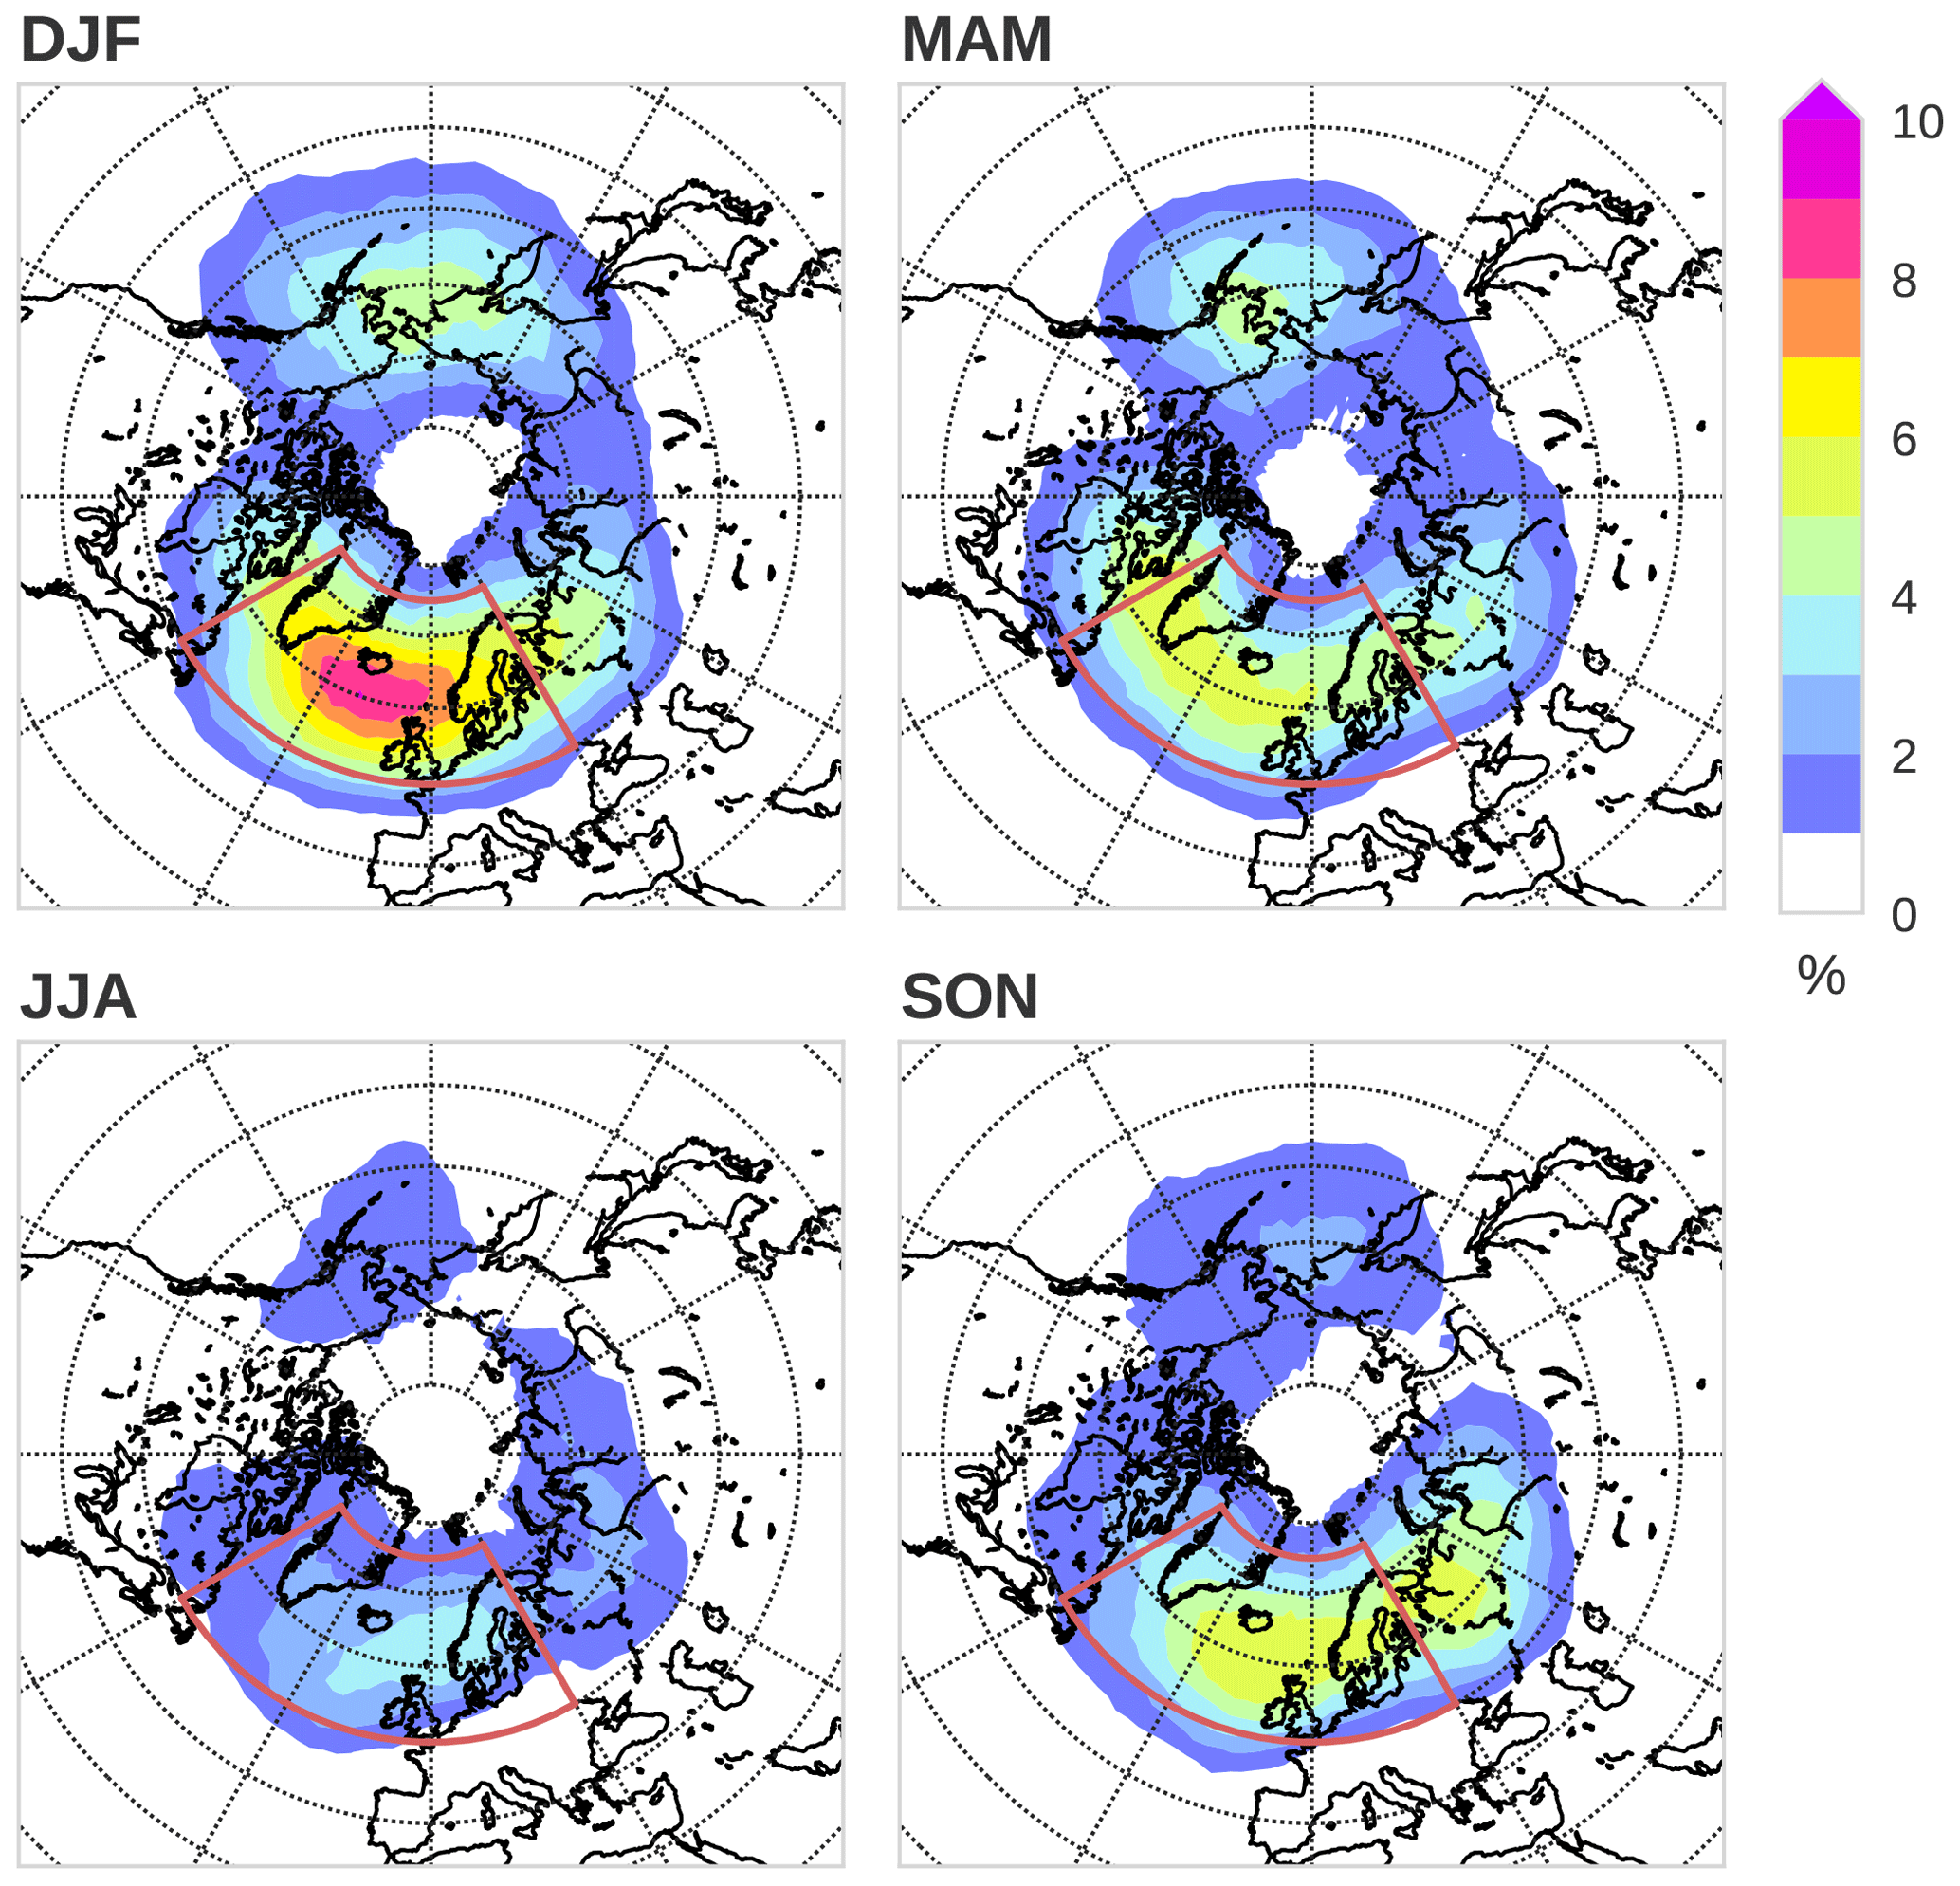
Figure 1Seasonal climatology of the Northern Hemisphere blocking frequency over 1979–2010. Colour shading indicates the percentage of blocking days per season for each grid cell. Red contours delimit the sectors used to define the Euro-Atlantic blocks (50–75∘ N, 60∘ W–30∘ E). Parallels are plotted for every 10∘, whereas meridians are plotted for every 30∘ on each plot.
The climatological blocking frequencies thus detected for the individual seasons are shown in Fig. 1. Consistent with previous studies, the maximum blocking frequencies are found during wintertime over the Atlantic and Pacific, while the minimum is found during summertime. As described in the introduction, we focus on Euro-Atlantic blocks identified over 50–75∘ N, 60∘ W–30∘ E in the December–January–February (DJF) season in the rest of our analyses, where the maximum blocking occurrence is found.
2.3 Trajectory computation
So-called atmospheric particles, representing infinitesimally small air parcels (Stohl et al., 2005), are tracked backward in time by using an atmospheric dispersion model, FLEXPART version 9.0.3 (Stohl et al., 2005), in which the particles are driven by the CFSR data from the Euro-Atlantic blocking areas identified with the blocking definition introduced in the previous section. FLEXPART computes the particle trajectories by adding parameterized sub-grid-scale wind fluctuations to the resolved winds at every time step (see Appendix B for more details of how these sub-grid-scale winds are computed in the model). This aspect of the dispersion model makes it markedly different from conventional kinematic trajectory models used by previous studies (e.g., Pfahl et al., 2015; Steinfeld and Pfahl, 2019), in which parcels are advected only with resolved winds without taking into account the turbulent effects. As the purpose of the current study is to identify the role of the ocean in providing heat and moisture to the atmospheric particles, which takes place within the turbulent planetary boundary layer (PBL), the inclusion of the turbulence effects makes FLEXPART an appropriate tool for the scope of the current study.
Using FLEXPART, we release 20 particles randomly placed in every horizontal grid cell where and when Euro-Atlantic blocks have been identified. Assuming that blocking has an equivalent barotropic structure, the particles are released from altitudes between 7000 and 8000 (above sea level), corresponding to approximately 350 hPa on average, given that the amplitude of blocking anomalies maximizes in the upper troposphere (Dole and Gordon, 1983; Schwierz et al., 2004). As such, we have released a total of over 5 million particles from the interior of the DJF Euro-Atlantic blocks over 31 years. After their release, each of these particles is tracked backward in time for a duration of 10 d. Multiple atmospheric variables, including temperature, specific humidity, and air density, are interpolated to the particle's position at each time step, while additional meteorological quantities useful for the subsequent analyses, such as PV and PBL height, are computed in FLEXPART along each trajectory. We then remove particles whose PV exceeds 2 PVU (potential vorticity unit; ) throughout the tracking period to exclude those particles that remain in the stratosphere.
Moreover, we have also released particles from higher altitudes between 9500 and 10 500 , approximately corresponding to 250 hPa, and from lower altitudes between 4500 and 5500 as well as between 3000 and 4000 , approximately corresponding to 500 and 700 hPa, respectively. To test how the blocking condition differs from the time when there is no block, we have also released 20 particles from every grid cell within the Atlantic domain defined in Sect. 2.2 when there is no blocking found within ±10 d from 7500 , which we refer to as non-blocking particles. We have applied a chi-squared independence test in order to compute the statistical significance of the difference between these non-blocking particles and blocking particles.
Furthermore, following Yamamoto et al. (2015) and Yamamoto and Palter (2016), whenever the particles reside within the atmospheric PBL over the ocean, we interpolate sensible heat flux (SHF) and latent heat flux (LHF) to the particle's 6-hourly location and time. These turbulent heat fluxes are useful in evaluating where the particles that eventually reach the Euro-Atlantic blocks are likely to be supplied with heat and moisture from the ocean. Applying the same technique, Yamamoto et al. (2015) showed that up to 88 % of the along-trajectory potential temperature variability in the particles released from western Europe can be explained by the accumulated turbulent heat fluxes along the trajectories alone on an interannual timescale, indicating that this method adequately captures along-trajectory diabatic changes.
In order to elucidate the role of the ocean in providing moisture to the atmospheric particles en route to the Euro-Atlantic blocks, we first partition the individual particles into moist and dry particles. Here, moist particles are defined as those that have been subject to evaporation from the ocean, marked with positive LHF, for at least one time step over the course of 10 d. Otherwise, the particles are regarded as dry particles. As our goal lies in identifying the oceanic sources of moisture for the blocking particles, we opt for this definition based on moisture gain from the ocean over that used in Pfahl et al. (2015) and Steinfeld and Pfahl (2019), who defined diabatic particles as those that are heated by more than 2 K within 3 d and 7 d prior to their arrival in the blocking regions.
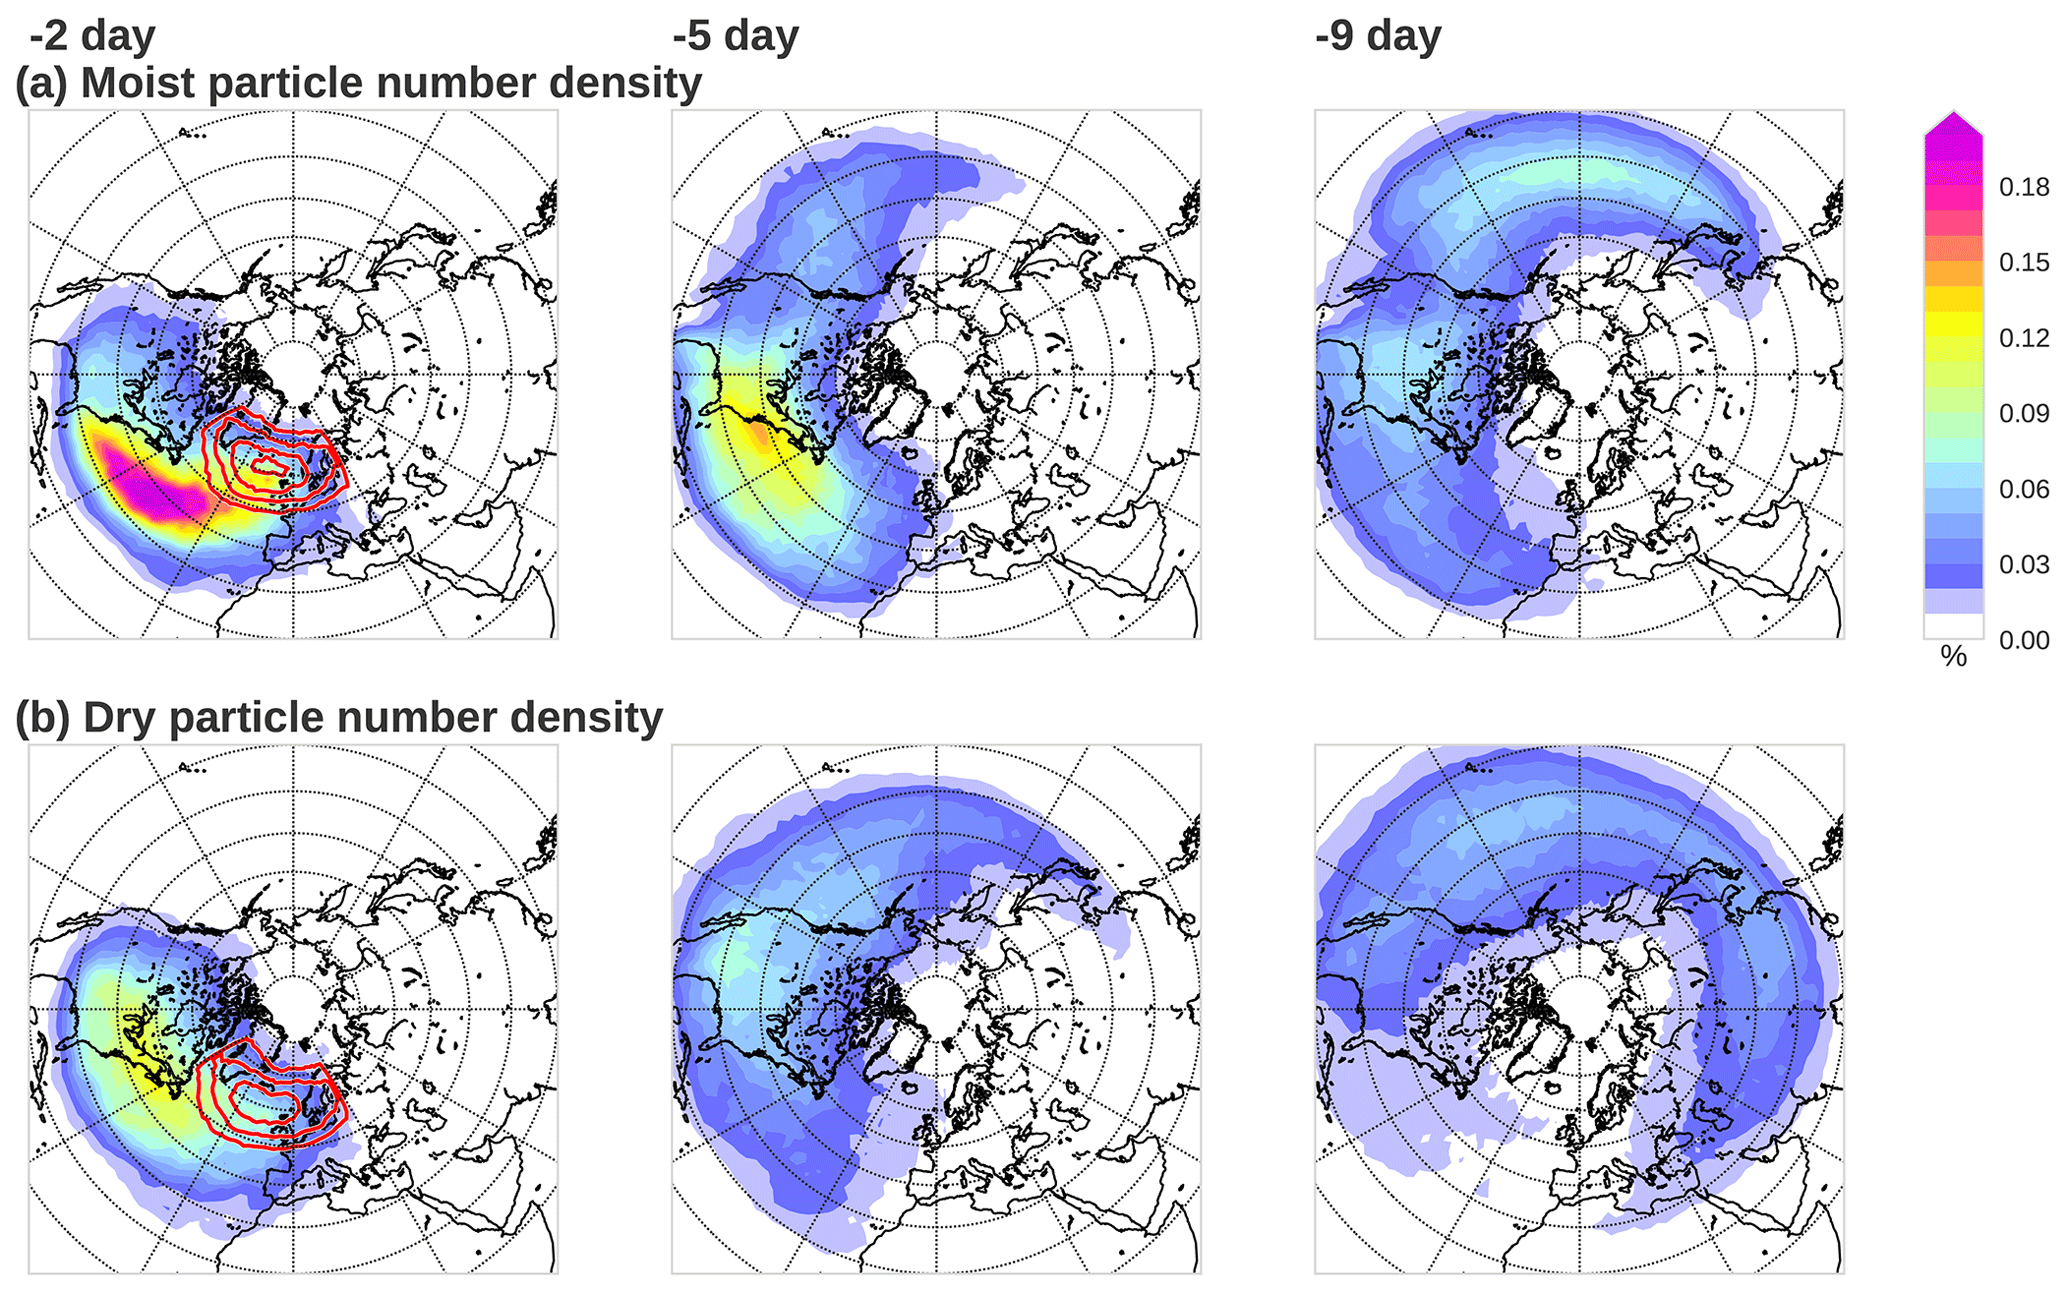
Figure 2Number density for each grid cell for the moist particles (a) and dry particles (b) 2 d (left column), 5 d (middle column), and 9 d (right column) prior to their arrival in the wintertime Euro-Atlantic blocking highs. Red contours denote the location of the particle release (i.e., where the blocks form) with the interval of 0.05 % starting from 0.1 %. In each panel the sum of all grid cells is 100 %. Parallels are plotted for every 10∘, whereas meridians are plotted for every 30∘ on each plot.
With our definition, we have identified 41.3 % of the total particles as moist particles and 58.7 % as dry particles. This fraction of moist particles in our study falls within the range of diabatic particles of 30 %–45 % that gain more than 2 K in the last 3 d before their arrival in the blocking system as defined by Pfahl et al. (2015). The fraction is underestimated relative to their fraction of 60 %–70 % of particles that gain more than 2 K in the 7 d before their arrival in the blocking system (Pfahl et al., 2015). When we apply the same definition as Pfahl et al. (2015), we find that 51.8 % and 69.5 % of particles are identified as diabatic particles which undergo diabatic processes in the last 3 and 7 d, respectively. We speculate that the difference between the results of Pfahl et al. (2015) and ours might arise from the differences in the blocking definitions, Lagrangian tracking methods, and/or reanalyses used in the two studies. Meanwhile, the fraction reported by the previous studies in the maintenance stage seems fairly consistent with the current study (see Fig. 6 of Steinfeld and Pfahl, 2019). The fraction of moist particles for the non-blocking particles is 37.1 %, which is only slightly lower than the blocking case, but nevertheless we have found that this small difference is significant at the 99 % confidence level. This result indicates that blocking particles preferentially contain more moist particles compared to non-blocking conditions, whereas non-blocking particles may well be ending up in a ridge that does not quite meet the blocking criteria used in this study. When we release particles from lower altitudes, the fraction of moist particles increases to 49.9 % and 55.0 % for the 5000 and 3500 release, respectively, while the fraction drops to 27.8 % for the particles released from 10 000
3.1 Spatial distribution of moist and dry particles
The spatial distributions of moist and dry particles 2, 5, and 9 d prior to their arrival at the blocking locations are shown in Fig. 2, where the particle release locations (i.e., where blocking occurs, corresponding to day 0) are indicated by red contours. As shown in Fig. 2, the particles in both categories are mostly advected eastward by the prevailing westerlies. Compared to their moist counterpart, dry particles tend to travel slightly faster, reflecting their tendency to be situated at higher altitudes (see Sect. 3.3), where the background westerlies tend to be stronger.
Upon further inspection of Fig. 2, one notices that moist particles 9 d prior (upper-right panel) tend to be situated within two distant regions separated by the Rockies, seemingly corresponding to the two major storm tracks in the wintertime Northern Hemisphere. Meanwhile, the maximum particle density 2 d prior is found over the mid-latitude North Atlantic just southwest of the blocking region, which is an important ascent region for some of these moist particles, as is shown later. In contrast, the corresponding locations of the dry particles appear to be less concentrated. As such, we speculate that these two categories of particles tend to undergo different dynamical processes.
3.2 Spatial distribution of mean properties along moist particles within and above the marine PBL
We further partition moist particles into the time when they are located within the atmospheric PBL over the ocean (Fig. 3) and the rest of the time (Fig. 4) in order to unambiguously identify the role of the ocean in fuelling moist particles. As such, Fig. 3 illustrates where the particles are located and how the mean properties along them are distributed when moist particles can exchange heat and moisture with the underlying ocean, while Fig. 4 shows when those particles are not in direct contact with the ocean. Note that the latter also includes the time when the particles are located within the PBL over land.
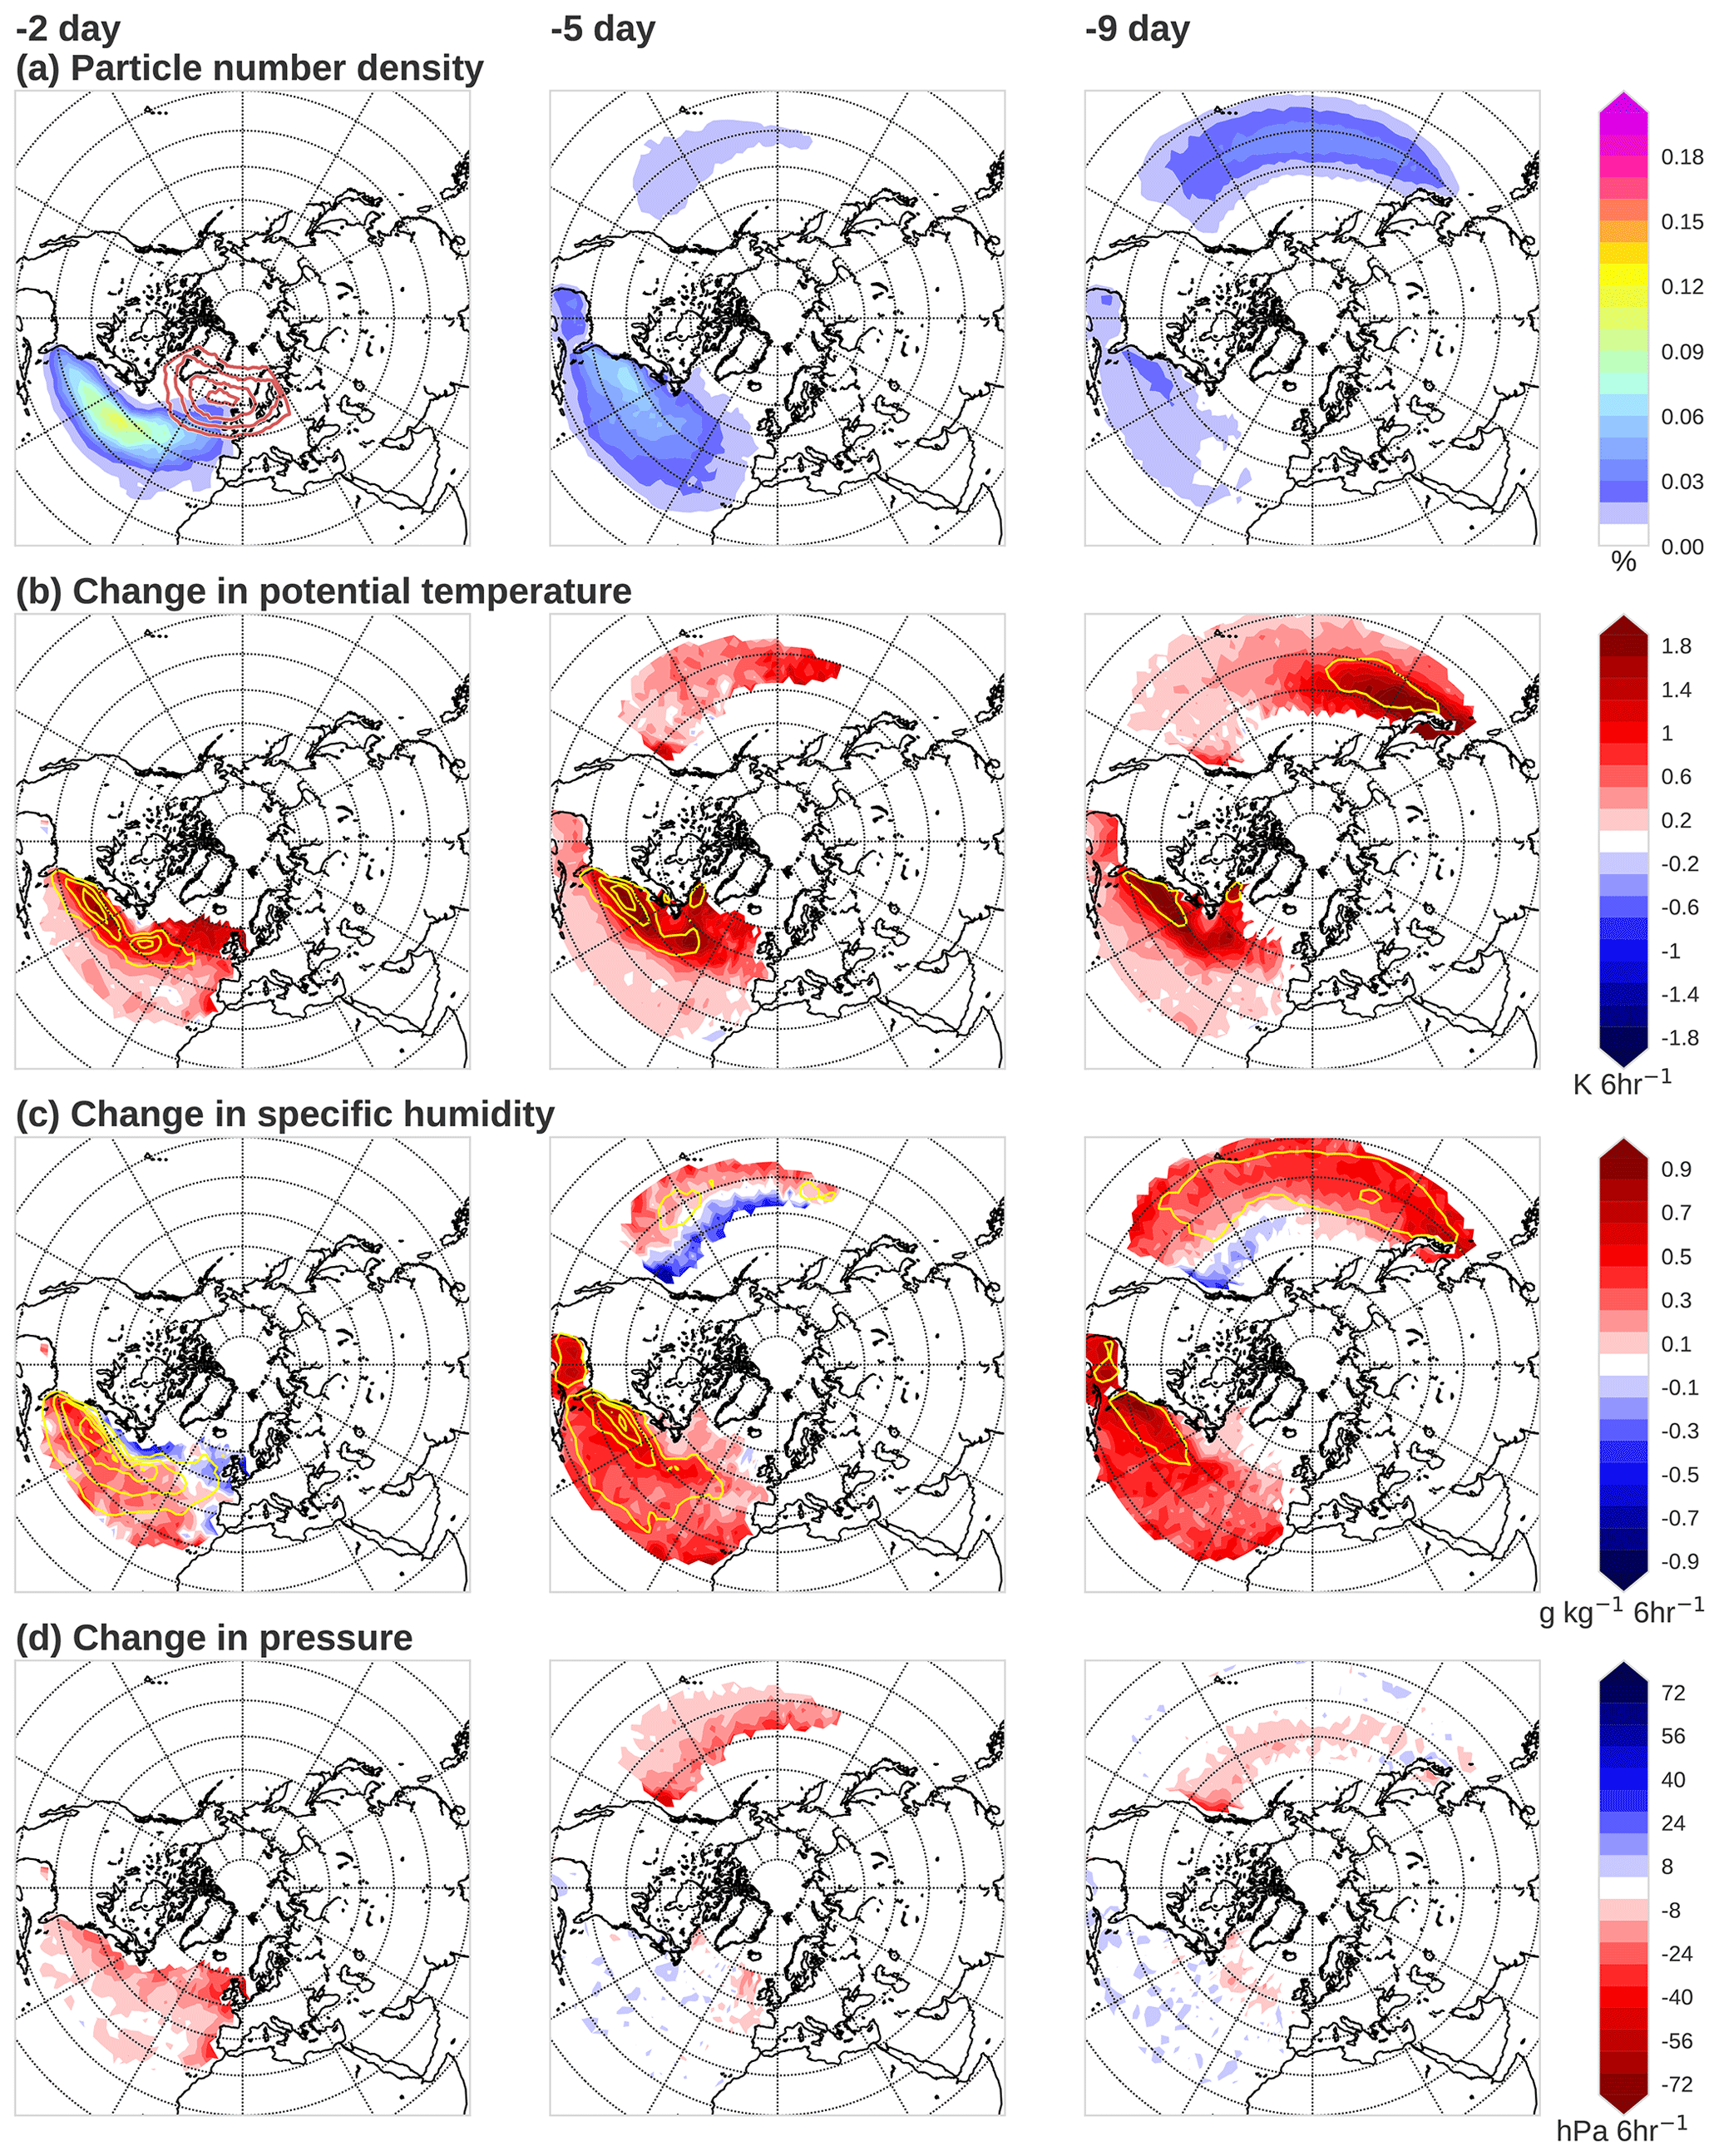
Figure 3Properties along moist particles when they are located within the marine PBL at 2 d (left column), 5 d (middle column), and 9 d (right column) prior to their arrival at the Euro-Atlantic blocks. (a) Number density of the particles [%] for each grid cell, with their release locations being indicated by the red contours with the interval of 0.05 % starting from 0.1 %. (b) Mean change in potential temperature (colour shading) along the moist particles when they are situated over each grid cell [K 6 h−1], with SHF (yellow contours indicating 0.05, 0.15, and 0.25 W m−2) superimposed. (c) Same as (b) but for the mean change in specific humidity (colour shading) [] with LHF overlaid (yellow contours for 0.1 W m−2 with the interval of 0.2 W m−2 afterwards). (d) Same as (b) but for the mean change in atmospheric pressure [hPa 6 h−1]. For (b–d), only those grid cells that contain over 0.005 % of the total particle's 6-hourly density are plotted. SHF and LHF are computed as the total SHF and LHF along moist particles found within each grid cell on the specified days divided by the total number of moist particles, thereby indicating the average SHF or LHF contributing to blocking per particle on each day. Parallels are plotted for every 10∘, whereas meridians are plotted for every 30∘ on each plot.
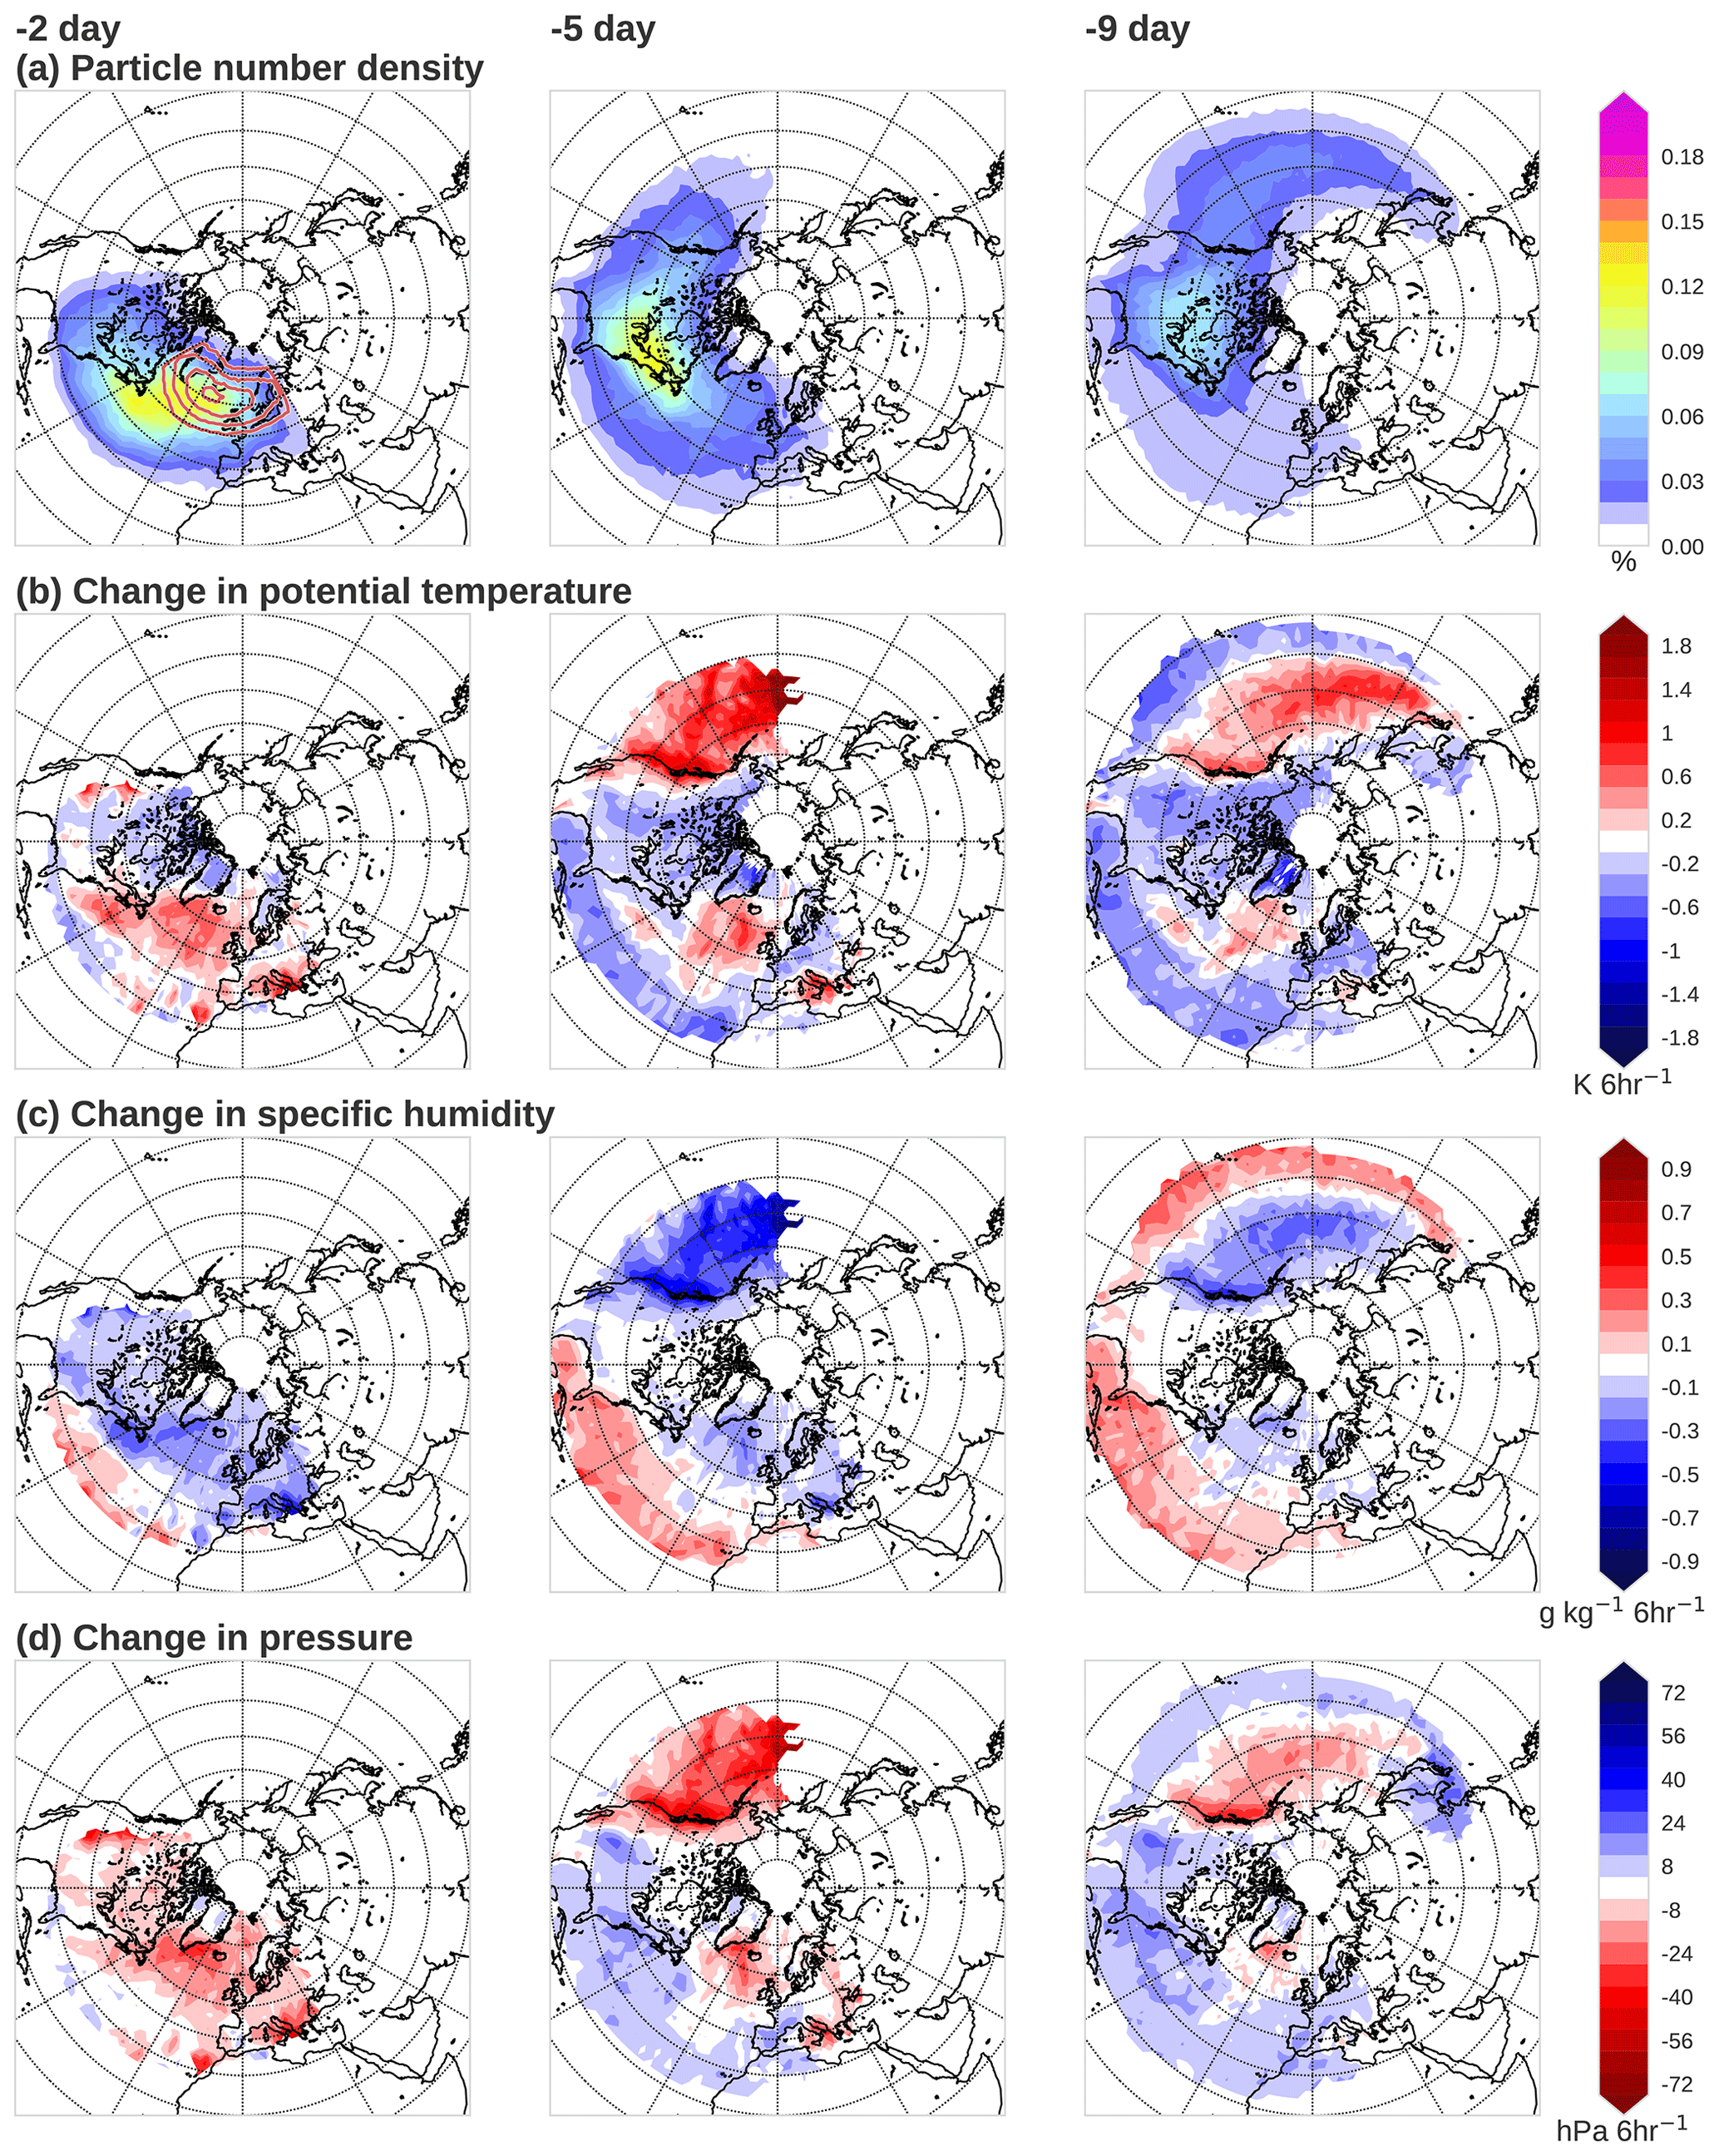
Figure 4Same as Fig. 3 but for moist particles above the marine PBL or within or above the PBL over land. By definition they are not under the influence of the turbulent heat fluxes from the ocean.
Figure 3a reveals that moist particles preferentially stay within the PBL over the Gulf Stream and Kuroshio as well as their extensions, where they tend to be both heated (Fig. 3b) and moistened (Fig. 3c) through the enhanced upward turbulent heat fluxes (Fig. 3b and c, yellow contours). These results suggest a central role of the western boundary currents as the primary heat and moisture sources for the moist particles that are going to be advected into the Euro-Atlantic blocks. One notable exception to this overall tendency is found off the west coast of North America, where the particles undergo topographical lifting (Fig. 3d) followed by drying (Fig. 3c) and warming (Fig. 3b) due to latent heating. As is shown later in Sect. 4.3, this region turns out to be a common location for the organized large-scale ascent of the particles that gain moisture from the Pacific.
In stark contrast, the dominant tendency for moist particles when they are situated above the PBL (Fig. 4) is such that an increase in potential temperature is concurrent with a decrease in specific humidity, which is accompanied by their ascent, while also the opposite is true (Fig. 4d). This result means that latent heating and evaporative cooling are the dominant processes that control the property changes in the particles travelling above the PBL. The preferred locations for the particle ascent are found just upstream of the blocking over the North Atlantic 2 d prior to their arrival at the blocking region as well as off the west coast of the North American continent found 5 and 9 d prior to the arrival at the blocking.
Meanwhile, dry particles barely undergo any property change, except for a general cooling trend associated with radiative processes (not shown).
3.3 Time evolution of variables along the trajectories of moist and dry particles
In order to further understand different properties associated with dry and moist particles, we compare the mean temporal evolution of several variables along their trajectories.
Figure 5 reveals that dry particles (cyan lines) tend to originate from the mid-latitudes and advance gradually northward while travelling pseudo-isobarically in the upper troposphere. These particles undergo a gradual cooling of approximately 0.7 K d−1, consistent with the radiative cooling reported by Steinfeld and Pfahl (2019). Specific humidity of dry particles remains fairly low over the course of 10 d en route to the blocking regions as these particles do not pick up any moisture from the ocean by definition. Despite its large standard deviation, dry particles' PV is maintained around approximately 1.5 PVU, slightly lower than a typical PV value of 2 PVU that marks the dynamical tropopause.
Moist particles (red lines in Fig. 5) display a fairly distinct picture from their dry counterparts: while also originating from the mid-latitudes and travelling northward, moist particles tend to originate from the lower troposphere and then undergo a substantial uplift over the course of 10 d. This uplift and the northward motions are particularly enhanced about 3 d prior to their arrival at the blocking system, coinciding with notable drying and warming due to intense latent heating during this period. The mean PV value of moist particles tends to be fairly low throughout without undergoing any substantial changes, reflecting their origins at the lower altitudes and latitudes. SHF and LHF are on average steadily supplied to moist particles until about 3 d prior to their arrival at the blocks before undergoing strong uplift.
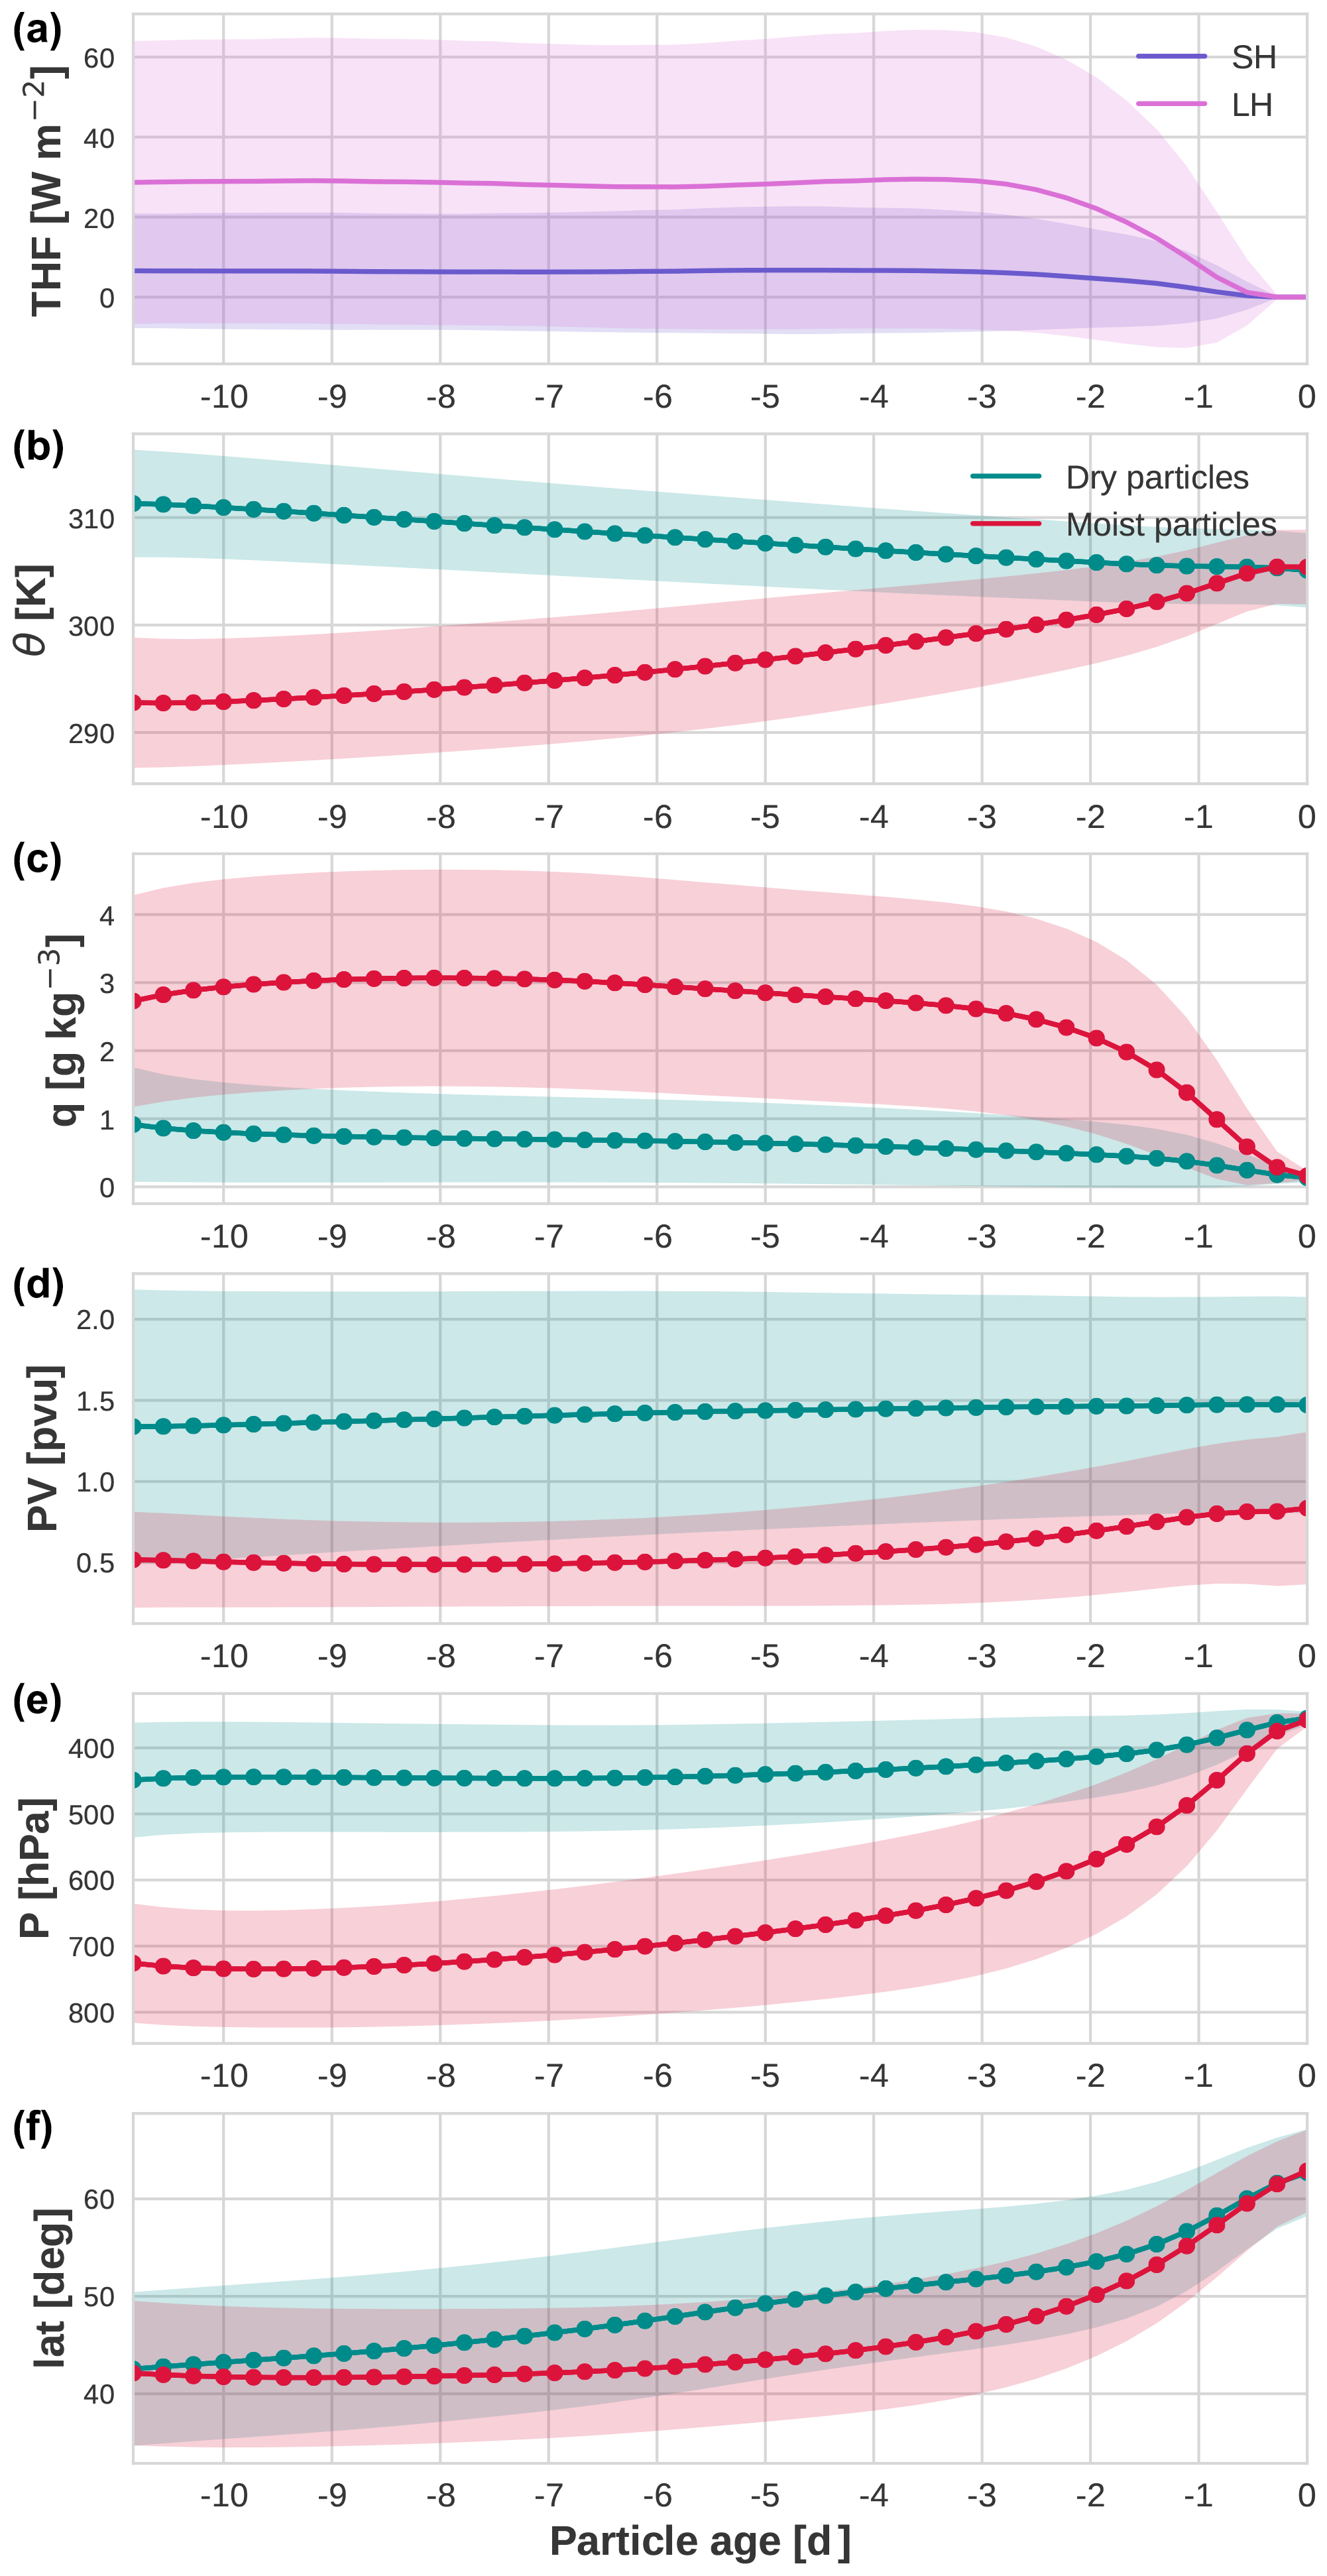
Figure 5Time evolution of the properties of dry and moist particles along their respective trajectories. (a) Mean sensible (blue) and latent heat fluxes (magenta) supplied to moist particles from the ocean when the particles reside within the marine PBL at specific particle age. (b–f) Mean potential temperature (b), mean specific humidity (c), mean potential vorticity (d), mean pressure (e), and mean latitude (f) of dry (cyan lines) and moist particles (red lines) along their respective trajectories. The envelopes around each line indicate ±0.5 standard deviations. The particle age on the x axis denotes the days before the particles arrive at the blocking system (i.e., day 0 means the arrival time at the blocks). The closed (open) circles indicate where a given property distribution between moist and dry particles is significantly different at the 99 % (95 %) confidence level. The maximum standard errors are 0.05 W m−2 for turbulent fluxes, 0.009 K for potential temperature, 0.002 g kg−1 for specific humidity, 0.001 PVU for PV, 0.2 hPa for pressure, and 0.01∘ for latitude.
Despite the aforementioned significant differences in their origins and their evolution between dry and moist particles, these differences almost diminish as time nears the particle release time from the blocks (i.e., particle age = day 0). One notable exception is PV, which on average undergoes little change during the course of 10 d, retaining its initial values along the trajectories of both dry and moist particles even at day 0. This result is consistent with the previous study by Methven (2015), who showed that the average PV of an upper-tropospheric outflow of a strongly ascending airstream is approximately equal to that of the lower-tropospheric inflow on average as PV increases below the heating maximum but decreases above it. The PV increase and decrease, however, are not visible in Fig. 5d after averaging over millions of particles as the timing of ascent differs for individual particles. Figure 5d indicates that the mean PV values are significantly higher for dry particles than for moist particles at the 99 % confidence level even at day 0. Given that blocks are high-pressure systems associated with low PV values, feeding of lower-PV air is expected to be crucial for their maintenance (Yamazaki and Itoh, 2013b). Our result thus suggests that these moist particles play an important role in transporting significantly lower PV into the block system, further corroborating the findings of the previous studies (Pfahl et al., 2015; Steinfeld and Pfahl, 2019).
This significant difference between dry and moist particles in their mean PV values seen at day 0 in Fig. 5d further suggests that there could be a difference in their spatial distribution at the time of their release from the blocks. Figure 6 illustrates the spatial distributions of the dry (left panels) and moist particles (middle panels) separately as well as their difference (right panels). Each row denotes different release altitudes: 10 000 (∼250 hPa), 7500 (∼350 hPa), 5000 (∼500 hPa), and 3500 (∼ 700 hPa). The figure reveals that regardless of the release altitudes, the density of moist particles at the centre of the blocks tends to be higher than that of dry particles. In other words, moist particles carry low-PV air upward across isentropic surfaces and thereby preferentially occupy the upper-level blocking core region.
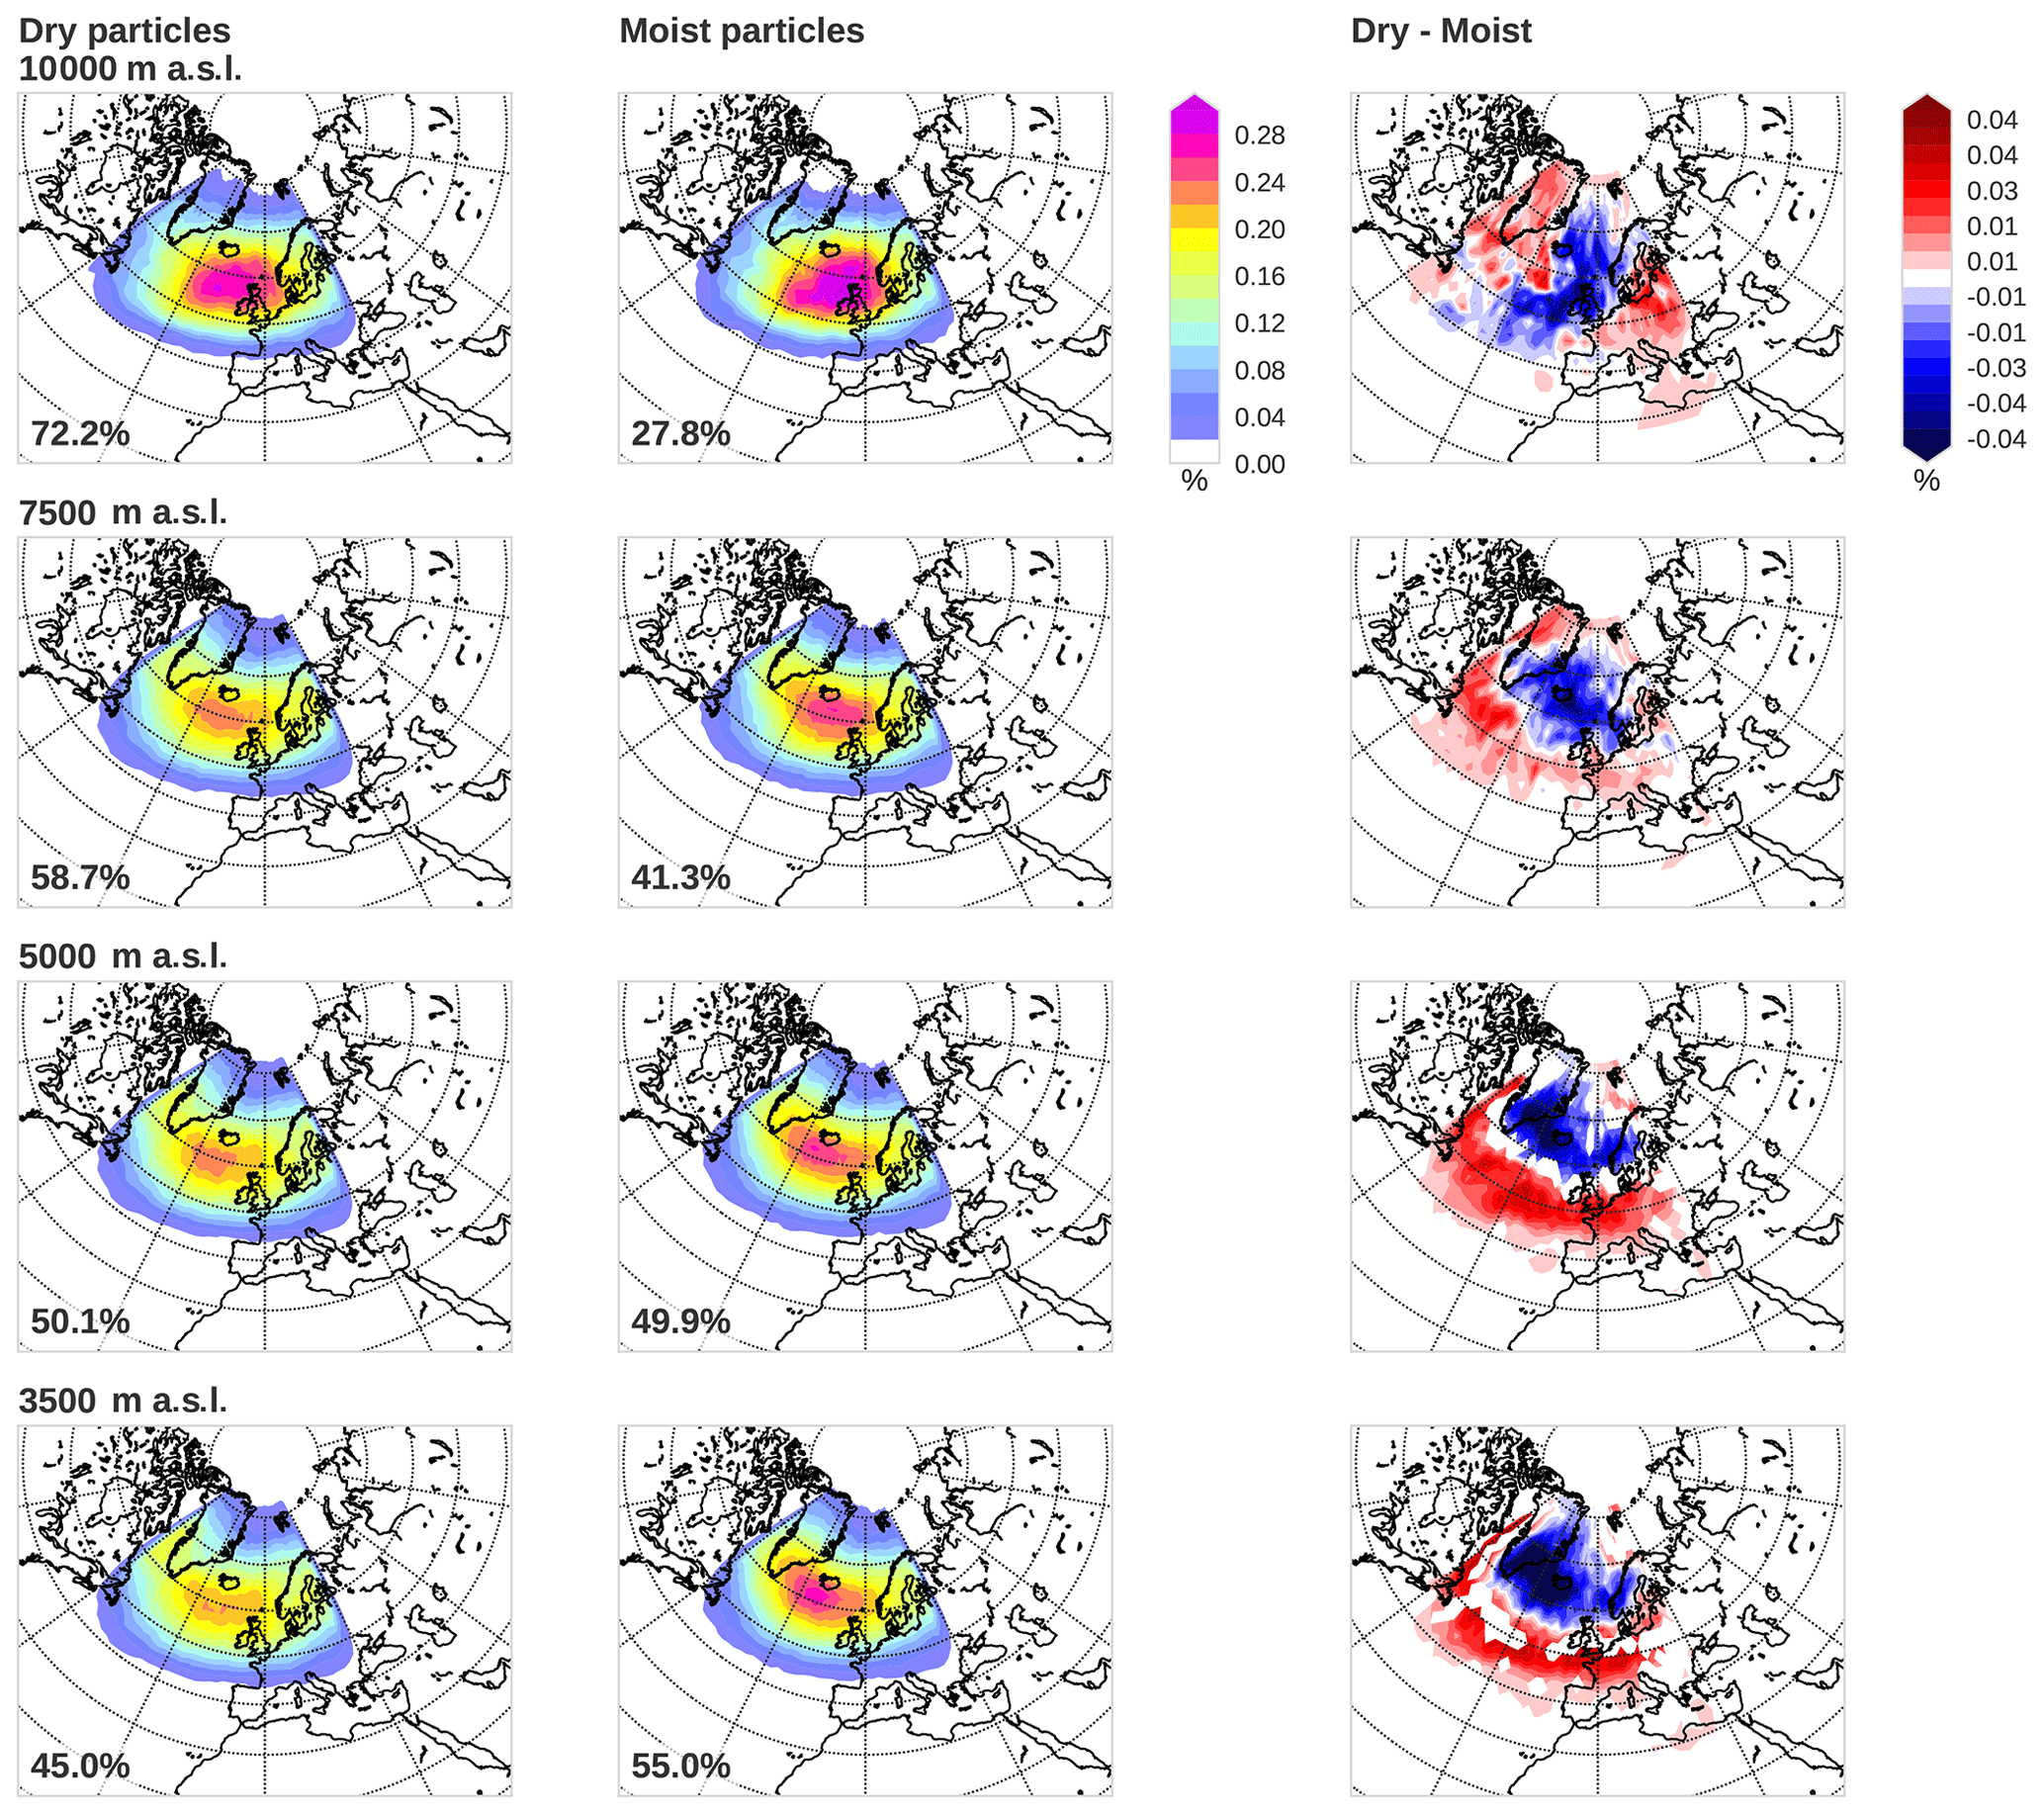
Figure 6The number density of dry (left column) and moist particles (middle column) and their difference after being normalized by the total particle number of each category (right column) for each grid cell at the time of their release from the block regions separately for the release altitudes of 10 000 (top), 7500 (second row), 5000 (third row), and 3500 (last row). The numbers indicated in the bottom left corner for the left and middle columns denote the percentages of dry and moist particles released from each altitude, respectively. Only the grid cells where statistical difference is significant at the 95 % confidence level are shaded in the third column. Parallels are plotted for every 10∘, whereas meridians are plotted for every 30∘ on each plot.
In the meantime, a closer look at the difference plots (right panels) highlights that moist particles tend to be situated poleward of dry particles among those particles released from the lower altitudes (5000 and 3500 ). Previous studies showed that geopotential height anomalies associated with blocks tend to be located equatorward of the corresponding PV anomalies (e.g., Fig. 10 in Steinfeld and Pfahl, 2019), suggesting that if we repeat the analysis with the blocks being defined with PV anomalies, the signature of moist particles making up the blocking cores may be more clearly seen. Confirmation of this speculation, however, should be a topic of a future study.
In the preceding section we have found that heat and moisture for the moist particles are not only provided by the Atlantic, but the North Pacific also likely acts to supply necessary heat and moisture to some particles en route to the Euro-Atlantic blocking (Fig. 3). In this section, we further separate the moist particles depending on their moisture sources in order to uncover the characteristics associated with their different pathways and their roles in blocking maintenance.
4.1 Partitioning of moist particles according to their moisture sources
We partition the moist particles into the two different moisture origins using the ocean basin mask dataset with 1∘ horizontal resolution provided by the US National Oceanic and Atmospheric Administration (NOAA; https://iridl.ldeo.columbia.edu/SOURCES/.NOAA/.NODC/.WOA05/.Masks/.basin/index.html?Set-Language=en., last access: 17 January 2020). Those particles that are subject to LHF from the ocean over the Atlantic south of 65∘ N and the Mediterranean Sea are termed “Atlantic particles”, while those particles subject to LHF from the ocean over the Pacific south of 65∘ N as well as the Sea of Japan are termed “Pacific particles”. As such, we have found that approximately two-thirds of the moist particles (i.e., 25.8 % out of 41.3 % of the total moist particles) source their moisture from the Atlantic basin, while the vast majority of the remaining one-third source it from the Pacific (i.e., 13.6 % out of 41.3 % of the total moist particles) based on the particle tracking backward in time for a period of 10 d (Fig. 7a). Intriguingly, a minute fraction of the particles (1.4 % of the total moist particles) receive heat and moisture from both the Pacific and Atlantic basins (denoted “two-basin particles”). In comparison, 23.0 % of the non-blocking particles is constituted by Atlantic particles, 12.3 % by Pacific particles, and 1.2 % by two-basin particles out of the 37.1 % of the total moist particles. Although these differences seem small, especially for the two-basin particles, all of these percentages are significantly different from the blocking particles at the 99 % confidence level. Note that we do not consider the moist particles fuelled over the Indian Ocean in the rest of the analyses, which only account for less than 1 % of the total moist particles. These particles do not additionally pick up moisture from the other ocean basins (not shown).

Figure 7Total LHF along the moist particles found within each grid cell over the whole (a) 10 d and (b) 20 d periods for backward particle tracking divided by the number particles of each moist-particle trajectory (colour shading) for the Atlantic particles (left column), Pacific particles (middle column), and two-basin particles (right column). The particle locations at (a) 10 and (b) 20 d prior to their arrival in the blocks for each grid cell are denoted by the red contours for 0.01 %, 0.025 %, 0.05 %, 0,1 %, 0.15 %, and 0.2 % in each panel. The percentage indicated in the bottom right corner of each panel denotes the percentage of the particles that belong to each moisture source category out of the total number of particles (i.e., dry and moist particles altogether). Parallels are plotted for every 10∘, whereas meridians are plotted for every 30∘ on each plot.
When we extend the duration of the particle tracking from 10 to 20 d (Fig. 7b), the fraction of moist particles increases by about 15 %, especially escalating the fractions of the Pacific particles and two-basin particles, while the 20 d tracking accounts for almost the same fraction for the Atlantic origin as the 10 d tracking. The twofold increase in the Pacific pathway particles indicates that the 10 d period is not long enough for some particles to be traced back to their moisture source in the Pacific. The over sixfold increase in the two-basin pathways is explained primarily by the detection of additional particles of Atlantic origin that previously stayed in the PBL over the Pacific between 10 and 20 d prior to blocking events and to a lesser extent by some particles of Pacific origin that are tracked back further to the Atlantic, across Eurasia. The fraction of particles sourcing their moisture from the Indian Ocean remains lower than 1 % even with the 20 d tracking, indicating that the Indian Ocean does not act to provide much moisture for the wintertime Euro-Atlantic blocking events.
The Atlantic particles tend to originate locally 10 d prior to the arrival at the block locations (the particle distribution at −10 d indicated by the red contours in Fig. 7a), with their maximum concentration found over the lee side of the Rockies over the North American continent. These particles then pick up a substantial amount of moisture from the Gulf Stream and its extension. A similar picture holds when they are tracked for 20 d (Fig. 7b), although more particles tend to stem from the east of the block locations over Eurasia.
The Pacific particles identified through the 20 d tracking tend to originate from farther upstream, primarily receiving turbulent heat fluxes from the Kuroshio and its extension, with a clearer maximum concentrated along the Kuroshio Extension. Note that the reason why the LHF maximum along the Kuroshio Extension is only about a half of that along the Gulf Stream, despite no notable difference in the climatological turbulent heat fluxes between them, is the fact that the particle density passing over the Kuroshio region arriving at Euro-Atlantic blocking is smaller compared to the Gulf Stream region (see. Fig. 2a).
The origin locations of the two-basin particles appear to be a mixture between the Atlantic and Pacific pathways, though largely stemming from the western Pacific. These particles tend to pick up ample moisture from the two western boundary currents and their extensions. Again, the role of the Kuroshio becomes more apparent when particles are tracked back for 20 d.
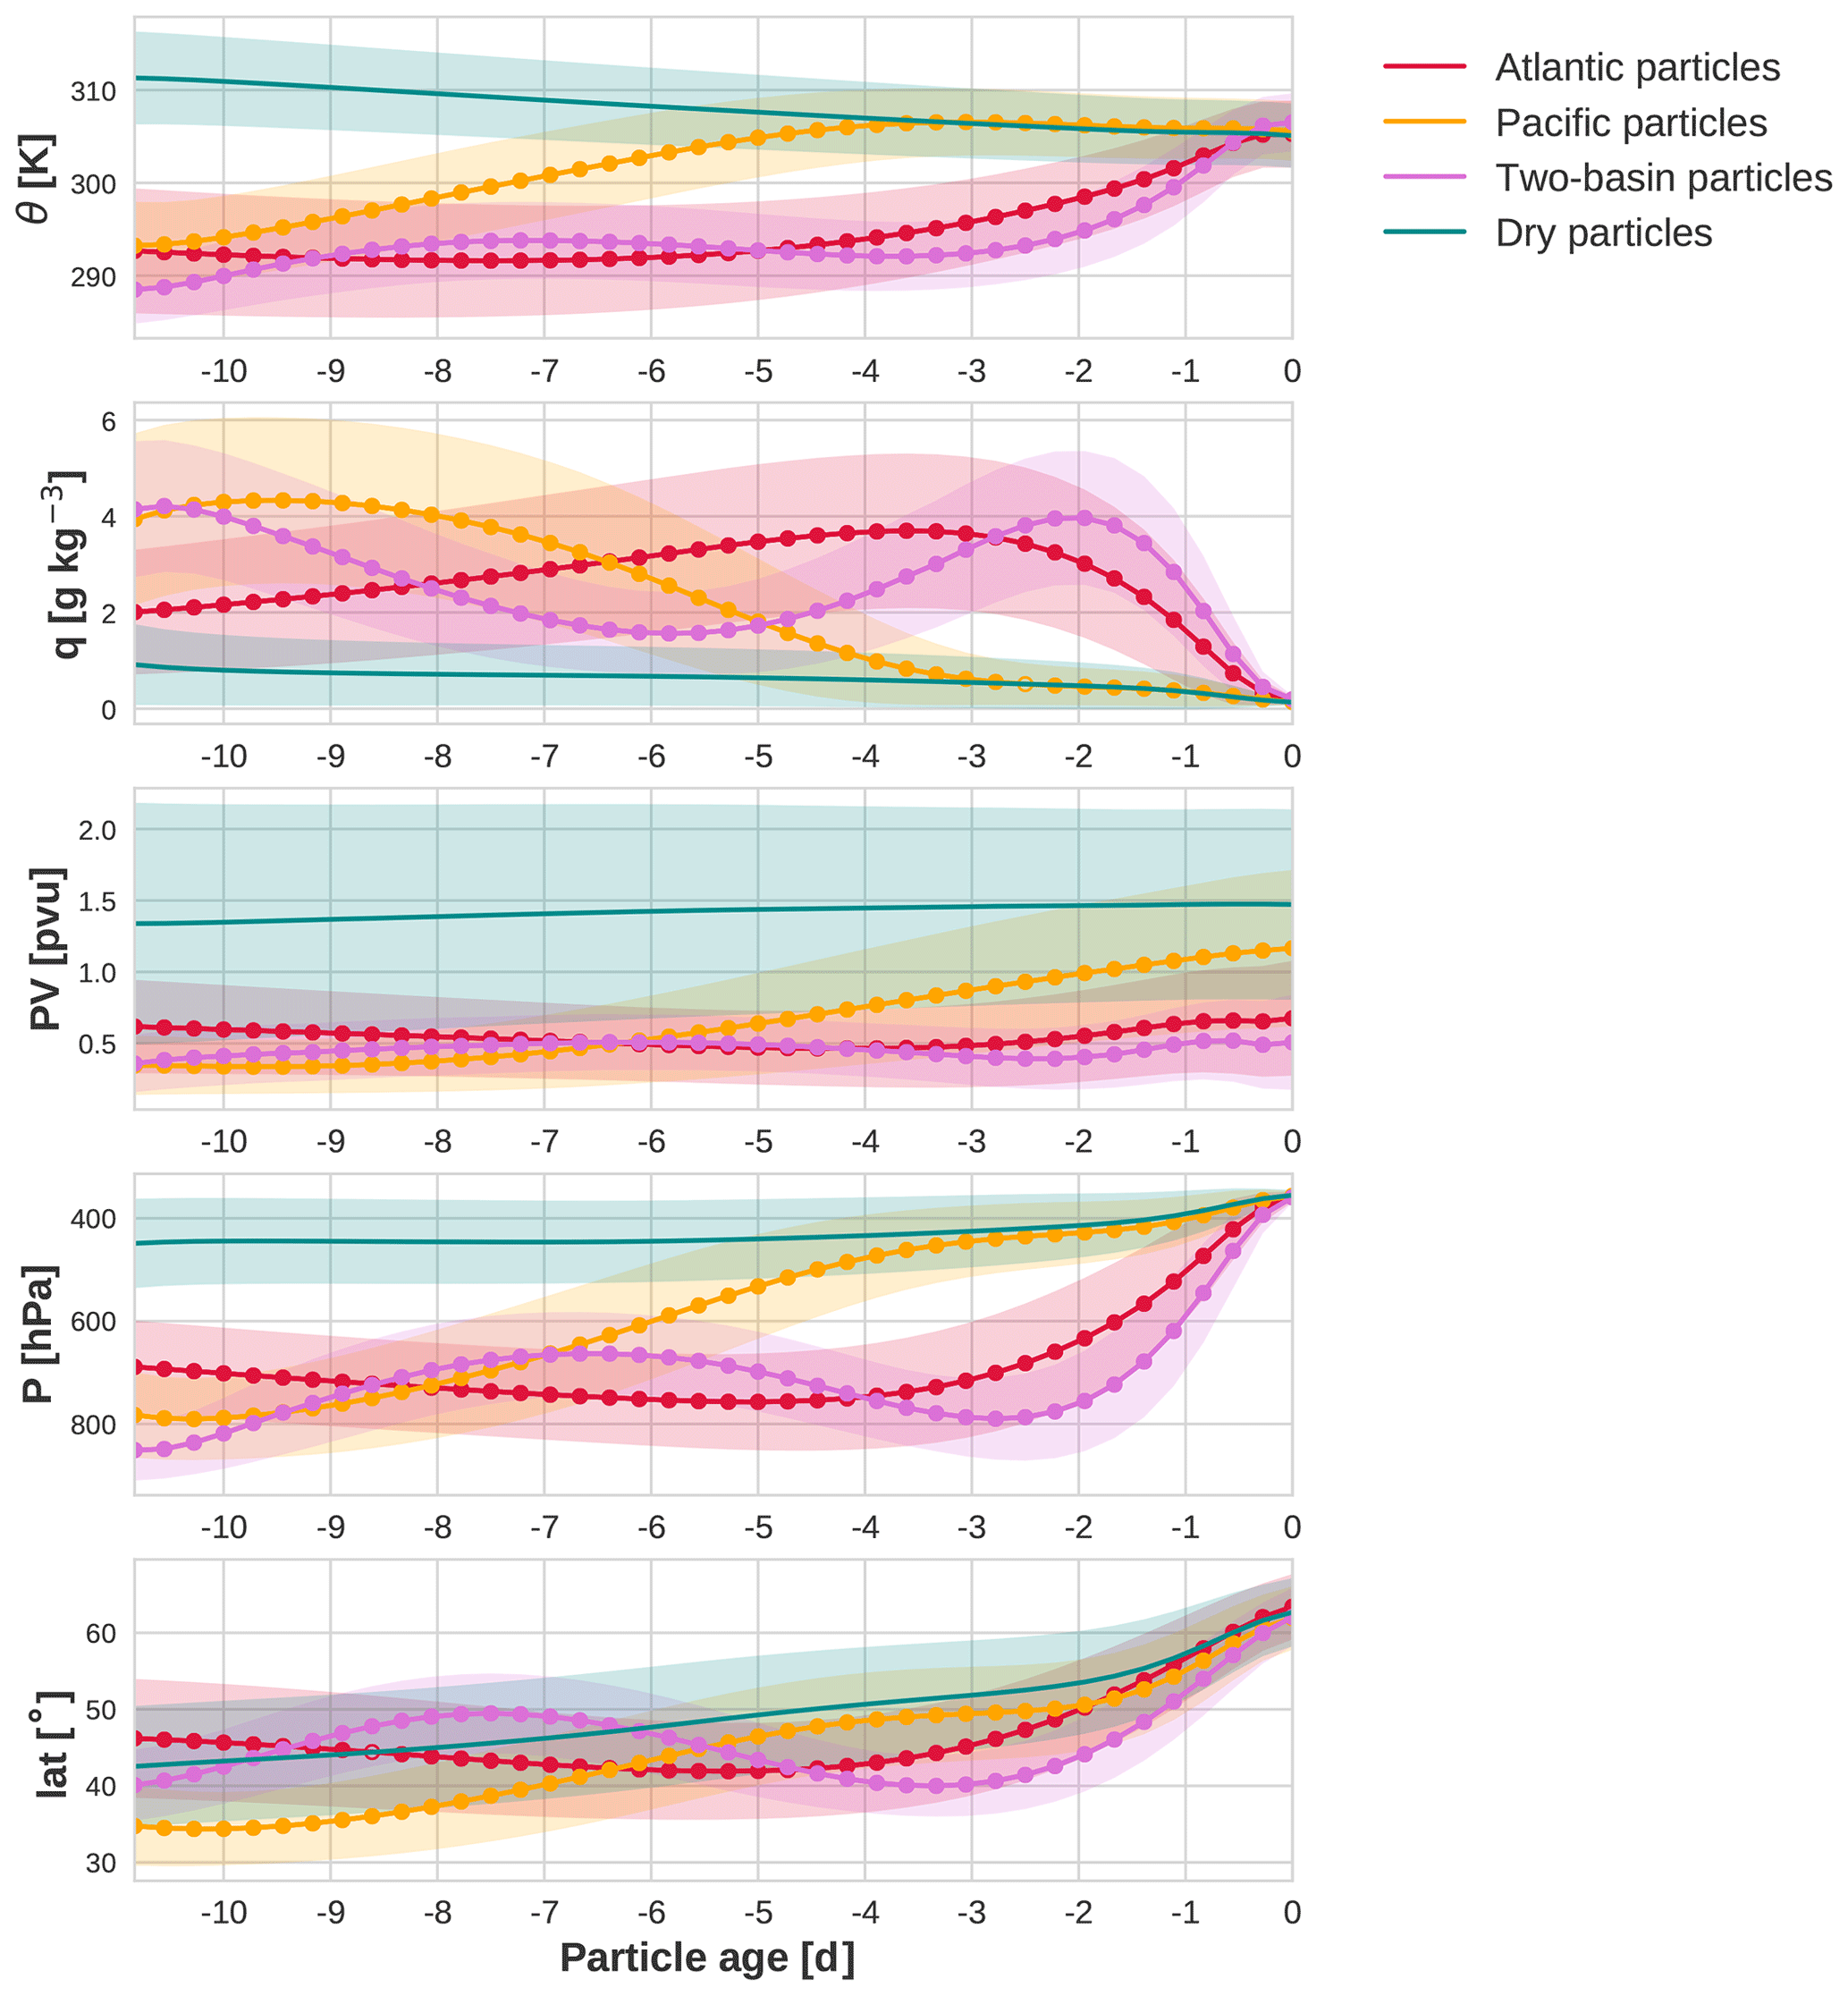
Figure 8Same as Fig. 5 but with moist particles being categorized according to their moisture sources: Atlantic particles (red), Pacific particles (orange), and two-basin particles (magenta). Cyan denotes the properties for the dry particles.
In addition, there exists another local maximum of LHF around 30∘ N, 145∘ W northeast of the Hawaiian Islands for both the Pacific and two-basin particles (Fig. 7 the middle and the right panels). Unlike the western boundary currents and their extensions, this particular region is not climatologically characterized by large upward LHF. The accumulated total LHF is affected by the following two factors: particles' 6-hourly concentrations and the actual LHF supplied to the particles. Further analysis indicates that these two factors both contribute, suggesting that the particles are preferentially situated over this location and that they are subject to a larger amount of LHF than its climatology (not shown). As discussed later in Sect. 4.3, this region coincides with starting locations of the large-scale ascent for those particles supplied with moisture from the Pacific, thus acting as a “springboard”.
4.2 Time evolution of variables along the trajectories of particles of different moisture sources
In order to assess whether the physical processes involved depend on the particles' moisture sources, we repeat the same analysis on the temporal evolution of variables along the particle trajectories but this time after separating the moist particles into different moisture sources (Fig. 8). Additionally, a three-dimensional view of the mean positions of these different pathways along with their mean PV value is shown in Fig. 9 in order to illustrate their typical trajectories relative to their geographical locations. The lowest altitudes of these averaged trajectories do not necessarily get lower in the boundary layer, reflecting the fact that the individual particles reside in the boundary layer at different times along the trajectories.
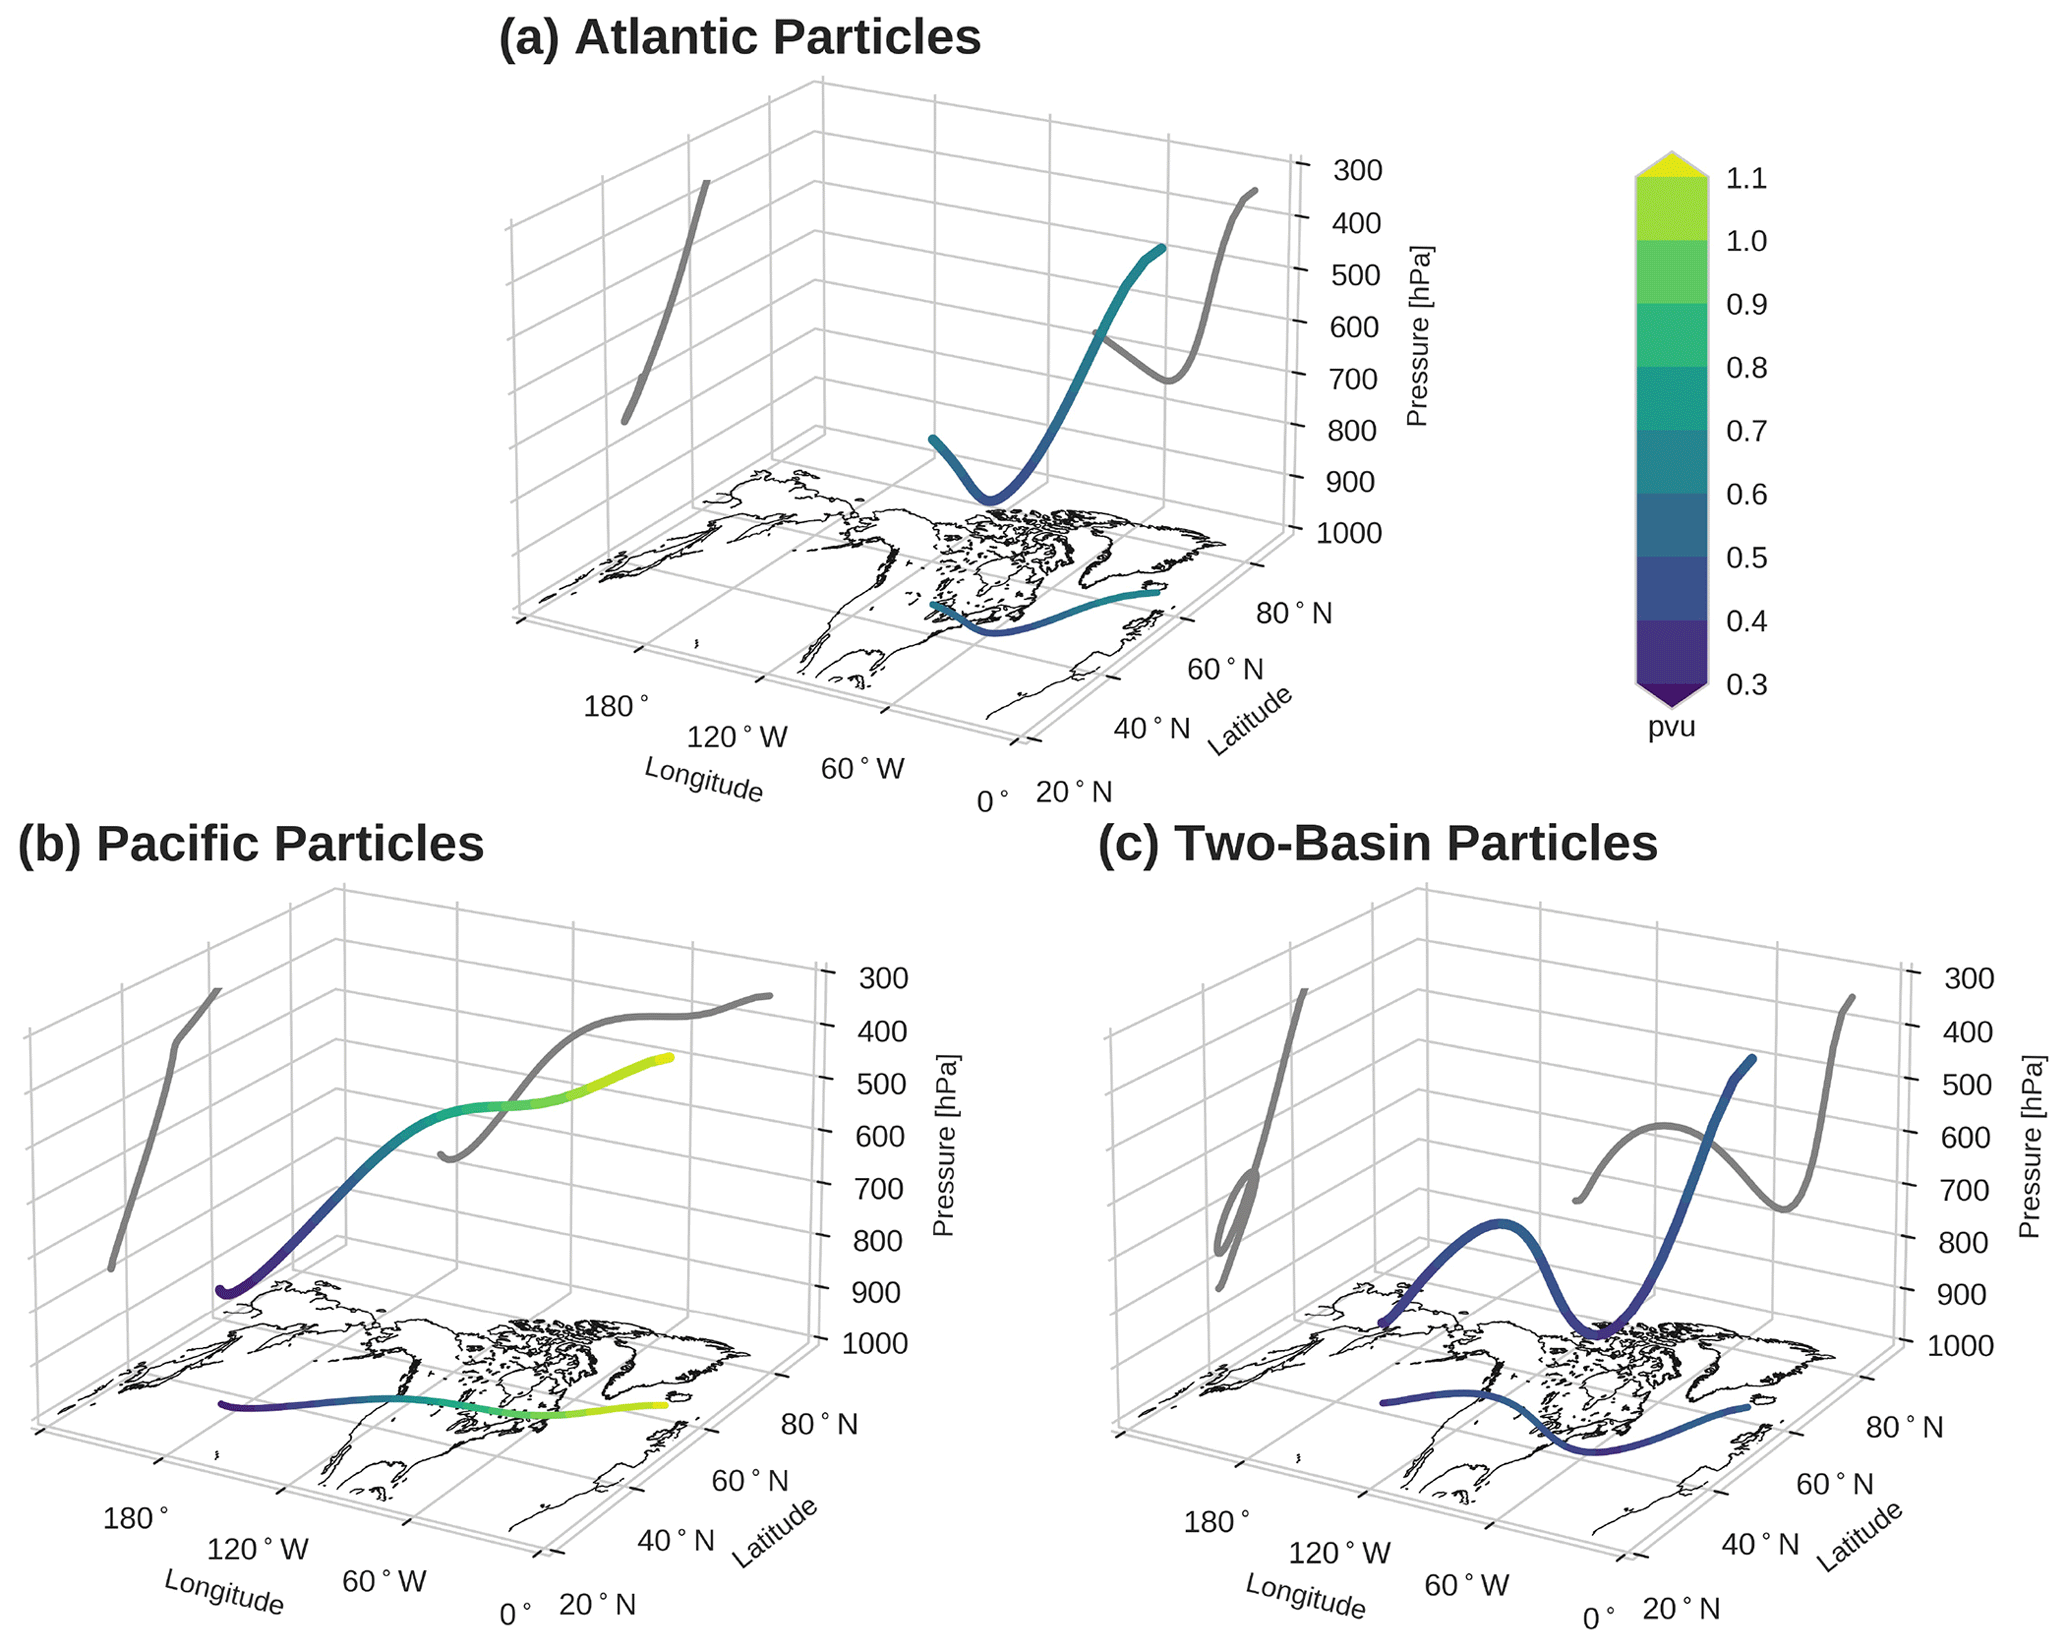
Figure 9Three-dimensional trajectory locations averaged for (a) the Atlantic particles, (b) Pacific particles, and (c) two-basin particles. The lines on the surfaces of constant pressure, latitude, and longitude are the projections of the three-dimensional mean trajectory locations on each surface. The colours along the trajectories denote the mean PV values.
Figure 8 reveals that the Atlantic particles tend to originate from northern locations in the mid-troposphere on average (red lines). These particles gradually descend while travelling southward and gaining moisture until the last 3–4 d before being lifted up swiftly and undergoing latent heating over the Atlantic basin (Fig. 9a).
In contrast, the Pacific particles (orange lines in Fig. 8) stem from the lower latitudes and altitudes. On the following days (day 9–day 4) these particles keep ascending and experiencing latent heating, especially off the west coast of North America (Fig. 9b), which tends to occur earlier than the Atlantic particles by approximately 4–5 d. After nearly all the moisture is lost by day −4, most of the properties of these particles become almost indiscernible from those of dry particles (denoted by cyan lines), travelling along similar pressure and isentropic surfaces as well as at similar latitudes. The figure indicates that these particles also undergo radiative cooling at the same rate as dry particles from then on. Thus, the Pacific particles are transported in the same manner as the dry particles once lifted up into the mid-troposphere. In the meantime, it is notable that PV along these Pacific particles increases as they ascend approximately from day −5, which is the opposite to the expectation that PV decreases above the heating maximum. Although further investigation is necessary, we speculate that this PV gain may be attributable to PV mixing with the higher upper-tropospheric PV near the tropopause (e.g., Hoskins, 1991).
The two-basin particles evolve in a similar manner to the Pacific particles at the beginning (magenta lines in Fig. 8) as the particles originate from relatively low latitudes and altitudes with relatively high moisture content and then undergo ascent over the Pacific, especially off the west coast of North America. The ascent is, however, only by about 150 hPa till day −7, leading to slight latent heating. As is shown in Sect. 4.4, this lesser extent of uplift off the west coast of North America stems from the lower humidity content of those particles compared to the Pacific counterpart at the time of the ascent. These particles then start descending on the lee side of the Rockies (Fig. 9c) and receive heat and moisture from the Atlantic before ascending very rapidly into the blocking system in the last 2 d (Fig. 8).
PV values of moist particles, regardless of their moisture sources, are significantly lower than those of dry particles. This is the case even for the Pacific particles that undergo a slight increase in PV after day −5 as noted earlier. While they appear to be advected indistinguishably from dry particles, their PV values are still significantly lower than those of dry particles. When compared to the winter mean background PV, the PV values of these particles during the last 4 d just before arriving at the blocking system indeed tend to be significantly lower, indicating that they are associated with anticyclonic eddies (Fig. 10). This result further corroborates the previous findings that, once lifted up into the upper troposphere, these particles constitute low-PV anomalies in contrast to the background upper-tropospheric PV at the same location (Pfahl et al., 2015; Steinfeld and Pfahl, 2019). In light of the blocking mechanism, therefore, these moist particles can be considered to be those associated with anticyclonic eddies (low PV) that are selectively absorbed into blocking systems (Yamazaki and Itoh, 2013a), acting to prolong the blocking lifetime. While Yamazaki and Itoh (2013a) identified the physical process behind this mechanism in the upper troposphere through an isentropic trajectory analysis by implicitly assuming dry processes, our result points towards such a reconciled view that at least a part of this low-PV air can be, in fact, traced back to moist processes farther upstream.
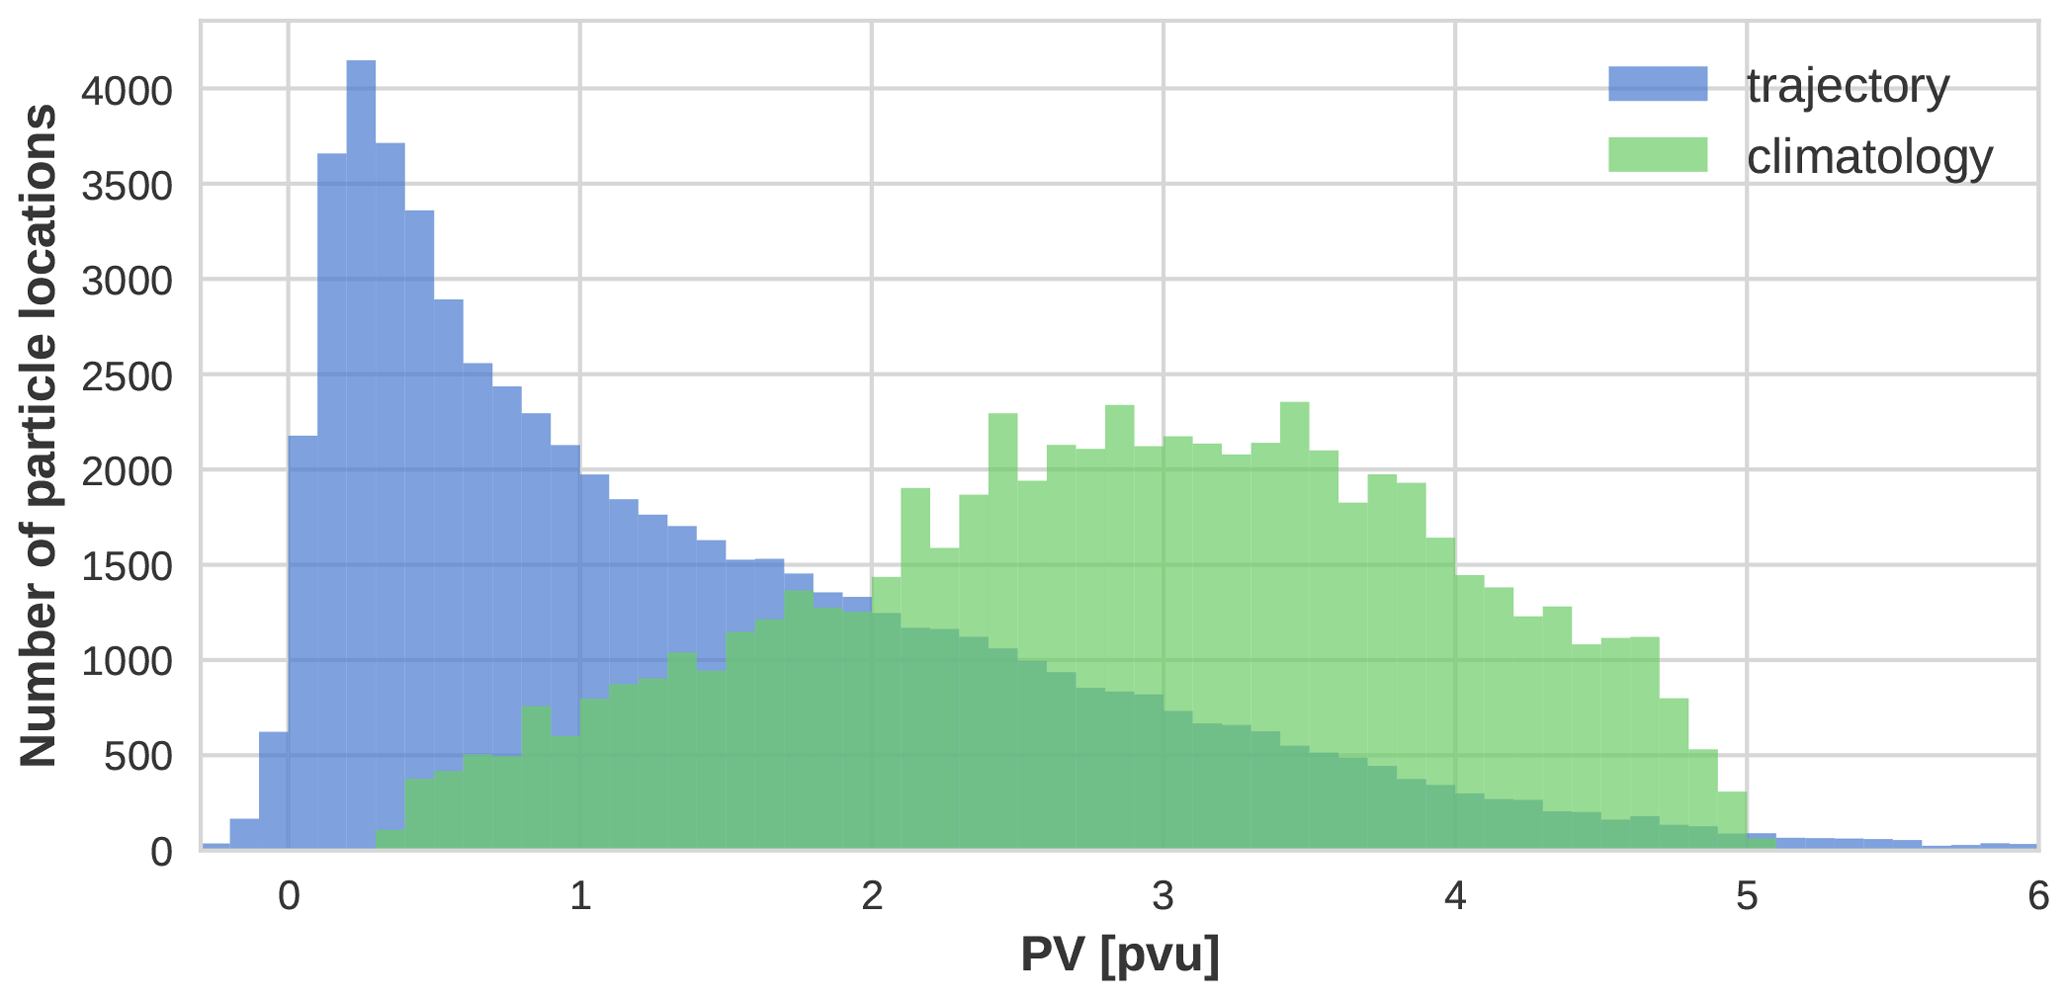
Figure 10Probability density distributions of PV values for the Pacific particles (blue) and for the climatological values interpolated to their two-dimensional locations (green). The former is based on 10.1 % of the Pacific particles that reached above 400 hPa and whose potential temperature remains between 300 and 320 K in the last 4 d before arriving at the Euro-Atlantic blocks, while the latter is based on the CFSR climatological PV values at the 310 K level computed by applying a 30 d low-pass filter. The two distributions are significantly different at the 95 % confidence level.
We have repeated the same analysis using particles tracked backward in time for 20 d. Extending the tracking time, however, does not change the qualitative picture shown in Fig. 8, except that all categories of particles originate from the mid-latitudes. Despite the fact that some particles are classified into different categories under the extended tracking, the evolution of the properties during the last 10 d is indistinguishable from those obtained from the 10 d tracking (not shown), indicating the significance of the processes that take place in the final 10 d for the downstream blocking.
4.3 Large-scale ascent associated with moist particles with different moisture sources
Given the importance of a large-scale cross-isentropic ascent, we investigate the extent of uplift as well as the associated properties for moist particles with different moisture sources. Here, we quantify large-scale ascent in accordance with the definition of WCBs. Following Steinfeld and Pfahl (2019), we define those particles released from wintertime Euro-Atlantic blocks that undergo a prominent rapid ascent for at least 600 hPa within 48 h as the WCB particles. For simplicity, unlike Madonna et al. (2014), the particles are not required to be in the vicinity of cyclones to be identified as WCB particles in our definition. Our WCB particles may thus include those particles that are not strictly classified as the conventional WCBs. A detailed analysis of individual events, nonetheless, revealed that these events are almost always accompanied by cyclonic systems at the time of their ascent (not shown). Consistent with Madonna et al. (2014), the average increase in potential temperature associated with the WCB particles is found to be about 20 K, while the average decrease in specific humidity is about 7 g kg−1.
Table 1 indicates that approximately 30 % of the moist particles (i.e., about 10 % of the total number of particles) are identified as WCB particles at some point along their 10 d trajectories, regardless of their moisture sources. This number (∼10 %) is fairly similar to 9.7 % reported by Steinfeld and Pfahl (2019) based on 7 d period statistics. The fraction of moist particles identified as WCBs exceeds 60 % (85 %) of the total moist particles when the WCB definition is loosened to an ascent over 500 hPa (400 hPa) within 48 h for the 10 d tracking trajectories (Table 1).
Table 1The fractions of the 10 d tracking moist particles of different moisture sources which fulfil different ascent criteria.
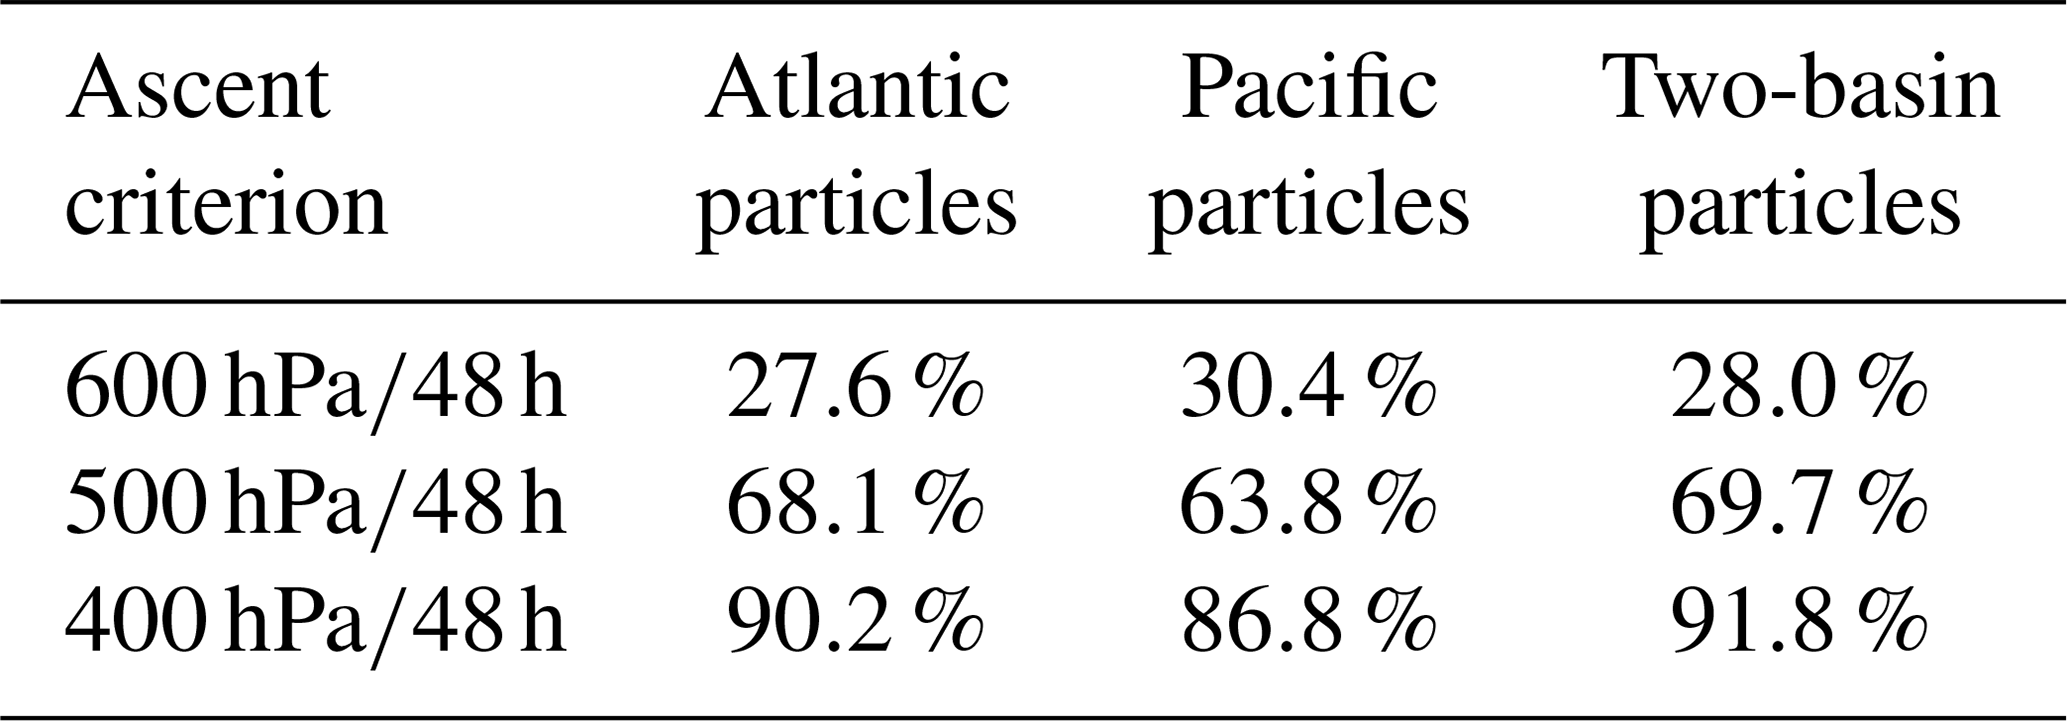
Figure 11a illustrates that the WCB particles undergo ascent preferentially around the western boundary currents and their extensions as well as over the eastern Pacific to the northeast of the Hawaiian Islands, as was the case for the locations of the maximum LHF that the particles receive (Fig. 7). These locations, including the region to the northeast of the Hawaiian Islands, agree with the reported climatological locations of the wintertime WCB occurrence (Madonna et al., 2014, their Fig. 4d). This close collocation between the particles' acquisition of turbulent heat fluxes and their ascent is in line with the results shown by Boutle et al. (2010) in their idealized extratropical cyclone simulation. They showed that the augmented continuous evaporation is found in the vicinity of the WCB as a consequence of the continual moisture export from these regions by the horizontal divergence forced by boundary-layer drag. This moisture, in turn, converges at the base of the WCB forced by surface drag and large-scale ageostrophic flow, thereby providing a substantial amount of moisture continuously to the WCB. Thus, the collocation of the LHF from the ocean and particle distributions is likely to indicate an active involvement of the moisture convergence associated with extratropical cyclones. While the result shown in Fig. 11a is for the 20 d tracking where the signature over the Pacific is more visible compared to the 10 d tracking, the same conclusion also holds for the 10 d tracked particles (not shown).

Figure 11(a) Number density of the 20 d tracked WCB particles released from Euro-Atlantic blocks at the starting time of the ascent (colour shading) and its ending time of their ascent (red contours) for each grid cell for the Atlantic particles (left), Pacific particles (middle), and two-basin particles (right). The number at the bottom right of each panel indicates the fraction (%) of the particles of each category identified as WCB particles. (b) Moisture sources for WCB particles released from Euro-Atlantic blocks (colour shading) for the Atlantic particles (first column), Pacific particles (second column), and two-basin particles. The two-basin particles are separated into two figures, depending on the WCB locations of interest: for the WCBs over the Atlantic basin (third column) and the Pacific basin (last column). The red contours in each panel delimit 0.01 % of the WCB starting locations. The percentage indicates the mean moisture contribution for the WCB ascent of each grid cell, and they amount to 100 % when they are summed up. Parallels are plotted for every 10∘, whereas meridians are plotted for every 30∘ on each plot.
To identify the moisture sources necessary for these large-scale ascents, we have applied a moisture source diagnostic following previous studies (Sodemann et al., 2008; Pfahl et al., 2014). In this method, we assign a weight to moisture uptake at each time step based on the ratio of the moisture increase to the specific humidity value that each particle has at the starting point of the WCB ascent such that each weight indicates a contribution of each moisture uptake for the WCB ascent. The weight at the previous moisture uptake is reduced when the specific humidity along the trajectory decreases and hence indicates a moisture loss due to precipitation. Thus, while partitioning of moisture particles into different moisture origins (Sect. 4.1) has been based solely on the location where the particles are exposed to LHF from the ocean without a prior knowledge that they undergo a rapid large-scale ascent, application of this method identifies the moisture sources necessary for a rapid large-scale ascent for each of these moist particles. Figure 11b shows the result of this moisture diagnostic applied to the moist particles of different moisture sources separately. Here we show the result for the 20 d tracking since the moisture source region particularly over the Pacific is more visible compared to the 10 d tracking, while the 10 d tracking also shows similar results. The figure clearly indicates that the Gulf Stream and Kuroshio, together with their extensions, act to primarily provide moisture necessary for the WCB ascent. For the two-basin particles, we have separately evaluated the ascent over the Atlantic and Pacific. The diagnostic reveals that the two-basin particles retain some of the moisture taken from the Pacific basin until they are lifted over the Atlantic basin. This moisture uptake over the Pacific explains 23.5 % and 41.6 % of the necessary moisture for the WCB ascent over the Atlantic basin for the 10 and 20 d tracking trajectories, respectively.
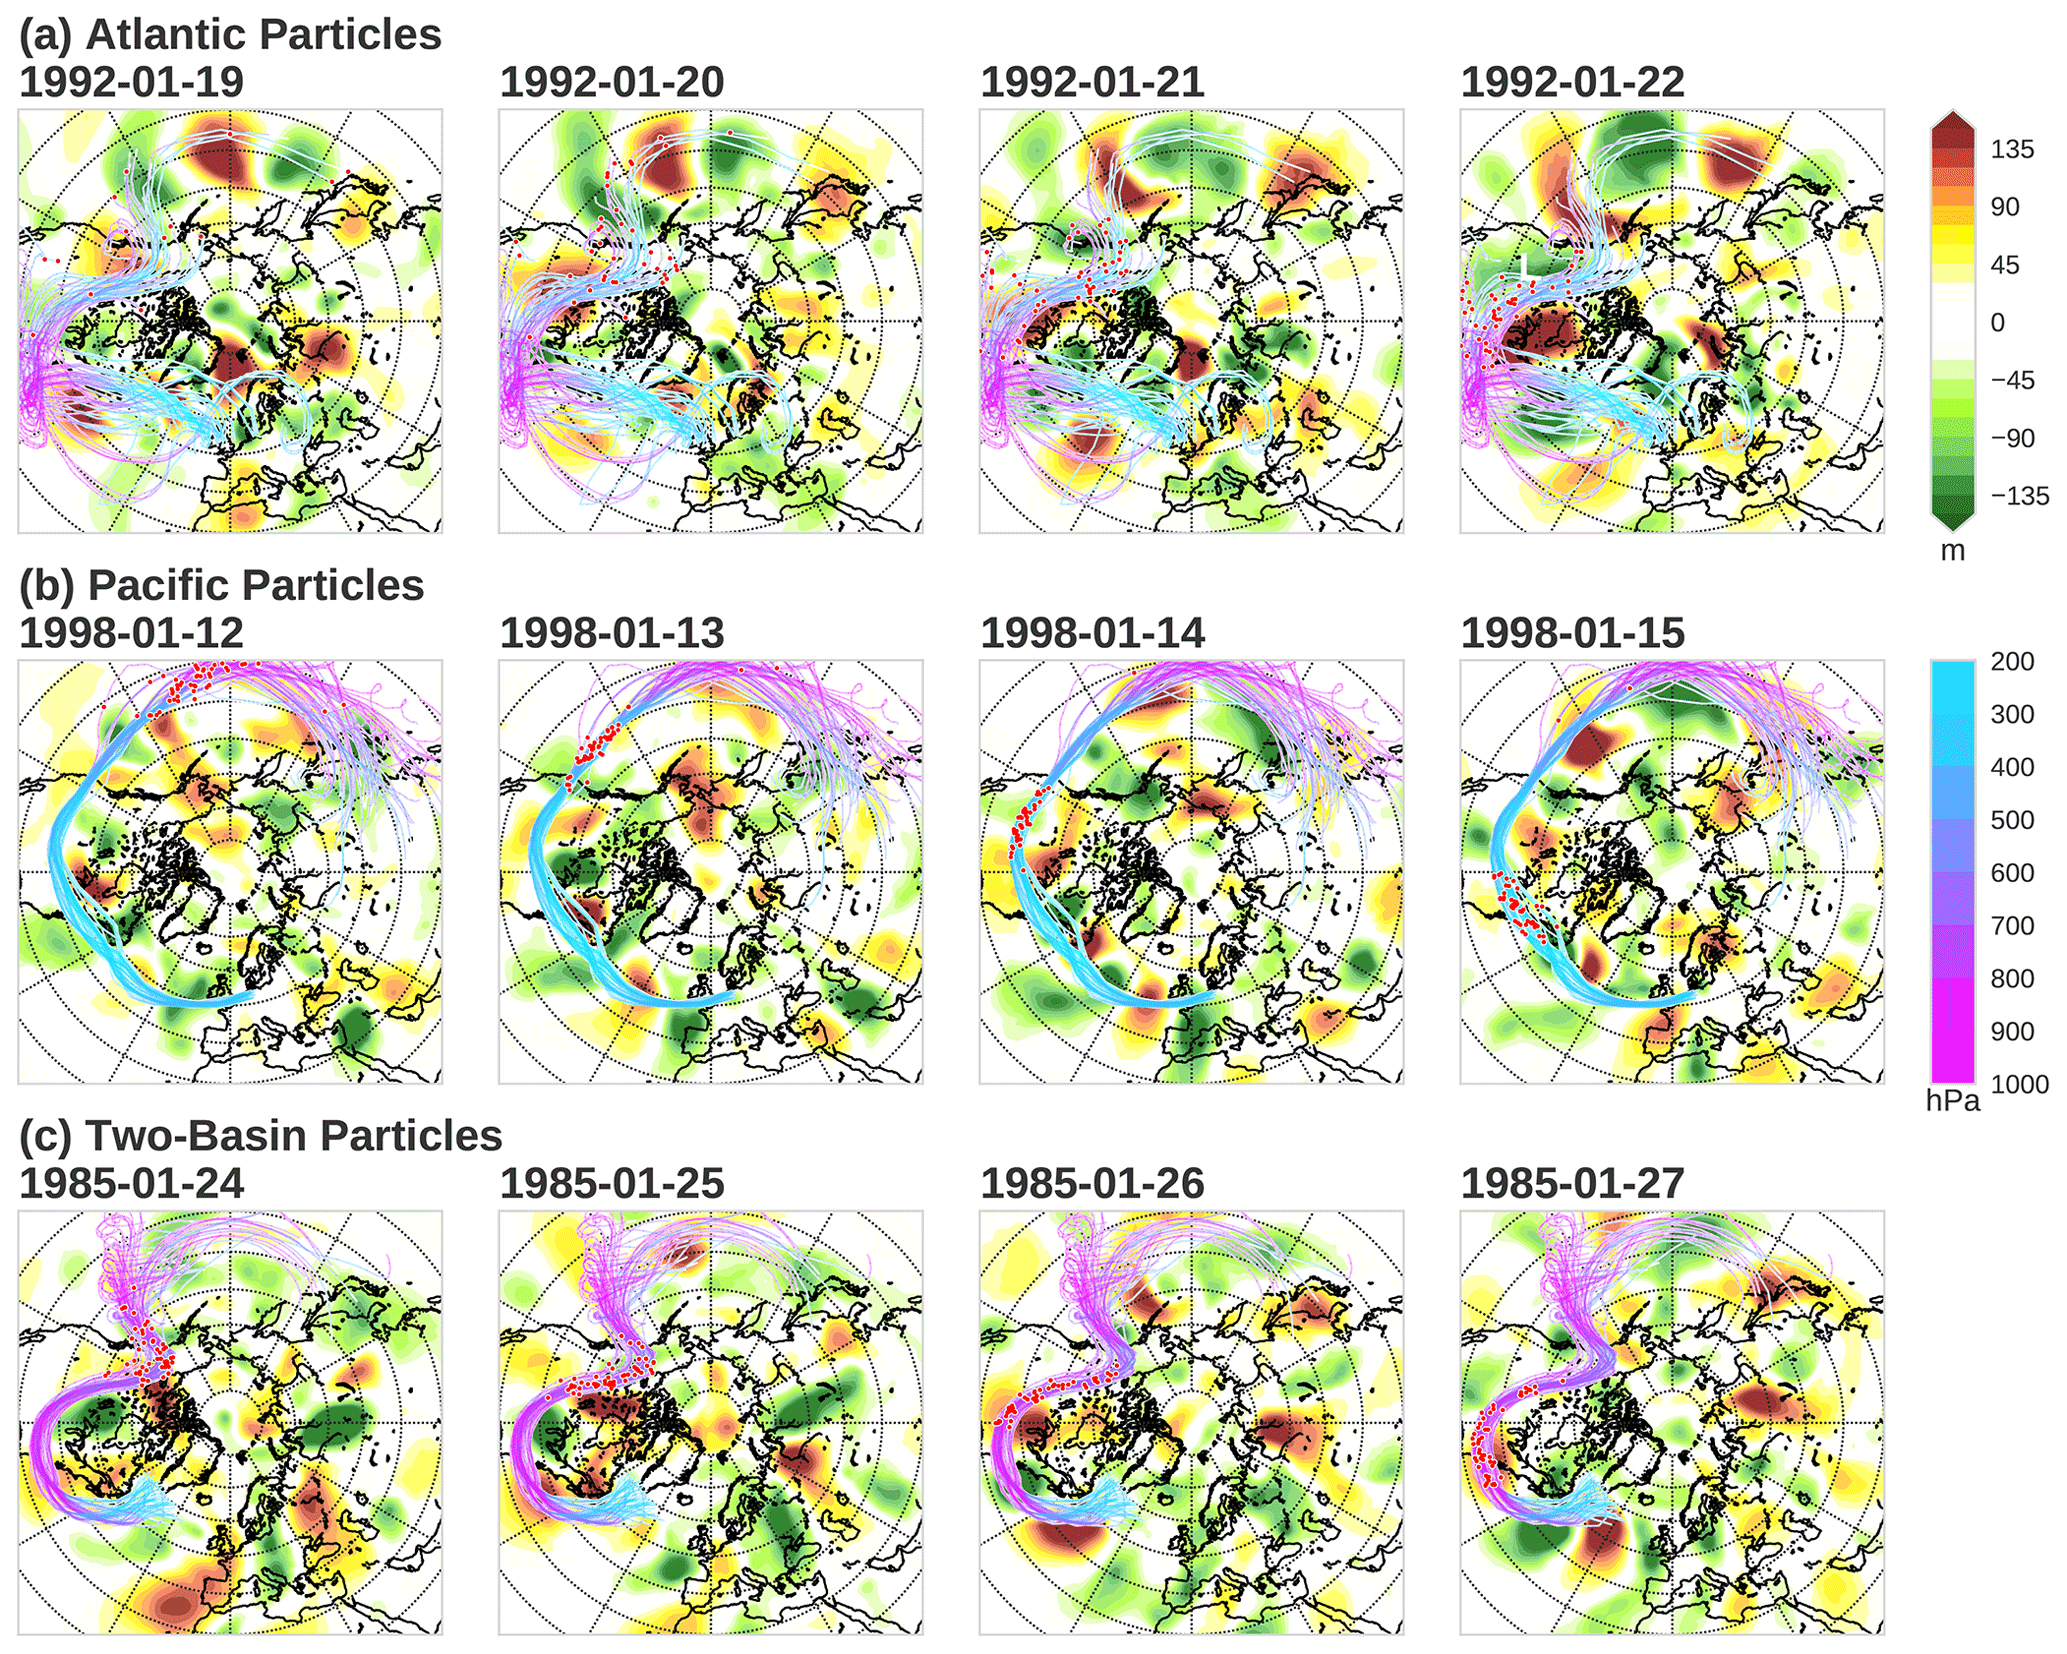
Figure 12Case studies of particle locations (coloured lines) and associated synoptic-scale eddies (shaded as in the top right colour bar) for the Atlantic particles (a), the Pacific particles (b), and the two-basin particles (c). The pressure levels [hPa] of up to 50 particles along their trajectories are plotted with coloured lines as indicated in the middle right colour bar. Their exact locations at the denoted times are indicated by red circles. The synoptic-scale eddies are defined as 8 d high-pass-filtered geopotential height fluctuations at 350 hPa. Parallels are plotted for every 10∘, whereas meridians are plotted for every 30∘ on each plot.
4.4 Typical synoptic conditions for individual moist-particle pathways
Thus far we have shown distinct properties along different pathways of moist particles and how they evolve differently from one another. The question, however, remains as to what kind of synoptic conditions possibly give rise to the different pathways that these moist particles are likely to take. To answer this question, we have analyzed the particle trajectories of different moisture sources with the corresponding upper-tropospheric synoptic eddies. Great case-to-case spatiotemporal diversity is found in the associated synoptic fields, hampering their meaningful composite analyses (not shown). Instead, Fig. 12 illustrates a more or less representative case that exhibits the common features found for a given moist-particle category. Many cases are found to exhibit roughly similar properties to these representative cases.
One common feature for the vast majority of the pathways that the Atlantic particles take is that the moist particles experience an organized descent over the North American continent in travelling southeastward in the vicinity of a synoptic-scale low-pressure system before they gain moisture from the North Atlantic. These features well correspond to those associated with a dry intrusion, a deep descent of dry air from the tropopause level into the lower troposphere often associated with extratropical cyclones (Browning, 1997), as clearly presented in Fig. 12 for 22 January 1992 (top right-most panel). A climatological study conducted by Raveh-Rubin (2017) illustrates that the North American continent is one of the most prominent locations for dry intrusion air to start descending before interacting with the warmer North Atlantic underneath approximately 48 h later. Intrusion of dry, cold atmospheric particles is likely to enhance SHF and LHF from the North Atlantic, especially over the warm Gulf Stream, effectively moistening the particles before they are lifted up into an upper-level blocking anticyclone.
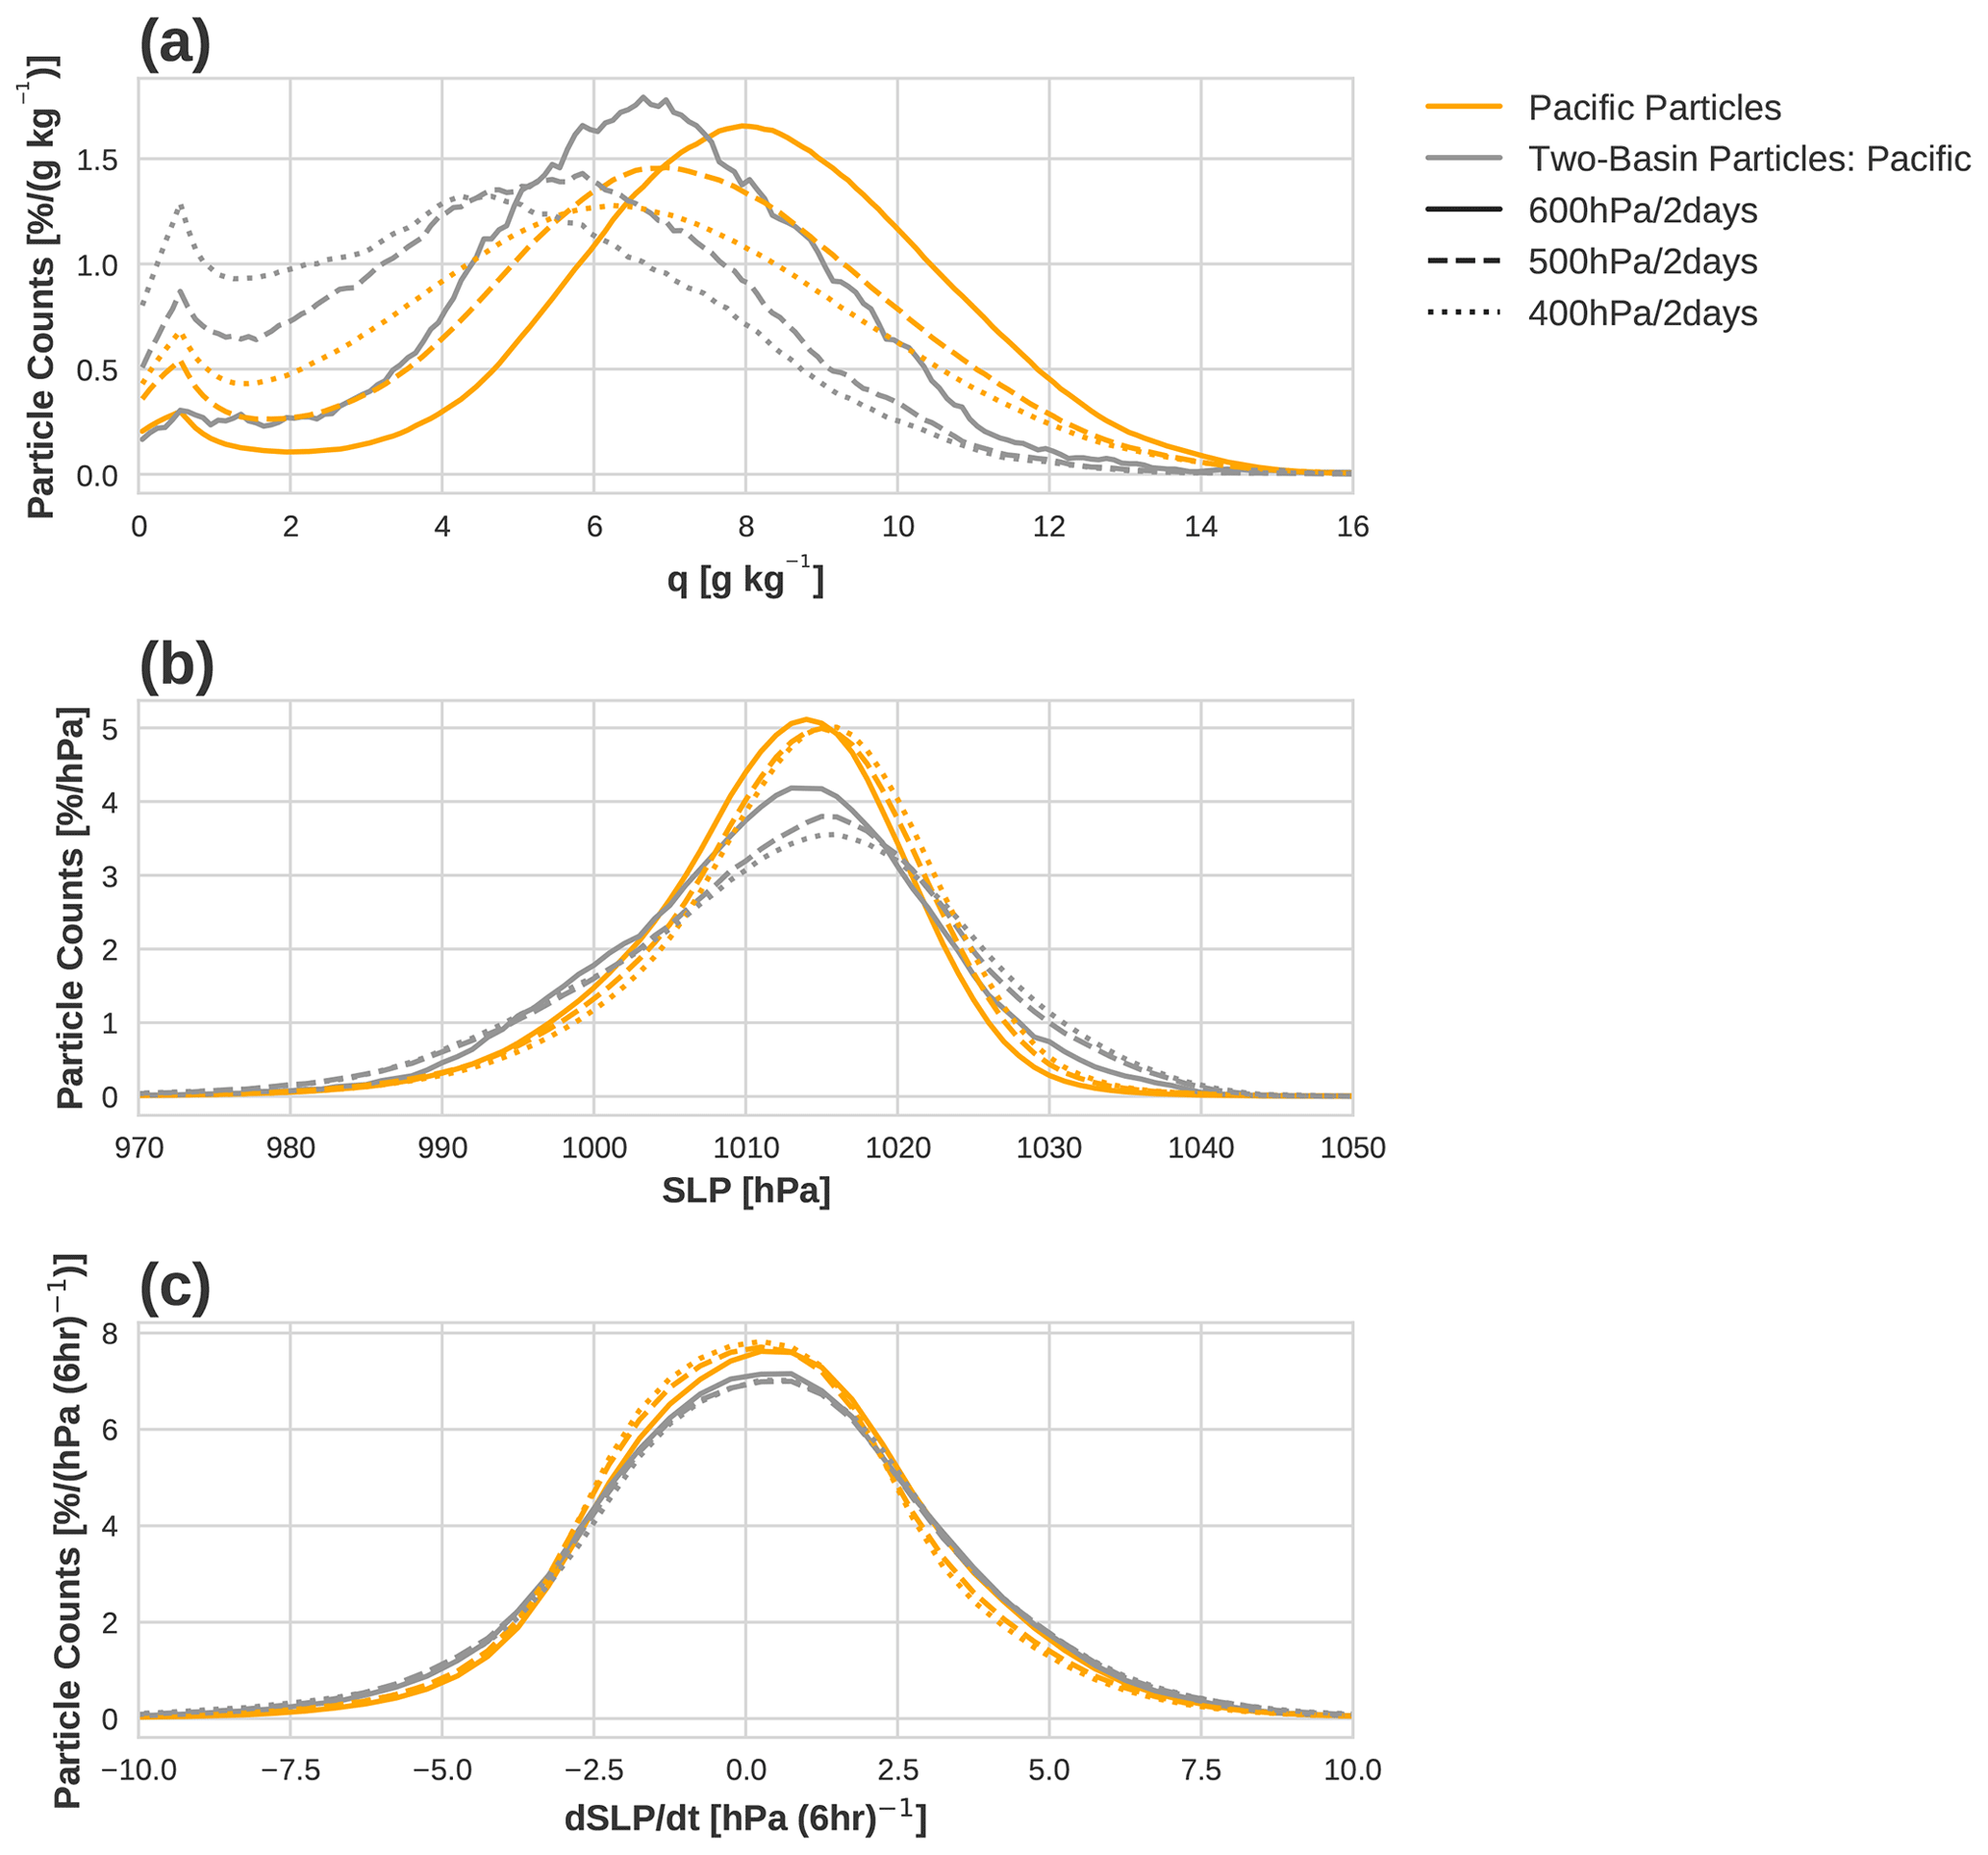
Figure 13(a) Specific humidity at the time of ascent for the Pacific particles (orange) and two-basin particles (grey). For the two-basin particles, only the time of their ascent over the Pacific is considered for each particle. For each moist-particle category, different line styles indicate different ascent criteria: solid lines for 600 , dashed lines for 500 , and dotted lines for 400 . (b) Same as the panel (a) but for the sea level pressure found at the time of the ascent at the particle's horizontal location. (c) Same as the panel (a) but for the sea level pressure tendency.
Both the behaviour of trajectories and the associated synoptic conditions are fairly dissimilar for the Pacific particles. Subsequent to a large-scale ascent into the upper troposphere over the northeastern Pacific, the particles do not undergo a deep descent over the North American continent unlike the Atlantic particles. Instead, the particles appear to follow the upper-level westerly waveguide in the vicinity of blocking (the second row of Fig. 12). Although further investigation is required, this aspect appears to be consistent with the finding by Yamazaki and Itoh (2013b), who suggested that upper-level westerlies upstream of a blocking high can act as a waveguide to effectively carry synoptic anticyclones towards the blocking high.
All cases of the two-basin particles are fairly analogous to the Atlantic particles but extended farther upstream into the Pacific 10 d prior to the arrival at the blocking events. Compared to the Pacific particles, they do not ascend as high off the west coast of North America, and as a result, they do not experience a strong descent over the North American continent compared to the Atlantic particles either. We found that this lack of a strong ascent over the Pacific is likely attributable to the difference in moisture content of the particles. At the time of the ascent, the moisture content of the Pacific particles is significantly higher than that of the two-basin particles at the 95 % confidence level, with the mean difference amounting to 1.4 g kg−1 (Fig. 13a). This relationship between the ascent level and moisture content becomes more evident when a different ascent criterion is applied (Fig. 13a, dashed and dotted lines). The figure reveals a clear link between the moisture content and the ascent level of a particle in such a way that the higher the particle's moisture content at the base of the ascent is, the higher the particle tends to ascend subsequently. In contrast, no such clear relationship is discernible with the sea level pressure (SLP; Fig. 13b) or with the SLP tendency (Fig. 13c) found at the base of the particle ascent despite the fact that a moderate to strong relationship has been reported between cyclone intensification and WCB strength by a previous study (Binder et al., 2016). Although more careful analyses, including an investigation of the lowest SLP found in the vicinity of the ascent as included in the WCB detection (Madonna et al., 2014), are indispensable to draw a more solid conclusion, these results point to the key role of the particles' moisture content at the base of the ascent in determining their ascending altitude.
Motivated by previous studies which pointed towards the significance of latent heating for atmospheric blocking events, we have investigated the oceanic moisture sources for wintertime Euro-Atlantic blocking events. To this end, we have utilized an atmospheric Lagrangian dispersion model and tracked particles released from blocking backward in time, which allows us to investigate the processes taking place within the turbulent planetary boundary layer (PBL). We found that 27.8 %–55 % of the total particles released from wintertime Euro-Atlantic blocking highs undergo diabatic processes, with the moist-particle percentages decreasing with the altitude that the particles are released from. Consistent with the previous studies, these moist particles transport significantly lower PV compared to dry particles from the PBL to the upper-tropospheric blocking highs via large-scale ascent. In stark contrast, dry particles travel pseudo-isobarically in the upper troposphere while being gradually cooled radiatively (Fig. 5). PV values remain significantly different between dry and moist particles throughout their evolution even when they reach the blocking highs (Fig. 5d). As a consequence, there is a tendency for moist particles to be preferentially concentrated in the blocking cores, indicating an important role of moist processes in the blocking systems (Fig. 6).
Depending upon their moisture sources, moist particles can be broadly divided into two categories: those moistening over the Atlantic and those moistening over the Pacific. The former, the particles that source moisture locally over the Atlantic, correspond to those that have been extensively studied in the previous studies (Pfahl et al., 2015; Steinfeld and Pfahl, 2019), which undergo a rapid ascent a few days prior to their arrival at the blocking systems. We have found that these particles tend to experience a large-scale descent over the North American continent before efficiently gaining moisture from the North Atlantic (Fig. 12a). Those particles that source their moisture remotely from the Pacific and then undergo ascent also transport low PV into the Euro-Atlantic blocking but almost in the same manner as the dry particles that travel along a westerly waveguide in the upper troposphere. Still, PV values of these moist particles remain significantly lower than the dry counterparts throughout, even all the way to their arrival at the blocking (Fig. 8). In this sense, these moist particles can be regarded as a part of the class considered by Yamazaki and Itoh (2013a) such that anticyclonic low-PV particles are preferentially absorbed into blocking systems, acting to prolong blocking lifetime. In their study, Yamazaki and Itoh (2013a) identified the mechanism by analyzing isentropic trajectories, and thus the involvement of moist processes remained uncertain. The current study, however, suggests that the same mechanism can be at play with particles of moist origin, thereby bridging the gap between the dry and the moist dynamical frameworks.
Our results further highlight that the paths that these moist particles preferentially follow while gaining moisture are concentrated over the western boundary currents as well as over the eastern Pacific to the northeast of the Hawaiian Islands (Figs. 3 and 7). These regions also coincide with the most frequent starting points of large-scale, cross-isentropic ascent resembling warm conveyor belts associated with extratropical cyclones (Fig. 11a). This collocation is likely linked with continuous evaporation from the warm sea surface and the subsequent transport toward the base of the warm conveyor belt associated with extratropical cyclones (Boutle et al., 2010). The western boundary currents are known for supplying substantial amounts of heat and moisture to the overlying atmosphere and thereby acting to anchor storm tracks by maintaining mean baroclinicity (Nakamura et al., 2004). Thus, given the primary role of extratropical cyclones, it is not surprising that the enhanced latent heat fluxes and the starting positions of warm conveyor belts are collocated over the western boundary currents. Meanwhile, the region to the northeast of the Hawaiian Islands is not a region that is climatologically known for large upward latent heat fluxes or a maximum in extratropical cyclone activity; rather, it corresponds to a region with an amplified vertically integrated moisture flux divergence driven primarily by advection associated with intraseasonal variability in the Aleutian low (Newman et al., 2012; Kwon and Joyce, 2013). Whether this anomalous moisture advection associated with the intraseasonal variability in the Aleutian low is linked with moisture convergence at the base of the WCB as discussed by Boutle et al. (2010) requires further investigation in future analyses.
Outstanding questions include whether the temporal variability in the western boundary currents on seasonal and longer timescales can affect blocking activities through modulations of moist processes. In this study we have focused on the climatological aspect of direct diabatic processes associated with blocking maintenance and shown that the western boundary currents provide substantial amounts of heat and moisture to the atmospheric particles en route to the Euro-Atlantic blocking systems. Observational evidence indicates that both the Kuroshio (Qiu and Chen, 2005; Kwon et al., 2010) and Gulf Stream (McCarthy et al., 2018; Joyce et al., 2019) exhibit interannual and decadal variabilities, which have been shown to influence the overlying atmosphere, including blocking activity (O'Reilly and Czaja, 2015; Joyce et al., 2019). Whether these oceanic variabilities can modulate the direct diabatic processes associated with the blocking events described in the current study, however, is yet to be known. Hence in a subsequent study we will investigate the effect of the oceanic temporal variability. Given a recent study that showed the projected strengthening of the Kuroshio and weakening of the Gulf Stream under future climate scenarios (Chen et al., 2019), understanding the sensitivity of the diabatic effect to the variabilities in these western boundary currents has important implications.
As is extensively discussed in Barriopedro et al. (2010) and Woollings et al. (2018), there is no one definite measure to define blocking, and thus numerous definitions have been used in the literature. Each definition aims at highlighting different aspects of blocking systems, entailing its pros and cons. The two mainstream types of blocking indices include the ones that detect the meridional gradient of geopotential height, focusing on the fact that blocks obstruct the prevailing westerlies (e.g., Tibaldi and Molteni, 1990; Scherrer et al., 2006) and others based on anomalies of variables such as geopotential height or potential vorticity from its climatological mean, highlighting that blocking highs are associated with strong anticyclonic anomalies (e.g., Dole and Gordon, 1983; Schwierz et al., 2004). Previous studies have reported that the former tends to erroneously detect the subtropical highs as blocks (Scherrer et al., 2006) while also having a deficiency in detecting omega or immature blocks (Doblas-Reyes et al., 2002; Pelly and Hoskins, 2003). The latter, in comparison, might suffer from cases when the geopotential height anomalies do not necessarily accompany a reversal of the westerlies (Woollings et al., 2018) while also having disadvantages in requiring arbitrary blocking anomaly thresholds and a robust climatology (Dunn-Sigouin et al., 2013).
In the current study, we identify blocks by using a hybrid index introduced by Dunn-Sigouin et al. (2013), which combines the basic ideas of both of these two types of blocking indices. Namely, blocks are detected by identifying a local maximum of 500 hPa geopotential height anomaly as in Dole and Gordon (1983) and then by ensuring that there exists a meridional height reversal around the identified maximum as in Tibaldi and Molteni (1990). More specifically, the following steps are followed:
-
500 hPa geopotential height anomaly (Z′) is computed by removing the climatological seasonal cycle and long-term variability as in Sausen et al. (1994) and then by imposing a weight proportional to the inverse of the sine of latitude. As such, Z′ represents a quasi-geostrophic stream function anomaly.
-
Closed positive contours of Z′ larger than a minimum amplitude threshold (A) with spatial scale (S) are then identified and tracked in time, ensuring that they meet the overlap criterion in blocking areas (O) for 2 consecutive days.
-
The existence of the reversal of the meridional gradient of the absolute 500 hPa geopotential height, defined as the maximum difference between the two grid points separated by a meridional range (Δϕ), is examined on the equatorial side of the anomaly maximum. The reversal criterion is met if the height gradient is negative at any longitude within a longitudinal range (Δλ).
-
The anomaly is identified as a blocking event if the above three criteria are met during a given period (D).
We have set the arbitrary thresholds to be identical to those used by Dunn-Sigouin et al. (2013): the amplitude threshold A of 1.5 standard deviations of Z′ over 30–90∘ N computed for a period of 3 months centred at a given calendar month; the spatial scale S of 2.5×10⁶ km2; the overlap criterion O of 50 %; the meridional Δϕ and zonal Δλ scales of 15∘ in latitude and 10∘ in longitude, respectively; and the duration period D of 5 d. These choices of criteria are rather restrictive and, as a result, tend to highlight the mature stage of blocking. The usage of these criteria can suppress the erroneous detection of quasi-stationary ridges and immature systems as blocks while capturing omega-shaped blocking well, thereby overcoming the shortcomings of the previously used indices (Dunn-Sigouin et al., 2013).
FLEXPART is a comprehensive offline atmospheric Lagrangian dispersion model, widely used for diverse atmospheric transport applications. FLEXPART computes the particle trajectories under the assumption of zero acceleration as
where t denotes time, Δt the time increment, and X the particle's position vector; is the three-dimensional wind vector consisting of grid-scale winds (), turbulent wind fluctuations (vt), and mesoscale wind fluctuations (vm). Turbulent wind fluctuations are evaluated by solving Langevin equations (Thomson, 1987) in assuming Gaussian turbulence. Mesoscale wind fluctuations, whose spectral interval falls between the resolved winds and the turbulent wind fluctuations, are approximated by solving an independent Langevin equation for the mesoscale wind velocity fluctuations in a similar manner to Maryon (1998).
In addition, in FLEXPART, one can optionally evaluate the effect of moist convective transport that takes place within convective clouds by turning on the moist convection scheme by Emanuel and Živković-Rothman (1999) at the expense of the substantial increase in the computational time (Stohl et al., 2005). This transport is grid-scale in the vertical but subgrid-scale in the horizontal. A recent study by Oertel et al. (2020) has highlighted the importance of convection embedded in WCBs by using a high-resolution model with a 0.02∘ horizontal resolution. Switching on the moist convection scheme in FLEXPART, however, does not qualitatively or quantitatively alter our results, suggesting that the importance of the subgrid-scale horizontal convection is only secondary to the resolved grid-scale convection in the current study with a much coarser resolution (not shown). For this reason, we turn off the moist convection scheme in our analyses.
The FLEXPART code was downloaded from https://www.flexpart.eu/ (FLEXPART, 2019), whereas the CFSR dataset (https://doi.org/10.5065/D69K487J, Saha et al., 2010b) was obtained from the NCAR/UCAR Research Data Archive (RDA).
AY designed the study in discussion with YOK and performed the analysis. All authors contributed to interpreting the results and writing the manuscript.
The authors declare that they have no conflict of interest.
Publisher's note: Copernicus Publications remains neutral with regard to jurisdictional claims in published maps and institutional affiliations.
We would like to thank Etienne Dunn-Sigouin for kindly providing us with the original blocking detection code and Christian M. Grams for helpful comments during the review process. The earlier version of the paper was significantly improved thanks to the insightful comments from Arnaud Czaja and three anonymous reviewers.
This research has been supported by the Japan Society for the Promotion of Science (JSPS) (grant nos. JP19H05701, JP19H05702, JP19H05703, JP19H05704 on Innovative Areas 6102, and JP20H01970), the Japan Science and Technology Agency through Belmont Forum CRA “InterDec” and COI-NEXT (grant no. JPMJPF2013), the Japanese Ministry of Environment through the Environment Research and Technology Development Fund (grant no. JPMEERF20192004), the Japanese Ministry of Education, Culture, Sports, Science and Technology (MEXT) through the Arctic Challenge for Sustainability (ArCS and ARCS II; grant nos. JPMXD1300000000 and JPMXD1420318865) programmes, the Japanese Ministry of Environment through the Environment Research and Technology Development Fund (grant no. 2-1904), the US NSF Climate & Large Scale Dynamics Program (grant no. AGS-2040073), and the US DOE CESD Regional and Gloabal Model Analysis programme (grant no. DE-SC0019492). Patrick Martineau was partly supported by Grant-in-Aid for JSPS Research Fellows.
This paper was edited by Christian M. Grams and reviewed by three anonymous referees.
Ahmadi-Givi, B. F., Graig, G. C., and Plant, R. S.: The dynamics of a midlatitude cyclone with very strong latent-heat release, Q. J. Roy. Meteor. Soc., 130, 295–323, https://doi.org/10.1256/qj.02.226, 2004. a
Barriopedro, D., García-Herrera, R., and Trigo, R. M.: Application of blocking diagnosis methods to General Circulation Models. Part I: A novel detection scheme, Clim. Dynam., 35, 1373–1391, https://doi.org/10.1007/s00382-010-0767-5, 2010. a
Baumgart, M., Riemer, M., Wirth, V., Teubler, F., and Lang, S. T.: Potential vorticity dynamics of forecast errors: A quantitative case study, Mon. Weather Rev., 146, 1405–1425, https://doi.org/10.1175/MWR-D-17-0196.1, 2018. a
Berman, J. D. and Torn, R. D.: The impact of initial condition and warm conveyor belt forecast uncertainty on variability in the downstream waveguide in an ECWMF case study, Mon. Weather Rev., 147, 4071–4089, https://doi.org/10.1175/MWR-D-18-0333.1, 2019. a
Binder, H., Boettcher, M., Joos, H., and Wernli, H.: The role of warm conveyor belts for the intensification of extratropical cyclones in Northern Hemisphere winter, J. Atmos. Sci., 73, 3997–4020, https://doi.org/10.1175/JAS-D-15-0302.1, 2016. a
Booth, J. F., Dunn-Sigouin, E., and Pfahl, S.: The relationship between extratropical cyclone steering and blocking along the North American East Coast, Geophys. Res. Lett., 44, 11976–11984, https://doi.org/10.1002/2017GL075941, 2017. a
Boutle, I. A., Beare, R. J., Belcher, S. E., Brown, A. R., and Plant, R. S.: The moist boundary layer under a mid-latitude weather system, Bound.-Lay. Meteorol., 134, 367–386, https://doi.org/10.1007/s10546-009-9452-9, 2010. a, b, c
Browning, K. A.: The dry intrusion perspective of extra-tropical cyclone development, Meteorol. Appl., 4, 317–324, https://doi.org/10.1017/S1350482797000613, 1997. a
Chen, C., Wang, G., Xie, S.-P., and Liu, W.: Why does global warming weaken the Gulf Stream but intensify the Kuroshio?, J. Climate, 32, 7437–7451, https://doi.org/10.1175/jcli-d-18-0895.1, 2019. a
Croci-Maspoli, M. and Davies, H. C.: Key dynamical features of the 2005/06 European winter, Mon. Weather Rev., 137, 664–678, https://doi.org/10.1175/2008mwr2533.1, 2008. a, b
Davini, P. and D'Andrea, F.: Northern Hemisphere atmospheric blocking representation in global climate models: Twenty years of improvements?, J. Climate, 29, 8823–8840, https://doi.org/10.1175/JCLI-D-16-0242.1, 2016. a, b
Doblas-Reyes, F. J., Casado, M. J., and Pastor, M. A.: Sensitivity of the Northern Hemisphere blocking frequency to the detection index, J. Geophys. Res.-Atmos., 107, 4009, https://doi.org/10.1029/2000jd000290, 2002. a
Dole, R. M. and Gordon, N. D.: Persistent anomalies of the extratropical Northern Hemisphere wintertime circulation: Structure, Mon. Weather Rev., 111, 1567–1586, https://doi.org/10.1175/1520-0493(1986)114<0178:PAOTEN>2.0.CO;2, 1983. a, b, c
Dunn-Sigouin, E., Son, S.-W., and Lin, H.: Evaluation of Northern Hemisphere blocking climatology in the Global Environment Multiscale Model, Mon. Weather Rev., 141, 707–727, https://doi.org/10.1175/MWR-D-12-00134.1, 2013. a, b, c, d, e, f
Emanuel, K. A. and Živković-Rothman, M.: Development and evaluation of a convection scheme for use in climate models, J. Atmos. Sci., 56, 1766–1782, https://doi.org/10.1175/1520-0469(1999)056<1766:DAEOAC>2.0.CO;2, 1999. a
FLEXPART: The official FLEXPART web site, available at: https://www.flexpart.eu/, last access: 20 March 2019. a
Grams, C. M., Wernli, H., Böttcher, M., Čampa, J., Corsmeier, U., Jones, S. C., Keller, J. H., Lenz, C. J., and Wiegand, L.: The key role of diabatic processes in modifying the upper-tropospheric wave guide: A North Atlantic case-study, Q. J. Roy. Meteor. Soc., 137, 2174–2193, https://doi.org/10.1002/qj.891, 2011. a, b
Grams, C. M., Magnusson, L., and Madonna, E.: An atmospheric dynamics perspective on the amplification and propagation of forecast error in numerical weather prediction models: A case study, Q. J. Roy. Meteor. Soc., 144, 2577–2591, https://doi.org/10.1002/qj.3353, 2018. a
Häkkinen, S., Rhines, P. B., and Worthen, D. L.: Atmospheric blocking and Atlantic multidecadal ocean variability, Science, 334, 655–659, https://doi.org/10.1126/science.1205683, 2011. a
Hoskins, B. J.: Towards a PV-theta view of the general circulation, Tellus A, 43, 27–35, https://doi.org/10.1034/j.1600-0870.1991.t01-3-00005.x, 1991. a
Joyce, T. M., Kwon, Y.-O., Seo, H., and Ummenhofer, C. C.: Meridional Gulf Stream shifts can influence wintertime variability in the North Atlantic storm track and Greenland blocking, Geophys. Res. Lett., 46, 1702–1708, https://doi.org/10.1029/2018GL081087, 2019. a, b, c
Kwon, Y. O. and Joyce, T. M.: Northern hemisphere winter atmospheric transient eddy heat fluxes and the gulf stream and Kuroshio-Oyashio extension variability, J. Climate, 26, 9839–9859, https://doi.org/10.1175/JCLI-D-12-00647.1, 2013. a
Kwon, Y.-O., Alexander, M. A., Bond, N. A., Frankignoul, C., Nakamura, H., Qiu, B., and Thompson, L.: Role of the Gulf Stream and Kuroshio-Oyashio systems in large-scale atmosphere-ocean interaction: A review, J. Climate, 23, 3249–3281, https://doi.org/10.1175/2010JCLI3343.1, 2010. a, b
Kwon, Y.-O., Seo, H., Ummenhofer, C. C., and Joyce, T. M.: Impact of multidecadal variability in Atlantic SST on winter atmospheric blocking, J. Climate, 33, 867–892, https://doi.org/10.1175/JCLI-D-19-0324.1, 2020. a, b
Maddison, J. W., Gray, S. L., Martínez-Alvarado, O., and Williams, K. D.: Upstream cyclone influence on the predictability of block onsets over the Euro-Atlantic region, Mon. Weather Rev., 147, 1277–1296, https://doi.org/10.1175/MWR-D-18-0226.1, 2019. a
Madonna, E., Wernli, H., Joos, H., and Martius, O.: Warm conveyor belts in the ERA-Interim Dataset (1979–2010). Part I: Climatology and potential vorticity evolution, J. Climate, 27, 3–26, https://doi.org/10.1175/JCLI-D-12-00720.1, 2014. a, b, c, d, e
Maryon, R. H.: Determining cross-wind variance for low frequency wind meander, Atmos. Environ., 32, 115–121, 1998. a
Masato, G., Hoskins, B. J., and Woollings, T. J.: Wave-breaking characteristics of midlatitude blocking, Q. J. Roy. Meteor. Soc., 138, 1285–1296, https://doi.org/10.1002/qj.990, 2012. a
McCarthy, G. D., Joyce, T. M., and Josey, S. A.: Gulf Stream variability in the context of quasi-decadal and multi-decadal Atlantic climate variability, Geophys. Res. Lett., 45, 11257–11264, https://doi.org/10.1029/2018GL079336, 2018. a
Methven, J.: Potential vorticity in warm conveyor belt outflow, Q. J. Roy. Meteor. Soc., 141, 1065–1071, https://doi.org/10.1002/qj.2393, 2015. a, b
Nakamura, H.: Rotational evolution of potential vorticity associated with a strong blocking flow configuration over Europe, Geophys. Res. Lett., 21, 2003–2006, https://doi.org/10.1029/94GL01614, 1994. a
Nakamura, H. and Fukamachi, T.: Evolution and dynamics of summertime blocking over the Far East and the associated surface Okhotsk high, Q. J. Roy. Meteor. Soc., 130, 1213–1233, https://doi.org/10.1256/qj.03.101, 2004. a
Nakamura, H., Nakamura, M., and Anderson, J. L.: The role of high- and low-frequency dynamics in blocking formation, Mon. Weather Rev., 125, 2074–2093, https://doi.org/10.1175/1520-0493(1997)125<2074:trohal>2.0.co;2, 1997. a, b
Nakamura, H., Sampe, T., Tanimoto, Y., and Shimpo, A.: Observed associations among storm tracks, jet streams and midlatitude oceanic fronts, in: Earth's Climate: The Ocean-Atmosphere Interaction, edited by: Wang, C., Xie, S.-P., and Carton, J. A., American Geophysical Union, Washington, D.C., USA, 329–346, https://doi.org/10.1029/147GM18, 2004. a
Newman, M., Kiladis, G. N., Weickmann, K. M., Ralph, M. F., and Sardeshmukh, P. D.: Relative contributions of synoptic and low-frequency eddies to time-mean atmospheric moisture transport, including the role of atmospheric rivers, J. Climate, 25, 7341–7361, https://doi.org/10.1175/JCLI-D-11-00665.1, 2012. a
Novak, L., Ambaum, M. H., and Tailleux, R.: The life cycle of the North Atlantic storm track, J. Atmos. Sci., 72, 821–833, https://doi.org/10.1175/JAS-D-14-0082.1, 2015. a
Oertel, A., Boettcher, M., Joos, H., Sprenger, M., and Wernli, H.: Potential vorticity structure of embedded convection in a warm conveyor belt and its relevance for large-scale dynamics, Weather Clim. Dynam., 1, 127–153, https://doi.org/10.5194/wcd-1-127-2020, 2020. a
O'Reilly, C. H. and Czaja, A.: The response of the pacific storm track and atmospheric circulation to kuroshio extension variability, Q. J. Roy. Meteor. Soc., 141, 52–66, https://doi.org/10.1002/qj.2334, 2015. a, b
O'Reilly, C. H., Minobe, S., and Kuwano-Yoshida, A.: The influence of the Gulf Stream on wintertime European blocking, Clim. Dynam., 47, 1545–1567, https://doi.org/10.1007/s00382-015-2919-0, 2016. a
Pelly, J. L. and Hoskins, B. J.: A new perspective on blocking, J. Atmos. Sci., 60, 743–755, https://doi.org/10.1175/1520-0469(2003)060<0743:ANPOB>2.0.CO;2, 2003. a, b
Pfahl, S., Madonna, E., Boettcher, M., Joos, H., and Wernli, H.: Warm conveyor belts in the ERA-Interim Dataset (1979–2010). Part II: Moisture origin and relevance for precipitation, J. Climate, 27, 27–40, https://doi.org/10.1175/JCLI-D-13-00223.1, 2014. a
Pfahl, S., Schwierz, C., Grams, C. M., Wernli, H., Croci-Maspoli, M., Grams, C. M., and Wernli, H.: Importance of latent heat release in ascending air streams for atmospheric blocking, Nat. Geosci., 8, 610–615, https://doi.org/10.1038/NGEO2487, 2015. a, b, c, d, e, f, g, h, i, j, k
Qiu, B. and Chen, S.: Eddy-induced heat transport in the subtropical North Pacific from Argo, TMI, and altimetry measurements, J. Phys. Oceanogr., 35, 458–473, https://doi.org/10.1175/JPO2696.1, 2005. a
Raveh-Rubin, S.: Dry intrusions: Lagrangian climatology and dynamical impact on the planetary boundary layer, J. Climate, 30, 6661–6682, https://doi.org/10.1175/JCLI-D-16-0782.1, 2017. a
Rex, D. F.: Blocking action in the middle troposphere and its effect upon regional climate, Tellus, 2, 275–301, https://doi.org/10.3402/tellusa.v2i4.8603, 1950. a
Saha, S., Moorthi, S., Pan, H.-L., Wu, X., Wang, J., Nadiga, S., Tripp, P., Kistler, R., Woollen, J., Behringer, D., Liu, H., Stokes, D., Grumbine, R., Gayno, G., Wang, J., Hou, Y.-T., Chuang, H.-Y., Juang, H.-M. H., Sela, J., Iredell, M., Treadon, R., Kleist, D., Van Delst, P., Keyser, D., Derber, J., Ek, M., Meng, J., Wei, H., Yang, R., Lord, S., van den Dool, H., Kumar, A., Wang, W., Long, C., Chelliah, M., Xue, Y., Huang, B., Schemm, J.-K., Ebisuzaki, W., Lin, R., Xie, P., Chen, M., Zhou, S., Higgins, W., Zou, C.-Z., Liu, Q., Chen, Y., Han, Y., Cucurull, L., Reynolds, R. W., Rutledge, G., and Goldberg, M.: The NCEP Climate Forecast System Reanalysis, B. Am. Meteorol. Soc., 91, 1015–1057, https://doi.org/10.1175/2010BAMS3001.1, 2010a. a
Saha, S., Moorthi, S., Pan, H., Wu, X., Wang, J., Nadiga, S., Tripp, P., Kistler, R., Woollen, J., Behringer, D., Liu, H., Stokes, D., Grumbine, R., Gayno, G., Wang, J., Hou, Y., Chuang, H., Juang, H. H., Sela, J., Iredell, M., Treadon, R., Kleist, D., Delst, P. V., Keyser, D., Derber, J., Ek, M., Meng, J., Wei, H., Yang, R., Lord, S., van den Dool, H., Kumar, A., Wang, W., Long, C., Chelliah, M., Xue, Y., Huang, B., Schemm, J., Ebisuzaki, W., Lin, R., Xie, P., Chen, M., Zhou, S., Higgins, W., Zou, C., Liu, Q., Chen, Y., Han, Y., Cucurull, L., Reynolds, R. W., Rutledge, G., and Goldberg, M.: NCEP Climate Forecast System Reanalysis (CFSR) Selected Hourly Time-Series Products, January 1979 to December 2010, Research Data Archive at the National Center for Atmospheric Research, Computational and Information Systems Laboratory [data set], https://doi.org/10.5065/D6513W89, 2010b. a
Sausen, R., König, W., and Sielmann, F.: Analysis of blocking events from observations and ECHAM model simulations, Tellus A, 47, 421–438, https://doi.org/10.3402/tellusa.v47i4.11526, 1994. a
Scaife, A. A., Copsey, D., Gordon, C., Harris, C., Hinton, T., Keeley, S., O'Neill, A., Roberts, M., and Williams, K.: Improved Atlantic winter blocking in a climate model, Geophys. Res. Lett., 38, L23703, https://doi.org/10.1029/2011GL049573, 2011. a
Scherrer, S. C., Croci-Maspoli, M., Schwierz, C., and Appenzeller, C.: Two-dimensional indices of atmospheric blocking and their statistical relationship with winter climate patterns in the Euro-Atlantic region, Int. J. Climatol., 26, 233–249, https://doi.org/10.1002/joc.1250, 2006. a, b
Schwierz, C., Croci-Maspoli, M., and Davies, H. C.: Perspicacious indicators of atmospheric blocking, Geophys. Res. Lett., 31, L06125, https://doi.org/10.1029/2003gl019341, 2004. a, b
Sheldon, L., Czaja, A., Vannière, B., Morcrette, C., Sohet, B., Casado, M., and Smith, D.: A `warm path' for Gulf Stream-troposphere interactions, Tellus A, 69, 1–15, https://doi.org/10.1080/16000870.2017.1299397, 2017. a
Shutts, G. J.: The propagation of eddies in diffluent jetstreams: Eddy vorticity forcing of “blocking” flow fields, Q. J. Roy. Meteor. Soc., 109, 737–761, https://doi.org/10.1002/qj.49710946204, 1983. a
Sodemann, H., Schwierz, C., and Wernli, H.: Interannual variability of Greenland winter precipitation sources: Lagrangian moisture diagnostic and North Atlantic Oscillation influence, J. Geophys. Res.-Atmos., 113, 1–17, https://doi.org/10.1029/2007JD008503, 2008. a
Steinfeld, D. and Pfahl, S.: The role of latent heating in atmospheric blocking dynamics: a global climatology, Clim. Dynam., 53, 6159–6180, https://doi.org/10.1007/s00382-019-04919-6, 2019. a, b, c, d, e, f, g, h, i, j, k, l, m, n
Stohl, A., Forster, C., Frank, A., Seibert, P., and Wotawa, G.: Technical note: The Lagrangian particle dispersion model FLEXPART version 6.2, Atmos. Chem. Phys., 5, 2461–2474, https://doi.org/10.5194/acp-5-2461-2005, 2005. a, b, c
Thomson, D. J.: Criteria for the selection of stochastic models of particle trajectories in turbulent flows, J. Fluid Mech., 180, 529–556, https://doi.org/10.1017/S0022112087001940, 1987. a
Tibaldi, S. and Molteni, F.: On the operational predictability of blocking, Tellus A, 42, 343–365, https://doi.org/10.1034/j.1600-0870.1990.t01-2-00003.x, 1990. a, b
Wernli, H. and Davies, H. C.: A Lagrangian-based analysis of extratropical cyclones. I: The method and some applications, Q. J. Roy. Meteor. Soc., 123, 467–489, https://doi.org/10.1256/smsqj.53810, 1997. a
Woollings, T., Barriopedro, D., Methven, J., Son, S. W., Martius, O., Harvey, B., Sillmann, J., Lupo, A. R., and Seneviratne, S.: Blocking and its response to climate change, Current Climate Change Reports, 4, 287–300, https://doi.org/10.1007/s40641-018-0108-z, 2018. a, b, c, d
Yamamoto, A. and Palter, J. B.: The absence of an Atlantic imprint on the multidecadal variability of wintertime European temperature, Nat. Commun., 7, 10930, https://doi.org/10.1038/ncomms10930, 2016. a
Yamamoto, A., Palter, J. B., Lozier, M. S., Bourqui, M. S., and Leadbetter, S. J.: Ocean versus atmosphere control on western European wintertime temperature variability, Clim. Dynam., 45, 3593–3607, https://doi.org/10.1007/s00382-015-2558-5, 2015. a, b
Yamazaki, A. and Itoh, H.: Vortex–Vortex Interactions for the Maintenance of Blocking. Part I: The Selective Absorption Mechanism and a Case Study, J. Atmos. Sci., 70, 725–742, https://doi.org/10.1175/JAS-D-11-0295.1, 2013a. a, b, c, d, e
Yamazaki, A. and Itoh, H.: Vortex-vortex interactions for the maintenance of blocking. Part II: Numerical experiments, J. Atmos. Sci., 70, 743–766, https://doi.org/10.1175/JAS-D-12-0132.1, 2013b. a, b
- Abstract
- Introduction
- Dataset and methods
- Distinct characteristics of moist and dry particles
- Moisture sources for moist particles
- Discussion and conclusions
- Appendix A: A hybrid blocking index
- Appendix B: Atmospheric dispersion model FLEXPART
- Code and data availability
- Author contributions
- Competing interests
- Disclaimer
- Acknowledgements
- Financial support
- Review statement
- References