the Creative Commons Attribution 4.0 License.
the Creative Commons Attribution 4.0 License.
 | 23 Aug 2022
Dynamics of gap winds in the Great Rift Valley, Ethiopia: emphasis on strong winds at Lake Abaya
Cornelius Immanuel Weiß
Alexander Gohm
Mathias Walter Rotach
Thomas Torora Minda
Lake Abaya, located in the Great Rift Valley (GRV) in Ethiopia, is affected by regularly occurring strong winds that cause water waves, which in turn affect the lake's ecology and food web. The driving forces for these winds, however, are yet unexplained. Hence, the main goal of this study is to provide a physical explanation for the formation of these strong winds in the GRV and especially at Lake Abaya. To this aim, two case studies were performed based on measurements, ERA5 reanalysis data and mesoscale numerical simulations conducted with the Weather Research and Forecasting (WRF) model. The simulations revealed that in both cases a gap flow downstream of the narrowest and highest part of the GRV (i.e. the pass) led to high wind speeds of up to 25 m s−1. Two types of gap flow were identified: a north-eastern gap flow and a south-western gap flow. The wind directions are in line with the orientation of the valley axis and depend on the air mass distribution north and south of the valley and the resulting along-valley pressure gradient. The air mass distribution was determined by the position of the Intertropical Convergence Zone relative to the GRV. The colder air mass was upstream of the GRV in both case studies. During the day, the convective boundary layer in the warmer air mass on the downstream side heated up more strongly and quickly than in the colder air mass. The most suitable variable describing the timing of the gap flow was found to be the pressure gradient at pass height, which corresponds roughly to the 800 hPa pressure level. In both cases the gap flow exhibited a strong daily cycle, which illustrates the importance of the thermal forcing due to differential heating over complex terrain in addition to the large-scale forcing due to air mass differences. The start, strength, and the duration of the gap winds within the valley depended on location. For both cases, the strongest winds occurred after sunset and in the ongoing night downstream of the gap and on the corresponding lee slope. The ERA5 reanalysis captures both events qualitatively well but with weaker wind speeds than in the mesoscale numerical simulations. Hence, ERA5 is suitable for a future climatological analysis of these gap flows.
- Article
(13659 KB) - Full-text XML
- BibTeX
- EndNote


Local scientists1 observed several cases of comparatively strong winds at Lake Abaya that induce surface waves on the lake and hence affect the lake's ecology. Different wind directions were observed among different cases. According to local fishermen, Galana winds blow from the east, Dega winds from the west, Gidabo winds (also Sidamo winds from the north-eastern, and Chamo winds from the south-west, respectively. The first two wind directions are perpendicular, and the latter two are in line with the valley orientation of the Great Rift Valley (GRV) in Ethiopia (also referred to as Ethiopian Rift Valley or Eastern Rift Valley). Gidabo winds were reported to be the strongest and to occur during nighttime and in the early morning. The physical mechanisms for these strong winds on Lake Abaya, however, are unknown so far.
Lake Abaya is located in the south-west of Ethiopia (6∘5′ N, 37∘41′ E) and is the largest of eight lakes in the GRV (Fig. 1a–c). The lake surface is situated at an altitude of 1175 m above mean sea level (a.m.s.l.) and is roughly 70 km long and 5 to 25 km wide. The average depth is 8.6 m (Teffera et al., 2017). Its elongated shape is in line with the valley orientation from north-east to south-west. East and west of the lake, topography rises to more than 3000 m a.m.s.l. within 30 km. From the northern shoreline, the valley floor rises monotonously towards a pass at around 2000 m a.m.s.l. near the city of Hawassa (close to PA in Fig. 1b). North of the pass the height of the valley floor remains unchanged for roughly 150 km before it declines and widens into the Afar Triangle in north-eastern Ethiopia. Approximately 5 km south of Lake Abaya follows Lake Chamo (Fig. 1c). These two lakes are separated by a shallow ridge called Yegzier Dildiyi (meaning God's Bridge) with an elevation of 400 m above ground level (a.g.l.). The southern end of the GRV in Ethiopia is determined by the Turkana Channel at the border to Kenya.
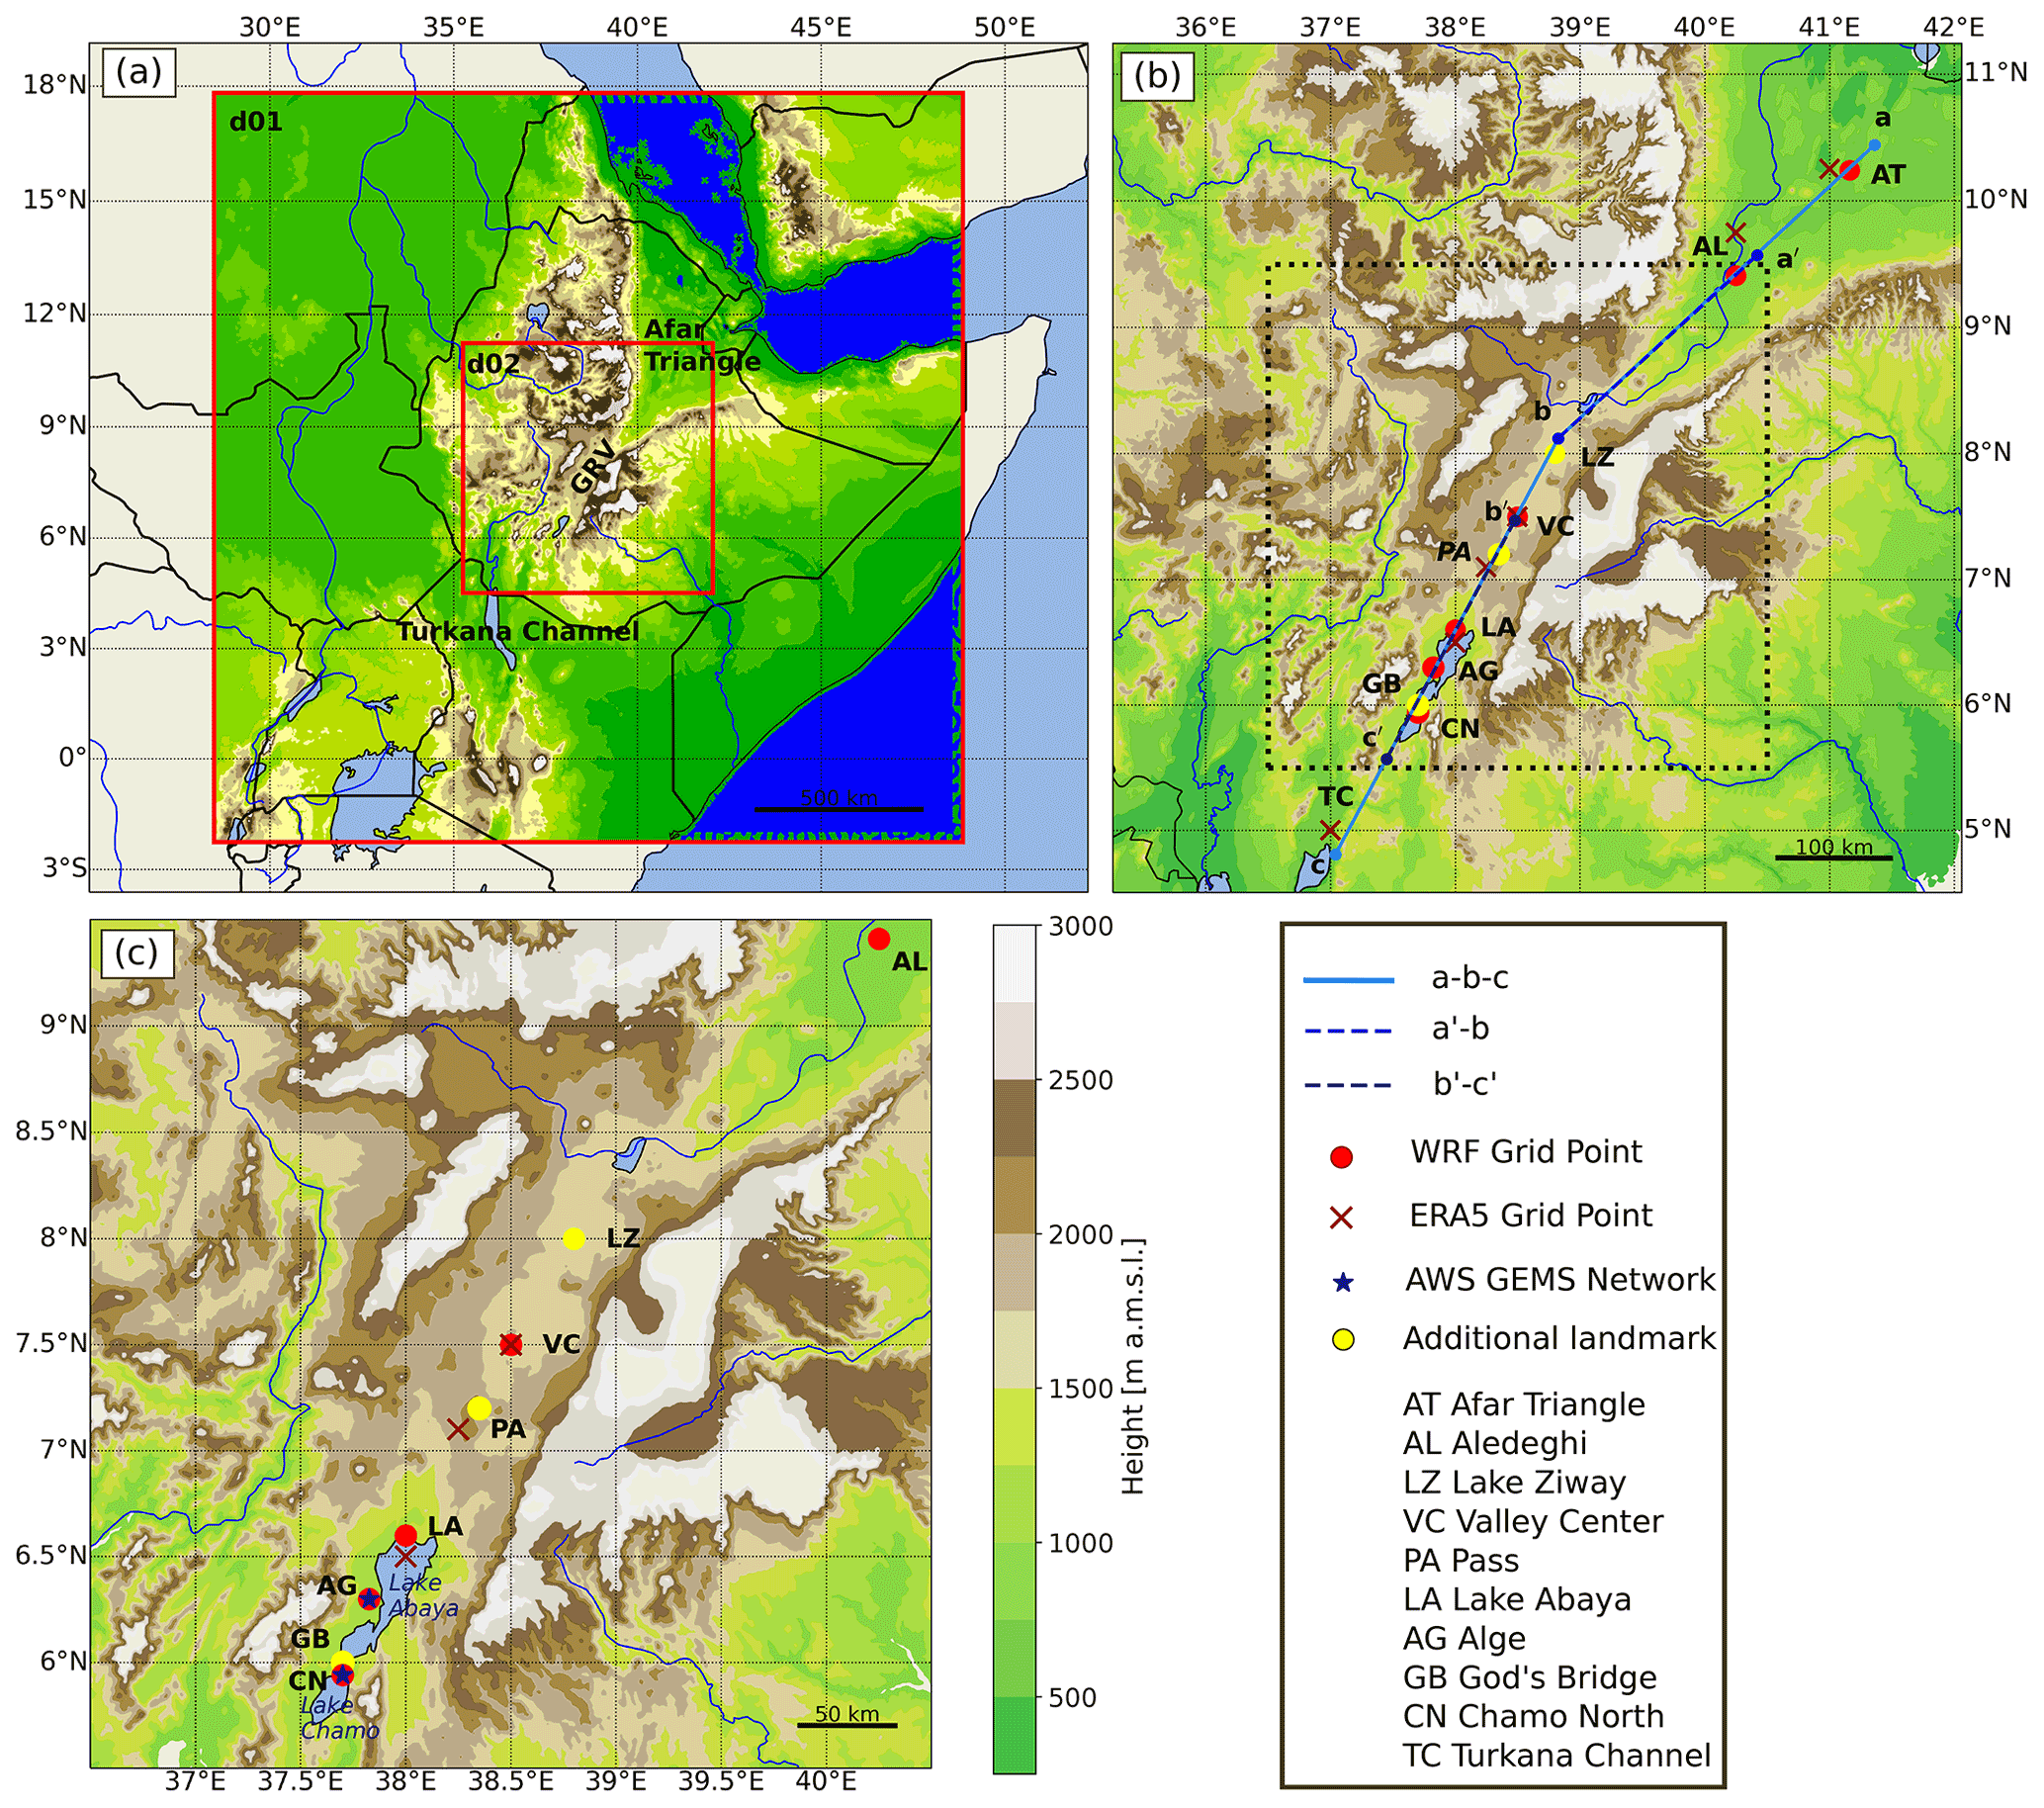
Figure 1(a) Topographic map of East Africa with the two nested Weather Research and Forecasting (WRF) model domains d01 and d02 indicated by the red boxes. The area contains the Afar Triangle, the Turkana Channel, and the Great Rift Valley (GRV) in between. (b) Topographic map of d02 and the GRV. Along-valley cross-sections marked in blue (a–b–c, a′–b, and b′–c′). Several grid points of the WRF model (red circles) and the ERA5 reanalysis (dark-red crosses) used in the investigations are indicated by markers and two-letter labels (see legend). (c) Topographic map of the target area around Lake Abaya and Lake Chamo. This subdomain is also indicated by a dashed black box in (b). Blue stars indicate the location of automatic weather stations of the Gamo Ethiopian Meteorological Stations (GEMS) network. Yellow circles mark additional landmarks.
Lake Abaya plays a key role in the local socio-ecological system and has a high biological diversity (Zinabu et al., 2002). The lake serves as a fishery as well as water supply for the local human population, wildlife, and agriculture (e.g. banana cultivation). Four decades ago, the ecology started to change. Due to massive deforestation and fertilization in the catchment of Lake Abaya, an immense input of sediments and nutrient runoff is present (Teffera, 2016; Zekarias et al., 2021). This causes not only a severe eutrophication of the lake but also a high turbidity (Teffera et al., 2017; Lemmens et al., 2017). Higher turbidity impedes insolation that is necessary for primary production of phyto- and zooplankton (Lemmens et al., 2017). Hence, the food web of Lake Abaya is threatened and has to adapt. Furthermore, Lake Abaya as a freshwater lake is subject to the growth of water hyacinth (Mengistu et al., 2017). This buoyant plant covers the lake surface. Therefore, the weak solar penetration into the lake is even further mitigated. Due to its large surface, Lake Abaya is prone to generating waves as a result of wind stress. This has two effects on the lake ecology. On the one hand, wind-induced sediment resuspension keeps turbidity near the surface high (Scheffer, 2004; Gebremariam, 2009). On the other hand, strong waves have the ability to destroy the colonies of water hyacinth and other plants on the lake surface and thereby increase the penetration of shortwave radiation. Disrupted water hyacinths have been observed and linked to the occurrence of strong winds and waves (Thomas Torora Minda and Fassil Teffera, personal communication, 2020). The waves could be the reason why Lake Abaya is less affected by invasive plants than other lakes in the Ethiopian GRV.
The synoptic wind field in tropical areas is generally influenced by the displacement of the Intertropical Convergence Zone (ITCZ) (Korecha and Sorteberg, 2013; Gleixner et al., 2017). This low-pressure belt is the key synoptic feature which determines the weather in Ethiopia (Minda, 2019). The ITCZ reaches its northernmost position over Africa at around 15∘ N in June and its extreme southward position at 15∘ S in January (Diro et al., 2007; Sjoukje et al., 2018). Hence, the general direction of the surface winds is determined by the associated trade winds underneath the trade wind inversion, which is at around 2000 m a.m.s.l. according to Cao et al. (2007) and Carrillo et al. (2016). The prevailing wind direction is from the north-east around January and from the south-east around June (Minda et al., 2018a). Due to the biannual passage of the ITCZ, the synoptic wind direction in Ethiopia oscillates between south and north by turning over east.
The position of the ITCZ is not the only factor that determines the wind field in East Africa. Ethiopia is a country rich in lakes and complex topography. Hence, lake- and terrain-induced mesoscale winds may dominate the local flow near the surface, as found by Haile et al. (2009) for the Lake Tana basin, the largest lake in Ethiopia. These mesoscale winds strongly vary on the daily and seasonal scale (Minda et al., 2018a).
For the particular region of interest at Lake Abaya, detailed studies concerning the local wind field are rare. Gebremariam (2009) found the observed lake and land breeze in February (the beginning of belg season) to be the dominant wind feature, which strongly deviates from the synoptic flow (ITCZ south of the Equator). Minda (2019) stated that the temperature contrast between day and night during this time of the year is large, supporting the development of mesoscale thermally driven flows like the lake and land breeze but also valley winds. Nevertheless, Gebremariam (2009) found that in some months the local winds around Lake Abaya blow in the same direction as the synoptic flow. Hence, forced channelling of the large-scale flow may influence or even determine the local flow (e.g. Kossmann and Sturman, 2003). According to Gebremariam (2009) the impact of the synoptic flow is strongest in May and June (end of belg and beginning of kirmet season), when the temperature contrast between day and night is weakest. In addition to the lake and land breeze, Minda et al. (2018a) observed anabatic and katabatic winds at the slopes of the valley.
In conclusion, strong winds at Lake Abaya have a major impact on the lake's wave dynamics and internal mixing and hence on food production, and thus they play an important role in the everyday life of the local community. It is the aim of this study to better understand these winds for eco-meteorological benefits. Since, to the best of our knowledge, there is not a single study dealing with the topic of strong wind events in the GRV, the more specific goals of this study are to investigate the physical mechanisms of the two cases and their daytime and seasonal dependency. The paper is organized as follows. Section 2 presents the data and methods used for the investigation. The synoptic conditions of the two cases are shortly summarized in Sect. 3, followed by a detailed description of the two events in Sects. 4 and 5. The results are discussed in Sect. 6, and conclusions are drawn in Sect. 7.
2.1 Observations
Observations from the Gamo Ethiopian Meteorological Stations (GEMS) network (Minda et al., 2018b), a local network of automatic weather stations (AWSs) in the area around Lake Abaya, were used to identify strong wind events at Lake Abaya. The locations of the considered AWSs are marked in Fig. 1c. The detailed procedure of the analysis, as well as a list of 20 cases with strong winds at Lake Abaya, is given in Weiß (2021). Out of these 20 strong wind events, two representative cases were selected and investigated in this study.
2.2 ERA5 reanalysis
In addition to the measurements, the fifth generation of reanalysis data provided by the European Centre for Medium-Range Weather Forecasts (ECMWF), the ERA5 data set, was used (Hersbach et al., 2020). The ERA5 data depict the synoptic and mesoscale conditions as well as the vertical structure of the atmosphere prior to and during strong wind events at Lake Abaya. The hourly ERA5 data available from the Copernicus Climate Data Store have a horizontal mesh size of , which corresponds to roughly 28 km. Data on 37 pressure levels between 1000 and 1 hPa were used, which seemed sufficient for this work. Moreover, the ERA-Land subset was used, which is a surface data set, forced by the ERA5 atmospheric parameters. The hourly ERA-Land data have a horizontal mesh size of , which corresponds to roughly 9 km.
Since topography is smoothed in global models like the ERA5 reanalysis data, valleys and mountains are only poorly resolved, if at all. The ERA5 topography captures large-scale terrain features like the Ethiopian Highlands as a whole, the Afar Triangle at the north-eastern end of the GRV, or the Turkana Channel at the south-western end of the GRV. The GRV with Lake Abaya is represented as well. However, the width of the valley near Lake Abaya is only about 50 to 100 km from crest line to crest line (see Fig. 1c) and hence only covered by a few ERA5 grid points. Therefore, the area around Lake Abaya is only poorly resolved in the ERA5 model topography, which near Lake Abaya is between 100 and 500 m higher than reality. The ERA5 grid point representing Lake Abaya best is at 6.5∘ N, 38.0∘ E, with an elevation of 1317 m a.m.s.l., which is 142 m higher than the real elevation of the lake surface of 1175 m a.m.s.l. This grid point (LA), amongst others selected and used in the case studies, is marked in Fig. 1b–c.
2.3 WRF model
The Weather Research and Forecasting (WRF) model, specifically the Advanced Research WRF (ARW) version 4.1 (Skamarock et al., 2019), was used to conduct a numerical simulation for each of the two cases. The aim of using WRF was to resolve the flow in the valley better in space and time than the ERA5. Therefore, the simulation strategy involved two one-way, online nested domains (Fig. 1a). The coarse domain (d01) included large parts of East Africa and had a horizontal grid spacing of Δx=3 km with 750×750 grid points. To minimize the impact of spurious noise at the lateral boundaries of d01 on the nested domain d02, d01 had a 3-times-larger geographical extent and served mainly as an intermediate step to produce boundary conditions for the inner domain (d02). This inner domain covered Ethiopia and particularly the main target area of the GRV with Lake Abaya as well as parts of the Afar Triangle and of the Turkana Channel, respectively (Fig. 1b). It had a horizontal mesh size of Δx=1 km and again 750×750 grid points. The integration time step was 12 s in d01 and 4 s in d02.
A hybrid sigma-pressure coordinate (Park et al., 2019) was used with 80 vertical mass levels in both domains. The top of the model domain was located at 20 hPa, which corresponds to about 26 km. The lowest level was approximately 20 m a.g.l. Close to the ground the vertical level spacing was Δz=20 m, which was stretched with increasing height to a maximum of 400 m. A damping layer after Klemp et al. (2008) was included to prevent wave reflection of vertically propagating gravity waves. This layer acted in the uppermost 10 km. For numerically stable simulations, it was crucial to cover the whole troposphere, which reaches up to about 16 km in tropical regions. Hence, the damping layer acted only in the stratosphere.
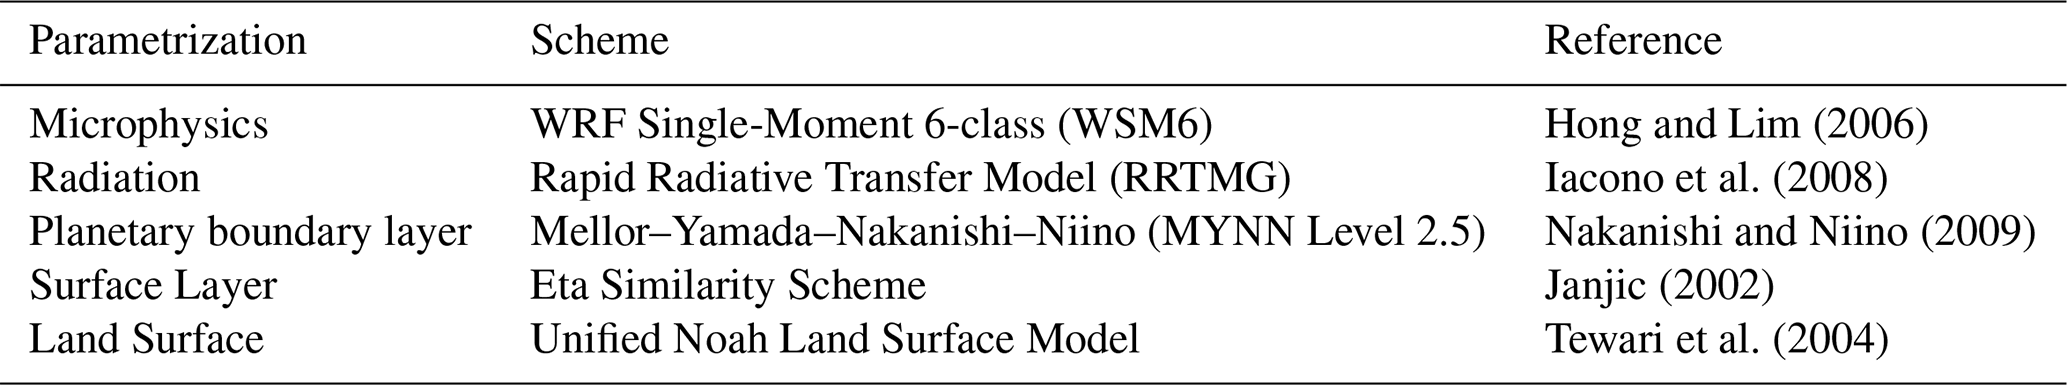
WRF offers a variety of physical parametrizations. The set-up for both domains is summarized in Table 1. In terms of convection, Yu and Lee (2010) found an upper bound for a convection-permitting grid spacing of 3 km, which is equal to the mesh size of domain d01. Hence, no cumulus parametrization was used in both model domains. In terms of land cover, the Moderate Resolution Imaging Spectroradiometer (MODIS) 30 s (≈1 km) land use data set with an inland water body class was used. The WRF default topographical data set, provided by the United States Geological Survey (USGS), with a resolution of 1 km, was taken for both domains.
Hong and Lim (2006)Iacono et al. (2008)Nakanishi and Niino (2009)Janjic (2002)Tewari et al. (2004)Table 1Summary of physical parameterizations used in both domains.
As initial and boundary conditions for d01 the operational high-resolution analysis (HRES) of the Integrated Forecasting System (IFS) of the ECMWF was applied. The HRES data set has a grid spacing of and is available for every 6 h.
In terms of lake surface temperatures, the alternative initialization procedure provided by WRF was used, where the daily averaged surface temperature was assigned as lake temperature to the grid points classified as inland water bodies. A comparison of the resulting lake temperatures to the Copernicus lake temperature data set, observed with satellites, revealed deviations of 1–2 K for different lakes in the domain.
This section illustrates the large-scale conditions prior to the two selected cases of strong winds in the GRV. The first case took place in the night from 14 to 15 January 2020 and was associated with winds from the north-east at Lake Abaya. The ITCZ was located south of Ethiopia. In the days before the event, the associated north and north-easterly trade winds advected cold air towards the Afar Triangle, which is located at the north-eastern end of the GRV (cf. Fig. 1a). This cold air advection was restricted below 800 hPa and blocked by the Ethiopian Highlands (Fig. 2a). Therefore, the depth of the colder air increased in the days before the event. In the Turkana Channel and the region around Lake Abaya, i.e. at the south-western end of the GRV, potentially warmer air was present. These different air masses led to an along-valley pressure gradient, which is depicted in Fig. 2a by the isolines of geopotential height Z at the 800 hPa surface, which roughly corresponds to the height of the pass near the city of Hawassa (cf. PA in Fig. 1b). The pressure gradient provided the basis to channel the potentially colder air (higher pressure) from the Afar Triangle through the GRV towards the warmer air (lower pressure) around Lake Abaya and the Turkana Channel. Hence, the strong north-easterly winds at Lake Abaya were associated with a gap flow through the GRV.
The second case took place on 5 June 2018 and was accompanied by strong winds from the south and south-west at Lake Abaya. The ITCZ was aligned along the northern edge of the Ethiopian Highlands. The Afar Triangle was therefore on the northern side of the ITCZ, while the Turkana Channel was located south. Again, this led to differential air mass advection in the lower troposphere. Potentially warmer air from north-eastern Africa was advected towards the Afar Triangle, whereas the Turkana Jet (Nicholson, 2016; Munday et al., 2022) brought potentially colder air into the Turkana Channel and the region around Lake Abaya (Fig. 2b). This air originated from the southern Indian Ocean and was deflected by the massive Mt. Kenya towards the north-east, resulting in the south-westerly winds in Fig. 2b. Below 800 hPa, a branch of this south-westerly airstream was deflected by the Turkana Jet into the Turkana Channel (not shown). The different air masses north and south of the GRV established an along-valley pressure gradient, illustrated in Fig. 2b. Hence, the synoptic forcing in terms of the along-valley pressure gradient was in the opposite direction than in the first event but also caused a gap flow along the GRV. These south-westerly gap winds allowed potentially colder air in the Turkana Channel to advance towards the lower pressure north of the valley. However, this pressure-driven channelling (Kossmann and Sturman, 2003) by the along-valley pressure gradient due to the temperature contrast was not the only large-scale factor determining the local flow in the GRV. In addition, forced channelling (Kossmann and Sturman, 2003) due to inflow at both valley entrances (cf. Fig. 2b) may have enhanced (weakened) the flow on the upstream (downstream) side of the gap. Notice that the large-scale winds at low latitudes are generally not in geostrophic balance and hence do not blow parallel to the isohypses on pressure levels (see Fig. 2a, b).
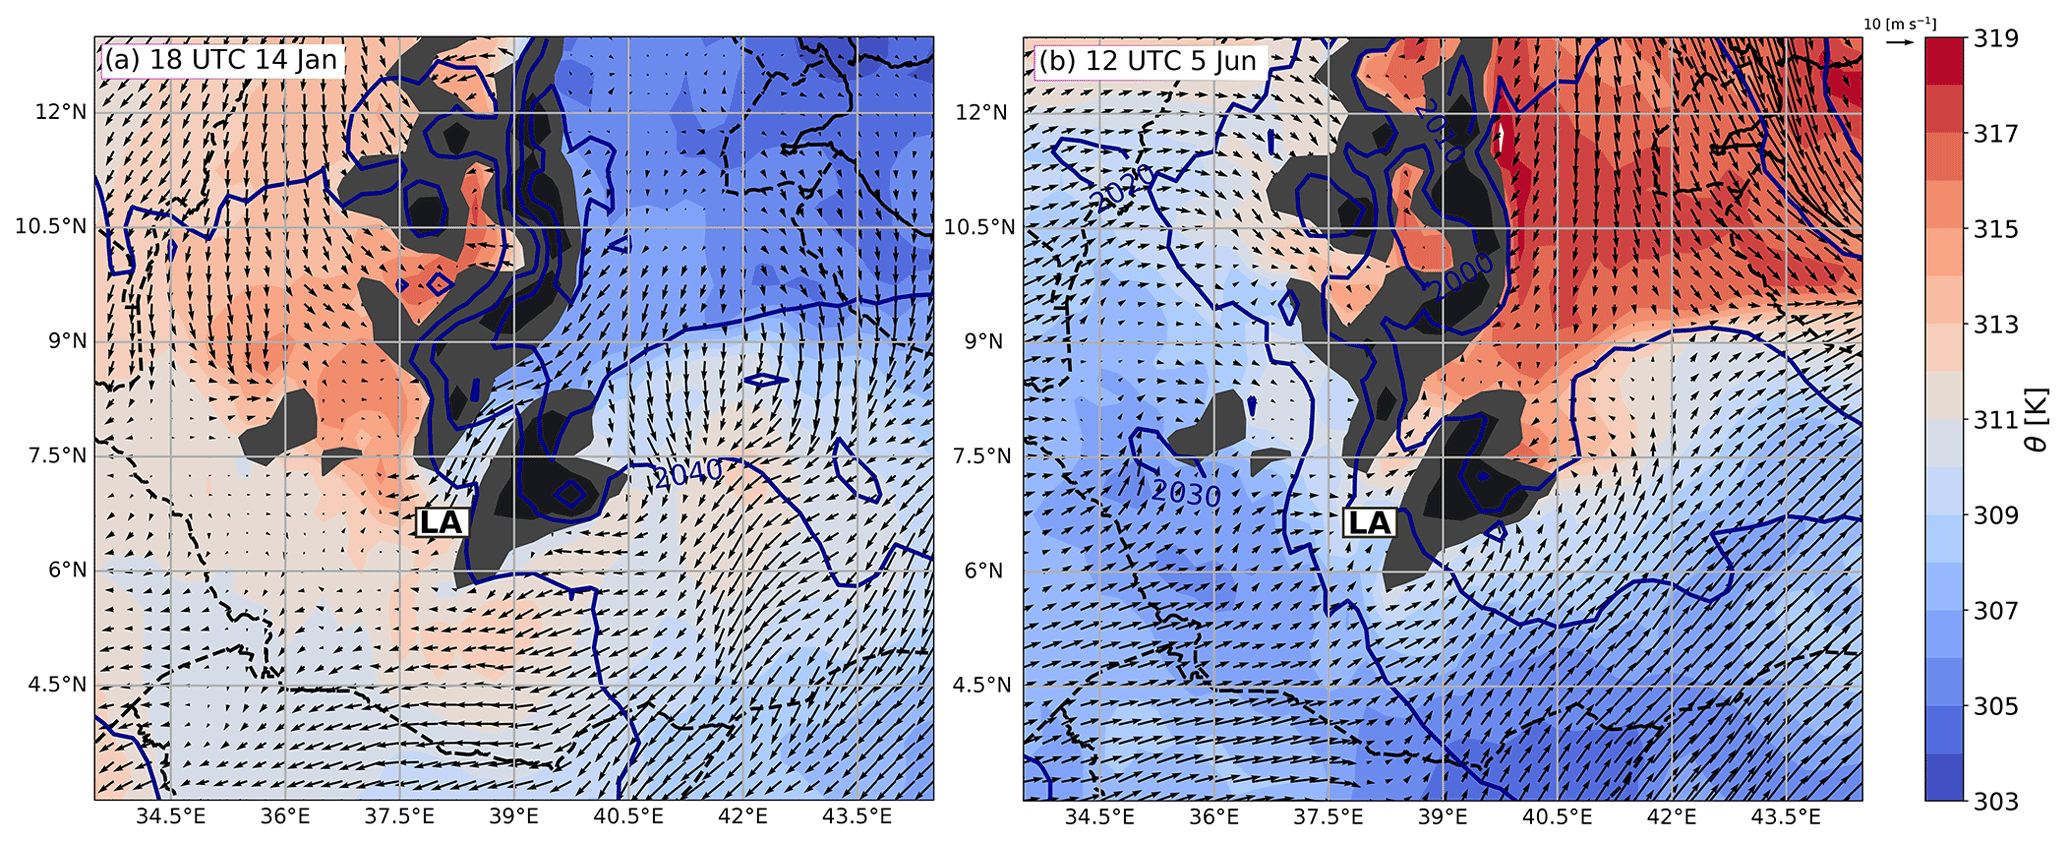
Figure 2Potential temperature (colour contours, 1 K increments), wind (arrows), and isohypses (i.e. lines of constant geopotential height; blue lines, 10 m increments) at 800 hPa in ERA5 over Ethiopia and Lake Abaya (LA) for (a) 18:00 UTC 14 January 2020 and (b) 12:00 UTC 5 June 2018. ERA5 model topography higher than 2000 m a.m.s.l. is shaded in dark grey.
This section presents the north-eastern gap flow event. First, more insights about the development of the lower atmosphere prior to the gap flow are given, followed by a description of the temporal evolution of the gap flow itself. The dependence on the time of the day of the strongest winds in the target area at Lake Abaya plays a special role.
4.1 Evolution of the main forcing
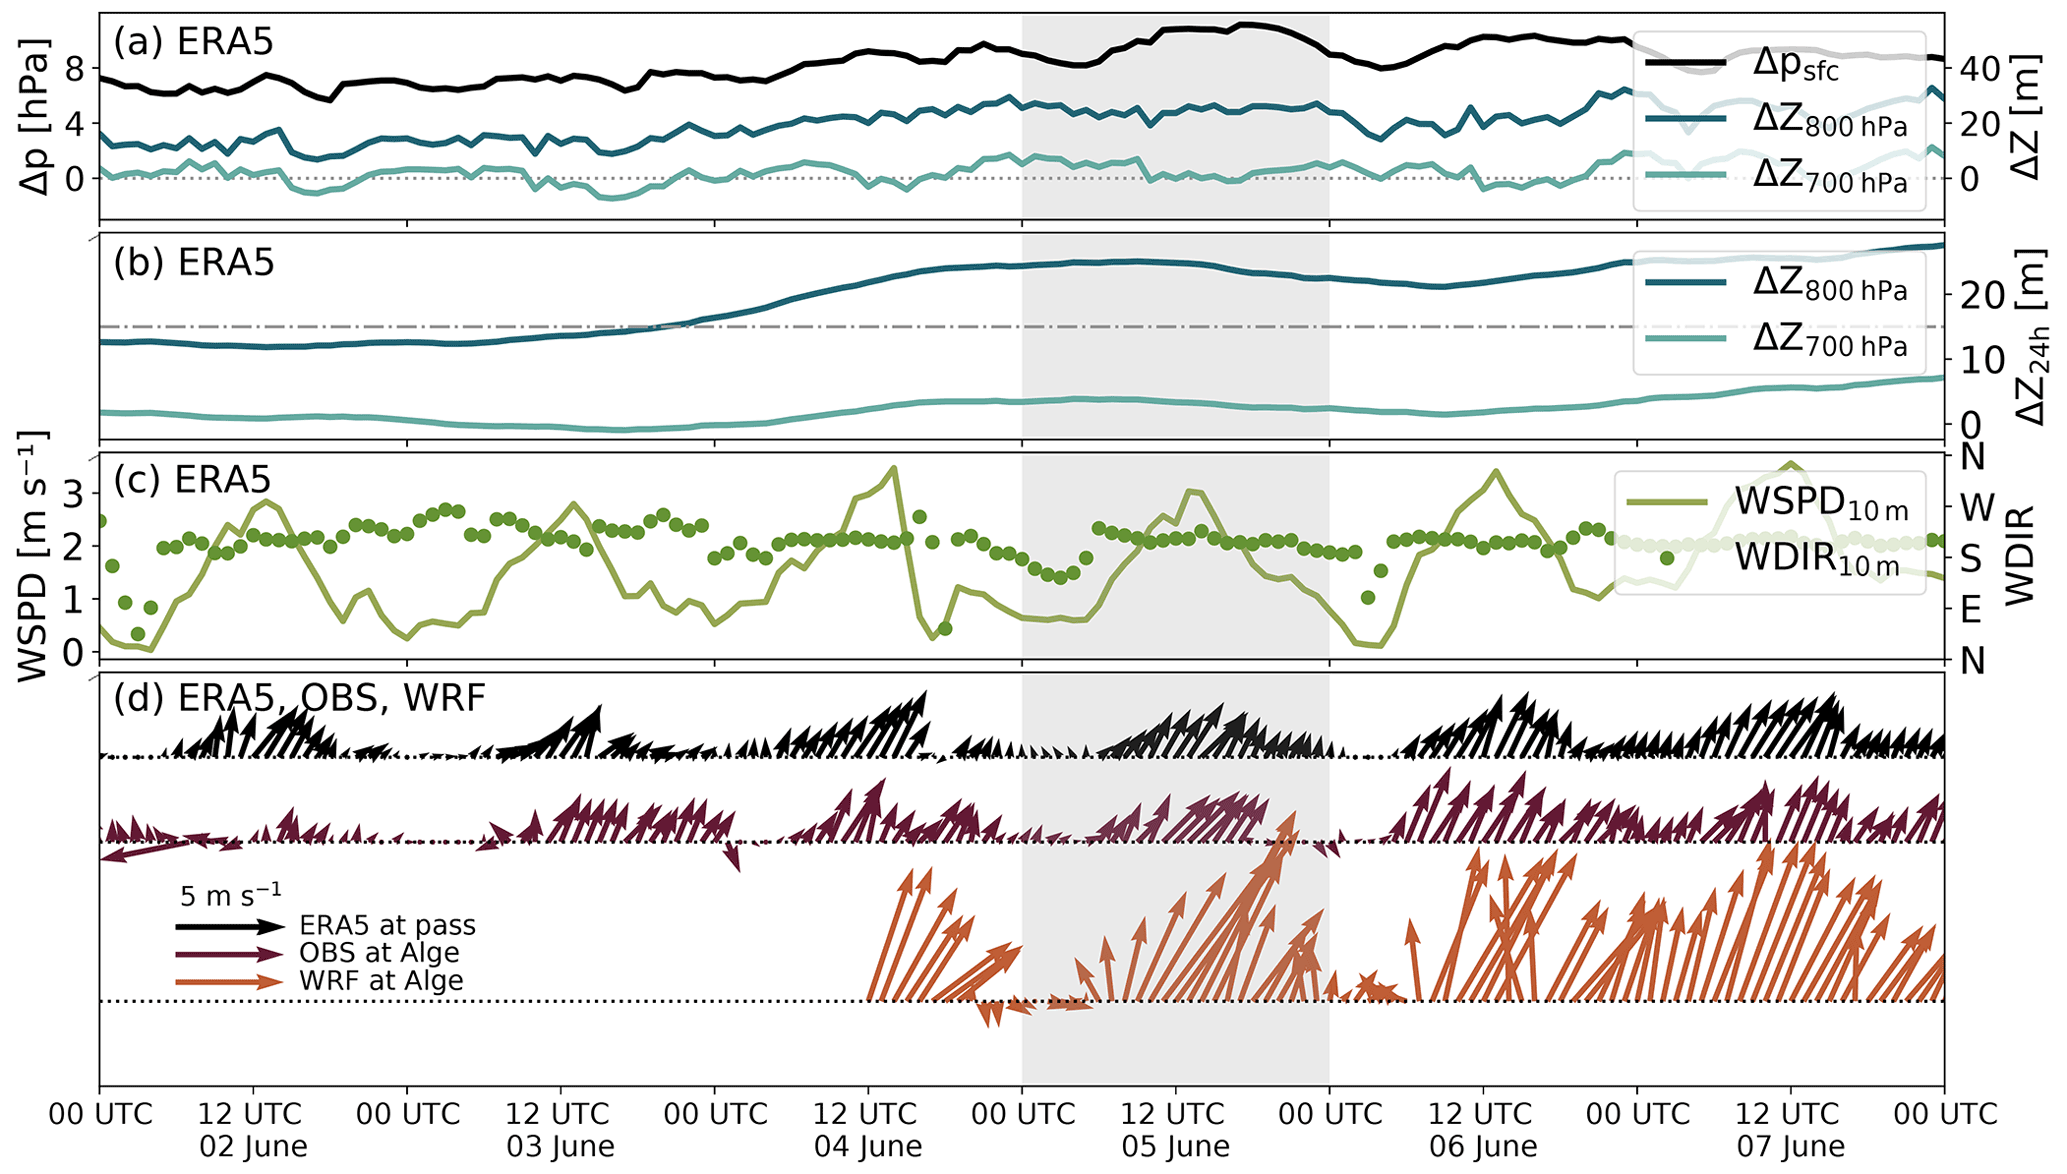
Two ERA5 grid points were selected at the two valley entrances, and the pressure difference between these two points was then taken as a diagnostic to describe the temporal evolution of the gap winds in the GRV. The upstream grid point is in the Afar Triangle (AT) at 10.25∘ N, 41∘ E, and the downstream grid point is located in the Turkana Channel (TC) at 5∘ N, 37∘ E (cf. Fig. 1b). The pressure difference at a specific height was calculated as Δp=p (AT) −p (TC). Figure 3 shows the time series of the difference in pressure reduced to 725 m a.m.s.l., Δpsfc, as well as the near-surface winds within the GRV. The considered gap flow event is highlighted by grey shading. The winds in the ERA5 near the pass (Fig. 3c) slowly but steadily intensified in the days before the actual gap flow event. A daily cycle in wind speed and wind direction is visible between 11–13 January, with southerly up-valley winds during the day and north-easterly down-valley winds during the night. On 14 January, the winds were strongest (but generally still rather weak) and remained north-east, indicating flow through the valley from the same direction throughout the whole day. Wind vectors for the same ERA5 grid point are also shown in Fig. 3d. In addition, the flow at Chamo North is depicted, which is located further downstream at the northern edge of Lake Chamo (cf. Fig. 1c). Winds at Chamo North were generally stronger and occurred later than at the pass. The strongest winds were measured and simulated in the night after 00:00 UTC (i.e. after 03:00 East African Time, EAT), whereas winds peaked at the pass before 00:00 UTC. The observed and simulated wind patterns in Fig. 3d are similar in the night before and after the considered event, which indicates that the gap flow was a recurring phenomenon spanning several consecutive days.
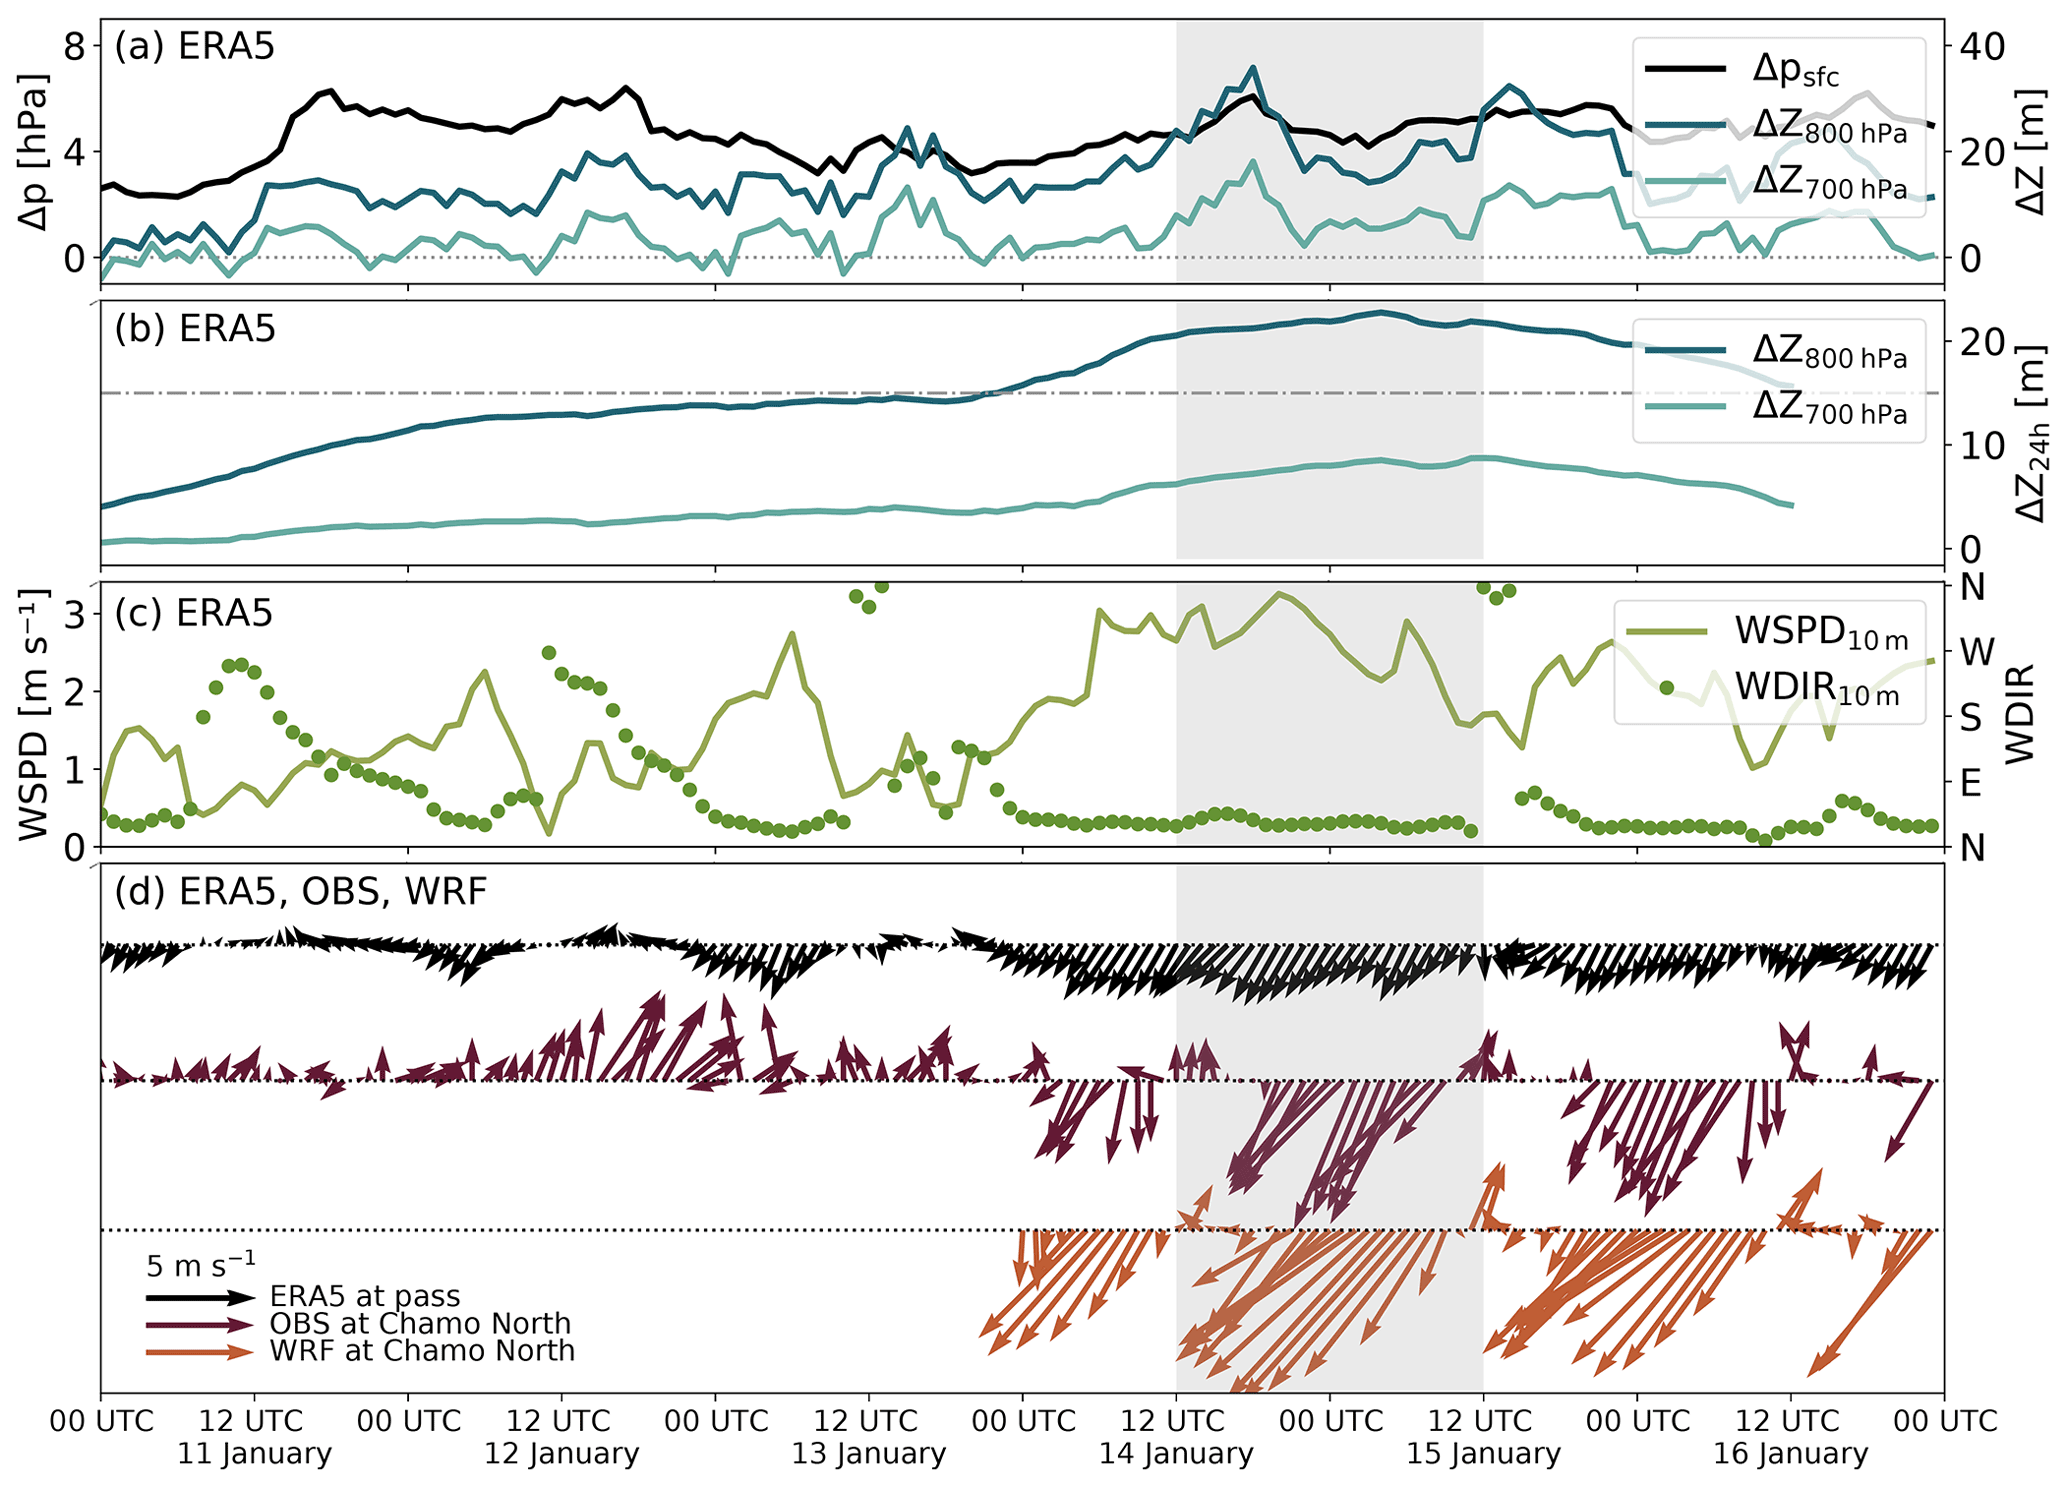
Figure 3Time series from 11 to 16 January 2020 of (a) difference between two ERA5 grid points (Fig. 1b), one in the Afar Triangle (AT) and one in the Turkana Channel (TC), of surface pressure Δpsfc reduced to 725 m a.m.s.l. as well as of geopotential height ΔZ at 800 and 700 hPa. (b) The 24 h running mean of ΔZ at 800 and 700 hPa. The dash-dotted line represents ΔZ=15 m. (c) ERA5 10 m wind speed (WSPD) and wind direction (WDIR) for a grid point close to the pass (PA; also Fig. 1b, c). (c) Wind arrows for the same ERA5 grid point as in (b), as well as observations and simulated WRF winds for Chamo North (CN; also Fig. 1b, c) further downstream. The period of the investigated gap flow event on 14–15 January 2020 is shaded in grey.
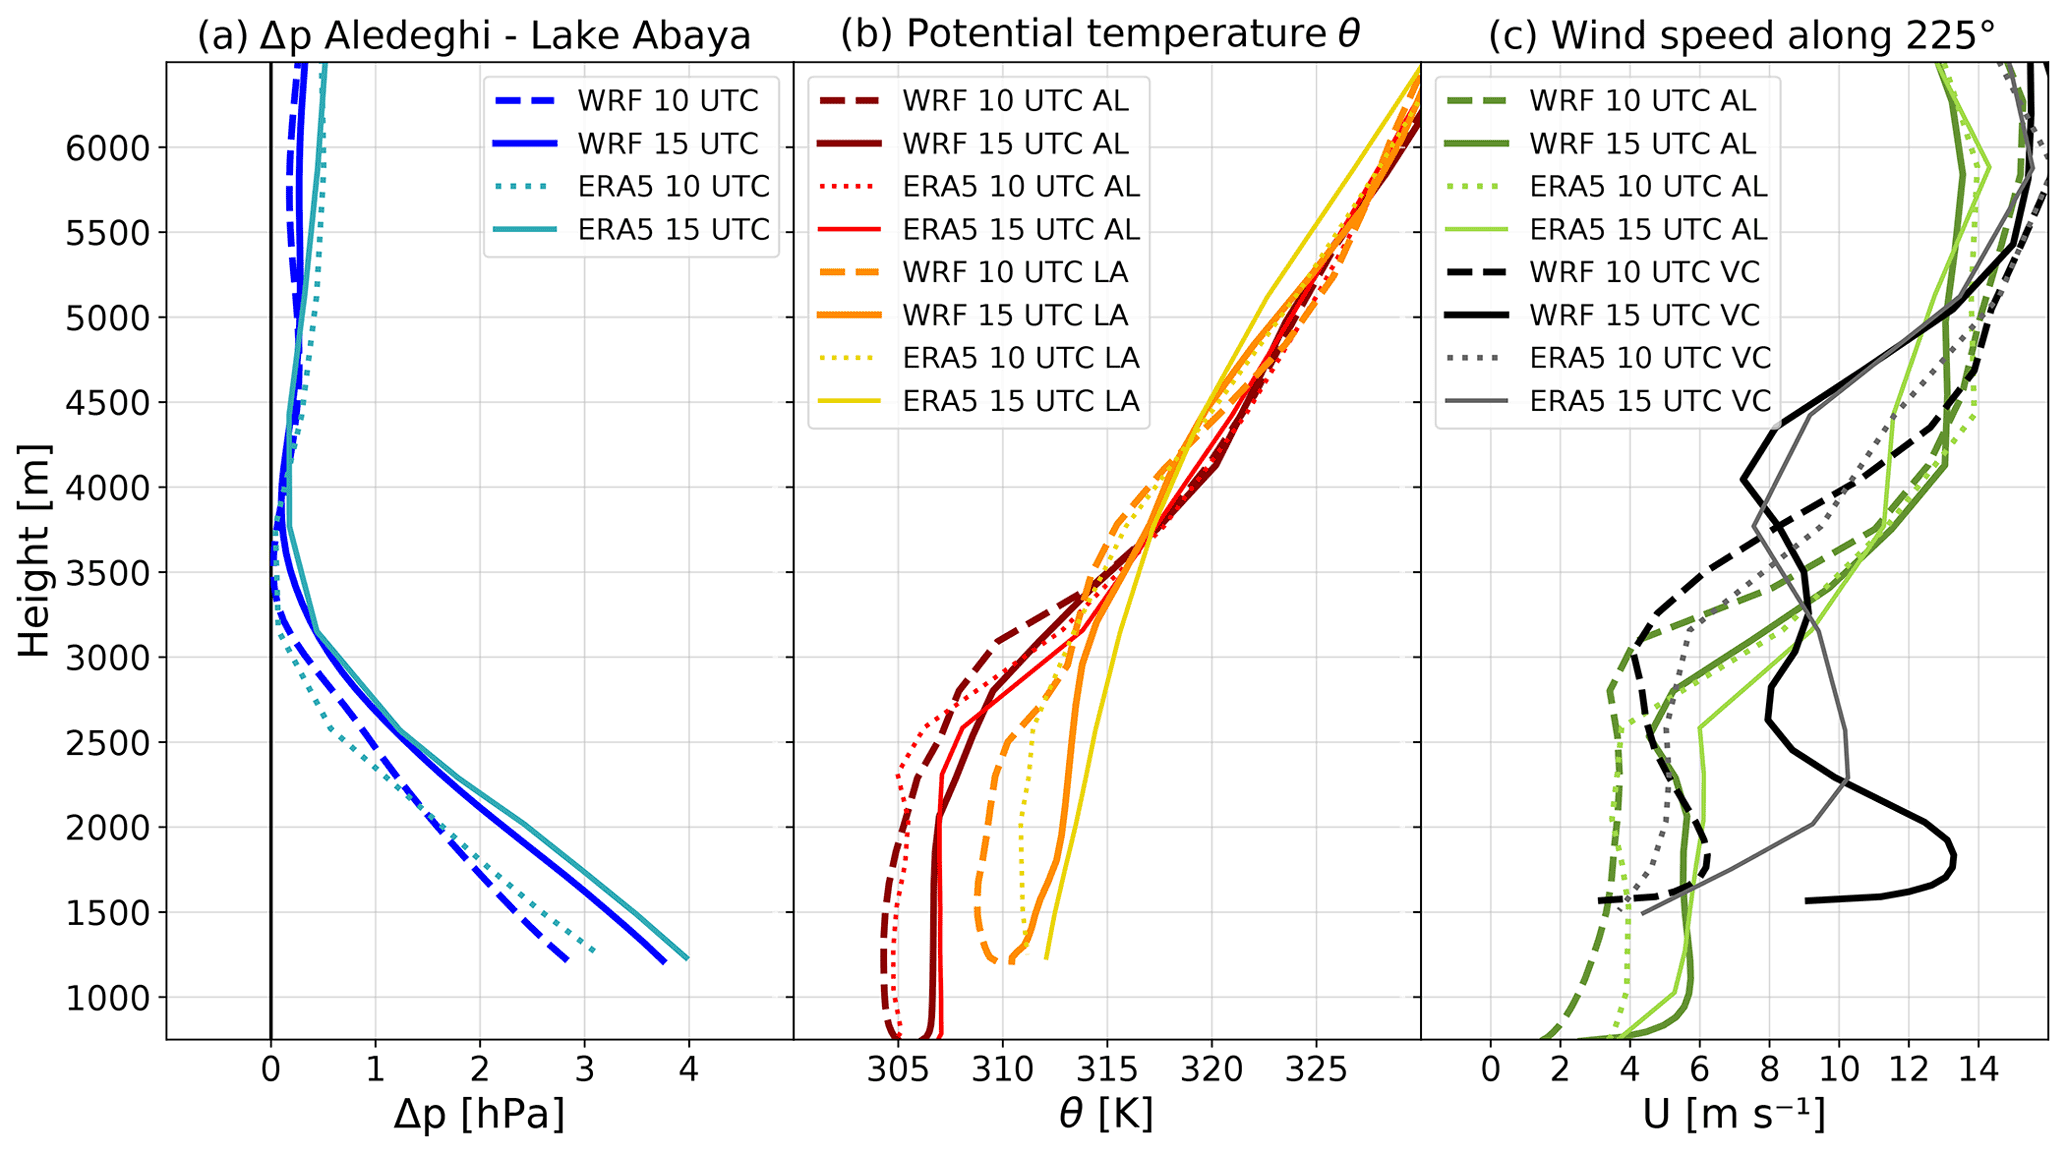
Figure 4Vertical profiles at two model grid points at Aledeghi (AL) and Lake Abaya (LA; Fig. 1b), respectively, for both the WRF simulation and the ERA5 reanalysis. (a) Pressure differences Δp in WRF (dark blue) and in ERA5 (light blue) for 10:00 and 15:00 UTC 14 January 2020. (b) Potential temperature θ, indicating the vertical stratification of the atmosphere up- and downstream, for both models at the two times. (c) Wind component in an azimuth direction of 225∘ (i.e. along the valley) for Aledeghi and for a model grid point in the along-valley centre (VC; Fig. 1b).
The difference in surface pressure Δpsfc in Fig. 3a cannot fully explain the timing of the gap flow event. It was at a comparable level already 3 d before the strongest winds at Lake Abaya. It mirrors the differential air mass advection below pass height and hence is mostly affected by the horizontal difference in the layer-mean temperature below 800 hPa up- and downstream of the pass. This is supported by the fact that the difference between the up- and downwind grid point (AT and TC) in geopotential height ΔZ around pass height (800 hPa) and crest height (700 hPa) is only marginally affected in the days prior to the investigated event (cf. Fig. 3a). However, between 12–14 January the increase in the depth of the colder air upstream in the Afar Triangle also increased the pressure gradient at pass height, which peaked in ΔZ800 hPa>30 m on the evening of 14 January. This peak corresponds to the day with the strongest winds in GRV and the target area. Figure 3b shows a 24 h running mean of ΔZ in which the diurnal cycle has been filtered in order to highlight the synoptic forcing. For ΔZ800 hPa, this filtered signal exceeded 15 m (dash-dotted grey line in Fig. 3b) during the strongest winds in the GRV. The peak in ΔZ at 800 hPa in Fig. 3a on 14 January was therefore composed of an increase in the synoptic forcing due to the air mass difference and a strong diurnal cycle.
Figure 4 provides vertical profiles of ERA5 and WRF at two grid points in the valley up- and downstream of the pass at 10:00 and 15:00 UTC 14 January. Notice that the horizontal distance between these two grid points, Aledeghi (AL) and Lake Abaya (LA), is shorter than the distance between the grid points used to derive the pressure and geopotential height differences in Fig. 3a (cf. Fig. 1b). The pressure difference over the shorter distance (Fig. 4a) below 3000 m a.m.s.l. increased between 10:00 and 15:00 UTC in both ERA5 and WRF. At pass height (≈2000 m a.m.s.l.) it increased in the WRF simulation from about 1.5 to 2.2 hPa. The magnitude and vertical structure is very similar in WRF and ERA5.
The potential temperature profiles (Fig. 4b) show generally warmer air at Lake Abaya than at Aledeghi for both models. The temperature difference increased over the day for each up- and downstream pair and is consistent with the increase in the pressure difference Δp. For both models and both locations the boundary layer warmed during the day until sunset at 15:33 UTC (18:33 EAT) and exhibited a mixed convective boundary layer (CBL), while at 10:00 UTC the CBL was slightly lower on the downstream side than on the upstream side in both ERA5 and WRF, and the CBL was higher on the downstream side at 15:00 UTC. At this time, the CBL reached up to more than 3000 m a.m.s.l. around Lake Abaya. Hence, the different evolution of the boundary layer and stronger warming on the downstream side in the target area compared to the upstream side enhanced the existing along-valley pressure gradient.
Figure 4c shows the wind profiles for Aledeghi and a grid point in the along-valley centre (VC; Fig. 1b). Depicted is the north-easterly wind component, i.e. the wind speed along the valley axis of 225∘. The Aledeghi profile is characterized by a homogeneous wind speed in the CBL except near the surface due to friction. Above the CBL inversion the winds strongly increase. Between 10:00 and 15:00 UTC, the inflow and the north-easterlies in the valley increased for both locations. The increase at VC, however, was stronger, with wind speeds of up to 10 m s−1 in ERA5 and 13 m s−1 in WRF. Furthermore, it exhibited a jet-like structure which was more pronounced in WRF than in ERA5.
4.2 Evolution of the flow in the valley
Figure 5 illustrates the evolution of the north-eastern gap flow in the GRV based on simulated wind speed and potential temperature along the vertical transect a–b–c (see Fig. 1b) as well as the wind field at 2000 m a.m.s.l. The gap flow began shortly before sunset at around 15:00 UTC (Fig. 5a–b). A prominent gap flow feature is the continuous acceleration and the associated descending isentropes as the flow passed the narrowest section near Lake Ziway (see LZ in Fig. 5a–b) of the GRV. The CBL was about 500–1000 m deeper downstream of the pass (Turkana Channel, point b) than upstream (Afar Triangle, point a) but exceeded pass height at both locations by at least 500 m (Fig. 5a). On the downstream side, the slight counteracting south-westerly (up-valley) flow at the northern shore of Lake Abaya was presumably the result of a combined lake breeze and slope/valley wind. Notice that this up-valley flow cannot be seen at 2000 m a.m.s.l. (Fig. 5b). After sunset the gap flow intensified, crossed the pass, and reached the north-eastern shore of Lake Abaya at 18:00 UTC (Fig. 5c–d). The horizontal wind component along the transect exceeded 24 m s−1. Lake Abaya was not yet affected by the gap flow but rather by an opposing outflow from a side valley that terminates near the middle of the lake from the south-east into the GRV (see Fig. 1c). The convergence of these two flows resulted in a hydraulic-jump-like feature at LA (Fig. 5c).
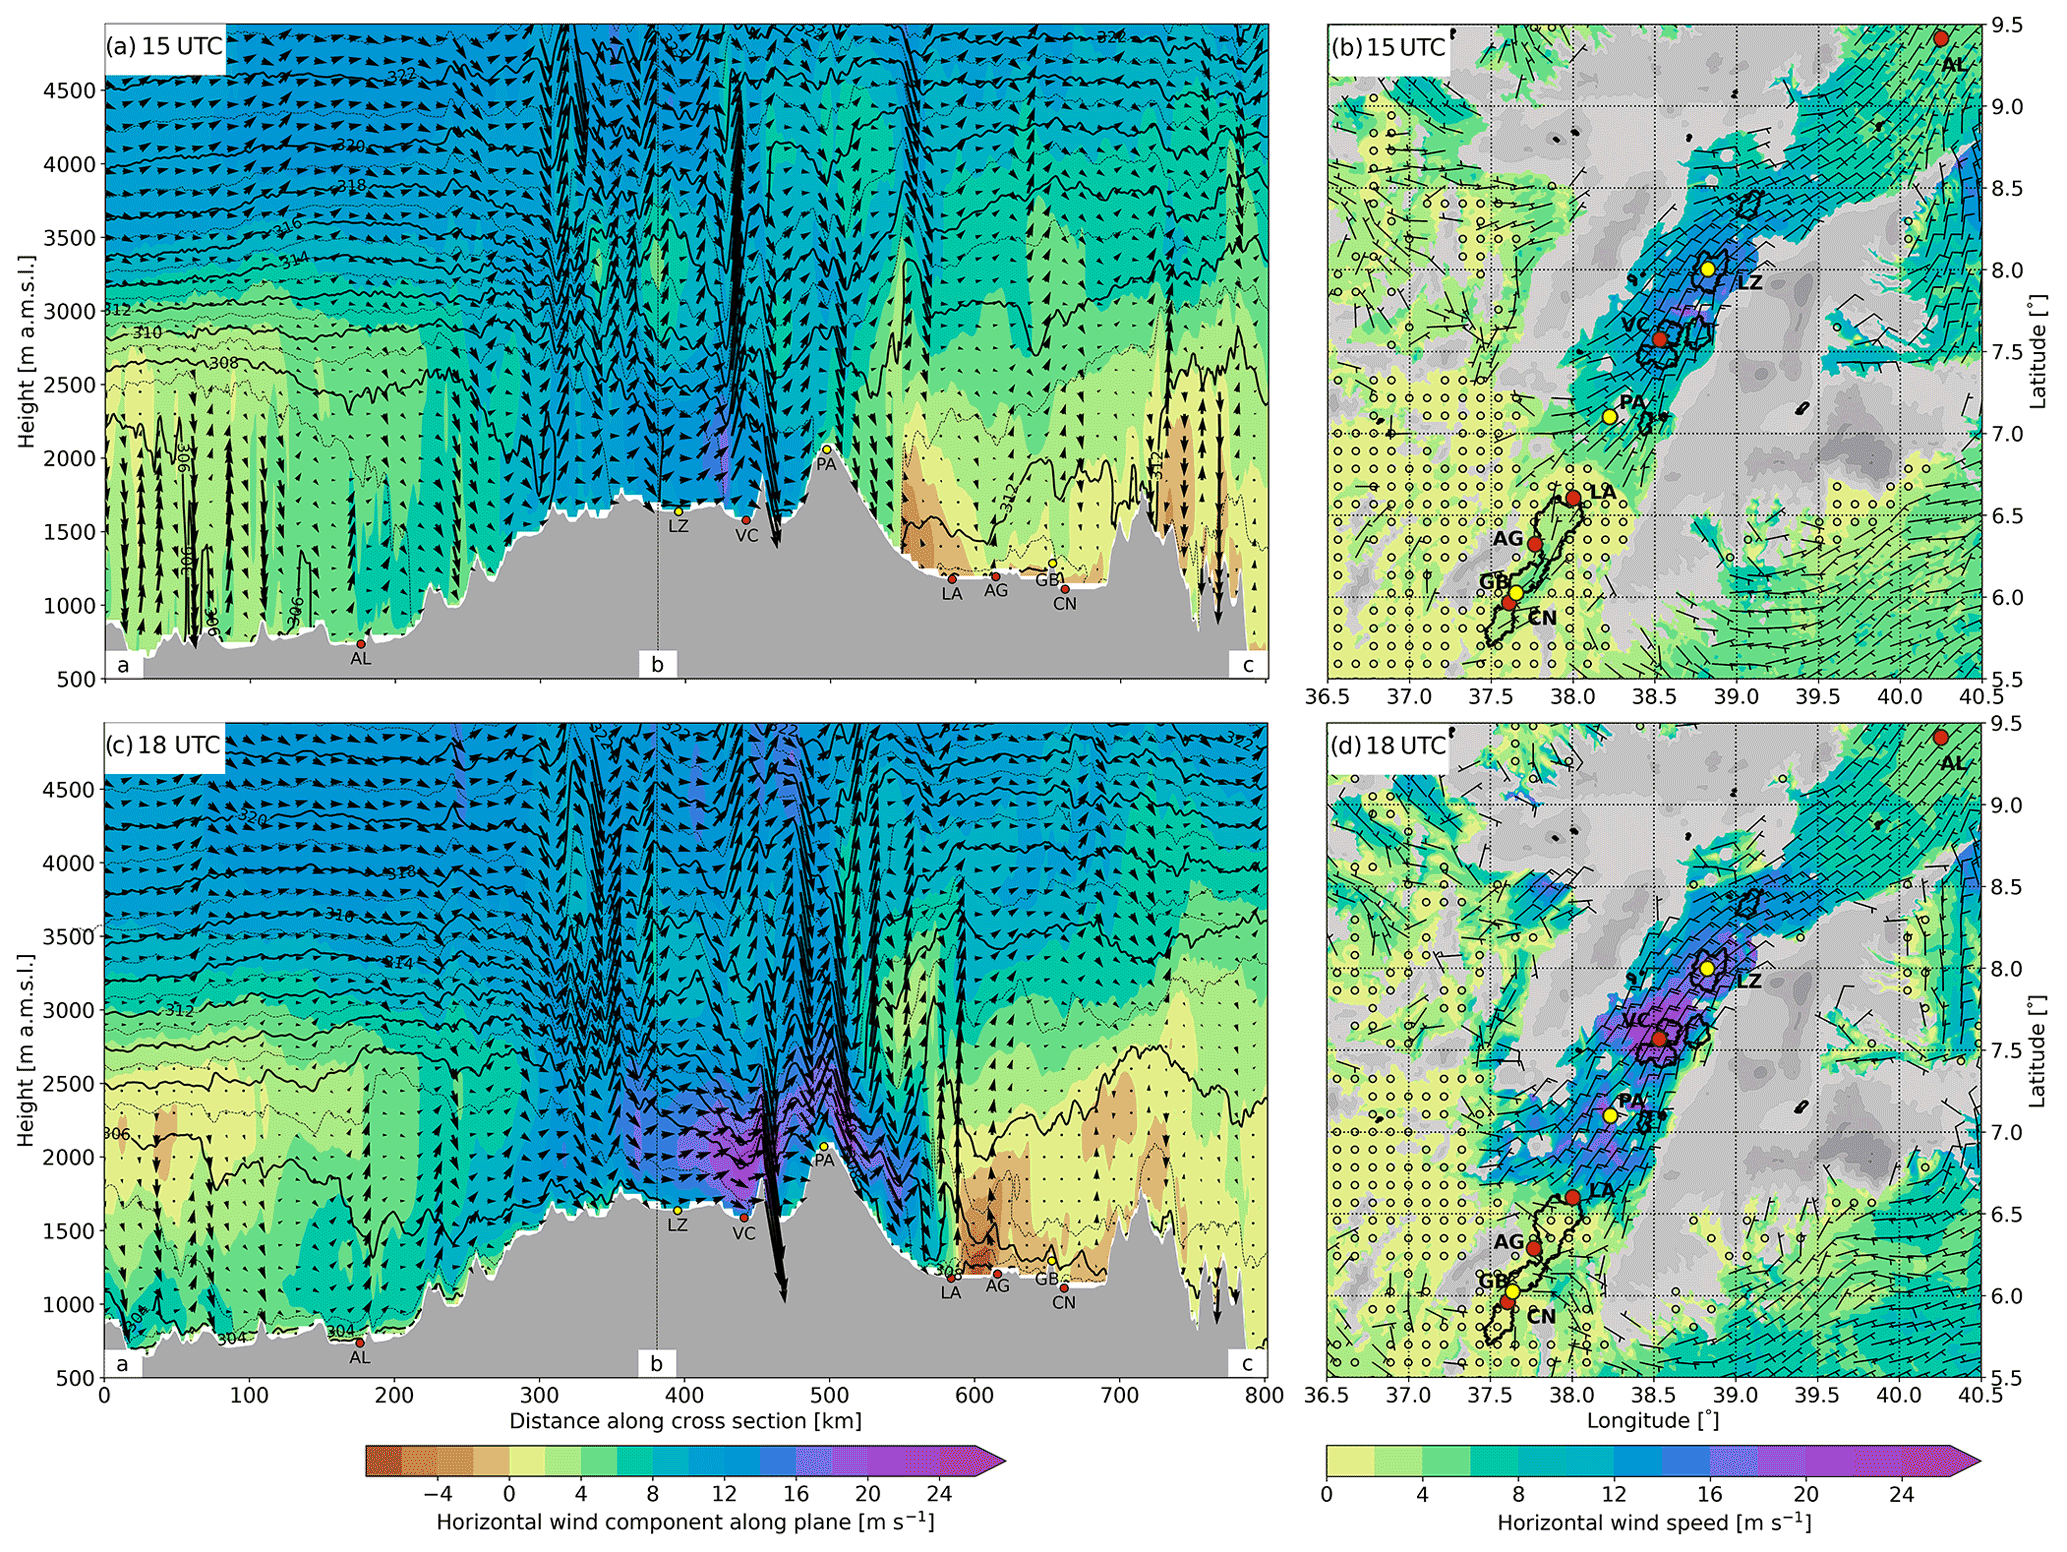
Figure 5WRF simulation (domain d02) of the north-eastern gap flow on 14 January 2020 at (a)–(b) 15:00 UTC and (c)–(d) 18:00 UTC: (a, c) vertical transect along line a–b–c (see Fig. 1b) through the GRV from the Afar Triangle (left) to the Turkana Channel (right) showing the potential temperature (black contour lines, 1 K increments), the horizontal wind component along the transect (colour contours, 2 m s−1 increments), and arrows for the 2D wind field on the vertical plane. (b, d) Wind field at 2000 m a.m.s.l. with the horizontal wind speed (colour contours, 2 m s−1 increments) and wind barbs (half barb for 5 m s−1 and full barb for 10 m s−1). Grey shading represents the topography. In (c) and (d) only the terrain exceeding 2000 m a.m.s.l. is shown. The bend of the transect at point b is marked in (a) and (c) by a vertical dashed line. Black lines in (b) and (d) indicate lakes resolved by the model. The following locations are marked: Aledeghi (AL), Lake Ziway (LZ), the along-valley centre (VC), the pass (PA), the northern end of Lake Abaya (LA), AWS Alge (AG), God's Bridge (GB), and the AWS Chamo North (CN).

Figure 6WRF simulation (domain d02) of the north-eastern gap flow: vertical transect along line b′–c′ (see Fig. 1b) south of the pass (at 30 km) around Lake Abaya and Lake Chamo at (a) 12:00 UTC, (b) 19:00 UTC, and (c) 23:00 UTC 14 January 2020 and (d) 04:00 UTC 15 January 2020. Shown is the potential temperature (black contour lines, 1 K increments), the horizontal wind component along the transect (colour contours, 2 m s−1 increments), and arrows for the 2D wind field on the vertical plane. The pass (PA) and the northern edge of Lake Abaya (LA), AWS Alge (AG), God's Bridge (GB), and AWS Chamo North (CN) are marked with black dots. Grey shading represents the topography.
Figure 6 shows the evolution of the gap flow near Lake Abaya and Lake Chamo along the shorter transect b′–c′ (see Fig. 1b). In the early afternoon at 12:00 UTC (15:00 EAT) a lake breeze at the shores of the two lakes, especially at the northern shore of Lake Abaya, indicated by south-westerly winds, can be identified (brown colours near LA in Fig. 6a). On the slope between Lake Abaya and the pass convection took place and formed a deep CBL. South-westerly upslope winds were weak but intensified 3 h later (Fig. 5a). However, at the same time the gap flow established and prevented a further extent of the slope winds towards the pass. Due to the intensification of the gap flow after sunset the hydraulic jump (i.e. the leading edge of the gap flow) propagated between 19:00 UTC (22:00 EAT) and 23:00 UTC (02:00 EAT) across both lakes and led to strong north-easterly winds over the lakes exceeding 10 m s−1 (Fig. 6b–c). These winds were presumably strong enough to generate surface waves on Lake Abaya through wind stress. About 20 km downstream of the pass, the gap flow detached from the surface and formed a low-level rotor indicated by the reversed flow at low levels. The rotor remained for several hours (Fig. 6b–d). Vertical isentropes and weak winds on top of the gap flow near LA are indicative of gravity wave breaking.
Local topographic features induced local accelerations of the gap flow. This is depicted in Fig. 6c by the descending isentropes over the southern part of Lake Abaya between AG and CN due to a local narrowing of the valley (cf. Fig. 1c) and over the northern part of Lake Chamo due to Yegzier Dildiyi, the shallow hill between Lake Abaya and Lake Chamo. This local acceleration presumably explains the strong winds at the AWS Chamo North. Until sunrise, near-surface winds remained strong, but the gap flow became shallower (Fig. 6d).
In this section, the south-western gap flow event in the GRV on 5 June 2018 is described. The structure is the same as in Sect. 4: starting with the development in the lower atmosphere followed by the description of the temporal evolution of the gap flow.
5.1 Evolution of the main forcing
Similar to the north-eastern gap flow event, the large-scale forcing is illustrated in Fig. 7a by the difference in pressure and geopotential height between an ERA5 grid point upstream and downstream of the GRV. The Turkana Channel (TC) is now located on the upstream side and the Afar Triangle (AT) on the downstream side; hence Δp=p (TC) − p (AT) and ΔZ=Z (TC) − Z (AT), which is opposite to the first case (cf. Fig. 3a). The positive surface pressure difference Δpsfc indicates that the pressure was again higher upstream than downstream of the GRV. It continuously increased in the days before the investigated event. The pressure gradient at pass height, depicted by the geopotential height difference ΔZ800 hPa, increased in line with Δpsfc and reached a maximum of about 30 m during the strongest winds near Lake Abaya, which is similar to the north-eastern gap flow. The synoptic forcing below pass height, represented by the 24 h running mean of ΔZ800 hPa in Fig. 7b, showed a similar behaviour as for the north-eastern case and exceeded 15 m. However, even before the investigated case the 24 h average of ΔZ800 hPa was close to 15 m and hence caused south-westerly winds in the GRV (Fig. 7d). Similar to the north-eastern case, the magnitude of the 24 h running mean of ΔZ was much larger at 800 hPa than at 700 hPa (Fig. 7b), indicating that the large-scale forcing was strongest below crest height, i.e. within the GRV.
The ERA5 grid point near the pass exhibits southerly or south-westerly near-surface winds for most of the 6 d period shown in Fig. 7c. They were strongest in the afternoon and weakest during the night, indicating a diurnal cycle and hence a dependence on solar radiation. In addition, the persistent large-scale pressure gradient favoured a long-lasting gap flow over several consecutive days. Wind observations at Lake Abaya, in this case taken from the AWS at Alge (cf. Fig. 1c), show a similar diurnal cycle as the ERA5 winds at the pass. The winds simulated by WRF at Alge also exhibit a diurnal cycle but were more than twice as strong as those observed. This is presumably due to lower friction associated with the underlying water land use class at the WRF grid points surrounding Alge.
Figure 8a shows vertical profiles of the pressure gradient Δp across the pass between Lake Abaya (upstream) and Aledeghi (downstream). The pressure gradient Δp was positive below main crest height (approx. 3000 m a.m.s.l.) and increased from crest height to the height of the lake. The values are in the same range as for the north-eastern gap flow case, with about 2 hPa at pass height. The horizontal pressure gradient slightly increased from 10:00 to 15:00 UTC by about 0.5 hPa (Fig. 8a).
Figure 8b shows the evolution of the potential temperature up- and downstream of the pass. At pass height (about 2000 m a.m.s.l.) potential temperature was about 8–10 K colder above Lake Abaya (upstream) than above Aledeghi (downstream of the pass). Except for a shallow layer near the surface, the valley atmosphere at Lake Abaya was stably stratified, while a deep CBL formed at Aledeghi profiles up to about 4000 m a.m.s.l. The temperature contrast between the up- and downstream side slightly increased between 10:00 and 15:00 UTC in both ERA5 and WRF, which is in agreement with the slight increase in the pressure gradient. Below crest height, the WRF profile exhibited a multi-layer structure in temperature which was not captured by ERA5. Large differences can also be seen in the wind profile at Lake Abaya (Fig. 8c), especially at 15:00 UTC, with a much stronger low-level jet in the WRF (up to 15 m s−1) than in the ERA5 (up to 5 m s−1). At the grid point of the along-valley centre (VC), the discrepancy is smaller but with a difference in near-surface wind speed of 5 m s−1. Hence, ERA5 captured the basic feature of the gap flow, including the increase in wind speed between 10:00 and 15:00 UTC, but again underestimated the magnitude of the gap winds, similar to the first case (cf. Figs. 4c and 8c). An interesting feature is the wind reversal near crest height, as indicated by the change in sign of the along-valley component in Fig. 8c. Hence, in contrast to the first case (Fig. 4c), the gap flow in the valley seemed to be completely decoupled from the synoptic flow above crest height.
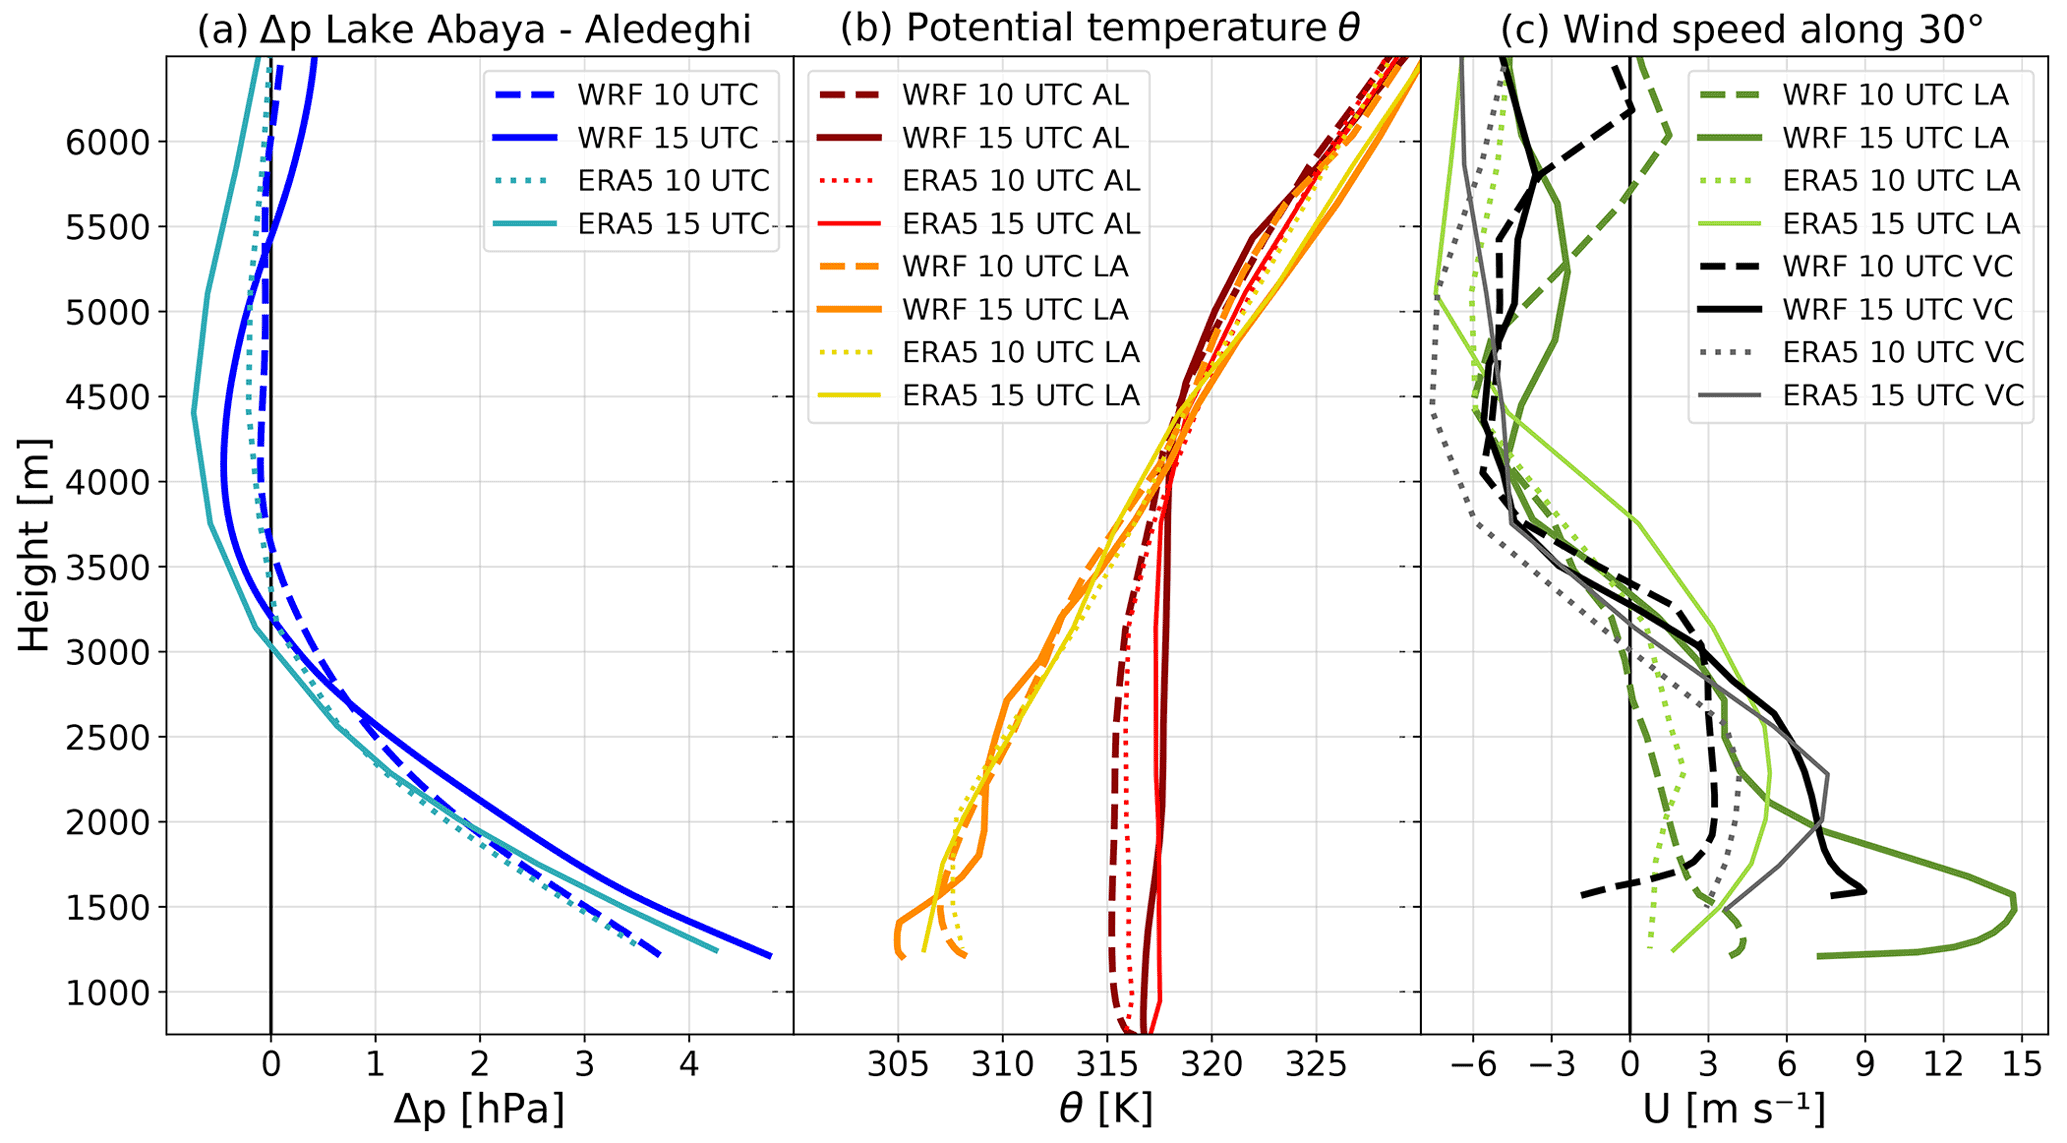
Figure 8As in Fig. 4 but for 10:00 and 15:00 UTC 5 June 2018. The pressure difference Δp is calculated as the pressure at Lake Abaya (LA) minus the pressure at Aledeghi (AL; Fig. 1b). The wind profiles for Lake Abaya and the along-valley centre (VC) in (c) refer to the wind component in an azimuth direction of 30∘, i.e. along the valley in a north-easterly direction.
5.2 Evolution of the flow in the valley
The development of the south-western gap flow in the GRV is illustrated by the vertical transect a–b–c in Fig. 9a, c and the wind field at 2000 m a.m.s.l. in Fig. 9b, d. Notice that the colour scale for the along-valley wind component in Fig. 9a, c is reversed compared to Fig. 5a, c in order to highlight the reversed gap flow with the same bluish colours. The same is the case for the shorter cross-sections a′–b and b′–c′ shown in Fig. 10.
In the late afternoon of 5 June at 14:00 UTC (17:00 EAT; Fig. 9a), the different structure of the boundary layer up- and downstream of the GRV was one of the most striking features. On the downstream side, in the Afar Triangle, the air mass was much warmer and exhibited a CBL deeper than 4 km a.m.s.l. (see also Fig. 8b). Resolved up- and downdraughts in the CBL, indicated by vertically pointing arrows, were associated with cumulus convection. The strong temperature contrast between the up- and downstream sides and the associated horizontal temperature gradient inside the valley is depicted by slanted isentropes (Fig. 9a). In the Turkana Channel and the region around Lake Abaya, the boundary layer was stably stratified due to cloud formation, except for a shallow mixed layer with a depth of about 200 to 300 m over Lake Abaya (see also Fig. 8b). The south-westerly flow into the valley, advecting colder air from the Turkana Channel, was restricted to the layer below 3500 m a.m.s.l. The structure of the bent isentropes upstream of the pass and the associated wind field showed similarities to a density current. The latter is characterized by an elevated head (cf. Fig. 2 in Gohm et al., 2010). This situation was persistent for roughly 6 h, long enough to generate waves on the lake. Local flow acceleration illustrated in Fig. 10b between CN and LA was most likely caused by the hill between Lake Chamo and Lake Abaya (Yegzier Dildiyi) and by the narrowing valley near the centre of Lake Abaya (see in Fig. 1c). The strongest winds occurred downstream of the narrowest part of the valley, i.e. downstream of the point AG. This is similar to a hydraulic-flow transition from a sub- to a supercritical state (e.g. Pan and Smith, 1999). The strongest winds in the core of the low-level jet over Lake Abaya (at about 300 m a.g.l.) reached about 20 m s−1 (Fig. 10b) but hardly exceeded 10 m s−1 near pass height at 2000 m a.m.s.l. (Fig. 9b). At the northern shoreline, the flow slowed down while ascending the slope towards the pass (Figs. 9a and 10b). North of the pass, the wind speed was still weak, although mostly from south-westerly directions (Figs. 9a and 10a). This changed after sunset, similar to the north-eastern gap flow case.
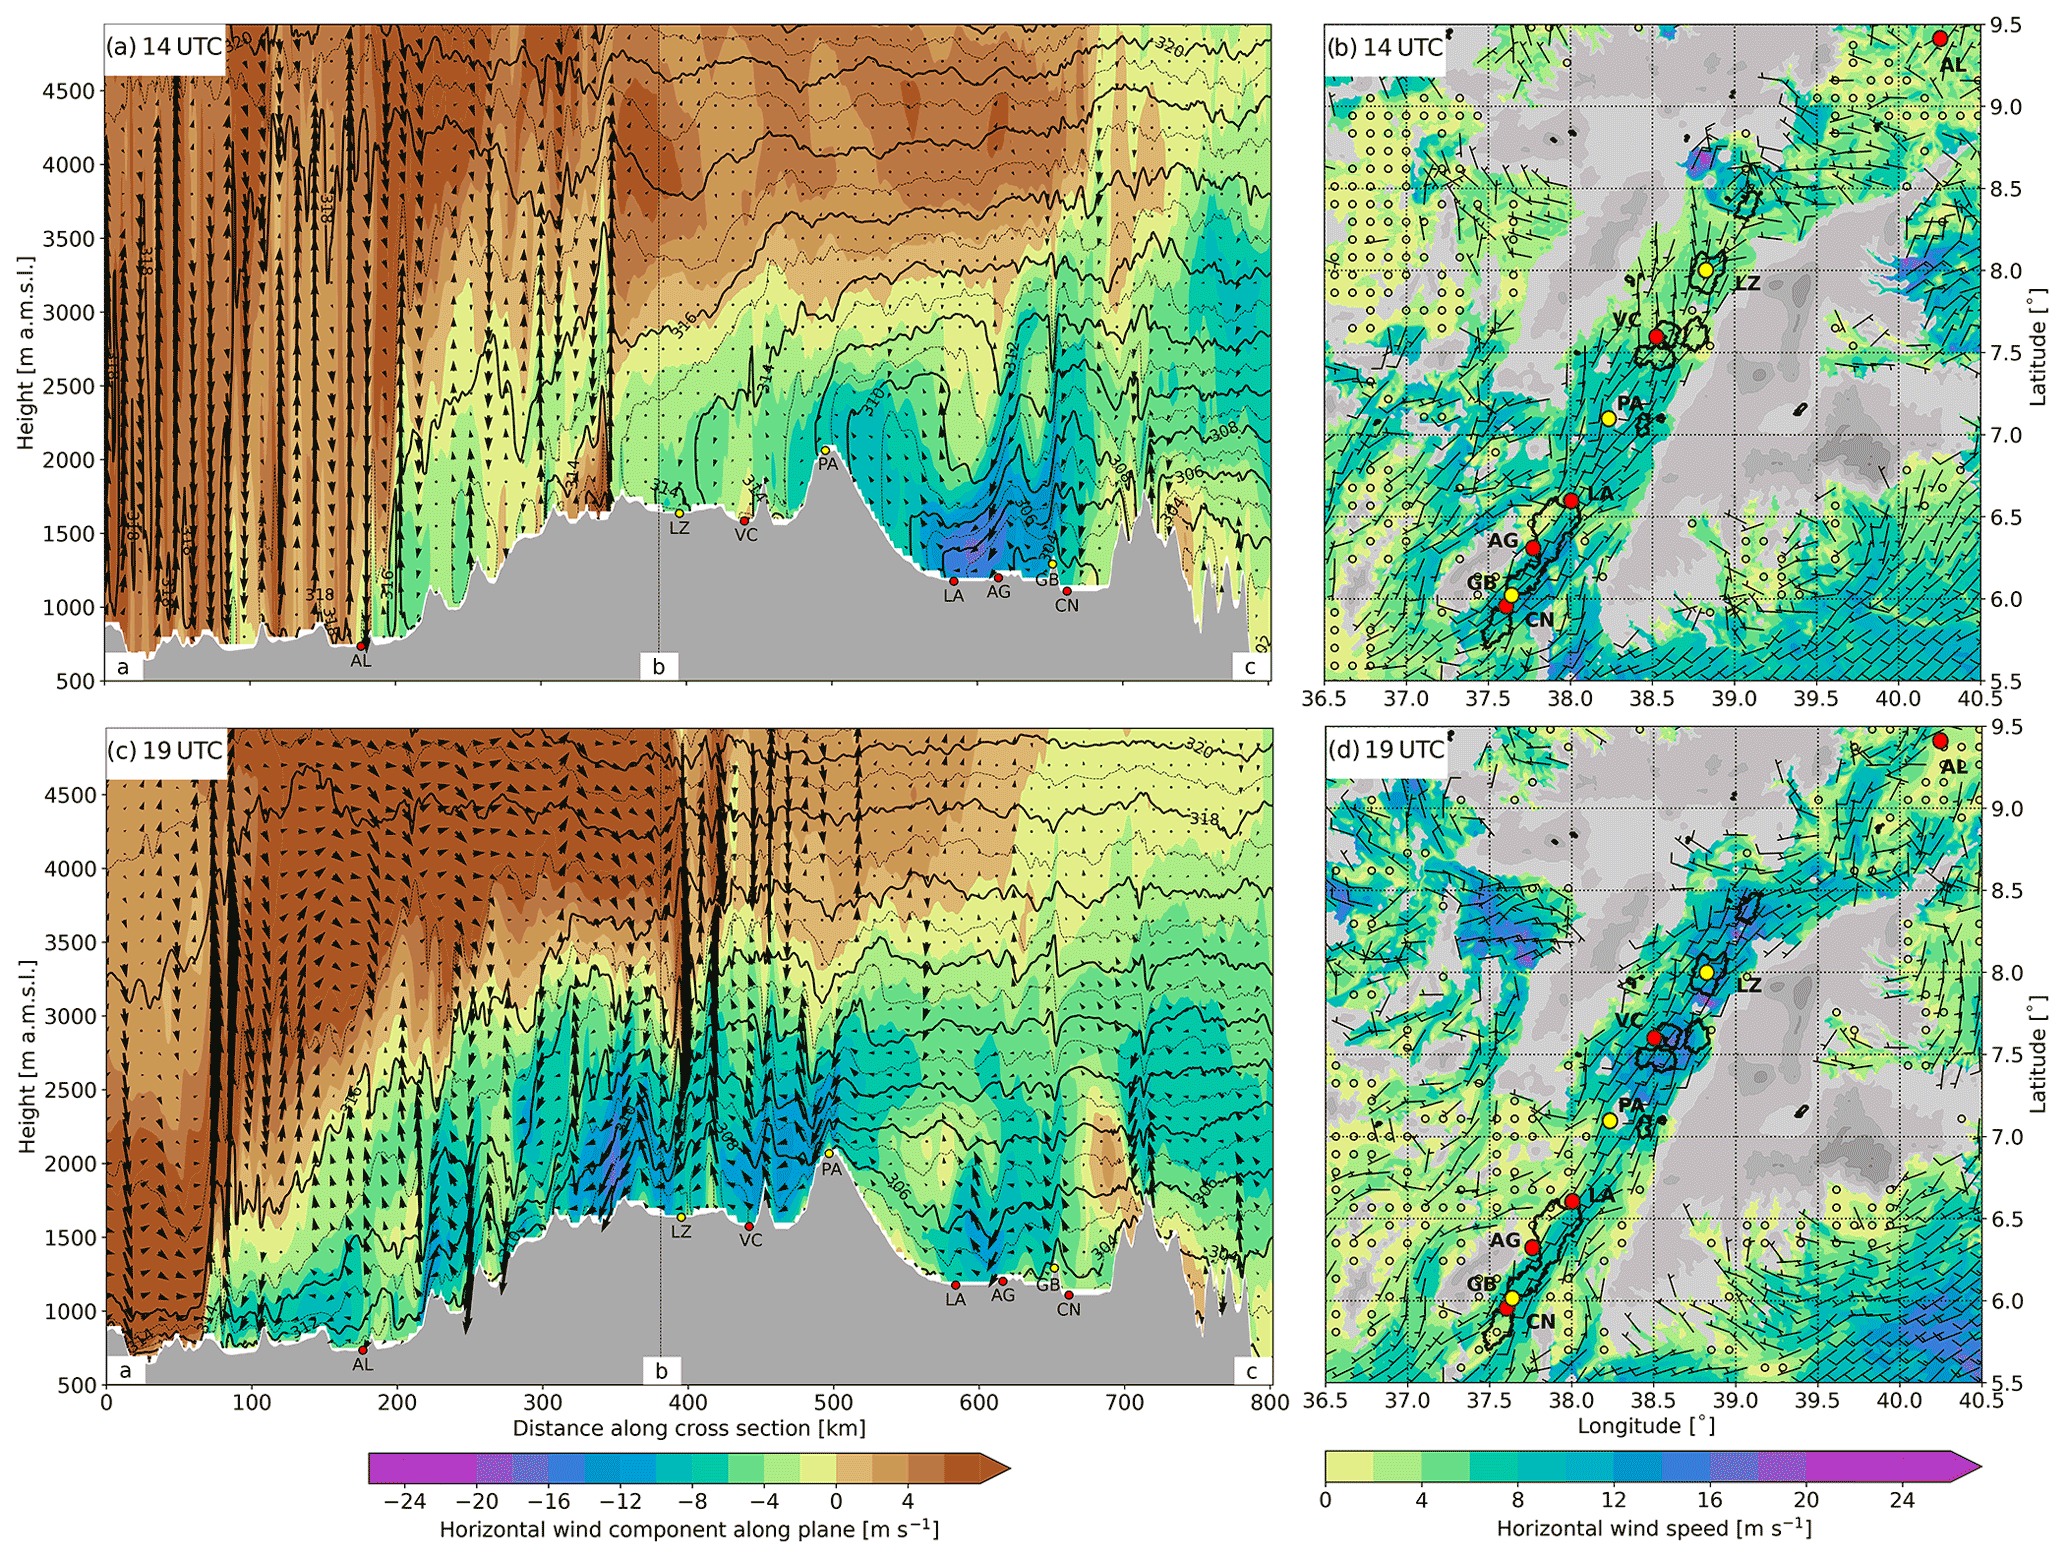

Figure 10WRF simulation (domain d02) of the south-western gap flow: vertical transect (a, c) along line a′–b (see Fig. 1b) in the northern part of the GRV and (b, d) along line b′–c′ around Lake Abaya and Lake Chamo at (a, b) 14:00 UTC and (c, d) 22:00 UTC 5 June 2018. Shown is the potential temperature (black contour lines, 1 K increments), the horizontal wind component along the transect (colour contours, 2 m s−1 increments), and arrows for the 2D wind field on the vertical plane. The pass (PA), the northern edge of Lake Abaya (LA), AWS Alge (AG), God's Bridge (GB), and AWS Chamo North (CN) in the upstream section and Aledeghi (AL) in the downstream section are marked with black dots. Grey shading represents the topography. Notice the reversed colour scale compared to Fig. 6
At 19:00 UTC, the flow accelerated downstream of the pass and also downstream of the narrowest valley section at Lake Ziway (see PA and LZ in Fig. 9c, d). The acceleration was associated with descending isentropes and hence a reduction in the flow depth (see layer below the 316 K isentrope, which also marks the height of the flow reversal). Both are again signs of a hydraulic transition into a supercritical state. The gap flow had reached the Afar Triangle. Wind speeds were moderate (around 15 m s−1) but intensified later in the night, reaching about 24 m s−1 north of the pass (see Fig. 10c). The evolution is similar to the north-eastern gap flow. Several hills embedded in the valley and lateral topographic constrictions led to local flow accelerations downstream of the pass (Fig. 10c), similar to the accelerations at Lake Abaya. The passage of the gap flow “front” removed the near-surface inversion that had formed in the Afar Triangle under the deep residual layer after sunset (Fig. 9c). The complete wind reversal at about 1500 m a.g.l. downstream of the pass (Fig. 10c) indicates that the gap flow was completely decoupled from the mid-tropospheric flow. After the initial phase of strong winds at Lake Abaya in the afternoon (Fig. 10b), wind speed decreased over the lake in the evening presumably due to partial flow blocking upstream of the pass (see e.g. terrain-intersecting isentropes in Fig. 10d). Hence, in contrast to the north-eastern gap flow, wind speed was weak during the night (Fig. 10d).
The reported strong winds at Lake Abaya were the result of processes on different scales. Although the two investigated cases are characterized by flows from different directions, they have several characteristics in common. Both events can be classified as a gap flow phenomenon in the GRV, Ethiopia. Gap winds result from a hydraulic response of the flow to changes in terrain height and valley width (e.g. Pan and Smith, 1999). As the flow in the GRV experienced lateral constriction due to a narrowing of the valley width and a rising valley floor, it accelerated and exhibited the typical asymmetric flow structure up- and downstream of the pass. Simulated wind speeds were up to 25 m s−1, which are similar to other gap flows like shallow foehn (Gohm and Mayr, 2004; Haid et al., 2020), shallow bora (Gohm et al., 2008; Grisogono and Belušić, 2009), or taku (Bond et al., 2006). Topographic features like the hill Yegzier Dildiyi between Lake Abaya and Lake Chamo as well as the lateral constriction near the centre of Lake Abaya locally enhanced the gap flow in the target area. The same is true for other regions in the GRV characterized by changes in the valley width and floor height.
Preceding both cases, differential advection of air masses on the two adjacent lowlands established an along-valley pressure gradient and hence an important dynamical driver on the synoptic scale. The colder and more stably stratified air, and therefore the higher pressure, was always on the upstream side. For the north-eastern gap flow, the colder air mass advected into the Afar Triangle upstream of the pass was blocked by the Ethiopian Highlands and piled up over a few days, similar to the cold-air blocking south of the Brenner Pass during shallow foehn in the European Alps (Zängl, 2002). The difference in geopotential height at 800 hPa (i.e. near pass height) over a horizontal distance of more than 700 km between the Afar Triangle and the Turkana Channel exceeded in both cases 30 m for the daily maximum and 15 m for the 24 h average. Hence, this variable may be used as a predictor for forecasting gap winds in the GRV, similar to the large-scale predictors used by Drechsel and Mayr (2008) for forecasting foehn in the Wipp Valley, Austria. Further case studies and a climatological analysis, however, are necessary to prove the applicability of this predictor. Besides the synoptic driver, however, both cases revealed a strong diurnal cycle, which highlights the importance of the thermal forcing due to differential heating over complex terrain. This thermal forcing acted at least on four different scales (e.g. De Wekker and Kossmann, 2015): (1) the two adjacent lowlands (Afar Triangle and Turkana Channel), causing very different CBL growths and enhancing the air mass contrast; (2) the Ethiopian Highlands, representing a plateau that acts as an elevated heat source and/or the GRV representing a basin; (3) the GRV, being a valley with embedded passes and hills inducing valley and slope winds; and last but not least (4) Lake Abaya, inducing lake and land breezes that enhanced or weakened the gap wind or delayed its onset locally. The relative contributions of these forcings could not be disentangled in this study, but it is conceivable that the smaller scales did not determine but only modify the occurrence of gap winds. It is noteworthy that the strongest gap winds in the GRV formed in the late afternoon and night, when daytime convection decayed, indicating that convection may be a delaying mechanism despite its importance for differential heating.
The biggest difference between the two cases of strong winds at Lake Abaya was their time of occurrence. The mature stage of the north-eastern gap flow occurred over Lake Abaya in the night and early morning long after convection had decayed. This is in line with eyewitness reports (Thomas Torora Minda, personal communications, 2020), indicating that the north-easterly winds, the Gidabo winds, occur mainly during nighttime and in the early morning. In contrast, the south-western gap flow was strongest at Lake Abaya in the afternoon and weakened in the night due to partial flow blocking upstream of the pass. However, in the Afar Triangle downstream of the pass, the gap flow broke through in the evening and intensified over the course of the night. Therefore, the timing and intensity of the gap winds in the GRV strongly depend on the region of interest. It is, however, worth mentioning that in both cases the synoptic forcing due to an air mass difference across the GRV was not able to form the gap winds alone. The diurnal forcing was an important supporter, if not a key player, on the larger scale by enhancing the air mass difference due to a different CBL growth but presumably a delayer on a smaller scale due to counteracting valley winds and convection on the lee slope. Hence, this study highlights the complex interactions of different mechanisms on different scales.
Plateau and basin winds could have played dual roles, especially during the investigated north-eastern gap flow. On the one hand, the Ethiopian Highlands could have acted as an elevated heat source. The resulting inflow from the adjacent lowlands in the form of a density current was suppressed until sunset, when convection decayed in the Afar Triangle and the Turkana Channel (cf. Zängl and Gonzalez Chico, 2006). According to Doran and Zhong (2000), a major gap, like the GRV, in the mountain ranges around a basin or in the plateau allows for (intense) inflow already in the afternoon, which was the case for the north-eastern gap flow. The premature and mature states of this inflow are depicted in Fig. 5a and c, respectively. The inflow from the north-east was stronger than from the south-west, presumably because it was superimposed by the dynamically driven flow. On the other hand, the GRV itself could be interpreted as a narrow, elongated basin within a mountain range, similar to the Mexico City basin (Doran and Zhong, 2000). The elevation of the valley floor varies only slightly over a distance of about 170 km (see Fig. 5a between 300 and 470 km). The valley exhibited higher potential temperatures compared to the Afar Triangle north-east as indicated by descending isentropes (Fig. 5a) towards the elevated basin, i.e. the inner part of the GRV. The resulting circulation in Fig. 5a exhibits similarities to the basin and plateau circulation illustrated in Fig. 10 of Doran and Zhong (2000) and Fig. 10 of Zängl and Gonzalez Chico (2006). For the south-western gap flow, plateau winds on the scale of the Ethiopian Highlands may have influenced the gap flow in the valley. Such plateau winds are depicted in Fig. 9b at 2000 m a.m.s.l. by upslope flows over the highlands, resulting in flow convergence at the highest part of the terrain. Basin winds could only have played a counteracting part at the north-eastern valley entrance that delayed the onset of the gap flow in the Afar Triangle. No strong evidence supporting this hypothesis, however, was found. The reversed flow in Fig. 9b at about 38.8∘ E, 8.7∘ N, and in Fig. 10a at x=190 km is associated with outflow of a convective cell.
The effect of the Turkana Jet on the gap flow in the GRV is not fully clear. According to Nicholson (2016) this jet is strongest in the late night and between June and September. On the one hand a partial deflection of the Turkana Jet into the valley may enhance the inflow into the GRV for south-western gap winds, and on the other hand it may limit the southward extent of north-eastern gap winds. Additionally, a connection between the nocturnal low-level jet in north-western Ethiopia and north-easterly gap flows in the GRV are imaginable (cf. similar flow pattern and temperature distribution in Fig. 2a and Fig. 12a in Rife et al., 2010).
Hydraulic theory explains gap winds by a transition from a sub- to a supercritical state (with respect to Froude number) at the narrowest and highest section of the terrain, resulting in a continuous flow descent and acceleration (e.g. Pan and Smith, 1999). This behaviour is indicated for both events by the descending isentropes behind the strongest lateral constriction in the GRV around Lake Ziway, downstream of the pass, and locally at Lake Abaya (e.g. Figs. 5c, 6c, and 10b–c). Applying reduced-gravity shallow-water theory (see Weiß, 2021) supported the expected transition from a sub- to a supercritical flow but is inaccurate due to the ambiguity in determining the channel width and the Froude number for a continuously stratified atmosphere (cf. Durran, 2015).
Comparing the WRF model outputs with the ERA5 reanalysis data showed that the investigated gap flows are represented qualitatively well in the ERA5 model. The ERA5 profiles of pressure, temperature, and wind in Figs. 4 and 8 showed a generally good agreement with the WRF profiles. There are, however, discrepancies in the height of the boundary layer top and especially in the strength of the low-level flow in the valley. The ERA5 winds were weaker (see Figs. 4c and 8c). This is most likely due to the coarser model topography with a smoothed terrain and less steep slopes. For instance, the elevation difference between the pass and Lake Abaya is 500 m in ERA5 and about 900 m in WRF d02. Local flow acceleration by embedded hills (e.g. Yegzier Dildiyi), valley width changes, and inflow from small side valleys are not resolved in ERA5. In contrast to wind speed in the valley, the inflow from the Afar Triangle into the valley for the north-eastern gap flow is nearly identical to the WRF simulation (cf. Fig. 4c).
Finally, it is noteworthy that the underestimation of the gap flow in the GRV in ERA5 agrees with the underestimation of the Turkana Jet recently found by Munday et al. (2022) based on radiosonde observations. Similar to the gap flow in the GRV, the Turkana Jet does not only exhibit a strong diurnal cycle due to the thermal forcing (Munday et al., 2022) but is also affected by synoptic-scale pressure gradients associated with low-level ridging along the East African coast (Vizy and Cook, 2019).
The aim of this study is to reveal the causes and properties of strong winds at Lake Abaya and in the GRV in Ethiopia. Two cases, classified as a north-eastern and a south-western gap flow, were examined in detail based on measurements, ERA5 reanalysis data, and mesoscale simulations conducted with the WRF model. The major findings are as follows:
-
In both cases, strong winds at Lake Abaya were caused by gap flows in the GRV. The valley exhibits a lateral constriction north-east of Lake Ziway and a pass near the city of Hawassa that favour acceleration as the air flows through the valley from the Afar Triangle to the Turkana Channel or vice versa. Maximum wind speed in the WRF model was in both cases about 25 m s−1, however, not directly over the lake surface.
-
Prior to both cases, different air masses were advected north and south of the GRV, respectively, with the colder and more stably stratified air mass on the corresponding upstream side. The differential air mass advection led to the formation of an along-valley pressure gradient. The pressure gradient at the height of the pass (about 2000 m a.m.s.l. or 800 hPa) and its 24 h running mean value turned out to be more suitable for describing the timing of the gap flow than the surface pressure gradient over the lowlands.
-
The strongest gap winds occurred downstream of the pass and the narrowest valley section. For the south-western gap flow Lake Abaya was located upstream of the pass. Nevertheless, in this case acceleration occurred also in the upstream section, and the local winds above Lake Abaya were enhanced by the hill Yegzier Dildiyi and the narrowing valley near the centre of the lake. For the north-eastern gap flow Lake Abaya was located downstream of the pass and hence experienced stronger winds. Over the lee slope between the pass and the lake an atmospheric rotor as well as gravity wave breaking occurred in the simulation.
-
Both cases exhibited a strong dependence on the time of the day, which suggests that the gap winds were not only dynamically driven but were strongly influenced by thermal forcing due to differential heating over complex terrain. However, the relative contribution of these forcings could not be quantified in this study. The onset of the gap flow near the pass happened around sunset for both events. In the target area at Lake Abaya, the strongest wind occurred at night for the north-eastern gap flow and in the afternoon for the south-western gap flow, respectively. This timing was mainly caused by the up- or downstream position of Lake Abaya relative to the pass. Additionally, the north-eastern flow opposed the up-valley wind downstream of the pass during the day, whereas for the south-western case the gap flow pointed in the same direction as the up-valley winds at Lake Abaya.
-
Both events are represented in the ERA5 reanalysis data qualitatively well, but gap winds are weaker in comparison to the WRF simulation.
This work provides first insights into strong winds at Lake Abaya and the GRV based on two case studies. It illustrates that these winds are the result of a complex interplay between different scales and forcings. Future research should focus on compiling a climatology of such gap winds or on developing a simple forecasting tool similar to the approach of Drechsel and Mayr (2008). Given the scarcity of data in this region, ERA5 could be a suitable data set for such studies. Furthermore, clarifying the role of the synoptic, thermal, and topographic drivers could be addressed with numerical sensitivity studies.
The WRF model is described by Skamarock et al. (2019), and its code is publicly available from https://github.com/wrf-model/WRF (University Corporation for Atmospheric Research, 2019). The ERA5 data set is described by Hersbach et al. (2020). The ERA5 data on pressure levels are publicly available from https://doi.org/10.24381/cds.bd0915c6 (Copernicus Climate Change Service, 2018), and the ERA5-Land data are available from https://doi.org/10.24381/cds.e2161bac (Copernicus Climate Change Service, 2019). Observational data and codes for analysis are available on request from the authors.
CIW performed the simulations and the analysis and wrote the manuscript based on his master’s thesis. AG was his main supervisor and contributed equally to the interpretation of results and the finalization of the manuscript. The idea for this study arose on a boat trip on Lake Abaya undertaken by MWR, TTM, and Fassil Teffera (colleague of TTM) during a visit to Arba Minch by MWR. MWR and TTM were co-supervisors of the master's thesis and contributed with proofreading.
The contact author has declared that none of the authors has any competing interests.
Publisher’s note: Copernicus Publications remains neutral with regard to jurisdictional claims in published maps and institutional affiliations.
The installation and operation of the GEMS network were supported by Arba Minch University (AMU), the Institutional University Cooperation (IUC) programme of the office for university cooperation for development (UOS) of the Flemish Interuniversity Council (VLIR), and the Meteorology and Air Quality Group of Wageningen University & Research. Further, we would like to thank Fassil Teffera for sharing his critical observations and knowledge with us. The computational results presented here have been achieved (in part) using the LEO HPC infrastructure of the University of Innsbruck.
This research has been supported by the University of Innsbruck through the employment of Cornelius Immanuel Weiß as a student assistant for writing this paper based on his master's thesis.
This paper was edited by Shira Raveh-Rubin and reviewed by two anonymous referees.
Bond, N. A., Dierking, C. F., and Doyle, J. D.: Research aircraft and wind profiler observations in Gastineau Channel during a Taku wind event, Weather Forecast., 21, 489–501, https://doi.org/10.1175/WAF932.1, 2006. a
Cao, G., Giambelluca, T. W., Stevens, D. E., and Schroeder, T. A.: Inversion variability in the Hawaiian trade wind regime, J. Climate, 20, 1145–1160, https://doi.org/10.1175/JCLI4033.1, 2007. a
Carrillo, J., Guerra, J. C., Cuevas, E., and Barrancos, J.: Characterization of the Marine Boundary Layer and the Trade-Wind Inversion over the Sub-tropical North Atlantic, Bound.-Lay. Meteorol., 158, 311–330, https://doi.org/10.1007/s10546-015-0081-1, 2016. a
Copernicus Climate Change Service (C3S) at ECMWF: ERA5 hourly data on pressure levels from 1959 to present, Copernicus Climate Change Service [data set], https://doi.org/10.24381/cds.bd0915c6, 2018. a
Copernicus Climate Change Service (C3S) at ECMWF: ERA5-Land hourly data from 1950 to present, Copernicus Climate Change Service [data set], https://doi.org/10.24381/cds.e2161bac, 2019. a
De Wekker, S. F. J. and Kossmann, M.: Convective Boundary Layer Heights Over Mountainous Terrain – A Review of Concepts, Front. Earth Sci., 3, 77, https://doi.org/10.3389/feart.2015.00077, 2015. a
Diro, G. T., Black, E., and Grimes, D. I. F.: Seasonal forecasting of Ethiopian spring rains, Meteorol. Appl., 15, 73–83, https://doi.org/10.1002/met.63, 2007. a
Doran, J. C. and Zhong, S.: Thermally driven gap winds into the Mexico City basin, J. Appl. Meteorol., 39, 1330–1340, https://doi.org/10.1175/1520-0450(2000)039<1330:TDGWIT>2.0.CO;2, 2000. a, b, c
Drechsel, S. and Mayr, G. J.: Objective forecasting of Foehn winds for a subgrid-scale alpine valley, Weather Forecast., 23, 205–218, https://doi.org/10.1175/2007WAF2006021.1, 2008. a, b
Durran, D.: MOUNTAIN METEOROLOGY | Downslope Winds, in: Encyclopedia of Atmospheric Sciences (Second Edition), edited by: North, G. R., Pyle, J., and Zhang, F., pp. 69–74, Academic Press, Oxford, second edition edn., https://doi.org/10.1016/B978-0-12-382225-3.00288-7, 2015. a
Gebremariam, B.: Basin Scale Sedimentary and Water Quality: Responses to External Forcing in Lake Abaya, Southern Ethiopian Rift Valley, Ph.D. thesis, Freie Universität Berlin, https://doi.org/10.17169/refubium-11182, 2009. a, b, c, d
Gleixner, S., Keenlyside, N., Viste, E., and Korecha, D.: The El Niño effect on Ethiopian summer rainfall, Clim. Dynam., 49, 1865–1883, https://doi.org/10.1007/s00382-016-3421-z, 2017. a
Gohm, A. and Mayr, G. J.: Hydraulic aspects of föhn winds in an Alpine valley, Q. J. Roy. Meteorol. Soc., 130, 449–480, https://doi.org/10.1256/qj.03.28, 2004. a
Gohm, A., Mayr, G., Fix, A., and Giez, A.: On the onset of bora and the formation of rotors and jumps near a mountain gap, Q. J. Roy. Meteorol. Soc., 134, 21–46, https://doi.org/10.1002/qj.206, 2008. a
Gohm, A., Mayr, G. J., Darby, L. S., and Banta, R. M.: Evolution and structure of a cold front in an Alpine valley as revealed by a Doppler lidar, Q. J. Roy. Meteorol. Soc., 136, 962–977, https://doi.org/10.1002/qj.609, 2010. a
Grisogono, B. and Belušić, D.: A review of recent advances in understanding the meso- and microscale properties of the severe Bora wind, Tellus A, 61, 1–16, https://doi.org/10.1111/j.1600-0870.2008.00369.x, 2009. a
Haid, M., Gohm, A., Umek, L., Ward, H. C., Muschinski, T., Lehner, L., and Rotach, M. W.: Foehn–cold pool interactions in the Inn Valley during PIANO IOP2, Q. J. Roy. Meteorol. Soc., 146, 1232–1263, https://doi.org/10.1002/qj.3735, 2020. a
Haile, A. T., Rientjes, T., Gieske, A., and Gebremichael, M.: Rainfall variability over mountainous and adjacent lake areas: The case of Lake Tana basin at the source of the Blue Nile River, J. Appl. Meteorol. Climatol., 48, 1696–1717, https://doi.org/10.1175/2009JAMC2092.1, 2009. a
Hersbach, H., Bell, B., Berrisford, P., Hirahara, S., Horányi, A., Muñoz-Sabater, J., Nicolas, J., Peubey, C., Radu, R., Schepers, D., Simmons, A., Soci, C., Abdalla, S., Abellan, X., Balsamo, G., Bechtold, P., Biavati, G., Bidlot, J., Bonavita, M., De Chiara, G., Dahlgren, P., Dee, D., Diamantakis, M., Dragani, R., Flemming, J., Forbes, R., Fuentes, M., Geer, A., Haimberger, L., Healy, S., Hogan, R, J., Hólm, E., Janisková, M., Keeley, S., Laloyaux, P., Lopez, P., Lupu, C., Radnoti, G., de Rosnay, P., Rozum, I., Vamborg, F., Villaume, S., and Thépaut, J.-N.: The ERA5 global reanalysis, Q. J. Roy. Meteorol. Soc., 146, 999–2049, https://doi.org/10.1002/qj.3803, 2020. a, b
Hong, S. and Lim, J.: The WRF Single-Moment 6-Class Microphysics Scheme (WSM6), Journal of the Korean Meteorological Society, 42, 129–151, 2006. a
Iacono, M. J., Delamere, J. S., Mlawer, E. J., Shephard, M. W., Clough, S. A., and Collins, W. D.: Radiative forcing by long-lived greenhouse gases: Calculations with the AER radiative transfer models, J. Geophys. Res.-Atmos., 113, 2–9, https://doi.org/10.1029/2008JD009944, 2008. a
Janjic, Z.: Nonsingular Implementation of the Mellor-Yamada Level 2.5 Scheme in the NCEP Meso model, NCEP Office Note, 437, 61, https://repository.library.noaa.gov/view/noaa/11409 (last access: 23 March 2022), 2002. a
Klemp, J. B., Dudhia, J., and Hassiotis, A. D.: An upper gravity-wave absorbing layer for NWP applications, Mon. Weather Rev., 136, 3987–4004, https://doi.org/10.1175/2008MWR2596.1, 2008. a
Korecha, D. and Sorteberg, A.: Validation of operational seasonal rainfall forecast in Ethiopia, Water Resour. Res., 49, 7681–7697, https://doi.org/10.1002/2013WR013760, 2013. a
Kossmann, M. and Sturman, A. P.: Pressure-driven channeling effects in bent valleys, J. Appl. Meteorol., 42, 151–158, https://doi.org/10.1175/1520-0450(2003)042<0151:PDCEIB>2.0.CO;2, 2003. a, b, c
Lemmens, P., Teffera, F. E., Wynants, M., Govaert, L., Deckers, J., Bauer, H., Woldeyes, F., Brendonck, L., Bouillon, S., and Meester, L. D.: Intra- and interspecific niche variation as reconstructed from stable isotopes in two ecologically different Ethiopian Rift Valley lakes, Funct. Ecol., 31, 1482–1492, https://doi.org/10.1111/1365-2435.12852, 2017. a, b
Mengistu, B. B., Unbushe, D., and Abebe, E.: Invasion of Water Hyacinth (Eichhornia crassipes) Is Associated with Decline in Macrophyte Biodiversity in an Ethiopian Rift-Valley Lake-Abaya, Open J. Ecol., 07, 667–681, https://doi.org/10.4236/oje.2017.713046, 2017. a
Minda, T. T.: Weather and crop dynamics in a complex terrain, the Gamo Highlands – Ethiopia: Towards a high-resolution and model-observation based approach, Ph.D. thesis, Wageningen University, https://doi.org/10.18174/497431 (last access: 23 March 2022), 2019. a, b
Minda, T. T., van der Molen, M. K., Heusinkveld, B. G., Struik, P. C., and de Arellano, J. V. G.: Observational characterization of the synoptic and mesoscale circulations in relation to crop dynamics: Belg 2017 in the Gamo Highlands, Ethiopia, Atmosphere, 9, 398, https://doi.org/10.3390/atmos9100398, 2018a. a, b, c
Minda, T. T., van der Molen, M. K., Struik, P. C., Combe, M., Jiménez, P. A., Khan, M. S., and de Arellano, J. V. G.: The combined effect of elevation and meteorology on potato crop dynamics: A 10-year study in the Gamo Highlands, Ethiopia, Agr. Forest Meteorol., 262, 166–177, https://doi.org/10.1016/j.agrformet.2018.07.009, 2018b. a
Munday, C., Engelstaedter, S., Ouma, G., Ogutu, G., Olago, D., Ong’ech, D., Lees, T., Wanguba, B., Nkatha, R., Ogalo, C., Gàlgalo, R. A., Dokata, A. J., Kirui, E., Hope, R., and Washington, R.: Observations of the Turkana Jet and the East African dry tropics: the RIFTJet field campaign, B. Am. Meteorol. Soc., 103, E1828–E1842, https://doi.org/10.1175/BAMS-D-21-0214.1, 2022. a, b, c
Nakanishi, M. and Niino, H.: Development of an improved turbulence closure model for the atmospheric boundary layer, J. Meteorol. Soc. Japan, 87, 895–912, https://doi.org/10.2151/jmsj.87.895, 2009. a
Nicholson, S.: The Turkana low-level jet: Mean climatology and association with regional aridity, Int. J. Climatol., 36, 2598–2614, https://doi.org/10.1002/joc.4515, 2016. a, b
Pan, F. and Smith, R. B.: Gap Winds and Wakes: SAR Observations and Numerical Simulations, J. Atmos. Sci., 56, 905–923, https://doi.org/10.1175/1520-0469(1999)056<0905:GWAWSO>2.0.CO;2, 1999. a, b, c
Park, S. H., Klemp, J. B., and Kim, J. H.: Hybrid mass coordinate in WRF-ARW and its impact on upper-level turbulence forecasting, Mon. Weather Rev., 147, 971–985, https://doi.org/10.1175/MWR-D-18-0334.1, 2019. a
Rife, D. L., Pinto, J. O., Monaghan, A. J., Davis, C. A., and Hannan, J. R.: Global Distribution and Characteristics of Diurnally Varying Low-Level Jets, J. Climate, 23, 5041–5064, https://doi.org/10.1175/2010JCLI3514.1, 2010. a
Scheffer, M.: Ecology of Shallow Lakes, Springer Netherlands, https://doi.org/10.1007/978-1-4020-3154-0, 2004. a
Sjoukje, P., Kew, S. F., van Oldenborgh, G. J., Otto, F., O'Keefe, S., Haustein, K., King, A., Zegeye, A., Eshetu, Z., Hailemariam, K., Singh, R., Jjemba, E., Funk, C., and Cullen, H.: Attribution analysis of the Ethiopian drought of 2015, J. Climate, 31, 2465–2486, https://doi.org/10.1175/JCLI-D-17-0274.1, 2018. a
Skamarock, W., Klemp, J., Dudhia, J., Gill, D., Zhiquan, L., Berner, J., Wang, W., Powers, J., Duda, M. G., Barker, D. M., and Huang, X.-Y.: A Description of the Advanced Research WRF Model Version 4.1, NCAR Technical Note NCAR/TN-556+STR, p. 145, https://doi.org/10.5065/1dfh-6p97, 2019. a, b
Teffera, F. E.: The ecology of the major Ethiopian Rift Valley lakes Abaya and Chamo, with special reference to water quality and food web structure, Ph.D. thesis, KU Leuven, https://limo.libis.be/primo-explore/fulldisplay?docid=LIRIAS1706016&context=L&vid=Lirias (last access: 23 March 2022), 2016. a
Teffera, F. E., Lemmens, P., Deriemaecker, A., Brendonck, L., Dondeyne, S., Deckers, J., Bauer, H., Gamo, F. W., and Meester, L. D.: A call to action: strong long-term limnological changes in the two largest Ethiopian Rift Valley lakes, Abaya and Chamo, Inland Waters, 7, 129–137, https://doi.org/10.1080/20442041.2017.1301309, 2017. a, b
Tewari, M., Chen, F., Wang, W., Dudhia, J., LeMone, M. A., Mitchell, K., Ek, M., Gayno, G., Wegiel, J., and Cuenca, R. H.: Implementation and verification of the unified noah land surface model in the WRF model[presentation], in: 20th Conference on Weather Analysis and Forecasting/16th Conference on Numerical Weather Prediction, pp. 11–15, http://n2t.net/ark:/85065/d7fb523p (last access: 23 March 2022), 2004. a
University Corporation for Atmospheric Research: The Weather Research and Forecasting Model, University Corporation for Atmospheric Research [code], https://github.com/wrf-model/WRF (last access: 17 August 2022), 2019. a
Vizy, E. K. and Cook, K. H.: Observed relationship between the Turkana low-level jet and boreal summer convection, Clim. Dynam., 53, 4037–4058, https://doi.org/10.1007/s00382-019-04769-2, 2019. a
Weiß, C.: Dynamics of Gap Winds in the Great Rift Valley, Ethiopia: Emphasis on Strong Winds at Lake Abaya, Master's thesis, University of Innsbruck, https://resolver.obvsg.at/urn:nbn:at:at-ubi:1-96956 (last access: 25 June 2022), 2021. a, b
Yu, X. and Lee, T. Y.: Role of convective parameterization in simulations of a convection band at grey-zone resolutions, Tellus A, 62, 617–632, https://doi.org/10.1111/j.1600-0870.2010.00470.x, 2010. a
Zekarias, T., Govindu, V., Kebede, Y., and Gelaw, A.: Degradation of wetlands and livelihood benefits of Lake Abaya-Chamo wetland, southern Ethiopia, Current Research in Environmental Sustainability, 3, 100060, https://doi.org/10.1016/j.crsust.2021.100060, 2021. a
Zinabu, G. M., Kebede-Westhead, E., and Desta, Z.: Long-term changes in chemical features of waters of seven Ethiopian rift-valley lakes, Hydrobiologia, 477, 81–91, https://doi.org/10.1023/A:1021061015788, 2002. a
Zängl, G.: Idealized numerical simulations of shallow föhn, Q. J. Roy. Meteorol. Soc., 128, 431–450, https://doi.org/10.1256/003590002321042045, 2002. a
Zängl, G. and Gonzalez Chico, S.: The thermal circulation of a grand plateau: Sensitivity to the height, width, and shape of the plateau, Mon. Weather Rev., 134, 2581–2600, https://doi.org/10.1175/MWR3207.1, 2006. a, b
Thomas Minda (meteorologist) and Fassil Teffera (aquatic ecologist), both from Arba Minch University.