the Creative Commons Attribution 4.0 License.
the Creative Commons Attribution 4.0 License.
 | 14 Jun 2022
Metrics of the Hadley circulation strength and associated circulation trends
Matic Pikovnik
Žiga Zaplotnik
Lina Boljka
Nedjeljka Žagar
This study compares trends in the Hadley cell (HC) strength using different metrics applied to the ECMWF ERA5 and ERA-Interim reanalyses for the period 1979–2018. The HC strength is commonly evaluated by metrics derived from the mass-weighted zonal-mean stream function in isobaric coordinates. Other metrics include the upper tropospheric velocity potential, the vertical velocity in the mid-troposphere, and the water vapour transport in the lower troposphere. Seven known metrics of HC strength are complemented here by a metric of the spatially averaged HC strength, obtained by averaging the stream function in the latitude–pressure (φ–p) plane, and by the total energy of zonal-mean unbalanced circulation in the normal-mode function decomposition. It is shown that metrics, which rely on single-point values in the φ–p plane, produce unreliable 40-year trends in both the northern and southern HCs, especially in ERA-Interim; magnitudes and even the signs of the trends depend on the choice of the HC strength metric. The two new metrics alleviate the vertical and meridional inhomogeneities of the trends in HC strength. The unbalanced energy metric suggests a positive HC trend in both reanalyses, whereas the metric based on averaging the stream function finds a significant positive trend only in ERA5.
- Article
(10038 KB) - Full-text XML
- BibTeX
- EndNote


The Hadley circulation is a thermally forced overturning circulation consisting of two symmetrical cells, which span between the tropics and the subtropics. Each cell consists of the ascending branch in the deep tropics, which is associated with enhanced precipitation, poleward upper tropospheric flow, and the descending motion in the subtropics that suppresses rainfall. The cell is completed by a frictional return flow in the lower troposphere. Therefore, potential changes in the Hadley cells (HCs), either to their strength or their meridional extent, will have a profound impact on the global hydrological cycle (Held and Soden, 2006; Burls and Fedorov, 2017) and the biosphere, particularly in the subtropics. For example, the subsidence region has already become drier, partly because of the enhanced descending motion, in line with the satellite observations of upper tropospheric humidity and total water vapour (Sohn and Park, 2010).
Several studies of HC strength using reanalyses suggested strengthening of both the northern Hadley cell (NHC) and southern Hadley cell (SHC) in recent decades. However, the reported magnitude and uncertainty of the trends differ (Tanaka et al., 2004; Mitas and Clement, 2005; Stachnik and Schumacher, 2011; Nguyen et al., 2013; Chemke and Polvani, 2019). This is, alongside differences among reanalysis datasets (e.g. different resolutions and use of observations), study periods used and multidecadal variability (IPCC, 2021; Zaplotnik et al., 2022), partly due to a variety of metrics that have been used to define HC strength.
The majority of studies describe the HC by the mass-weighted zonal-mean stream function ψ in the latitude–pressure (φ–p) plane (Oort and Yienger, 1996). The ψ function is computed by the vertical integration of the zonal-mean meridional wind as
where [v] is the zonal- and annual/seasonal-mean meridional wind, R is earth's radius, g is gravity, φ is latitude, and p is pressure. Several metrics of HC strength based on single-point values (maxima or minima) of ψ(φ,p) have been used:
-
the maximum (minimum) values of ψ in the φ–p plane (e.g. Mitas and Clement, 2005; Stachnik and Schumacher, 2011; D’Agostino and Lionello, 2017);
-
the maximum (minimum) value of ψ at some selected pressure level, e.g. 500 hPa (e.g. Kang et al., 2013; Son et al., 2018; Chemke and Polvani, 2019; Mathew and Kumar, 2019; Menzel et al., 2019);
-
the vertical average of the maxima (minima) of ψ at different pressure levels in the troposphere (e.g. in the layer 200–900 hPa, as in Nguyen et al., 2013).
The strength of the overall Hadley circulation can also be evaluated using the velocity potential in the upper branch of the HC (located in the upper troposphere). The meridional divergent flow is strongest there, which is associated with the maximal upward motions in the layer beneath (Tanaka et al., 2004). Related to this, the Hadley circulation strength can also be defined by the maximum ascent at some predefined mid-tropospheric level (Wang, 2002).
In the past few years, several studies have compared different metrics of the tropical expansion (e.g. Solomon et al., 2016; Adam et al., 2018; Staten et al., 2018; Waugh et al., 2018). In contrast, the Hadley circulation strength has only been compared between different reanalyses and climate models (e.g. Stachnik and Schumacher, 2011; Chemke and Polvani, 2019). No study (to our knowledge) has yet compared different metrics of HC strength in the same dataset. Therefore, in this study, we perform such an inter-comparison of HC metrics and we assess how the trends estimated by different metrics compare with each other in the ERA5 and ERA-Interim reanalyses. We assess the sensitivity of the trends derived from the stream-function-based metrics in isobaric coordinates (Eq. 1) to the choice of the pressure level. Motivated by uncertainties in the results based on different metrics, we propose two alternative metrics of HC strength: (1) a stream-function-based metric of spatially averaged HC strength; and (2) an energy metric defined as the total energy of the zonally averaged unbalanced circulation, to which the HC is the main contributor. The first metric is similar to the existing metrics and grasps the overall trends in each HC, whereas the second new metric is a holistic approach that can be coupled to the global energy cycle but a priori does not distinguish between the NHC and SHC. Here the term “unbalanced” denotes circulation that projects on the inertia–gravity (or non-Rossby) eigensolutions of the primitive equations (e.g. Žagar and Tribbia, 2020).
The paper is organized as follows: Section 2 describes the data and methods including definitions of various metrics. The metrics are compared in Sect. 3. Discussion and conclusions are given in Sect. 4.
2.1 Reanalysis data
Two modern ECMWF reanalyses are analysed: ERA5 (Hersbach et al., 2020, 2018) and ERA-Interim (Dee et al., 2011). Forty years (1979–2018) of daily data at 00:00 UTC are used. Meridional wind (v), zonal wind (u), specific humidity (q), and vertical velocity (ω) data are provided on 37 pressure levels between 50∘ S and 50∘ N on a latitude–longitude grid with 1∘ resolution for both reanalyses. Among these levels, 23 are between 1000 and 200 hPa.
A new, energy-based metric is a product of a multivariate normal-mode function decomposition and it requires both wind components and a pseudo-geopotential field that combines the hydrostatic geopotential and the mean sea level pressure term (see Sect. 2.2). Input data are in this case monthly mean fields on the regular Gaussian grid F80 with 1.125∘ horizontal resolution and 137 hybrid model levels for ERA5, and 60 vertical levels for ERA-Interim.
ERA5 has a higher model resolution than ERA-Interim (0.3∘ compared with 1∘, respectively). It also has an improved dynamical core and more detailed model physics (Hersbach et al., 2020). Advanced data assimilation procedures and new observation operators allow ERA5 to assimilate five times more data than ERA-Interim. The radiative forcing depends on the long-term changes in the concentration of greenhouse gases and aerosols. The atmospheric model in ERA5 is forced by the state-of-the-art sea surface temperature (SST) and sea ice concentration (SIC) data; thus, it is able to capture the low-frequency variability in the climate system better. Collectively, these upgrades result in a better agreement with the observations of tropospheric temperature, wind, humidity, and precipitation (Simmons, 2022). Furthermore, the accuracy of the HC estimation is boosted significantly by the reduced surface meridional wind and horizontal wind divergence bias over the oceans (Belmonte Rivas and Stoffelen, 2019). Based on the above factors, we consider ERA5 a more reliable dataset.
2.2 Metrics of Hadley cell strength
The trends and their uncertainties are compared for several metrics of HC strength:
-
Maximum (minimum) of annual/seasonal-mean stream function between 40∘ S and 40∘ N, and between 200 and 900 hPa, denoted ψmax (ψmin). Slightly different boundaries were employed by Mitas and Clement (2005), Stachnik and Schumacher (2011), and D’Agostino and Lionello (2017); however, a reasonable choice of boundaries (e.g. excluding the lower part of the boundary layer and the stratosphere) does not affect the results.
-
Maximum (minimum) of annual/seasonal-mean stream function at predefined pressure levels (e.g. 400, 500 hPa etc.) within 40∘ S and 40∘ N, denoted ψmax(p) (or ψmin(p)); as used in, for example, Kang et al. (2013), Chemke and Polvani (2019), and Menzel et al. (2019).
-
Stream function value at the location of climatological (1979–2018) annual/seasonal-mean maximum (minimum) of the NHC (SHC) strength, , where , and analogous for .
-
An average of maximum (minimum) values of annual/seasonal-mean ψ over pressure levels between, for example, 200 and 900 hPa, with a constant step size of 50 hPa, as in Nguyen et al. (2013):
and analogous for .
-
Maximum of the zonal-mean velocity potential Φmax(p) at some predefined pressure level p, typically in the upper troposphere, e.g. at 200 hPa (Tanaka et al., 2004). The velocity potential is related to the horizontal wind divergence as .
-
Minimum of the zonal-mean vertical (pressure) velocity ωmin(p), i.e. maximum ascent, at some predefined pressure level p, typically in the mid-troposphere, e.g. at 500 hPa (Wang, 2002), or a minimum ω within the tropical troposphere (ωmin).
-
Spatially averaged HC strength, which is obtained by spatially averaging the stream-function field in the latitude–pressure plane. For the NHC, it yields
where ψ is uniformly sampled latitudinally, and vertically with a 50 hPa step. Wide latitudinal boundaries ensure that the Hadley cell is fully contained in every season (as shown in Fig. 1). An analogous metric ψSHC is defined for the southern Hadley cell but with conditions ψ<0 and meridional boundaries within . An example of spatial averaging is shown in Fig. A2.
-
Effective wind for water vapour transport (Sohn and Park, 2010):
The atmospheric column is divided into N layers in Eq. (4). In each layer i which spans from pressure level pi to , the amount of precipitable water is , where ρw is density of liquid water. The total precipitable water in the atmospheric column is . Standard notations are used: g is acceleration of gravity, q is specific humidity, vD stands for divergent (irrotational) wind component, and ps is surface pressure. The metric partially removes the influence of the change in total column water vapour (thermodynamic impact of warming climate) on water vapour transport.
-
An energy-based metric IM, which is defined as the total energy of the zonal-mean unbalanced circulation. Unbalanced circulation is derived using the normal-mode function decomposition and it corresponds to the circulation projecting onto the inertia–gravity eigensolutions (or IG modes) of the linearized primitive equations (Žagar et al., 2017). The projection of global geopotential and wind fields from reanalyses onto the normal-mode functions provides time series of the complex expansion coefficients defined by the zonal wavenumber k, vertical mode index m, and meridional mode index n for each IG and Rossby eigenmode. The IG modes of the mean zonal state (k=0) are used to compute the total (kinetic plus available potential) energy as
where denotes the absolute value. For every vertical eigenmode m, Dm denotes the associated eigenvalue known as the equivalent depth (e.g. Žagar et al., 2015, their Fig. 4), such that , where M is the maximal vertical wave number. Every combination defines a single component of the Hough harmonics expansion and the coupling between the geopotential height and winds. The amplitude of Dm defines the meridional scale of the modes that is associated with the radius of deformation on the equatorial β−plane, , where , and Ω is earth's angular velocity. Higher modes with smaller equivalent depths correspond to stronger equatorial trapping, e.g. the trapping scale is roughly 17∘ for D7=708 m. With all vertical and meridional modes included, the mean unbalanced circulation resides mainly within the tropics, and to a small extent near the major orographic features in the extratropics and in the polar winter stratosphere, as shown in Žagar et al. (2015, their Fig. 10). For details on the derivation and application of normal-mode functions the reader is referred to Žagar and Tribbia (2020). Two figures in the Appendix illustrate the new metric. First, Fig. A3 shows the unbalanced circulation at 200 hPa level for four seasons illustrating that its seasonal march across the equator resembles the Hadley cell. Figure A4 confirms that the Hadley circulation is well represented by our new metric.
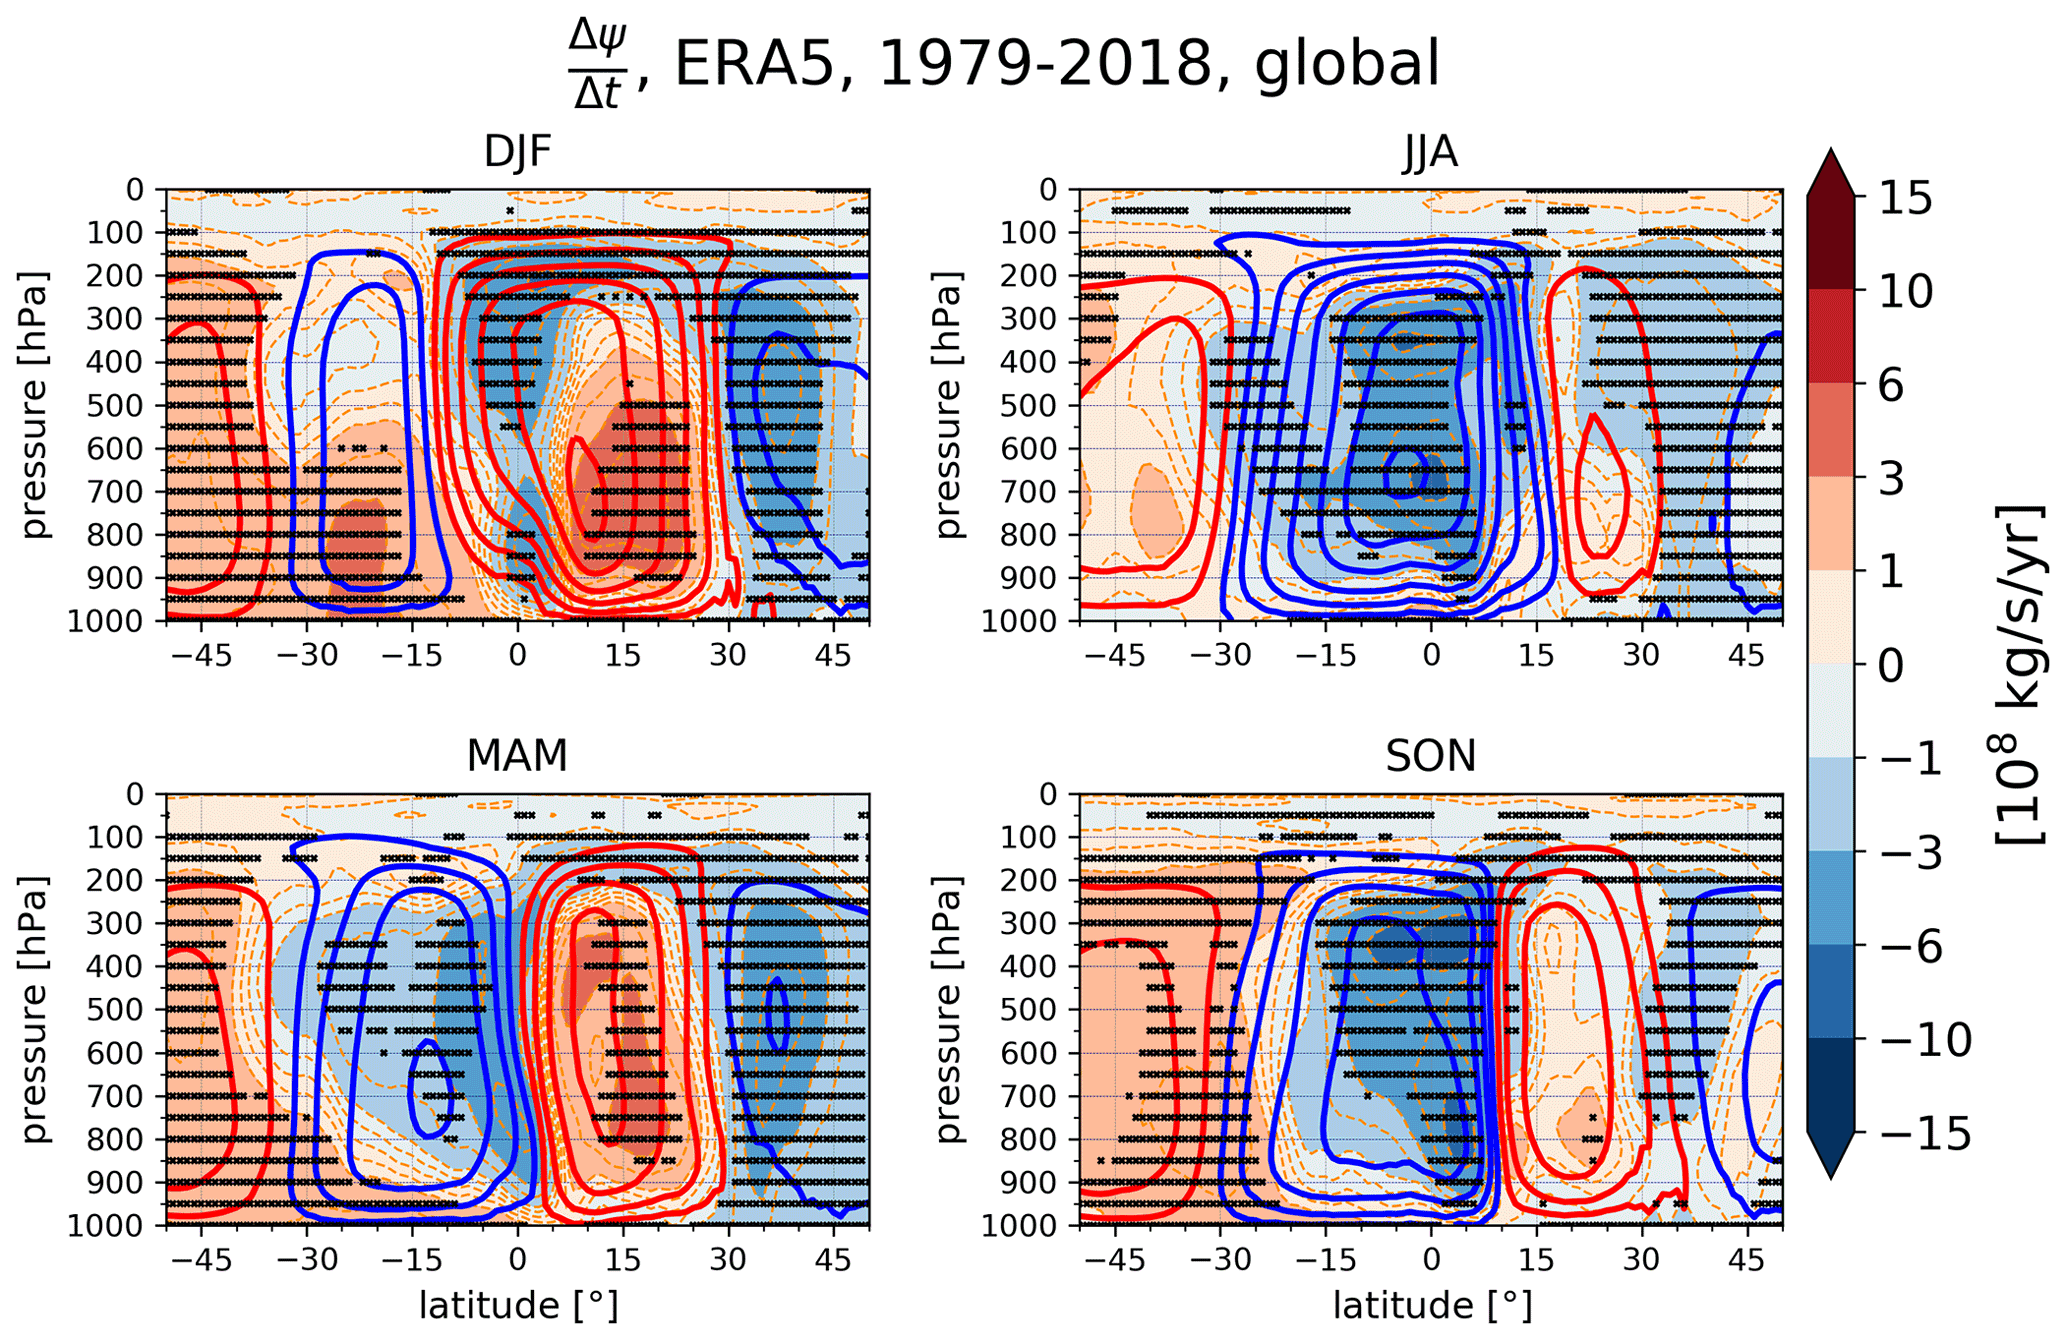
Figure 1Seasonal-mean climatology of Hadley circulation (red and blue contours) and its trends (shading) in ERA5 reanalysis between 1979 and 2018. Red contours indicate positive climatological stream-function values, i.e. kg s−1 and blue contours their negative equivalents, i.e. kg s−1. Crosses indicate the statistically significant trends at the 95 % confidence level. Note that the overlapping of contours and shading of the same colour indicates strengthening of the cell, while overlapping of different colours indicates cell weakening.
The described metrics have different properties. Metrics (1)–(4), (7), and (8) distinguish between the two Hadley cells, whereas metrics (5), (6), and (9) do not. Metrics (1)–(3) are sensitive to the vertical inhomogeneities in the strength of the Hadley cell by definition. Metric (8) describes only the return flow of the Hadley circulation in the lower troposphere. Metric (4) averages over the vertical, but not the meridional, inhomogeneity. Metrics (5) and (6) only describe the ascending branch of the Hadley circulation. New metric (7) alleviates the sensitivity to the spatial (meridional and vertical) inhomogeneities by spatial averaging. The same applies to the new metric (9), which is a global metric largely different from all other metrics and applied here without any special tuning. Metrics (8) and (9) include nonlinear terms (Eqs. 4, 5); therefore, the metrics are sensitive to the temporal averaging of the input data (e.g. hourly means, daily means, and monthly means of daily means). In this study, monthly means are used for metric (8), consistent with Sohn and Park (2010), whereas metric (9) uses monthly means due to computational complexity.
In the following section, we explore the sensitivity of the trends to different metrics of HC strength.
3.1 Mean HC and its trend
Trends are evaluated from the time series of ψ for different single-point values ψ(φ,p) as linear regression coefficients. The trends are considered significant if they pass the 95 % threshold of the modified Mann–Kendall test using the trend-free pre-whitening method to eliminate the impact of serial autocorrelation (Yue and Wang, 2002; Hussain and Mahmud, 2019). Note that the trends presented in this study are only representative of the analysed 40-year period and that we do not evaluate the extent to which they represent a climate-change signal. A separate study (Zaplotnik et al., 2022) addresses this question and its results suggest that a part of the recent 40-year trend in HC strength may be due to the multidecadal variability.
Figure 1 shows climatological seasonal-mean stream function and its pointwise trends in the ERA5 reanalysis between 1979 and 2018. A significant enhancement in the winter cells can be observed: the northern Hadley cell (NHC; red contours) strengthens most in December–January–February (DJF), whereas the southern Hadley cell (SHC; blue contours) strengthens most in June–July–August (JJA). Both cells are strengthening between March and May (MAM). Note that trends in the seasonal-mean HC strength are spatially inhomogeneous across the cells, both meridionally and vertically. For example, in the winter NHC (DJF), the lower tropospheric part of the descending branch is mostly strengthening, while the ascending branch of the cell in the deep tropics is weakening. From September to November (SON), the SHC exhibits significant strengthening in the ascending branch in the Inter-Tropical Convergence Zone, while its descending branch mostly shows insignificant strengthening or weakening, and even significant weakening at the southern boundary of the cell. The inhomogeneities in trends are even more pronounced in the ERA-Interim reanalysis (Fig. A1); for example, vertical inhomogeneity in the SHC trend in MAM, JJA, and SON is especially pronounced in the regions of the strongest ψ gradients. The presence of the inhomogeneities in the HC trends raises a question about the reliability of some of the trends derived from single-point metrics of HC strength.
3.2 Comparison of the stream-function metrics
The sensitivity of the trends in the annual-mean and seasonal-mean HC strength to the stream-function metrics (1)–(4) and (7), described in Sect. 2.2, is shown in Fig. 2 for ERA5 and in Fig. A5 for ERA-Interim. In both reanalyses, large differences are observed between the trends in ψmax(p) at distinct pressure levels p (metric 2). In ERA5, the multiyear trend in the annual-mean NHC (leftmost column in Fig. 2a) is 0.7 × 10⁸ kg s−1 yr−1 at 400 hPa and 2.2 × 10⁸ kg s−1 yr−1 at 800 hPa. For the SHC (Fig. 2b), ψmin(p) strengthens by 0.9 × 10⁸ kg s−1 yr−1 at 800 hPa and by 2.8 × 10⁸ kg s−1 yr−1 at 400 hPa. In ERA-Interim, the NHC exhibits even differences in the sign of trends (leftmost major column in Fig. A5a); a strengthening trend of 1.9×10⁸ kg s−1 yr−1 is present at 700 hPa and an insignificant weakening trend of kg s−1 yr−1 at 400 hPa. The SHC has an insignificant trend in the annual-mean HC in the lower troposphere and a significant weakening of up to kg s−1 yr−1 in the upper troposphere (leftmost major column in Fig. A5b), i.e. opposite to what ERA5 shows.
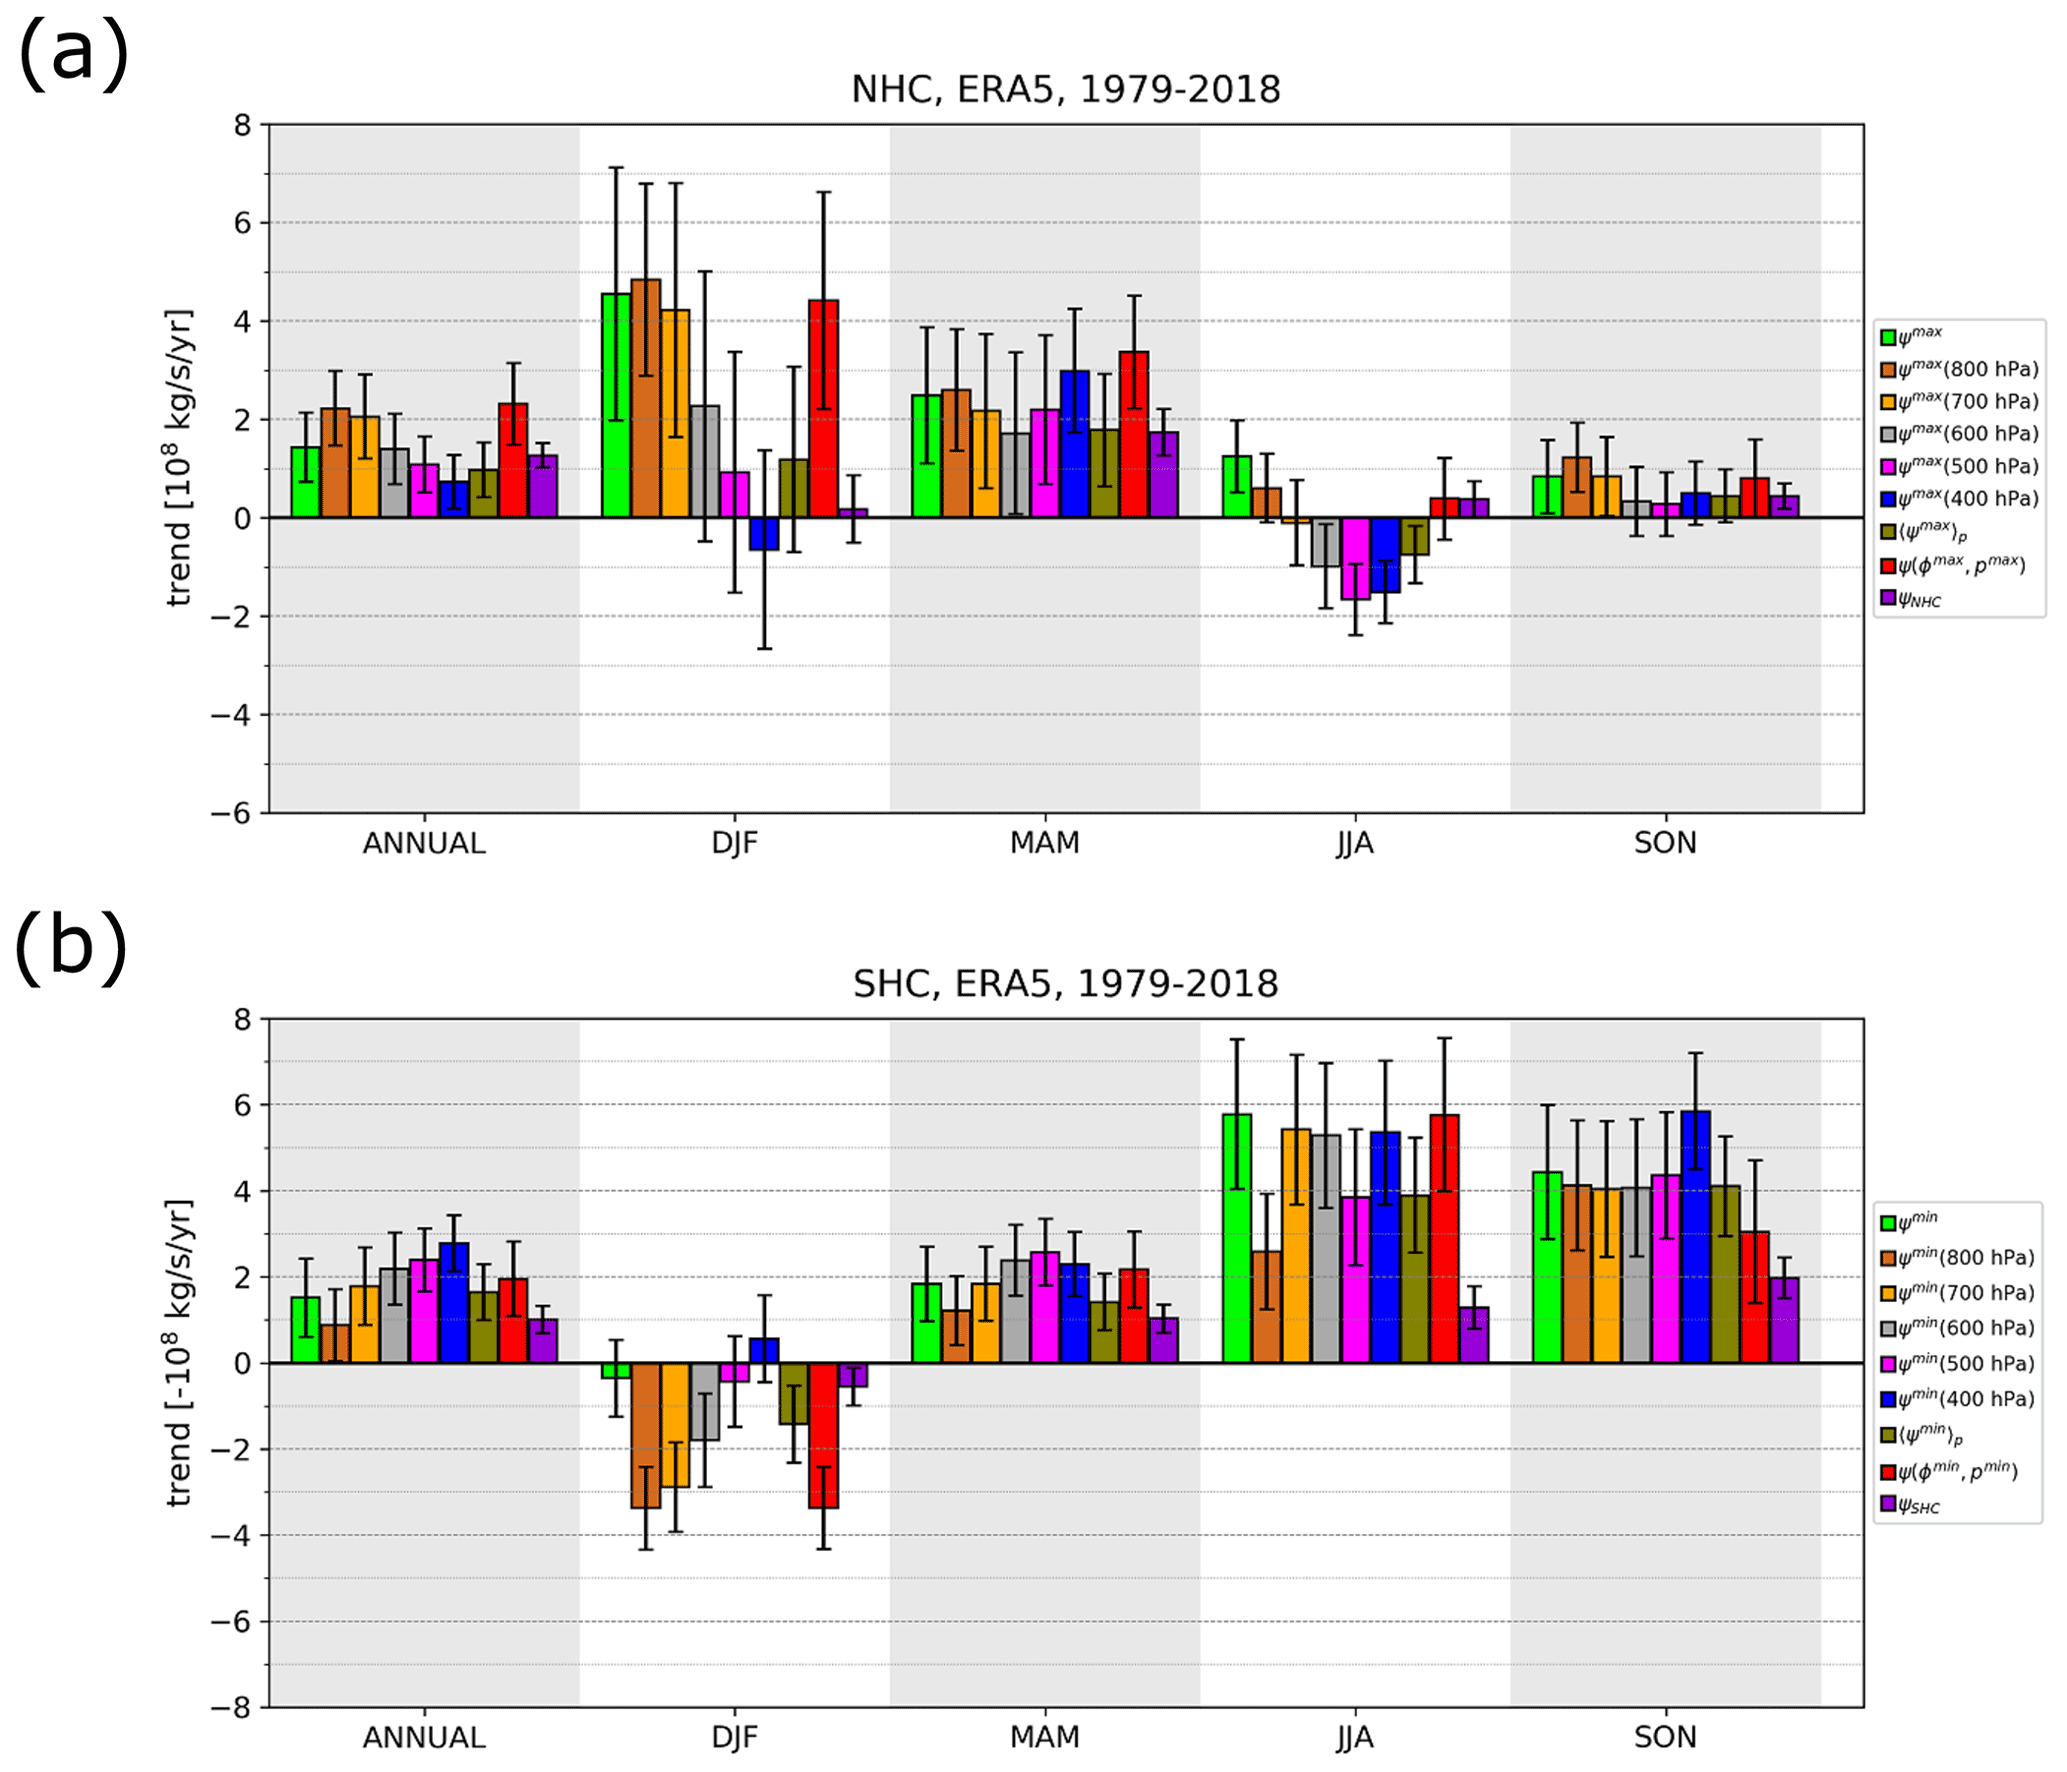
Figure 2Trends in NHC strength (a) and SHC strength (b) in ERA5 reanalysis between 1979 and 2018 for different stream-function metrics from Sect. 2.2. Annual-mean trends in HC strength are shown in the first column, while seasonal-mean trends are shown in the other columns (as labelled). Different metrics of HC strength are shown in the legend, e.g. in (a) for the NHC: ψmax denotes annual/seasonal stream-function maximum (metric 1), ψmax at 400, 500 hPa etc. denotes annual/seasonal stream-function maximum at respective pressure level (metric 2), and denotes that the trends are measured at the point of the maximum stream function in a multiyear average of NHC strength (metric 3). denotes vertically averaged ψmax between 200 and 900 hPa (metric 4, Eq. 2) and ψNHC denotes the average stream-function metric (7), Eq. (3). Analogous notations are used for the stream-function minimum for the SHC in (b). Note that values in (b) are multiplied by (−1); thus, positive values in both (a) and (b) indicate strengthening of the cell. Black error bars indicate the standard error of the trend estimates.
The differences between trends in seasonal-means at different pressure levels are even larger. For example, the winter NHC exhibits a large and significant strengthening in the lower troposphere (700–800 hPa) with trends around 4.5×10⁸ kg s−1 yr−1 in both ERA5 (Fig. 2a) and ERA-Interim (Fig. A5a); however, the trends in the mid-troposphere (400–500 hPa) are mostly negative and/or insignificant. Different magnitudes of the trends at distinct pressure levels can partly be explained by the differences in the climatological mean magnitude of HC strength at different pressure levels. Normalization accounts for some of these differences; normalized results are discussed below at the end of Sect. 3.2 (see Fig. 4).
The differences in the trends in seasonal-means at various pressure levels point towards the unreliability of the trend. Furthermore, magnitudes of the differences between metrics are of the same order as the uncertainties of the derived trends for individual metrics. Thus, by measuring the maximum HC strength at a selected pressure level, e.g. 500 hPa (as in metric 2), the estimated trends are affected by the limitation of the metric.
Another notable feature of Figs. 2b and A5b is a significant difference between the trends in the annual-mean SHC strength in ERA5 and ERA-Interim reanalyses: the SHC is strengthening in ERA5 but weakening in ERA-Interim. In JJA and SON, the SHC is strengthening in both reanalyses by the majority of metrics, while in MAM, SHC is weakening in ERA-Interim and strengthening in ERA5. The reasons for such discrepancies are likely in the data assimilation modelling and treatment of observations, and are therefore beyond the scope of this study.
Metric (1) exhibits significant year-to-year variability in the levels of ψmax, observed also by Mitas and Clement (2005). ψmax is switching between 350 and 700 hPa levels in ERA5, and between 400 and 650 hPa levels in ERA-Interim (Fig. A7, magenta and red lines). In contrast, the level of ψmin remains roughly the same (700–750 hPa, blue and orange lines in Fig. A7) in both reanalyses throughout the studied period. Metric (1) also sometimes produces anomalous trends especially in the seasonal data, which do not align with any of the other metrics (e.g. in ERA5 NHC in JJA).
Metric (2) is sensitive to the vertical inhomogeneity of the trend in HC strength (as seen from ψ at different levels in Figs. 2, A5). Metric (3) evaluates each Hadley cell in a spatially fixed point throughout the observed period (1979–2018 in our study). Thus, we expect it to be susceptible to potential meridional shifts of the mean Hadley circulation (Grise and Davis, 2020) or vertical shifts due to vertically expanding tropical troposphere (Hu and Vallis, 2019). As a single-point metric, it also suffers from spatial inhomogeneity of the trend in HC strength, similarly to metrics (1) and (2).
Vertically averaged maximum and minimum values of ψ as in metric (4) reduce the discrepancies associated with the varying pressure levels of stream-function maxima and minima. Metric (4) also averages out the differences between the trends at different pressure levels, as well as the uncertainty due to the choice of the pressure level in metric (2). However, Fig. 1 also reveals significant trend inhomogeneities in the meridional direction, e.g. between the ascending and the descending branches of the Hadley circulation, which are addressed by the average stream-function metric (7) (i.e. by adding a meridional average).
The HC strength measured by metric (7) is on average weaker than in other ψ-based metrics as spatial averaging leads to a smaller magnitude of ψ (not shown). Consequently, the trends are smaller (Figs. 2, A5, rightmost violet bar in each major column). When trends are spatially more homogeneous, metric (7) exhibits relatively smaller uncertainties than the other metrics (e.g. trends in seasonal means of the NHC in MAM, ERA5; Figs. 1 and 2a), and conversely for spatially less homogeneous trends (e.g. trends in seasonal-means of the NHC in JJA, ERA5; Figs. 1 and 2a). The average stream-function metric (7) thus provides an average over “extreme” local HC strength metrics (1)–(4), as well as an overall uncertainty. Figures 2 and A5 reflect the stronger year-to-year variability in seasonal means (compared with year-to-year variability in annual means), as well as larger discrepancies between ψ metrics at different levels (as also seen from Figs. 1, A1). However, from here on, we limit the analysis only to the trends (and variability) of the annual-mean Hadley circulation.
3.3 Comparison of stream-function metrics with other metrics
The time series X(t) of metrics with different units and different mean magnitudes can be compared after their normalization by their respective climatological value of the 1979–2018 period (denoted ). Results are shown in Fig. 3 for ERA5 reanalysis, including the normalized time series of stream function (ψ) metrics (1)–(4) and (7), velocity-potential (Φ) metric (5), pressure–velocity (ω) metric (6), water vapour transport metric (8), and the unbalanced energy metric (9). Figure 4 and Table 1 present the trends in the normalized time series, i.e. the relative trends in percentages per year, whereas Fig. 5 shows the correlations between the time series of HC strength derived from different metrics.

Figure 3Time series of NHC strength (a) and SHC strength (b) in ERA5 reanalysis between 1979 and 2018 for different metrics from Sect. 2.2. Time series are normalized by their 1979–2018 climatological mean. Different stream-function metrics of HC strength are shown in the legend (in grey colours), e.g. in (a) for the NHC: ψmax denotes the annual/seasonal stream-function maximum (metric 1); ψmax at 800, 700, 600 hPa etc. denotes the annual/seasonal stream-function maximum at respective pressure level (metric 2); denotes that HC strength is measured at the point of the maximum stream function in a multiyear average of NHC strength (metric 3); denotes the vertically averaged ψmax between 200 and 900 hPa (metric 4, Eq. 2); ψNHC denotes the average stream-function metric (7); and denotes effective wind for the lower tropospheric water vapour transport (metric 8, blue colour). Analogous notations are used for the SHC in (b). The following metrics do not distinguish between the two Hadley cells, but describe the Hadley circulation as a whole (their time series are thus the same for the NHC in a and SHC in b): Φmax(p) denotes the maximum of the zonal-mean velocity potential at different pressure levels (metric 5, violet colours); ωmin(p) denotes the minimum of the zonal-mean vertical velocity (metric 6, orange colours); and IM denotes the normal-modes-based metric of the Hadley circulation (metric 9, red colour).
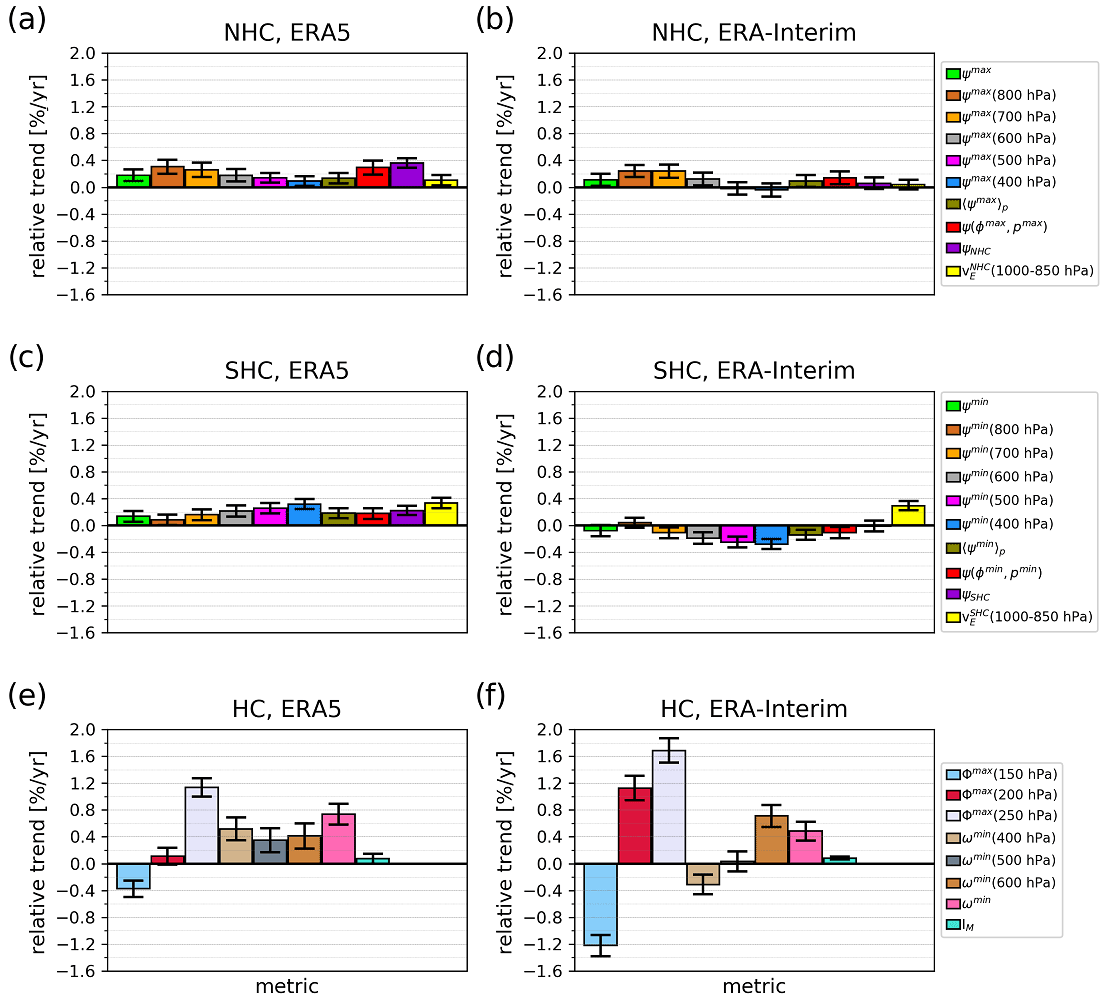
Figure 4Trends in the annual-mean HC strength normalized by their climatological mean values: for the NHC (a, b), SHC (c, d), and total Hadley circulation (e, f); in ERA5 (a, c, e) and ERA-Interim (b, d, f) reanalyses between 1979 and 2018 for different metrics of HC strength defined in Sect. 2.2; see also Fig. 3. Note that positive values in all panels indicate strengthening of NHC and SHC. Black error bars indicate the standard error of the trend estimates.
Table 1Annual-mean HC strength trends normalized by the climatological mean values of HC strength in ERA5 between 1979 and 2018. The trends derived from stream-function metrics (which distinguish between the NHC and the SHC) are separated from the trends derived from other metrics (which describe the two cells together). The values in parentheses denote the standard error of the trend estimates.
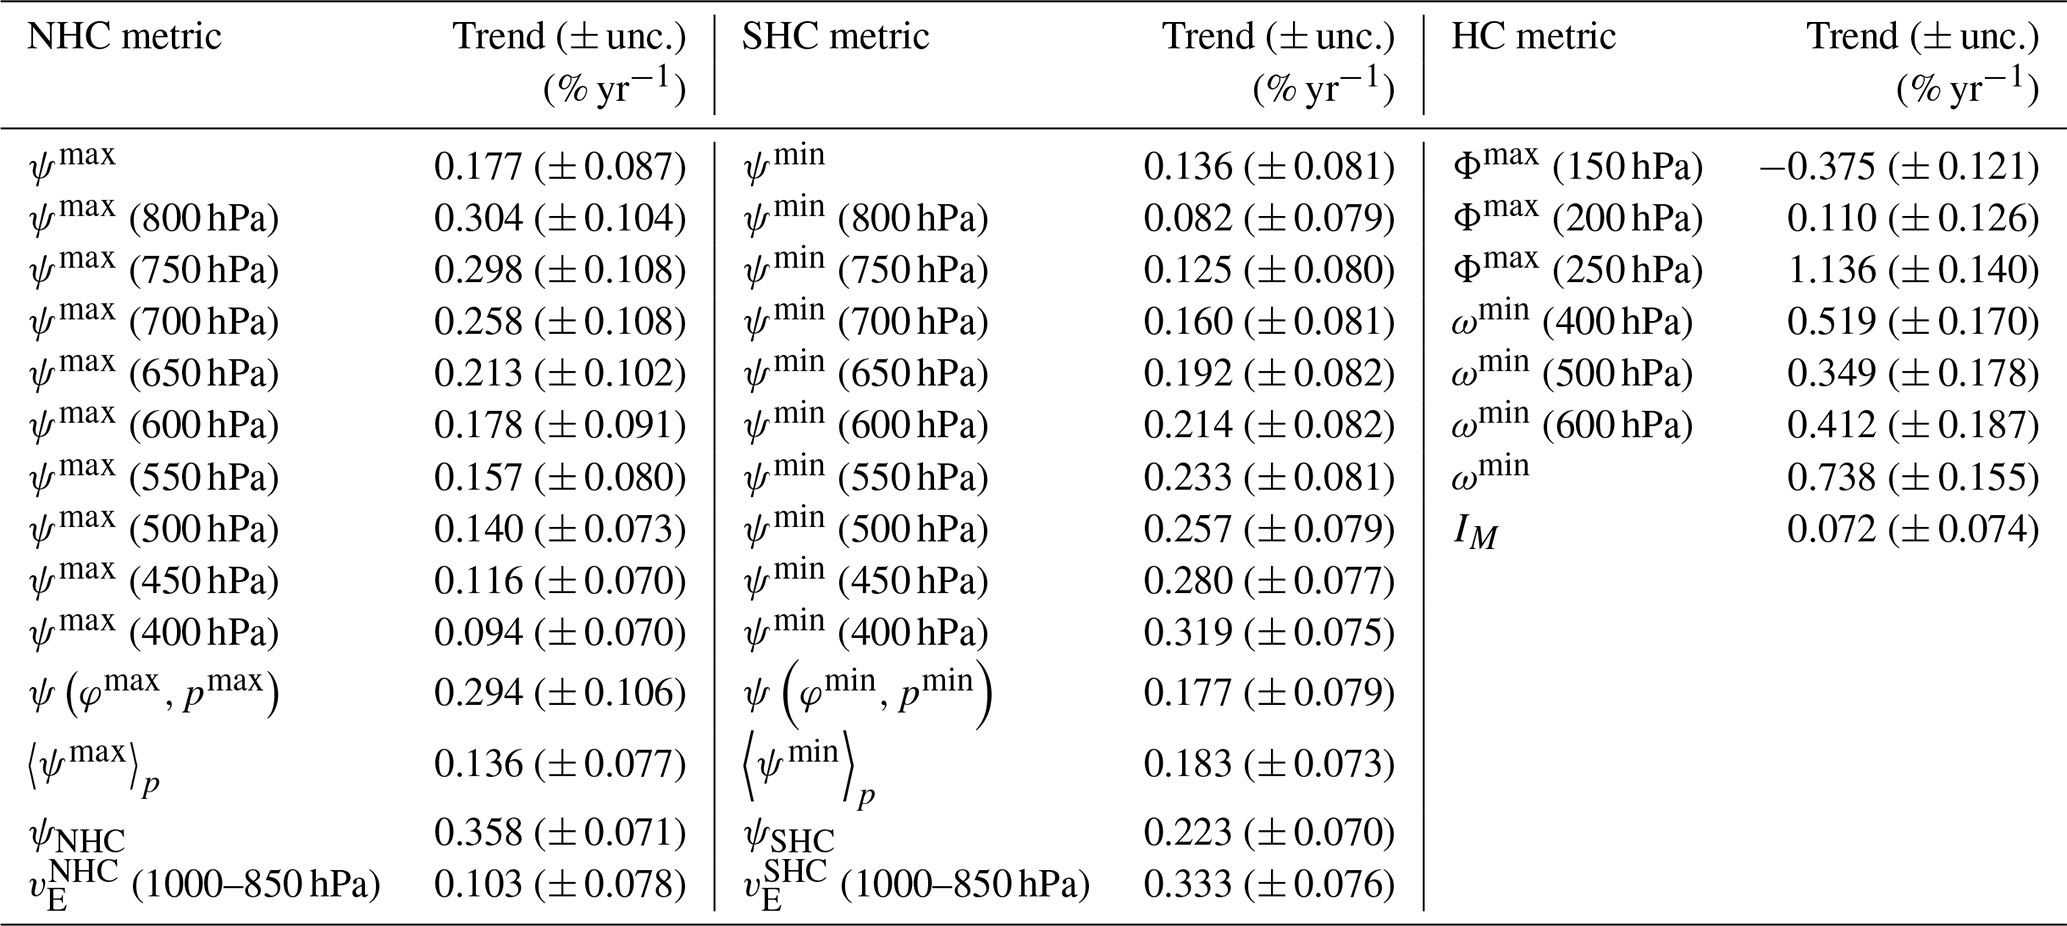
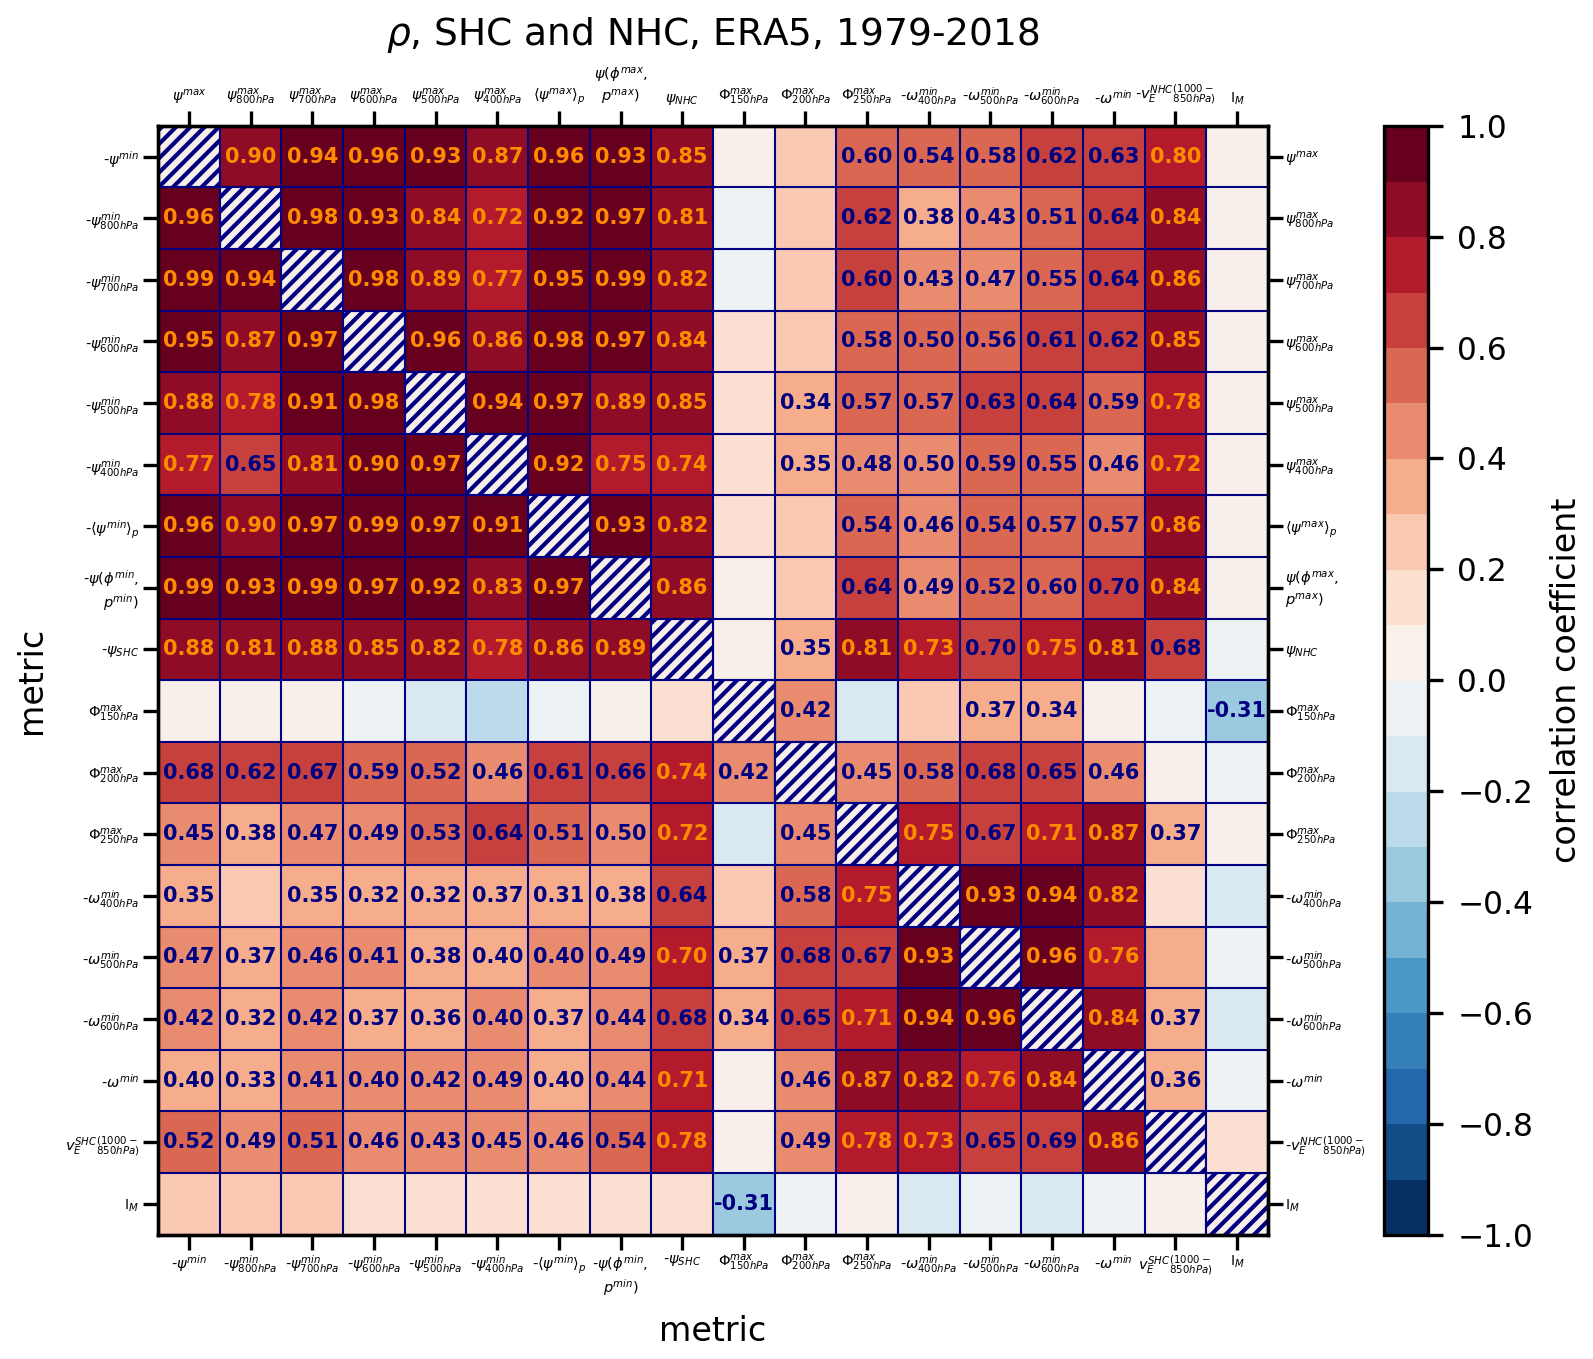
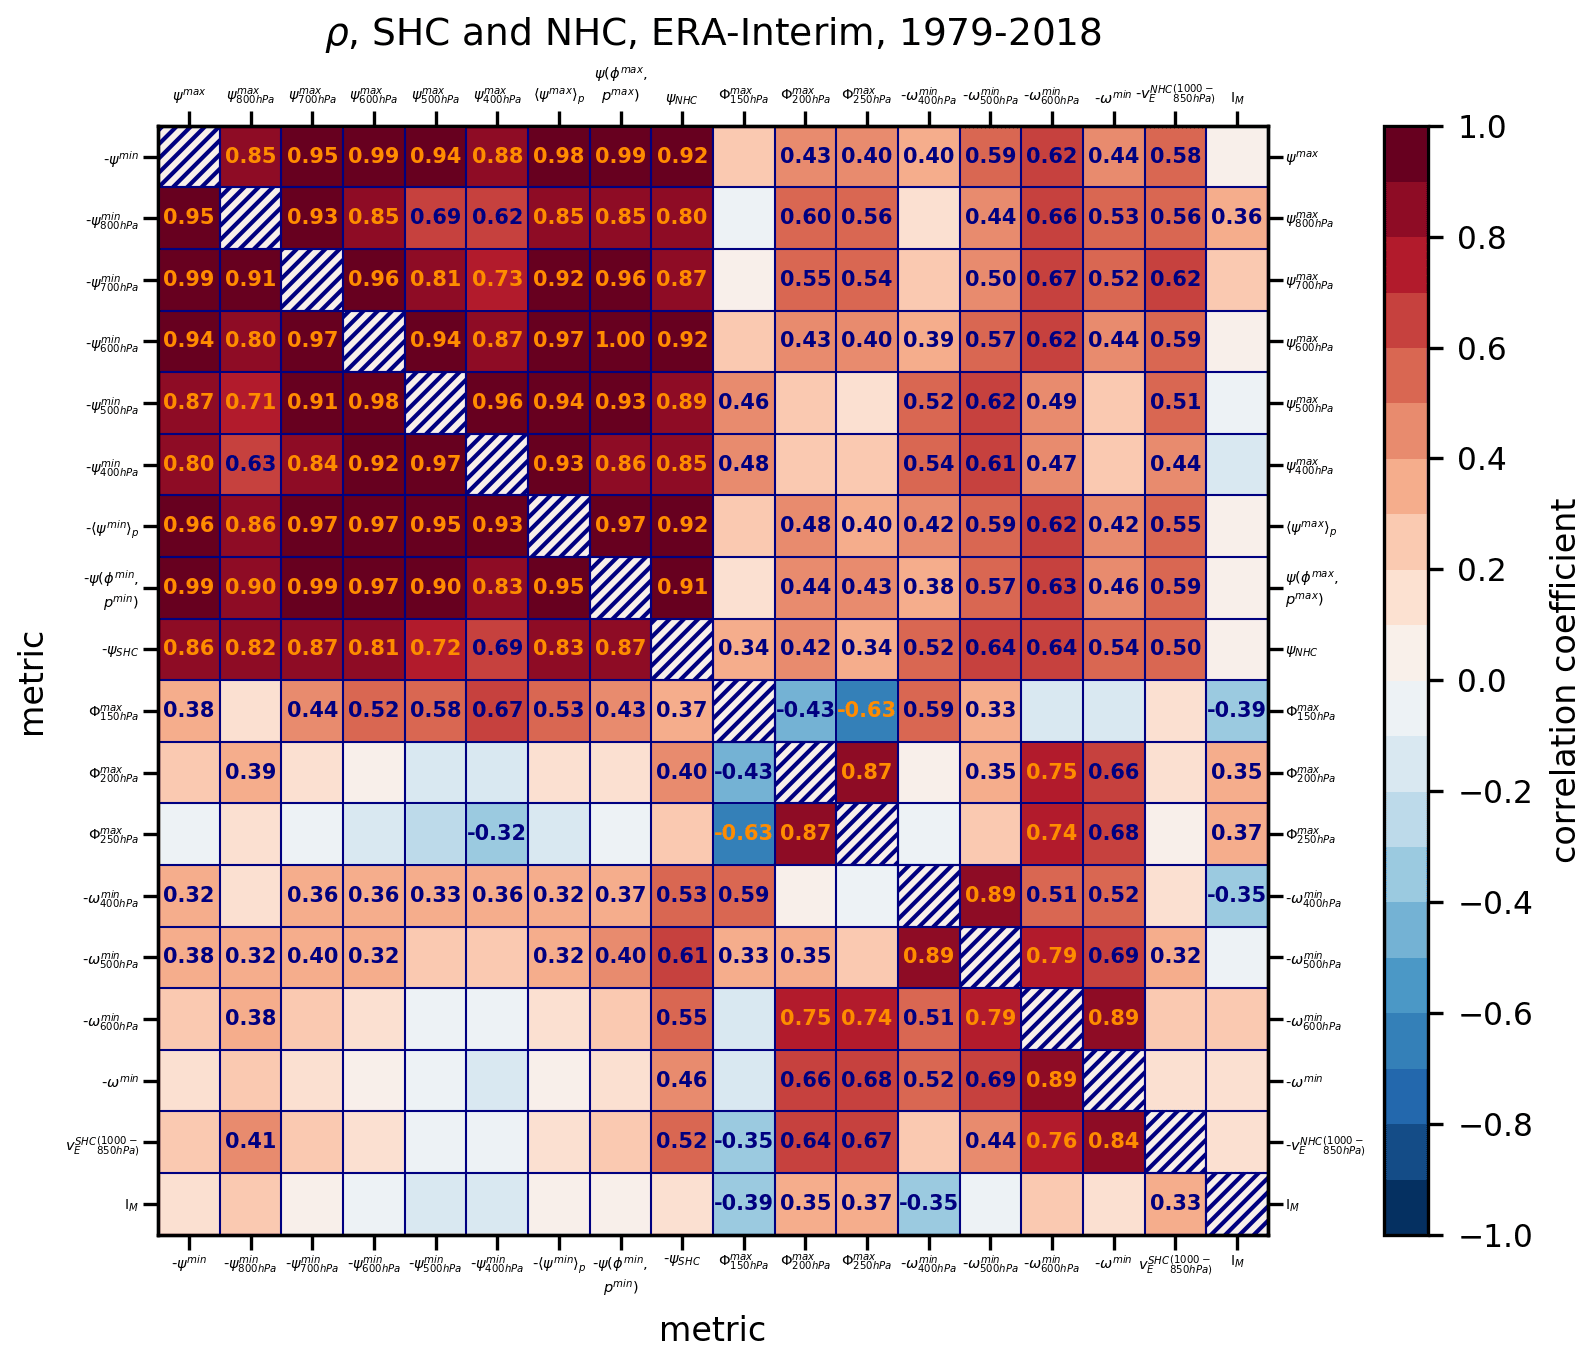
Figure 5Correlations of time series, derived from different metrics of Hadley cell strength, described in Sect. 2.2, for the 1979–2018 period in ERA5 reanalysis. The correlations for the northern Hadley cell are shown in the upper right part of the matrix, whereas the southern Hadley cell correlations are represented in the lower left part. Time series of ω(p)min are multiplied by (−1) so that more positive values correspond to HC strengthening. Similarly, the time series of the stream-function metrics ψmin and time series of the effective wind for the lower tropospheric water vapour transport metric are also multiplied by (−1) so that more positive values correspond to HC strengthening. Only correlations exceeding the 95 % significance threshold are shown.
In general, the normalized stream-function metrics are well aligned in both HCs (Fig. 3, in grey colours), with a slightly larger spread over a few periods (e.g. 1979–1983 in both HCs). The time series of ψ metrics are better aligned for the SHC than the NHC, both in ERA5 and ERA-Interim (Fig. A6). They are also highly correlated (Fig. 5), as expected from Fig. 3. For example, the time series derived from ψmax(p) (metric 2) at nearby pressure levels (100 hPa apart) are highly correlated with correlation coefficient r>0.94. Absolute ψmax and ψmin (metric 1) correlate best with ψmax(p) and ψmin(p) at lower-to-mid-tropospheric pressure levels (500–800 hPa). The result is in line with Fig. A7. Metric (4) is highly correlated (r>0.9) with ψmax(p) and ψmin(p) at various levels.
A widely utilized HC strength metric ψmax(500 hPa) (and similarly ψmax) also highly correlates (r=0.85) with the average stream-function metric, ψNHC. In the SHC, the stream-function minimum at 500 hPa yields a slightly lower correlation (r=0.82) with the average stream-function metric for the SHC, ψSHC. Even higher correlations (r=0.88) with ψSHC are found for ψmin(p) at 700 hPa and ψmin.
The above results suggest that the ψmax(p) metrics at pressure levels between 600 and 500 hPa are most representative of the overall changes in the NHC, whereas ψmin(p) metrics around 700 hPa are most representative of the SHC. The other single levels should probably be avoided as the metrics of the overall HC strength.
The time series of the other stream-function metrics, i.e. ψmax or ψmin, or , or at the location of the climatological maximum or minimum also highly correlate (r=0.74–0.89) with the average stream-function metric. Thus, the newly proposed metric is an adequate candidate for assessing the changes in HC strength.
Despite the high correlations, the relative trends in ψ metrics can differ significantly (Fig. 4; Tables 1, A1). ERA5 (Fig. 4a, c, e; Table 1) shows mostly significant strengthening from 0.09 % yr−1 to 0.36 % yr−1 for the NHC and 0.08 % yr−1 to 0.32 % yr−1 for the SHC. In the NHC, the widely used metric ψmax (500 hPa) shows strengthening of 0.14 % yr−1 and is equal to the trend of , while ψmax increases by 0.18 % yr−1. and ψNHC show larger trends with strengthening of 0.29 % yr−1 and 0.36 % yr−1, respectively. The two metrics that perform spatial averaging, and ψSHC, suggest strengthening of the southern cell by 0.18 % yr−1 and 0.22 % yr−1, respectively. The relative trends derived from the average stream-function metric show reduced uncertainty compared with the other stream-function-based single-point metrics, in line with the results of Sect. 3.2.
The time series derived from ω metrics have much higher temporal oscillations compared with ψ metrics (Fig. 3); however, the maxima and minima are fairly aligned with ψ metrics, though with larger anomalies. This is captured also by their moderate correlations (r=0.3–0.5 for the SHC and 0.4–0.65 for the NHC) (Figs. 5, A8). However, the average stream-function metric, ψNHC and ψSHC, correlates better with the ω metrics: r=0.70–0.81 for the NHC and 0.64–0.71 for the SHC. It also correlates better with the Φ metrics than the other ψ metrics, particularly with Φmax at 200 and 250 hPa. This further implies that the average stream-function metric captures also the changes in HC in regions of ascending motion. The correlation of Φmax at 150 hPa with other metrics is low and mostly insignificant, suggesting that the 150 hPa level might already be in the tropical tropopause.
The velocity-potential metrics Φmax(p) show much larger magnitude of the trends compared with the other metrics. They are also very susceptible to the applied pressure level, a similar issue as for the ψ metrics. Therefore, this metric is also likely susceptible to the potential future changes in the depth of the tropical troposphere. For example, Φmax (250 hPa) in ERA5 shows a strengthening trend of 1.14 % yr−1, at 200 hPa roughly 0.11 % yr−1, whereas Φmax at 150 hPa shows a weakening trend of −0.38 % yr−1 (Fig. 4e; Table 1), an outlier among the other metrics. The differences among trend magnitudes are even larger in ERA-Interim (Fig. 4f; Table A1).
The trends derived from the ω metrics align reasonably well with the trends derived from the ψ metrics. In particular, ωmin at 500 hPa (dark grey bar in Fig. 4) shows good agreement with the average stream-function metric (7), but with more than doubled uncertainty due to larger variability in the ω metrics, as revealed in Fig. 3. As for the other single-point metrics, the derived trends in the ω-based HC strength are strongly susceptible to the choice of the pressure level. (This is again more pronounced in the ERA-Interim.)
The effective wind metric (8) aligns well with the stream-function metrics (Fig. 3), as reflected in their high correlations (r=0.68–0.86) for the NHC and moderate correlations (r=0.43–0.54) for the SHC. The exception is the high correlation (r=0.78) of metric (8) with the average stream-function metric ψSHC. The sign and the magnitude of HC strength defined by metric (8) also aligns well with the stream-function-based metrics, except for the SHC in ERA-Interim. On the other hand, for the NHC, the effective wind metric (8) shows low (and insignificant) correlations with ω and Φ metrics describing the ascending branch of the HC, whereas it shows high correlations (r∼0.7) for the SHC (in both reanalyses). These results likely suggest that the northward water vapour transport to the deep tropics (in the lower branch of the SHC) provides the bulk of the fuel for condensation, associated vertical motions, and divergent outflow in the upper troposphere (described by the velocity potential).
The unbalanced energy metric IM has strengthened in the 1979–2018 period in both reanalyses with a rate of roughly 0.1 % yr−1 (Fig. 4; Tables 1, A1). The uncertainty of the trend is smaller than in the other metrics. For ERA5, the sign of the derived trends is consistent with the other metrics. However, the IM metric suggests strengthening of HC also in ERA-Interim (Fig. 4f). This global trend in HC strength is consistent with strengthening of NHC derived from the other metrics in ERA-Interim, but is opposite to their trends in SHC. Furthermore, the correlation of the energy metric with the other metrics is low and insignificant (Fig. 5), except for the Φmax at 150 hPa. Insignificant correlations are not surprising as this metric is largely different from all other metrics. It is the total energy metric; the kinetic energy is due to both components of the horizontal flow and there is a contribution to the energy also from extratropical troposphere and from the stratosphere. The part of IM from the extratropics and the stratosphere is, however, arguably unimportant for the overall magnitude of the metric. Žagar et al. (2020) discussed the unbalanced circulation in ERA5 and ERA-Interim in relation to their observation processing and data assimilation setups, and showed that in spite of the differences, the two datasets agree on the trends in the most energetic large-scale features of tropical circulation.
To quantify the role of the stratospheric circulation in the uncertainties of the trends for the IM metric, we compared IM in ERA-Interim focusing on levels up to about 93 hPa. It revealed a smaller, but still positive, trend in ERA-Interim and a somewhat higher correlation with the other metrics (not shown). Given the importance of the mixed Rossby-gravity (MRG) waves in the Hadley circulation (Hoskins et al., 2020; Hoskins and Yang, 2021), we also tested an extension of the IM, which includes also energy of the MRG waves for all zonal wavenumbers in Eq. (5). In this case, the relative trend increased by a small margin, while the correlation with the other metrics remained insignificant (not shown). Furthermore, performing the summation (Eq. 5) for a subset of vertical modes (e.g. m≥9), thereby reducing the stratospheric and high-latitude contributions to the IM, improved correlations with the other metrics, and also increased a trend, in a better alignment with the other metrics (not shown).
In this study, we have analysed a number of metrics of the Hadley circulation strength including metrics based on the mass-weighted mean meridional stream function, velocity potential, pressure velocity ω, water vapour transport, and the total energy of the zonal-mean unbalanced circulation. The metrics were applied to ERA5 and ERA-Interim reanalysis data between 1979 and 2018. While ERA5, a more recent and a more reliable reanalysis, is our main dataset, its comparison with ERA-Interim provides confidence that the observed discrepancies between distinct metrics are not an isolated feature of ERA5 reanalysis. However, the comparison is not straightforward as the two reanalyses differ in their representations of the tropical circulation, including uncertainties that are difficult to quantify. Differences are associated with advances in observation processing, data assimilation modelling, and the ECMWF forecast model. We have also proposed two new metrics that are based on averaging or integrating circulation properties to alleviate the character of some existing metrics. The first newly proposed metric describes the average strength of the NHC and SHC using spatially averaged stream function and is therefore insensitive to spatial inhomogeneities. The other new metric quantifies the total energy of the unbalanced zonal-mean circulation.
By analysing the stream-function trends in the latitude–pressure plane, we showed that the trends are spatially inhomogeneous, both meridionally and vertically (Figs. 1, A1), particularly in ERA-Interim. Therefore, distinct stream-function metrics of HC strength resulted in significantly different and sometimes even opposing trends, decreasing our prospects to draw firm conclusions on the circulation changes. The same applies to other single-point metrics of HC strength. The two new metrics of HC strength are characterized by a smaller uncertainty of the derived trends compared with the current metrics, likely due to spatial averaging (average stream function) or the integration (unbalanced energy metric).
Presented opposing trends suggest that the contribution of physical mechanisms that drive the Hadley cells and govern their strength (diabatic heating, friction processes, eddy heat and momentum fluxes, static stability etc.) are likely to vary with the chosen HC strength metric (Chemke and Polvani, 2019; Zaplotnik et al., 2022). For example, friction should affect HC strength trends more if the metric ψmax(p) is taken at some lower tropospheric pressure level, whereas its impact is likely reduced when ψmax(p) is evaluated at mid-to-upper tropospheric levels. Note that a detailed analysis of these effects is beyond the scope of this study and will be pursued in the future.
Because of the different mechanisms involved in HC dynamics, the choice of the HC strength metric will ultimately depend on the application in a specific study. However, our results demonstrate that caution is needed when comparing HC trends from different studies using different metrics of HC strength. In light of all the results, we would suggest using the average stream function as the metric of overall HC strength whenever interested in the variability and trends in each Hadley cell separately. On the other hand, the unbalanced energy metric is a physically sound choice for analysing the changes in the global zonal-mean circulation. Note that evaluations of HC strength and its trends may also benefit from analyses in alternative coordinate systems, such as thermodynamic coordinates (Kjellsson et al., 2014), moist isentropic coordinates (e.g. Wu et al., 2019) or dry isentropic coordinates (e.g. Lucas et al., 2021) that yield a different perspective on the mean meridional circulation. Overall, we believe that future discussions of HC strengthening or weakening would benefit from using a unified metric.
MODES software (Žagar et al., 2015) is used to perform scale- and circulation-type-dependent decomposition of the 3D dynamical fields: the zonal wind u, meridional wind v, and modified geopotential with . Here, Φ represents the geopotential, R is the gas constant, and T0(p) is the globally averaged temperature on a certain pressure level. The input data vector is decomposed using separable series of M orthogonal vertical structure functions Gm(p) and series of horizontal structure functions (Hough harmonics) , which consist of 2K+1 zonal waves and R meridional waves:
where is a diagonal matrix, g is gravitational acceleration, Dm is an equivalent depth of the vertical mode m and couples the vertical and horizontal structure functions, are the spectral Hough coefficients, and is a meridional vector function consisting of multivariately related components . For every vertical mode m, the system of horizontal structure equations applies:
The equations can be made dimensionless by taking , , , and , so that
where and L is the linear differential matrix operator:
γ is a dimensionless parameter defined as the ratio of shallow-water gravity wave speed and twice the rotation speed of earth, . The third equation in system (A2) now becomes
The solution ansatz can be expressed by assuming separability of time-dependent and space-dependent solutions, i.e.
where is dimensionless frequency and are the associated horizontal structure functions, which are used in the expansion (A1).
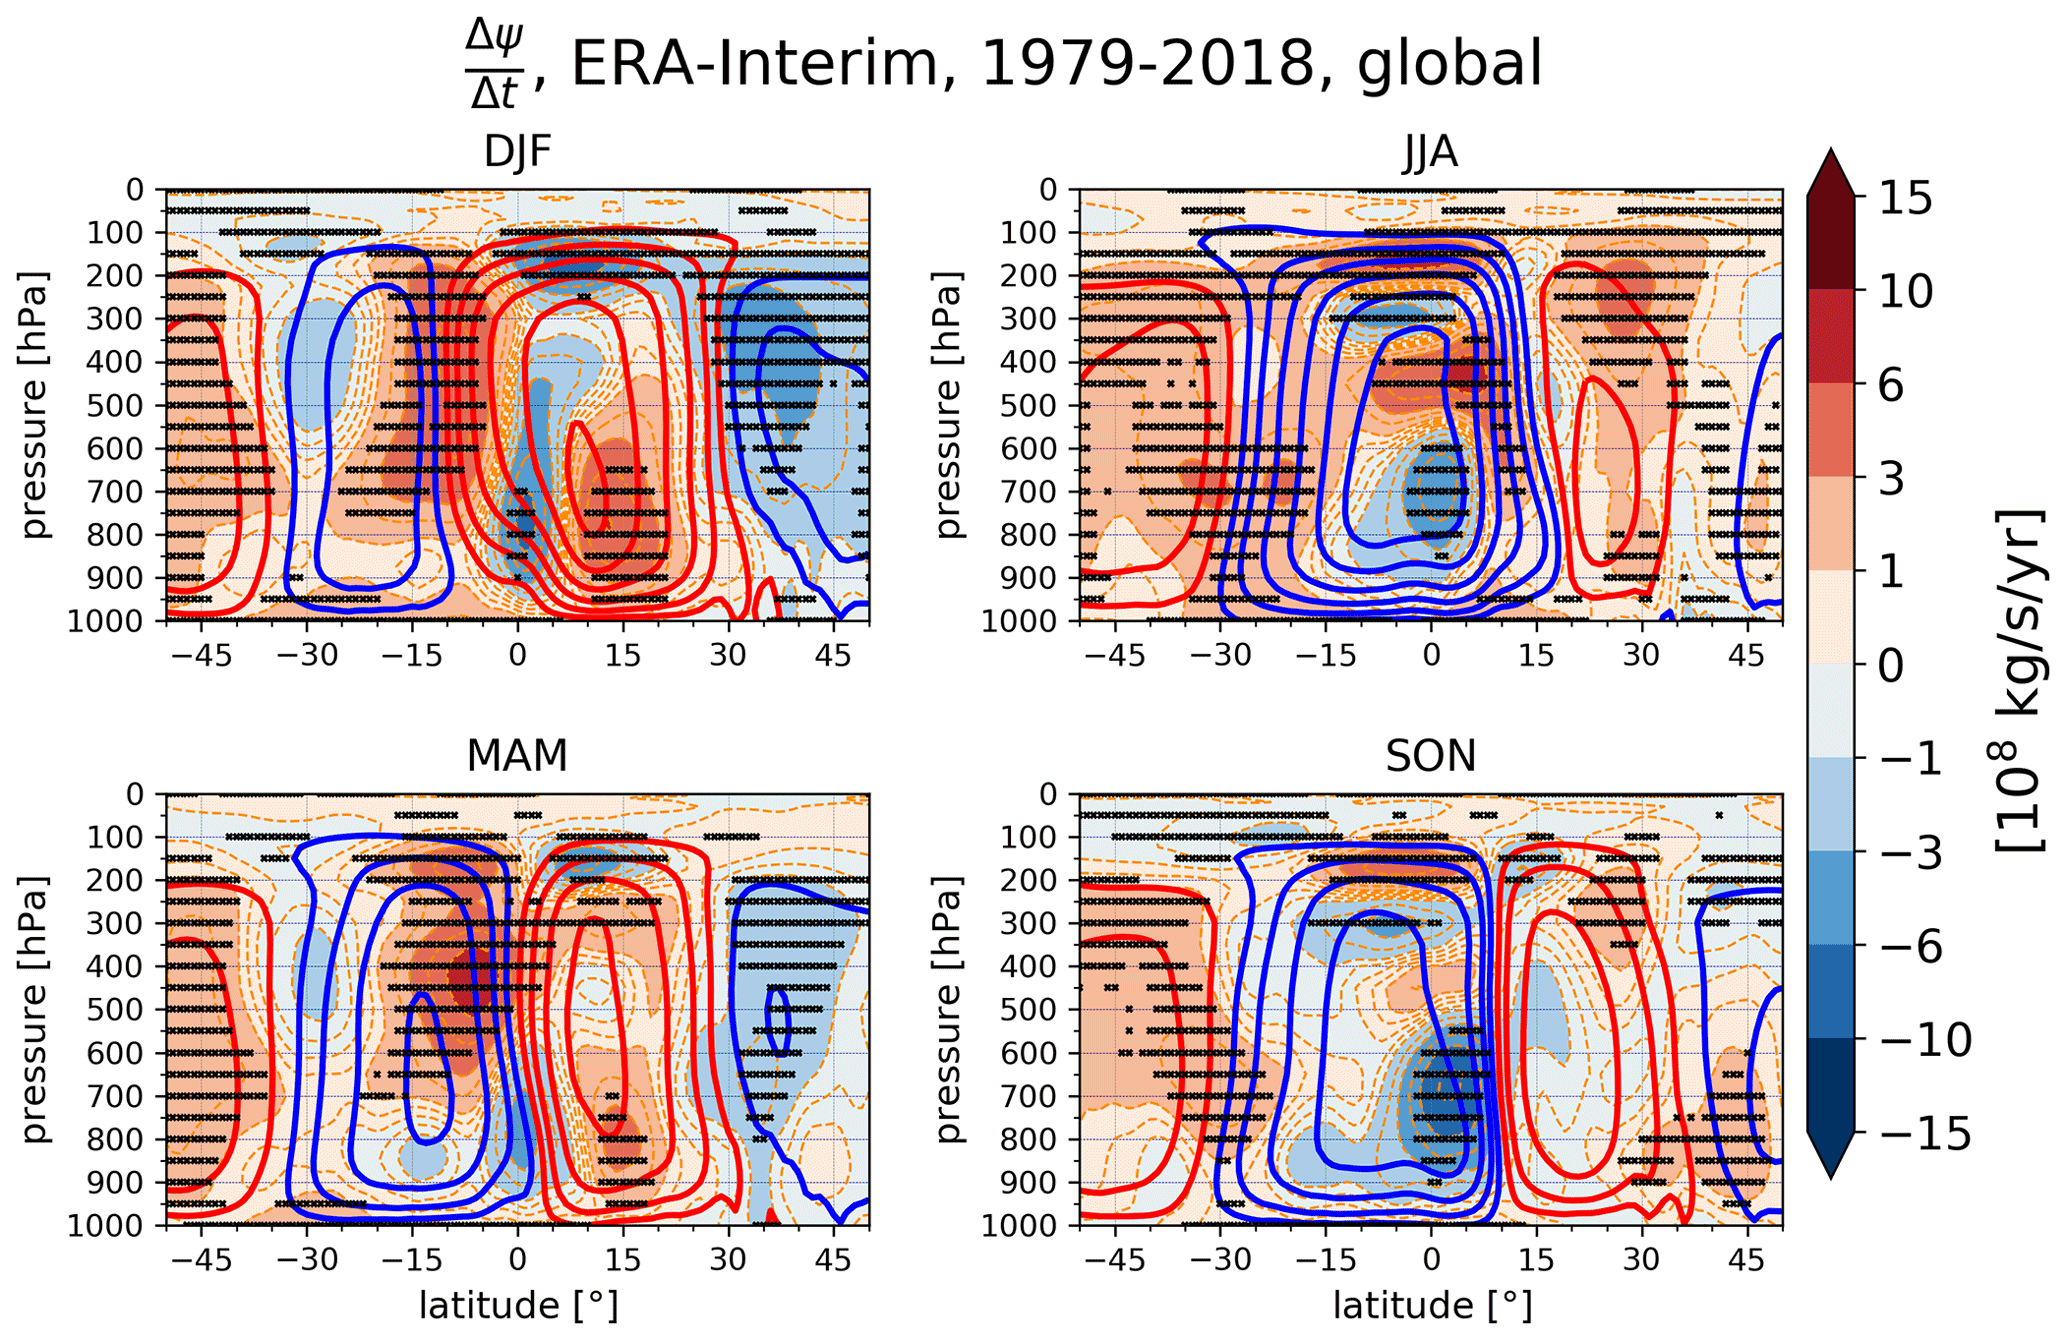
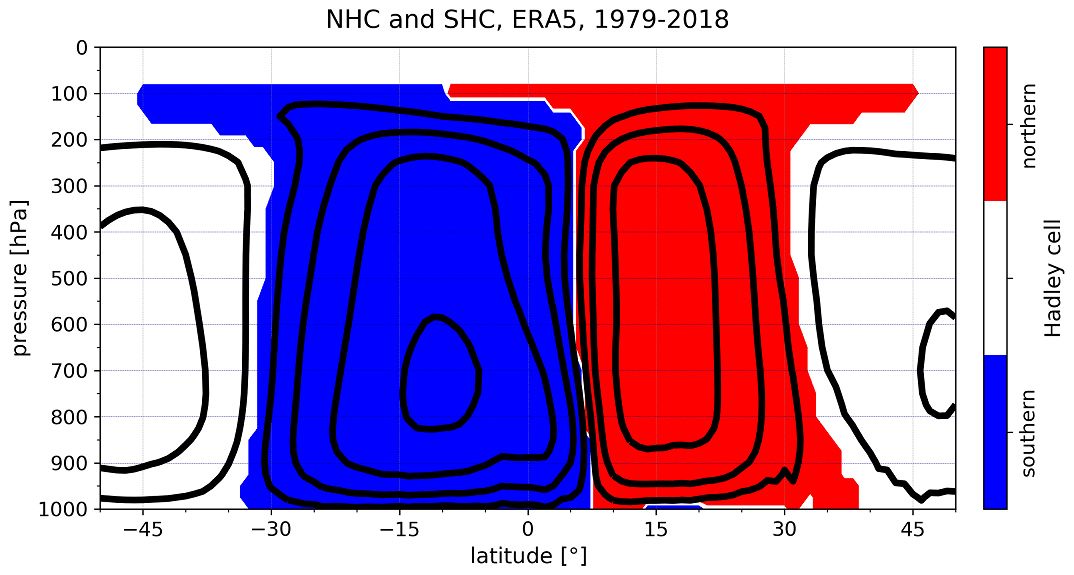
Figure A2The area (red/blue) where the stream function is spatially averaged to evaluate NHC/SHC strength following metric (7) for the case of 1979–2018 average zonal-mean stream function in ERA5 reanalysis. The averaging area is data adaptive.
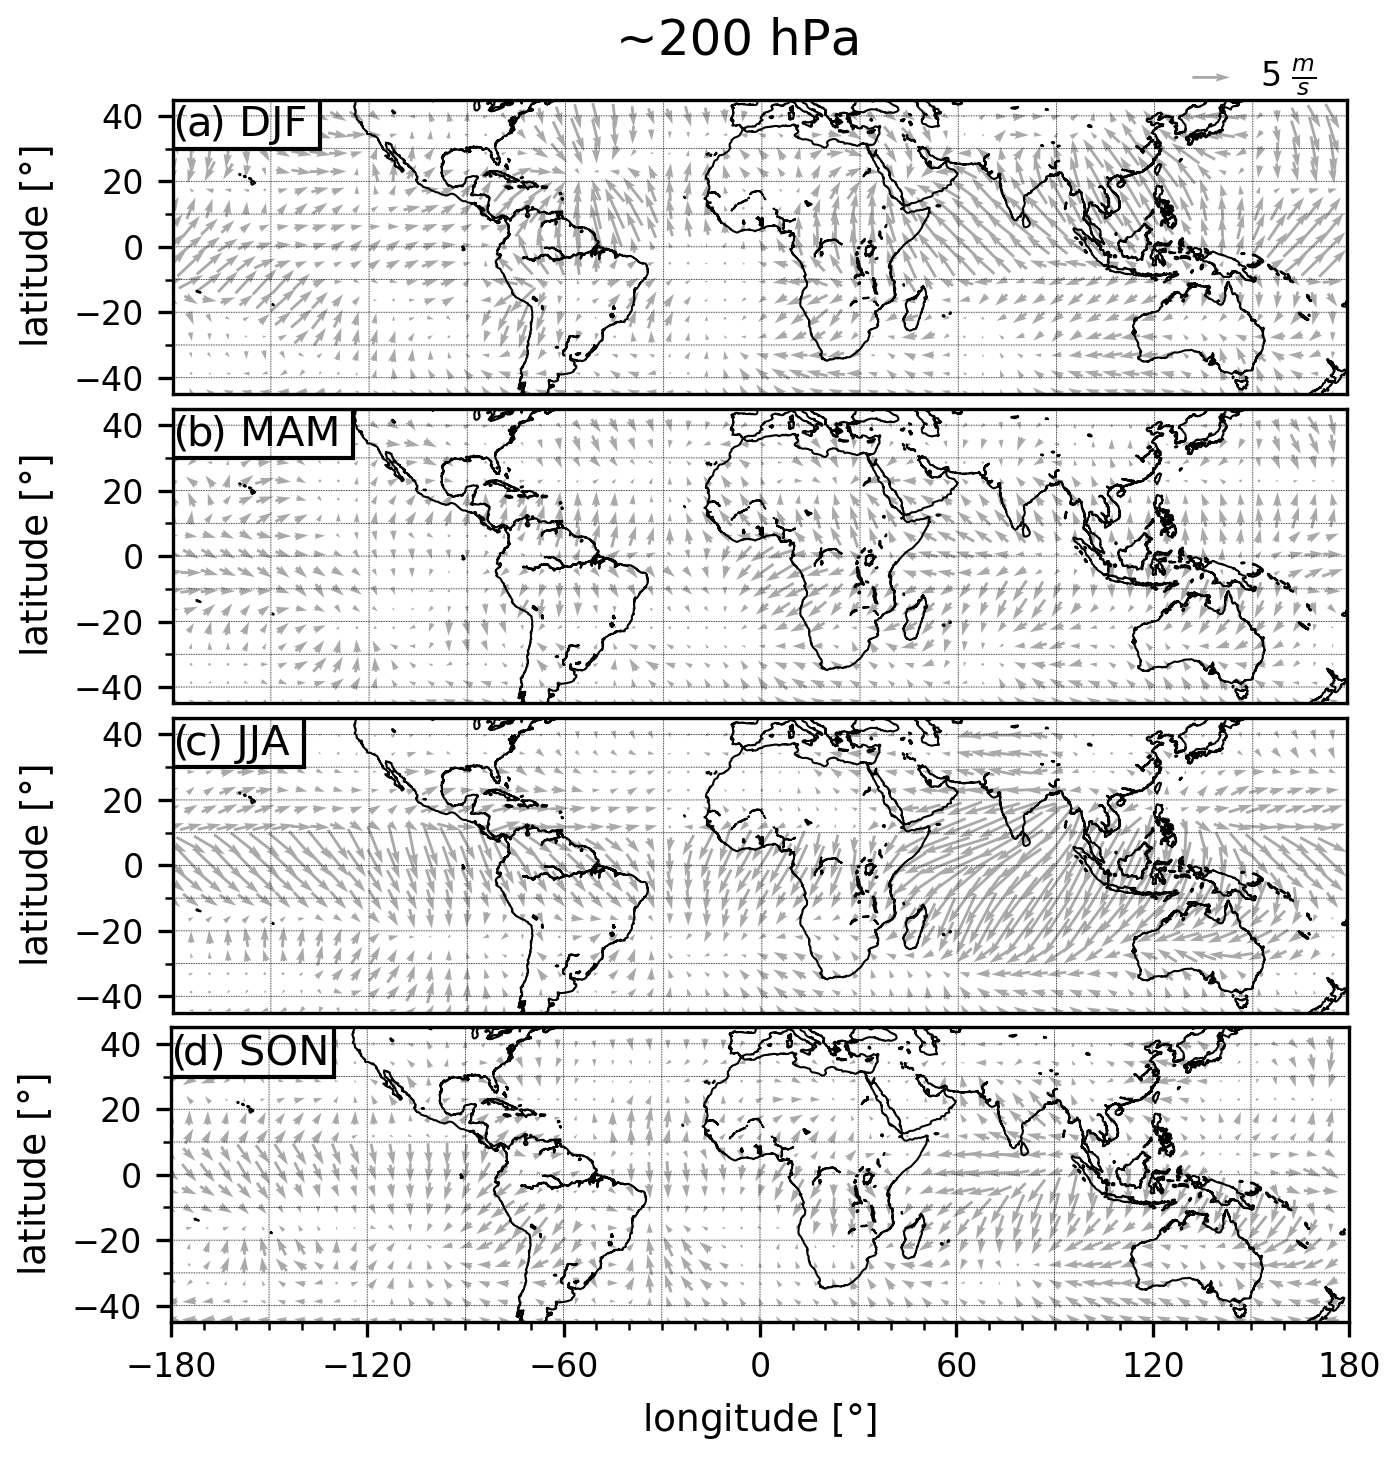
Figure A3The 2018 mean horizontal winds for an unbalanced circulation component in ERA5 reanalysis, in different seasons, on the 200 hPa pressure level. Wind intensity is shown by the length of the wind vectors.
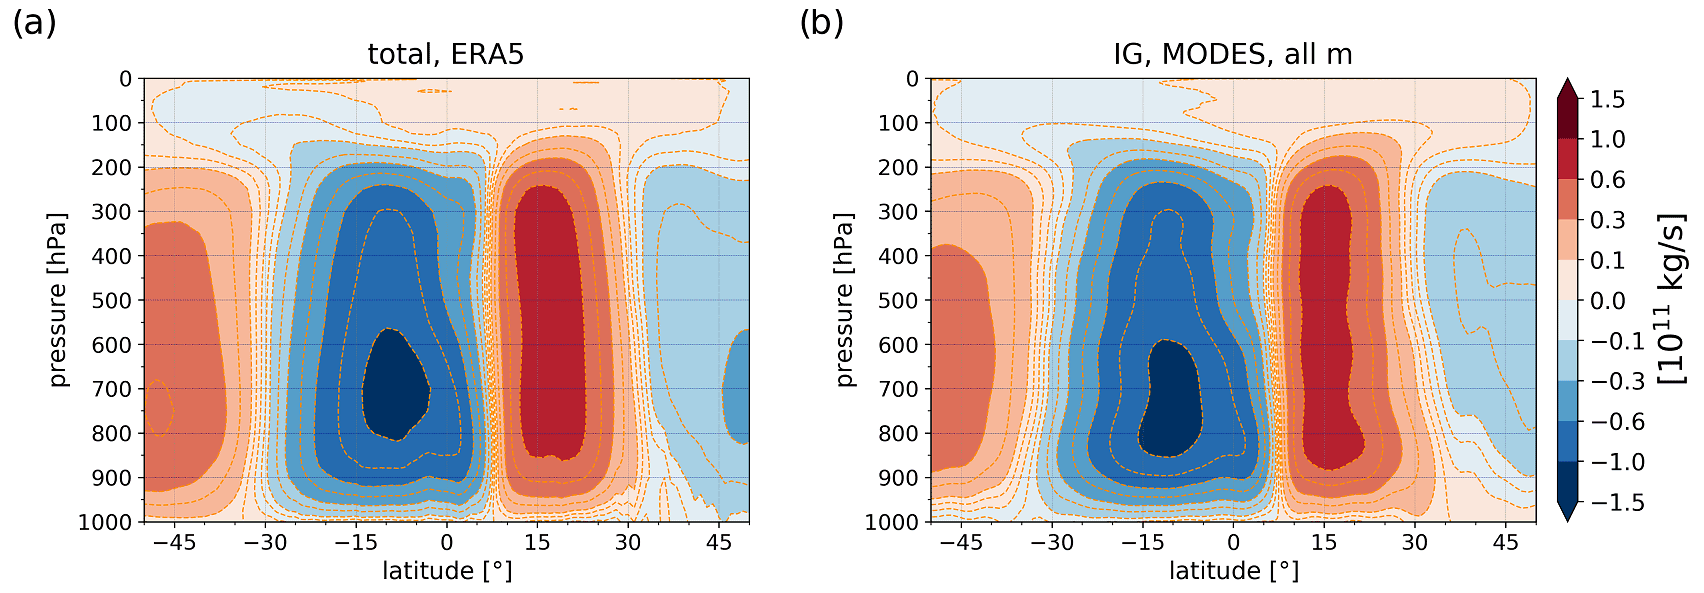
Figure A4The 2018 mean Hadley circulation (red and blue contours) in ERA5 reanalysis computed from (a) total fields of zonal-mean meridional wind and (b) unbalanced (inertia–gravity) fields. Contours indicate values of stream function ψ.
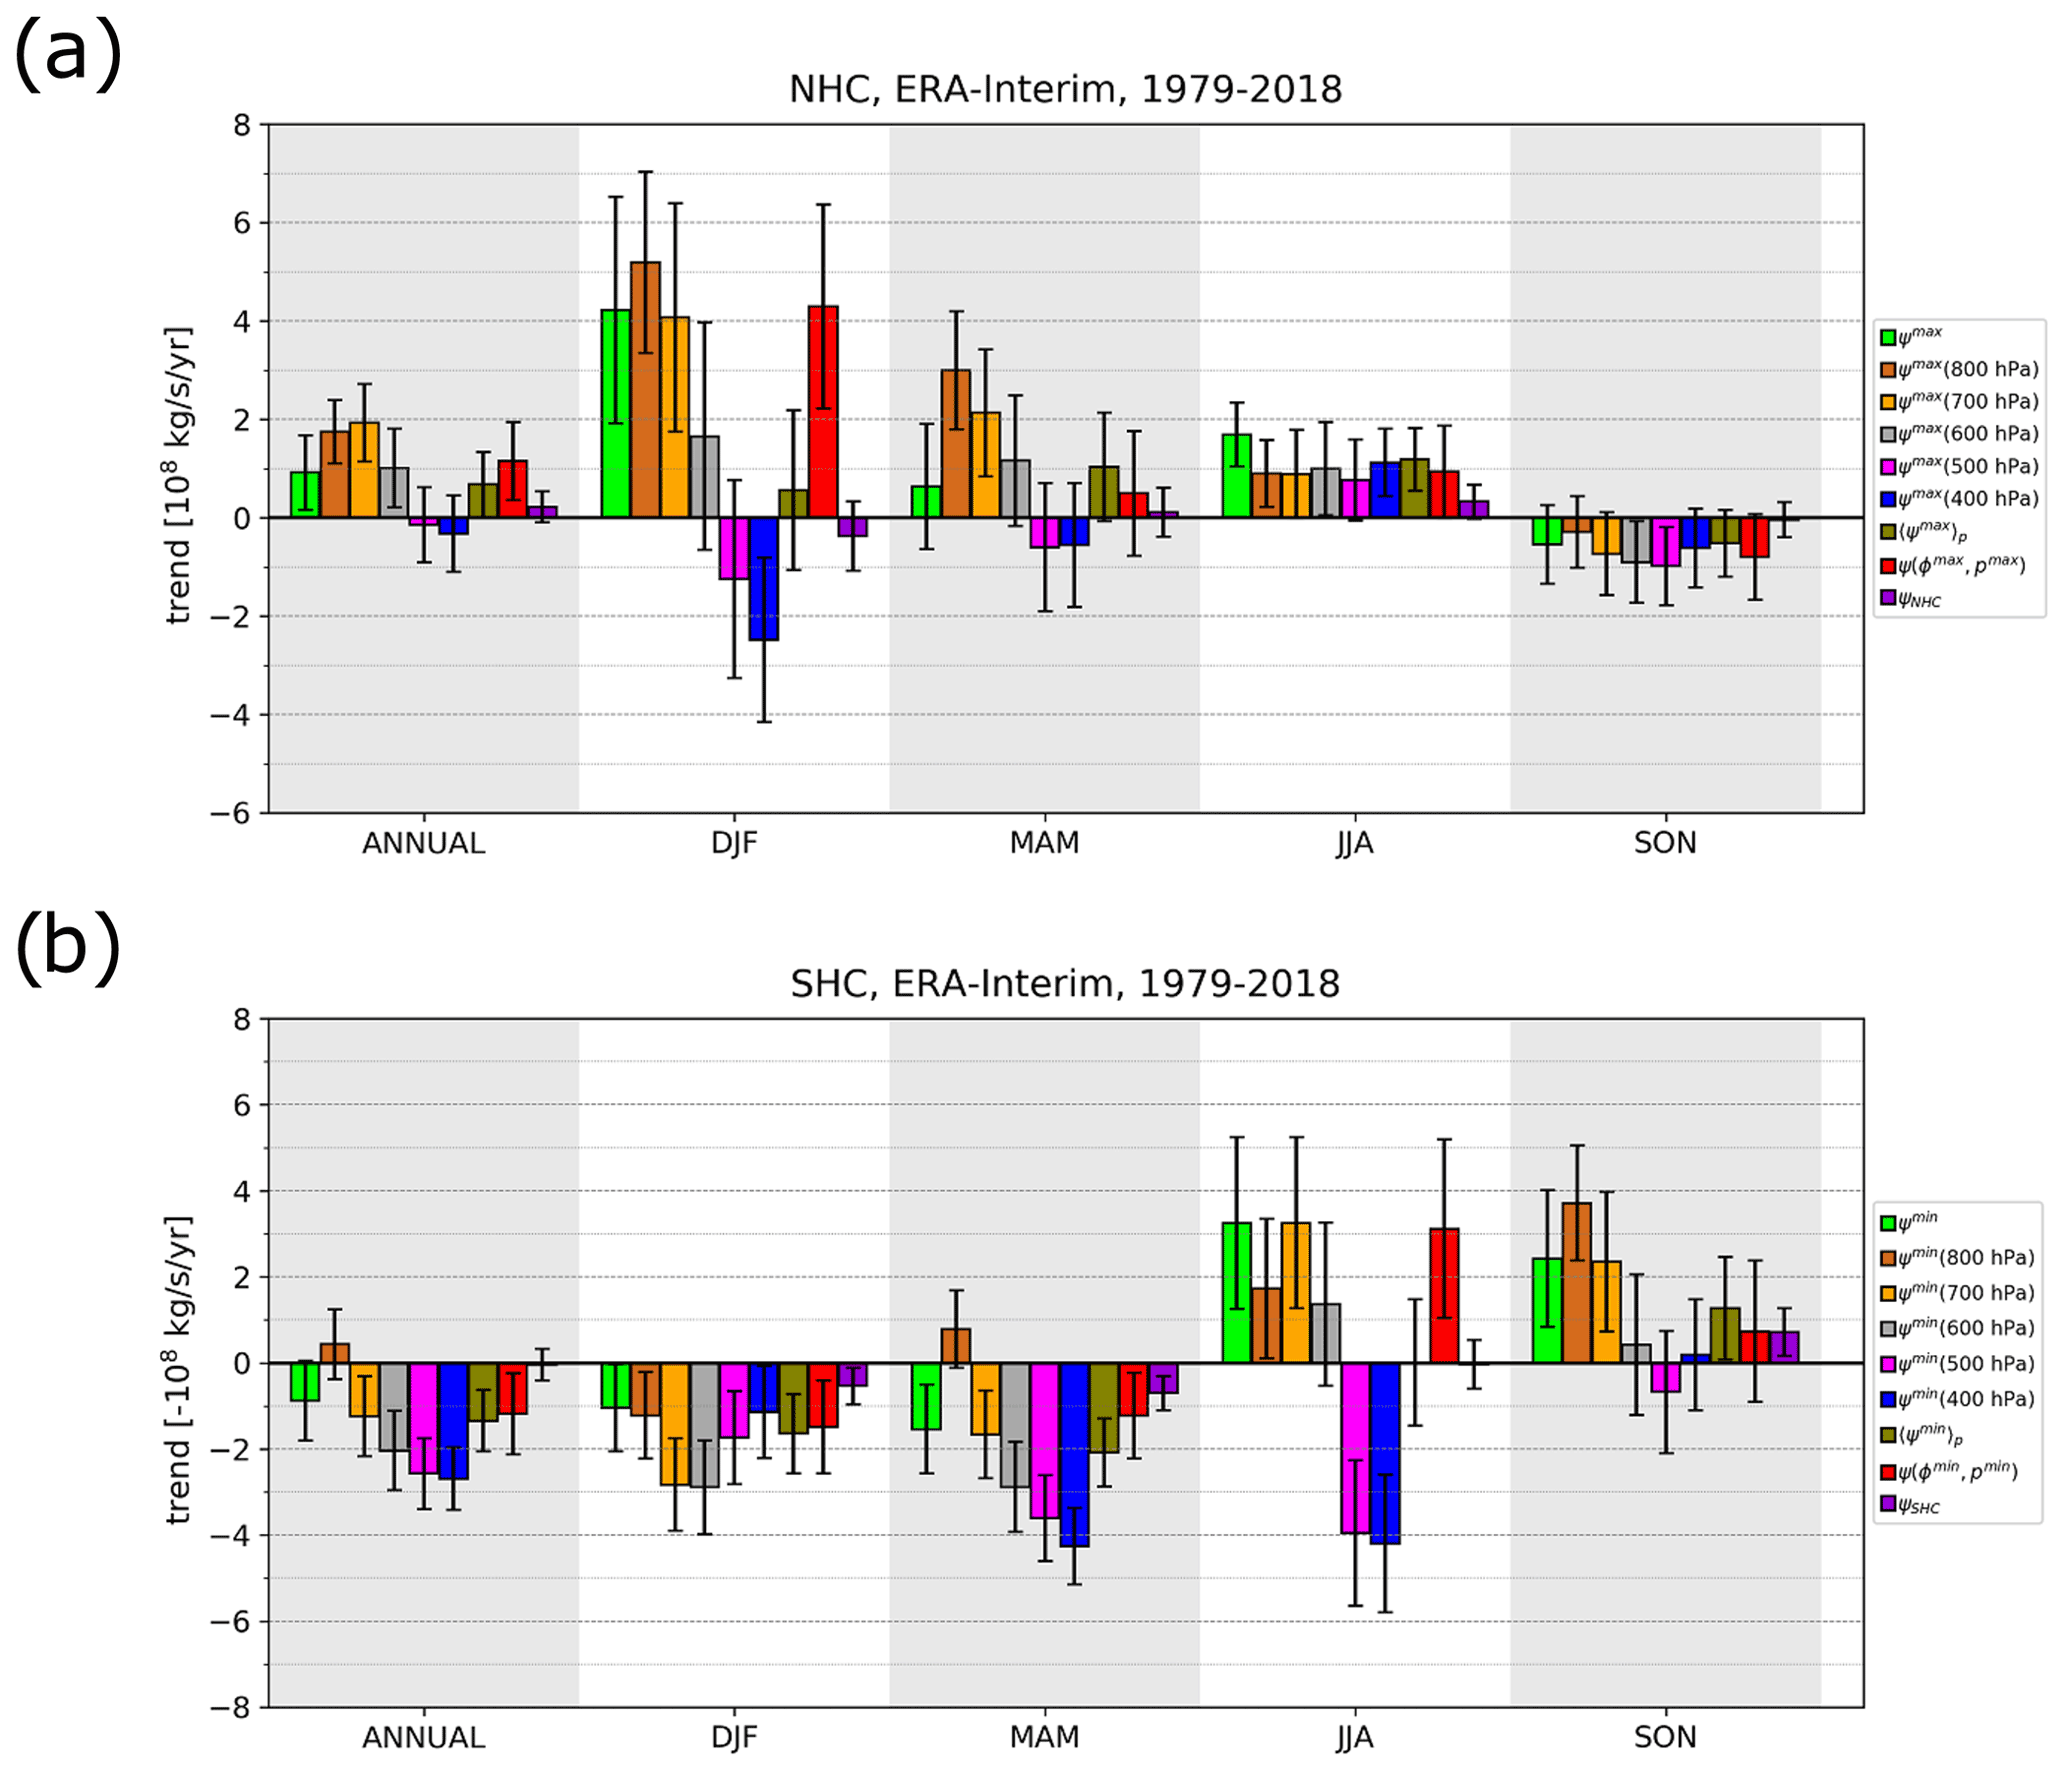
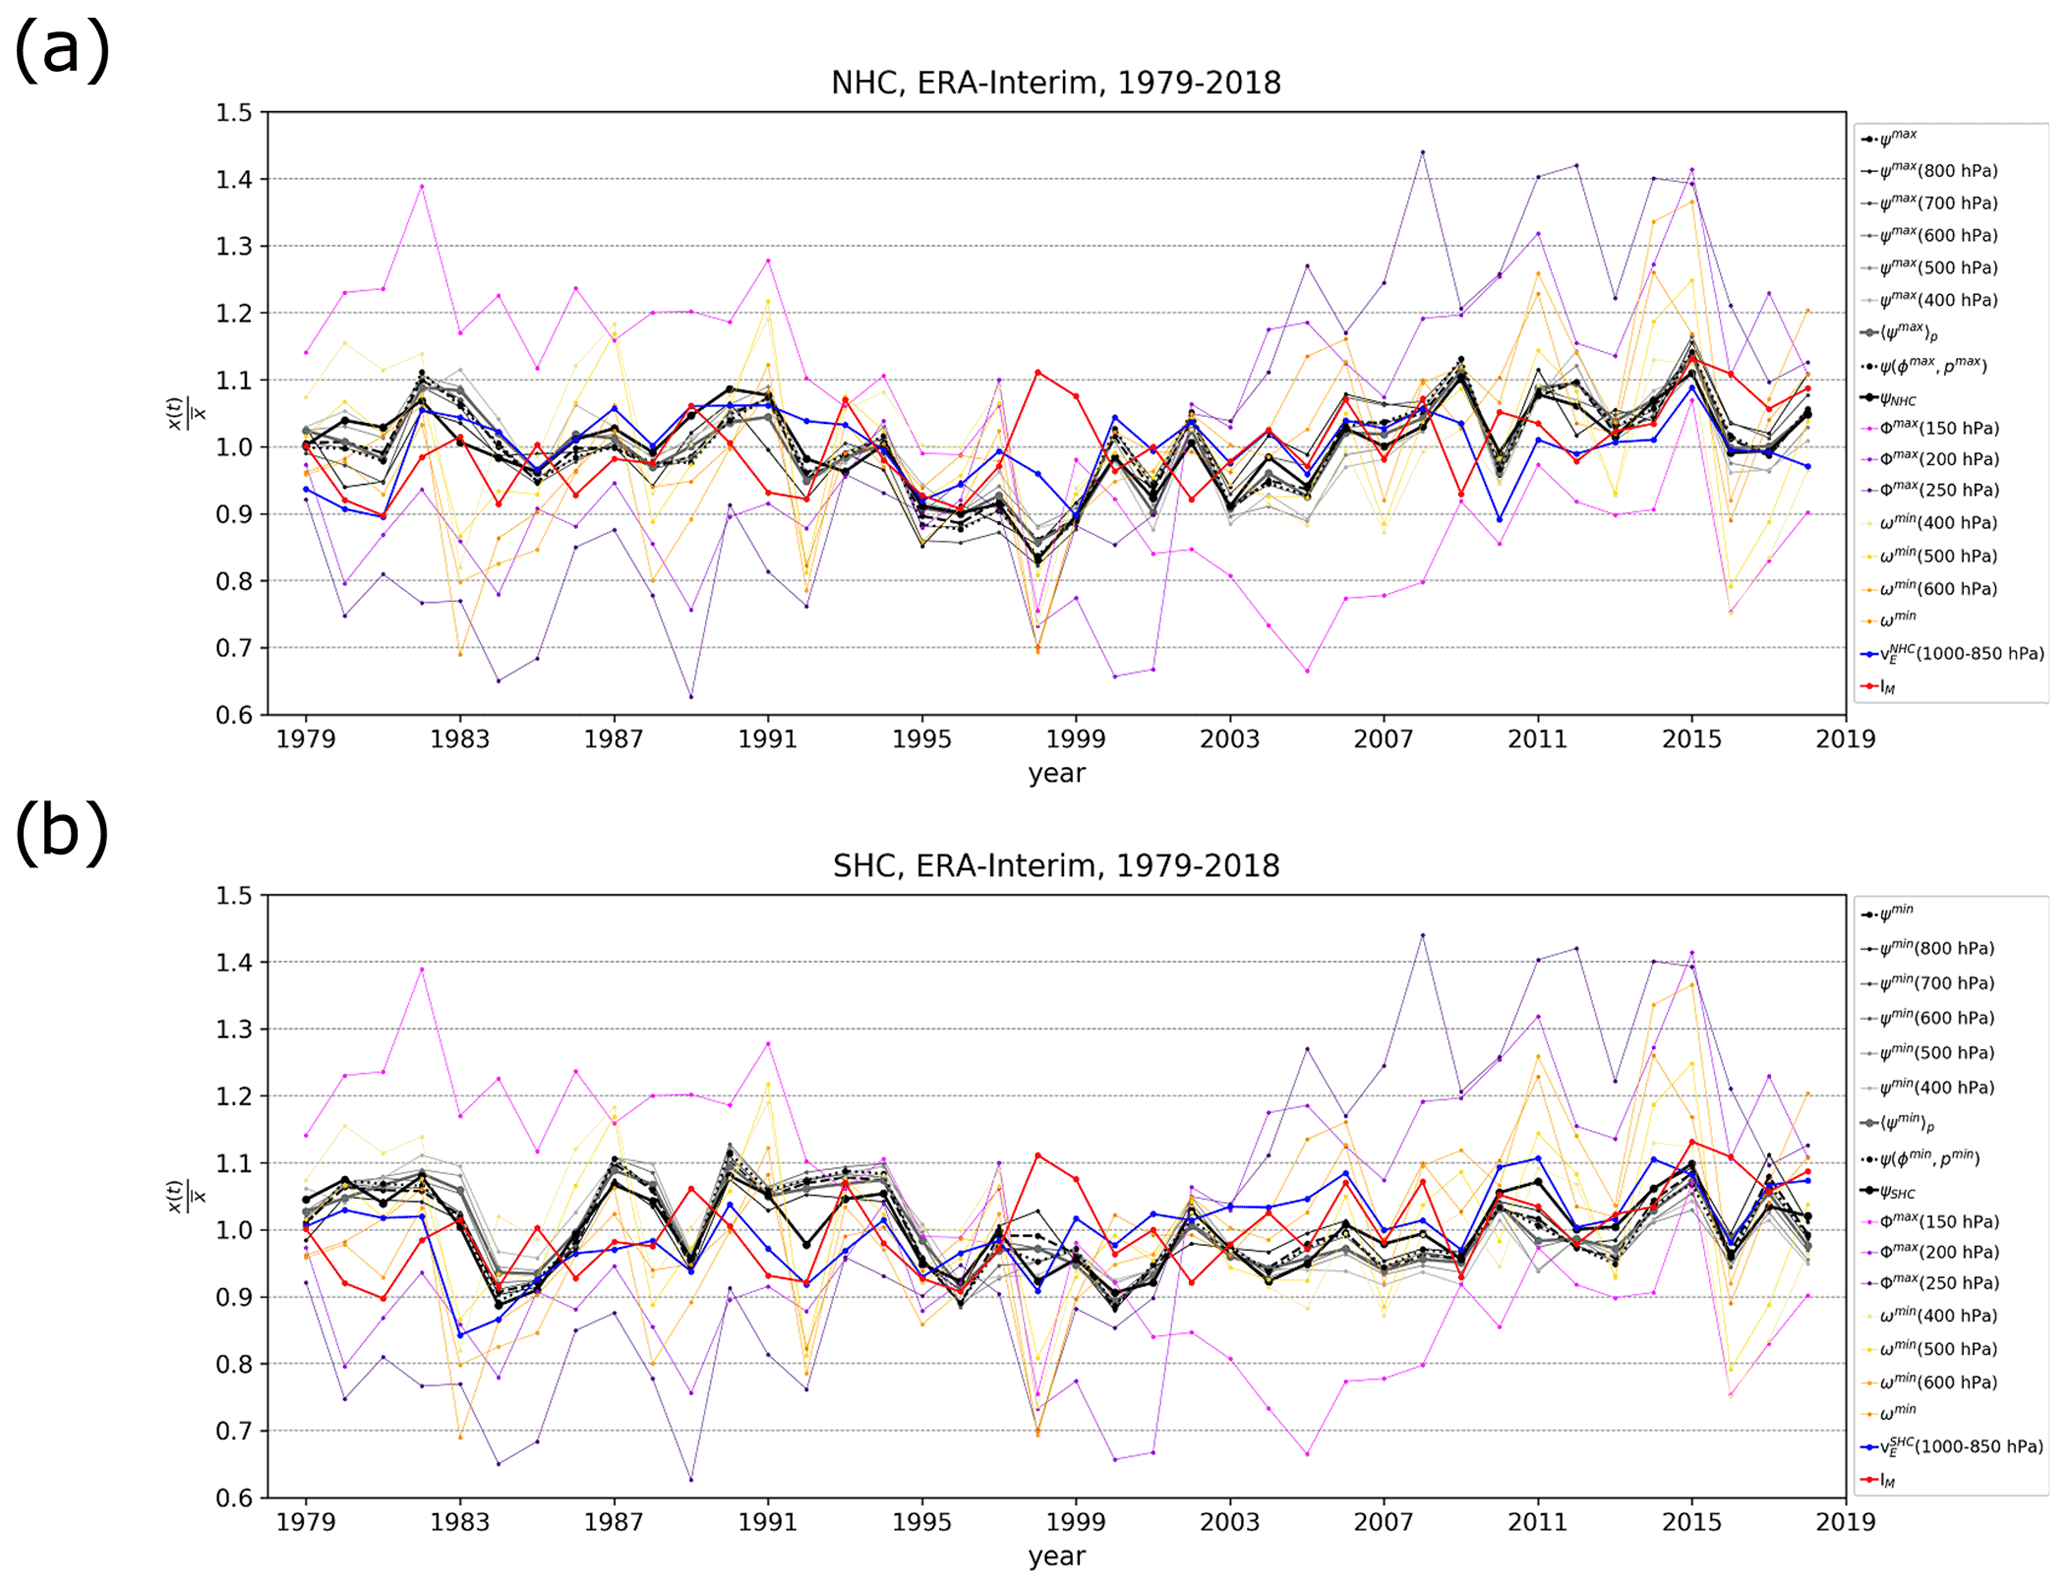
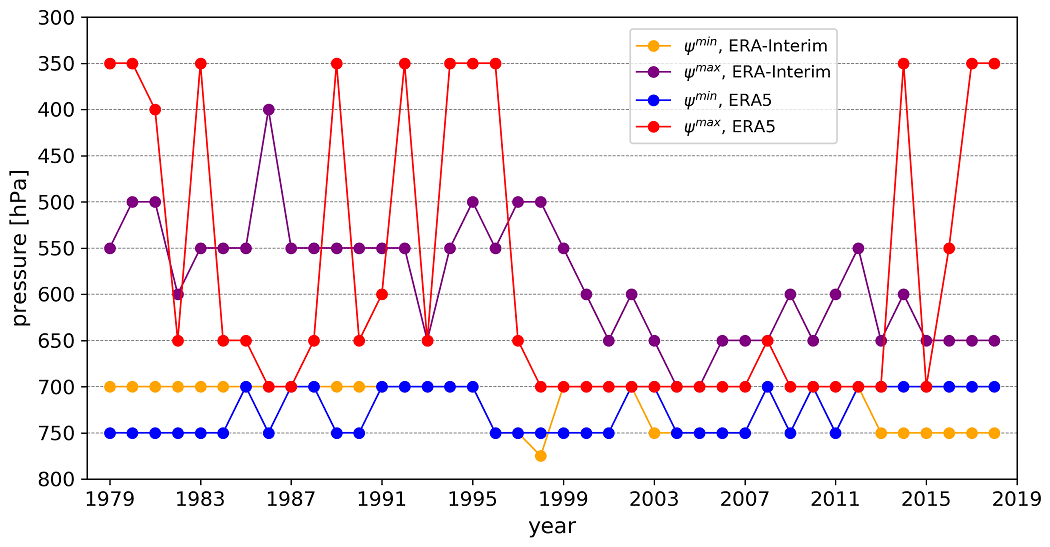
Figure A7Level of maximum and minimum stream function in annual-mean Hadley circulation between 1979 and 2018 in ERA5 and ERA-Interim reanalyses.

The results of this paper are based on the ERA-Interim reanalysis dataset, Copernicus Climate Change Service (C3S), available from https://www.ecmwf.int/en/forecasts/datasets/archive-datasets/reanalysis-datasets/era-interim (last access: 27 September 2020). ERA5 data (https://doi.org/10.24381/cds.bd0915c6, Hersbach et al., 2018) was downloaded from the Copernicus Climate Change Service (C3S) Climate Data Store (accessed 25 September 2020). The results contain modified Copernicus Climate Change Service information 2020. Neither the European Commission nor ECMWF is responsible for any use that may be made of the Copernicus information or data it contains.
Data used to generate Figs. 2–5 and A3–A6 are publicly available at https://github.com/zaplotnik/Metrics-of-Hadley-circulation-strength (last access: 6 May 2022) and published in Zenodo data repository: https://doi.org/10.5281/zenodo.6525718 (Pikovnik and Zaplotnik, 1996). Other scripts are available upon request.
MP performed numerical analysis and generated all figures. ŽZ devised the research, performed the modal analysis, and wrote the first draft of the manuscript. NŽ oversaw modal analysis. LB and NŽ provided additional insight and helped improve the manuscript for the final version.
The contact author has declared that neither they nor their co-authors have any competing interests.
Publisher’s note: Copernicus Publications remains neutral with regard to jurisdictional claims in published maps and institutional affiliations.
We thank three anonymous reviewers for their comprehensive reviews. Research of Nedjeljka Žagar contributes to the Cluster of Excellence 405 “CLICCS−Climate, Climatic Change, and Society” of the Center for Earth System Research and Sustainability (CEN) of Universität Hamburg.
This research has been supported by the Javna Agencija za Raziskovalno Dejavnost RS (grant no. J1-9431 and Programme P1-0188) and Trond Mohn Foundation (project BCPU, grant no. BFS2018TMT01).
This paper was edited by Juliane Schwendike and reviewed by three anonymous referees.
Adam, O., Grise, K. M., Staten, P., Simpson, I. R., Davis, S. M., Davis, N. A., Waugh, D. W., Birner, T., and Ming, A.: The TropD software package (v1): standardized methods for calculating tropical-width diagnostics, Geosci. Model Dev., 11, 4339–4357, https://doi.org/10.5194/gmd-11-4339-2018, 2018. a
Belmonte Rivas, M. and Stoffelen, A.: Characterizing ERA-Interim and ERA5 surface wind biases using ASCAT, Ocean Sci., 15, 831–852, https://doi.org/10.5194/os-15-831-2019, 2019. a
Burls, N. J. and Fedorov, A. V.: Wetter subtropics in a warmer world: Contrasting past and future hydrological cycles, P. Natl. Acad. Sci. USA, 114, 12888–12893, https://doi.org/10.1073/pnas.1703421114, 2017. a
Chemke, R. and Polvani, L. M.: Opposite tropical circulation trends in climate models and in reanalyses, Nat. Geosci., 12, 528–532, https://doi.org/10.1038/s41561-019-0383-x, 2019. a, b, c, d, e
D’Agostino, R. and Lionello, P.: Evidence of global warming impact on the evolution of the Hadley Circulation in ECMWF centennial reanalyses, Clim. Dynam., 48, 3047–3060, https://doi.org/10.1007/s00382-016-3250-0, 2017. a, b
Dee, D. P., Uppala, S. M., Simmons, A. J., Berrisford, P., Poli, P., Kobayashi, S., Andrae, U., Balmaseda, M. A., Balsamo, G., Bauer, P., Bechtold, P., Beljaars, A. C., van de Berg, L., Bidlot, J., Bormann, N., Delsol, C., Dragani, R., Fuentes, M., Geer, A. J., Haimberger, L., Healy, S. B., Hersbach, H., Hólm, E. V., Isaksen, L., Kållberg, P., Köhler, M., Matricardi, M., Mcnally, A. P., Monge-Sanz, B. M., Morcrette, J. J., Park, B. K., Peubey, C., de Rosnay, P., Tavolato, C., Thépaut, J. N., and Vitart, F.: The ERA-Interim reanalysis: Configuration and performance of the data assimilation system, Q. J. Roy. Meteor. Soc., 137, 553–597, https://doi.org/10.1002/qj.828, 2011. a
Grise, K. M. and Davis, S. M.: Hadley cell expansion in CMIP6 models, Atmos. Chem. Phys., 20, 5249–5268, https://doi.org/10.5194/acp-20-5249-2020, 2020. a
Held, I. M. and Soden, B. J.: Robust responses of the hydrological cycle to global warming, J. Climate, 19, 5686–5699, https://doi.org/10.1175/JCLI3990.1, 2006. a
Hersbach, H., Bell, B., Berrisford, P., Biavati, G., Horányi, A., Muñoz Sabater, J., Nicolas, J., Peubey, C., Radu, R., Rozum, I., Schepers, D., Simmons, A., Soci, C., Dee, D., and Thépaut, J.-N.: ERA5 hourly data on pressure levels from 1979 to present, Copernicus Climate Change Service (C3S) Climate Data Store (CDS) [data set], https://doi.org/10.24381/cds.bd0915c6, 2018. a, b
Hersbach, H., Bell, B., Berrisford, P., Hirahara, S., Horányi, A., Muñoz-Sabater, J., Nicolas, J., Peubey, C., Radu, R., Schepers, D., Simmons, A., Soci, C., Abdalla, S., Abellan, X., Balsamo, G., Bechtold, P., Biavati, G., Bidlot, J., Bonavita, M., De Chiara, G., Dahlgren, P., Dee, D., Diamantakis, M., Dragani, R., Flemming, J., Forbes, R., Fuentes, M., Geer, A., Haimberger, L., Healy, S., Hogan, R. J., Hólm, E., Janisková, M., Keeley, S., Laloyaux, P., Lopez, P., Lupu, C., Radnoti, G., de Rosnay, P., Rozum, I., Vamborg, F., Villaume, S., and Thépaut, J. N.: The ERA5 global reanalysis, Q. J. Roy. Meteor. Soc., 146, 1999–2049, https://doi.org/10.1002/qj.3803, 2020. a, b
Hoskins, B. J. and Yang, G. Y.: The detailed dynamics of the Hadley cell. Part II: December-February, J. Climate, 34, 805–823, https://doi.org/10.1175/JCLI-D-20-0504.1, 2021. a
Hoskins, B. J., Yang, G., and Fonseca, R. M.: The detailed dynamics of the June–August Hadley Cell, Q. J. Roy. Meteor. Soc., 146, 557–575, https://doi.org/10.1002/qj.3702, 2020. a
Hu, S. and Vallis, G. K.: Meridional structure and future changes of tropopause height and temperature, Q. J. Roy. Meteor. Soc., 145, 2698–2717, https://doi.org/10.1002/qj.3587, 2019. a
Hussain, M. M. and Mahmud, I.: pyMannKendall: a python package for non parametric Mann Kendall family of trend tests, Journal of Open Source Software, 4, 1556, https://doi.org/10.21105/joss.01556, 2019. a
IPCC: Climate Change 2021: The Physical Science Basis. Contribution of Working Group I to the Sixth Assessment Report of the Intergovernmental Panel on Climate Change, edited by: Masson-Delmotte, V., Zhai, P., Pirani, A., Connors, S., Péan, C., Berger, S., Caud, N., Chen, Y., Goldfarb, L., Gomis, M., Huang, M., Leitzell, K., Lonnoy, E., Matthews, J., Maycock, T., Waterfield, T., Yelekçi, O., Yu, R., and Zhou, B., Tech. rep., Cambridge University Press, in press, 2021. a
Kang, S. M., Deser, C., and Polvani, L. M.: Uncertainty in climate change projections of the hadley circulation: The role of internal variability, J. Climate, 26, 7541–7554, https://doi.org/10.1175/JCLI-D-12-00788.1, 2013. a, b
Kjellsson, J., Döös, K., Laliberté, F. B., and Zika, J. D.: The Atmospheric General Circulation in Thermodynamical Coordinates, J. Atmos. Sci., 71, 916–928, https://doi.org/10.1175/JAS-D-13-0173.1, 2014. a
Lucas, C., Rudeva, I., Nguyen, H., Boschat, G., and Hope, P.: Variability and changes to the mean meridional circulation in isentropic coordinates, Clim. Dynam., 58, 257–276, https://doi.org/10.1007/S00382-021-05903-9, 2021. a
Mathew, S. S. and Kumar, K. K.: On the role of precipitation latent heating in modulating the strength and width of the Hadley circulation, Theor. Appl. Climatol., 136, 661–673, https://doi.org/10.1007/s00704-018-2515-4, 2019. a
Menzel, M. E., Waugh, D., and Grise, K.: Disconnect Between Hadley Cell and Subtropical Jet Variability and Response to Increased CO2, Geophys. Res. Lett., 46, 7045–7053, https://doi.org/10.1029/2019GL083345, 2019. a, b
Mitas, C. M. and Clement, A.: Has the Hadley cell been strengthening in recent decades?, Geophys. Res. Lett., 32, 1–5, https://doi.org/10.1029/2004GL021765, 2005. a, b, c, d
Nguyen, H., Evans, A., Lucas, C., Smith, I., and Timbal, B.: The hadley circulation in reanalyses: Climatology, variability, and Change, J. Climate, 26, 3357–3376, https://doi.org/10.1175/JCLI-D-12-00224.1, 2013. a, b, c
Oort, A. H. and Yienger, J. J.: Observed interannual variability in the Hadley circulation and its connection to ENSO, J. Climate, 9, 2751–2767, https://doi.org/10.1175/1520-0442(1996)009<2751:OIVITH>2.0.CO;2, 1996. a
Pikovnik, M. and Zaplotnik, Ž.: zaplotnik/Metrics-of-Hadley-circulation-strength (HC_strength_metrics_trends), Zenodo [data set], https://doi.org/10.5281/zenodo.6525718, 2022. a
Simmons, A. J.: Trends in the tropospheric general circulation from 1979 to 2022, Weather Clim. Dynam. Discuss. [preprint], https://doi.org/10.5194/wcd-2022-19, in review, 2022. a
Sohn, B. J. and Park, S.-C.: Strengthened tropical circulations in past three decades inferred from water vapor transport, J. Geophys. Res., 115, D15112, https://doi.org/10.1029/2009JD013713, 2010. a, b, c
Solomon, A., Polvani, L. M., Waugh, D. W., and Davis, S. M.: Contrasting upper and lower atmospheric metrics of tropical expansion in the Southern Hemisphere, Geophys. Res. Lett., 43, 496–503, https://doi.org/10.1002/2016GL070917, 2016. a
Son, S. W., Kim, S. Y., and Min, S. K.: Widening of the Hadley Cell from Last Glacial Maximum to future climate, J. Climate, 31, 267–281, https://doi.org/10.1175/JCLI-D-17-0328.1, 2018. a
Stachnik, J. P. and Schumacher, C.: A comparison of the Hadley circulation in modern reanalyses, J. Geophys. Res.-Atmos., 116, D22102, https://doi.org/10.1029/2011JD016677, 2011. a, b, c, d
Staten, P. W., Lu, J., Grise, K. M., Davis, S. M., and Birner, T.: Re-examining tropical expansion, Nat. Clim. Change, 8, 1–8, https://doi.org/10.1038/s41558-018-0246-2, 2018. a
Tanaka, H. L., Ishizaki, N., and Kitoh, A.: Trend and interannual variability of Walker, monsoon and Hadley circulations defined by velocity potential in the upper troposphere, Tellus A, 56, 250–269, https://doi.org/10.1111/j.1600-0870.2004.00049.x, 2004. a, b, c
Wang, C.: Atmospheric circulation cells associated with the El Nino-Southern Oscillation, J. Climate, 15, 399–419, https://doi.org/10.1175/1520-0442(2002)015<0399:ACCAWT>2.0.CO;2, 2002. a, b
Waugh, D. W., Grise, K. M., Seviour, W. J., Davis, S. M., Davis, N., Adam, O., Son, S. W., Simpson, I. R., Staten, P. W., Maycock, A. C., Ummenhofer, C. C., Birner, T., and Ming, A.: Revisiting the relationship among metrics of tropical expansion, J. Climate, 31, 7565–7581, https://doi.org/10.1175/JCLI-D-18-0108.1, 2018. a
Wu, Y., Lu, J., and Pauluis, O.: Weakening of Upward Mass but Intensification of Upward Energy Transport in a Warming Climate, Geophys. Res. Lett., 46, 1672–1680, https://doi.org/10.1029/2018GL081399, 2019. a
Yue, S. and Wang, C.: Applicability of Prewhitening to Eliminate the Influence of Serial Correlation on the Mann-Kendall Test, Water Resour. Res., 38, 1–4, https://doi.org/10.1029/2001WR000861, 2002. a
Žagar, N. and Tribbia, E. J.: Modal View Of Atmospheric Variability: Applications Of Normal-Mode Function Decomposition in Weather and Climate Research, Springer Nature, ISBN 978-3030609627, 2020. a, b
Žagar, N., Kasahara, A., Terasaki, K., Tribbia, J., and Tanaka, H.: Normal-mode function representation of global 3-D data sets: open-access software for the atmospheric research community, Geosci. Model Dev., 8, 1169–1195, https://doi.org/10.5194/gmd-8-1169-2015, 2015. a, b, c
Žagar, N., Jelić, D., Blaauw, M., and Bechtold, P.: Energy Spectra and Inertia–Gravity Waves in Global Analyses, J. Atmos. Sci., 74, 2447–2466, https://doi.org/10.1175/jas-d-16-0341.1, 2017. a
Žagar, N., Zaplotnik, Z., and Karami, K.: Atmospheric Subseasonal Variability and Circulation Regimes: Spectra, Trends and Uncertainties, J. Climate, 33, 9375–9390, https://doi.org/10.1175/jcli-d-20-0225.1, 2020. a
Zaplotnik, Z., Pikovnik, M., and Boljka, L.: Recent Hadley Circulation Strengthening: A Trend or Multidecadal Variability?, J. Climate, 35, 4157–4176, https://doi.org/10.1175/JCLI-D-21-0204.1, 2022. a, b, c