the Creative Commons Attribution 4.0 License.
the Creative Commons Attribution 4.0 License.
 | 29 Jul 2022
The tropical route of quasi-biennial oscillation (QBO) teleconnections in a climate model
Jorge L. García-Franco
Lesley J. Gray
Scott Osprey
Robin Chadwick
Zane Martin
The influence of the quasi-biennial oscillation (QBO) on tropical climate is demonstrated using 500-year pre-industrial control simulations from the Met Office Hadley Centre model. Robust precipitation responses to the phase of the QBO are diagnosed in the model, which show zonally asymmetric patterns that resemble the El Niño–Southern Oscillation (ENSO) impacts. These patterns are found because the frequency of ENSO events for each QBO phase is significantly different in these simulations, with more El Niño events found under the westerly phase of the QBO (QBOW) and more La Niña events for the easterly phase (QBOE). The QBO–ENSO relationship is non-stationary and subject to decadal variability in both models and observations. In addition, regression analysis shows that there is a QBO signal in precipitation that is independent of ENSO. No evidence is found to suggest that these QBO–ENSO relationships are caused by ENSO modulating the QBO in the simulations. A relationship between the QBO and a dipole of precipitation in the Indian Ocean is also found in models and observations in boreal fall, characterised by a wetter western Indian Ocean and drier conditions in the eastern part for QBOW and the opposite under QBOE conditions. The Walker circulation is significantly weaker during QBOW compared to QBOE, which could explain the observed and simulated zonally asymmetric precipitation responses at equatorial latitudes, as well as the more frequent El Niño events during QBOW. Further work, including targeted model experiments, is required to better understand the mechanisms causing these relationships between the QBO and tropical convection.
- Article
(6363 KB) - Full-text XML
-
Supplement
(5441 KB) - BibTeX
- EndNote


Long-distance effects or teleconnections associated with the stratospheric quasi-biennial oscillation (QBO) have been well documented in the subtropics and extratropics, including, for example, the stratospheric polar vortex (Holton and Tan, 1980; Anstey and Shepherd, 2014; Domeisen et al., 2019; Lu et al., 2020), the subtropical jets (Garfinkel and Hartmann, 2011a; Hansen et al., 2016; Ma et al., 2021) and the North Atlantic Oscillation (Hansen et al., 2016; Gray et al., 2018; Andrews et al., 2019). Observational and modelling evidence suggests that there is also a tropical route of influence of the QBO through impacts on monsoons (Giorgetta et al., 1999; Claud and Terray, 2007; Liess and Geller, 2012), the Intertropical Convergence Zone (ITCZ) (Gray et al., 2018), tropical sea-surface temperatures (SSTs) (Garfinkel and Hartmann, 2011b; Huang et al., 2012), tropical high clouds (Liess and Geller, 2012; Peña-Ortiz et al., 2019), tropical cyclones (Ho et al., 2009; Jaramillo et al., 2021) and the Madden–Julian Oscillation (MJO) (Son et al., 2017; Wang et al., 2019; Martin et al., 2021c). For recent reviews on stratosphere–troposphere coupling in the tropics, see Haynes et al. (2021) and Hitchman et al. (2021).
The tropical route of QBO teleconnections remains less well understood than other routes for various reasons. One reason is that the observational record is too short to diagnose robust differences between the two QBO phases in a 30–40-year-long dataset as variability in the tropics on QBO timescales is dominated by El Niño–Southern Oscillation (ENSO) (Liess and Geller, 2012; Seo et al., 2013; Gray et al., 2018). Similarly, the modulation of the location and strength of tropical convection by ENSO events can influence the characteristics of the QBO (Taguchi, 2010; Schirber, 2015; Geller et al., 2016; Christiansen et al., 2016; Serva et al., 2020), which makes it difficult to separate the cause and effects of ENSO and the QBO.
However, multiple lines of evidence suggest that there is a modulation of several features of tropical climate by the QBO. In observations, impacts of the QBO over monsoon regions have been diagnosed in satellite-derived fields such as cloud height, occurrence and out-going longwave radiation (Collimore et al., 2003; Liess and Geller, 2012), as well as in surface precipitation (Seo et al., 2013; Gray et al., 2018). The observational evidence shows zonally asymmetric impacts – indicating that the QBO influence depends on longitude. A proposed mechanism suggests a QBO modulation of the Walker circulation (Collimore et al., 2003; Liess and Geller, 2012). Additionally, analyses of observations and forecast models have found that the MJO is stronger and more predictable under the easterly phase in the lower stratosphere (Son et al., 2017; Lim et al., 2019; Klotzbach et al., 2019; Martin et al., 2020, 2021c).
Several of the observed relationships between the QBO and tropical convective phenomena appear to be non-stationary or intermittent. For example, Gray (1984) found evidence for a QBO modulation of Atlantic tropical cyclones, but this link seemingly disappears after 1990 (Camargo and Sobel, 2010). A second example is the QBO–ENSO relationship; during the 1953–1980 period, La Niña (LN) events were more frequent under the westerly phase of the QBO (QBOW) and El Niño (EN) events during the easterly phase (QBOE) suggesting an anti-correlation of QBO–ENSO indices (Garfinkel and Hartmann, 2007; Hu et al., 2012; Domeisen et al., 2019). However, the relationship between the QBO and ENSO indices has become positive since 1985 (Taguchi, 2010; Liess and Geller, 2012). Interdecadal variations have also been observed in the signs of the QBO–Walker circulation (Hu et al., 2012; Hitchman et al., 2021) and MJO–QBO relationships (Klotzbach et al., 2019).
Modelling studies have also investigated tropical surface impacts associated with the QBO. For example, Giorgetta et al. (1999) found that boreal summer monsoon regions exhibit a significant response in cloudiness to the QBO winds in a general circulation model (GCM). In a cloud-resolving model, Nie and Sobel (2015) found that the influence of the QBO may depend on the strength of convection and SST forcing, suggesting a non-linear effect of the QBO on the convective processes.
A relatively smaller number of studies have analysed tropical QBO teleconnections in GCMs. For example, Rao et al. (2020) analysed the precipitation response to the QBO in models from the Coupled Model Intercomparison Project phase 6 (CMIP6) cohort and found large model disagreement in the sign and pattern of the precipitation response. In contrast, Serva et al. (2022) analysed simulations from the QBO-initiative (QBOi) (Butchart et al., 2018) project and found robust responses across models in the East Pacific ITCZ that are similar to the observed pattern (Gray et al., 2018).
Moreover, the physical mechanisms through which the QBO could influence tropical climate are also not well understood. The influence of the QBO over the temperature and vertical wind shear near the tropopause layer (Tegtmeier et al., 2020; Martin et al., 2021b) has been hypothesised to affect tropical deep convection. For example, early studies (Gray, 1984; Collimore et al., 2003) argue that the QBO induces changes to the vertical wind shear or static stability in the upper-troposphere–lower-stratosphere (UTLS) that can modify the depth of convection at equatorial latitudes. However, other studies suggest that the surface impact of the QBO may be a function of both the UTLS temperature changes and the tropospheric forcing (Nie and Sobel, 2015).
In short, observational uncertainty limits the confidence in the diagnosis of impacts from the QBO to the tropical troposphere. This paper aims to address these shortcomings by investigating the tropical route of QBO influence using long integrations of the UK Met Office Hadley Centre (MOHC) Unified Model (UM) submitted to CMIP6. The model extends to the mesosphere and includes a self-generated QBO via a non-orographic gravity wave scheme that compares well with the observed QBO (Richter et al., 2020). The CMIP6 pre-industrial control (piControl) experiments with constant 1850 external forcing are examined to exploit their length (500 years) and the resulting statistical robustness of the diagnosed QBO impacts. QBO–MJO connections are excluded from this study as they have already been explored and found largely absent in the MOHC models (Kim et al., 2020).
The paper is structured as follows. Section 2 describes the simulations together with the observational and reanalysis data that are employed for comparison and verification, as well as the composite and regression techniques employed in the study. Section 3 examines evidence for QBO signals in a variety of tropical climate indicators, including precipitation, the ITCZ, monsoons, ENSO, the Walker circulation and the Indian Ocean Dipole (IOD). The final section provides a summary and conclusions of the main findings.
2.1 Observations and reanalysis
The gridded precipitation datasets used in this study are the 1∘ resolution Global Precipitation Climatology Project (GPCP) v2.3 (Adler et al., 2003) dataset and the Global Precipitation Climatology Centre (GPCC) dataset version 6 at 0.5∘ resolution (Becker et al., 2011; Schneider et al., 2011) – in both cases available as monthly means. GPCP is a merged product of satellite and land rain-gauge observations and provides coverage over land and ocean, whereas GPCC uses a large network of surface station data going back to the early 1900s and has a higher horizontal resolution but does not provide data over oceanic regions (Becker et al., 2013; Adler et al., 2018). The HadSST 4.0 dataset is used for SSTs (1930–2021) (Kennedy et al., 2019). Zonal winds at the 70 hPa level from the Freie Universität Berlin (FUB) radiosonde dataset and from a long reconstruction (1930–2021 in this study) from sea-level pressure data (Brönnimann et al., 2007; hereafter B07) are also used to diagnose the QBO (see Sect. 2.3).
For the other diagnostics, including zonal wind, vertical velocity and convective precipitation, we use the European Centre for Medium-Range Weather Forecasts (ECMWF) ERA5 Reanalyses (Hersbach et al., 2020) downloaded at the resolution. Monthly mean data were used for all observational datasets. The GPCP and ERA5 datasets span the 1979–2021 period, whereas the period 1953–2019 is used for GPCC.
2.2 CMIP6 data
The MOHC submitted three simulations for the piControl experiment of CMIP6 using two models: HadGEM3 GC3.1 at N96 and N216 horizontal resolutions (hereafter referred to as GC3 N96-pi and GC3 N216-pi) and UKESM1 at N96 horizontal resolution (hereafter referred to as UKESM N96-pi). The HadGEM3 model is the core physical climate model, and UKESM1 is an earth system model extension, with additional treatment of aspects of, for example, land surface, ocean and sea-ice processes, as well as improved chemical processes (Kuhlbrodt et al., 2018; Williams et al., 2018; Sellar et al., 2019). The N in N96 refers to the maximum number of zonal 2 grid-point waves that can be represented by the model (Walters et al., 2019) at that resolution, so the N96 and N216 atmospheric resolutions at the mid-latitudes are and , respectively, whereas their oceanic resolutions using the NEMO model are 1∘ (ORCA1) and 0.25∘ (ORCA025) (Williams et al., 2018), respectively.
The three simulations (GC3 N216-pi, UKESM N96-pi and GC3 N96-pi) used in this study are 500 years long and have the same experimental design with only one ensemble member. The simulations were run with constant year-1850 external forcing; further details about the MOHC piControl experiments can be found in Menary et al. (2018) and about the UKESM1 model in Sellar et al. (2019). The majority of diagnostics are shown for the GC3 N216-pi simulation, and comparisons with the other two simulations are noted where appropriate.
The equatorial climate of GC3 N216-pi captures tropical dynamical processes including mean and extreme precipitation reasonably well (García-Franco et al., 2020; Abdelmoaty et al., 2021) as this configuration is amongst the best compared to other CMIP5/CMIP6 models, e.g. in tropical extreme precipitation (Abdelmoaty et al., 2021) and the annual cycle of equatorial Atlantic SSTs and low-level winds (Richter and Tokinaga, 2020). However, notable biases of the MOHC models include the southward bias of the Atlantic ITCZ linked to the dry Amazon bias and a wet bias over the East Pacific ITCZ (García-Franco et al., 2020).
Furthermore, the MOHC models have improved their representation of ENSO characteristics; e.g. Lee et al. (2021) finds that HadGEM3 configurations represent the pattern, seasonal cycle, amplitude and life cycle of ENSO better than the CMIP6 multi-model mean. These results agree with other studies that indicate the GC3 N216-pi configuration reasonably simulates the seasonal phase-locking and the spectral power of ENSO (Menary et al., 2018; Richter and Tokinaga, 2020; Liu et al., 2021).
In the stratosphere, this and previous configurations of the model reasonably simulate the QBO (Schenzinger et al., 2017; Richter et al., 2020; Bushell et al., 2022). The model QBO is driven by both resolved and parameterised non-orographic gravity waves (Scaife et al., 2002; Walters et al., 2019) and is tied to total precipitation sources in the tropics (Bushell et al., 2015). However, the atmosphere model configuration used in this study underestimates the amplitude of the QBO in the lower stratosphere (60–90 hPa), with the maximum bias found at 70 hPa of 5 m s−1, and the power spectrum of QBO periods shows more power at longer periods (32–36 months) than observations (Bushell et al., 2022).
2.3 Indices
The index used to characterise the QBO for ERA5, the FUB and the simulations is the monthly mean zonal-mean zonal winds at 70 hPa averaged between 5∘ S and 5∘ N, which is well suited to diagnose impacts in the tropical tropopause region (Huesmann and Hitchman, 2001; Gray et al., 2018; Hitchman et al., 2021; Serva et al., 2022). The QBO phase is defined using a threshold of 2 m s−1 (Garfinkel and Hartmann, 2010), so the transition months when the QBO winds fall within the range ±2 m s−1 are excluded. The reconstruction from B07 uses the 90 hPa winds and a threshold of ±2 m s−1. The amplitude and descent rates of the QBO are calculated using the deseasonalised zonal-mean zonal wind averaged over the stated latitudes between 10 and 70 hPa. The amplitude (A) of the QBO is defined using the first and second principal components (PCs) following an empirical orthogonal function (EOF) decomposition of the 10–70 hPa wind time series (Serva et al., 2020) as . The descent rates are calculated following Schenzinger et al. (2017) for descending westerly and easterly phases individually by finding the level of the zero wind line (u=0) for each month computing the height difference between consecutive months. These definitions of the amplitude and descent rates were chosen to evaluate the influence of ENSO on the whole profile of the QBO and not just one single level.
The EN3.4 SST index is used to characterise ENSO by area-averaging the box within 5∘ S–5∘ N and 190–240∘ E. A 5-month running mean of the index is calculated and a threshold of ±0.5 K used to define positive (EN) and negative (LN) events. ENSO-neutral (NN) months are defined where the magnitude of the EN3.4 index is smaller than ±0.5 K. For the Indian Ocean Dipole (IOD), an index to characterise the zonal gradient in convective precipitation in the Indian Ocean (convective IOD Index) was defined as the difference of the deseasonalised area-averaged convective precipitation between the western (50–70∘ E) and eastern (80–100∘ E) equatorial (10∘ S–10∘ N) Indian Ocean, which is in a similar region as the standard SST IOD index (Wang and Wang, 2014). This index was computed using the convective precipitation from the models and ERA5, and IOD events were defined using a 1 standard deviation threshold.
2.4 Analysis techniques
Composite analysis is the primary technique used in the study. Annual-mean and seasonal-mean composites were derived by computing weighted averages to account for differences in the number of samples from each month and avoid a possible seasonal effect due to QBO or ENSO phase-locking, so all months contribute equally to a seasonal- or annual-mean composite. The length of the experiments is such that the number of total El Niño and La Niña months for GC3 N216-pi were 1700 and 1600, respectively, whereas 2400 months were classified as QBOW and 1800 as QBOE. Moreover, EN months found under QBOW were 626 compared to 392 under QBOE for the simulation, whereas in the observed 1979–2020 period using HadSST SSTs and the ERA5 QBO index, 65 QBOW–EN months and 45 QBOE–EN months were diagnosed. The ratio of QBOW–EN and QBOE–EN months to the total number of available months is slightly lower in the models (0.10 and 0.06, respectively) compared to ERA5 1979–2020 (0.11 and 0.08, respectively) because in the models fewer months satisfy our threshold for each QBO phase at 70 hPa due to the low-amplitude bias of the QBO in the lower stratosphere in GCMs (Schenzinger et al., 2017; Bushell et al., 2022).
In addition to composite analysis, multi-linear regression analysis is also employed to explore the impact of one or more of the indices. Previous studies have shown that the regression can separate candidate mechanisms or indices (Gray et al., 2018; Misios et al., 2019; Rao et al., 2020), for example, by removing the influence of ENSO. Details of the regression analysis technique are provided in Appendix A.
The statistical significance of the observed composite differences is estimated using a randomised resampling (“bootstrapping with replacement”) method that generates a distribution of differences constructed from randomly sampling the observed period.
The significance level is then interpreted as QBO W–E differences that are outside of the 95 % confidence level of the distribution of randomly generated differences. The significance in the simulations is estimated using Welch's two-sided t test, but other bootstrap methods were tested without significantly changing the results.
The tropical precipitation response to the QBO phase is analysed first in the annual mean and then by season (Sect. 3.1). The potential for aliasing with the ENSO signal is investigated (Sect. 3.2), and QBO–ENSO interactions are further explored (Sect. 3.3), as well as QBO interactions with the Indian Ocean dipole (IOD). Finally, interactions between the QBO and the ITCZ, monsoons and the Walker circulation are identified and discussed in Sect. 3.4.
3.1 Precipitation
QBO composite differences in annual mean precipitation (QBOW minus QBOE) are shown in Fig. 1 for the GPCP observational dataset and the three model simulations. In the observations, the QBO signals are largest and statistically significant in the tropical Pacific, equatorial Atlantic and Indian oceans, in good agreement with previous analyses (Liess and Geller, 2012; Gray et al., 2018). The three simulations show positive differences of up to 1.2 mm d−1 in the equatorial Central Pacific and the Indian Ocean and negative differences of up to 0.6 mm d−1 in the off-equatorial North Pacific. In the tropical Atlantic, however, there is a weak but significant signal in two of the simulations, but this signal is absent in the case of GC3 N96-pi. Note that precipitation in this region is affected by the biased southward position of the Atlantic ITCZ in the model which is more pronounced in December–January–February (DJF) (García-Franco et al., 2020).
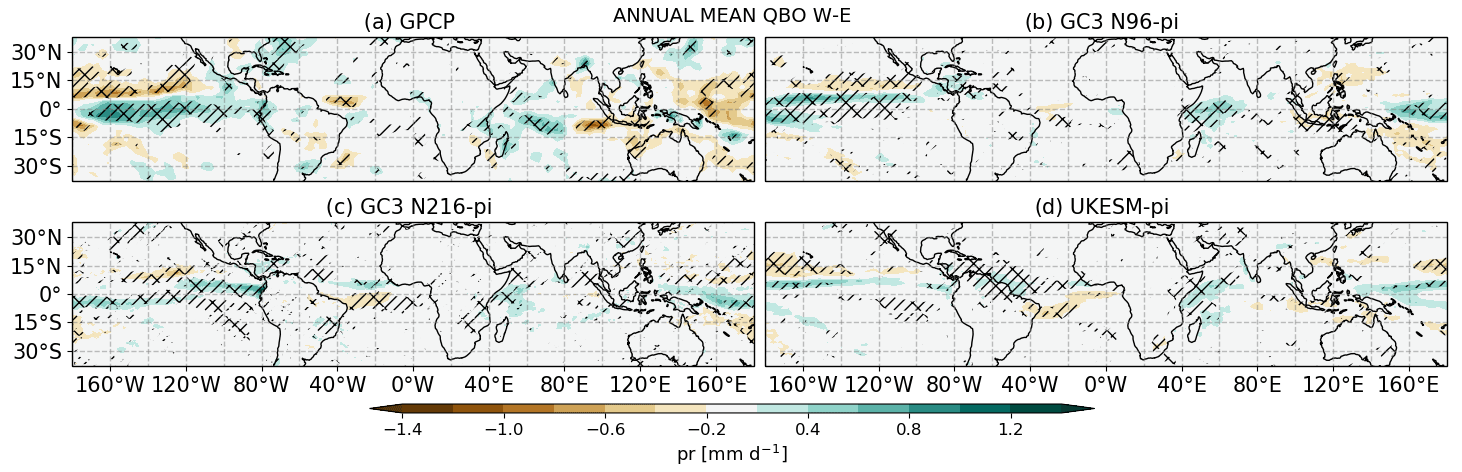
Figure 1QBOW minus QBOE composite differences in annual-mean precipitation [mm d−1] from (a) GPCP, (b) GC3 N96-pi, (c) GC3 N216-pi and (d) UKESM N96-pi. Hatching denotes statistically significant differences at the 95 % confidence level.
The precipitation signal associated with the QBO is strongly dependent on the seasonal cycle in the model. Figure 2 shows a comparison of the GPCP dataset and GC3 N216-pi for individual seasons (see Fig. S1 in the Supplement for the other models). The positive equatorial Pacific signal in the GPCP dataset, which resembles an El Niño anomaly (Dommenget et al., 2013; Capotondi et al., 2015), is particularly strong and statistically significant in DJF (Fig. 2a). In GC3 N216-pi, the QBO signal in the Pacific is significant in all seasons but is generally weaker than observations likely due to the greater number of years in the simulation.
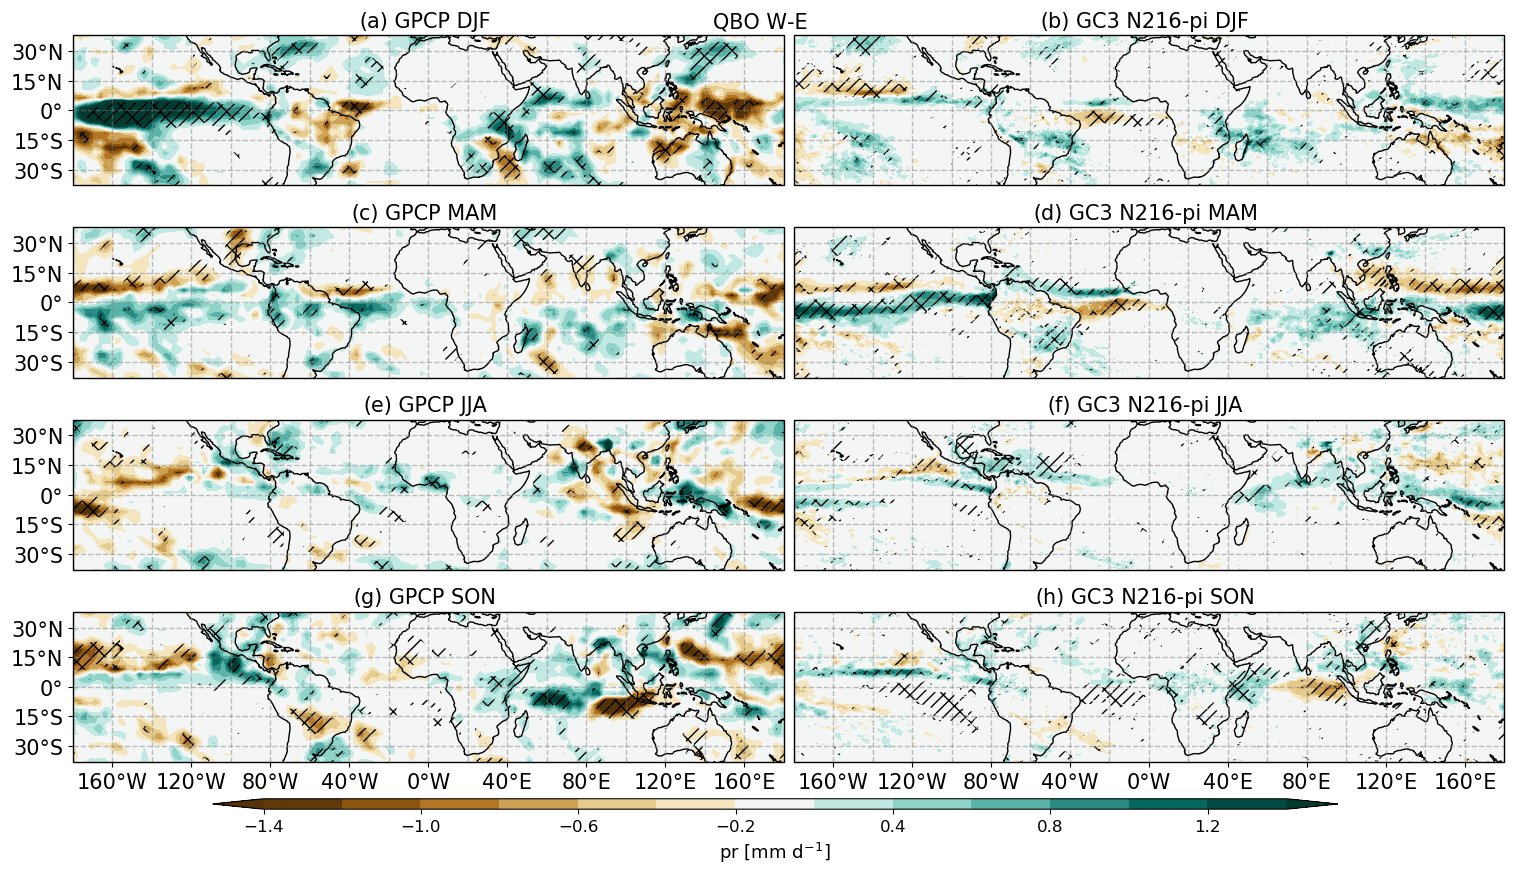
Figure 2As in Fig. 1 but showing seasonal-mean QBO composites from (a, c, e, g) GPCP and (b, d, f, h) GC3 N216-pi for (a, b) December–January–February (DJF), (c, d) March–April–May (MAM), (e, f) June–July–August (JJA) and (g, h) September–October–November (SON) from top to bottom.
In the Atlantic, the QBO signal over the ITCZ region is more evident in the individual seasons. In DJF, the model response becomes negative in the southern equatorial Atlantic, whereas in March–April–May (MAM) the response is characterised by a dipole that resembles a northward shift of the Atlantic ITCZ. In addition, all models indicate that the Caribbean Sea is wetter in June–July–August (JJA) during QBOW than in QBOE (see Figs. 2 and S1). In the Indian Ocean, all models show relatively large and significant differences in September–October–November (SON; Fig. 2e and f), characterised by a dipole of wet anomalies to the west and dry anomalies to the east. The dipole anomalies suggest a possible QBO influence on the IOD, which is characterised by a zonal gradient of SSTs and convective activity in the Indian Ocean that is specially prominent in SON (Saji et al., 1999; Deser et al., 2010; McKenna et al., 2020). This possibility is explored further in Sect. 3.3 below.
In summary, the observed (1979–2020) composite analyses show a zonally asymmetric QBO signal primarily in the ITCZ regions over the oceans, consistent with previous studies (Liess and Geller, 2012; Gray et al., 2018). The results in the simulations show several regions where there is a significant precipitation difference associated with the QBO phase. The significant response to the QBO in these long simulations (500 years) suggests that the analysis of the modelled QBO signals may help us to understand the mechanisms that give rise to the QBO signals at the surface. However, the QBO signals in the models show strong similarities to well-known response patterns for ENSO and the IOD. Before further investigating the QBO surface impacts, these tropical interactions are investigated in the following sections.
3.2 Potential aliasing of QBO and ENSO signals
The tropical SSTs and the EN3.4 index differences for each QBO phase are investigated in this section to understand the precipitation patterns found in Figs. 1 and 2. The SST response (QBO W–E) closely follows the precipitation patterns for observations and models (Figs. 3, S2 and S3), with warmer SSTs found in regions with increased precipitation. In DJF, warmer SSTs in the equatorial Pacific and western Indian oceans are observed for QBOW compared to QBOE. In particular, the pattern in the HadSST dataset since 1979 resembles an East Pacific (or “standard”) El Niño, whereas the simulated anomalies in DJF (see also Fig. S3) are weaker and resemble a Central Pacific El Niño (Capotondi et al., 2015).
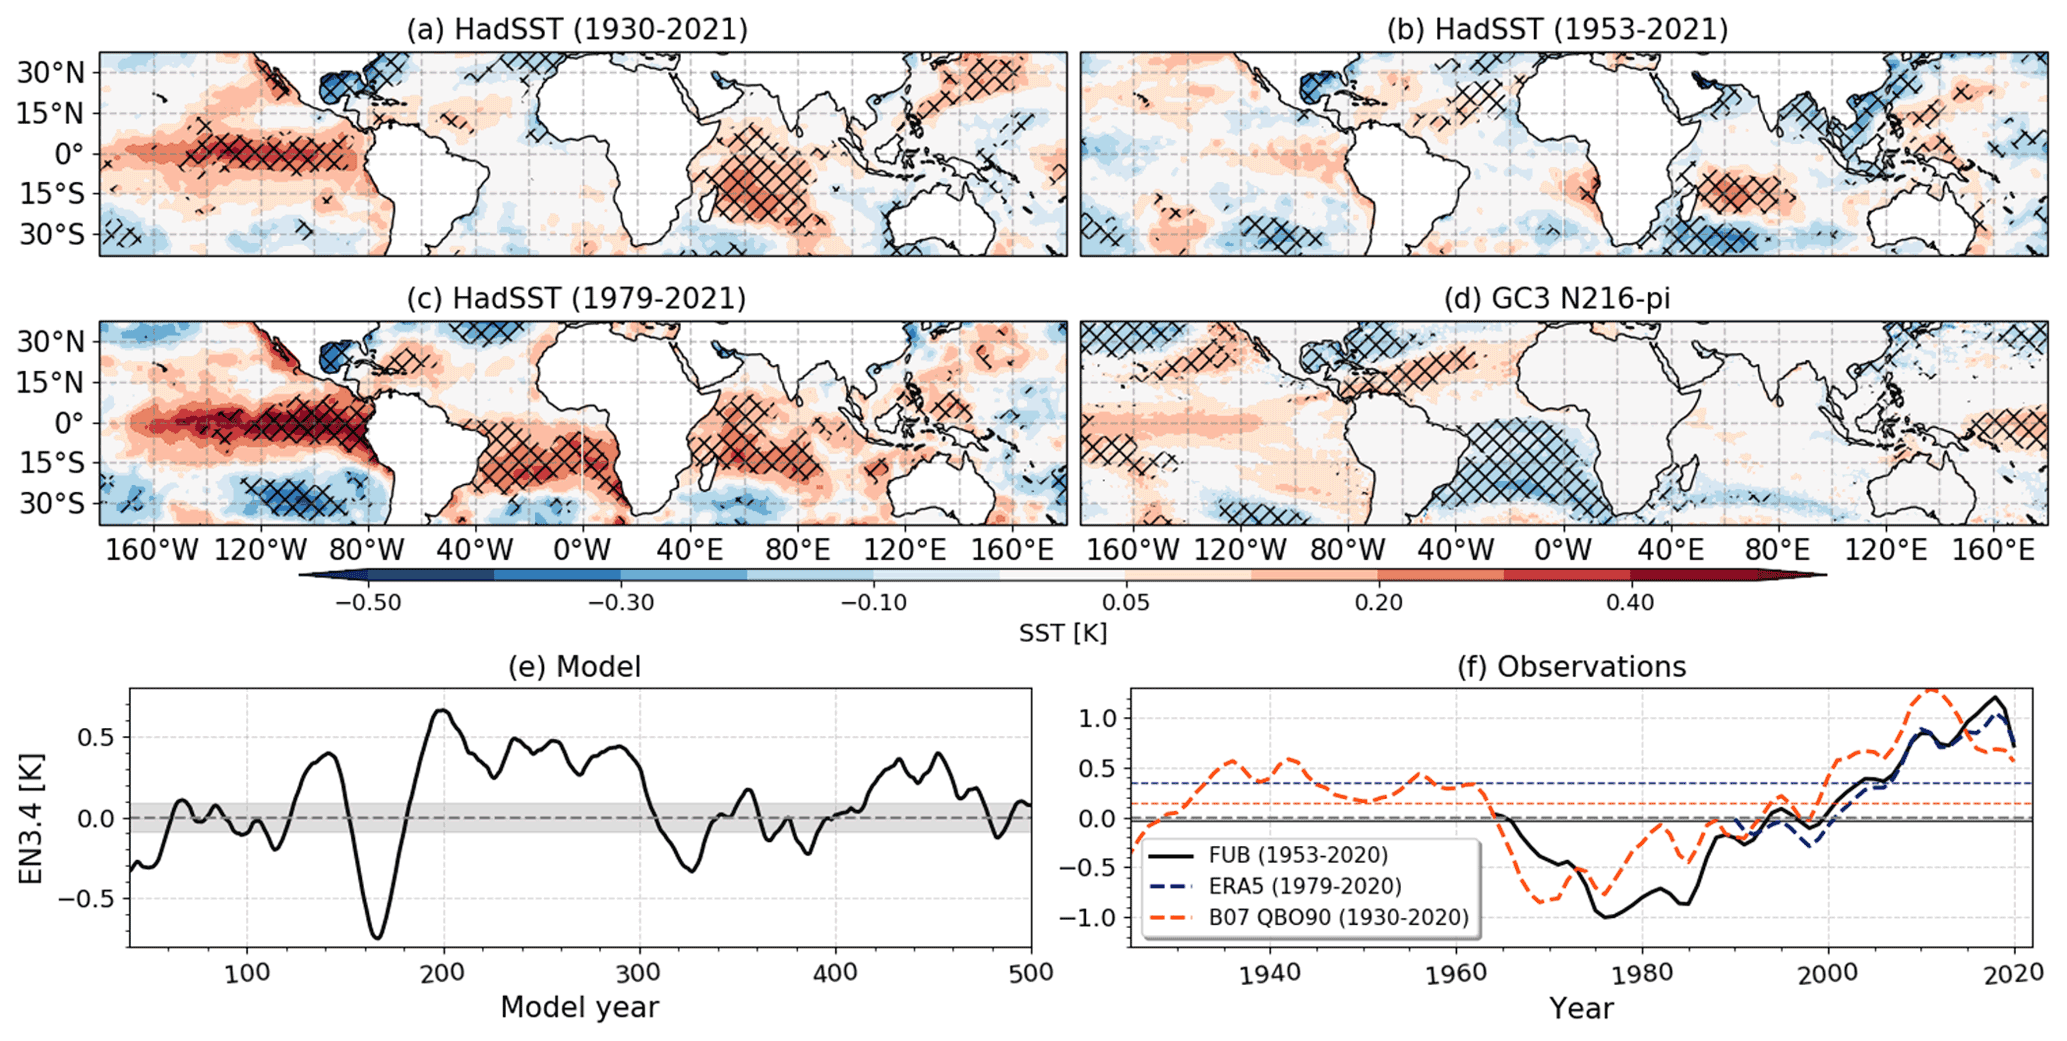
Figure 3(a–d) SST differences (QBO W–E) in DJF for (a–c) HadSST and (d) GC3 N216-pi. In panels (a)–(c) the HadSST differences are obtained by using (a) the B07 reconstruction (1930–2021), (b) the FUB dataset and (c) ERA5. Panels (e) and (f) show time series of EN3.4 [K] differences (QBO W–E) in (e) GC3 N216-pi and (f) HadSST using the different products for the QBO. In panel (e) the time series are constructed by computing the W–E differences in November–March (NDJFM) in sliding windows of 30-year periods and in panel (f) by computing the 12-year sliding average. The shading in panel (e) indicates the first and third quartile of a distribution of differences found by randomised resampling, and the horizontal lines indicate in panel (f) the mean EN3.4 for each dataset.
Previous studies have noted (Garfinkel and Hartmann, 2007; Domeisen et al., 2019) that the QBO–ENSO relationship in observations has changed since 1979. Figure 3 confirms that the Pacific SST response to the QBO has changed over different decades, with an anti-correlation relationship in 1960–1980 and a positive relationship emerging from 1985 to present. In the period prior to the radiosonde era (1930–1960) the relationship was also positive, according to the B07 QBO index.
The model simulations also exhibit decadal variability in the QBO–ENSO relationship (Fig. 3e). Even though the QBO–ENSO relationship is mostly positive, some 30–50-year periods exhibit a negative relationship. The link between the variability in the QBO–ENSO relationship in the model and the Atlantic Multidecadal Variability (Sutton and Hodson, 2005) or the Pacific Decadal Oscillation (Mantua et al., 1997) indices was investigated (not shown), and no significant relationship was found. The observed multidecadal changes to the QBO–ENSO relationship (Fig. 3) means that the precipitation response (Figs. 1 and 2) would likely be different if a longer record of precipitation was available. While our analysis of the observed record is affected by statistical uncertainty (e.g. Deser et al., 2017), this is likely not the case in the pre-industrial control simulations given their length and constant external forcing. This result further highlights the advantage of using these model experiments to understand QBO tropical teleconnections, including ENSO relationships, in the remainder of this paper.
As an initial investigation of the possibility of aliasing between the QBO and ENSO signals, Fig. 4a and b show the DJF QBOW minus QBOE composite differences of total precipitation from the GC3 N216-pi simulation using all years (as in Fig. 2) compared with using only those years identified as “ENSO-neutral”. Although the sample size is substantially reduced in the latter (see figure for the number of months in each QBO composite), the sample size is still large. The response patterns are similar in each plot, e.g. the drier patch north of the Equator over the eastern Pacific or the wet anomaly over Madagascar. This result suggests that there is a QBO signal that is unlikely to be the result of a sampling bias that favours one particular phase of ENSO.
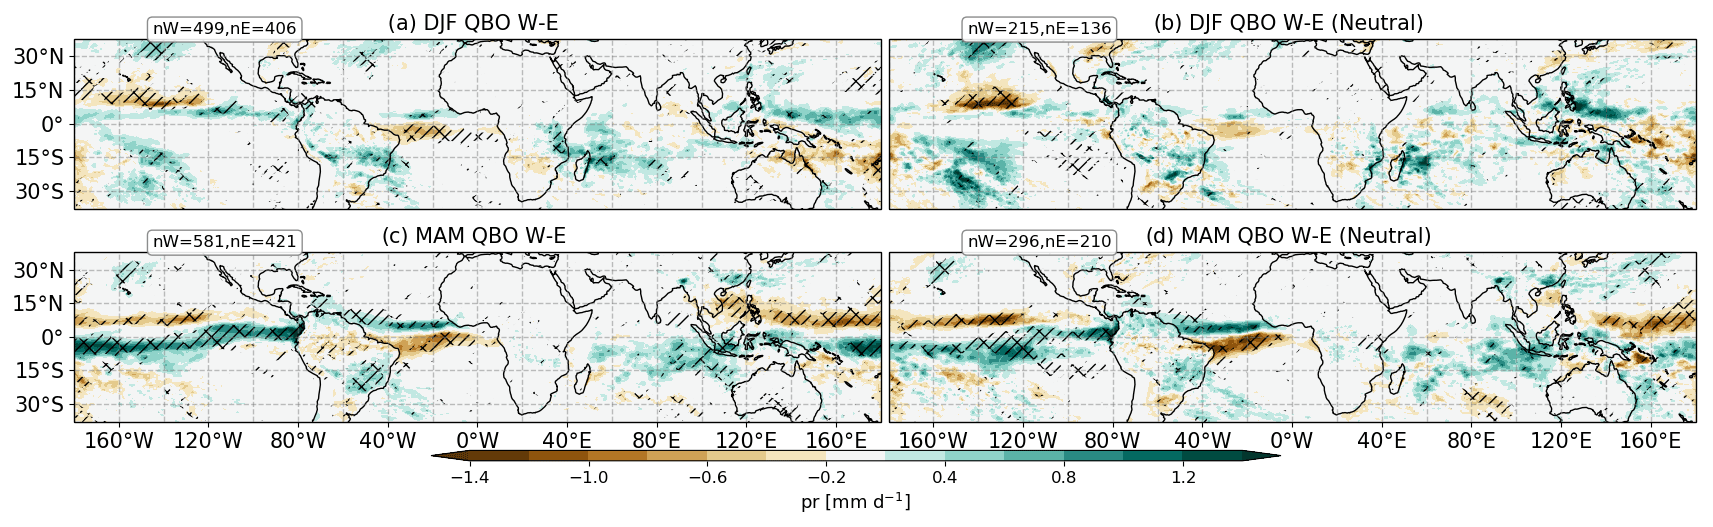
Figure 4Composite QBO W–E differences of total precipitation in GC3 N216-pi in (a, b) DJF and (c, d) MAM for (a, c) all the events and (b, d) ENSO-neutral conditions only. The sample size of each composite is noted in the top left corner of each panel. Statistically significant differences to the 95 % confidence level are shown through the hatching.
An alternative approach to investigate the possibility of aliasing of the QBO and ENSO signals is to use a multi-linear regression technique (see Sect. 2) in which the signal is analysed for both QBO and ENSO simultaneously. Here, we switch to analysing convective precipitation to better investigate the possible influence of the QBO on deep tropical convection.
Figure 5a and b show results from a simple linear regression analysis of the monthly averaged time series of GC3 N216-pi total precipitation in which only the 70 hPa QBO index was employed. Figure 5a includes all available years, while Fig. 5b includes only ENSO-neutral years. The results are very similar to the annual-mean composite differences in total precipitation (Fig. 1), with increased convective precipitation over the equatorial Pacific when the zonal winds at 70 hPa are positive.
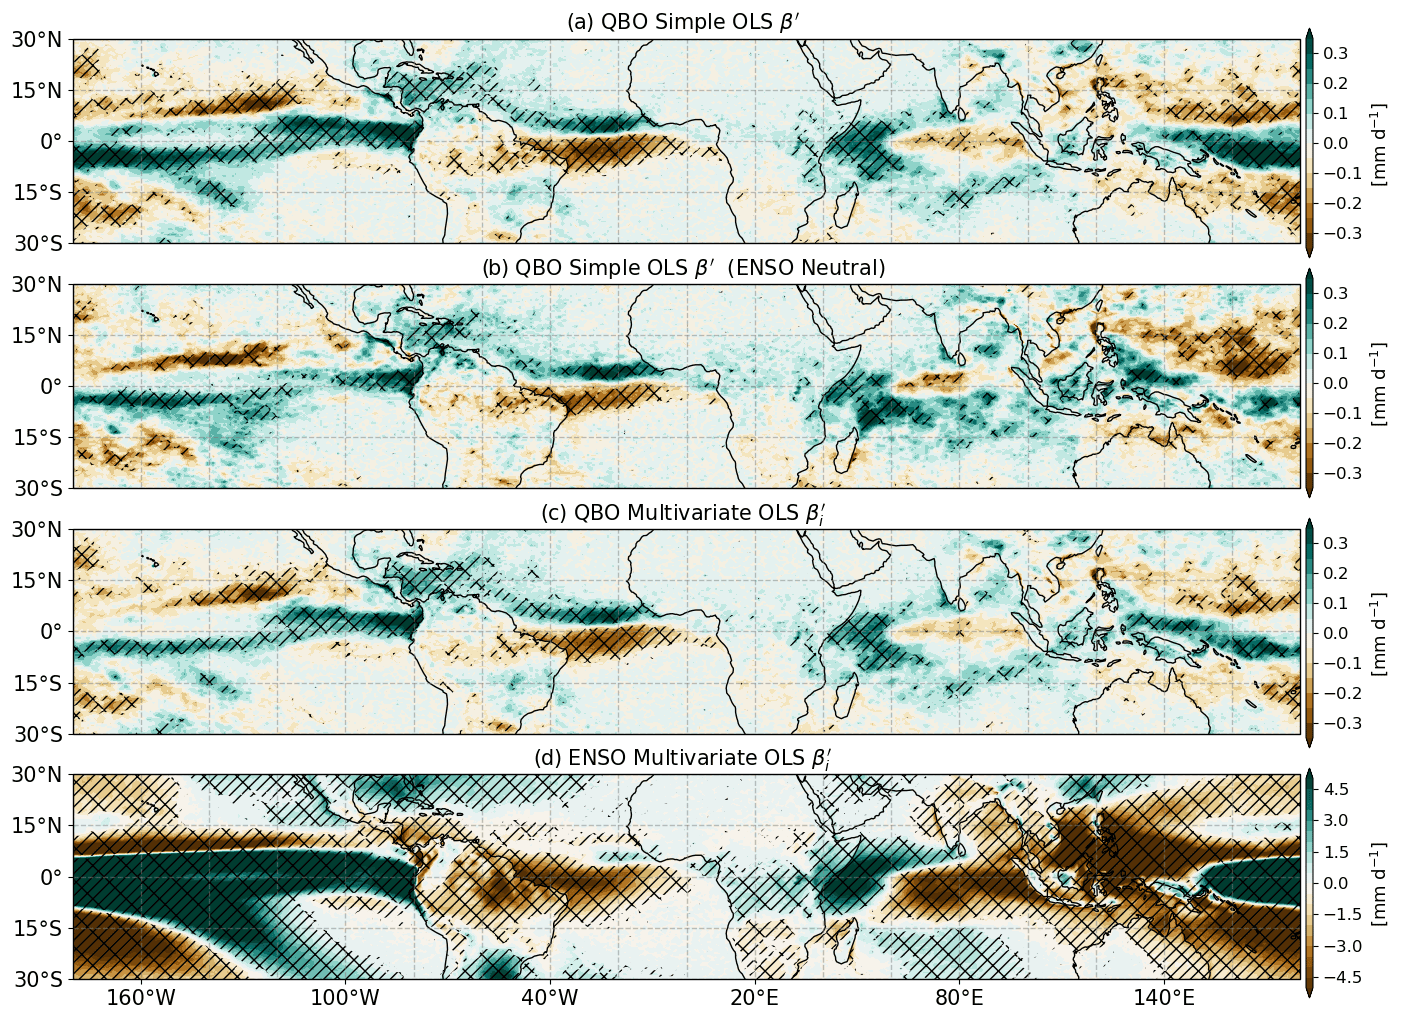
Figure 5Annual-mean regression model results in GC3 N216-pi for convective precipitation. (a, b) Rescaled regression coefficients () from a simple ordinary least-squares (OLS) regression model with the QBO index for (a) all months and (b) ENSO-neutral months only. Panels (c) and (d) show the regression coefficients resulting from a multivariate regression model using the ENSO and QBO indices for the (c) QBO and (d) predictors. In all cases, the regression coefficients are rescaled by multiplying the regression coefficients by the ratio of maximum amplitude and standard deviation of the QBO or ENSO indices, and the hatching indicates significance to the 95 % confidence level based on a t test.
Figure 5c and d show the ENSO and QBO signals when the EN3.4 index is included, as well as the QBO index. The ENSO response is clearly evident, highly statistically significant and compares well with the well-known patterns obtained from observations. The amplitude of the ENSO signal is also much larger than the QBO signal. Nevertheless, the QBO signal remains intact, and all of the main features are still significant (Fig. 5c). For example, the positive regression coefficients that suggest a northward shift of the Atlantic ITCZ and the wetter Caribbean Sea and western Indian Ocean in the simple regression model are still found in the multivariate regression analysis. A similar analysis of tropical SSTs (Fig. S4) shows a QBO signal in SSTs that is separate from the effect of ENSO and agrees with the results of the composite analysis (Fig. 3).
These results suggest that the modelled QBO signal in total precipitation does not arise due to a simple aliasing of the signal with ENSO. However, the multi-linear regression technique assumes that the QBO and ENSO indices are linearly independent and that their responses add together linearly. The similarity of the two responses suggests that this is probably not the case and there may be substantial non-linear interaction between the two phenomena (e.g. Gray et al., 1992). Nevertheless, the QBO signal remains even when only ENSO-neutral years are included in the analysis, suggesting that the QBO has a real influence on the surface precipitation.
3.3 Interaction of the QBO with ENSO and IOD
To further explore the interaction of the QBO and ENSO, we first investigate whether aspects of the QBO are influenced by ENSO events. This relationship could be a real possibility since the intrinsic mechanism of the QBO involves tropical waves that are generated within the troposphere. Schirber (2015) found in a GCM that under El Niño conditions tropospheric wave activity increases and accelerates the downward propagation speed of the QBO westerly phase. However, the analysis by Serva et al. (2020) shows that only models with relatively high horizontal resolution can reproduce the observed ENSO effects on the QBO amplitude, although with weaker impacts than observed, while several models, including the MOHC UM, show no impact of ENSO on the QBO.
For that reason, we analyse several characteristics of the QBO and their dependence on the ENSO phase, namely the descent rate and the amplitude of the QBO (see Sect. 2.3 for details of how these metrics are defined). The results are summarised in Fig. 6 for the ERA5 reanalysis dataset (41 years; 1979–2020) and for the GC3 N216-pi simulation (500 years). In ERA5, the well-known faster descent rates during the westerly phase than in the easterly phase are evident and agree well with studies of longer datasets such as the Berlin radiosonde data (Schenzinger et al., 2017). Also, the ERA5 QBO descent rates and the amplitude both depend on the phase of ENSO. A higher amplitude and slower descent rates are observed during La Niña phases and weaker amplitudes and faster descent rates during El Niño, in agreement with Geller et al. (2016).
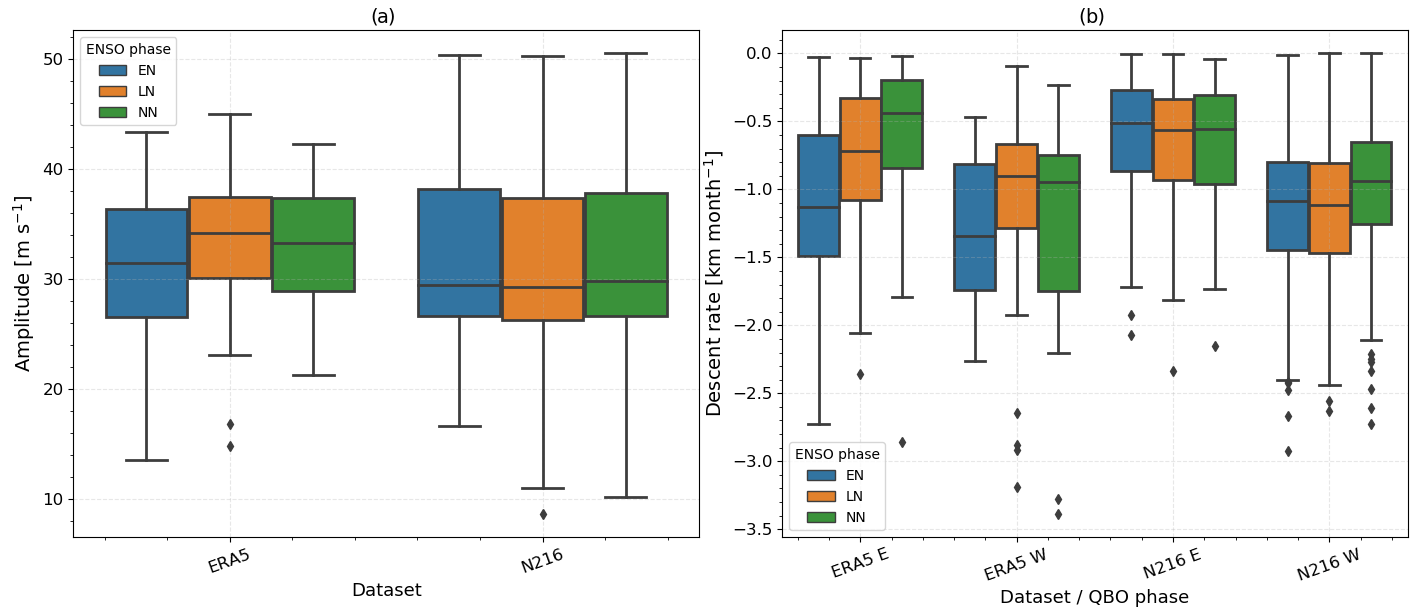
Figure 6Box plots of the median (horizontal line), first and third quartiles (boxes), and minimum and maximum (delimited by the whiskers) of the distribution of QBO (a) amplitudes [m s−1] and (b) descent rates [km per month] separated by dataset (ERA5 and GC3 N216-pi) and ENSO phase. NN stands for ENSO-neutral. In panel (b) descent rates are shown for both descending easterly (E) and westerly (W) phases following Schenzinger et al. (2017).
In the model, the descent rates are also faster for the westerly than the easterly QBO phase, as observed, but the relationship between the QBO characteristics and ENSO is less clear. Neither the amplitudes nor descent rates of the QBO are significantly different between EN and LN phases, according to Welch's t test. Interestingly, the only significant difference in the model is that descending westerlies are slower in ENSO-neutral months compared to EN or LN conditions, perhaps suggesting that characteristics of tropical wave activity may be different in ENSO phases compared with neutral years (e.g. Geller et al., 2016). The model results therefore suggest that there is little influence of ENSO on the descent rate and amplitude of the QBO in the GC3 N216-pi simulation; this result was also found for the lower-resolution simulations (not shown). In addition, no evidence was found that strong warm ENSO events change the phase of the QBO in this model, in contrast to the findings of Christiansen et al. (2016). This finding of a null influence of ENSO on the QBO agrees well with the results of Serva et al. (2020), who examined these relationships in an older version of the HadGEM model.
The reverse possibility, i.e. that the QBO may somehow influence ENSO, is now examined, first, by estimating whether the frequency of ENSO events significantly depends on the QBO phase. Table 1 documents the frequency of ENSO events in each QBO phase from observations/reanalysis and the three model simulations. A higher frequency of EN events during QBOW and of LN during QBOE has been observed from 1979 to 2020 (Taguchi, 2010; Liess and Geller, 2012), but the opposite is diagnosed if the period is extended to 1953–2020, in agreement with previous sections and studies (Domeisen et al., 2019). Probability density functions (PDFs) were constructed, first, for the observations by bootstrapping with replacement to account for observational uncertainty and for the model data using 39-year samples to match the length of the ERA5 period. In addition to Welch's t test, a Kolmogorov–Smirnov (KS) test was used to evaluate if the PDFs of an event frequency (e.g. EN) were significantly different for each phase of the QBO.
Table 1ENSO and IOD event frequency (month per month), e.g. no. months ENSOno. months QBO. Note that the ENSO frequencies for ERA5 (1979–2020), FUB (1953–2020) and B07 (1930–2020) are obtained using HadSST data. For each dataset, the standard deviation of the probability density distribution (PDF), obtained by bootstrapping with replacement, is shown as the uncertainty of the mean value. Model results in bold indicate that the PDF for QBOW is significantly different from the PDF for QBOE to the 95 % confidence level according to the KS test.

The results show significant differences, according to both KS and Welch tests, for each ENSO phase in the three model simulations. EN events are more frequent under QBOW conditions than under QBOE in both observations and model datasets. LN events are equally frequent in both QBO phases in the HadSST dataset, but in GC3 N216-pi they are more frequent under QBOE than under QBOW. Note that the frequencies of LN and EN under neutral QBO conditions in the model were ±0.26 month per month in both cases.
Figure 7a and b show the EN3.4 index amplitude and interannual standard deviation as a function of each month from the HadSST dataset and the GC3 N216-pi simulation, separated for each phase of the QBO. From this we can examine, for example, whether any QBOW minus QBOE differences in ENSO characteristics arise primarily from one QBO phase or the other (i.e. a non-linear response) or whether both phases contribute equally to the response difference.
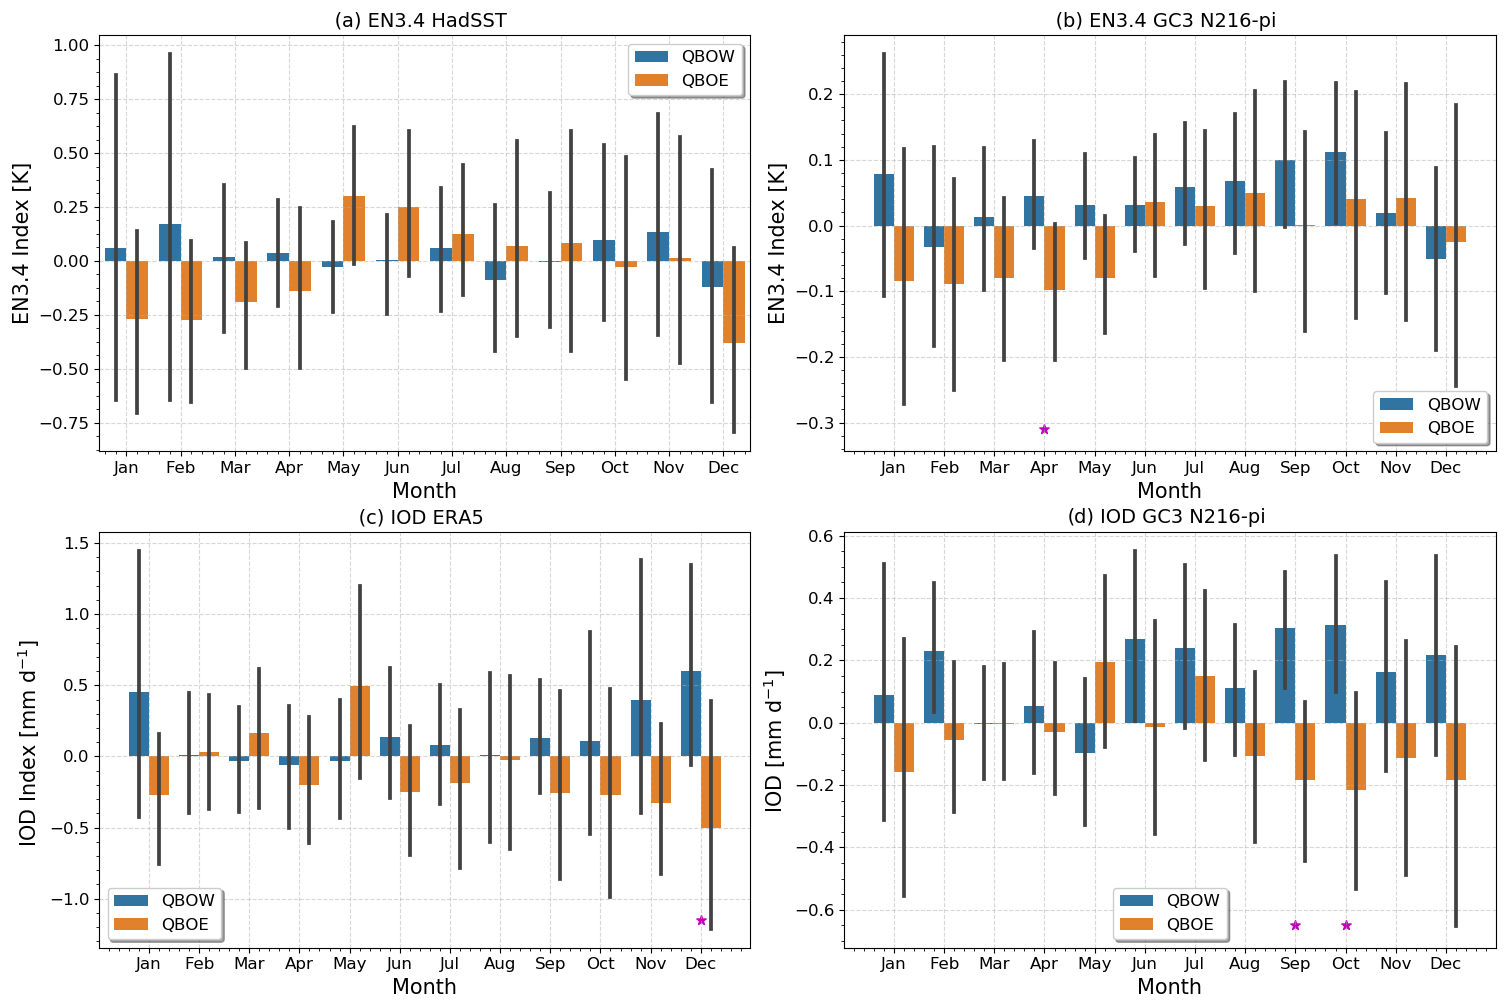
Figure 7Monthly mean (a, b) EN3.4 and (c, d) IOD indices separated per QBO phase in (a, c) observations/reanalysis ERA5 and HadSST (1979–2021) and (b, d) GC3 N216-pi. The error bars show the standard deviation of each index for each month, and significant differences between QBOW and QBOE months are highlighted with a ⋆ at the bottom of each panel.
In the observed period of 1979–2021, the EN3.4 SST is negative from December to April under QBOE. These results are consistent with the analysis of ENSO frequency in Table 1, which shows more frequent La Niña events under QBOE and El Niño events under QBOW. In the model, the mean EN3.4 index is frequently positive under QBOW and also negative from December to April under QBOE. In both cases, the strength and sign of the differences varies seasonally; for example, the only month where the EN3.4 index is statistically different is April.
The previous sections have demonstrated that the mean QBO response is affected by an uneven frequency of ENSO events in each QBO phase. In addition, evidence was found of non-linear ENSO impacts associated with the QBO or, in other words, that the QBO response can also be a function of ENSO. This non-linearity can be observed in Fig. 8 where the QBO composite differences in convective precipitation in MAM are shown using all years, ENSO-neutral years, and EN or LN years. While the broad nature of the QBO signal remains similar, the details differ depending on the phase of ENSO (Fig. 8c and d). For example, the Atlantic and Pacific ITCZ responses are opposite during LN compared to neutral and EN years. The total equatorial Atlantic response is then a result of the combination of EN and neutral years which is dampened or obscured by the LN years.

Figure 8Composite convective precipitation differences (QBO W–E) in MAM for GC3 N216-pi for (a) all the months and (b) ENSO-neutral conditions only, (c) El Niño and (d) La Niña. The sample size of each composite is noted in the top left corner of each panel. Statistically significant differences to the 95 % confidence level are shown through the hatching.
Another prominent feature of the composite of all years is the off-equatorial West Pacific positive response which is only observed for neutral years. This result suggests that some ENSO impacts, e.g. over the Atlantic basin, are different depending on the QBO phase. In GC3 N216-pi, this effect is more readily observed during MAM, but similar results are found for the other two models in DJF (Figs. S6 and S7). The implication of these results would be that, in some cases, regression analysis may not be the right approach because the QBO surface impacts may be non-linear.
In the previous sections, the precipitation and SST analyses also show suggestive evidence of a relationship between the QBO and the Indian Ocean, in both the observations and the model. The link between the QBO and the IOD event frequency have been analysed in the same way as for the ENSO index and a significant relationship is confirmed (Table 1 and Fig. 7c and d). The IOD event frequency is also markedly different depending on the QBO phase, with positive events more frequently observed in the westerly phase of the QBO and negative events found more frequently under QBOE, both for ERA5 and the model simulations (Table 1). The monthly mean values in Fig. 7c and d for the model indicate a more frequently positive IOD index under QBOW and a negative index for QBOE, and these differences are statistically significant in September and October. The GC3 N96-pi and UKESM N96-pi results are very similar (Fig. S5), and the differences are also significant in SON.
This section demonstrates statistically robust links between the IOD and ENSO, as well as the QBO. These phenomena (ENSO and the IOD) are intertwined by pan-tropical teleconnections through zonal circulations (Cai et al., 2019), and they interact with monsoons and the ITCZ. For that reason, the following section explores more closely the links between the QBO and features of the circulation in the tropics.
3.4 ITCZ, monsoons and the tropical overturning circulation
This section investigates the QBO impacts on the ITCZ, monsoons and the Walker circulation. The previous sections demonstrated a robust link in the simulations between ENSO and the QBO, and for that reason, this section presents results of when the influence of ENSO has been removed by using ENSO-neutral (NN) composites. Model biases in the representation of the migration and dynamics of the ITCZ, measured by zonally averaged convective precipitation in the Pacific and Atlantic sectors (Fig. 9a and b), are highly relevant since these biases may modify any physical mechanisms of the QBO over convection. These biases can be characterised by a southward shift of the simulated Atlantic ITCZ in DJF and MAM and a wider extent of the Central Pacific ITCZ compared to ERA5 leading to a “double ITCZ” in the Pacific during boreal winter (García-Franco et al., 2020). Note that the magnitude of the biases is almost as large as the climatological values during boreal winter.
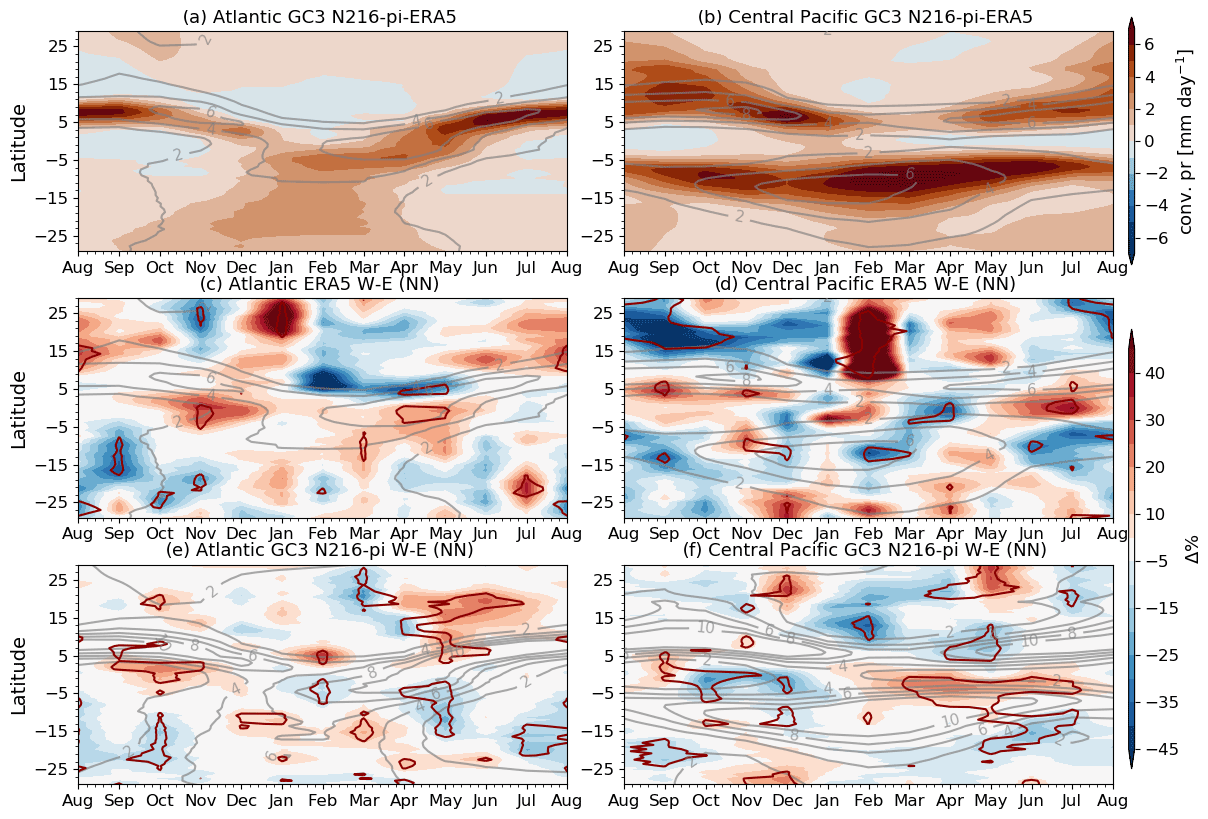
Figure 9(a, b) Zonal mean biases in convective precipitation in GC3 N216-pi compared to ERA5 in the (a) Atlantic (60–20∘ W) and (b) Central Pacific (180–140∘ W) sectors. These sectors that represent the Pacific and Atlantic ITCZ were chosen based on the regions that exhibit a significant impact in Fig. 5. (c–f) Monthly and zonal mean QBO W–E percent [%] differences during NN conditions in convective precipitation in which the absolute difference is weighted by the climatological value at each latitude and month. The line contour (red) depicts differences that are statistically significant to the 95 % level according to a bootstrapping test, and the grey lines show the climatological values.
The monthly mean QBO W–E zonal-mean convective precipitation differences in the Pacific and Atlantic ITCZ regions during NN conditions (Fig. 9) show that the ITCZ impacts are seasonally dependent. While there are no clear differences in the Atlantic sector for ERA5 in any month, in GC3 N216-pi there is a significant northward shift of the ITCZ from April to June, which is likely associated with the warm SST anomalies found in this season in the northern tropical Atlantic (Fig. 3).
The differences in the Pacific sector for ERA5 show a very noisy and mixed result. However, in GC3 N216-pi, a southward shift of the ITCZ is observed from February to July, maximised in the MAM season. Very similar results for the Atlantic and Pacific sectors were observed for the other two simulations (Fig. S8). Note that these results are for ENSO-neutral conditions, and for all years the link between QBO and ENSO is evident (Fig. S9).
Observational (Collimore et al., 2003; Liess and Geller, 2012; Gray et al., 2018) and modelling (Giorgetta et al., 1999; Garfinkel and Hartmann, 2011b) evidence has documented links between the QBO and monsoon regions. However, the results in the previous sections (Fig. 1) show little-to-no robust effects of the QBO on precipitation over land in the simulations. The precipitation response over land is examined more closely by analysing regions that fit the concept of the global monsoon. For this purpose, a monsoon region is defined as a region in which over 55 % of the total annual rainfall is observed or simulated in the respective summer season, and the summer–winter precipitation difference is higher than 2 mm d−1 (Wang and Ding, 2008; Wang et al., 2017, 2021). After defining these regions, the QBO W–E differences, during ENSO-neutral only, are computed for June–September (JJAS) and December–March (DJFM) for Northern Hemisphere and Southern Hemisphere monsoons, respectively, for GPCC (1953–2020) and GC3 N216-pi.
Figure 10 shows that precipitation response over monsoon regions is relatively weak in GPCC and GC3 N216-pi. In the South American and Indian monsoon regions, for example, both positive and negative significant differences are observed, indicating no region-wide coherent impact. This lack of spatial coherency suggests that regional dynamics are likely important. In GC3 N216-pi, in the South American monsoon region, the QBO W–E differences indicate a significantly wetter region in South America, where the South Atlantic Convergence Zone is located (Carvalho et al., 2004; Jorgetti et al., 2014). Similarly, wetter conditions over southern Mexico and Central America (the Midsummer Drought region) (García-Franco et al., 2020) are observed during QBOW compared to QBOE in GPCC and, albeit much weaker, in GC3 N216-pi.
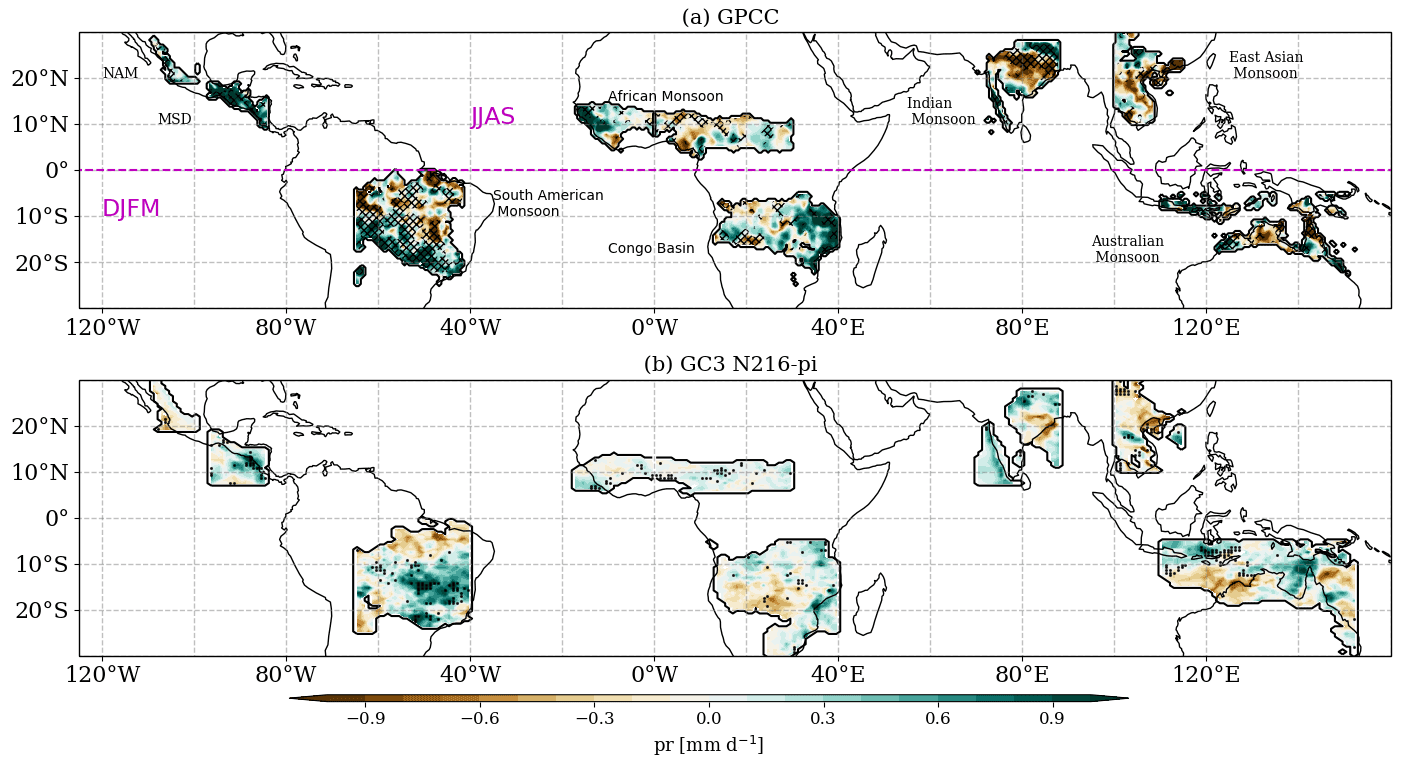
Figure 10Total precipitation differences in monsoon regions between QBO W–E phases under ENSO-neutral conditions only for (a) GPCC (1953–2020) using the FUB QBO index and (b) GC3 N216-pi. For monsoon regions in the Northern Hemisphere, differences are shown for the JJAS period, whereas for Southern Hemisphere monsoons, results are shown for DJFM. Hatching and dots indicate differences that are statistically significant to the 95 % level. NAM and MSD stand for the North American monsoon and the Midsummer Drought (García-Franco et al., 2020), respectively.
The climatological biases in the representation of the monsoon dynamics by this and other climate models (e.g. in South America; García-Franco et al., 2020; Coelho et al., 2022) could mean that the impacts seen in Fig. 10 are model-dependent and that our analysis of the lower-resolution simulations (Fig. S10) indicates that some of these impacts are also resolution-dependent. This reinforces the notion that the mean representation of the dynamical features of each monsoon by a model configuration is important for any subsequent response to the QBO. Nevertheless, this analysis shows that in the model the QBO impacts on land convection are weaker than on oceanic convection, suggesting that SST feedbacks may be important for the QBO response in the model.
A number of studies have suggested a link between the QBO and the Walker circulation that could explain the zonally asymmetric nature of the QBO surface impacts in the tropics (e.g. Collimore et al., 2003; Liess and Geller, 2012). Therefore, the relationship between the Walker circulation and the QBO is examined to evaluate this hypothesis through the use of the zonal streamfunction (Yu and Zwiers, 2010; Bayr et al., 2014; Eresanya and Guan, 2021), defined as
where ψ is the zonal streamfunction, uD is the divergence part of the zonal wind, a is the Earth's radius, p is the pressure coordinate, and g is the gravitational acceleration. The divergent component of the zonal wind (uD) is computed by solving the Poisson equation (Eresanya and Guan, 2021) for the velocity potential using the python package windspharm (Dawson, 2016) that employs spherical geometry. The streamfunction is calculated by first averaging over the equatorial band of 10∘ S–10∘ N and integrating from the top level of each dataset to the surface.
QBOW minus QBOE composite differences in DJF show that the streamfunction in the eastern Pacific (220–260∘ E) is significantly weaker during QBOE than during QBOW in ERA5 and GC3 N216-pi (Fig. 11). In the model, these streamfunction differences are significant even low in the troposphere. The zonal wind at upper levels (300–100 hPa) is also weaker in QBOW compared to QBOE at 200∘ E in both model and reanalysis. In GC3 N216-pi, the negative ψ difference is accompanied by descending motion anomalies in the 170–220∘ E region, whereas anomalous ascent is observed in the Maritime Continent and Indian Ocean. The differences in the other simulations agree with the results of GC3 N216-pi (not shown).
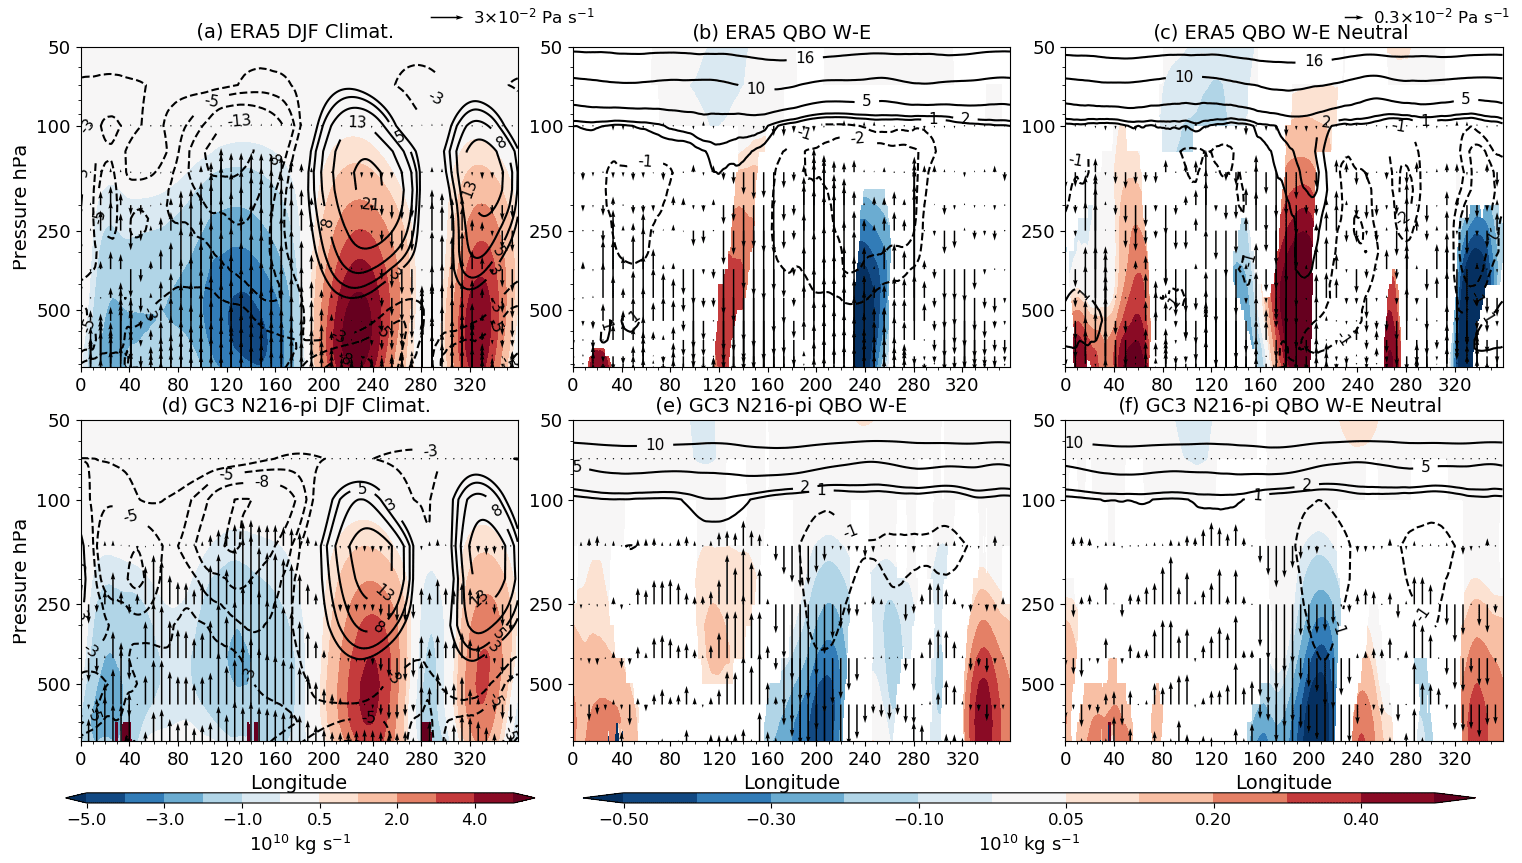
Figure 11(a, d) Climatological mean state of the Walker circulation, depicted through the zonal streamfunction (ψ) in shading, the zonal wind (contours) and vertical velocity (ω [Pa s−1], vectors) during the DJF season in (a) ERA5 and (b) N216-pi. (b, c, e, f) W–E composite differences, during DJF, for the same variables, and only statistically significant differences (95 % confidence level) are shown. Panels (c) and (f) are as in panels (b) and (e) but considering ENSO-neutral periods only. Example vector sizes for ω are given in the top right corners of panels (a) and (c). Note that the colour bar and vector sizes are different for the climatology plots (a, d) than for the anomaly plots.
In boreal fall (Fig. 12), the differences are also significant and can be linked to the relationships found between the IOD and the QBO. Specifically, significant positive differences (W–E) in the streamfunction are found in the eastern Indian Ocean and Maritime Continent and negative differences in the eastern Pacific. In GC3 N216-pi, vertical velocity anomalies indicate stronger ascent in the western Indian Ocean and in the Maritime Continent, whereas weaker ascent anomalies are found in the eastern Indian Ocean. These results agree with positive IOD indices found in QBOW and a mean negative index during QBOE.
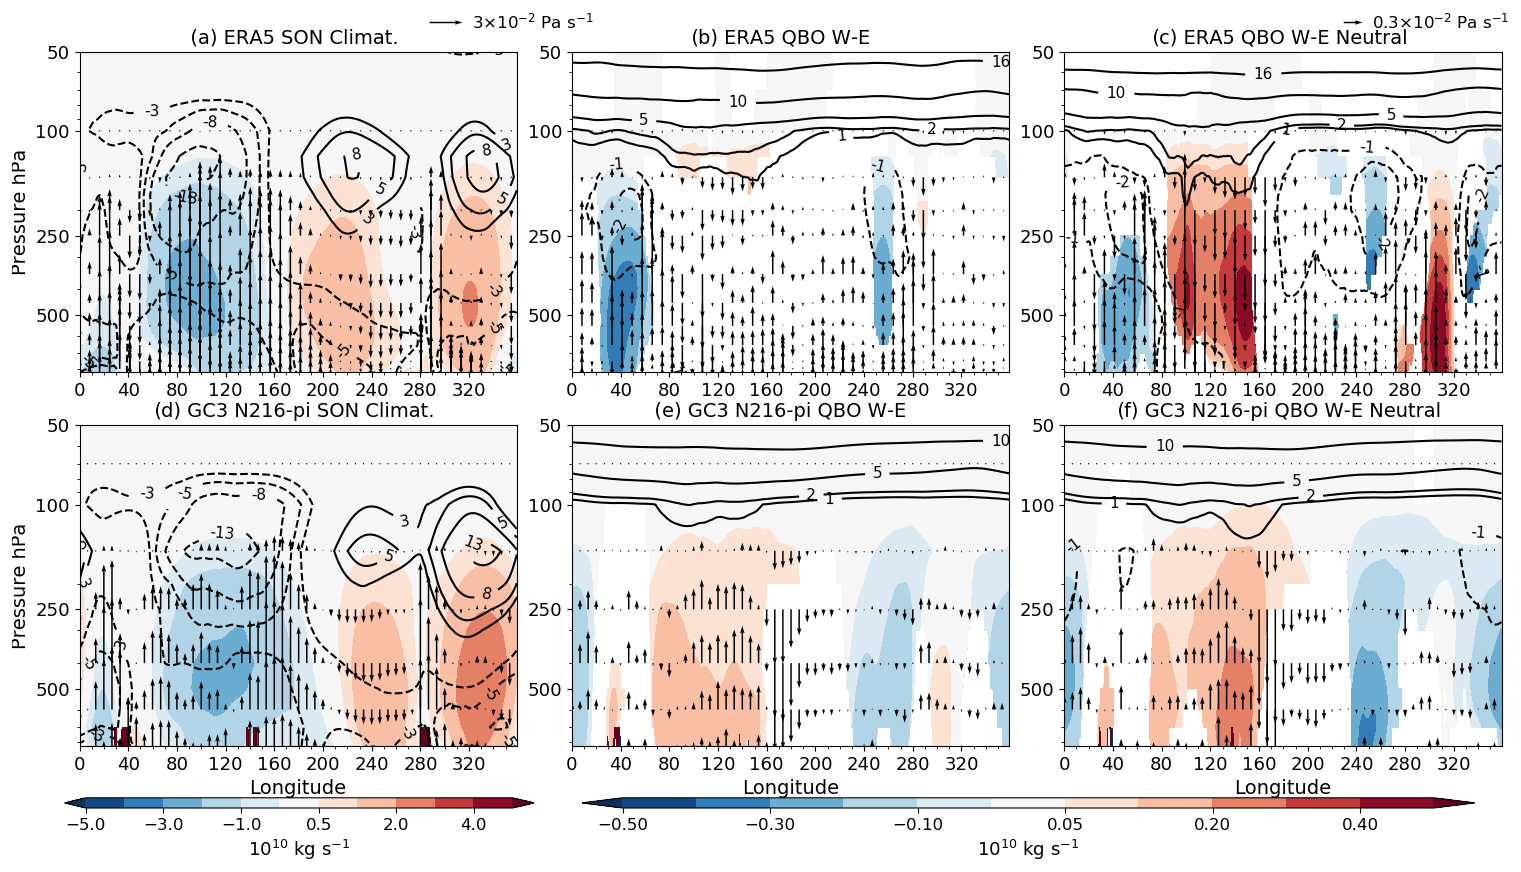
The rightmost panels in Figs. 11 and 12, in which only ENSO-neutral months are considered, suggest that this relationship between the QBO and the Walker circulation occurs regardless of ENSO events for GC3 N216-pi. However, some QBO–ENSO superposition can be seen from the plots; e.g. in ERA5, removing ENSO events changes the sign of the response. This effect is likely due to the small sample size in the observational record when only neutral months are considered. The weakening of the Walker circulation under QBOW compared to QBOE is also seen in the other model configurations (Figs. S11 and S12). These results highlight links between the large-scale overturning circulation and local precipitation found in previous studies and in early sections of this paper.
Analyses of observational records of clouds and precipitation in the tropics suggest links between the stratospheric QBO and tropical deep convection (Collimore et al., 2003; Liess and Geller, 2012; Gray et al., 2018). However, the short observational record available and the confounding influence of ENSO and its teleconnections limit the robustness of any analysis seeking to explore these links and possible mechanisms of interaction between the QBO and the tropical troposphere. This study investigates the tropical signature of the QBO in the 500-year-long pre-industrial control CMIP6 experiments of the Met Office Hadley Centre Unified Model, with a focus on the HadGEM3 GC3.1 N216 simulation.
Composite and regression analyses were used to demonstrate the presence of a statistically significant link between the QBO and precipitation in the tropics. These impacts were found in the position and strength of the Pacific and Atlantic ITCZ, as well as in the Caribbean Sea and the Indian Ocean. The QBO signal was found to be zonally asymmetric, with the more robust and largest differences over the oceans, suggesting the possibility of SST feedback processes and a role for the Walker circulation. Impacts over monsoon land regions were found to be much weaker.
A similarity between the QBO precipitation response pattern and positive ENSO events raised the possibility of an aliasing of ENSO and QBO signals in the model and observations. The interaction of the QBO and ENSO signals was extensively explored. When only ENSO-neutral years are analysed the QBO signal remains essentially unchanged, ruling out the possibility of a straightforward aliasing of ENSO events with the QBO phase selection, a result that was confirmed by multivariate regression analysis (Fig. 5). Additionally, this study examined the possibility that the QBO response in regions dominated by ENSO teleconnections could be due to an influence of ENSO on the QBO rather than a real downward impact of the QBO itself. This upward interaction could be via modulation of tropical wave generation, as has been proposed previously (Schirber, 2015). The model was shown to successfully simulate the well-known differences in QBO descent rates in which the QBOW phase descends more rapidly than the QBOE phase. However, there was no evidence in the model for an ENSO influence on the rate of descent or amplitude of either QBO phase.
While recognising that linear diagnostics are unable to provide specific evidence of cause and effects, our analysis demonstrated that the QBO–ENSO relationship is statistically significant in the model. The frequency of ENSO events in each phase of the QBO was first explored. In observations, the QBO–ENSO relationship shows decadal variability; in recent decades El Niño events have been found to occur more frequently in QBOW years, and La Niña events are more frequently found in QBOE years (Taguchi, 2010). However, the use of radiosondes and a reconstruction by B07 highlighted that this relationship has changed sign over different periods from 1930 to 2020.
In the model, more frequent El Niño events are found under QBOW and La Niña events under QBOE. However, this relationship is also non-stationary, and in some 30–50-year periods, the opposite QBO–ENSO relationship can be found. The examination of the month-by-month EN3.4 amplitude in the model showed that the interaction between QBO and ENSO is far from linear since the amplitude dependence on QBO phase was asymmetric and strongly seasonally dependent. The non-linearity of the QBO–ENSO interaction was confirmed using composite analyses that showed different QBO signal patterns during El Niño years as compared with La Niña years.
In addition to the QBO–ENSO link, the model analysis also highlighted a statistically significant QBO signal in precipitation over the Indian Ocean, raising the possibility of an interaction with the IOD. In boreal fall, the IOD index, a measure of the zonal gradient of convective precipitation in the Indian Ocean, was found to be anomalously positive in QBOW years and anomalously negative in QBOE years, both for ERA5 and the three model simulations.
Finally, previous studies have proposed that the QBO may influence the mean state of the Walker circulation, which could be linked to the zonally asymmetric nature of the QBO signal in precipitation in the tropics (Collimore et al., 2003; Liess and Geller, 2012; Hitchman et al., 2021). The modelled Walker circulation was found to vary by up to 10 % between QBO phases, even when the effect of ENSO events was taken into account. Specifically, the Walker circulation was found to be weaker during QBOW than during QBOE.
Most of the results in this study agree with previous analyses of models and observations (Gray et al., 2018; Hitchman et al., 2021; Serva et al., 2022). However, Rao et al. (2020) found very different responses in a set of CMIP5/6 models, including HadGEM3 and UKESM1. These differences can be explained, first, by the fact that the study of Rao et al. (2020) examined ≈150-year-long simulations with historical forcings, in contrast to the 500-year control simulation (no external forcing) examined by this study, and, second, because Rao et al. (2020) used a different QBO index based on the 30 hPa winds compared to this study (70 hPa). The 30 hPa level index captures very little of the QBO-driven temperature variability near the tropopause (Fig. S13) compared to the 70 hPa index, and the use of only one ensemble member to diagnose the precipitation response in a simulation with time-varying external forcing can result in different (and misleading) impacts compared to the ensemble mean of all available members (Fig. S14).
The role of model biases for these results must be emphasised and the results treated with caution since a different representation of the stratosphere or the troposphere may control the extent and location of the QBO influence. Tropospheric biases, e.g. in the strength or position of the ITCZ (Fig. 9), may limit the robustness of these results and may mean that the impacts diagnosed in this study may be different in another model. Similarly, stratospheric biases such as the weak amplitude of the QBO in the lower stratosphere found in most models (Bushell et al., 2022; Rao et al., 2020) mean that the simulated tropical pathway of QBO teleconnections may be weaker, non-existent or difficult to diagnose in some models, highlighting the need to improve vertical resolution (Garfinkel et al., 2022).
The exact nature of the relationship between the QBO and tropical deep convection remains to be well understood. Targeted model experiments (see, e.g., Garfinkel and Hartmann, 2011b; Martin et al., 2021a) would help us to investigate hypotheses about causal mechanisms, such as the static stability mechanism (Hitchman et al., 2021), in order to disentangle the direction of causality between the tropical stratosphere and troposphere.
The simple linear regression model can be written as
where Y is the measured or dependent variable, X0 is a constant coefficient, β is the regression coefficient between X and Y, and ϵ represents random error or a residual. In all cases, the models were solved using an ordinary least-squares (OLS) method. A multivariate regression model was used to study the joint effect of two or more predictors, in this case ENSO and QBO indices, over a variable (Y), in this case precipitation, such that the model can be written as
where Xj(t) is any predictor with an associated regression coefficient βj.
As in previous studies (Gray et al., 2018; Misios et al., 2019), the regression coefficient can be rescaled to evaluate the total effect that a predictor (Xj) can have on the variance of the measured variable (Y) using the standard deviation (σj) and the maximum (Xj,max) and minimum (Xj,min) values of Xj so that the rescaled coefficient can be written as
ERA5 reanalysis data are available from the Copernicus Climate Change Service Climate Data Store at https://doi.org/10.24381/cds.6860a573 (Hersbach et al., 2019). The FUB dataset was obtained from http://www.geo.fu-berlin.de/en/met/ag/strat/produkte/qbo/ (last access: 1 July 2022, Freie Universität Berlin, 2020), whereas the reconstruction can be obtained at https://climexp.knmi.nl/getindices.cgi?WMO=BernData/qbo_90&STATION=QBO_90&TYPE=i&id=someone@somewhere (last access: 1 June 2022; Brönnimann et al., 2007, https://doi.org/10.1029/2007GL031354). The HadSST 4.0 dataset is available at https://www.metoffice.gov.uk/hadobs/hadsst4/data/download.html (last access: 1 June 2022; Kennedy et al., 2019, https://doi.org/10.1029/2018JD029867). The GPCP v2.3 was downloaded from https://doi.org/10.7289/V56971M6 (Adler et al., 2016). CMIP6 simulations used in this study are available from the Earth System Grid Federation of the Centre for Environmental Data Analysis (ESGF-CEDA; https://esgf-index1.ceda.ac.uk/projects/cmip6-ceda/, last access: 22 October 2021, WCRP, 2021).
The supplement related to this article is available online at: https://doi.org/10.5194/wcd-3-825-2022-supplement.
JLGF, SO and LJG designed the scope and model analysis. JLGF conducted the analyses. RC and ZM contributed in the interpretation of results. All authors were fully involved in the revisions and the preparation of the paper.
The contact author has declared that none of the authors has any competing interests.
Publisher's note: Copernicus Publications remains neutral with regard to jurisdictional claims in published maps and institutional affiliations.
Jorge L. García-Franco acknowledges support from an Oxford-Richards graduate scholarship under Wadham College and from a Met Office Partnership PhD CASE studentship. Zane Martin acknowledges support from the National Science Foundation. Lesley J. Gray and Scott Osprey wish to acknowledge support from the United Kingdom Natural Environment Research Council and National Centre for Atmospheric Science. We thank Chaim Garfinkel and two anonymous reviewers for their constructive comments which have greatly improved this study.
This research was supported by an Oxford-Richards scholarship and a PhD CASE scholarship. Zane Martin was supported by the National Science Foundation (award no. 2020305). Lesley J. Gray and Scott Osprey were supported by the United Kingdom Natural Environment Research Council and National Centre for Atmospheric Science (award nos. NE/N018028 and NE/P006779/1).
This paper was edited by Daniela Domeisen and reviewed by Chaim Garfinkel and two anonymous referees.
Abdelmoaty, H. M., Papalexiou, S. M., Rajulapati, C. R., and AghaKouchak, A.: Biases beyond the mean in CMIP6 extreme precipitation: A global investigation, Earths Future, 9, e2021EF002196, https://doi.org/10.1029/2021EF002196, 2021. a, b
Adler, R. F., Huffman, G. J., Chang, A., Ferraro, R., Xie, P.-P., Janowiak, J., Rudolf, B., Schneider, U., Curtis, S., Bolvin, D., Gruber, A., Susskind, J., Arkin, P., and Nelkin, E.: The version-2 global precipitation climatology project (GPCP) monthly precipitation analysis (1979–present), J. Hydrometeorol., 4, 1147–1167, 2003. a
Adler, R., Wang, J. J., Sapiano, M., Huffman, G., Chiu, L., Xie, P. P., Ferraro, R., Schneider, U., Becker, A., Bolvin, D., Nelkin, E., Gu, G., and NOAA CDR Program: Global Precipitation Climatology Project (GPCP) Climate Data Record (CDR), Version 2.3 (Monthly), National Centers for Environmental Information [data set], https://doi.org/10.7289/V56971M6, 2016. a
Adler, R. F., Sapiano, M. R., Huffman, G. J., Wang, J.-J., Gu, G., Bolvin, D., Chiu, L., Schneider, U., Becker, A., Nelkin, E., Xie, P., Ferraro, R., and Shin, D.-B.: The Global Precipitation Climatology Project (GPCP) monthly analysis (new version 2.3) and a review of 2017 global precipitation, Atmosphere, 9, 138, https://doi.org/10.3390/atmos9040138, 2018. a
Andrews, M. B., Knight, J. R., Scaife, A. A., Lu, Y., Wu, T., Gray, L. J., and Schenzinger, V.: Observed and simulated teleconnections between the stratospheric quasi-biennial oscillation and Northern Hemisphere winter atmospheric circulation, J. Geophys. Res.-Atmos., 124, 1219–1232, 2019. a
Anstey, J. A. and Shepherd, T. G.: High-latitude influence of the quasi-biennial oscillation, Q. J. Roy. Meteor. Soc., 140, 1–21, 2014. a
Bayr, T., Dommenget, D., Martin, T., and Power, S. B.: The eastward shift of the Walker Circulation in response to global warming and its relationship to ENSO variability, Clim. Dynam., 43, 2747–2763, 2014. a
Becker, A., Finger, P., Meyer-Christoffer, A., Rudolf, B., and Ziese, M.: GPCC full data reanalysis version 6.0 at 1.0: monthly land-surface precipitation from rain-gauges built on GTS-based and historic data, Global Precipitation Climatology Centre (GPCC), Berlin, Germany, https://doi.org/10.5676/DWD_GPCC/CLIM_M_V2011_100, 2011. a
Becker, A., Finger, P., Meyer-Christoffer, A., Rudolf, B., Schamm, K., Schneider, U., and Ziese, M.: A description of the global land-surface precipitation data products of the Global Precipitation Climatology Centre with sample applications including centennial (trend) analysis from 1901–present, Earth Syst. Sci. Data, 5, 71–99, https://doi.org/10.5194/essd-5-71-2013, 2013. a
Brönnimann, S., Annis, J. L., Vogler, C., and Jones, P. D.: Reconstructing the quasi-biennial oscillation back to the early 1900s, Geophys. Res. Lett., 34, L22805, https://doi.org/10.1029/2007GL031354, 2007 (data available at: https://climexp.knmi.nl/getindices.cgi?WMO=BernData/qbo_90&STATION=QBO_90&TYPE=i&id=someone@somewhere, last access: 1 June 2022). a, b
Bushell, A. C., Butchart, N., Derbyshire, S. H., Jackson, D. R., Shutts, G. J., Vosper, S. B., and Webster, S.: Parameterized gravity wave momentum fluxes from sources related to convection and large-scale precipitation processes in a global atmosphere model, J. Atmos. Sci., 72, 4349–4371, 2015. a
Bushell, A. C., Anstey, J. A., Butchart, N., Kawatani, Y., Osprey, S. M., Richter, J. H., Serva, F., Braesicke, P., Cagnazzo, C., Chen, C.-C., Chun, H.-Y., Garcia, R. R., Gray, L. J., Hamilton, K., Kerzenmacher, T., Kim, Y.-H., Lott, F., McLandress, C., Naoe, H., Scinocca, J., Smith, A. K., Stockdale, T. N., Versick, S., Watanabe, S., Yoshida, K., and Yukimoto, S.: Evaluation of the Quasi-Biennial Oscillation in global climate models for the SPARC QBO-initiative, Q. J. Roy. Meteor. Soc., 148, 1459-1489, https://doi.org/10.1002/qj.3765, 2022. a, b, c, d
Butchart, N., Anstey, J. A., Hamilton, K., Osprey, S., McLandress, C., Bushell, A. C., Kawatani, Y., Kim, Y.-H., Lott, F., Scinocca, J., Stockdale, T. N., Andrews, M., Bellprat, O., Braesicke, P., Cagnazzo, C., Chen, C.-C., Chun, H.-Y., Dobrynin, M., Garcia, R. R., Garcia-Serrano, J., Gray, L. J., Holt, L., Kerzenmacher, T., Naoe, H., Pohlmann, H., Richter, J. H., Scaife, A. A., Schenzinger, V., Serva, F., Versick, S., Watanabe, S., Yoshida, K., and Yukimoto, S.: Overview of experiment design and comparison of models participating in phase 1 of the SPARC Quasi-Biennial Oscillation initiative (QBOi), Geosci. Model Dev., 11, 1009–1032, https://doi.org/10.5194/gmd-11-1009-2018, 2018. a
Cai, W., Wu, L., Lengaigne, M., Li, T., McGregor, S., Kug, J.-S., Yu, J.-Y., Stuecker, M. F., Santoso, A., Li, X., Ham, Y.-G., Chikamoto, Y., Ng, B., McPhaden, M. J., Du, Y., Dommenget, D., Jia, F., Kajtar, J. B., Keenlyside, N., Lin, X., Luo, J.-J., Martín-Rey, M., Ruprich-Robert, Y., Wang, G., Xie, S.-P., Yang, Y., Kang, S. M., Choi, J.-Y., Gan, B., Kim, G.-I., Kim, C.-E., Kim, S., Kim, J.-H., and Chang, P.: Pantropical climate interactions, Science, 363, eaav4236, https://doi.org/10.1126/science.aav4236, 2019. a
Camargo, S. J. and Sobel, A. H.: Revisiting the influence of the quasi-biennial oscillation on tropical cyclone activity, J. Climate, 23, 5810–5825, 2010. a
Capotondi, A., Wittenberg, A. T., Newman, M., Di Lorenzo, E., Yu, J.-Y., Braconnot, P., Cole, J., Dewitte, B., Giese, B., Guilyardi, E., Jin, F., Karnauskas, K., Kirtman, B., Lee, T., Schneider, N., Xue, Y., and Yeh, S.: Understanding ENSO diversity, B. Am. Meteorol. Soc., 96, 921–938, 2015. a, b
Carvalho, L. M., Jones, C., and Liebmann, B.: The South Atlantic convergence zone: Intensity, form, persistence, and relationships with intraseasonal to interannual activity and extreme rainfall, J. Climate, 17, 88–108, 2004. a
Christiansen, B., Yang, S., and Madsen, M. S.: Do strong warm ENSO events control the phase of the stratospheric QBO?, Geophys. Res. Lett., 43, 10489–10495, https://doi.org/10.1002/2016GL070751, 2016. a, b
Claud, C. and Terray, P.: Revisiting the possible links between the quasi-biennial oscillation and the Indian summer monsoon using NCEP R-2 and CMAP fields, J. Climate, 20, 773–787, 2007. a
Coelho, C. A. S., de Souza, D. C., Kubota, P. Y., Cavalcanti, I. F. A., Baker, J. C. A., Figueroa, S. N., Firpo, M. A. F., Guimarães, B. S., Costa, S. M. S., Gonçalves, L. J. M., Bonatti, J. P., Sampaio, G., Klingaman, N. P., Chevuturi, A., and Andrews, M. B.: Assessing the representation of South American monsoon features in Brazil and UK climate model simulations, Climate Resilience and Sustainability, 1, e27, https://doi.org/10.1002/cli2.27, 2022. a
Collimore, C. C., Martin, D. W., Hitchman, M. H., Huesmann, A., and Waliser, D. E.: On the relationship between the QBO and tropical deep convection, J. Climate, 16, 2552–2568, 2003. a, b, c, d, e, f, g
Dawson, A.: Windspharm: A high-level library for global wind field computations using spherical harmonics, Journal of Open Research Software, 4, e31, https://doi.org/10.5334/jors.129, 2016. a
Deser, C., Alexander, M. A., Xie, S.-P., and Phillips, A. S.: Sea surface temperature variability: Patterns and mechanisms, Annu. Rev. Mar. Sci., 2, 115–143, 2010. a
Deser, C., Simpson, I. R., McKinnon, K. A., and Phillips, A. S.: The Northern Hemisphere extratropical atmospheric circulation response to ENSO: How well do we know it and how do we evaluate models accordingly?, J. Climate, 30, 5059–5082, 2017. a
Domeisen, D. I., Garfinkel, C. I., and Butler, A. H.: The teleconnection of El Niño Southern Oscillation to the stratosphere, Rev. Geophys., 57, 5–47, 2019. a, b, c, d
Dommenget, D., Bayr, T., and Frauen, C.: Analysis of the non-linearity in the pattern and time evolution of El Niño Southern Oscillation, Clim. Dynam., 40, 2825–2847, 2013. a
Eresanya, E. O. and Guan, Y.: Structure of the Pacific Walker Circulation Depicted by the Reanalysis and CMIP6, Atmosphere, 12, 1219, 2021. a, b
Freie Universität Berlin: The Quasi-Biennial-Oscillation (QBO) Data Serie, Freie Universität Berlin [data set], http://www.geo.fu-berlin.de/en/met/ag/strat/produkte/qbo/ (last access: 1 July 2022), 2020. a
García-Franco, J. L., Gray, L. J., and Osprey, S.: The American monsoon system in HadGEM3 and UKESM1, Weather Clim. Dynam., 1, 349–371, https://doi.org/10.5194/wcd-1-349-2020, 2020. a, b, c, d, e, f, g
Garfinkel, C. I. and Hartmann, D.: Influence of the quasi-biennial oscillation on the North Pacific and El Niño teleconnections, J. Geophys. Res., 115, D20116, https://doi.org/10.1029/2010JD014181, 2010. a
Garfinkel, C. I. and Hartmann, D. L.: Effects of the El Niño–Southern Oscillation and the quasi-biennial oscillation on polar temperatures in the stratosphere, J. Geophys. Res., 112, D19112, https://doi.org/10.1029/2007JD008481, 2007. a, b
Garfinkel, C. I. and Hartmann, D. L.: The influence of the quasi-biennial oscillation on the troposphere in winter in a hierarchy of models. Part I: Simplified dry GCMs, J. Atmos. Sci., 68, 1273–1289, 2011a. a
Garfinkel, C. I. and Hartmann, D. L.: The influence of the quasi-biennial oscillation on the troposphere in winter in a hierarchy of models. Part II: Perpetual winter WACCM runs, J. Atmos. Sci., 68, 2026–2041, 2011b. a, b, c
Garfinkel, C. I., Gerber, E. P., Shamir, O., Rao, J., Jucker, M., White, I., and Paldor, N.: A QBO Cookbook: Sensitivity of the Quasi-Biennial Oscillation to Resolution, Resolved Waves, and Parameterized Gravity Waves, J. Adv. Model. Earth Sy., 14, e2021MS002568, https://doi.org/10.1029/2021MS002568, 2022. a
Geller, M. A., Zhou, T., and Yuan, W.: The QBO, gravity waves forced by tropical convection, and ENSO, J. Geophys. Res.-Atmos., 121, 8886–8895, 2016. a, b, c
Giorgetta, M. A., Bengtsson, L., and Arpe, K.: An investigation of QBO signals in the east Asian and Indian monsoon in GCM experiments, Clim. Dynam., 15, 435–450, 1999. a, b, c
Gray, L. J., Anstey, J. A., Kawatani, Y., Lu, H., Osprey, S., and Schenzinger, V.: Surface impacts of the Quasi Biennial Oscillation, Atmos. Chem. Phys., 18, 8227–8247, https://doi.org/10.5194/acp-18-8227-2018, 2018. a, b, c, d, e, f, g, h, i, j, k, l, m
Gray, W. M.: Atlantic seasonal hurricane frequency. Part I: El Niño and 30 mb quasi-biennial oscillation influences, Mon. Weather Rev., 112, 1649–1668, 1984. a, b
Gray, W. M., Sheaffer, J. D., and Knaff, J. A.: Influence of the stratospheric QBO on ENSO variability, J. Meteorol. Soc. Jpn. Ser. II, 70, 975–995, 1992. a
Hansen, F., Matthes, K., and Wahl, S.: Tropospheric QBO–ENSO interactions and differences between the Atlantic and Pacific, J. Climate, 29, 1353–1368, 2016. a, b
Haynes, P., Hitchcock, P., Hitchman, M., Yoden, S., Hendon, H., Kiladis, G., Kodera, K., and Simpson, I.: The influence of the stratosphere on the tropical troposphere, J. Meteorol. Soc. Jpn. Ser. II, 99, 803–845, https://doi.org/10.2151/jmsj.2021-040, 2021. a
Hersbach, H., Bell, B., Berrisford, P., Biavati, G., Horányi, A., Muñoz Sabater, J., Nicolas, J., Peubey, C., Radu, R., Rozum, I., Schepers, D., Simmons, A., Soci, C., Dee, D., and Thépaut, J.-N.: ERA5 monthly averaged data on pressure levels from 1959 to present, Copernicus Climate Change Service (C3S) Climate Data Store (CDS) [data set], https://doi.org/10.24381/cds.6860a573, 2019. a
Hersbach, H., Bell, B., Berrisford, P., Hirahara, S., Horányi, A., Muñoz-Sabater, J., Nicolas, J., Peubey, C., Radu, R., Schepers, D., Simmons, A., Soci, C., Abdalla, S., Abellan, X., Balsamo, G., Bechtold, P., Biavati, G., Bidlot, J., Bonavita, M., De Chiara, G., Dahlgren, P., Dee, D., Diamantakis, M., Dragani, R., Flemming, J., Forbes, R., Fuentes, M., Geer, A., Haimberger, L., Healy, S., Hogan, R. J., Hólm, E., Janisková, M., Keeley, S., Laloyaux, P., Lopez, P., Lupu, C., Radnoti, G., de Rosnay, P., Rozum, I., Vamborg, F., Villaume, S., and Thépaut, J.-N.: The ERA5 global reanalysis, Q. J. Roy. Meteor. Soc., 146, 1999–2049, https://doi.org/10.1002/qj.3803, 2020. a
Hitchman, M. H., Yoden, S., Haynes, P. H., Kumar, V., and Tegtmeier, S.: An observational history of the direct influence of the stratospheric quasi-biennial oscillation on the tropical and subtropical upper troposphere and lower stratosphere, J. Meteorol. Soc. Jpn. Ser. II, 99, 239–267, https://doi.org/10.2151/jmsj.2021-012, 2021. a, b, c, d, e, f
Ho, C.-H., Kim, H.-S., Jeong, J.-H., and Son, S.-W.: Influence of stratospheric quasi-biennial oscillation on tropical cyclone tracks in the western North Pacific, Geophys. Res. Lett., 36, L06702, https://doi.org/10.1029/2009GL037163, 2009. a
Holton, J. R. and Tan, H.-C.: The influence of the equatorial quasi-biennial oscillation on the global circulation at 50 mb, J. Atmos. Sci., 37, 2200–2208, 1980. a
Hu, Z.-Z., Huang, B., Kinter, J. L., Wu, Z., and Kumar, A.: Connection of the stratospheric QBO with global atmospheric general circulation and tropical SST. Part II: Interdecadal variations, Clim. Dynam., 38, 25–43, 2012. a, b
Huang, B., Hu, Z.-Z., Kinter, J. L., Wu, Z., and Kumar, A.: Connection of stratospheric QBO with global atmospheric general circulation and tropical SST. Part I: Methodology and composite life cycle, Clim. Dynam., 38, 1–23, 2012. a
Huesmann, A. S. and Hitchman, M. H.: The stratospheric quasi-biennial oscillation in the NCEP reanalyses: Climatological structures, J. Geophys. Res.-Atmos., 106, 11859–11874, 2001. a
Jaramillo, A., Dominguez, C., Raga, G., and Quintanar, A. I.: The Combined QBO and ENSO Influence on Tropical Cyclone Activity over the North Atlantic Ocean, Atmosphere, 12, 1588, 2021. a
Jorgetti, T., da Silva Dias, P. L., and de Freitas, E. D.: The relationship between South Atlantic SST and SACZ intensity and positioning, Clim. Dynam., 42, 3077–3086, 2014. a
Kennedy, J. J., Rayner, N. A., Atkinson, C. P., and Killick, R. E.: An ensemble data set of sea surface temperature change from 1850: The Met Office Hadley Centre HadSST.4.0.0.0 data set, J. Geophys. Res.-Atmos., 124, 7719–7763, https://doi.org/10.1029/2018JD029867, 2019 (data available at: https://www.metoffice.gov.uk/hadobs/hadsst4/data/download.html, last access: 1 June 2022). a, b
Kim, H., Caron, J. M., Richter, J. H., and Simpson, I. R.: The Lack of QBO-MJO Connection in CMIP6 Models, Geophys. Res. Lett., 47, e2020GL087295, https://doi.org/10.1029/2020GL087295, 2020. a
Klotzbach, P., Abhik, S., Hendon, H., Bell, M., Lucas, C., Marshall, A., and Oliver, E.: On the emerging relationship between the stratospheric Quasi-Biennial oscillation and the Madden-Julian oscillation, Sci. Rep.-UK, 9, 1–9, 2019. a, b
Kuhlbrodt, T., Jones, C. G., Sellar, A., Storkey, D., Blockley, E., Stringer, M., Hill, R., Graham, T., Ridley, J., Blaker, A., Calvert, D., Copsey, D., Ellis, R., Hewitt, H., Hyder, P., Ineson, S., Mulcahy, J., Siahaan, A., and Walton, J.: The low-resolution version of HadGEM3 GC3. 1: Development and evaluation for global climate, J. Adv. Model. Earth Sy., 10, 2865–2888, 2018. a
Lee, J., Planton, Y. Y., Gleckler, P. J., Sperber, K. R., Guilyardi, E., Wittenberg, A. T., McPhaden, M. J., and Pallotta, G.: Robust evaluation of ENSO in climate models: How many ensemble members are needed?, Geophys. Res. Lett., 48, e2021GL095041, https://doi.org/10.1029/2021GL095041, 2021. a
Liess, S. and Geller, M. A.: On the relationship between QBO and distribution of tropical deep convection, J. Geophys. Res., 117, D03108, https://doi.org/10.1029/2011JD016317, 2012. a, b, c, d, e, f, g, h, i, j, k, l, m
Lim, Y., Son, S.-W., Marshall, A. G., Hendon, H. H., and Seo, K.-H.: Influence of the QBO on MJO prediction skill in the subseasonal-to-seasonal prediction models, Clim. Dynam., 53, 1681–1695, 2019. a
Liu, M., Ren, H.-L., Zhang, R., Ineson, S., and Wang, R.: ENSO phase-locking behavior in climate models: from CMIP5 to CMIP6, Environmental Research Communications, 3, 031004, https://doi.org/10.1088/2515-7620/abf295, 2021. a
Lu, H., Hitchman, M. H., Gray, L. J., Anstey, J. A., and Osprey, S. M.: On the role of Rossby wave breaking in the quasi-biennial modulation of the stratospheric polar vortex during boreal winter, Q. J. Roy. Meteor. Soc., 146, 1939–1959, 2020. a
Ma, T., Chen, W., Huangfu, J., Song, L., and Cai, Q.: The observed influence of the Quasi-Biennial Oscillation in the lower equatorial stratosphere on the East Asian winter monsoon during early boreal winter, Int. J. Climatol., 41, 6254–6269, https://doi.org/10.1002/joc.7192, 2021. a
Mantua, N. J., Hare, S. R., Zhang, Y., Wallace, J. M., and Francis, R. C.: A Pacific interdecadal climate oscillation with impacts on salmon production, B. Am. Meteorol. Soc., 78, 1069–1080, 1997. a
Martin, Z., Vitart, F., Wang, S., and Sobel, A.: The Impact of the Stratosphere on the MJO in a Forecast Model, J. Geophys. Res.-Atmos., 125, e2019JD032106, https://doi.org/10.1029/2019JD032106, 2020. a
Martin, Z., Orbe, C., Wang, S., and Sobel, A.: The MJO–QBO Relationship in a GCM with Stratospheric Nudging, J. Climate, 34, 4603–4624, 2021a. a
Martin, Z., Sobel, A., Butler, A., and Wang, S.: Variability in QBO temperature anomalies on annual and decadal time scales, J. Climate, 34, 589–605, 2021b. a
Martin, Z., Son, S.-W., Butler, A., Hendon, H., Kim, H., Sobel, A., Yoden, S., and Zhang, C.: The influence of the quasi-biennial oscillation on the Madden–Julian oscillation, Nature Reviews Earth & Environment, 2, 477–489, 2021c. a, b
McKenna, S., Santoso, A., Gupta, A. S., Taschetto, A. S., and Cai, W.: Indian Ocean Dipole in CMIP5 and CMIP6: characteristics, biases, and links to ENSO, Sci. Rep.-UK, 10, 1–13, 2020. a
Menary, M. B., Kuhlbrodt, T., Ridley, J., Andrews, M. B., Dimdore-Miles, O. B., Deshayes, J., Eade, R., Gray, L., Ineson, S., Mignot, J., Roberts, C. D., Robson, J., Wood, R. A., and Xavier, P.: Preindustrial Control Simulations With HadGEM3-GC3. 1 for CMIP6, J. Adv. Model. Earth Sy., 10, 3049–3075, 2018. a, b
Misios, S., Gray, L. J., Knudsen, M. F., Karoff, C., Schmidt, H., and Haigh, J. D.: Slowdown of the Walker circulation at solar cycle maximum, P. Natl. Acad. Sci. USA, 116, 7186–7191, 2019. a, b
Nie, J. and Sobel, A. H.: Responses of tropical deep convection to the QBO: Cloud-resolving simulations, J. Atmos. Sci., 72, 3625–3638, 2015. a, b
Peña-Ortiz, C., Manzini, E., and Giorgetta, M. A.: Tropical deep convection impact on southern winter stationary waves and its modulation by the quasi-biennial oscillation, J. Climate, 32, 7453–7467, 2019. a
Rao, J., Garfinkel, C. I., and White, I. P.: How does the quasi-biennial oscillation affect the boreal winter tropospheric circulation in CMIP5/6 models?, J. Climate, 33, 8975–8996, 2020. a, b, c, d, e, f
Richter, I. and Tokinaga, H.: An overview of the performance of CMIP6 models in the tropical Atlantic: mean state, variability, and remote impacts, Clim. Dynam., 55, 2579–2601, 2020. a, b
Richter, J. H., Anstey, J. A., Butchart, N., Kawatani, Y., Meehl, G. A., Osprey, S., and Simpson, I. R.: Progress in Simulating the Quasi-Biennial Oscillation in CMIP Models, J. Geophys. Res.-Atmos., 125, e2019JD032362, https://doi.org/10.1029/2019JD032362, 2020. a, b
Saji, N., Goswami, B. N., Vinayachandran, P., and Yamagata, T.: A dipole mode in the tropical Indian Ocean, Nature, 401, 360–363, 1999. a
Scaife, A., Butchart, N., Warner, C., and Swinbank, R.: Impact of a spectral gravity wave parameterization on the stratosphere in the Met Office Unified Model, J. Atmos. Sci., 59, 1473–1489, 2002. a
Schenzinger, V., Osprey, S., Gray, L., and Butchart, N.: Defining metrics of the Quasi-Biennial Oscillation in global climate models, Geosci. Model Dev., 10, 2157–2168, https://doi.org/10.5194/gmd-10-2157-2017, 2017. a, b, c, d, e
Schirber, S.: Influence of ENSO on the QBO: Results from an ensemble of idealized simulations, J. Geophys. Res.-Atmos., 120, 1109–1122, 2015. a, b, c
Schneider, U., Becker, A., Finger, P., Meyer-Christoffer, A., Rudolf, B., and Ziese, M.: GPCC Full Data Reanalysis Version 6.0 at 0.5∘: monthly land-surface precipitation from rain-gauges built on GTS-based and historic data, Global Precipitation Climatology Centre (GPCC), Deutscher Wetterdienst (DWD) [data set], https://doi.org/10.5676/DWD_GPCC/FD_M_V6_050, 2011. a
Sellar, A. A., Jones, C. G., Mulcahy, J., Tang, Y., Yool, A., Wiltshire, A., O'Connor, F. M., Stringer, M., Hill, R., Palmieri, J., Woodward, S., de Mora, L., Kuhlbrodt, T., Rumbold, S., Kelley, D. I., Ellis, R., Johnson, C. E., Walton, J., Abraham, N. L., Andrews, M. B., Andrews, T., Archibald, A. T., Berthou, S., Burke, E., Blockley, E., Carslaw, K., Dalvi, M., Edwards, J., Folberth, G. A., Gedney, N., Griffiths, P. T., Harper, A. B., Hendry, M. A., Hewitt, A. J., Johnson, B., Jones, A., Jones, C. D., Keeble, J., Liddicoat, S., Morgenstern, O., Parker, R. J., Predoi, V., Robertson, E., Siahaan, A., Smith, R. S., Swaminathan, R., Woodhouse, M. T., Zeng, G., and Zerroukat, M.: UKESM1: Description and evaluation of the UK Earth System Model, J. Adv. Model. Earth Sy., 11, 4513–4558, https://doi.org/10.1029/2019MS001739, 2019. a, b
Seo, J., Choi, W., Youn, D., Park, D.-S. R., and Kim, J. Y.: Relationship between the stratospheric quasi-biennial oscillation and the spring rainfall in the western North Pacific, Geophys. Res. Lett., 40, 5949–5953, 2013. a, b
Serva, F., Cagnazzo, C., Christiansen, B., and Yang, S.: The influence of ENSO events on the stratospheric QBO in a multi-model ensemble, Clim. Dynam., 54, 2561–2575, 2020. a, b, c, d
Serva, F., Anstey, J. A., Bushell, A. C., Butchart, N., Cagnazzo, C., Gray, L., Kawatani, Y., Osprey, S. M., Richter, J. H., and Simpson, I. R.: The impact of the QBO on the region of the tropical tropopause in QBOi models: present-day simulations, Q. J. Roy. Meteor. Soc., 148, 1945–1964, https://doi.org/10.1002/qj.4287, 2022. a, b, c
Son, S.-W., Lim, Y., Yoo, C., Hendon, H. H., and Kim, J.: Stratospheric control of the Madden–Julian oscillation, J. Climate, 30, 1909–1922, 2017. a, b
Sutton, R. T. and Hodson, D. L.: Atlantic Ocean forcing of North American and European summer climate, Science, 309, 115–118, 2005. a
Taguchi, M.: Observed connection of the stratospheric quasi-biennial oscillation with El Niño–Southern Oscillation in radiosonde data, J. Geophys. Res., 115, D18120, https://doi.org/10.1029/2010JD014325, 2010. a, b, c, d
Tegtmeier, S., Anstey, J., Davis, S., Ivanciu, I., Jia, Y., McPhee, D., and Pilch Kedzierski, R.: Zonal Asymmetry of the QBO Temperature Signal in the Tropical Tropopause Region, Geophys. Res. Lett., 47, e2020GL089533, https://doi.org/10.1029/2020GL089533, 2020. a
Walters, D., Baran, A. J., Boutle, I., Brooks, M., Earnshaw, P., Edwards, J., Furtado, K., Hill, P., Lock, A., Manners, J., Morcrette, C., Mulcahy, J., Sanchez, C., Smith, C., Stratton, R., Tennant, W., Tomassini, L., Van Weverberg, K., Vosper, S., Willett, M., Browse, J., Bushell, A., Carslaw, K., Dalvi, M., Essery, R., Gedney, N., Hardiman, S., Johnson, B., Johnson, C., Jones, A., Jones, C., Mann, G., Milton, S., Rumbold, H., Sellar, A., Ujiie, M., Whitall, M., Williams, K., and Zerroukat, M.: The Met Office Unified Model Global Atmosphere 7.0/7.1 and JULES Global Land 7.0 configurations, Geosci. Model Dev., 12, 1909–1963, https://doi.org/10.5194/gmd-12-1909-2019, 2019. a, b
Wang, B. and Ding, Q.: Global monsoon: Dominant mode of annual variation in the tropics, Dynam. Atmos. Oceans, 44, 165–183, 2008. a
Wang, B., Biasutti, M., Byrne, M. P., Castro, C., Chang, C.-P., Cook, K., Fu, R., Grimm, A. M., Ha, K.-J., Hendon, H., Kitoh, A., Krishnan, R., Lee, J., Li, J., Liu, J., Moise, A., Pascale, S., Roxy, M. K., Seth, A., Sui, C., Turner, A., Yang, S., Yun, K., Zhang, L., and Zhou, T.: Monsoons climate change assessment, B. Am. Meteorol. Soc., 102, E1–E19, 2021. a
Wang, P. X., Wang, B., Cheng, H., Fasullo, J., Guo, Z., Kiefer, T., and Liu, Z.: The global monsoon across time scales: Mechanisms and outstanding issues, Earth-Sci. Rev., 174, 84–121, 2017. a
Wang, S., Tippett, M. K., Sobel, A. H., Martin, Z., and Vitart, F.: Impact of the QBO on prediction and predictability of the MJO convection, J. Geophys. Res.-Atmos., 124, 11766–11782, https://doi.org/10.1029/2019JD030575, 2019. a
Wang, X. and Wang, C.: Different impacts of various El Niño events on the Indian Ocean Dipole, Clim. Dynam., 42, 991–1005, 2014. a
Williams, K. D., Copsey, D., Blockley, E. W., Bodas-Salcedo, A., Calvert, D., Comer, R., Davis, P., Graham, T., Hewitt, H. T., Hill, R., Hyder, P., Ineson, S., Johns, T. C., Keen, A. B., Lee, R. W., Megann, A., Milton, S. F., Rae, J. G. L., Roberts, M. J., Scaife, A. A., Schiemann, R., Storkey, D., Thorpe, L., Watterson, I. G., Walters, D. N., West, A., Wood, R. A., Woollings, T., and Xavier, P. K.: The Met Office global coupled model 3.0 and 3.1 (GC3.0 and GC3.1) configurations, J. Adv. Model. Earth Sy., 10, 357–380, 2018. a, b
World Climate Research Programme (WCRP): Coupled Model Intercomparison Project (Phase 6), WCRP, https://esgf-index1.ceda.ac.uk/projects/cmip6-ceda/, last access: 22 October 2021. a
Yu, B. and Zwiers, F. W.: Changes in equatorial atmospheric zonal circulations in recent decades, Geophys. Res. Lett., 37, L05701, https://doi.org/10.1029/2009GL042071, 2010. a