the Creative Commons Attribution 4.0 License.
the Creative Commons Attribution 4.0 License.
 | 19 Jan 2023
Cloud-radiative impact on the dynamics and predictability of an idealized extratropical cyclone
Behrooz Keshtgar
Aiko Voigt
Corinna Hoose
Michael Riemer
Bernhard Mayer
Extratropical cyclones drive midlatitude weather, including extreme events, and determine midlatitude climate. Their dynamics and predictability are strongly shaped by cloud diabatic processes. While the cloud impact due to latent heating is much studied, little is known about the impact of cloud radiative heating (CRH) on the dynamics and predictability of extratropical cyclones. Here, we address this question by means of baroclinic life cycle simulations performed at a convection-permitting resolution of 2.5 km with the ICON model. The simulations use a newly implemented channel setup with periodic boundary conditions in the zonal direction. Moreover, the simulations apply a new modeling technique for which only CRH interacts with the cyclone, which circumvents changes in the mean state due to clear-sky radiative cooling that has complicated the interpretation of previous work.
We find that CRH increases the kinetic energy of the cyclone system. The impact is most prominent at upper levels. To understand the CRH impact on the upper-tropospheric circulation, we diagnose the evolution of differences in potential vorticity between a simulation with and without CRH, and we quantify through which processes these differences grow over the course of the cyclone's life cycle. According to this diagnostic, CRH affects the cyclone mostly via the intensification of latent heating from cloud microphysical processes. Near the tropopause, direct diabatic modification of potential vorticity by intensified latent heat release precedes further changes in the tropopause by the upper-tropospheric divergent flow, which represents an indirect impact of latent heat release. Subsequently, differences in the tropopause structure amplify with the rotational flow during the highly nonlinear stage of the baroclinic wave.
Our results show that although CRH is comparably small in magnitude, it can affect extratropical cyclones by changing cloud microphysical heating and subsequently the large-scale flow. The CRH impact follows a previously identified mechanism of multi-stage upscale error growth. At the same time, simulations in which CRH is disabled after certain days show that the CRH impact operates throughout the entire intensification phase of the cyclone. This means that CRH does not merely provide an arbitrary initial perturbation to the cyclone, from which differences grow in a generic way. Instead, our results suggest that uncertainties associated with the representation of CRH in numerical models have a more systematic impact and may more fundamentally influence model predictions of extratropical cyclones.
- Article
(8904 KB) - Full-text XML
- BibTeX
- EndNote


Extratropical cyclones are an essential component of the midlatitude circulation and determine midlatitude climate by transporting energy and moisture poleward. They also drive midlatitude weather and are responsible for extreme events such as strong windstorms and floods. Advances in understanding the dynamics of extratropical cyclones have led to better weather predictions (Schultz et al., 2019). While baroclinicity, i.e., horizontal gradients in temperature, is the main driver of extratropical cyclones (Catto, 2016), their dynamics and predictability are strongly affected by diabatic processes (Davis et al., 1993; Stoelinga, 1996). Work on diabatic impacts has mainly focused on latent heating, which is well known to amplify extratropical cyclones and modify their potential vorticity (PV) structure (Booth et al., 2013; Büeler and Pfahl, 2017). This includes studies of warm conveyor belts and the embedded latent heating, as well as the role of cloud microphysics (Joos and Wernli, 2012; Oertel et al., 2020).
In contrast, radiative processes have received much less attention. Although radiative heating and cooling in the atmosphere are smaller in magnitude than other diabatic processes, their persistence over longer periods of time can make them as important as other diabatic processes. Several studies showed that radiative processes should be considered more systematically. The cyclone case studies of Chagnon et al. (2013) and Spreitzer et al. (2019) highlighted the importance of longwave radiative cooling for the PV structure near the tropopause leading to a first-order impact on the amplitude evolution of the upper-tropospheric Rossby wave pattern (Teubler and Riemer, 2021). Baumgart et al. (2019) found radiation to be as important as other diabatic processes for forecast error growth on longer timescales, and Martínez-Alvarado et al. (2016) found that radiation contributes to the diabatic generation of forecast errors in warm conveyor belts and Rossby waves. Climate model studies showed that cloud radiative heating and cooling (hereafter CRH) increase the eddy kinetic energy in the midlatitudes (Li et al., 2015). However, using a different climate modeling technique, Grise et al. (2019) showed that the coupling of CRH with the circulation damps the intensity of extratropical storm tracks. Other studies highlighted the importance of CRH on the response of the extratropical circulation to increasing surface temperatures (Albern et al., 2019; Voigt et al., 2021).
Many valuable insights on the role of latent heating were gained in idealized simulations of extratropical cyclones, i.e., so-called baroclinic life cycle simulations. To isolate the impact of latent heating, such simulations tend to neglect radiation altogether (e.g., Booth et al., 2013; Boutle et al., 2010; Tierney et al., 2018). Schäfer and Voigt (2018) were the first to show that radiation cuts the magnitude of idealized extratropical cyclone's strength in half, and that a substantial (although not the dominant) part of the radiative weakening was due to cloud-radiative processes. However, the dynamical mechanism by which radiation, and in particular CRH, affects cyclones has remained elusive from their work.
Radiative processes change the dynamics and physics of clouds (Klinger and Mayer, 2016). Spatial contrasts in radiative heating and cooling can destabilize clouds and their environment (Fu et al., 1995), thereby generating buoyancy that promotes cloud formation and enhances condensation. Tropical cyclone studies showed that cloud longwave absorption and emission by the anvil enhances upward motion and, as a result, convective heating (Fovell et al., 2016), and Ruppert et al. (2020) found this effect to accelerate tropical cyclone development. Longwave radiation can also affect the microphysics of clouds, resulting in enhanced cloud droplet growth and an earlier formation of precipitation (Barekzai and Mayer, 2020).
It is also conceivable that cloud-radiation interaction might affect the predictability of extratropical cyclones. Given the multiscale nature of the atmosphere, small grid-scale errors associated with physical processes can grow to the synoptic scale, resulting in substantial forecast errors (e.g., Zhang et al., 2007; Baumgart et al., 2019). The cyclone case studies of Joos and Forbes (2016) showed that changes in the microphysical parameterization affect the outflow of warm conveyor belts and thereby the evolution of the upper-tropospheric flow. Cloud-radiative processes might act as a similar source of forecast error, but this possibility has not been addressed so far.
In this study, we conduct idealized baroclinic life cycle simulations with a convection-permitting resolution of 2.5 km to provide the first systematic investigation of the cloud-radiative impact on extratropical cyclones. The high resolution allows the model to treat deep convection explicitly, i.e., no deep convection scheme needs to be used and clouds and updrafts interact directly. Using these simulations, we address three research questions:
-
How strongly does CRH affect an idealized extratropical cyclone?
-
What are the mechanisms that underlie the cloud-radiative impact?
-
What does this imply for the cloud-radiative impact on cyclone predictability?
The paper is organized as follows. The model setup and simulation design are described in Sect. 2. Section 3 characterizes the cloud-radiative impact on the baroclinic life cycle in terms of the cyclone strength and PV. In Sect. 4, we use a PV-difference diagnostic to understand how CRH changes the dynamics and evolution of the cyclone. In Sect. 5, we assess the cloud-radiative impact on cyclone predictability by disabling cloud-radiation interaction at a number of days during the cyclone growth. Finally, the paper closes with the conclusion in Sect. 6.
This section describes the model setup that we use for the baroclinic life cycle simulations, and introduces the new modeling approach that we have developed to study the impact of CRH.
2.1 ICON model setup
We use the ICOsahedral Nonhydrostatic atmosphere model (ICON-NWP, version 2.6.2.2; Zängl et al., 2015). For the simulations, we use a limited-area channel setup on a Cartesian f-plane with periodic boundary conditions in zonal direction and fixed meridional boundaries. Because a channel setup was not available in ICON, we introduced a new grid by building upon the planar-channel grid available for the ICON ocean component and the torus grid available for the ICON atmosphere component.
The channel setup allows for high horizontal resolution while keeping computational costs manageable for more simulations. Another advantage is its perfectly uniform grid, i.e., each triangular grid cell has exactly the same area. We use a convection-permitting resolution of 2.5 km in the horizontal direction, which results in nearly 6 million grid points. In the vertical direction, we use 75 model levels. The Coriolis parameter is constant with a value for 45∘ N. For the domain size, we set the channel width to 9000 km and the channel length to 4000 km, which approximately equals 81∘ in latitudinal and 51∘ in longitudinal direction. The large meridional extent ensures that the simulated cyclone is not influenced by the meridional boundaries. Test simulations showed that the cyclone is sensitive to the domain length. For smaller lengths, the cyclone is rather weak, while for larger lengths it becomes very strong. We thus settled for a domain length of 4000 km.
The model surface is specified as an ice-free ocean surface with no topography and time-constant sea surface temperatures that are 0.5 K cooler than the initial temperature of the lowest model level. The model is run with full physics including the shallow convection scheme of Bechtold et al. (2008) and the turbulence scheme of Raschendorfer (2001). The deep convection scheme is disabled. Cloud microphysics and grid‐scale precipitation are represented by the two‐ice‐category one‐moment scheme of Doms et al. (2011). Longwave and shortwave radiation are calculated with the rapid radiative transfer model (Mlawer et al., 1997). The diurnal cycle is retained and equinox conditions for the shortwave radiation calculation are used.
The initial conditions are the same as in Schäfer and Voigt (2018) and follow the life cycle type 1 configuration of Polvani and Esler (2007). The relative humidity is set to 80 %. With the initial wind profile being baroclinically unstable, the baroclinic life cycle is triggered by adding a sinusoidal thermal wave with a 1 K amplitude at all levels and with a wavelength equal to the domain length. This means that a single cyclone is simulated, instead of a train of six cyclones as in Schäfer and Voigt (2018).
The configuration results in a reasonable cyclone whose structure is typical for wintertime extratropical cyclones. This is illustrated in Fig. 1, which shows the spatial distribution of surface pressure, cloud cover and precipitation rate for a cyclone simulated without radiation. For visualization and remapping purposes, the map plots in our paper use the geographical latitude and longitude coordinates that are assigned to grid cells during the grid generation according to the Cartesian length and width of the domain. The geographical latitude center of the grid is set to 45∘ N, and the cyclone is initialized at 45∘ N. Thus, the grid extends latitudinally from 4.5 to 85.5∘ N. However, in all figures, the range of the latitudes is chosen so that only the necessary information is shown. Nevertheless, the model computation is solely based on the Cartesian grid.
The region with the highest precipitation marks the position of the warm conveyor belt, which is located east and southeast of the cyclone center in Fig. 1a. The warm conveyor belt moves ahead of the cold front and splits into two branches. One branch wraps cyclonically north of the cyclone center, and the other one anticyclonically towards the high-pressure region (Fig. 1a). The less cloudy region just behind the warm conveyor belt marks the location of the descending cold, dry air. From the southwest of the cyclone center to the high-pressure center, shallow stratocumulus clouds form due to the passing of cold air over the warm sea surface.
The use of Cartesian instead of spherical coordinates (which were employed in the global setup of Schäfer and Voigt, 2018) results in a different, but no less realistic, cyclone structure. It is well known that baroclinic waves simulated on a Cartesian geometry display stronger cyclonic flows and upper cyclonic wave breaking during their mature phase. This is evident from the evolution of the dynamical tropopause in Fig. 1b, which shows that the tropopause wave rolls up cyclonically, exhibiting characteristics of the cyclonic life cycle type 2 paradigm of Thorncroft et al. (1993). Similar behavior can be achieved for a spherical geometry by adding a small cyclonic shear to the initial jet. More information on the impact of geometries on the baroclinic life cycle can be found in Balasubramanian and Garner (1997).
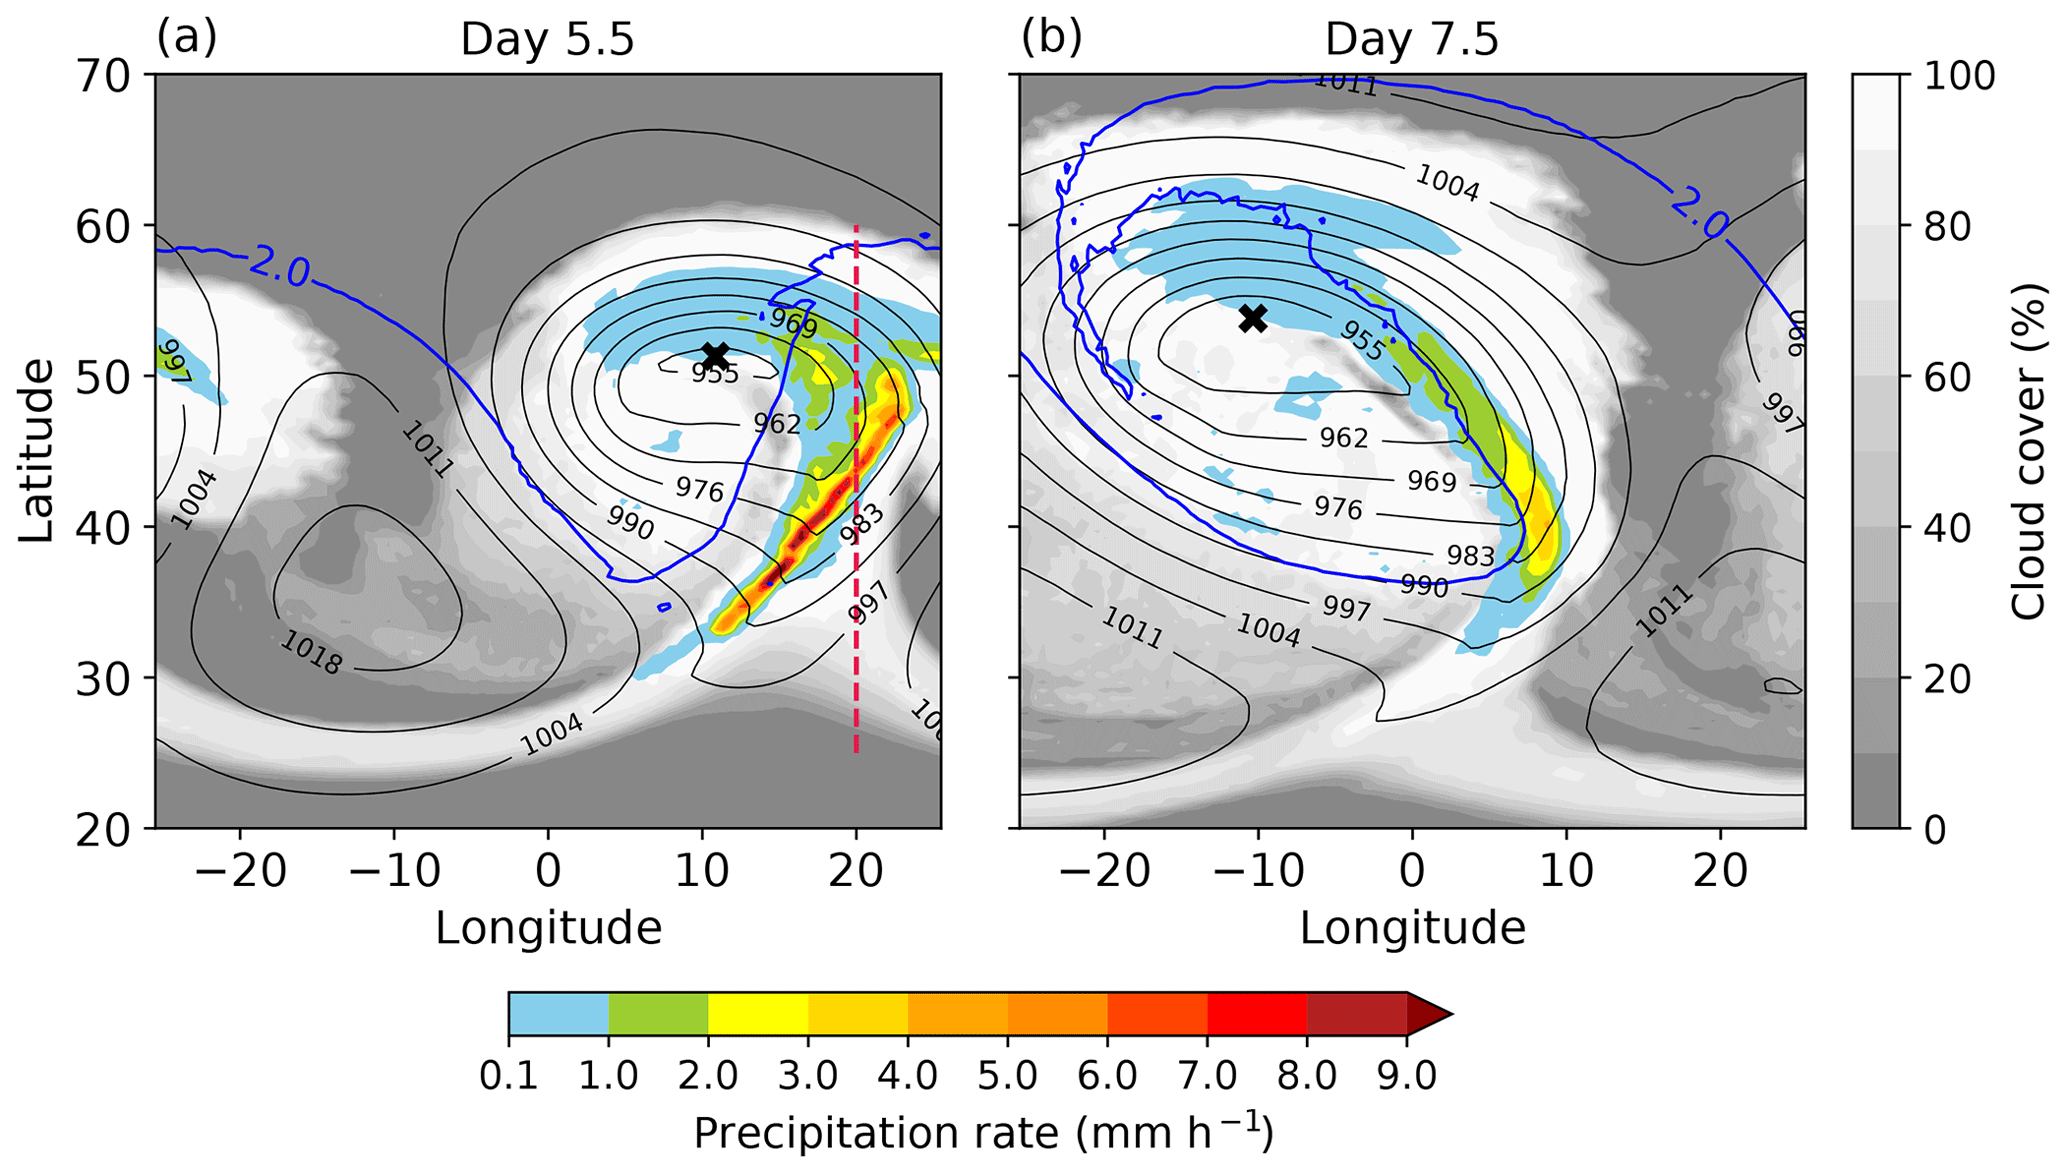
Figure 1Surface pressure (black contours, hPa), total precipitation rate (colors) and cloud cover (gray shadings) for the cyclone simulation without radiation at (a) day 5.5 and (b) day 7.5. The blue contours indicate the dynamical tropopause as given by the 2 PVU contour on the 326 K isentrope. The dashed red line shows the position of the cross-section shown in Fig. 6. The cross shows the position of the cyclone center given by the minimum surface pressure.
2.2 Simulation design
In Schäfer and Voigt (2018) three simulations were performed with different radiative configurations: (1) no radiation, (2) all-sky radiation that includes the radiative contributions from clouds and (3) clear-sky radiation in which clouds are set to zero in the radiation transfer calculation. The cloud-radiative impact was then estimated as the difference between the simulations with all-sky and clear-sky radiation. However, when radiation is included in the baroclinic life cycle simulations, Schäfer and Voigt (2018) found a strong atmospheric cooling in the first days. This initial cooling also occurs in our model setup (Fig. 2a). Due to the strong clear-sky radiative cooling, the atmospheric background state changes, and it is not clear whether the radiative impact on the cyclone is solely due to cloud radiative heating and cooling (CRH) or changes in the atmospheric background.
To eliminate this problem, we develop and apply a new modeling approach that isolates the impact of CRH in a clean and easy-to-interpret manner. Our new approach requires two simulations: one simulation with no radiation as in Schäfer and Voigt (2018) and one simulation with only CRH. In the latter simulation, only the radiative heating from clouds, defined as the all-sky minus the clear-sky radiative heating, is passed to the model's dynamical core. In terms of the thermodynamic equation, our approach is described by
where J represents the heating rates from other diabatic processes. In terms of model implementation, our approach requires two calls to the radiation scheme: one call in which the scheme calculates the all-sky radiative heating rate including clouds and one call in which clouds are set to zero, providing the clear-sky radiative heating rate. CRH is then calculated accordingly and passed to the dynamical core instead of the all-sky or clear-sky radiative heating rates. Our approach, thus, removes the initial radiative adjustment, and the cyclone forms in the same background state independent of whether CRH is active or not. This is shown in Fig. 2b and c.
To study to what extent the cloud-radiative impact is linear, we perform an additional simulation in which we multiply CRH by a factor of two before feeding it to the dynamical core (cf. Eq. 1). This simulation will be referenced as 2xCRH in the following. For convenience, from now on the simulations with no radiation and with cloud radiation only will be referenced as REF and CRH, respectively.
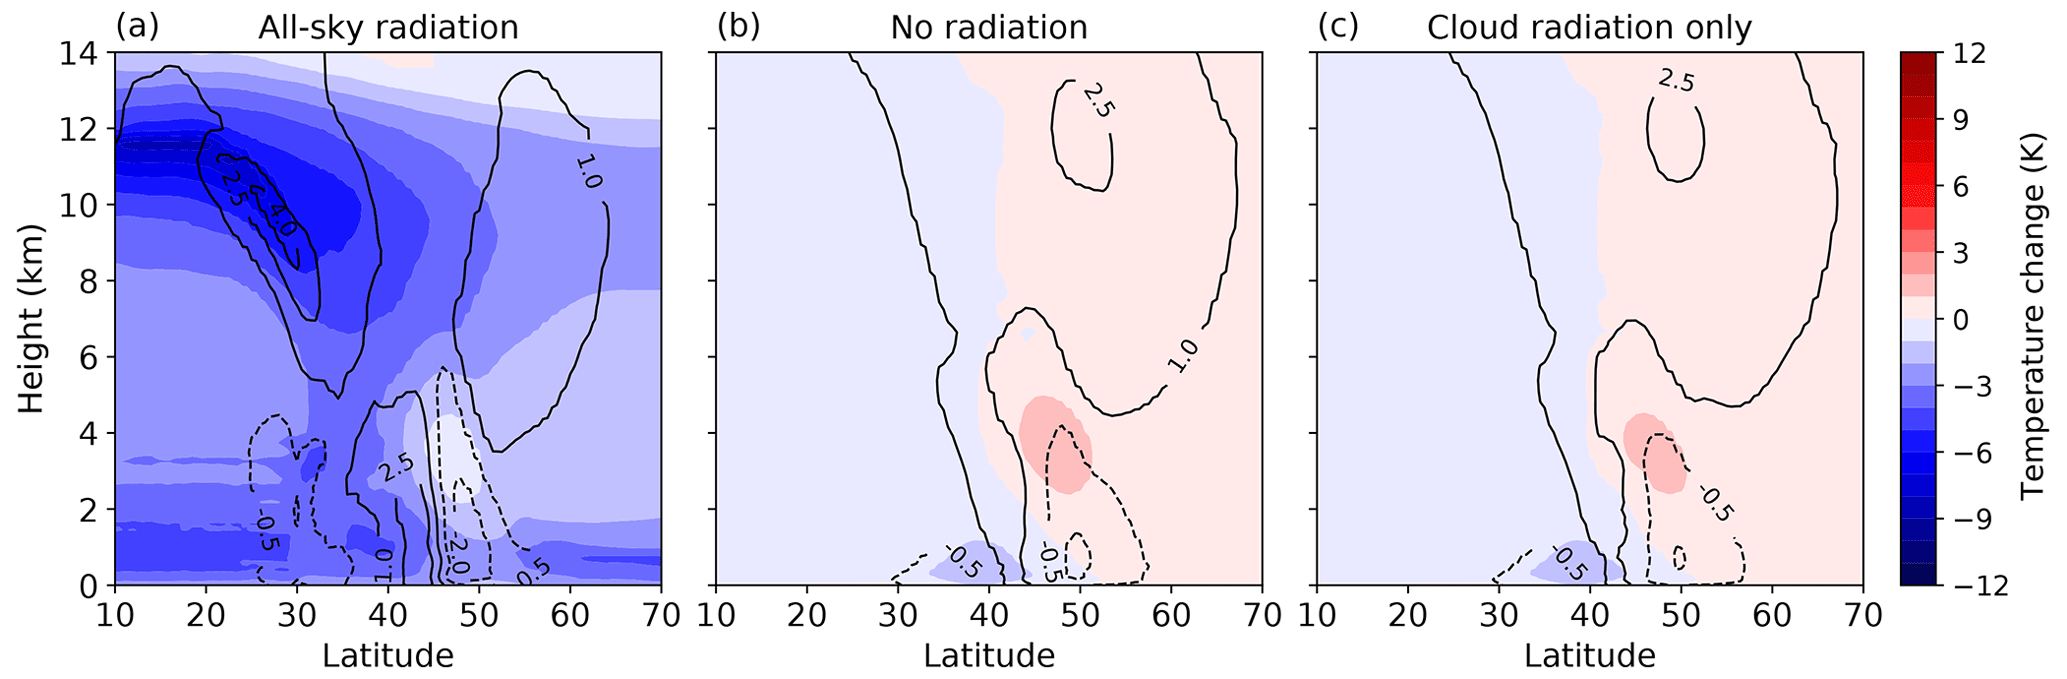
Figure 2Zonal-mean changes in temperature and zonal wind (black contours, m s−1) at day 3 for simulations with (a) all-sky radiation, (b) no radiation and (c) cloud radiation only.
For the analysis, we use the climate data operators (Schulzweida, 2019) and first remap the model output from the triangular grid to a regular rectangular grid with the same resolution using the nearest neighbor interpolation method. We then interpolate the data to a latitude–longitude grid using conservative interpolation. When we calculate spatial averages over the entire simulation domain, we exclude the northern and southern boundaries and perform the calculation from 10 to 80∘ N and −25.5∘ W to 25.5∘ E.
In this section, we assess the impact of CRH on the evolution of the cyclone. To this end, we compare the REF simulation with the simulations that include CRH as given by Eq. (1).
3.1 Cyclone intensity
We characterize cyclone intensity by means of eddy kinetic energy and cyclone center pressure. Eddy kinetic energy is calculated with respect to the deviation from the zonal-mean wind field at each time step. Cyclone central pressure is simply given by the minimum surface pressure within the model domain. Figure 3 shows the evolution of the intensity metrics for the simulations REF, CRH and 2xCRH.
According to the cyclone central pressure shown in Fig. 3a, cyclone development starts at around day 3 and peaks at around day 7. CRH has no noticeable impact on cyclone development as measured by the central pressure. However, CRH clearly strengthens the cyclone in terms of eddy kinetic energy. When CRH is taken into account, eddy kinetic energy increases after day 6 compared to the REF simulation, signaling a stronger cyclone whose peak intensity is delayed. The cloud-radiative impact is more prominent at upper levels, and weaker at lower levels (cf. Fig. 3b and c). This implies that CRH mostly influences the near-tropopause flow. Doubling CRH in the 2xCRH simulation further increases eddy kinetic energy, although the change between the CRH and 2xCRH simulations is smaller than that between the REF and the CRH simulations (Fig. 3b).
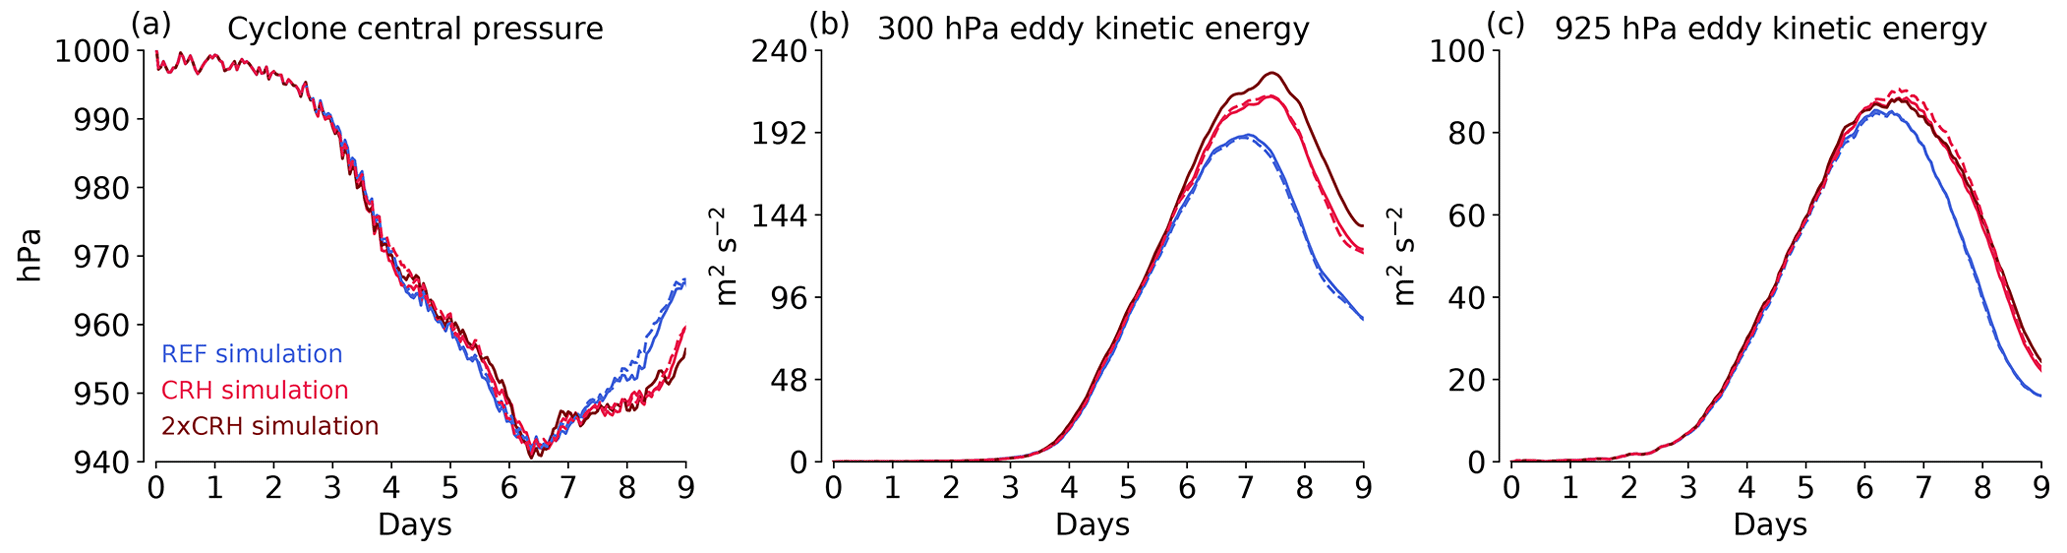
Figure 3Evolution of (a) cyclone central pressure and eddy kinetic energy at (b) 300 hPa and (c) 925 hPa for simulations with no radiation (REF), cloud-radiative heating (CRH) and cloud-radiative heating increased by a factor of 2 (2xCRH). The dashed lines show additional simulations that use the two-moment instead of the one-moment microphysical scheme.
Our results are in contrast to the global simulations of Schäfer and Voigt (2018), who reported that CRH weakens idealized cyclones. Schäfer and Voigt (2018) also used the ICON atmosphere model and studied a cyclone growing from the same initial conditions. The disagreement between our finding of a strengthening CRH impact and the finding of Schäfer and Voigt (2018) of a weakening impact might seem discomforting at first sight, but in fact, it does point out the importance of model uncertainty in CRH. This is briefly described in the following. In a companion study, which was performed as a Master's thesis advised by Aiko Voigt and Behrooz Keshtgar, Butz (2022) found that the result of Schäfer and Voigt (2018) is sensitive to the version of the ICON model. Butz (2022) found a weakening CRH impact in ICON version 2.1 (which is essentially the same version as used by Schäfer and Voigt, 2018), but a strengthening impact in ICON version 2.6 (which is the version used in the present study). Butz (2022) traced this difference to a difference in the simulation of low clouds, of which there are many in version 2.1 but fewer in version 2.6. The results of Butz (2022) imply that the CRH impact is not sensitive to whether a global or channel setup is used. Moreover, we have repeated our channel simulations with the two-moment microphysics scheme of Seifert and Beheng (2006) instead of the one-moment scheme and have found that CRH impact is independent of the microphysics scheme (Fig. 3). Thus, the CRH impact is robust with respect to the model domain and cloud microphysics, although it can be expected to be model dependent because of model uncertainty in the simulation of CRH.
In conjunction with the cyclone intensity metrics, Fig. 4 shows the evolution of spatially averaged total precipitation rate and cloud cover for the three simulations and the differences with respect to the REF simulation. The total precipitation rate is derived from hourly accumulated precipitation and includes precipitation in all forms (rain, snowfall, etc.). Precipitation starts to form around day 3 and peaks at day 6.5 for all simulations (Fig. 4a). Total cloud cover increases constantly during the 9 d of the simulation. When CRH is active, total precipitation rate and total cloud cover increase compared to the REF simulation (Fig. 4a and b). Similar to the eddy kinetic energy (Fig. 3), the CRH impact gets stronger with amplified CRH.
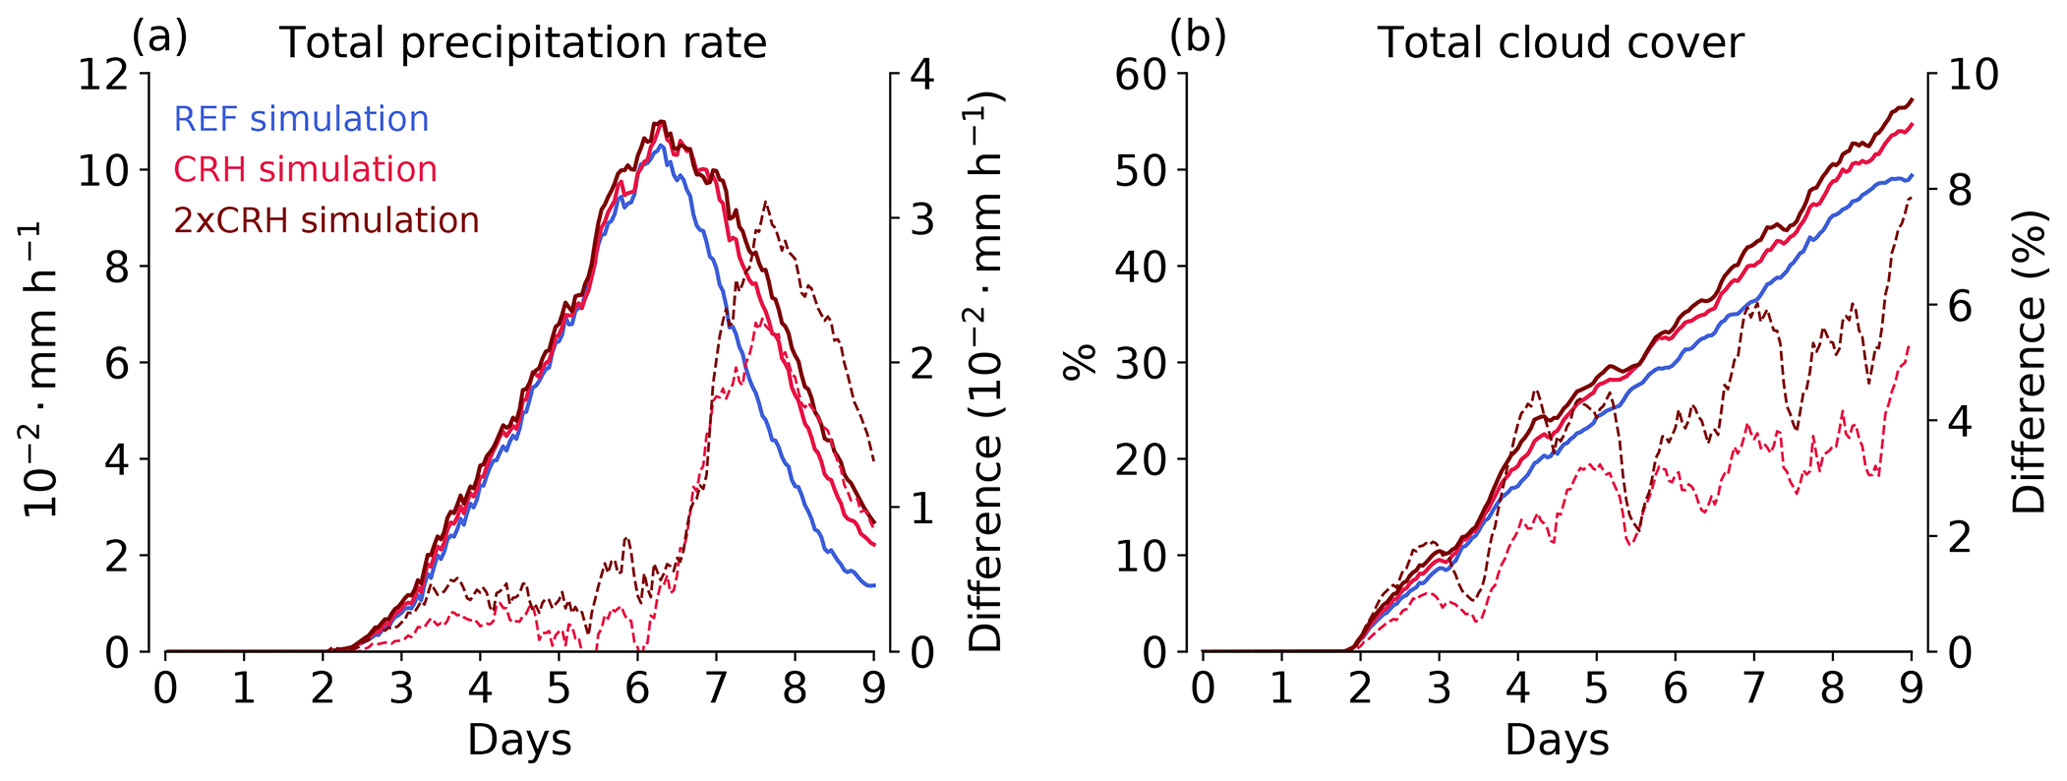
Figure 4Evolution of spatially averaged (a) total precipitation rate and (b) total cloud cover for different treatments of cloud-radiative heating. The dashed lines denote the differences of the CRH and 2xCRH simulations with respect to the REF simulation. For the differences, the right y-axis is used.
The CRH-induced increase in precipitation indicates that the cloud-radiative impact might operate via changes in condensation and latent heating, which are known to strongly affect cyclone development. In the following subsection, we will indeed look at this point in more detail by analyzing the potential vorticity (PV) evolution.
3.2 Cloud-radiative impact on potential vorticity
PV combines dynamic and thermodynamic information and is a conserved quantity for frictionless adiabatic flow. Therefore, PV can serve as a tracer that indicates how the circulation is modified by diabatic processes (e.g., Joos and Wernli, 2012). In addition, the PV distribution on isentropic surfaces helps to characterize the synoptic-scale structure of baroclinic waves and their propagation (Hoskins et al., 1985).
The first row in Fig. 5 shows the evolution of PV at the 326 K isentrope for the REF simulation. This isentropic level includes tropospheric air at lower latitudes and stratospheric air at higher latitudes. The tropopause is located in a region of strong PV gradients that separate tropospheric from stratospheric air masses. The dynamical tropopause is shown by the 2 PVU contour and its wave-like distortion and eventual breaking can be used to depict the development of the cyclone.

Figure 5Upper-level PV evolution on the 326 K isentrope for the REF simulation from days 5 to 8 (a–d). PV differences between the CRH and REF simulations (CRH–REF) at upper levels on the 326 K isentrope (e–h) and at lower levels on the 925 hPa isobaric surface (i–l). The dynamical tropopause is shown in solid and dashed black lines for CRH and REF simulations, respectively. The thin black contours depict the surface pressure (hPa) averaged between the two simulations.
Similar to eddy kinetic energy, the wave amplitude starts to grow at around day 3 and reaches its maximum at day 7 with impending wave breaking. The wave breaking is evident from the reversal of the PV meridional gradient in the western part of the domain at day 7 (Fig. 5c). This is followed by the decay phase of the wave through barotropic conversion of eddy kinetic energy into zonal-mean kinetic energy (not shown).
To demonstrate the impact of CRH on the evolution of PV, the differences of PV between the CRH and the REF simulations are plotted at upper and lower levels in the second and third rows of Fig. 5, respectively. At the upper levels shown by the 326 K isentrope, PV differences at days 5 and 6 are small and limited to regions close to the dynamical tropopause (Fig. 5e and f), but grow to substantial values at days 7 and 8 (Fig. 5g and h). At the lower levels shown by the 925 hPa isobaric surface, PV differences are confined near the cyclone center and in the warm conveyor belt (Fig. 5k and j). However, lower-level PV differences are not strong enough to substantially change the eddy kinetic energy at 925 hPa during the baroclinic development (Fig. 3c)
The distribution of positive and negative PV differences at upper levels indicates that CRH slows the propagation of the baroclinic wave towards the east, thereby postponing the cyclonic wave breaking, and increases the wave amplitude. These impacts can be seen from the deformation of the dynamical tropopause wave at days 7 and 8 (Fig. 5g and h). Higher PV east of the trough center (blue colors) and lower PV at the tip of the ridge (red colors) for the REF simulation at day 7 indicate an earlier wave breaking and termination of the wave intensification. Positive PV differences west of the trough center (red colors) and negative PV differences on the poleward side of the ridge (blue colors in Fig. 5g and h) imply a deeper tropopause fold and stronger ridge for the baroclinic wave with CRH, although this is not explicitly shown in the figure.
The CRH impact is consistent with the diabatic intensification of baroclinic waves in terms of wave amplitude and growth rate. For instance, Chagnon et al. (2013) showed in their cyclone case study that the PV anomalies generated by diabatic processes help to keep the upper-level PV wave phase-locked with the surface potential temperature wave, which means that each wave component will help to increase the amplitude of the other. This mutual interaction then slows down the eastward propagation of the wave and amplifies the growth rate. Thus, including CRH helps to reinforce this impact, resulting in higher eddy kinetic energy and delayed peak time. Overall, the evolution of PV is consistent with that of eddy kinetic energy and the stronger impact of CRH at upper levels.
3.3 Potential vorticity tendency from diabatic processes
We now investigate the modification of PV by diabatic processes and the relation to the PV differences diagnosed in Sect. 3.2. Diabatic processes can modify the near-tropopause PV and hence the tropopause structure. The impact can be direct through diabatically generated PV anomalies, most notably as the result of vertical gradients in diabatic heating, or indirectly through changes in wind and PV advection.
We start with the diabatic PV tendencies of Ertel's PV (Ertel, 1942):
For a non-conservative flow, the diabatic modification of PV is given by (e.g., Büeler and Pfahl, 2017)
where denotes the material derivative, ρ is the density, η is the absolute vorticity vector, is the diabatic heating tendency and F is the frictional force. The first and the second terms on the r.h.s. of Eq. (3) represent the PV modification due to diabatic heating tendencies and nonconservative momentum. For PV modification due to diabatic heating tendencies, one can assume that the vertical gradient of dominates the PV tendency, which is typically the case. Thus, the main effect of diabatic heating is an increase of PV below the maximum of the heating and the reduction of PV above it. However, for our analysis, we derive the diabatic PV tendencies based on the three vector components of Eq. (3) and on model levels to benefit from the high vertical resolution. Our analysis includes all diabatic heating tendencies of the ICON model as well as the nonconservative momentum due to the parameterization of turbulence, shallow convection and non-orographic gravity waves.
The overwhelming part of the heating from cloud-radiation interaction and cloud microphysics occurs within the warm conveyor belt of the cyclone, which is characterized by extensive cloud formation and heavy precipitation. For the simulation with CRH, Fig. 6 shows cross-sections through the warm conveyor belt (shown in Fig. 1) for cloud cover, CRH and microphysical heating at day 5.5. The figure also shows the associated diabatic PV tendencies.
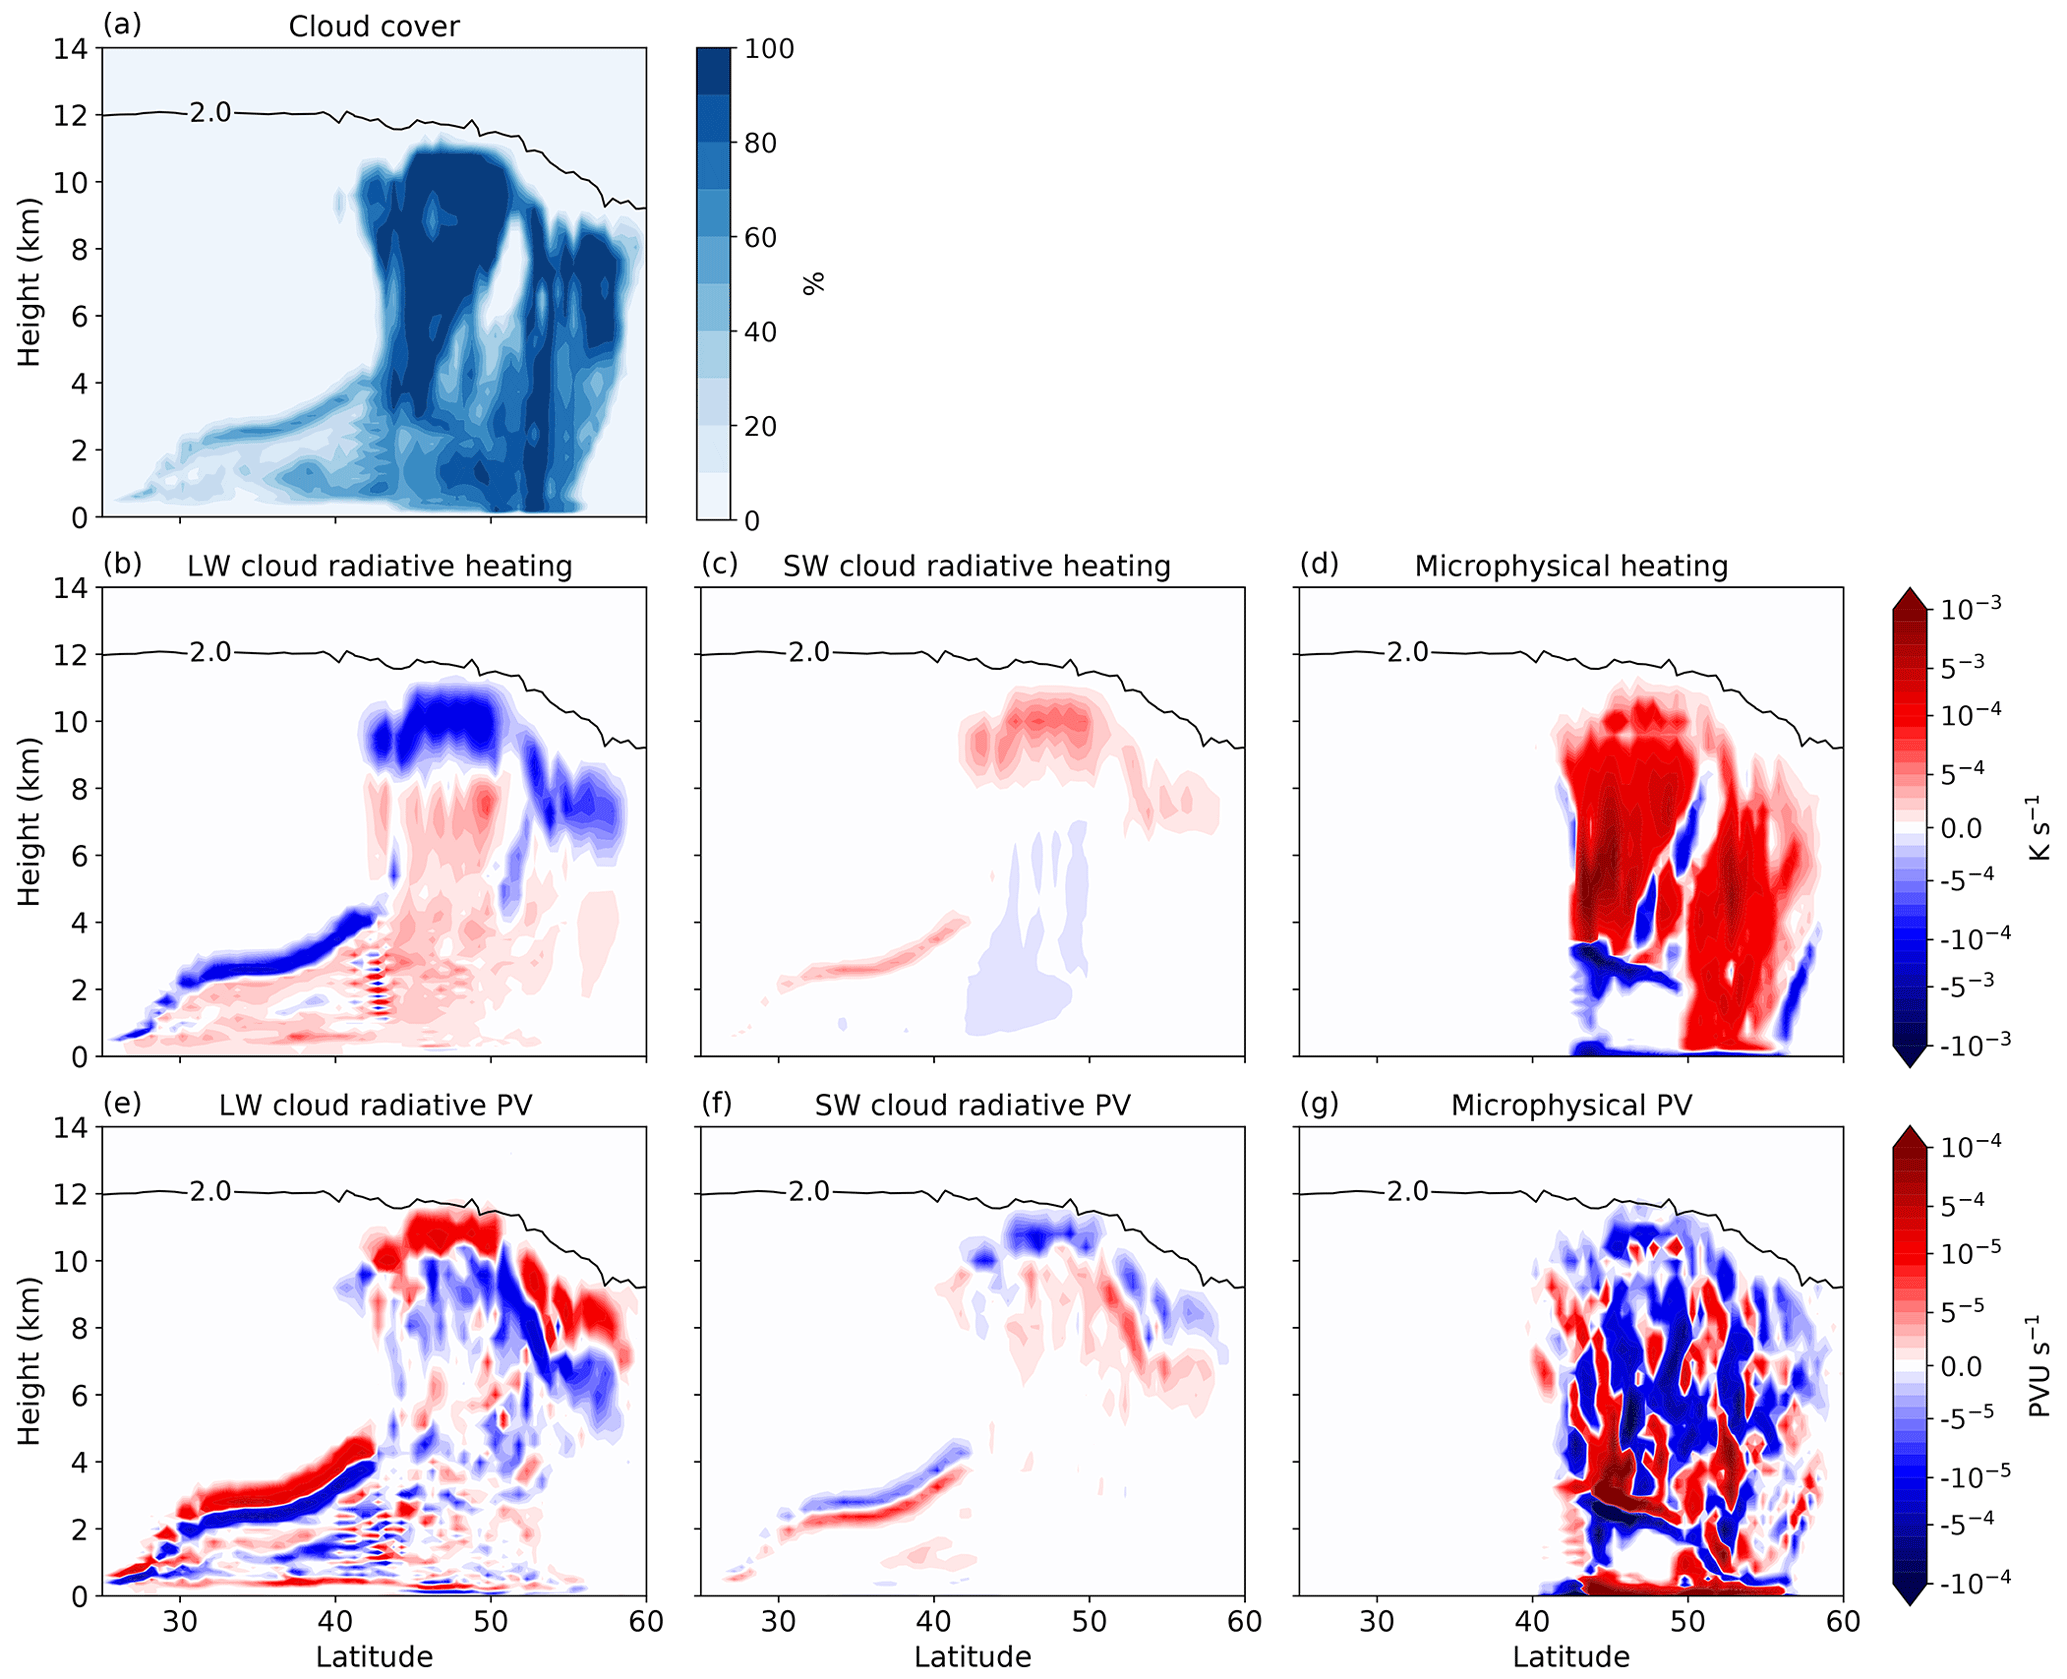
Figure 6Cross-section through the warm conveyor belt shown in Fig. 1 at day 5.5 for the simulation with CRH. (a) Cloud cover, (b) longwave CRH, (c) shortwave CRH and (d) heating from cloud microphysical processes. Panels (e), (f) and (g) show the associated diabatic PV tendencies. Black contours show the tropopause by the 2 PVU contour.
The two cloud bands mark the regions of ascent in the warm conveyor belt and the cyclonic branch that is located further north (Fig. 6a). In these regions, longwave CRH leads to strong cooling near the cloud top and modest warming below (Fig. 6b). In contrast, shortwave CRH warms the top of the clouds and weakly cools the cloud layer below (Fig. 6c). Compared to longwave CRH, shortwave CRH is small and is limited mostly to near the cloud top.
A substantial part of diabatic heating in these cloudy regions is associated with cloud microphysical processes (Fig. 6d). Strong microphysical heating occurs inside the cloud bands, with some cooling below. Joos and Wernli (2012) showed in their warm conveyor belt case study that the largest contribution to microphysical heating is due to the condensation of water vapor and the depositional growth of snow, and that cooling is mostly due to the evaporation of rain and snow melting.
The vertical gradients in CRH and microphysical heating lead to diabatic PV increase and reduction according to Eq. (3) as shown in Fig. 6e, f and g. Longwave CRH mostly generates a vertical dipole of negative and positive PV tendencies near the cloud top (Fig. 6e). For shortwave CRH, the dipole is reversed and somewhat compensates for the longwave CRH impact. Consistent with the larger heating rates, PV tendencies associated with cloud microphysical processes are much stronger.
The relationship between cloud diabatic heating and the associated PV tendencies is further illustrated in Fig. 7, which shows vertical profiles of heating rates and PV tendencies averaged spatially over the entire domain and averaged between days 5 to 8. Another heating rate that is required to be considered for the total latent heating comes from the saturation adjustment scheme. The aim of the saturation adjustment scheme is to bring the water vapor and liquid water back in equilibrium, hence this scheme accounts for the heating rates from condensation. In Fig. 7b, the total latent heating from the sum of cloud microphysics and saturation adjustment is shown. For comparison, the microphysical and total latent heating and their PV tendencies for the REF simulation are also plotted as dashed lines.
On average, longwave CRH leads to a noticeable cooling at upper levels. In the boundary layer, longwave CRH cools the boundary layer top and warms the layer from below (Fig. 7a). Cloud microphysical processes on the other hand produce much stronger heating at mid-levels between 4–8 km (Fig. 7a). Saturation adjustment further increases the mid-levels heating and leads to a secondary heating maximum at 2 km (Fig. 7b).
Previous studies showed that the vertical dipole of PV tendencies associated with latent heating (Fig. 7c, d, red and dark red lines) helps to increase the intensity of the cyclone (Stoelinga, 1996; Büeler and Pfahl, 2017). At lower levels, positive PV tendencies tend to form and increase the lower-tropospheric PV. The negative PV tendencies above the maximum latent heating lead to the downstream upper-level ridge amplification. This configuration supports the typical westward tilt between lower and upper-level waves, hence cyclone intensification.
PV tendencies by CRH may enhance or weaken the aforementioned PV tendencies associated with cyclone intensification. At upper levels, positive PV tendencies by longwave CRH tend to reduce the magnitude of latent heating negative PV tendency. But, at lower levels between 2–4 km, they tend to interfere positively to increase PV (Fig. 7c and d). CRH also amplifies the microphysical and total latent heating (Fig. 7a and b) and their PV tendency dipole (Fig. 7c and d). This is related to the destabilization of the ascent region within the cyclone by the longwave CRH dipole (Fig. 6b). Cloud top cooling and warming below increase the buoyancy of the layer leading to stronger ascending motion and latent heating. The stronger latent heating PV tendency dipole is in favor of cyclone intensification and hence higher eddy kinetic energy.
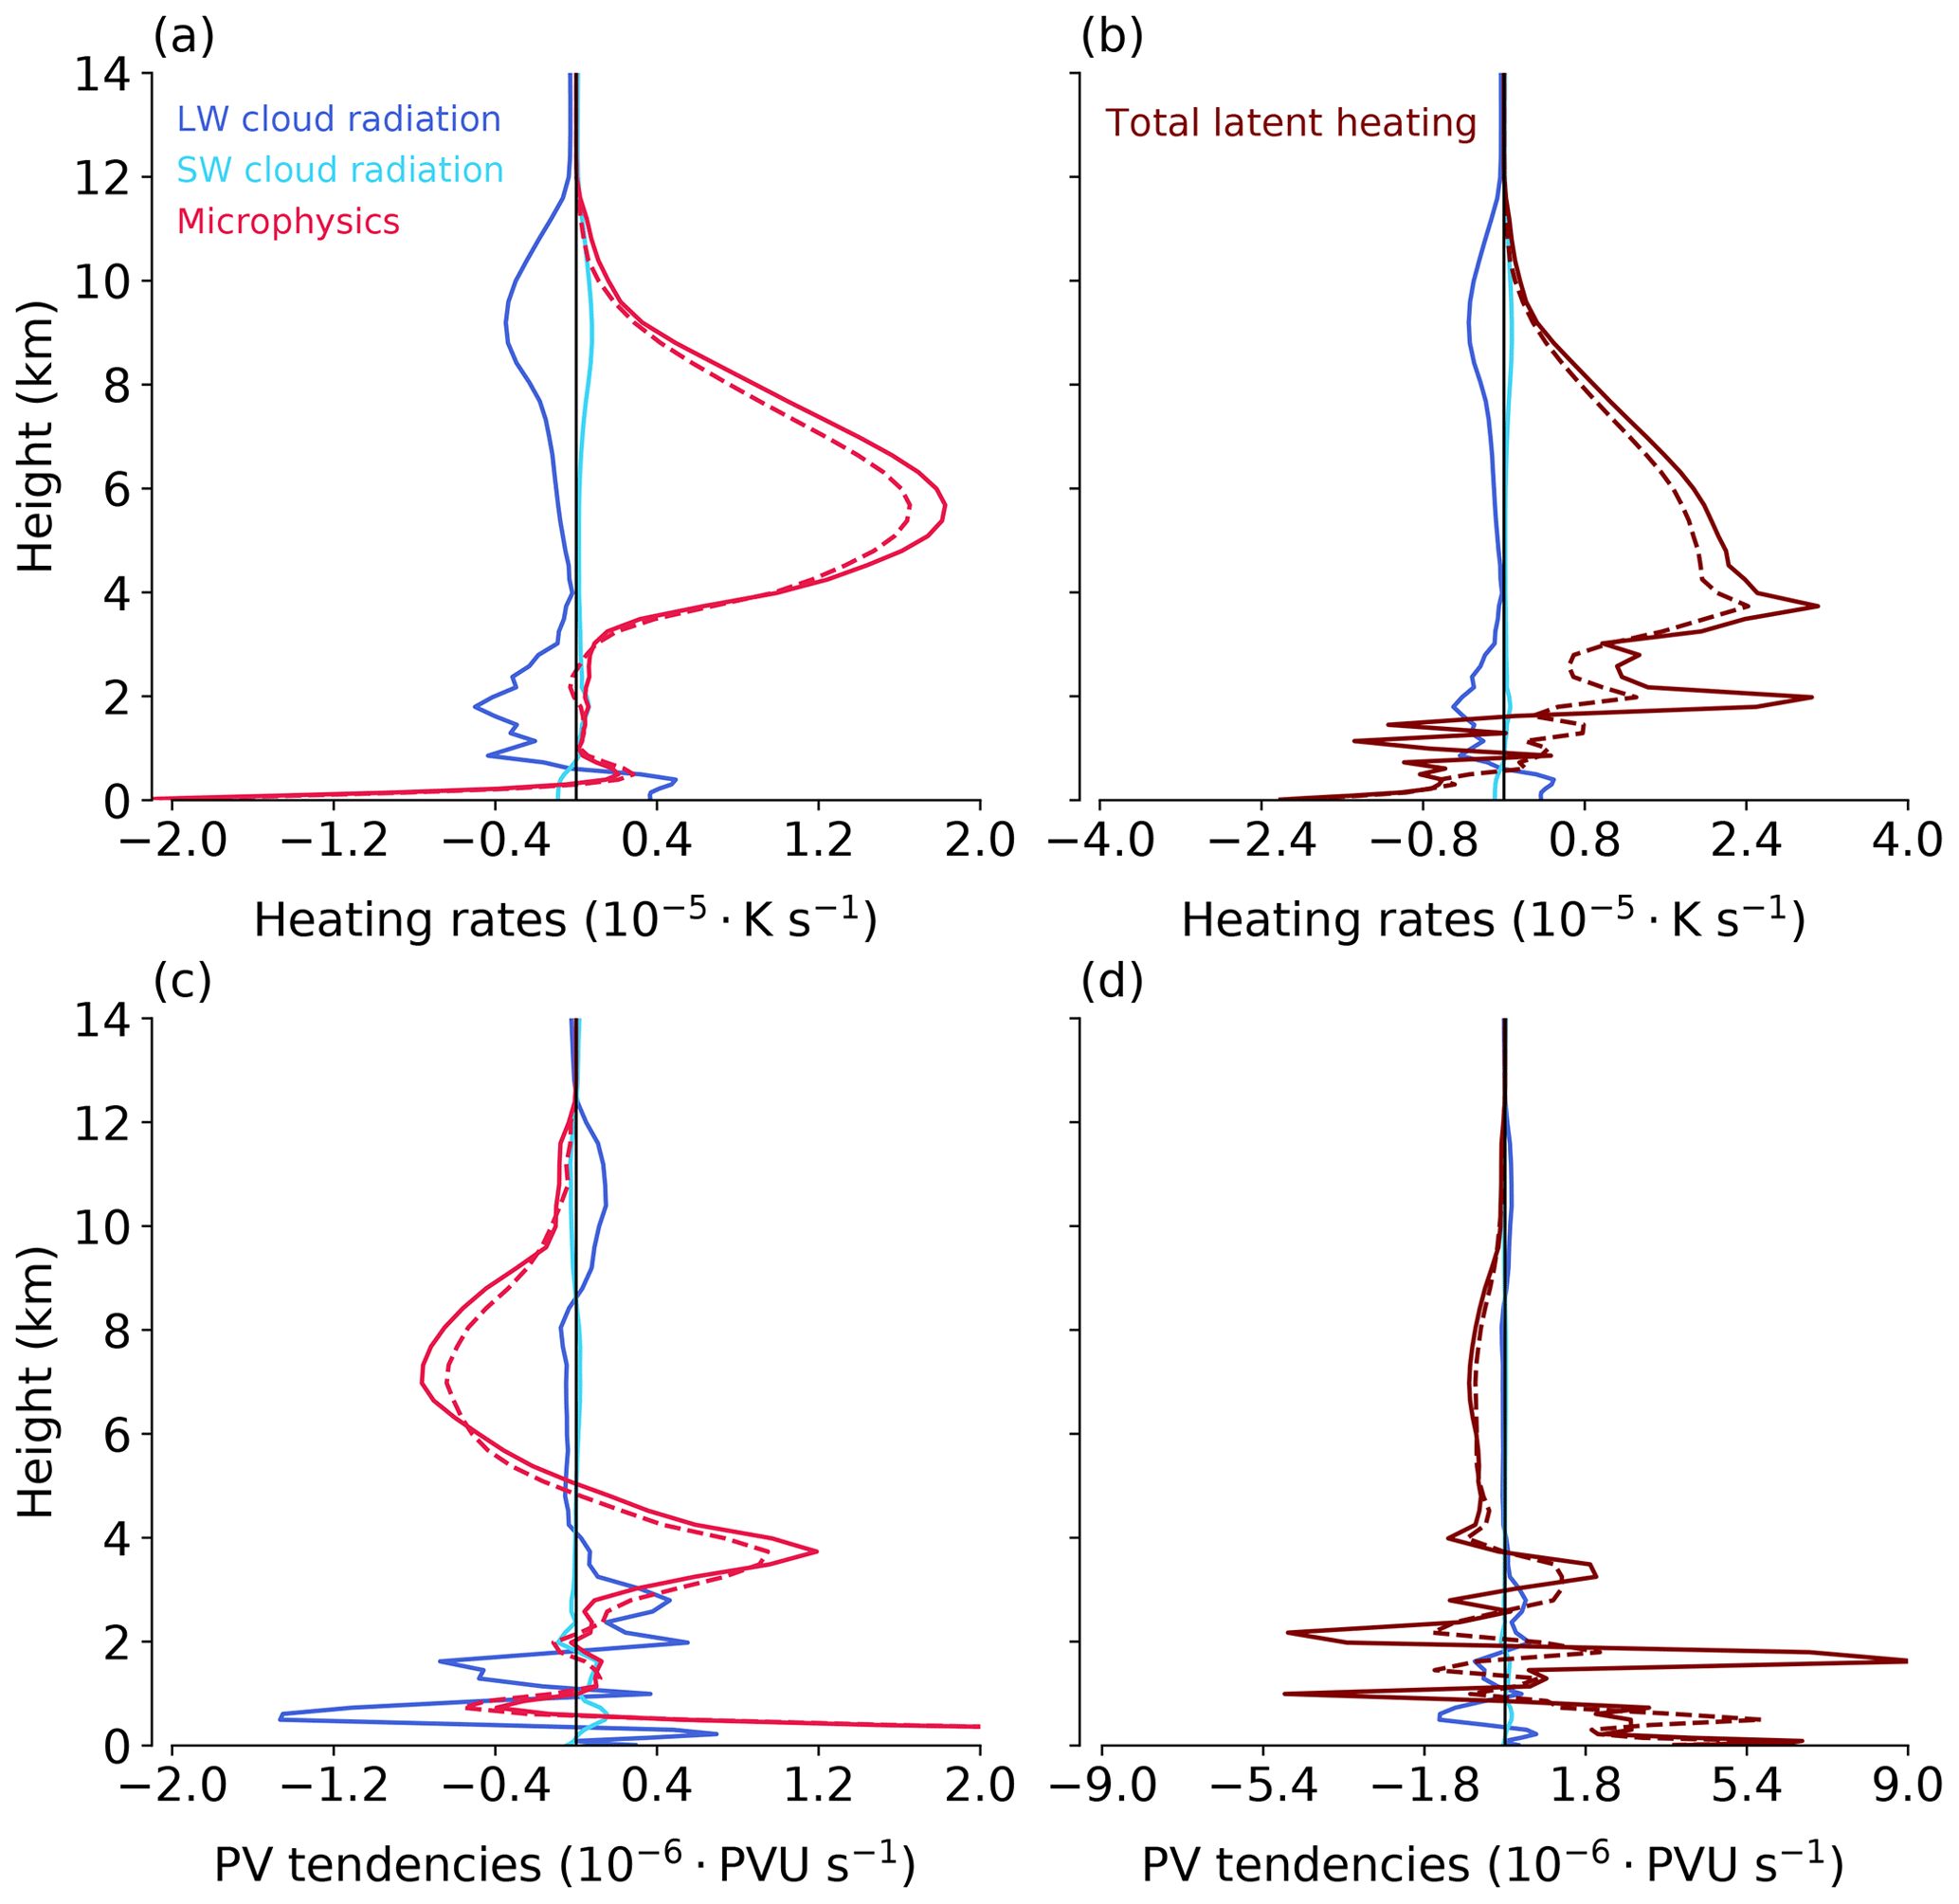
Figure 7Vertical profiles of spatially averaged (a) cloud radiative and microphysical heating rates averaged between days 5 to 8. Panel (b) further shows the total latent heating calculated as the sum of cloud microphysical heating and heating from saturation adjustment. Panels (c) and (d) show the associated PV tendencies. The solid lines are for the CRH simulation, and the dashed lines are for REF simulation.
Moreover, the dipole of positive and negative PV tendencies by CRH in the boundary layer (Fig. 7c and d) suggests that the layer becomes more turbulent. Thus, CRH can impact not only the total latent heating but also other diabatic processes. To demonstrate how CRH affects diabatic PV tendencies, Fig. 8 shows the evolution of spatially averaged PV tendencies from individual diabatic processes. Besides CRH and total latent heating, this includes the PV tendencies from turbulence, convection and nonconservative momentum. The convection contribution is only due to parameterized shallow convection. The PV tendencies are shown at four layers to characterize their variation with height and are shown for the CRH simulation in the first row and their differences with the REF simulation in the second row.
At upper levels (8–12 km) all diabatic processes generate negative PV tendencies except longwave CRH, which tend to damp the net negative diabatic PV tendency (Fig. 8a). At mid-levels (4–8 km) the negative PV tendency by total latent heating drives the total diabatic PV tendency (Fig. 8b). At lower levels (2–4 km) total diabatic PV tendencies are mostly controlled by opposing impacts from latent heating and turbulence (Fig. 8c). The opposing effect between latent heating and turbulence PV tendencies is also visible in the boundary layer (0–2 km). However, PV tendencies associated with nonconservative momentum lead to the net positive diabatic PV tendency. On average the PV tendencies associated with convection are small at all levels.
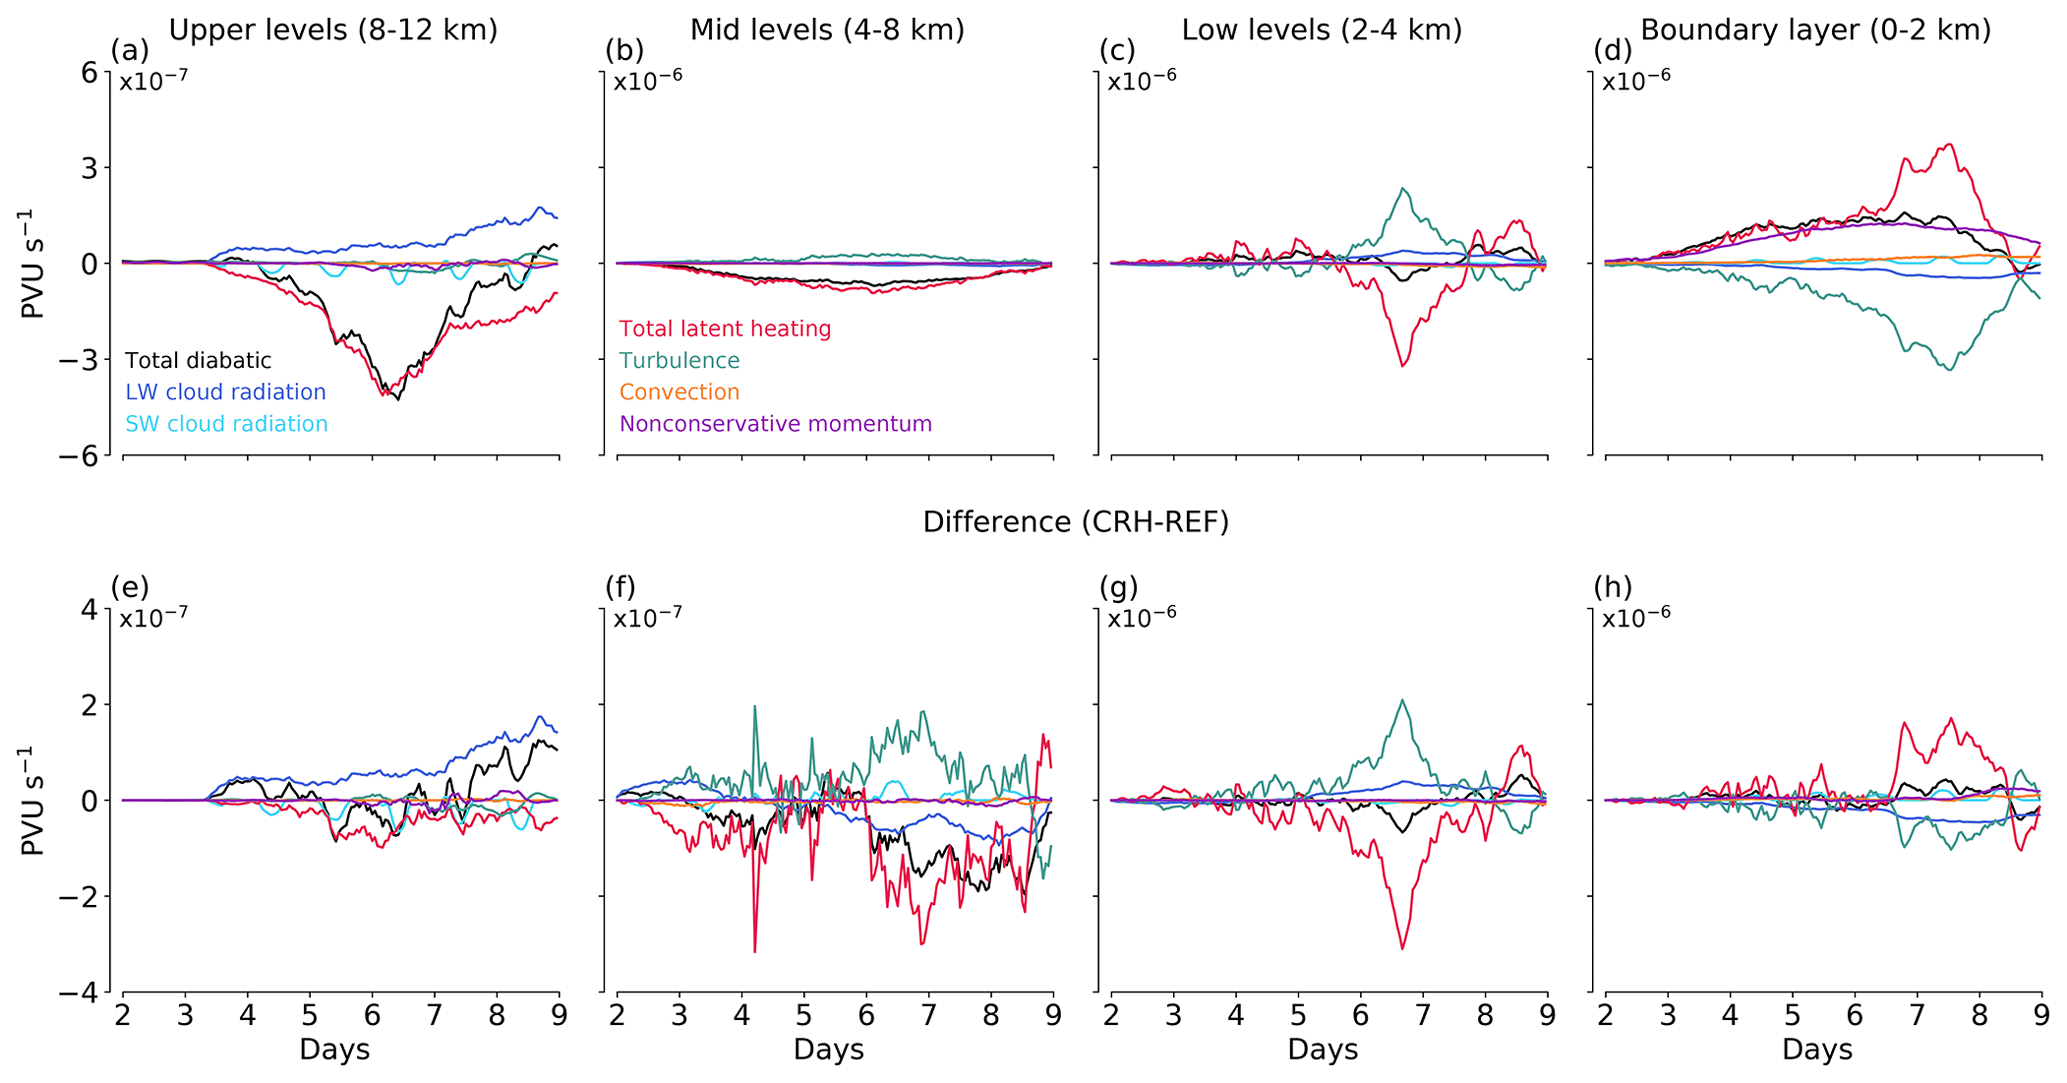
Figure 8Evolution of spatially averaged and mass-weighted vertical average of diabatic PV tendencies between (a) 8–12 km, (b) 4–8 km, (c) 2–4 km and (d) 0–2 km in the CRH simulation. Panels (e)–(h) show the differences between the CRH and REF simulations (CRH–REF). Note the different y axes in the panels. Total diabatic PV tendency (black line) is the sum of the individual diabatic PV tendencies shown as colored lines.
When CRH is included, the PV tendencies from latent heating and turbulence change at all levels. This is shown in the lower row of Fig. 8. In fact, the PV tendencies associated with turbulence and total latent heating are amplified at all levels in the CRH simulation compared to the REF simulation. At upper levels, however, this amplification is more than compensated by the strong positive PV tendency from longwave CRH (Fig. 8e). At mid-levels, the negative PV tendency by CRH amplifies the net negative PV tendency between days 5 to 9.
Diabatic PV tendencies have a higher impact on lower-level PV than on mid- and upper-level PV. Büeler and Pfahl (2017) showed that during the cyclone maximum intensity phase, most of the PV anomalies are controlled by diabatic processes at lower levels. Thus, small changes in the net diabatic PV tendency at lower levels and boundary layer mostly due to the compensation between amplified turbulence and latent heating PV tendencies might explain the weak impact of CRH on the eddy kinetic energy at 925 hPa found in Fig. 3c. Near the tropopause, however, PV is strongly controlled by PV advection from the rotational and divergent flow (Chagnon et al., 2013; Riemer and Jones, 2010). Thus, changes in the diabatic PV tendencies near the tropopause (Fig. 8e) cannot fully explain the PV differences shown in Sect. 3.2. Therefore, we study the impact of CRH on the PV advection and their relation to the PV differences in more detail in the following section.
The previous sections have documented a clear impact of CRH on the idealized cyclone and the evolution of PV. To understand the underlying dynamical mechanisms, we now compare the simulations with and without CRH by means of the PV error growth framework of Baumgart et al. (2018, 2019).
4.1 Diagnostic framework and application to our simulations
The framework of Baumgart et al. (2018, 2019) has been developed to understand the growth of PV forecast errors near the tropopause in numerical weather predictions at the synoptic scale. The framework has led to important insights into the dynamics and multiple scales of the error growth from the convective to the synoptic or even hemispheric scale. To this end, the framework compares the near-tropopause PV tendencies between a reference analysis and a forecast simulation and quantifies the adiabatic and diabatic mechanisms that lead to the PV error growth in the forecast.
Here, we apply the framework by considering the CRH simulation as the reference analysis, and the REF simulation without radiation as the forecast. Because a “true” evolution of the idealized cyclone does not exist, we use the terminology of “difference” instead of “error” in the following.
We follow the approach described in Baumgart et al. (2019) for deriving the PV tendency and its decomposition, apart from the small changes that are described below. On isentropic levels, Ertel PV tendency is given by
The first term on the r.h.s accounts for the PV tendency due to advection, and the remaining terms are the PV tendencies due to diabatic processes. The residual term RES arises from processes that cannot be quantified with the available model output (e.g., numerical diffusion), from numerical errors due to the spatial and temporal discretization and from the interpolation of model output. v is the horizontal wind and ∇ is the horizontal gradient, which are both calculated on isentropic levels. is the diabatic heating. is the diabatic horizontal wind tendencies. Our analysis includes all diabatic heating and nonconservative momentum tendencies of the ICON model as described in Sect.3.
To account for different mechanisms involved in the evolution of PV near the tropopause, the horizontal wind in Eq. (4) can be partitioned into contributions from rotational and divergent winds by means of Helmholtz decomposition,
The rotational wind accounts for advective PV tendency by the (quasi-barotropic) near-tropopause flow and by the winds associated with the low-level PV anomalies (i.e, baroclinic interaction). The divergent wind contains a contribution associated with dry (balanced) dynamics and a contribution associated with moist dynamics, mostly the invigoration of upper-tropospheric divergence by latent heat release below. In the presence of prominent latent heat release, which is the case in our simulations, several case studies have indicated that PV advection near the tropopause by the divergent wind can be interpreted to a large extent as an indirect impact of moist processes (see, e.g., discussion and references in Teubler and Riemer, 2021). We here adapt the interpretation that the divergent term is predominantly associated with changes in diabatic heating. Baumgart et al. (2018) showed that the contribution of the lower-level winds to near-tropopause PV error growth is small. Because the differences of the cyclone PV evolution in our simulations are relatively small at low levels, we restrict ourselves to a Helmholtz decomposition and avoid in the current study the intricateness of piecewise PV inversion.
Our aim is to understand how CRH affects the cyclone and PV relative to the cyclone without radiation. We therefore focus on the PV difference between the CRH and REF simulations,
Again following Baumgart et al. (2019), we consider the spatial integration of the squared PV difference over a fixed domain A and refer to this as the difference potential enstrophy . The difference potential enstrophy tendency is then given by
We calculate the time derivative in Eq. (7) with the centered finite difference method. Based on the PV tendency equation (Eq. 4) and the Helmholtz decomposition (Eq. 5), the difference potential enstrophy tendency can be decomposed into different processes:
where
The Δ symbol indicates the difference of a variable between simulations (CRH–REF); the overbar means that the variable is averaged between the CRH and REF simulations. 𝒫𝒱rot and 𝒫𝒱div measure the contributions from advection by the rotational and divergent winds, respectively. The contributions from parameterized diabatic heating and nonconservative momentum are given by 𝒫𝒱dia. For reference, the above equation is the same as Eq. (9) of Baumgart et al. (2019).
To compute Eq. (8) we linearly interpolate the model output from height-based model levels to isentropic levels that intersect the midlatitude tropopause. We choose the 326 K isentrope for the analysis and compute Eq. (8) on a grid. We have tested at which spatial resolution the diagnostic is best used. The tests were necessary because our high-resolution simulations exhibit a lot of small-scale PV structures that could substantially affect the budget in Eq. (8). The tests showed that the budget is better closed when we compute Eq. (8) on the grid. In fact, for a spatial resolution close to the 2.5 km resolution of the model, Eq. (8) is not even approximately closed because of strong co-variability between PV and diabatic heating on small scales, which leads to large diabatic tendencies. However, this small-scale co-variability is short-lived, and hence in our view is not necessarily relevant for the synoptic-scale dynamics that we are interested in. We also note that Baumgart et al. (2019) developed and tested the diagnostics with model outputs at grid.
Still, also on the grid, Eq. (8) is not perfectly closed. In the early stages, the difference potential enstrophy tendency on the l.h.s is larger than the sum of the individual terms on the r.h.s. This is likely due to errors in the spatial discretization. Shortly before the cyclone reaches maturity and thereafter, the l.h.s. of Eq. (8) becomes smaller than the r.h.s. It is reasonable to assume that this is due to a sink of difference potential enstrophy from model diffusion, discussed in detail in Baumgart et al. (2019). Their results indicated that numerical diffusion leads to a negative contribution that can be as large as the contribution from the advective tendencies. The contribution from numerical diffusion, however, cannot be quantified from our model output and means that one should in fact not expect a perfectly closed budget. The generation of PV anomalies by a numerical model's dynamical core has been also demonstrated in, e.g., Saffin et al. (2016). Nevertheless and despite these limitations, the r.h.s. of Eq. (8) captures the evolution of difference potential enstrophy tendency reasonably well.
4.2 Evolution of difference potential enstrophy
Before studying the domain average, we look into the spatial distribution of the different contributions to the difference potential enstrophy tendency. These are shown in Fig. 9 for day 7.5, i.e., the time of maximum intensity of the cyclone.
Similar to the near-tropopause PV differences studied in Sect. 3, difference potential enstrophy and its contributions attain their largest values along the dynamical tropopause (Fig. 9). The diabatic tendencies are small and of noticeable magnitude only in the trough region (Fig. 9b). A further decomposition of the diabatic tendencies shows that they are dominated by total latent heating and CRH (not shown). The differences associated with CRH are mostly located in the ridge, whereas differences by total latent heating are located in the trough region (not shown).
Indeed and as expected at this stage of the cyclone life cycle, advective tendencies dominate the differences in the near-tropopause PV (Fig. 9c and d). The rotational contribution is somewhat larger than the divergent contribution, but both are important. This result is consistent with previous findings that at synoptic scales differences in the PV evolution are governed by balanced dynamics and that the rotational tendency associated with non-linear Rossby wave dynamics controls the PV differences near the tropopause (Baumgart et al., 2018). Note that the sum of diabatic, rotational and divergent tendency does not add up to the difference potential enstrophy shown in Fig. 9a because of the residual term RES (see Eq. 8).
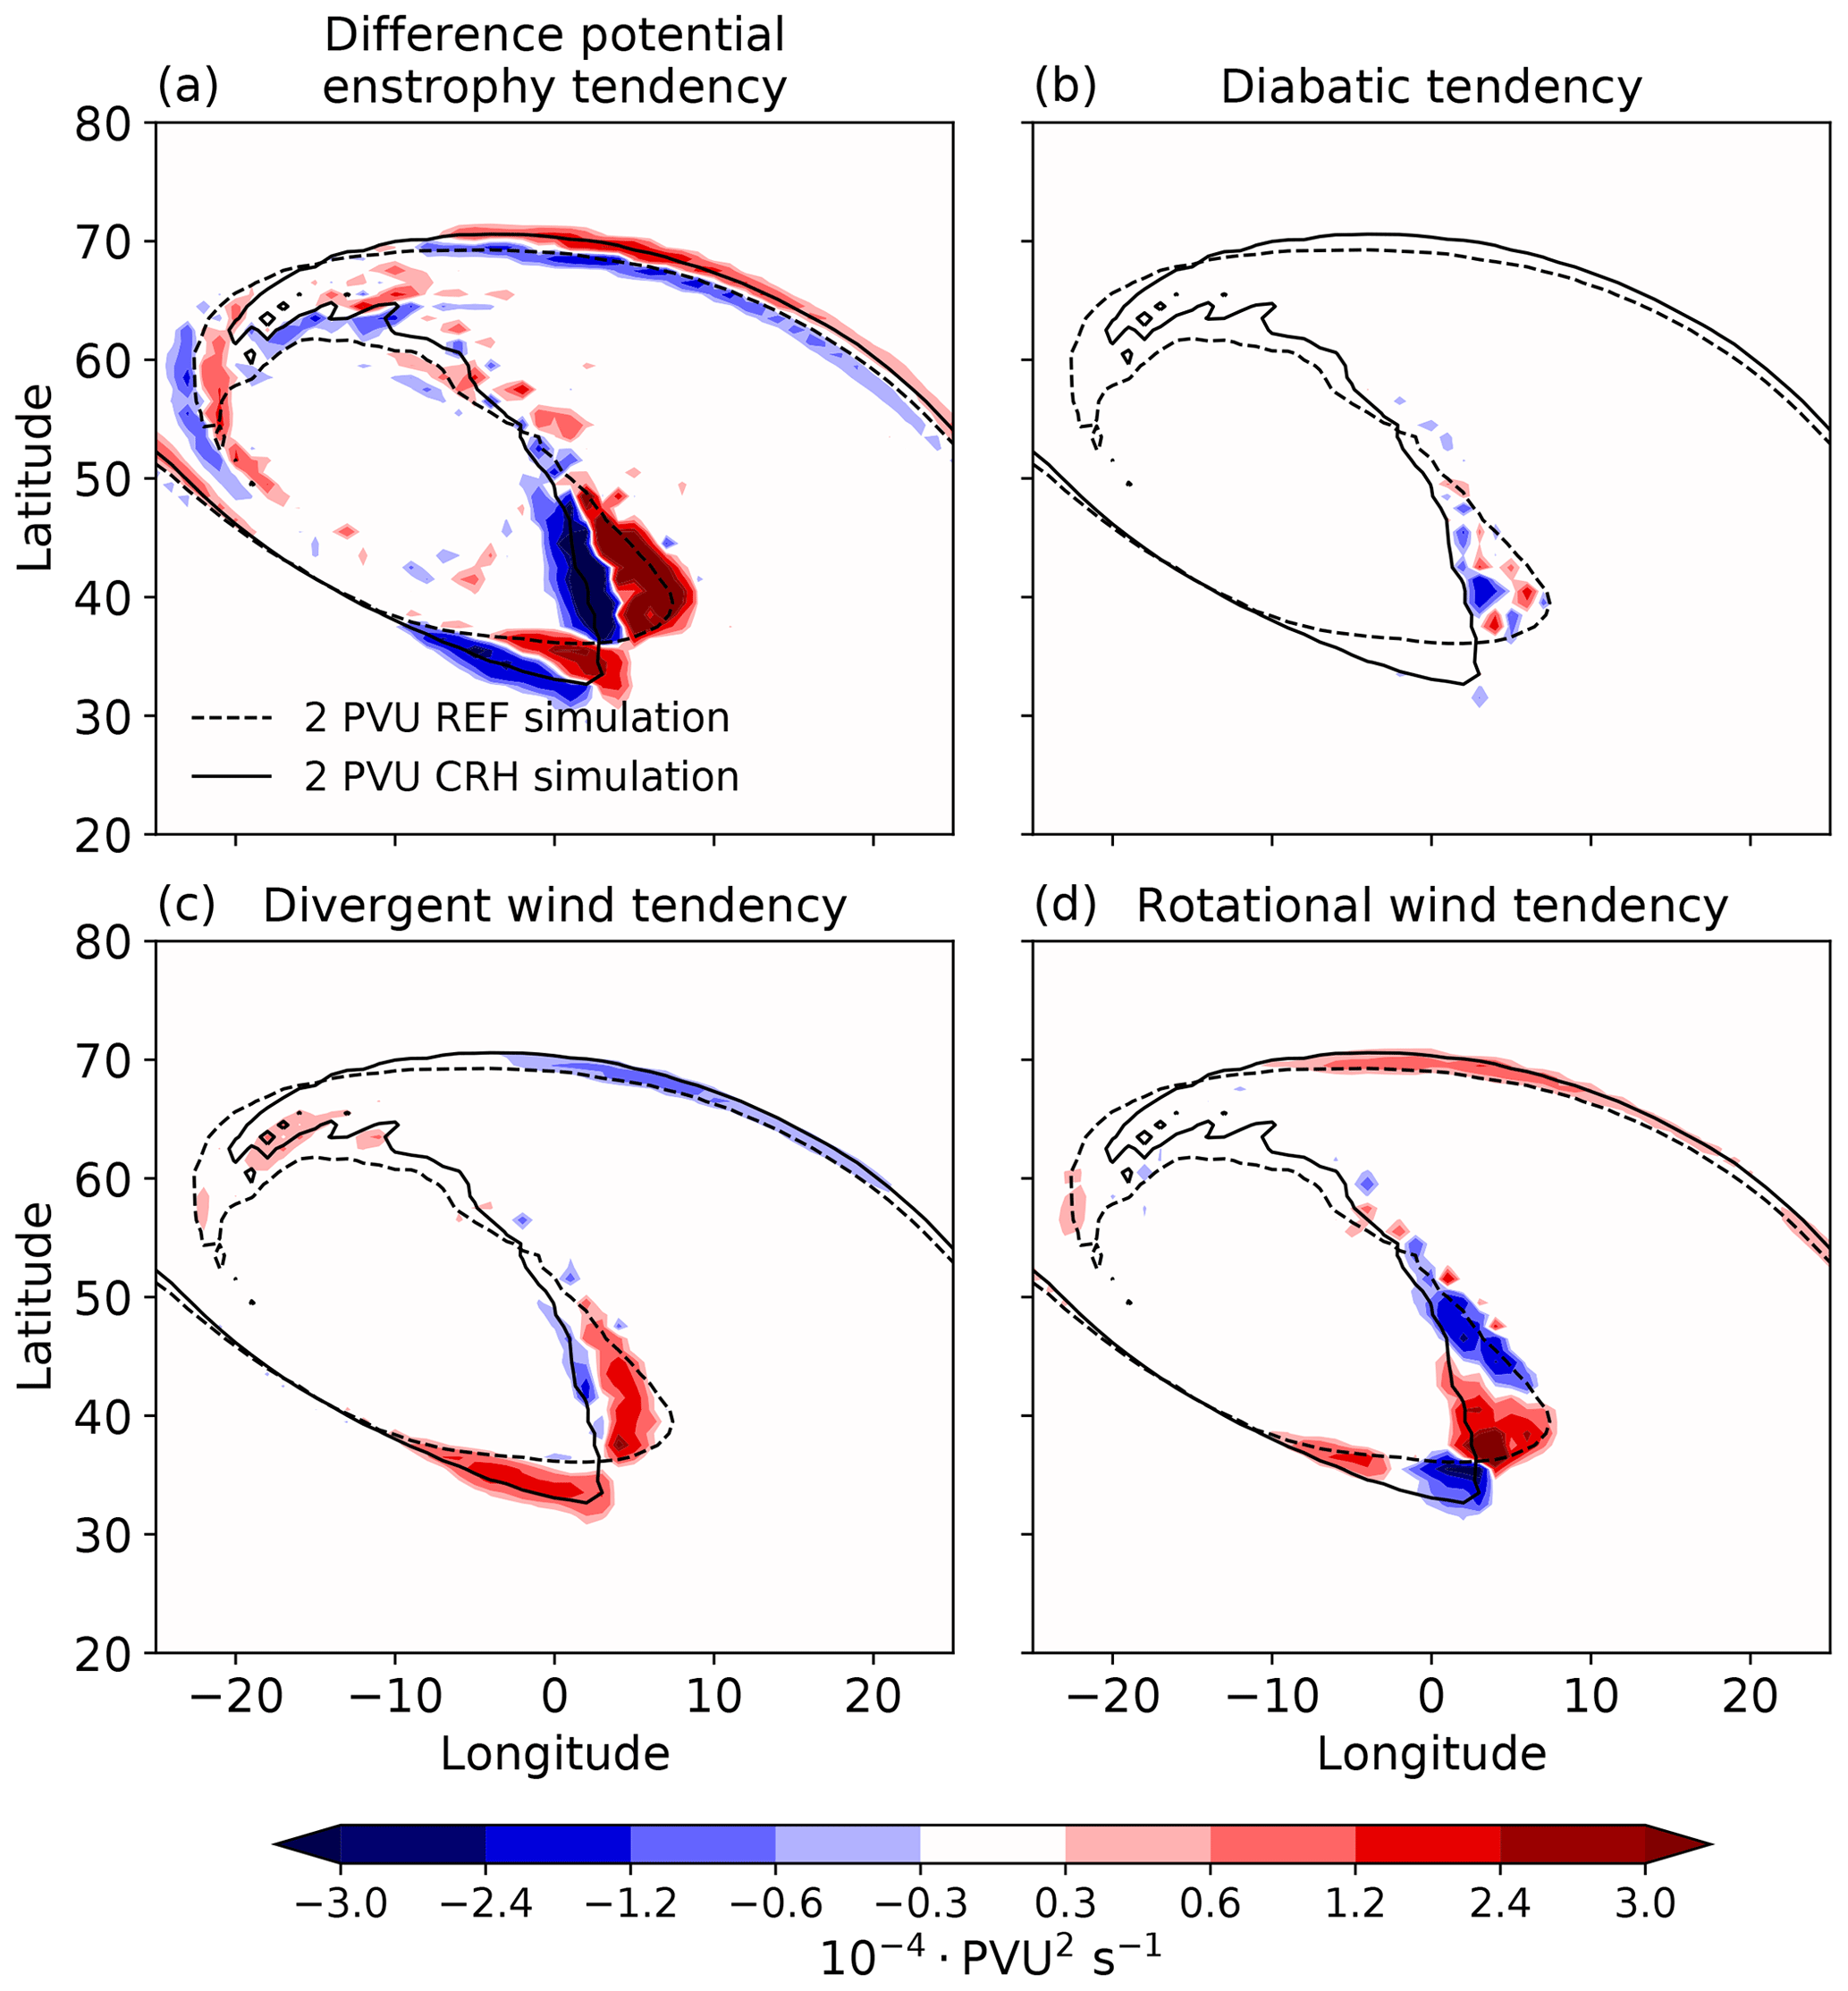
Figure 9Spatial distribution of (a) difference potential enstrophy tendency and contributions from (b) diabatic processes as well as advection by the (c) divergent flow and (d) the rotational flow at day 7.5. The black contours show the dynamical tropopause for the cyclone with CRH (solid) and without CRH (dashed) on the 326 K isentrope.
To show how different processes contribute to the evolution of difference potential enstrophy, we consider the time series of spatially averaged tendencies, shown in Fig. 10. Although Eq. (8) is not perfectly closed for the reasons explained in Sect. 4.1, the sum of the diagnosed contributions (green line) matches the actual difference potential enstrophy tendency (black line) reasonably well.
Until day 6 the contribution from diabatic processes is almost in the same range as that from advection. However, close to the cyclone mature stage between days 6 to 8, the growth of difference potential enstrophy is dominated by advection, whose impact via the divergent and rotational flow is one order of magnitude larger compared to diabatic processes (Fig. 10a).
The partitioning of the diabatic tendency into the contribution from different processes in Fig. 10b shows that CRH and total latent heating control the diabatic impact until day 5. Thereafter, the contribution from total latent heating grows rapidly and becomes the dominant diabatic process. This means that much of the cloud-radiative impact operates via changes in latent heating: when CRH is included, latent heating amplifies between day 5 and 6.5, which in turn amplifies vertical motion and hence the divergent flow. Following the intensification of the divergent flow, the rotational flow also increases and becomes the dominant process at the time of cyclone maximum intensity (Fig. 10a).
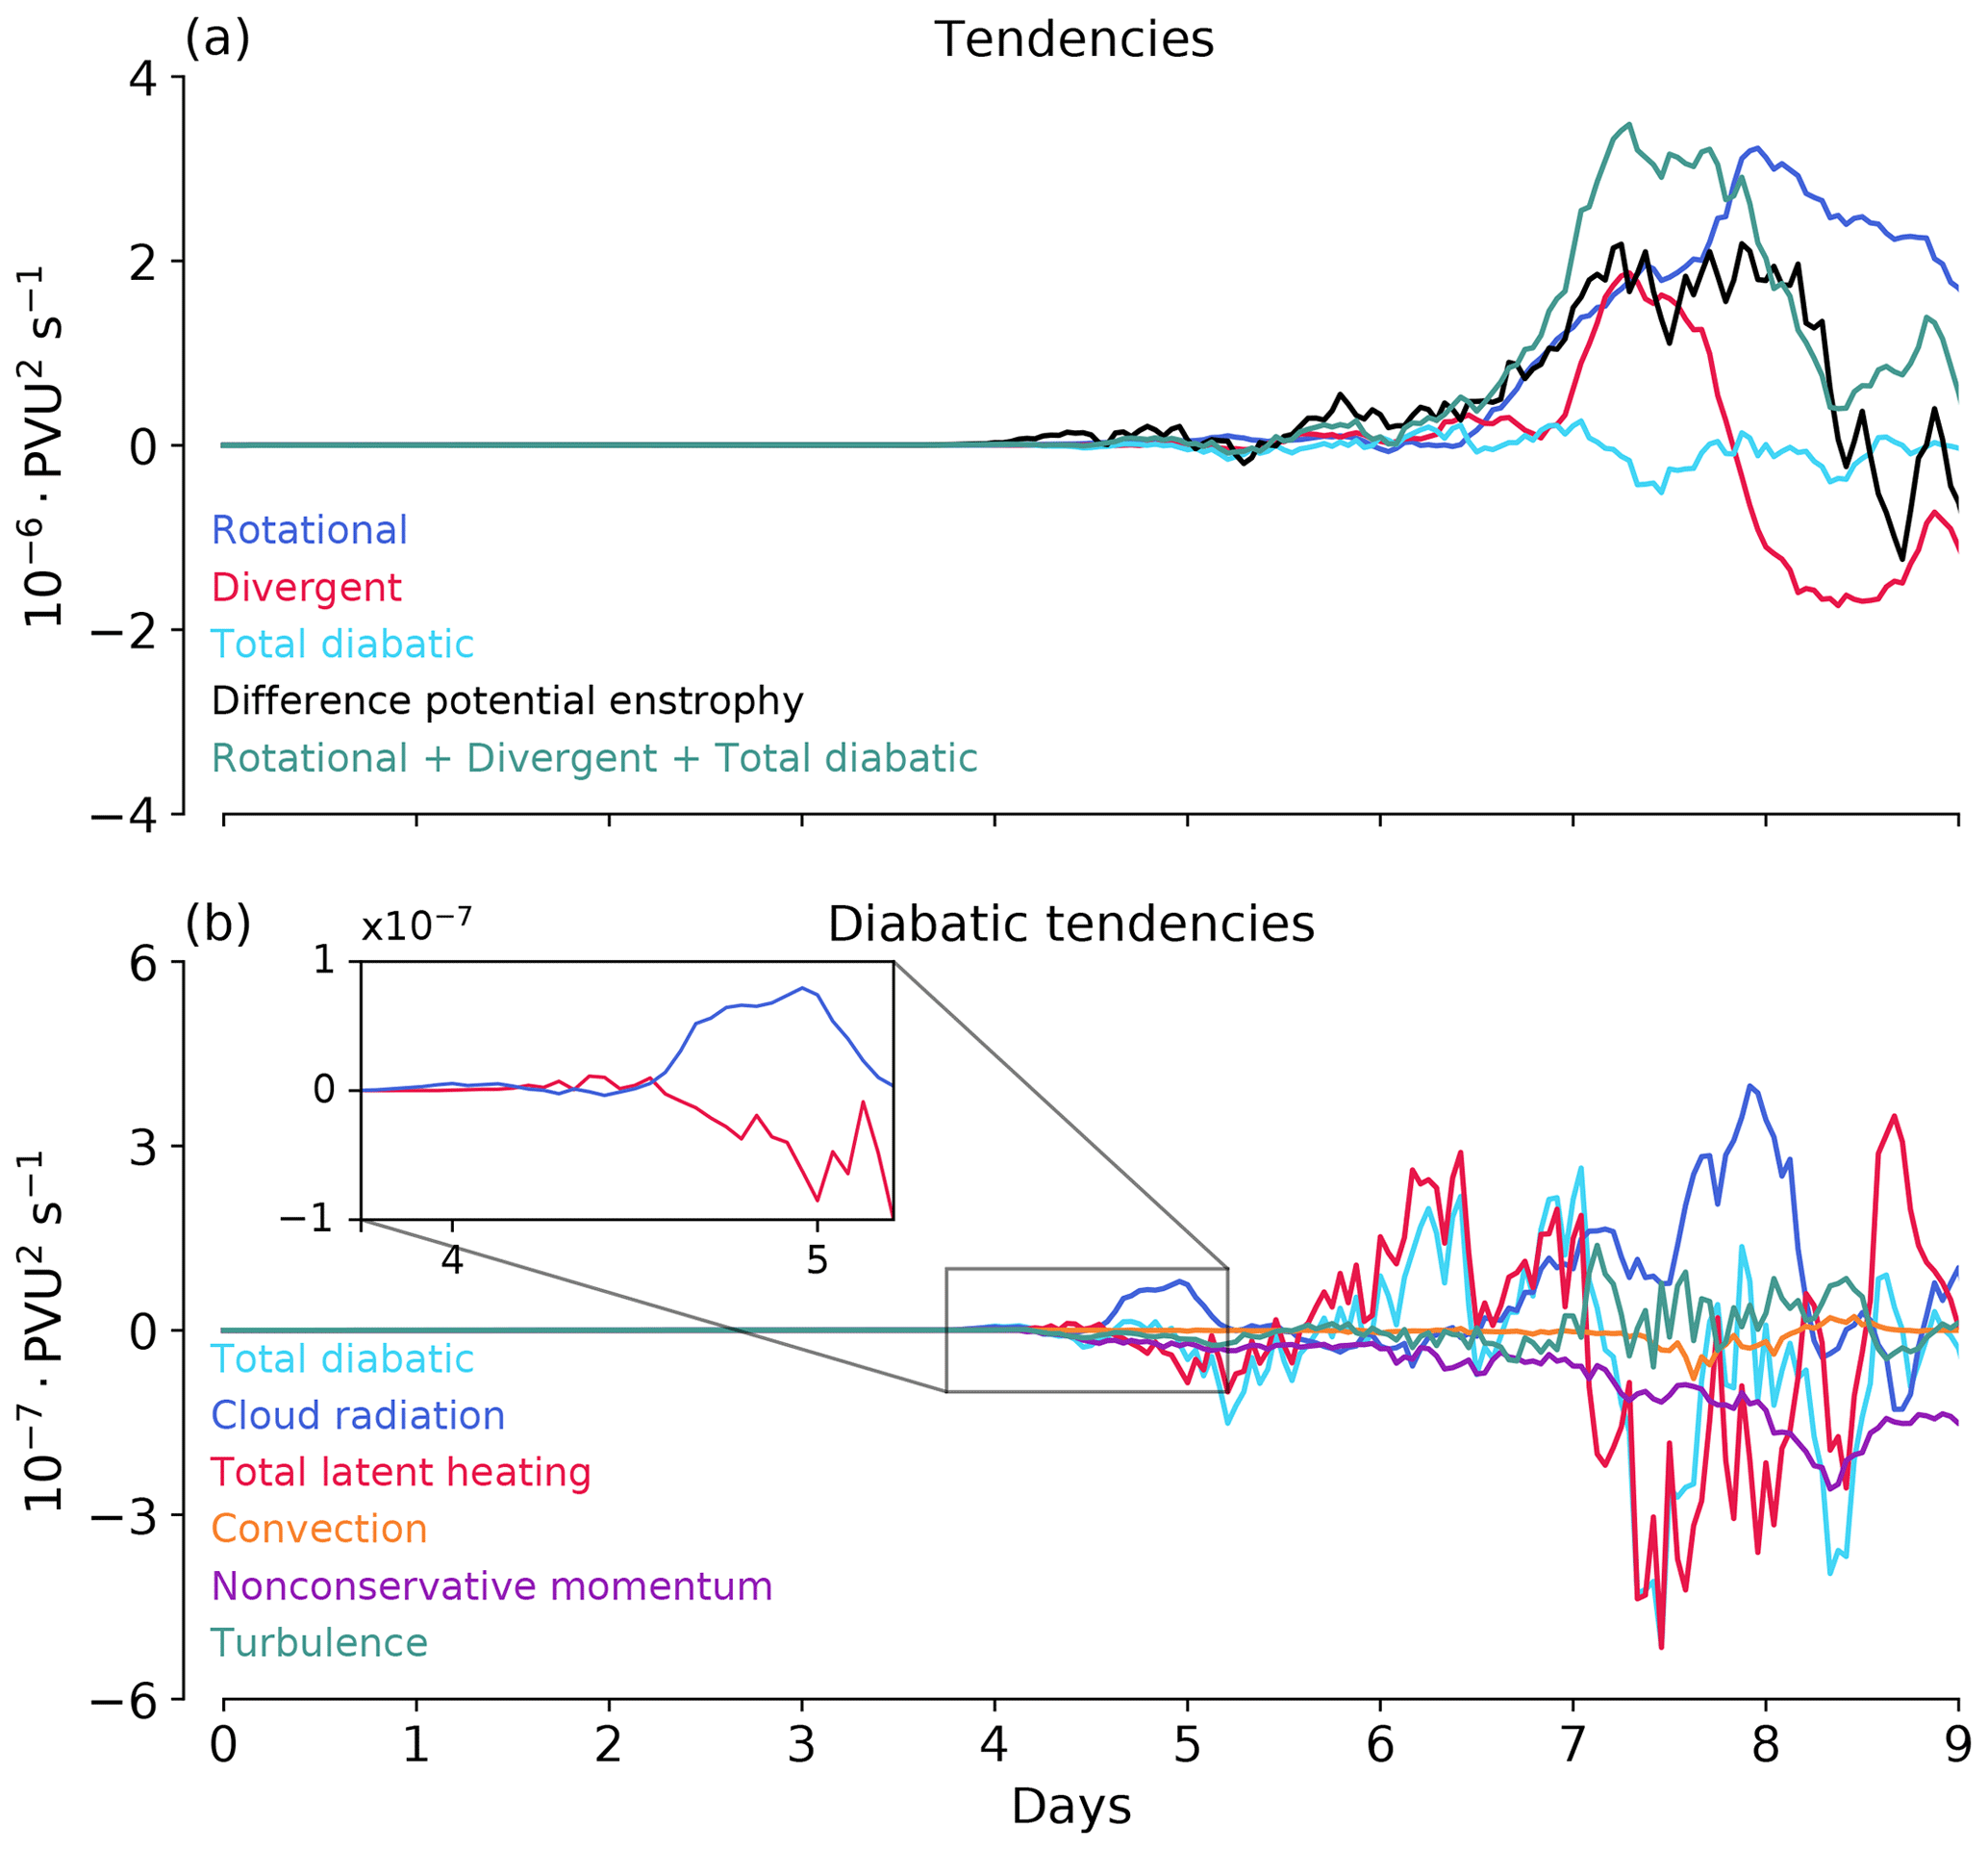
Figure 10Evolution of the (a) spatially averaged difference potential enstrophy tendency and contributions from individual processes diagnosed from the r.h.s. of Eq. (8). The analysis is performed around the tropopause on the 326 K isentrope. Panel (b) further decomposes the total diabatic (cyan line) contribution into the contributions from individual diabatic processes. Note the different scales in panels.
The differences in near-tropopause PV during the cyclone intensification thus do not result from a direct radiative increase or decrease of PV. Instead, the CRH impact follows a multi-stage sequence of processes. From the absolute scale used in Fig. 10a it is difficult to infer the contributions during the first couple of days. Therefore, and similar to Baumgart et al. (2019), we also consider the relative contributions calculated as
Given that the only difference between the REF and the CRH simulations is the presence of cloud-radiative heating in CRH simulation, one expects that CRH initiates and dominates the differences early in the simulations. This is indeed the case. Clouds start to form at around day 2 in the lower troposphere and CRH initiates the evolution of difference potential enstrophy (Fig. 11a). Around the tropopause on the 326 K isentrope, the differences are dominated by the divergent flow already at day 2 (Fig. 11b). This is due to the fact that most of the early CRH occurs below the tropopause level. Thus, the circulation responds quickly to the presence of CRH (Fig. 11) and CRH can directly impact the wind fields even in the very early stage of the cyclone growth. However, the early wind changes are small and not relevant for the PV evolution during the intensification phase, as we will further investigate in Sect. 5.

Figure 11Contribution to the relative growth of difference potential enstrophy from the rotational and divergent flow as well as from total diabatic processes and cloud-radiative heating. Panel (a) is for the 310 K isentrope, which is in the lower troposphere. Panel (b) is for the 326 K isentrope, which is near the tropopause.
An important finding of the above analysis is that much of the CRH impact occurs through changes in the total latent heating, and that latent heating plays an important role in the upscale growth of the differences between the CRH and REF cyclones. The physical mechanisms involved in the multi-stage growth to the synoptic scale are illustrated in Fig. 12 by means of latitude–longitude plots of selected processes at different days.
At day 4, considerable differences in diabatic heating between the CRH and REF simulations occur ahead of the cyclone center in the region of the warm conveyor belt. The differences are co-located with differences in precipitation (Fig. 12a and b). This finding is consistent with our earlier finding in Fig. 4a, which showed that CRH increases precipitation.
Following the changes in the total latent heating, vertical motion in the warm conveyor belt changes as well. The differences in vertical motion then lead to changes in near-tropopause divergence. This is demonstrated for day 5.5, for which differences from the near-tropopause divergent flow and differences in vertical motion are located east and southeast of the cyclone center in the warm conveyor belt (Fig. 12c and d). The differences in vertical motion are located slightly eastward of the differences in divergent flow. This is likely related to the westward tilt during the cyclone intensification phase (day 5.5). The vertical velocity differences are plotted on the isobaric surface at 500 hPa, whereas the divergent tendency is plotted at 326 K isentrope near the tropopause. Thus, the vertical velocity differences will be advected upward to the near-tropopause level west of their position in the mid-troposphere. Finally, the CRH impact reaches the near-tropopause level, where it manifests as changes in the rotational flow that lead to a shift in the position of the trough and the ridge. This is shown for day 7.5, for which differences in the rotational flow are dominant and control the PV differences along the tropopause (Fig. 12e and f).
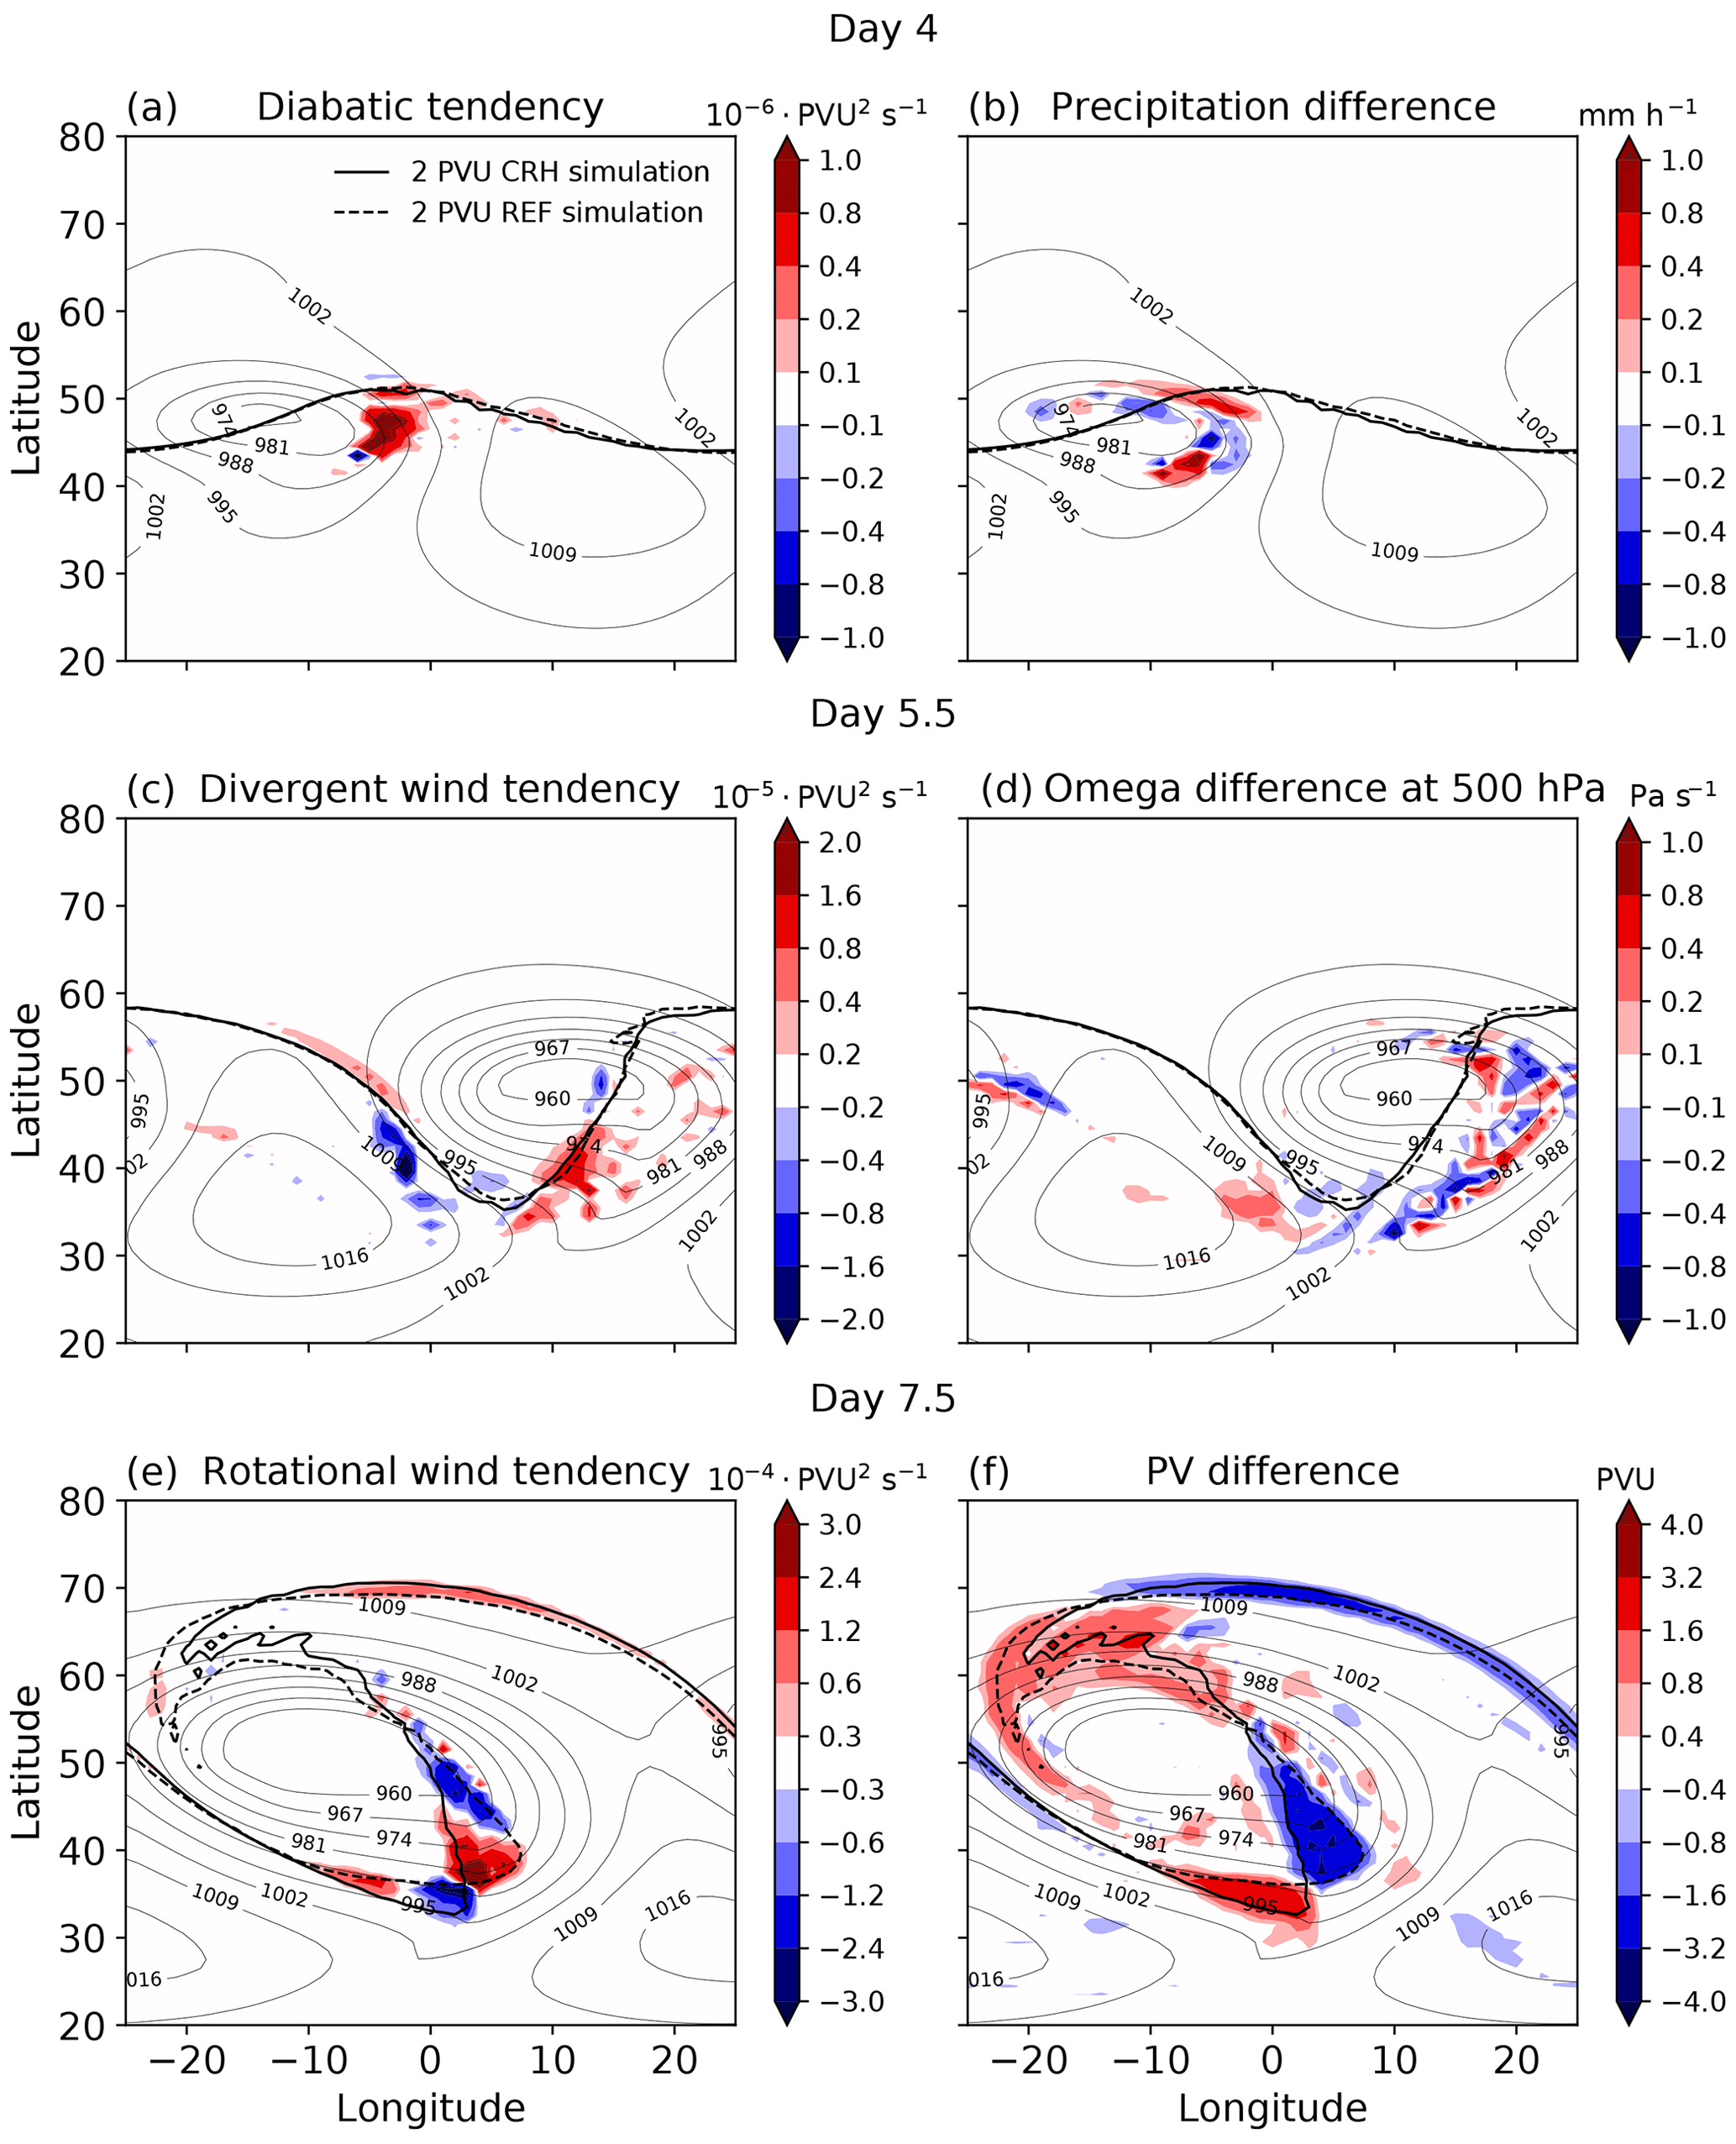
Figure 12Illustration of the dominant contributions to the evolution of difference potential enstrophy during different stages of the cyclone growth (a, c, e). Panels (b), (d), (f) illustrate the underlying processes by means of fields that are closely related to the different contributions. Thick black contours show the dynamical tropopause for the REF (dashed) and CRH (solid) simulations. Thin contours show the surface pressure (hPa) averaged between the two simulations. The differences are calculated as CRH–REF.
The multistage sequence of processes that underlies the CRH impact is very similar to the growth of initial state uncertainty from the convective scale to the synoptic scale (Baumgart et al., 2019). At the same time, however, our 2xCRH simulation with doubled cloud-radiative heating exhibits a substantially stronger eddy kinetic energy than the standard CRH simulation (Fig. 3b). This raises the question of whether the CRH impact is the result of radiative perturbations in the early phase of the cyclone life cycle that grow in a non-linear atmosphere, or whether CRH in the later phase of the cyclone is also important. The former would mean that CRH acts as a form of initial state uncertainty; the latter would mean that CRH affects the cyclone in a systematic and continuous manner during the entire life cycle.
To answer this question, we perform additional simulations in which CRH is active initially but then disabled after a certain number of days. We achieve this by restarting the model from the CRH simulation but with radiation set to zero. As a result, CRH has only interacted with the cyclone up to the restart day. We perform four such simulations, with CRH being deactivated at days 3, 4, 5 and 6, respectively. Figure 13 characterizes the spatial pattern and magnitude of the temperature change due to CRH at the 4 days, where the temperature change is shown as the mass-weighted vertical average over the depth of the troposphere.
With clouds starting to form at around day 2 (Fig. 4b), small changes in temperature on the order of a few 10ths of a Kelvin are already present at day 3 (Fig. 13a). When restarting the simulation at this time without CRH, one can think of these temperature changes as initial perturbations. The wind has also changed to some extent at day 3 due to the presence of CRH, as can be inferred from Fig. 11. Later in the life cycle, Fig. 13 shows that the temperature change grows to values more than 1 K.
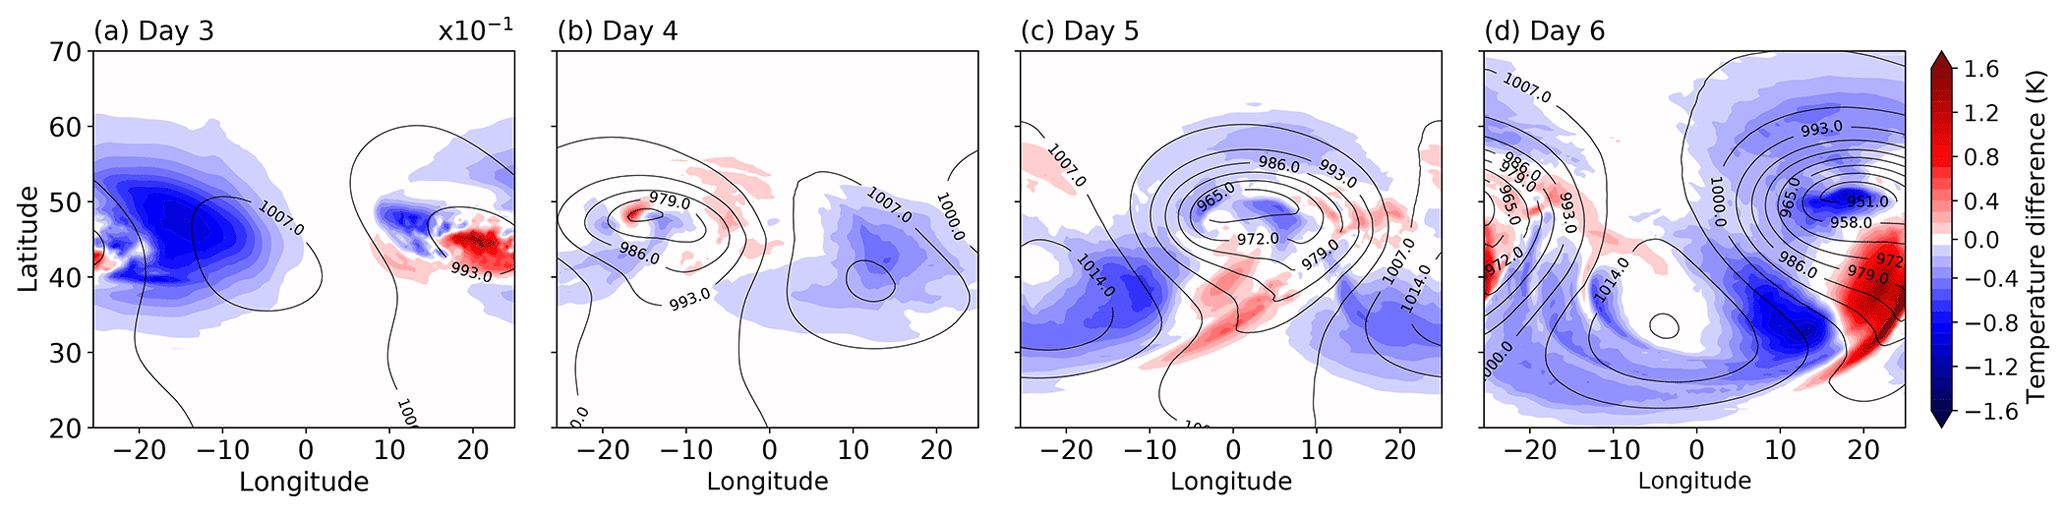
Figure 13Temperature change due to cloud-radiative heating derived as the mass-weighted vertical average over the depth of the troposphere. The change is calculated as the temperature in the CRH simulation minus the REF simulation. Note that the scale of the temperature change at day 3 is 10 times smaller than for the other days.
The new simulations make clear that CRH has a continuous impact on cyclone intensity. This is demonstrated by the evolution of eddy kinetic energy differences with respect to the standard CRH simulation in Fig. 14. When CRH is disabled at day 3, eddy kinetic energy closely follows the REF simulation. The temperature and wind changes induced by CRH until day 3 are thus too small to affect the cyclone in a considerable manner. It also indicates that CRH is not affecting the cyclone by providing some small initial perturbations.
When CRH is allowed to interact with the cyclone until day 4, differences in the eddy kinetic energy decrease noticeably compared to the REF simulation. When CRH is active even longer, i.e., until day 5 or 6, the evolution of eddy kinetic energy and its maximum value more and more follow the CRH simulation. It is further interesting that even when CRH is active until day 6, the cyclone does not reach the same peak intensity as when CRH is active throughout the entire life cycle.
As shown in Sects. 3 and 4, between days 3 to 5, CRH increases the latent heat release and precipitation rate (Fig. 4a) and thus affects the near-tropopause PV through divergent flow. To check this effect further, similar to Fig. 10 we will look into the difference potential enstrophy tendencies between the REF and the new simulations in Fig. 15.
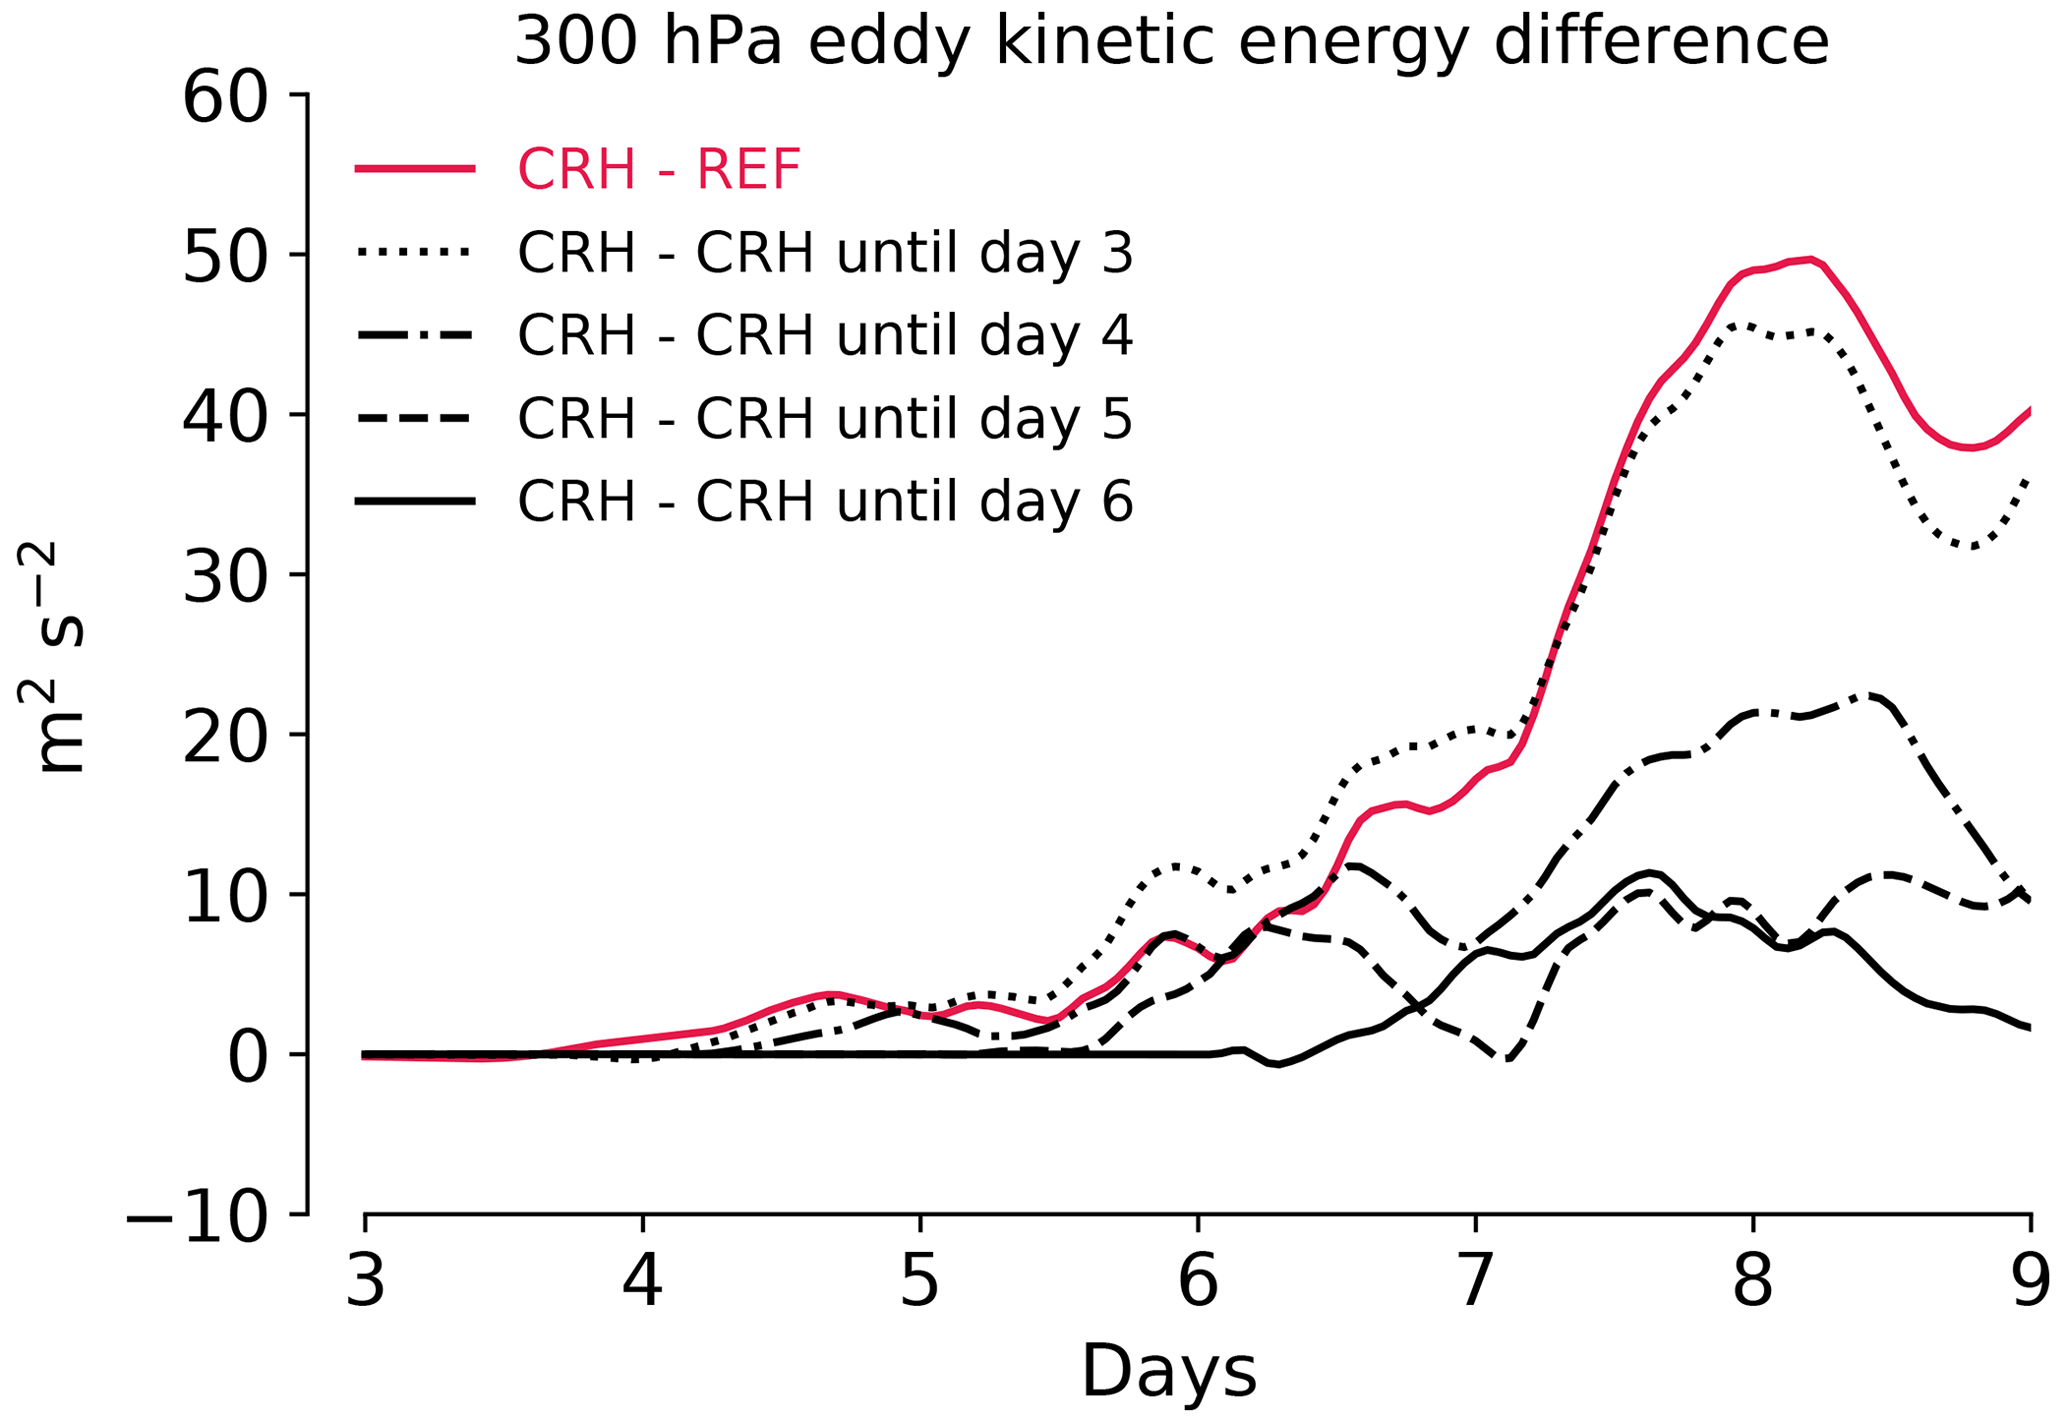
Figure 14Evolution of eddy kinetic energy differences with respect to the CRH simulation at 300 hPa for the REF simulation, and simulations with CRH disabled after certain days.
For the simulation starting at day 3, differences caused by CRH can grow and change the near-tropopause PV. However, the PV evolution is very similar to the REF simulation during the intensification phase. Differences start to appear after the cyclone reaches its maturity (Fig. 15a). This is an indication of the non-linearity of the atmospheric flow caused by the CRH in the early stages of the life cycle.
Letting CRH interact with the cyclone until day 4 leads to more latent heat release. This is shown by the increase in the different divergent wind tendencies, which represent an indirect impact of latent heat release near the tropopause. Compared to the simulation starting at day 3, different divergent wind tendencies are enhanced for the simulation starting at day 4 (Fig. 15b). With amplified divergent wind tendencies, differences in the rotational flow also increase and change the near-tropopause PV during the cyclone mature stage between days 6 to 7.5. This effect becomes stronger if CRH is active until days 5 and 6 (Fig. 15c and d).
There is a common pattern in the evolution of tendencies and associated processes. During the cyclone mature stage, the peak of the divergent wind tendency is associated with differences in precipitation around day 7 which becomes stronger as long as CRH is active in the simulations (Fig. 15). Also, there are secondary smaller peaks in the divergent wind tendencies around day 6 that precede the marked increase in the rotational wind tendencies. The smaller peak is absent for the simulation with CRH disabled at day 3 (shown by insets in Fig. 15). Thus, during the mature stage, the prominent growth of differences in the near-tropopause PV occurs primarily due to amplified divergent wind tendencies by CRH.
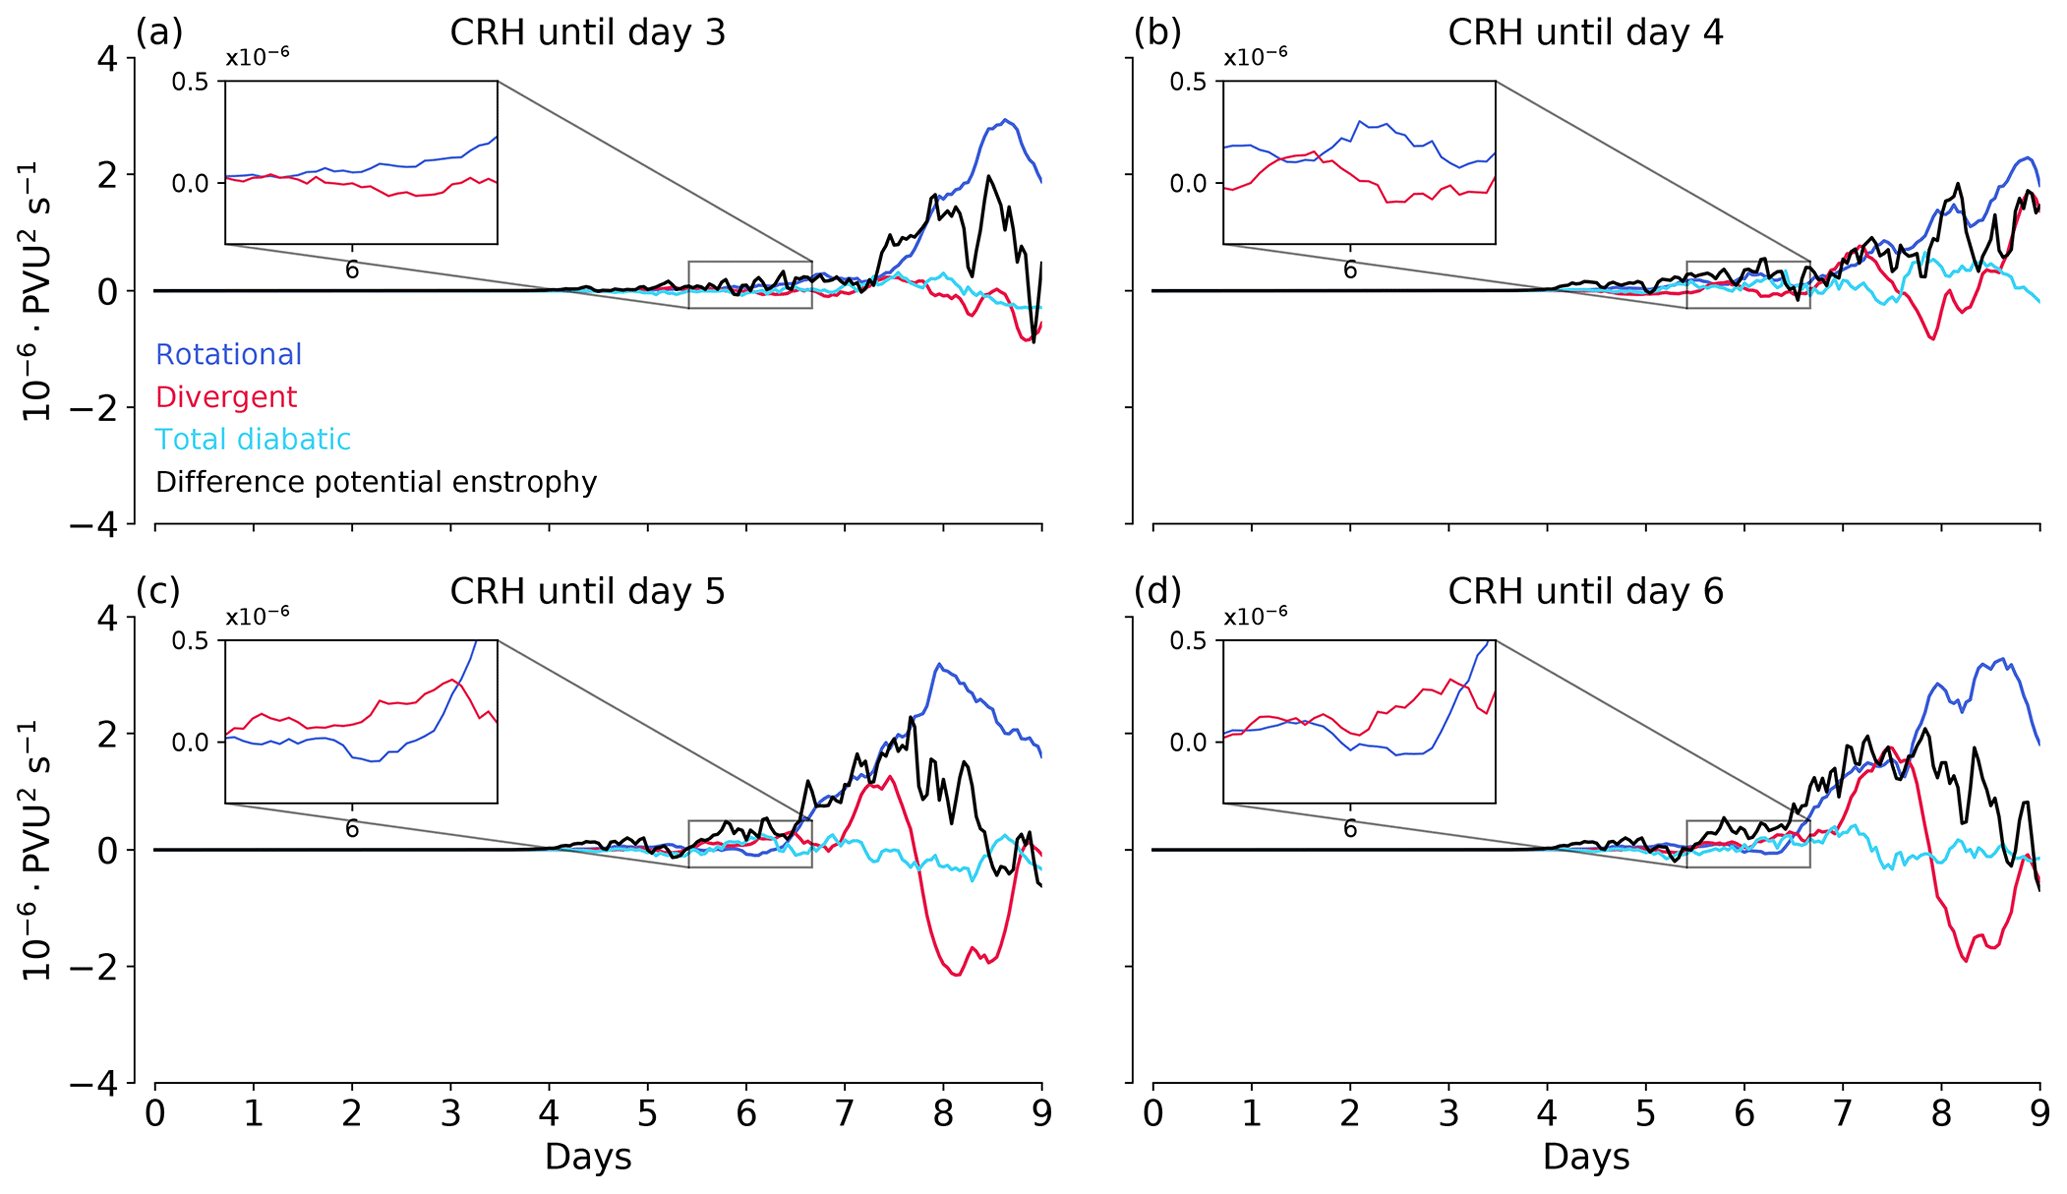
Figure 15Similar to Fig. 10 but for tendencies calculated from the REF simulation and simulations with CRH disabled at (a) day 3, (b) day 4, (c) day 5 and (d) day 6.
Overall, our results indicate that CRH impacts the cyclone's predictability in terms of its synoptic-scale PV evolution near the tropopause. A small part of the CRH impact indeed is due to the non-linearity of the atmospheric flow caused by small perturbations in the beginning. However, this effect does not change the cyclone near-tropopause PV during the mature phase. In fact, it is the enhanced latent heat release and the subsequent different divergent flow by CRH that leads to changes in near-tropopause PV. Thus, the CRH impact is important throughout the entire life cycle of the cyclone.
We study the impact of cloud-radiative heating (CRH) on extratropical cyclones by means of baroclinic life cycle simulations with the ICON atmosphere model. The simulations study an idealized cyclone and are run at a high resolution of 2.5 km, allowing deep convection to be modeled explicitly. In contrast to the global setup of Schäfer and Voigt (2018), we use a planar Cartesian geometry with zonal periodic boundary conditions, and we implement a new approach to isolate the impact of CRH. An important advantage of the new approach is that it facilitates the interpretation of the CRH impact because it eliminates the changes in the mean state due to strong clear-sky radiative cooling.
We find that CRH leads to substantial strengthening of the cyclone. The strengthening is most prominent at upper levels near the tropopause and weaker close to the surface. We also show that within this idealized framework CRH affects the predictability of the cyclone. Although our results are limited to a single case, we believe they allow for some general insights into how CRH affects the growth of extratropical cyclones.
Our results are in contrast to Schäfer and Voigt (2018), who found a weakening impact of CRH. As discussed in Sect. 3 and in Butz (2022), the disagreement arises from changes in low-level clouds between the ICON version used in our study and an earlier model version used by Schäfer and Voigt (2018). It, therefore, seems possible – and in fact not unlikely – that other models show a different sign and magnitude of the CRH impact, and it might also be that the CRH impact depends on the cyclone case. We hence do not intend to imply that CRH strengthens all extratropical cyclones. Instead, our work highlights that CRH can have a considerable effect on extratropical cyclones, and that model uncertainty in CRH might be large enough to impact numerical forecasts at synoptic scales.
Our analysis of the evolution of potential vorticity (PV) near the tropopause shows that the presence of CRH results in a higher amplitude of the baroclinic wave and delayed cyclonic wave breaking. Both contribute to a stronger cyclone. Schäfer and Voigt (2018) suggested that the reduction in the mid-tropospheric PV by CRH could be responsible for the weakening of the cyclone. However, we show that CRH has only a small direct impact on PV. Instead, the mechanism by which CRH affects the dynamics of the cyclone operates predominantly via its influence on latent heating and near-tropopause winds.
CRH enhances total latent heat release. To elucidate the relation between CRH, increased latent heating and near-tropopause PV, we use the PV error growth framework developed by Baumgart et al. (2018, 2019). By comparing simulations with no radiation and with cloud radiation, we quantify the relative importance of diabatic and advective PV tendencies by the rotational and the divergent flows to the evolution of PV near the tropopause. We show that differences in the latent heating caused by CRH lead to differences in vertical motion in the ascending regions of the cyclone. The differences in the vertical motion then lead to changes in near-tropopause divergent flow. Following changes in the divergent flow, differences in the tropopause structure amplify with the rotational flow during the highly nonlinear stage of the baroclinic wave.
The multi-stage sequence of CRH impact on near-tropopause PV is similar to a previously identified mechanism of multi-stage upscale error growth that describes how convective-scale uncertainty may grow upscale to lead to changes at the synoptic scale. An important result of our work is that CRH is not simply affecting the cyclone by providing some kind of initial state uncertainty. Instead, CRH has a continuous effect on the cyclone. Our results show that eddy kinetic energy amplifies as long as CRH is present in the simulation. The analysis also indicates that (synoptic-scale) perturbations to the temperature field that occur early in the simulation by CRH do not project onto differences in baroclinic growth. Instead, even in our case of a growing baroclinic wave, the most prominent growth of differences is associated with modulation of moist processes by CRH and thereafter by the nonlinear tropopause dynamics.
While the direct contribution of CRH to the cyclone PV structure is small, CRH affects the cyclone by changing cloud microphysical heating and subsequently the large-scale flow. Thus, future studies should look into the interaction between radiation and cloud microphysics, and whether this interaction can play a noticeable role in numerical weather predictions of extratropical cyclones. Moreover, with models moving to storm-resolving kilometer-scale resolutions (Satoh et al., 2019), we should also consider to what extent the CRH impact might depend on an adequate representation of radiation in these models compared to low-resolution models.
The simulation raw output is archived on the High-Performance Storage System at the German Climate Computing Center (DKRZ). The post-processed data used in the analysis along with the ICON simulation run scripts, scripts for deriving the baroclinic life cycle initial conditions, and the analysis scripts are published at the LMU open data server (https://doi.org/10.57970/h1y02-bjv70, Keshtgar et al., 2023). For convenience, the scripts are also available in the Gitlab repository hosted by the University of Vienna (https://gitlab.phaidra.org/climate/keshtgar-etal-crh-cyclone-wcd2022, Keshtgar, 2023, last commit: 4a50234fb57e939b4433ed0297aa1ecf5d63775c).
The study was designed by AV. The implementation of the planar channel setup in ICON and the simulation design were carried out by BK and AV. The ICON simulations were carried out by BK. The data analysis was done by BK with inputs from AV, CH, and MR. BK led the writing process of the paper, with editing from AV and input from all authors.
At least one of the (co-)authors is a member of the editorial board of Weather and Climate Dynamics. The peer-review process was guided by an independent editor, and the authors also have no other competing interests to declare.
Publisher’s note: Copernicus Publications remains neutral with regard to jurisdictional claims in published maps and institutional affiliations.
This research has been performed within project B4 of the Transregional Collaborative Research Center SFB/TRR 165 “Waves to Weather” funded by the German Research Foundation (DFG). The authors acknowledge project A1 of “Waves to Weather” for their collaboration with our project. Aiko Voigt received partial support from the German Ministry of Education and Research (BMBF) and FONA: Research for Sustainable Development (https://www.fona.de/de/, last access: 28 June 2022) under grant agreement 01LK1509A. We thank the German Climate Computing Center (DKRZ, Hamburg) for providing computing and storage resources as part of project bb1135. The authors wish to thank Tobias Selz at LMU for providing the original code for the PV error growth diagnostic and for his feedback. We are also thankful to the developers and maintainers of the open source Python packages NumPy (Harris et al., 2020), Xarray (Hoyer and Hamman, 2017) and Matplotlib (Hunter, 2007) that were used for the data analysis. The authors also thank the two anonymous reviewers for their useful comments and suggestions that allowed us to improve the paper.
This research has been supported by the Deutsche Forschungsgemeinschaft (grant no. SFB/TRR 165) and by the Bundesministerium für Bildung und Forschung (grant no. 01LK1509A).
This paper was edited by Stephan Pfahl and reviewed by two anonymous referees.
Albern, N., Voigt, A., and Pinto, J. G.: Cloud-Radiative Impact on the Regional Responses of the Midlatitude Jet Streams and Storm Tracks to Global Warming, J. Adv. Model. Earth Sy., 11, 1940–1958, https://doi.org/10.1029/2018MS001592, 2019. a
Balasubramanian, G. and Garner, S. T.: The Role of Momentum Fluxes in Shaping the Life Cycle of a Baroclinic Wave, J. Atmos. Sci., 54, 510–533, https://doi.org/10.1175/1520-0469(1997)054<0510:TROMFI>2.0.CO;2, 1997. a
Barekzai, M. and Mayer, B.: Broadening of the Cloud Droplet Size Distribution due to Thermal Radiative Cooling: Turbulent Parcel Simulations, J. Atmos. Sci., 77, 1993–2010, https://doi.org/10.1175/JAS-D-18-0349.1, 2020. a
Baumgart, M., Riemer, M., Wirth, V., Teubler, F., and Lang, S. T.: Potential vorticity dynamics of Forecast errors: A quantitative case study, Mon. Weather Rev., 146, 1405–1425, https://doi.org/10.1175/MWR-D-17-0196.1, 2018. a, b, c, d, e
Baumgart, M., Ghinassi, P., Wirth, V., Selz, T., Craig, G. C., and Riemer, M.: Quantitative view on the processes governing the upscale error growth up to the planetary scale using a stochastic convection scheme, Mon. Weather Rev., 147, 1713–1731, https://doi.org/10.1175/MWR-D-18-0292.1, 2019. a, b, c, d, e, f, g, h, i, j, k, l
Bechtold, P., Koehler, M., Jung, T., Doblas-Reyes, F., Leutbecher, M., Rodwell, M., Vitart, F., and Balsamo, G.: Advances in simulating atmospheric variability with the ECMWF model: From synoptic to decadal time-scales, Q. J. Roy. Meteor. Soc., 134, 1337–1351, https://doi.org/10.1002/qj.289, 2008. a
Booth, J. F., Wang, S., and Polvani, L.: Midlatitude storms in a moister world: Lessons from idealized baroclinic life cycle experiments, Clim. Dynam., 41, 787–802, https://doi.org/10.1007/s00382-012-1472-3, 2013. a, b
Boutle, I. A., Beare, R. J., Belcher, S. E., Brown, A. R., and Plant, R. S.: The moist boundary layer under a mid-latitude weather system, Bound.-Lay. Meteorol., 134, 367–386, https://doi.org/10.1007/s10546-009-9452-9, 2010. a
Butz, K.: The radiative impact of clouds on idealized extratropical cyclones, Master's thesis, University of Vienna, https://doi.org/10.25365/thesis.71895, 2022. a, b, c, d, e
Büeler, D. and Pfahl, S.: Potential Vorticity Diagnostics to Quantify Effects of Latent Heating in Extratropical Cyclones. Part I: Methodology, J. Atmos. Sci., 74, 3567–3590, https://doi.org/10.1175/JAS-D-17-0041.1, 2017. a, b, c, d
Catto, J. L.: Reviews of Geophysics Extratropical cyclone classification and its use, Rev. Geophys., 54, 486–520, https://doi.org/10.1002/2016RG000519, 2016. a
Chagnon, J. M., Gray, S. L., and Methven, J.: Diabatic processes modifying potential vorticity in a north atlantic cyclone, Q. J. Roy. Meteor. Soc., 139, 1270–1282, https://doi.org/10.1002/qj.2037, 2013. a, b, c
Davis, C. A., Stoelinga, M. T., and Kuo, Y.-H.: The Integrated Effect of Condensation in Numerical Simulations of Extratropical Cyclogenesis, Mon. Weather Rev., 121, 2309–2330, https://doi.org/10.1175/1520-0493(1993)121<2309:TIEOCI>2.0.CO;2, 1993. a
Doms, G., Förstner, J., Heise, E., Herzog, H.-J., Mironov, D., Raschendorfer, M., Reinhardt, T., Ritter, B., Schrodin, R., Schulz, J.-P., and Vogel, G.: A Description of the Nonhydrostatic Regional COSMO Model Part II : Physical Parameterization, Tech. rep., http://www.cosmo-model.org (last access: 16 January 2023), 2011. a
Ertel, H.: Ein neuer hydrodynamischer Wirbelsatz, Meteorol. Z., 59, 277–281, 1942. a
Fovell, R. G., Bu, Y. P., Corbosiero, K. L., Tung, W., Cao, Y., Kuo, H., Hsu, L., and Su, H.: Influence of Cloud Microphysics and Radiation on Tropical Cyclone Structure and Motion, Meteor. Mon., 56, 1–11, https://doi.org/10.1175/amsmonographs-d-15-0006.1, 2016. a
Fu, Q., Krueger, S. K., and Liou, K. N.: Interactions of Radiation and Convection in Simulated Tropical Cloud Clusters, J. Atmos. Sci., 52, 1310–1328, https://doi.org/10.1175/1520-0469(1995)052<1310:IORACI>2.0.CO;2, 1995. a
Grise, K. M., Medeiros, B., Benedict, J. J., and Olson, J. G.: Investigating the Influence of Cloud Radiative Effects on the Extratropical Storm Tracks, Geophys. Res. Lett., 46, 7700–7707, https://doi.org/10.1029/2019GL083542, 2019. a
Harris, C. R., Millman, K. J., van der Walt, S. J., Gommers, R., Virtanen, P., Cournapeau, D., Wieser, E., Taylor, J., Berg, S., Smith, N. J., Kern, R., Picus, M., Hoyer, S., van Kerkwijk, M. H., Brett, M., Haldane, A., del Río, J. F., Wiebe, M., Peterson, P., Gérard-Marchant, P., Sheppard, K., Reddy, T., Weckesser, W., Abbasi, H., Gohlke, C., and Oliphant, T. E.: Array programming with NumPy, Nature, 585, 357–362, https://doi.org/10.1038/s41586-020-2649-2, 2020. a
Hoskins, B. J., McIntyre, M. E., and Robertson, A. W.: On the use and significance of isentropic potential vorticity maps, Q. J. Roy. Meteor. Soc., 111, 877–946, https://doi.org/10.1002/qj.49711147002, 1985. a
Hoyer, S. and Hamman, J.: xarray: N-D labeled arrays and datasets in Python, Journal of Open Research Software, 5, 10, https://doi.org/10.5334/jors.148, 2017. a
Hunter, J. D.: Matplotlib: A 2D graphics environment, Comput. Sci. Eng., 9, 90–95, https://doi.org/10.1109/MCSE.2007.55, 2007. a
Joos, H. and Forbes, R. M.: Impact of different IFS microphysics on a warm conveyor belt and the downstream flow evolution, Q. J. Roy. Meteor. Soc., 142, 2727–2739, https://doi.org/10.1002/qj.2863, 2016. a
Joos, H. and Wernli, H.: Influence of microphysical processes on the potential vorticity development in a warm conveyor belt: A case-study with the limited-area model COSMO, Q. J. Roy. Meteor. Soc., 138, 407–418, https://doi.org/10.1002/qj.934, 2012. a, b, c
Klinger, C. and Mayer, B.: The Neighboring Column Approximation (NCA) – A fast approach for the calculation of 3D thermal heating rates in cloud resolving models, J. Quant. Spectrosc. Ra., 168, 17–28, https://doi.org/10.1016/j.jqsrt.2015.08.020, 2016. a
Keshtgar, B.: Scripts for “Cloud-radiative impact on the dynamics and predictability of an idealized extratropical cyclone”, Gitlab [code], https://gitlab.phaidra.org/climate/keshtgar-etal-crh-cyclone-wcd2022, last access: 16 January 2023. a
Keshtgar, B., Voigt, A., Hoose, C., Riemer, M., and Mayer, B.: ICON baroclinic life cycle simulations description and dataset for studying the cloud-radiative impact on the dynamics of an idealized cyclone, LMU Munich, Faculty of Physics [data set], https://doi.org/10.57970/h1y02-bjv70, 2023. a
Li, Y., Thompson, D. W. J., and Bony, S.: The Influence of Atmospheric Cloud Radiative Effects on the Large-Scale Atmospheric Circulation, J. Climate, 28, 7263–7278, https://doi.org/10.1175/JCLI-D-14-00825.1, 2015. a
Martínez-Alvarado, O., Madonna, E., Gray, S. L., and Joos, H.: A route to systematic error in forecasts of Rossby waves, Q. J. Roy. Meteor. Soc., 142, 196–210, https://doi.org/10.1002/qj.2645, 2016. a
Mlawer, E. J., Taubman, S. J., Brown, P. D., Iacono, M. J., and Clough, S. A.: Radiative transfer for inhomogeneous atmospheres: RRTM, a validated correlated-k model for the longwave, J. Geophys. Res.-Atmos., 102, 16663–16682, https://doi.org/10.1029/97JD00237, 1997. a
Oertel, A., Boettcher, M., Joos, H., Sprenger, M., and Wernli, H.: Potential vorticity structure of embedded convection in a warm conveyor belt and its relevance for large-scale dynamics, Weather Clim. Dynam., 1, 127–153, https://doi.org/10.5194/wcd-1-127-2020, 2020. a
Polvani, L. M. and Esler, J. G.: Transport and mixing of chemical air masses in idealized baroclinic life cycles, J. Geophys. Res.-Atmos., 112, D23102, https://doi.org/10.1029/2007JD008555, 2007. a
Raschendorfer, M.: The new turbulence parameterization of LM, COSMO Newsletter, 1, 89–97, 2001. a
Riemer, M. and Jones, S. C.: The downstream impact of tropical cyclones on a developing baroclinic wave in idealized scenarios of extratropical transition, Q. J. Roy. Meteor. Soc., 136, 617–637, https://doi.org/10.1002/qj.605, 2010. a
Ruppert, J. H., Wing, A. A., Tang, X., and Duran, E. L.: The critical role of cloud-infrared radiation feedback in tropical cyclone development., P. Natl. Acad. Sci. USA, 117, 27884–27892, https://doi.org/10.1073/pnas.2013584117, 2020. a
Saffin, L., Methven, J., and Gray, S.: The non‐conservation of potential vorticity by a dynamical core compared with the effects of parametrized physical processes, Q. J. Roy. Meteor. Soc., 142, 1265–1275, 2016. a
Satoh, M., Stevens, B., Judt, F., Khairoutdinov, M., Lin, S.-J., Putman, W. M., and Düben, P.: Global Cloud-Resolving Models, Current Climate Change Reports, 5, 172–184, https://doi.org/10.1007/s40641-019-00131-0, 2019. a
Schäfer, S. A. K. and Voigt, A.: Radiation Weakens Idealized Midlatitude Cyclones, Geophys. Res. Lett., 45, 2833–2841, https://doi.org/10.1002/2017GL076726, 2018. a, b, c, d, e, f, g, h, i, j, k, l, m, n, o
Schultz, D. M., Bosart, L. F., Colle, B. A., Davies, H. C., Dearden, C., Keyser, D., Martius, O., Roebber, P. J., Steenburgh, W. J., Volkert, H., and Winters, A. C.: Extratropical Cyclones: A Century of Research on Meteorology’s Centerpiece, Meteor. Mon., 59, 1–16, https://doi.org/10.1175/amsmonographs-d-18-0015.1, 2019. a
Schulzweida, U.: CDO User Guide, Zenodo [code], https://doi.org/10.5281/zenodo.3539275, 2019. a
Seifert, A. and Beheng, K. D.: A two-moment cloud microphysics parameterization for mixed-phase clouds. Part 1: Model description, Meteorol. Atmos. Phys., 92, 45–66, https://doi.org/10.1007/s00703-005-0112-4, 2006. a
Spreitzer, E., Attinger, R., Boettcher, M., Forbes, R., Wernli, H., and Joos, H.: Modification of Potential Vorticity near the Tropopause by Nonconservative Processes in the ECMWF Model, J. Atmos. Sci., 76, 1709–1726, https://doi.org/10.1175/JAS-D-18-0295.1, 2019. a
Stoelinga, M. T.: A Potential Vorticity-Based Study of the Role of Diabatic Heating and Friction in a Numerically Simulated Baroclinic Cyclone, Mon. Weather Rev., 124, 849–874, https://doi.org/10.1175/1520-0493(1996)124<0849:APVBSO>2.0.CO;2, 1996. a, b
Teubler, F. and Riemer, M.: Potential-vorticity dynamics of troughs and ridges within Rossby wave packets during a 40-year reanalysis period, Weather Clim. Dynam., 2, 535–559, https://doi.org/10.5194/wcd-2-535-2021, 2021. a, b
Thorncroft, C., Hoskins, B., and McIntyre, M.: Two paradigms of baroclinic‐wave life‐cycle behaviour, Q. J. Roy. Meteor. Soc., 119, 17–55, 1993. a
Tierney, G., Posselt, D. J., and Booth, J. F.: An examination of extratropical cyclone response to changes in baroclinicity and temperature in an idealized environment, Clim. Dynam., 51, 3829–3846, https://doi.org/10.1007/s00382-018-4115-5, 2018. a
Voigt, A., Albern, N., Ceppi, P., Grise, K., Li, Y., and Medeiros, B.: Clouds, radiation, and atmospheric circulation in the present-day climate and under climate change, WIRES Clim. Change, 12, 1–22, https://doi.org/10.1002/wcc.694, 2021. a
Zängl, G., Reinert, D., Rípodas, P., and Baldauf, M.: The ICON (ICOsahedral Non-hydrostatic) modelling framework of DWD and MPI-M: Description of the non-hydrostatic dynamical core, Q. J. Roy. Meteor. Soc., 141, 563–579, https://doi.org/10.1002/qj.2378, 2015. a
Zhang, F., Bei, N., Rotunno, R., Snyder, C., and Epifanio, C. C.: Mesoscale Predictability of Moist Baroclinic Waves: Convection-Permitting Experiments and Multistage Error Growth Dynamics, J. Atmos. Sci., 64, 3579–3594, https://doi.org/10.1175/JAS4028.1, 2007. a
- Abstract
- Introduction
- Methods
- Cloud-radiative impact on the cyclone
- Understanding the cloud-radiative impact by diagnosing the growth of PV differences
- Implications for the cyclone predictability
- Conclusions
- Code and data availability
- Author contributions
- Competing interests
- Disclaimer
- Acknowledgements
- Financial support
- Review statement
- References