the Creative Commons Attribution 4.0 License.
the Creative Commons Attribution 4.0 License.
 | 11 May 2023
Towards a holistic understanding of blocked regime dynamics through a combination of complementary diagnostic perspectives
Seraphine Hauser
Franziska Teubler
Michael Riemer
Peter Knippertz
Christian M. Grams
Atmospheric blocking describes a situation in which a stationary and persistent anticyclone blocks the eastward propagation of weather systems in the midlatitudes and can lead to extreme weather events. In the North Atlantic–European region, blocking contributes to life cycles of weather regimes which are recurrent, quasi-stationary, and persistent patterns of the large-scale circulation. Despite progress in blocking theory over the last decades, we are still lacking a comprehensive, process-based conceptual understanding of blocking dynamics. Here we combine three different perspectives on so-called “blocked” weather regimes, namely the commonly used Eulerian and Lagrangian perspectives, complemented by a novel quasi-Lagrangian perspective. Within the established framework of midlatitude potential vorticity (PV) thinking, the joint consideration of the three perspectives enables a comprehensive picture of the dynamics and quantifies the importance of dry and moist processes during a blocked weather regime life cycle.
We apply the diagnostic framework to a European blocking weather regime life cycle in March 2016, which was associated with a severe forecast bust in the North Atlantic–European region. The three perspectives highlight the importance of moist processes during the onset or maintenance of the blocked weather regime. The Eulerian perspective, which identifies the processes contributing to the onset and decay of the regime, indicates that dry quasi-barotropic wave dynamics and especially the eastward advection of PV anomalies (PVAs) into the North Atlantic–European region dominate the onset of the regime pattern. By tracking the negative upper-tropospheric PVA associated with the “block”, the quasi-Lagrangian view reveals, for the same period, abrupt amplification due to moist processes. This is in good agreement with the Lagrangian perspective indicating that a large fraction of air parcels that end up in the negative PVA experience diabatic heating. Overall, the study shows that important contributions to the development take place outside of the region in which the blocked weather regime eventually establishes, and that a joint consideration of different perspectives is important in order not to miss processes, in particular moist-baroclinic dynamics, contributing to a blocked regime life cycle.
- Article
(10381 KB) - Full-text XML
- BibTeX
- EndNote


Atmospheric blocking is a phenomenon in the mid and high latitudes where stationary, long-lived high-pressure systems disrupt the mean westerly flow and “block” the propagation of weather systems (e.g., Rex, 1950; Steinfeld and Pfahl, 2019). Thereby, blocking does not only mean the block itself but also the circulation pattern in which the block forms the dominant part, such that blocking can be considered from the perspective of so-called weather regimes. These large-scale, quasi-stationary, and recurrent atmospheric circulation states make up an important part of the extratropical atmospheric variability in intraseasonal timescales (Vautard, 1990; Michelangeli et al., 1995; Cassou, 2008). Low-frequency circulation regimes affect continent-size regions for several days and modulate the location and intensity of synoptic-scale weather systems that determine surface weather (Yiou and Nogaj, 2004). The weather regimes that are dominated by an anticyclonic circulation anomaly, which essentially is also identified as atmospheric blocking, are here referred to as “blocked” regimes. Due to their stationarity, these regimes can regionally lead to extreme weather events (Kautz et al., 2022), such as flooding (Houze et al., 2011; Hong et al., 2011), heat waves and associated droughts (Pfahl and Wernli, 2012; Lavaysse et al., 2018; Alvarez-Castro et al., 2018), cold spells (Sillmann et al., 2011; Buehler et al., 2011; Ferranti et al., 2018), and storms (Donat et al., 2010; Grams et al., 2017). In terms of predictability, weather regimes have an undisputed importance in forecasting, as they shape the sub-seasonal “predictability desert” between medium-range and seasonal forecasts (Vitart et al., 2012; Cortesi et al., 2021). Enhanced predictability may be expected for regimes that feature prominent anticyclonic circulation anomalies because, once established, anticyclonic anomalies exhibit slower decay rates than cyclonic anomalies, suggesting a self-sustaining nature of anticyclonic anomalies (e.g., Shutts, 1983). However, state-of-the-art numerical weather prediction models struggle with the correct representation of regimes dominated by anticyclonic anomalies where especially the onset and maintenance of the blocked circulation pattern pose difficulty (Ferranti et al., 2015; Matsueda and Palmer, 2018; Grams et al., 2018).
Existing studies on the dynamics of blocked circulation patterns address various aspects of a blocking life cycle using different approaches and addressing different spatial and temporal scales: important processes on large scales are wave dynamics (Austin, 1980), wave resonance to a given forcing (Petoukhov et al., 2013), the role of topography in the initiation of blocking on the planetary scale (Charney and DeVore, 1979; Grose and Hoskins, 1979), and the impact of tropical heating (Henderson et al., 2016). A notable study in this context by Nakamura and Huang (2018) discusses the onset of a block by the convergence and the subsequent constrained zonal propagation of wave activity as a jet stream “traffic jam”. On smaller spatial scales, studies have found an effect of enhanced transient activity (Nakamura and Wallace, 1990) and especially the role of upstream cyclones in the transfer of vorticity and momentum to the block (Nakamura and Wallace, 1993). However, it is not only the individual mechanisms at different scales but the scale interaction that is of importance for the onset and the blocking maintenance stage (e.g., Shutts, 1983; Nakamura et al., 1997; Luo et al., 2014; Miller and Wang, 2022). For example, one theory for maintaining a block by the interplay of different scales is based on the idea that an existing mature block absorbs smaller-scale eddies of the same polarity and thus re-enforces itself (Yamazaki and Itoh, 2009). While the theories described above are more related to the “dry” dynamics, studies in recent years emphasize the importance of moist-diabatic processes in modifying the midlatitude flow in the upper troposphere (Grams et al., 2011; Pfahl et al., 2015; Steinfeld and Pfahl, 2019; Teubler and Riemer, 2021). Warm conveyor belts (WCBs) – rapidly ascending airstreams in the vicinity of extratropical cyclones – play an important role here because latent heat release in the midlatitudes occurs mostly within WCBs, and WCBs transport low-tropospheric air to the upper troposphere, leading to divergent outflow near the tropopause (Wernli, 1997; Madonna et al., 2014; Pfahl et al., 2015; Steinfeld and Pfahl, 2019). All the studies mentioned above handle different mechanisms of blocking dynamics and contribute to significant progress in diverse blocking dynamic theories. However, so far the individual mechanisms have not been considered together to get a complete, comprehensive picture of the blocking dynamics (Lupo, 2021).
In this study, we make use of potential vorticity (PV; Rossby, 1940; Hoskins et al., 1985) as a key variable in atmospheric dynamics to capture the balanced dynamics of regimes. Low-PV air masses are advected poleward during blocking, leading to anticyclonic anomalies in the upper troposphere associated with a meridional amplification of Rossby waves. Teubler and Riemer (2016, 2021) have developed a quantitative framework based on Ertel PV (Ertel, 1942) that allows the decomposition of the total change in PV into different processes that contribute to the evolution of upper-tropospheric PV anomalies (PVAs) associated with Rossby wave packets (Wirth et al., 2018). A piecewise PV inversion is performed by Teubler and Riemer (2021) in order to separately consider the influence of baroclinic interaction and quasi-baroclinic propagation. The consequent distinction between quasi-barotropic, baroclinic, divergent, and non-conservative PV tendencies allows the quantification of the effects associated with dry and moist dynamics on the amplitude evolution of troughs and ridges. Quasi-barotropic PV tendencies are associated with upper-tropospheric linear wave dynamics and describe the advection of PVAs by the background flow and the advection of background PV by the flow associated with PVAs (intrinsic wave propagation). The impact of lower-tropospheric PVAs on upper-tropospheric PVAs is described by baroclinic PV tendencies. Divergent PV tendencies are due to PV advection by the divergent wind, which incorporates the impact of WCB outflow on upper-tropospheric PV. The direct impact of diabatic processes on the PV distribution is represented by non-conservative PV tendencies.
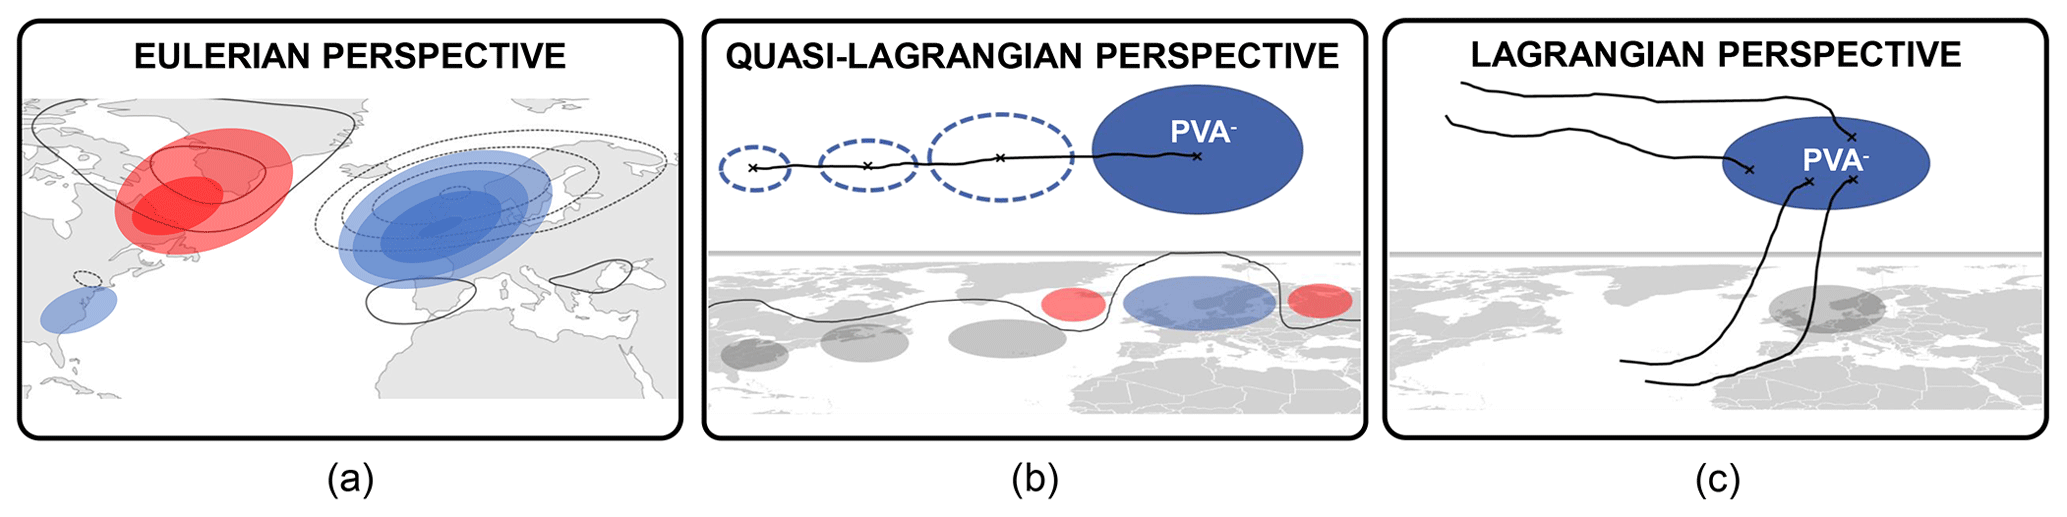
Figure 1Schematic overview of the three perspectives on the PV dynamics of blocked weather regime life cycles. (a) The Eulerian perspective quantifies the PV dynamics by projecting different upper-tropospheric PV tendency terms onto the mean regime pattern. Solid (dashed) black contours schematically show the PV pattern for the European blocking (EuBL) regime and therefore the location of positive and negative upper-tropospheric PVAs. Red and blue shading shows exemplary positive and negative PVAs at a fixed point in time, respectively. (b) The quasi-Lagrangian perspective follows negative upper-tropospheric PVAs, assigns them to active regime life cycles, and investigates the PVA amplitude evolution. The solid black line connects the center of mass positions of PVA objects (shown as dashed blue contours for different times) and points to the negative PVA track. Note that the tracked negative PVA is part of a Rossby wave packet as displayed by the sequence of negative (blue shading) and positive (red shading) PVAs. The thin black line on the map schematically shows the position of the waveguide. (c) The Lagrangian perspective calculates backward trajectories out of the negative PVA defined in the quasi-Lagrangian perspective in panel (b) and focuses on the diabatic and non-diabatic history of air parcels that end up in the negative PVA. The black lines represent schematically backward trajectories from a negative PVA (starting points marked with a black cross).
The setup of diagnostics in this study consists of three complementary approaches to look at blocking dynamics from various perspectives and to distinguish between identified mechanisms from previous studies on different temporal and spatial scales (Fig. 1). Most importantly, we here consider blocking from the viewpoint of blocked weather regimes, i.e., regime patterns with dominating anticyclonic circulation anomalies. Therefore, we use a year-round weather regime classification in the North Atlantic–European region by Grams et al. (2017). The first perspective – referred to as the “Eulerian” perspective in the following – is methodologically related to the well-known weather regime thinking, in which projections of a current field onto a mean regime field are used to obtain life cycles of weather regimes (Michel and Rivière, 2011; Grams et al., 2017). Several studies in the past have looked at regime dynamics and especially the transition phases with a low-frequency stream function budget to quantify the processes involved (Benedict et al., 2004; Feldstein, 2003; Michel and Rivière, 2011). We here translate this Eulerian approach to PV by considering the projection of low-frequency PVAs and PV tendencies onto a mean regime pattern. The projection of the anomaly's tendency is equivalent to the tendency of the projection of the anomaly and thus enables the quantification of processes leading to the onset and decay of the full regime pattern (Fig. 1a). Next, we exclusively trace the anticyclonic, upper-tropospheric PVAs associated with the dominant anticyclonic circulation anomaly of a blocked weather regime pattern. This “quasi-Lagrangian” approach is strongly leaning on the blocking identification method of Schwierz et al. (2004) based on upper-tropospheric anticyclonic PV anomalies. A new objective tracking algorithm, which detects and quantifies the effect of the splitting and merging of PVAs, enables an integrated investigation of the selective absorption mechanism by Yamazaki and Itoh (2009), mentioned above. The PV framework of Teubler and Riemer (2016) was originally used for ridges and troughs (identified as negative and positive PVAs) within a Rossby wave packet and is here applied to upper-tropospheric negative PVAs to quantify the processes associated with the PVA amplitude change (Fig. 1b). The quasi-Lagrangian perspective allows us to determine the origin of PVAs that evolve into blocking anticyclones and, for the first time, to determine the contribution of dry and moist dynamics to the amplitude evolution of PVAs using piecewise PV tendencies. The third perspective is Lagrangian in nature and is based on trajectory thinking, which has been used in studies by Pfahl et al. (2015) and Steinfeld and Pfahl (2019) to investigate the air masses associated with blocking. By calculating backward trajectories of air parcels from blocking anticyclones, it is possible to investigate how these negative upper-tropospheric PVAs have been created and if diabatic heating and therefore “moist” dynamics have played an important role (Fig. 1c).
The purpose of this study is to demonstrate how, by combining the three perspectives, a holistic view of the dynamical evolution of a blocked regime life cycle can be achieved. We use a European blocking (EuBL) regime life cycle in March 2016, which was sensitive to moist-baroclinic development during the onset stage (Magnusson, 2017; Grams et al., 2018), as an illustrative case study. The paper is organized as follows: Sect. 2 introduces the data sets and provides a detailed overview of the three different perspectives that are combined in this study. The EuBL life cycle in March 2016 is presented in Sect. 3, with a brief description of the evolution of the larger-scale flow. Section 4 presents the PV dynamics from the three different perspectives (Eulerian, quasi-Lagrangian, and Lagrangian) applied to the case study from Sect. 3. The discussion of the complementary perspectives and a comparison with previous literature constitutes the contents of Sect. 5. The study closes with the main conclusions and an outlook in Sect. 6.
2.1 Data
This study is based on the reanalysis data set ERA5 of the European Centre for Medium-Range Weather Forecasts (ECMWF), which is available from 1950 to the present (Hersbach et al., 2020). We use data for the period of 1 January 1979–31 December 2019, remapped from the original T639 spectral resolution to a regular latitude–longitude grid. For the identification of upper-tropospheric PVAs in the quasi-Lagrangian approach, we select ERA5 model-level data for maximum possible vertical resolution, with a temporal resolution of 3 h and a horizontal grid spacing of 0.5∘. We use spatially coarser data (1.0∘) for the PV inversion, also with 3-hourly resolution and with 17 pressure levels (1000, 950, 925, 900, 850, 800, 700, 600, 500, 400, 300, 250, 200, 150, 100, 70, and 50 hPa). Mean temperature and wind tendencies at model levels from ERA5 short-range forecasts serve to estimate non-conservative processes, with a spatial resolution of 0.5∘ in the horizontal and a temporal resolution of 1 h. ERA5 provides these tendencies accumulated over the previous hour, from which we calculate a 3-hourly mean around the analysis time (e.g., taking the mean of data valid at 02:00, 03:00, and 04:00 UTC for the analysis at 03:00 UTC). We distinguish here between tendencies from all parameterizations and non-radiative parameterizations.
2.2 PV framework: quantification of individual processes
This work uses Ertel's PV as (Ertel, 1942) in its hydrostatic approximation on isentropic levels, where ζθ is the component of relative vorticity perpendicular to an isentropic surface, f the Coriolis parameter, and the isentropic layer density with gravity g, pressure p, and potential temperature θ. The PV tendency equation is given by isentropic advection and non-conservative PV modification (𝒩):
with the horizontal isentropic wind vector and ∇θ the gradient operator along an isentropic surface. The non-conservative PV modification is given by
with the unit vector perpendicular to an isentropic surface, the non-conservative heating rate, and values the sources and sinks of non-conservative momentum (e.g., friction or gravity wave drag). We estimate the non-conservative PV modification term 𝒩 with the mean 3-hourly temperature and wind tendencies introduced in Sect. 2.1.
The advection term in Eq. (1) is further separated into different processes (Hoskins et al., 1985; Teubler and Riemer, 2021). PVAs (q′) are defined as deviations from a climatological background state q0 such that q′ = q−q0 is valid. For each time step within the year (recall Δt = 3 h), averages are constructed based on the period of 1980–2019. This is used for the climatological background state q0 defined as a 30 d running mean climatology centered on the respective time to ensure smooth transitions in q0 between consecutive time steps. Following the basics of PV thinking, the three-dimensional distribution of PVAs can be further separated into upper-tropospheric and lower-tropospheric PV (and temperature) anomalies. Here, the separation level of upper-tropospheric and lower-tropospheric PV anomalies lies between 600 and 650 hPa. Piecewise PV inversion with the nondivergent wind field under nonlinear balance (Charney, 1955; Davis and Emanuel, 1991; Davis, 1992) is performed on pressure levels between 25 and 80∘ N and yields the wind fields and associated with the upper-tropospheric and lower-tropospheric PV anomalies, respectively. It is important to note that our quantitative analysis is performed for the evolution of upper-tropospheric anomalies. From the PV perspective of midlatitude dynamics, we may thus consider the impact of the upper-tropospheric anomalies on themselves (mediated by ) as quasi-barotropic dynamics and the impact of the lower-tropospheric anomalies on the upper-tropospheric anomalies (mediated by ) as baroclinic dynamics. The piecewise PV inversion thus provides the possibility to consider the influence of the dynamics in the lower troposphere and the influence of the wave on itself separately from each other. The background wind field v0 is obtained in the same way as the background PV field q0 as a 30 d running mean climatology (1980–2019) centered on the respective calendar day and is approximately balanced. Per definition, the wind fields and from piecewise PV inversions are nondivergent and will hence be further complemented by the divergent flow . All wind fields are interpolated to isentropic levels. Following Röthlisberger et al. (2018), we select an isentropic level average around 320 K (namely 315, 320, and 325 K) for the EuBL in March 2016. The full wind field can finally be divided into
We introduce here the residual , which arises due to (i) characteristics inherent in piecewise PV inversion, e.g., nonlinearities and imperfect knowledge of boundary conditions; (ii) numerical inaccuracies; and (iii) the interpolation of wind fields from pressure to isentropic levels. A more detailed discussion of the PV partitioning, the piecewise PV inversion technique, and the residual is given in Teubler and Riemer (2021).
With the partitioning of PV into a background state and anomalies thereof, and the associated partitioning of the wind field, a PV-anomaly tendency equation can be written following Eq. (1) as
where we have included in the residual term the (very small) tendencies due to our use of a slowly varying background state.
The first term (in square brackets) describes the PV thinking of (upper-tropospheric, linear) barotropic Rossby waves (Hoskins et al., 1985; Wirth et al., 2018), hereafter referred to as quasi-barotropic PV tendency. For a linear wave in uniform background flow, both individual contributions to this tendency are in quadrature with the PVAs but with opposite signs. The first contribution () represents intrinsic (phase and group) propagation, including the downstream development and amplification of anomalies at the leading edge of a Rossby wave packet. The second contribution () represents the Doppler shift, i.e., the advection of the wave pattern by the background flow. In a background flow with horizontal shear, this term contributes to the deformation of PVAs. The second term in Eq. (4) () describes baroclinic interaction with lower-tropospheric PVAs, which leads on average to baroclinic growth, i.e., the amplification of upper-tropospheric ridge and trough anomalies (e.g., Teubler and Riemer, 2021). This term will hereafter be referred to as baroclinic PV tendency. The third term describes the impact of the divergent flow (hereafter referred to as divergent PV tendency). It is difficult to accurately attribute this divergent flow to individual processes, e.g., dry balanced dynamics vs. moist processes. It is usually most reasonable, however, to attribute large values of the divergent PV tendency near the tropopause to latent heat release, which invigorates mid-tropospheric ascent and hence divergent outflow aloft. A more detailed discussion of this issue can be found in Wirth et al. (2018) and Teubler and Riemer (2021). In the current study, we verify this relationship explicitly using trajectory calculations. The fourth term in Eq. (4) describes the nonlinear redistribution of PVAs in terms of the convergence of PVA flux by the (anomalous) rotational wind (), hereafter referred to simply as eddy flux convergence. Note that eddy flux convergence may change PVAs locally but may neither generate new nor amplify existing PVAs in a globally averaged sense (because the flux vanishes at the boundary of the global domain). Furthermore, eddy flux convergence may not change the area-integrated amplitude of PVAs that are defined by a boundary at which (Teubler and Riemer, 2016). The fifth term (𝒩) depicts the direct non-conservative PV modification and contains all non-conservative processes, like latent heat release, friction, and radiation.
In the later Sects. 2.4 and 2.5, our description of the evolution of PVAs associated with the dynamics of blocked weather regimes in the Eulerian and quasi-Lagrangian perspectives will build on the tendency in Eq. (4).
2.3 Weather regimes in the North Atlantic–European region
In this study, we use the year-round definition of seven weather regimes in the North Atlantic–European region (NAE; 80∘ W–40∘ E, 30–90∘ N; dashed gray in Fig. 2a) by Grams et al. (2017) adapted to ERA5. Geopotential height anomalies are calculated based on a 90 d running mean climatology from 1979–2019 at 500 hPa with a temporal resolution of 6 h. Anomalies are additionally filtered by a 10 d low-pass filter (Lanczos filter; Duchon, 1979) to exclude high-frequency signals. After normalization of the anomalies for a year-round definition, k-means clustering is performed for the expanded phase space of the leading seven empirical orthogonal functions that describe 74.4 % of the variability. A weather regime is then defined as the cluster mean of one of seven clusters, which was shown to be the optimal number in the year-round definition. The seven weather regimes consist of three cyclonic regime types (zonal regime – ZO, Scandinavian trough – ScTr, Atlantic trough – AT) and four anticyclonic regime types (Atlantic ridge – AR, European blocking – EuBL, Scandinavian blocking – ScBL, Greenland blocking – GL).
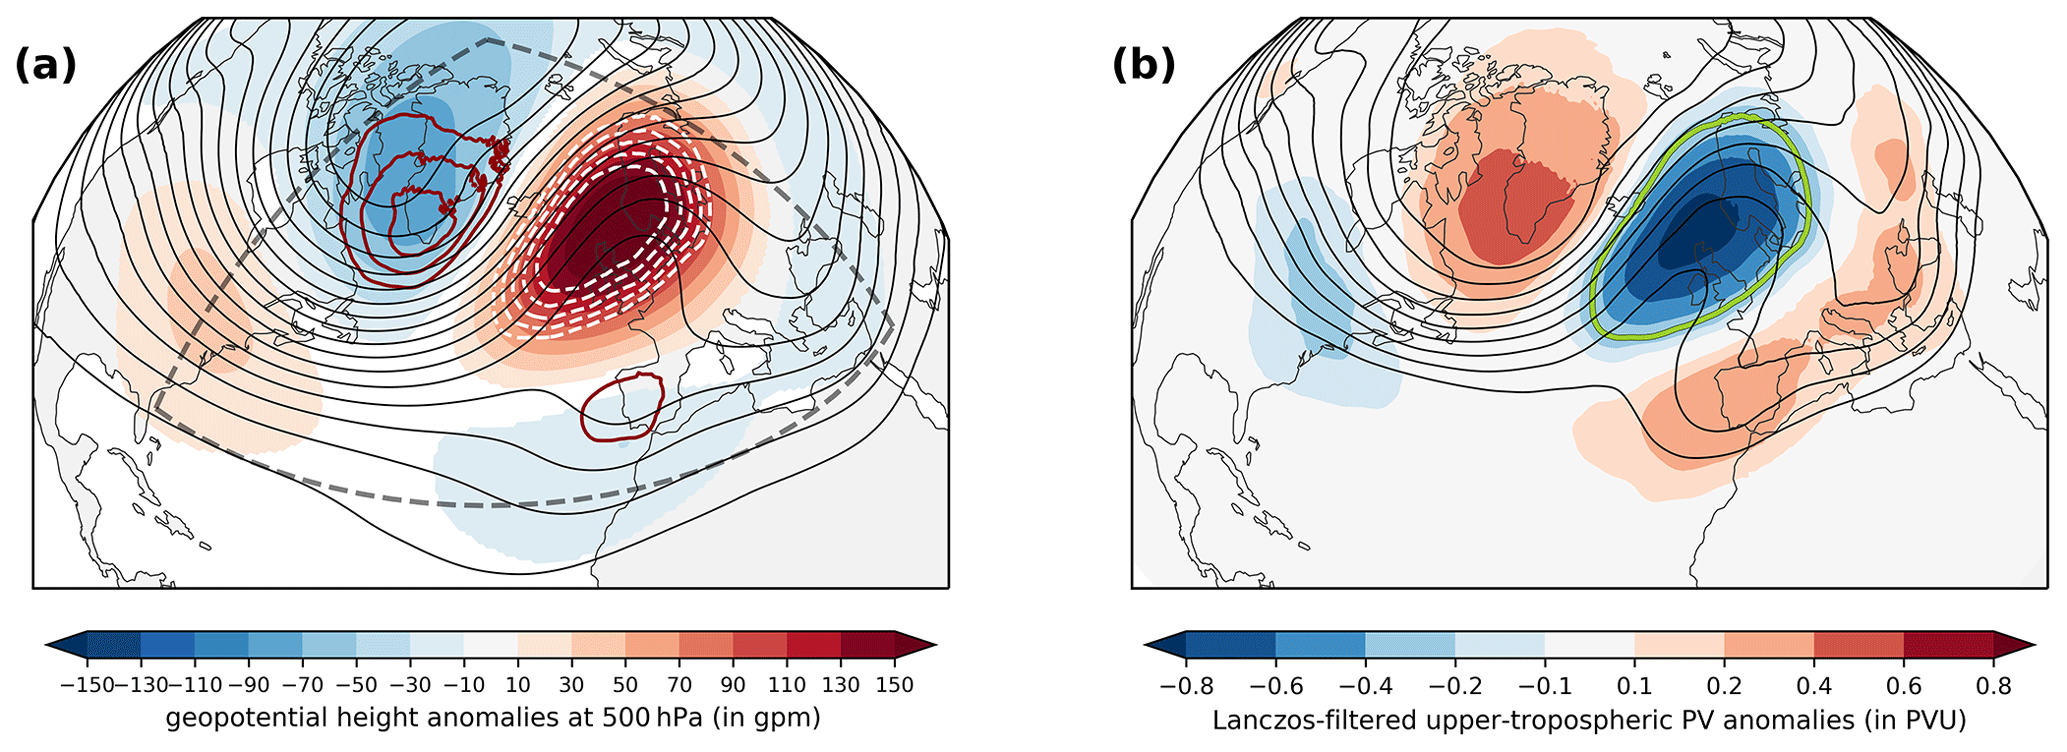
Figure 2Year-round weather regime composite of EuBL after Grams et al. (2017) based on geopotential height at 500 hPa and upper-tropospheric PV. (a) Lanczos-filtered (10 d) geopotential height anomalies at 500 hPa (shading, in gpm), absolute geopotential height at 500 hPa (black lines every 40 gpm), and vertically averaged PVAs between 500–150 hPa for negative (positive) values in dashed white (solid dark red) lines between 0.3 and 0.7 every 0.1 for all time steps attributed to the EuBL regime type (in PVU). The box (dashed gray) shows the area used to define the year-round weather regimes. (b) Lanczos-filtered (10 d) vertically averaged PVAs between 500–150 hPa (shading) and vertically averaged PV for all time steps attributed to the EuBL regime type (contours, in PVU, from 1.5 to 3.5 PVU in steps of 0.25 PVU). The solid bright green line illustrates the regime mask for the EuBL regime type, defined by the −0.3 PVU PVA contour.
In this study, we apply different methods to quantify weather regime dynamics to a EuBL regime life cycle. The mean year-round regime pattern for EuBL is shown in Fig. 2a. A positive geopotential height anomaly over the eastern North Atlantic and Europe dominates the regime pattern and is flanked by two areas of negative geopotential height anomalies upstream over Greenland and downstream over the Mediterranean and East Asia.
To make a quantitative statement about the similarity of an instantaneous pattern to the seven weather regimes, we use the weather regime index (IWR) (Michel and Rivière, 2011; Grams et al., 2017), defined as
where NT is the total number of time steps within a climatological sample (all times in 1979–2019), the climatological mean of the projection PWR, the low-frequency geopotential height anomaly at 500 hPa, the low-frequency geopotential height pattern that defines the weather regime, and (λ,φ) the respective latitude–longitude in the Northern Hemisphere (NH).

Figure 3Weather regime index (IWR) for all seven weather regimes around the EuBL life cycle in March 2016 shown for the year-round weather regime definition from 24 February, 00:00 UTC–27 March, 00:00 UTC for all seven Euro–Atlantic regimes: Atlantic trough (AT), zonal (ZO), Scandinavian trough (ScTr), Atlantic ridge (AR), European blocking (EuBL), Scandinavian blocking (ScBL), and Greenland blocking (GL). Thick lines represent active regime life cycles. Gray shading indicates the period of the active EuBL regime life cycle from 9 March, 18:00 UTC–18 March, 00:00 UTC.
Objective weather regime life cycles are derived based on the IWR for each regime and time step. Following Grams et al. (2017), a regime life cycle is defined as a persistent IWR above 1.0 for more than 5 consecutive days that shows for at least one time step the highest IWR in all seven regimes. A weather regime life cycle is called active if the IWR lies above 1.0, and the first time step at which IWR > 1.0 is defined as the onset of the life cycle. The decay is then set as the first time at which the IWR is below 1.0 again. The course of the weather regime index around the EuBL life cycle in March 2016 is shown in Fig. 3.
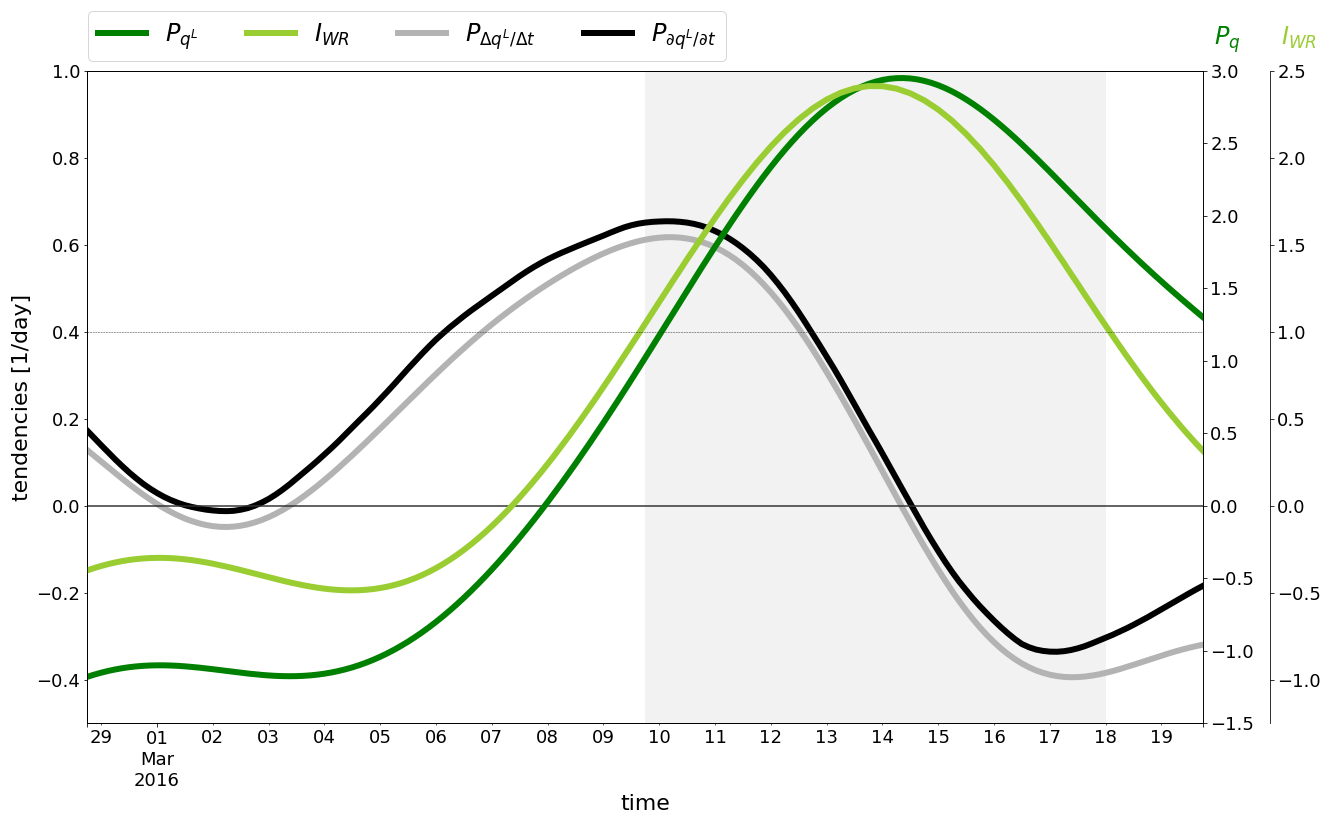
Figure 4Difference between the IWR evolution and the evolution of the projected low-frequency PVAs to the EuBL regime pattern Pq. Projection of 10 d low-pass-filtered PVAs (Pq, dark green) and IWR in terms of geopotential height anomalies at 500 hPa (light green, see Fig. 3) on the right y axes. The gray and black solid lines represent the projection of the observed () and the diagnosed (DIAG = ) evolution of the PVAs, respectively (left y axis). The gray shaded area denotes the period of the active life cycle defined by IWR≥1.
2.4 Eulerian PV perspective on the weather regime evolution
We are interested in the processes governing the dynamics of the EuBL in March 2016 from a PV perspective. Because EuBL is defined in terms of a low-frequency anomaly pattern (Sect. 2.3), we here apply the same 10 d low-pass filter to the PVAs, hence considering low-frequency PVAs qL. Following, e.g., Feldstein (2003) and Michel and Rivière (2011), who studied the stream function evolution of low-frequency modes like the North Atlantic Oscillation, we define a normalized projection of qL and its tendencies onto the low-frequency PV pattern of the weather regime, , as
Note that the projection of the tendency is equivalent to the tendency of the projection because is constant with time, and the operator commutes with the summation operator. The normalized projection is performed over the Northern Hemisphere in the latitudinal band between 25 and 80∘ N, since the PV tendencies are limited to this domain. The low-pass-filtered anomaly qL is averaged between 315 and 325 K (Sect. 2.2). The weather regime PV pattern is defined as the mean of the low-frequency PVAs vertically averaged between 500 and 150 hPa on active life-cycle days (shown for EuBL in Fig. 2b), consistent with the definition used in the quasi-Lagrangian perspective to track PVAs (Sect. 2.5). Analogous to the definition of the IW R in Sect. 2.3, we subtract the climatological background value and do a standardization. then closely resembles the IW R and describes how similar a certain PV pattern is to one of the weather regimes (Eq. 5). The similarity of and IW R is shown for the EuBL regime life cycle in March 2016 in Fig. 4. Due to the large qualitative agreement, we conclude that the dynamics underlying the evolution of IW R can be interpreted in terms of the dynamics of .
The individual contributions governing the evolution of (namely the quasi-barotropic term – QB, the baroclinic term – BC, the divergent term – DIV, the convergence of the eddy flux term – EDDY, the non-conservative term – NON-CONS, and the residual term – RES) are obtained by applying our 10 d low-pass filter to each term in Eq. (4) and inserting that term into the RHS (right-hand side) of Eq. (6). This leads to the projection defined as
which describes a normalized pattern correlation between the low-frequency PV tendencies and the regime pattern. If a projection is positive, the associated process favors a given regime pattern. If a projection is negative, the associated process works against a regime pattern. The observed temporal evolution of agrees very well with the diagnosed evolution, (Fig. 4). There is a near-constant difference of 0.07 d−1 between the diagnosed and observed evolution (a relative difference of 12 % at onset time), which increases during the decay stage of the regime. However, the diagnosed tendencies still capture the overall evolution of very well. In combination with the relative smallness of the difference, we thus assert that the assessment of the relative importance of individual processes is not compromised.
2.5 Quasi-Lagrangian perspective on the amplitude evolution of negative PVAs contributing to a weather regime
We complement the Eulerian perspective with a quasi-Lagrangian perspective that follows upper-tropospheric anticyclonic PVAs in blocked weather regime life cycles and quantifies the processes in their PVA amplitude evolution. To identify contributing PVAs, we first identify and track negative upper-tropospheric PVAs as the vertical average between 500 and 150 hPa based on ERA5 model-level data and then define the spatial overlap of each of the identified PVAs with the defining weather regime PV pattern. The identification and tracking of negative PVAs closely follow the blocking diagnostics of Schwierz et al. (2004), with the following modifications: (i) PVAs are calculated as deviations from a 30 d running mean climatology (1980–2019) centered on the respective calendar day, (ii) PVAs are not smoothed in time but smoothed spatially over a scale of 150 km, (iii) a weaker threshold of −0.8 PVU is used which enables early detection, and (iv) the spatial overlap criterion for the tracking of the PVAs is reduced to a minimum (overlap > 0 %) to enable the tracking of fast-moving, transient PVAs (compared to quasi-stationary PVAs in Schwierz et al., 2004). The fixed threshold of −0.8 PVU is used exclusively in this case study and captures approximately the 35 % strongest negative PVAs in the Northern Hemisphere in terms of area for the period of 1980–2019. In this context, the threshold value fulfills both conditions required: (1) it is close enough to q′ = 0 such that the budget of the integrated PVA amplitude of Teubler and Riemer (2016) can be closed as well as possible, and (2) it is far enough away from q′ = 0 such that the grouping of PVAs over the entire Northern Hemisphere by single thin filaments is avoided, which enables the investigation of single distinct PVAs. Furthermore, the algorithm is modified to identify splitting and merging events. For further details about the identification and tracking the interested reader is referred to the Appendix (Appendix A, Fig. A1). In the remainder of this study, the negative upper-tropospheric PVAs identified and tracked in the quasi-Lagrangian perspective are referred to as 's in the following. The assignment of 's to active weather regime life cycles is based on the spatial overlap with a predefined regime mask. The regime mask is defined as the area encapsulated by the area where the values of the weather regime pattern are smaller than −0.3 PVU (bright green contour line in Fig. 2b). 's that exhibit at least a 10 % overlap with the regime mask at the time of an active regime are attributed to that specific regime life cycle. In general, more than one may contribute to a given regime life cycle.
We apply the PV framework of Teubler and Riemer (2016) to tracks and consider the importance of processes that contribute to the amplitude evolution. This allows for deeper insights into the associated dynamics. Our amplitude metric is the spatial integral of q′ over the area A of the , i.e., . Using the Leibniz integral rule, the tendency equation for this amplitude metric following Teubler and Riemer (2021, their Eq. 6) is given by
with the normal vector n in outward direction of the boundary 𝒮 of 𝒜, and vs is the motion of 𝒮. The first term on the right describes the contributions to the amplitude strength, whereas the second term represents the contribution to the area change. We expand the first term of the RHS according to the partitioning introduced in Eq. (3), which yields
where we have rearranged terms, used the nondivergence of the balanced flow (v0, , ), and assumed the residual wind to be nondivergent too1. The abbreviations that are introduced in Eq. (9) to denote the different PV tendency terms appear in the figures in the quasi-Lagrangian perspective (Sect. 4.2) and are used for an easier reference. The (very small) term v0⋅∇q0 is not attributed to the quasi-barotropic term of Teubler and Riemer (2021) for the sake of consistency with the Eulerian perspective above. The major contribution to the amplitude change of the anomaly (Eq. 9) is due to terms of the form v⋅∇q0 that describe that air masses cross the gradient of background PV.
The boundary term BND is introduced, which describes the change in the integration area 𝒜 by (i) the net divergence of the PVA flux () through the boundary and (ii) the movement of the boundary vs. Note that the eddy term in Eq. (4) is completely absorbed into the first term of BND (Eq. 9). Teubler and Riemer (2016) considered anomalies that were bounded, in general, by on the respective isentropic level. In this case, BND is sufficiently small so that it can be neglected. In this study, the identification and tracking of is performed on pressure levels. We hence define the integration area 𝒜 by the overlap of with the negative PVA on isentropic levels (315, 320, and 325 K). As a consequence, BND no longer cancels out during integration. Generally, BND is difficult to determine since the motion of the boundary of the anomaly vs is required. Section B in the Appendix discusses inherent limitations to the evaluation of BND. Evaluating BND by using observed changes ΔA of the area A of the PVA on isentropic levels, we find very good agreement between the observed and the diagnosed tendency of the amplitude (Fig. B1a).
In the following, we will in particular focus on the first four terms in Eq. (9) (QB, BC, DIV, and NON-CONS), i.e., on those that yield amplitude changes in the globally integrated sense. This focus implies the assumption that the relative importance of the processes diagnosed within the – defined by a finite threshold – is similar to that in the vicinity of the . Vicinity is here defined as the area between the contour line of the finite q′ threshold and a neighboring contour line. However, for completeness, the temporal evolution of the terms contained in the second row of Eq. (9) is presented in the Appendix (Fig. B1).
2.6 Lagrangian perspective on the diabatic history of air parcels ending up in the
We complement the Eulerian and quasi-Lagrangian perspectives with a Lagrangian perspective that focuses on the diabatic history of air parcels that end up in the associated with a blocked regime. We employ the Lagrangian analysis tool LAGRANTO (Sprenger and Wernli, 2015), using three-dimensional wind fields from ERA5 model-level data. The diabatic history of air parcels is investigated with a set of 3 d backward trajectories that end up in the defined in the quasi-Lagrangian perspective (Sect. 2.5). Following Pfahl et al. (2015), trajectory calculations are launched for each grid point within a (Δx = 0.5∘) on nine pressure levels between 500 and 150 hPa (Δp = 50 hPa) for each time step. In accordance with Pfahl et al. (2015) and Steinfeld and Pfahl (2019), we trace potential temperature θ along the trajectories, and the 3 d backward trajectories are classified based on their net change of θ along the trajectory. Trajectories are classified as diabatically “heated” if Δθh,max > 2 K is fulfilled.
In addition, we create an additional set of trajectories to detect WCBs as trajectories that ascend by at least 600 hPa in 48 h, based on a similar methodology to Madonna et al. (2014). Analogous to Quinting and Grams (2022), we distinguish different stages of the WCB and assign all WCB trajectory parcels that are located above 400 hPa to the WCB outflow stage. For this purpose, 2 d backward trajectories are started 3-hourly in the Northern Hemisphere at an equidistant grid of Δx = 100 km and at 13 equidistant vertical levels between 400 and 100 hPa. This is not the traditional way to determine WCB outflow by forward trajectories, but it offers the advantage of calculating trajectories directly from the 's. The filtering of trajectories is omitted here to avoid double counting as well as the criterion that the ascent must take place in the vicinity of an extratropical cyclone.
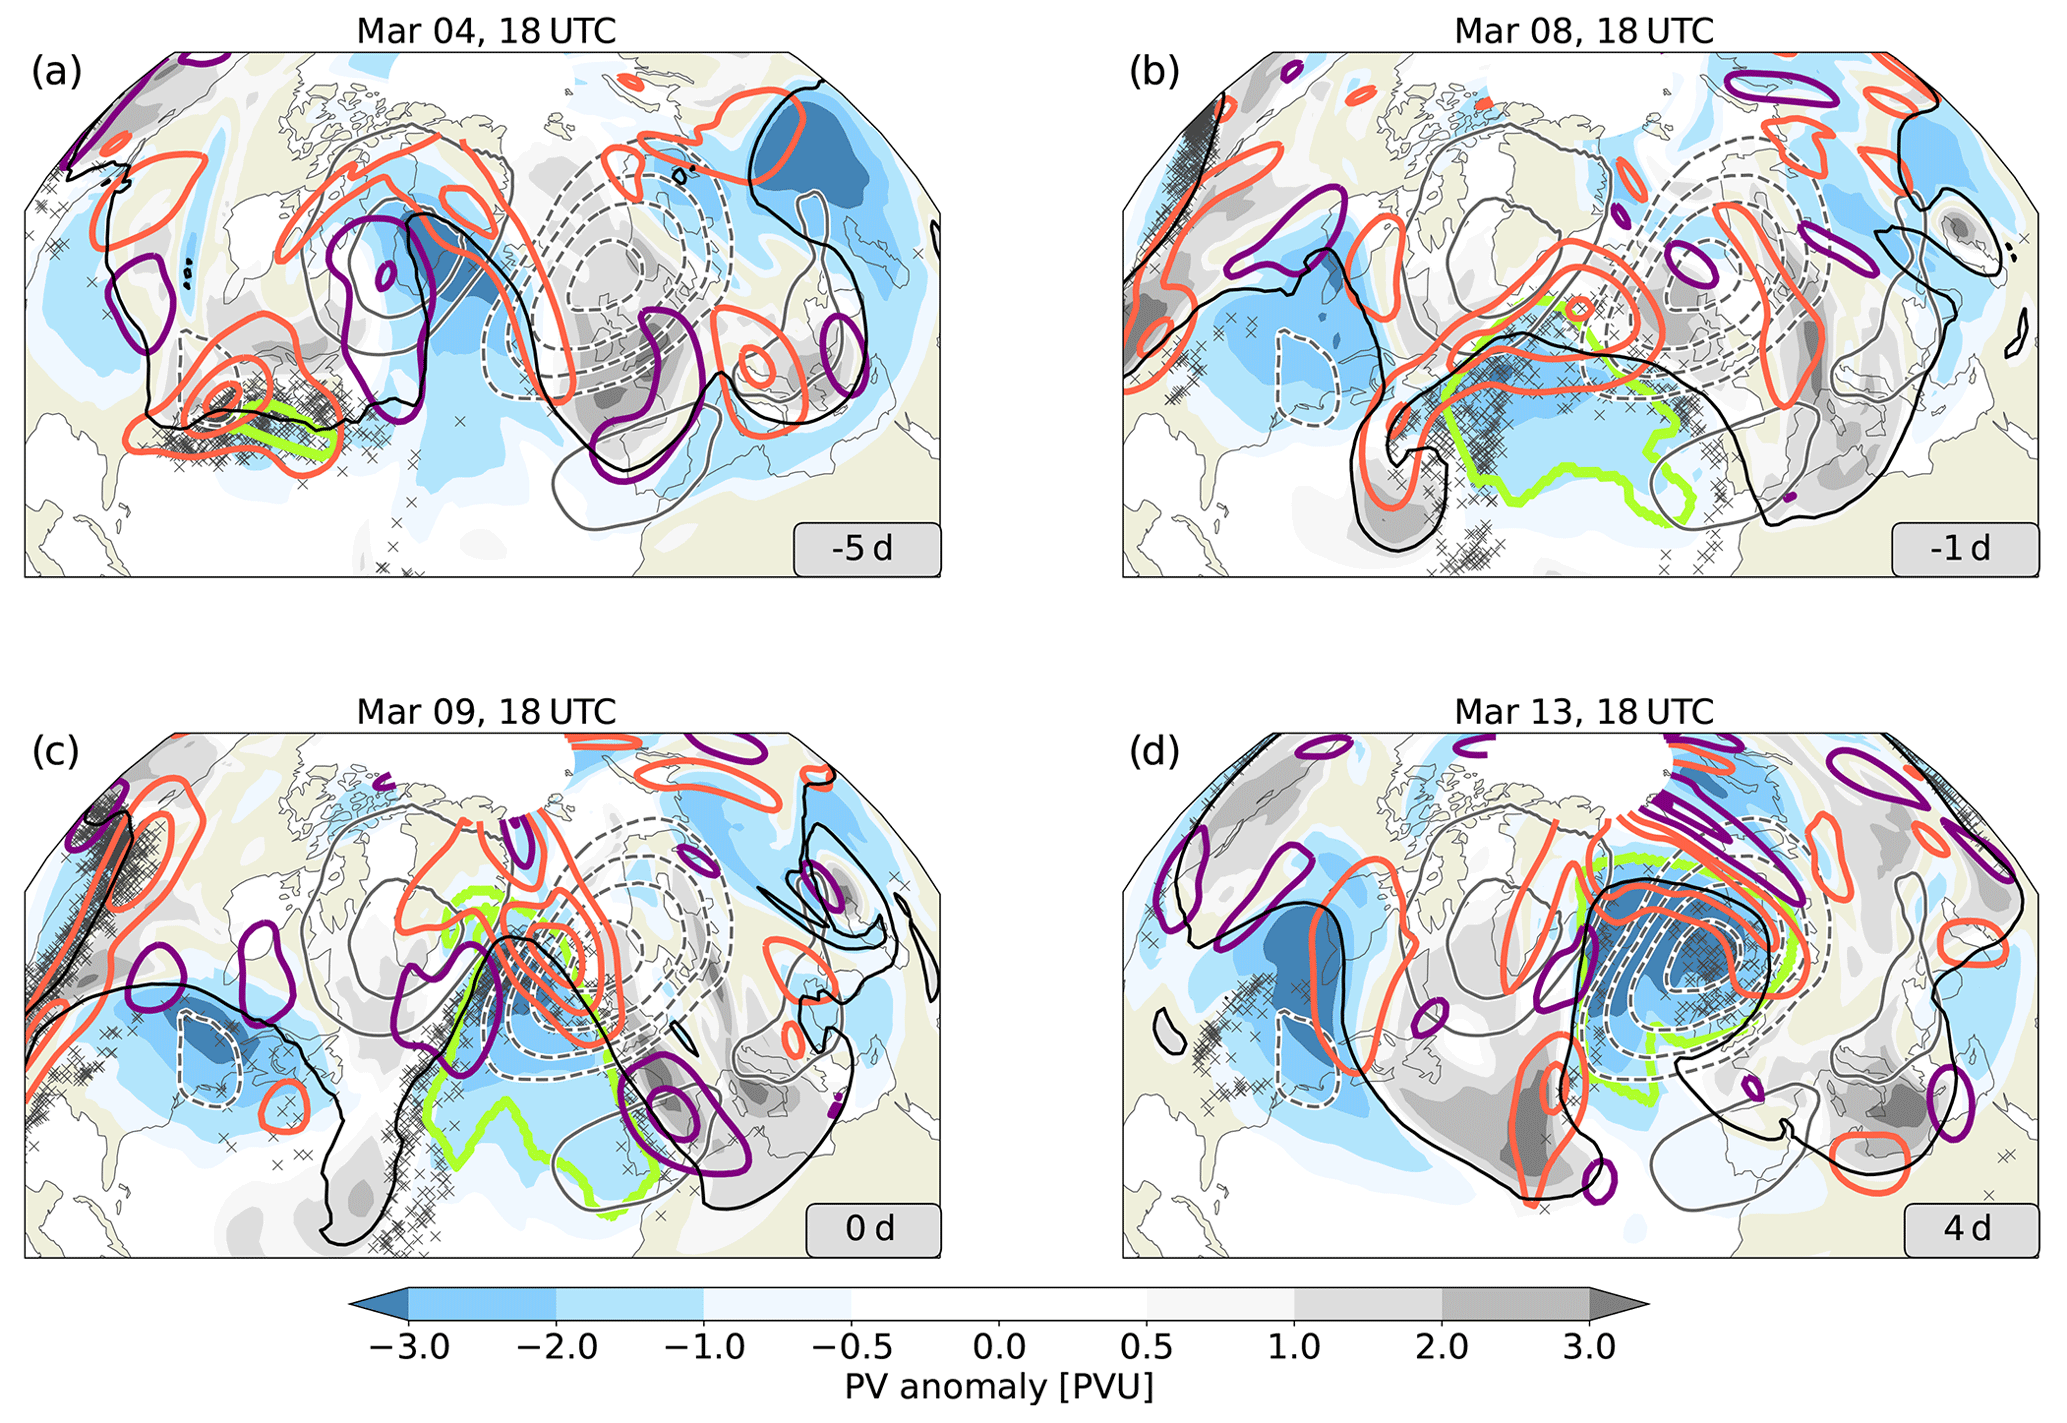
Figure 5Synoptic evolution of the EuBL regime life cycle in March 2016. Upper-tropospheric PVAs (315–325 K isentropic layer mean, shading) and the 2 PVU contour (solid black) for selected time lags relative to the EuBL regime life cycle onset (9 March, 18:00 UTC): (a) 5 d before onset, (b) the day before onset, (c) onset, and (d) 4 d after onset. The negative PV anomaly that is later identified in the quasi-Lagrangian perspective in Sect. 4.2 () as the main contributing negative PVA is shown in a light-green contour line (corresponds to the −0.8 PVU anomaly contour). Solid orange and dark-purple contour lines point to negative and positive divergent PV tendencies (), likewise shown as the isentropic mean between 315–325 K (in steps of ± 0.5, 1.5, 2.5 PVU d−1). Note that divergent PV tendencies are smoothed by a Gaussian filter. Black crosses mark every 30 intersection points of WCB trajectories in the 317.5–322.5 K isentropic layer. The thin dark-gray contours indicate the regime pattern of EuBL (± (0.2, 0.4, 0.6, 0.8) PVU, negative dashed).
This section introduces the synoptic and large-scale evolution of the EuBL weather regime life cycle in March 2016. Based on the IWR, the life cycle occurred from 9 March, 18:00 UTC to 18 March, 00:00 UTC (Fig. 5). We first discuss the PV-based evolution of the large-scale flow features in the North Atlantic–European region. This is complemented by a first overview of the potential influence of moist processes in the development of the blocked regime pattern, based on divergent PV tendencies and WCB intersection points with the 320 K isentropic surface in the upper troposphere.
The large-scale circulation pattern is characterized by a high-amplitude ridge over the North Atlantic 5 d prior to regime onset (black 2 PVU contour and strong negative PVA in blue shading, Fig. 5a). This ridge is flanked by broad troughs upstream over eastern North America and downstream over western Europe (positive PVAs in gray shading). An incipient negative upper-tropospheric PVA develops at the southern flank of the trough upstream near the US East Coast (light-green contour in Fig. 5a). This negative PV anomaly is identified later in this study as the main contributing from a quasi-Lagrangian perspective. The broad trough over western Europe occupies the region where a quasi-stationary ridge is expected later during the EuBL life cycle (see thin dashed lines in black, Fig. 5a). Over the next 4 d, the incipient ridge over the North Atlantic dramatically amplifies ahead of a narrowed and elongated trough along the US East Coast and extends to the east, where it replaces the high-amplitude ridge over the North Atlantic (Fig. 5b). During the same period, the large-amplitude trough downstream slowly moved from western to central Europe (Fig. 5a and b). Around 1 d prior to the EuBL onset, the trough upstream reaches far to the south, exhibits a cut-off character, and wraps up cyclonically. At the time of the EuBL onset, 1 d later, the ridge is centered over the eastern North Atlantic, upstream of the region of the climatological mean negative PVA during EuBL (Fig. 5c). The troughs upstream and downstream of the ridge also strengthen, as manifested by the increasing PV anomaly magnitude within these areas. A further intensification of the negative PVA occurs during the 4 d of the active regime life cycle, resulting in a highly amplified ridge at the time of the maximum manifestation of the blocked regime (defined as maximum in IW R in Fig. 3). At that time, the ridge covers a large area over the eastern North Atlantic and northwestern Europe and starts breaking anticyclonically towards central Europe (Fig. 5d). The trough downstream is displaced to the southeast and has weakened, but the trough upstream continues to strengthen and still reaches far to the south.
To understand the impact of moist processes for the development and maintenance of the EuBL regime life cycle, we look at divergent PV tendencies and WCB air parcels at 320 K. High WCB activity prevails over the US East Coast at the time when the incipient negative PVA develops and suggests a moist contribution to the formation of the PVA (Fig. 5a). Simultaneously, divergent PV tendencies centered at the northwestern corner of the anomaly strengthen the negative PVA (red contours). On the day before the EuBL onset, again strong negative divergent PV tendencies co-occur with WCB air parcels, especially on the northwestern flank of the ridge associated with the upstream trough (Fig. 5b). Studies by Magnusson (2017) and Grams et al. (2018) have shown that synoptic-scale WCB activity associated with this upper-level trough contributed to the subsequent amplification and poleward extension of the ridge. This has further been demonstrated to largely amplify forecast errors, leading to a particularly poor medium-range forecast over Europe. At the time of the regime onset, high WCB activity is observed on the eastern and western flanks of the large-amplitude ridge around the EuBL onset, with a clear center of action located at the northern tip (Fig. 5c). Here we see again that this is accompanied by strong divergent PV tendencies that are associated with an amplification of the ridge. At the same time, positive divergent PV tendencies are now appearing on the flanks of the ridge, indicating a narrowing. During the life cycle, it becomes clear that the maintenance of the regime involves a diabatic contribution implied by strong negative divergent PV tendencies in the northern corner of the ridge (Fig. 5d). Ongoing WCB activity is observed ahead of the high-amplitude cyclonically breaking trough upstream.
In summary, the development and maintenance of the EuBL life cycle in March 2016 are related to the propagation and amplification of a negative PVA reaching Europe around the time of regime onset. The amplification of this negative PVA and its maintenance over Europe is associated with intermittent synoptic activity that points to a non-negligible moist-dynamical contribution. Fair agreement is seen in the spatial occurrence of WCB air parcels and ridge-amplifying divergent PV tendencies so that the consideration of the divergent PV tendency term as an indirectly diabatic term is justified. It is important to note that the negative PVA is not generated locally over Europe but quite far upstream. Likewise, the synoptic activity, which seems to be an important contributor to the buildup of the regime, takes place upstream of where the block is expected. In the following, we will quantify the contributions of different processes to the EuBL regime life cycles from the Eulerian, quasi-Lagrangian, and Lagrangian perspectives.
4.1 Eulerian PV perspective
We consider the onset, maintenance, and decay of the EuBL regime over the North Atlantic–European region from the Eulerian perspective by focusing on the processes that locally contribute to a certain regime pattern. Low-pass-filtered PV tendencies are projected onto the regime pattern to quantitatively determine the mechanisms that govern the evolution of the regime pattern. Further insight into the dynamics of the pattern evolution can be gained by considering the positive and negative PVAs separately, i.e., by projecting the individual tendencies only onto the positive (trough) and negative (ridge) parts of the pattern, respectively. The individual contributions of different processes to the evolution of the EuBL regime pattern are shown as tendencies in Fig. 6. Positive values indicate that an individual mechanism contributes to the onset of the regime pattern, and negative values imply that a particular process contributes to the decay of the regime pattern. The time series of the tendencies is complemented with spatial information on PV and PV tendencies for selected times in Fig. 7.
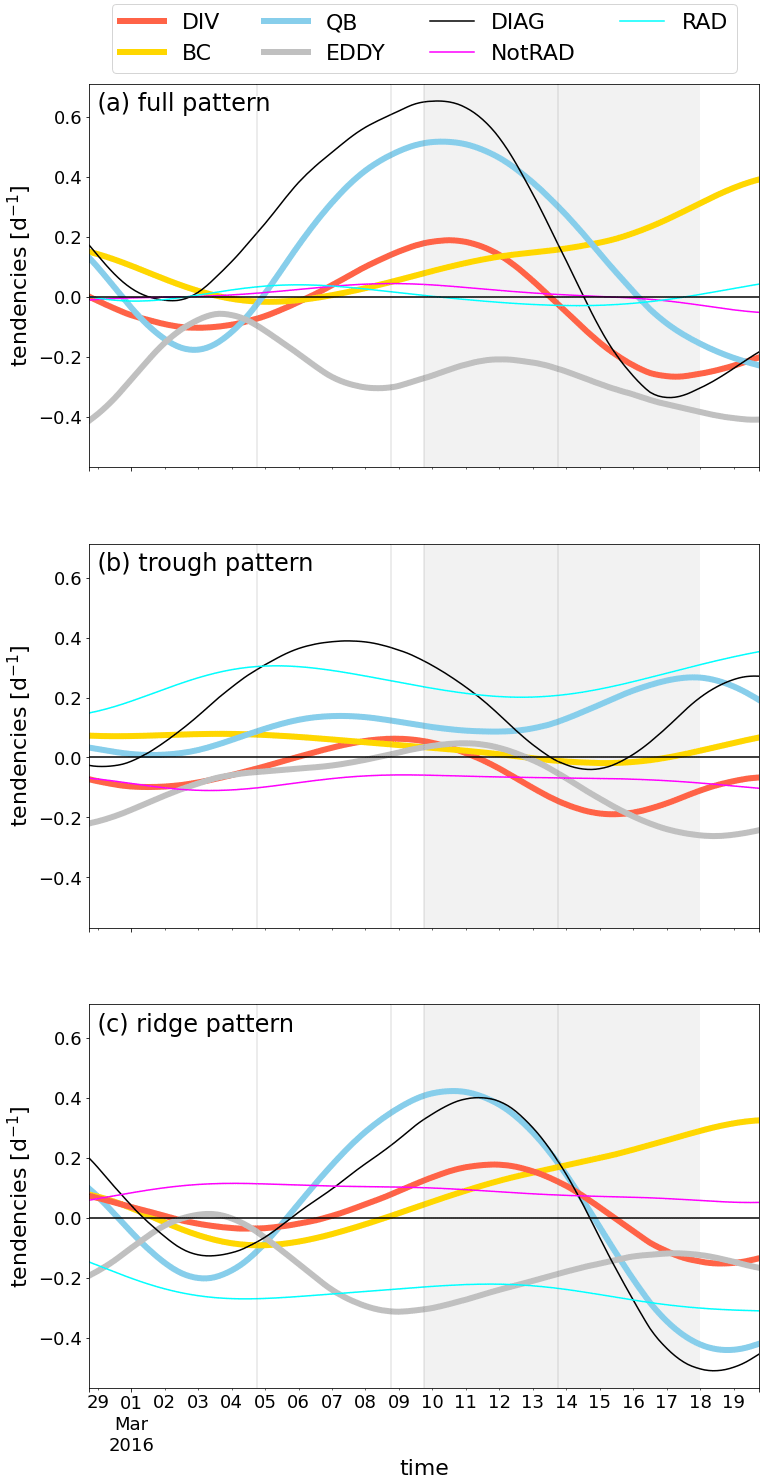
Figure 6Quantified PV dynamics of the EuBL regime life cycle in March 2016 from an Eulerian perspective. Projection of low-frequency PV tendencies (in d−1) onto (a) the full regime pattern consisting of positive and negative PVAs, (b) only the positive PVAs, and (c) only the negative PVAs of the regime pattern. The colored curves represent the different PV tendencies: divergent (DIV, red), quasi-barotropic (QB, blue), baroclinic (BC, yellow), and the convergence of eddy fluxes (EDDY, gray). The contribution due to direct diabatic modification is separated into radiation (RAD, turquoise) and non-radiative processes (NotRAD, pink). The full diagnosed tendency (DIAG) is displayed as the sum of all the terms included in Eq. (7) (black curve). The gray shaded area denotes the time of the active EuBL regime life cycle. Gray vertical lines refer to the times for which spatial fields of PVAs and PV tendencies are shown in Fig. 7.
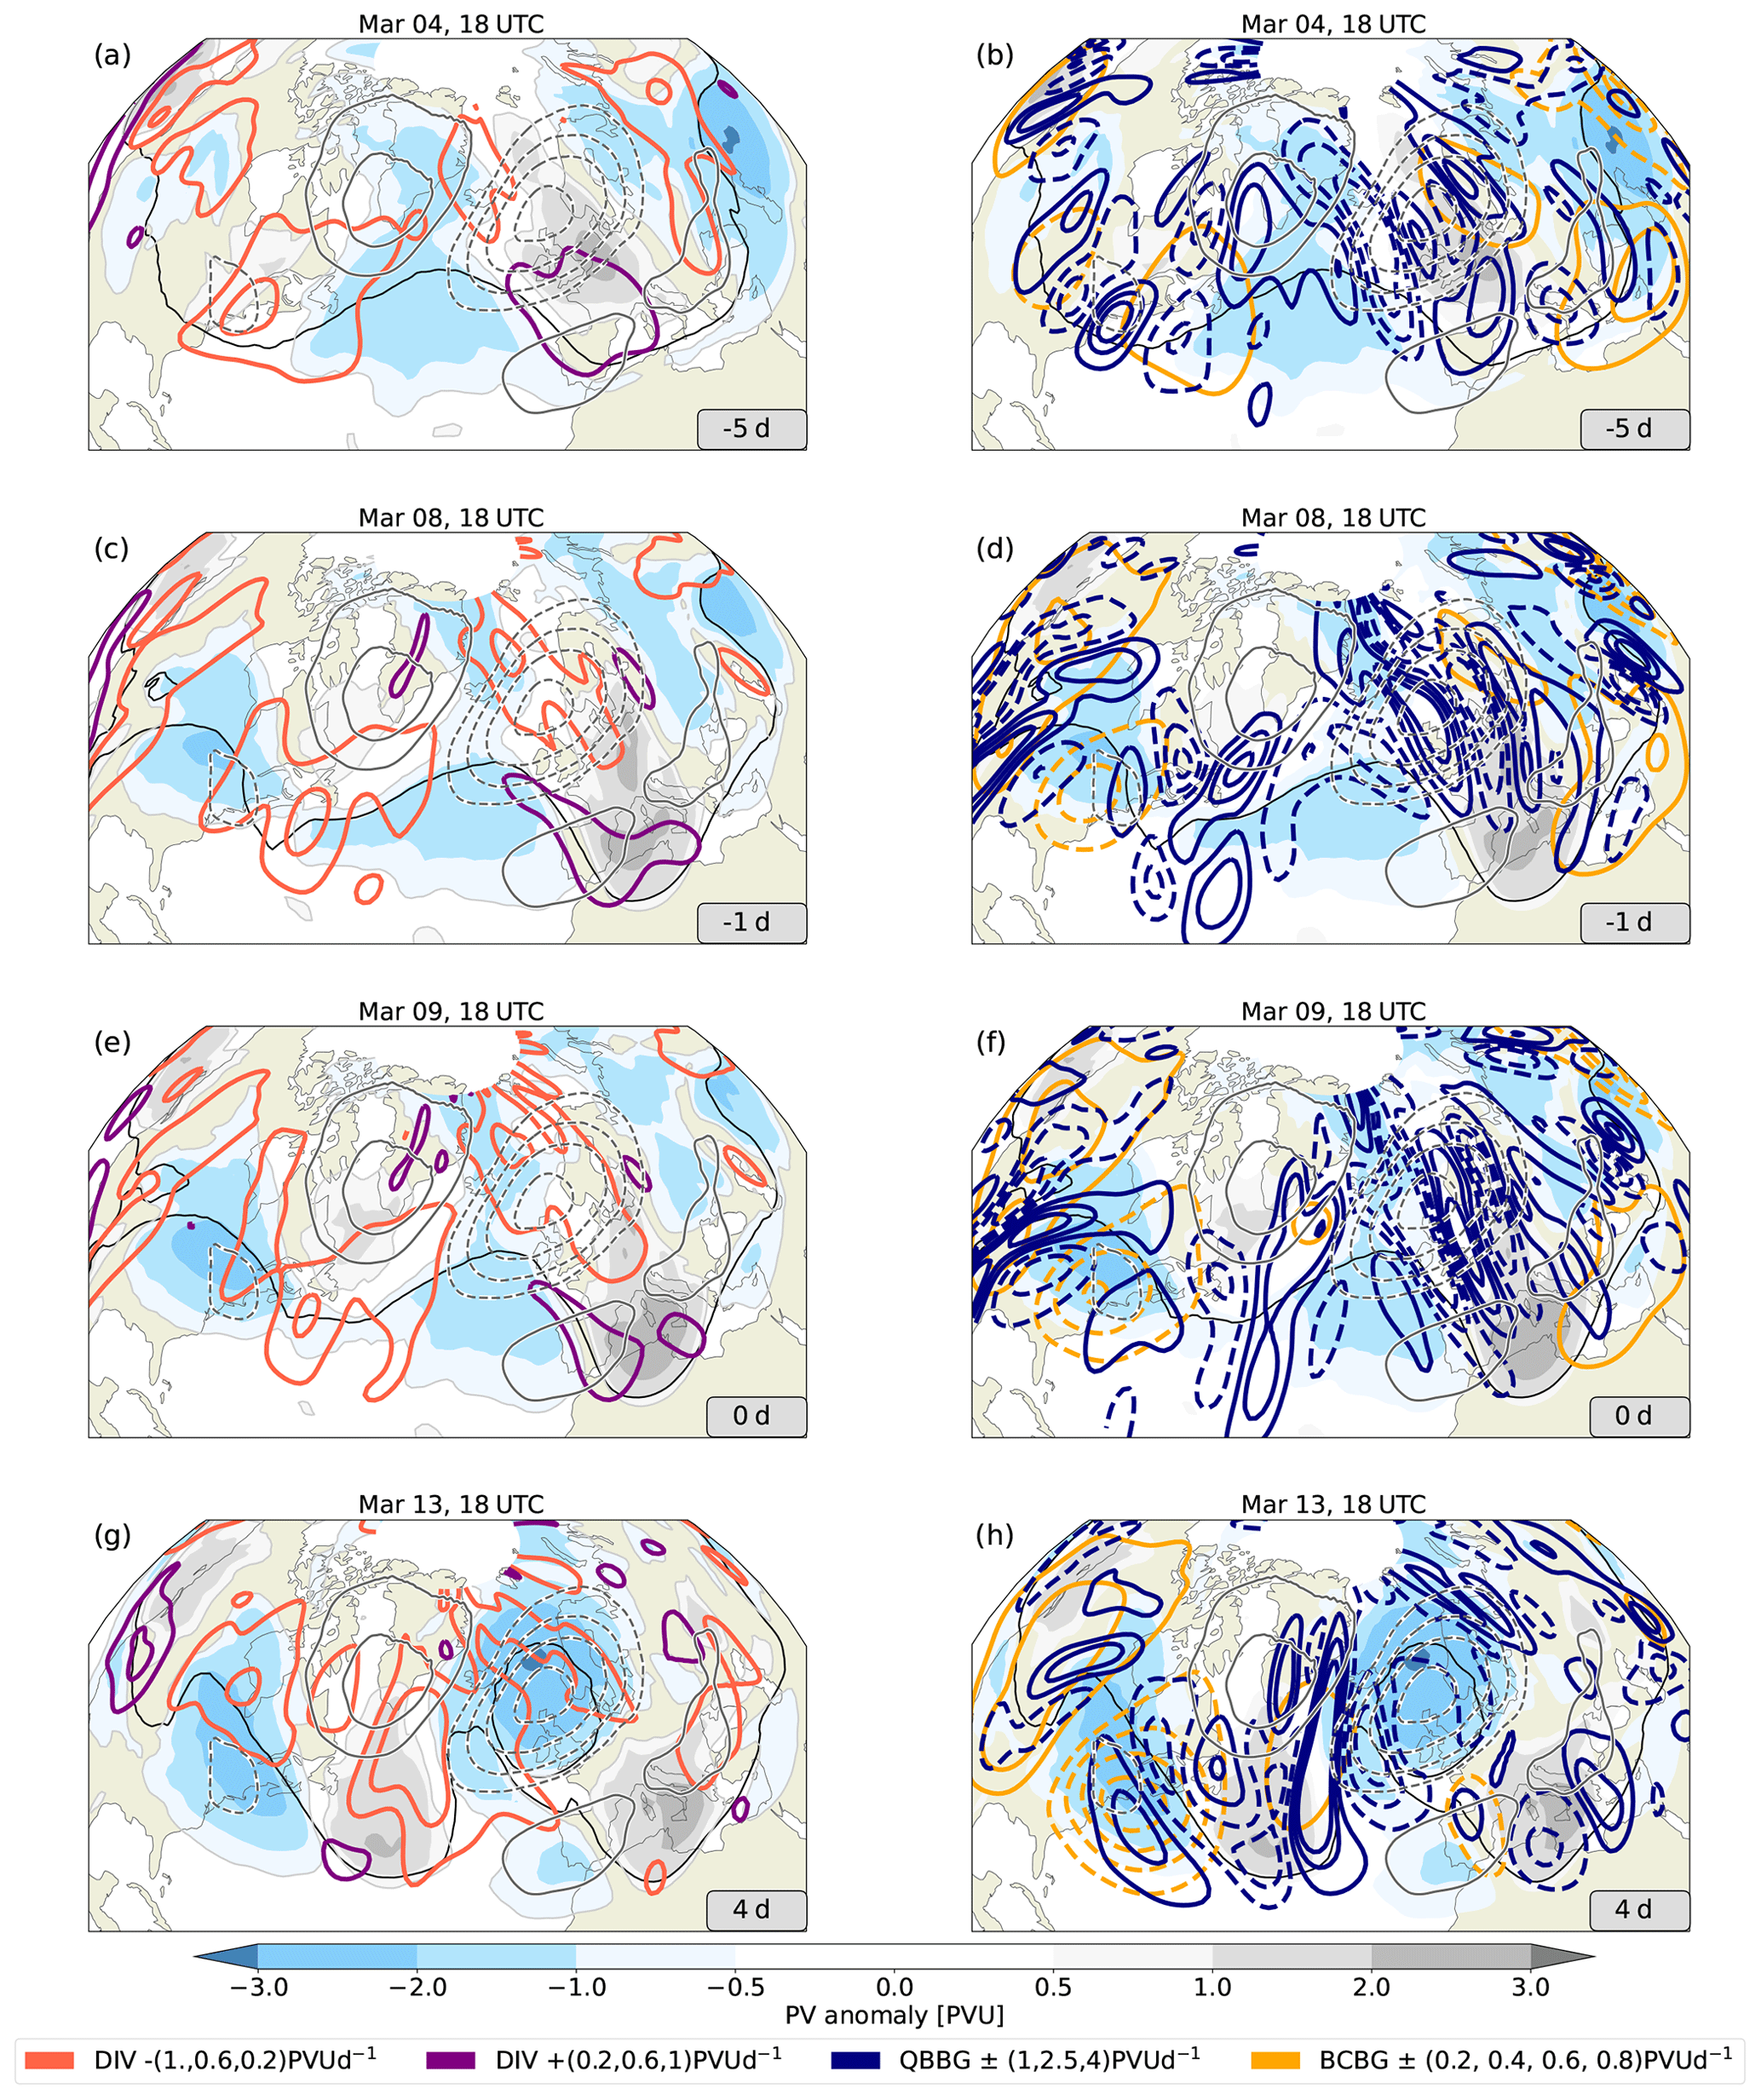
Figure 7Snapshots of the low-frequency PV evolution around the EuBL regime life cycle. Low-frequency PVAs (315–325 K averages) are shown in shading (in PVU), the 2 PVU contour is shown as a thick black line, and the thin dark-gray lines show the EuBL regime pattern used to project the PV tendencies and PVAs into (dashed for negative and solid for positive). Divergent PV tendencies are smoothed by a Gaussian filter and shown by contour lines in the left column (see lower left color bar). Blue contour lines point to quasi-barotropic PV tendencies and yellow contour lines to baroclinic PV tendencies in the right column (see color bar in the lower right). For the quasi-barotropic and baroclinic tendencies, solid (dashed) contour lines display positive (negative) PV tendencies. The snapshots are shown for 5 d before onset (a, b), the day before onset (panels c and d), onset (e, f), and 4 d after onset (g, h). The selected time steps are marked as vertical gray lines in the projection timeline in Fig. 6.
The most dominant contribution to the regime pattern evolution around the onset arises from linear wave dynamics as described by the quasi-barotropic PV tendency (Fig. 6a). As discussed in Sect. 2.2, this PV tendency term describes the residual of the (westward) intrinsic phase propagation and the eastward advection of PVAs by the background flow. During the considered period, the latter term dominates, and thus the downstream advection of PVAs is of crucial importance for the onset of the regime pattern. We have already shown in Sect. 3 that the negative PVA (), which later represents the block over Europe, forms upstream. Considering negative and positive PVAs separately, the propagation of this from upstream to the target region is reflected in large values of the quasi-barotropic tendency in the projection (Fig. 6c) and amplifying quasi-barotropic tendencies in the ridge of the regime pattern (Fig. 7d, f). A consistently positive contribution from the quasi-barotropic term for the cyclonic part of the regime pattern underlines the propagation of positive PVAs, but the contribution is much smaller (Figs. 6b and 7d, f). Baroclinic PV tendencies are predominantly associated with the maintenance of the regime pattern but do not play a leading role in its onset (Fig. 6a). However, they become important in counteracting other PV tendency terms towards the end of the life cycle. The contributions to the full regime pattern arise predominantly from the anticyclonic part of the regime pattern, suggesting a contribution to the amplification of the ridge over Europe (Fig. 6c). However, a closer look at the spatial pattern reveals that the baroclinic term contributes to the secondary anticyclonic part of the regime pattern located over the US East Coast and not to that related to the block itself (Fig. 7f and h). The divergent PV tendencies are of further importance in the onset stage of the EuBL regime pattern and show their maximum positive contribution to the onset of the pattern around 9 March, 18:00 UTC (Fig. 6a). Divided into the anticyclonic and cyclonic parts of the regime pattern, the divergent term almost exclusively contributes to the former and weakens the latter, with a large contribution to the regime decay in the second half of the regime life cycle (Figs. 6b, c and 7c, e, g). Negative divergent PV tendencies overlap with the cyclonic regime pattern over the central North Atlantic at that time (Fig. 7g), which could be related to the onset of the subsequently established Atlantic ridge regime pattern (Fig. 3).
Nonlinear processes as diagnosed by the convergence of nondivergent eddy fluxes have been the focus of many previous studies. In this case, they are negative, such that they support neither the onset nor the maintenance of the pattern in the current case and are consistently associated with the decay of the regime pattern (Fig. 6a). A clear minimum is visible in the separate consideration of the anticyclonic part of the pattern around the onset, where nonlinear processes such as wave breaking are associated with a decay of the regime pattern (Fig. 6c). Note, however, that the eddy fluxes may still help to maintain the regime pattern by reducing the strength of the westerly flow upstream (Illari, 1984). A dipole pattern associated with the eddy fluxes that indicates such a reduction is found in the average over many cases of Greenland blocking (Teubler et al., 2023).
When the two diabatic PV tendency terms – radiative and non-radiative tendencies – are considered together, their effect on the regime onset and decay cancels out almost completely (Fig. 6a). The radiative tendency strengthens the cyclonic part of the regime pattern and weakens the anticyclonic part (Fig. 6b and c). Thereby, the projected tendency is almost constant and changes only slowly, indicating that the radiative diabatic tendency is not closely linked to the mechanisms governing the regime evolution. While non-radiative diabatic tendencies are associated with a decay of the cyclonic regime part, they strengthen the anticyclonic part of the regime, suggesting that these tendencies are dominated by latent heat release.
The Eulerian perspective elaborates on the importance of the advection of existing PVAs by the background flow in the onset stage of the EuBL regime pattern. From this perspective, divergent PV tendencies have a non-negligible effect in building up the anticyclonic part of the regime. However, the Eulerian perspective misses the processes associated with the development of PVAs advected into the region. Further insights into the evolution of these PVAs can be gained by tracing the PVAs that are advected into the region, especially the negative PVAs associated with the anticyclonic part of the pattern over northern Europe ('s).
4.2 Quasi-Lagrangian PV perspective
The quasi-Lagrangian perspective focuses on traced anticyclonic PVAs in the Northern Hemisphere ('s) that contribute to a blocked regime life cycle and their amplitude evolution. In contrast with the low-frequency Eulerian perspective above, here we consider the instantaneous PV evolution. We will first discuss the track of the main (already indicated in light-green contours in Fig. 5), based on the center of mass coordinates and the splitting and merging events. Subsequently, we quantify the individual contributions to the amplitude evolution of the main , consider direct diabatic impacts separately, and finally conclude with a summary.
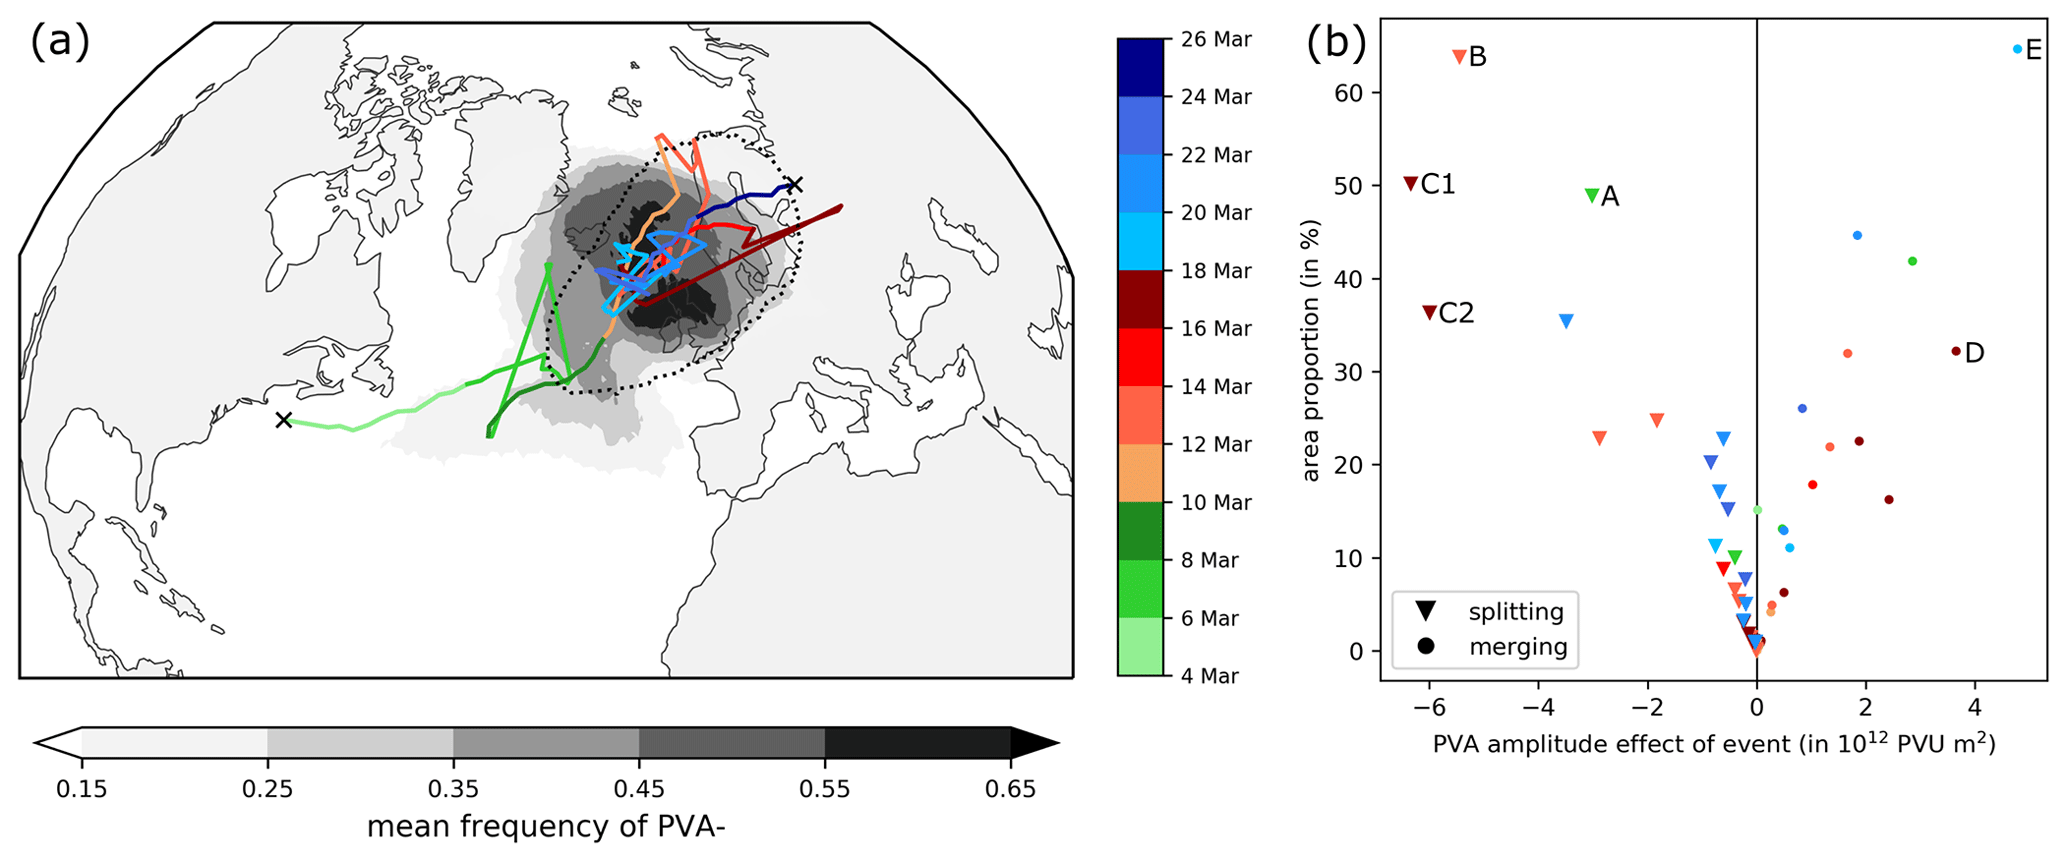
Figure 8Track of the that contributed to the EuBL in March 2016 and detected splitting and merging events along the tracks. (a) The colored line shows the track of the based on the center of mass from 4 March, 15:00 UTC–25 March, 00:00 UTC. The time information is given in color shades (green: before regime onset, red: active regime life cycle, blue: after regime decay). Jumps in the track can be attributed to abrupt changes in the center of mass due to splitting and merging events. The mean frequency of the during the time of the track (which is the percentage of the lifetime on which the overlaps a grid point) is shown in gray shading (in %). The black dotted contour highlights the regime mask of EuBL (same as in Fig. 2b). (b) Scatter plot that shows the association between the amplitude effect of a splitting (triangle) or a merging (dot) event (in 1012 PVU m2) and the area proportion of the splitting/merging and the main (in %). Each marker (triangle, dot) represents a splitting or merging event, and the marker color indicates the time of the event. Particular events mentioned in the text are labeled with capital letters (and numbers).
4.2.1 Anomaly track and splitting and merging events
From a quasi-Lagrangian perspective, the EuBL life cycle in March 2016 was dominated by a single , which we identified from 4–25 March. The was first identified over the US East Coast 5 d before regime onset and propagated northeastwards (Fig. 8a). With the start of the EuBL life cycle on 9 March, the settled into a quasi-stationary position over northern Europe (illustrated by the maximum in frequency, Fig. 8a). At the time of the regime decay, the started to migrate further to the northeast. The end of the anomaly's life cycle was reached 7 d after the regime decay.
Abrupt changes in the track of the main are evident in Fig. 8a, which are mainly due to splitting and merging events. These events cause sudden changes of the amplitude and area, which in turn may prominently impact the position of the anomaly's center of mass. Our novel tracking algorithm in the quasi-Lagrangian perspective (Sect. 2.5, Fig. A1) is designed to detect and quantify the effect of these events. An overview of all splitting and merging events is provided in Fig. 8b. For approximately half of the events, the impact on the area and area-integrated amplitude of the main 's is small (relative area change < 15 %). Other events, however, are accompanied by a significant change in area and amplitude and lead to jumps in the track. For example, the prominent southward jump in the track around 7 March can be attributed to a splitting event, in which the northern part of the area that makes up approximately 50 % of the splits off (Fig. 8a and b; light-green triangle with the label “A”) and propagates towards the north (not shown). Another example is the merging event on 19 March (Fig. 8b; light-blue dot with the label “E”) when a negative PVA of remarkable size (> 60 % of the area) was fed into the existing .
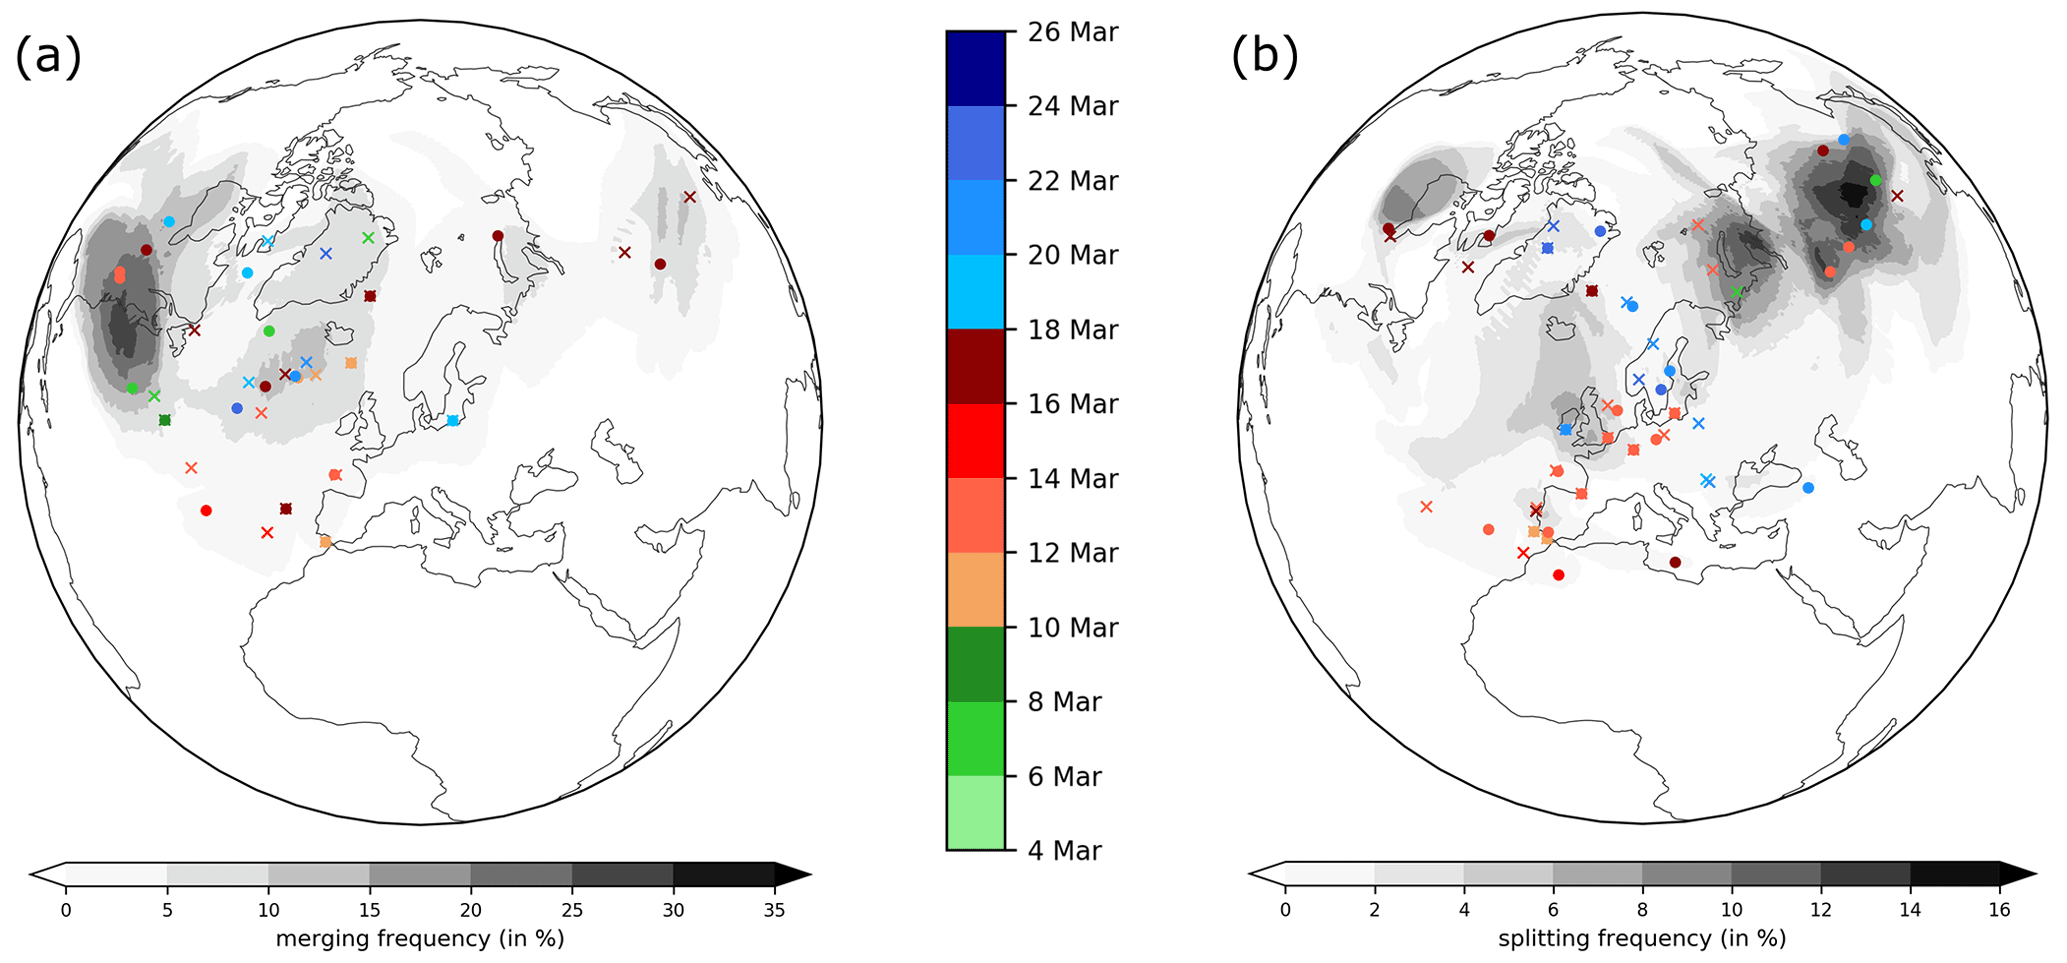
Figure 9Occurrence frequency (in %) of (a) 's that merge into the main contributing and (b) 's that separate from the main contributing . We consider all splitting and merging events that take place along the life cycle of the main . For the calculation per event, the is traced back 3 d in the case of merging or from the splitting event to 3 d later if possible. Crosses show the position (based on the center of mass) of the before they merge into the main (a) or at the time of splitting from the main (b). Points mark the position of the 's at most 3 d before the merging event or at most 3 d after the splitting event. In case of a shorter lifetime of the , the last possible (splitting) or first possible (merging) position is shown. The color indicates the time in the life cycle at which the respective event occurs.
The majority of the anomalies that merge into the main originate (up to 3 d prior to the merging event) from upstream and migrate into the main from the southwest (Fig. 9a). In contrast, the anomalies that split from the main tend to move to the east of the main anomaly downstream into northern Asia (Fig. 9b). Overall, splitting and merging events can have a substantial impact on the amplitude evolution. For the first time, we can quantify this impact and compare the role of these events with other processes that impact the amplitude evolution.
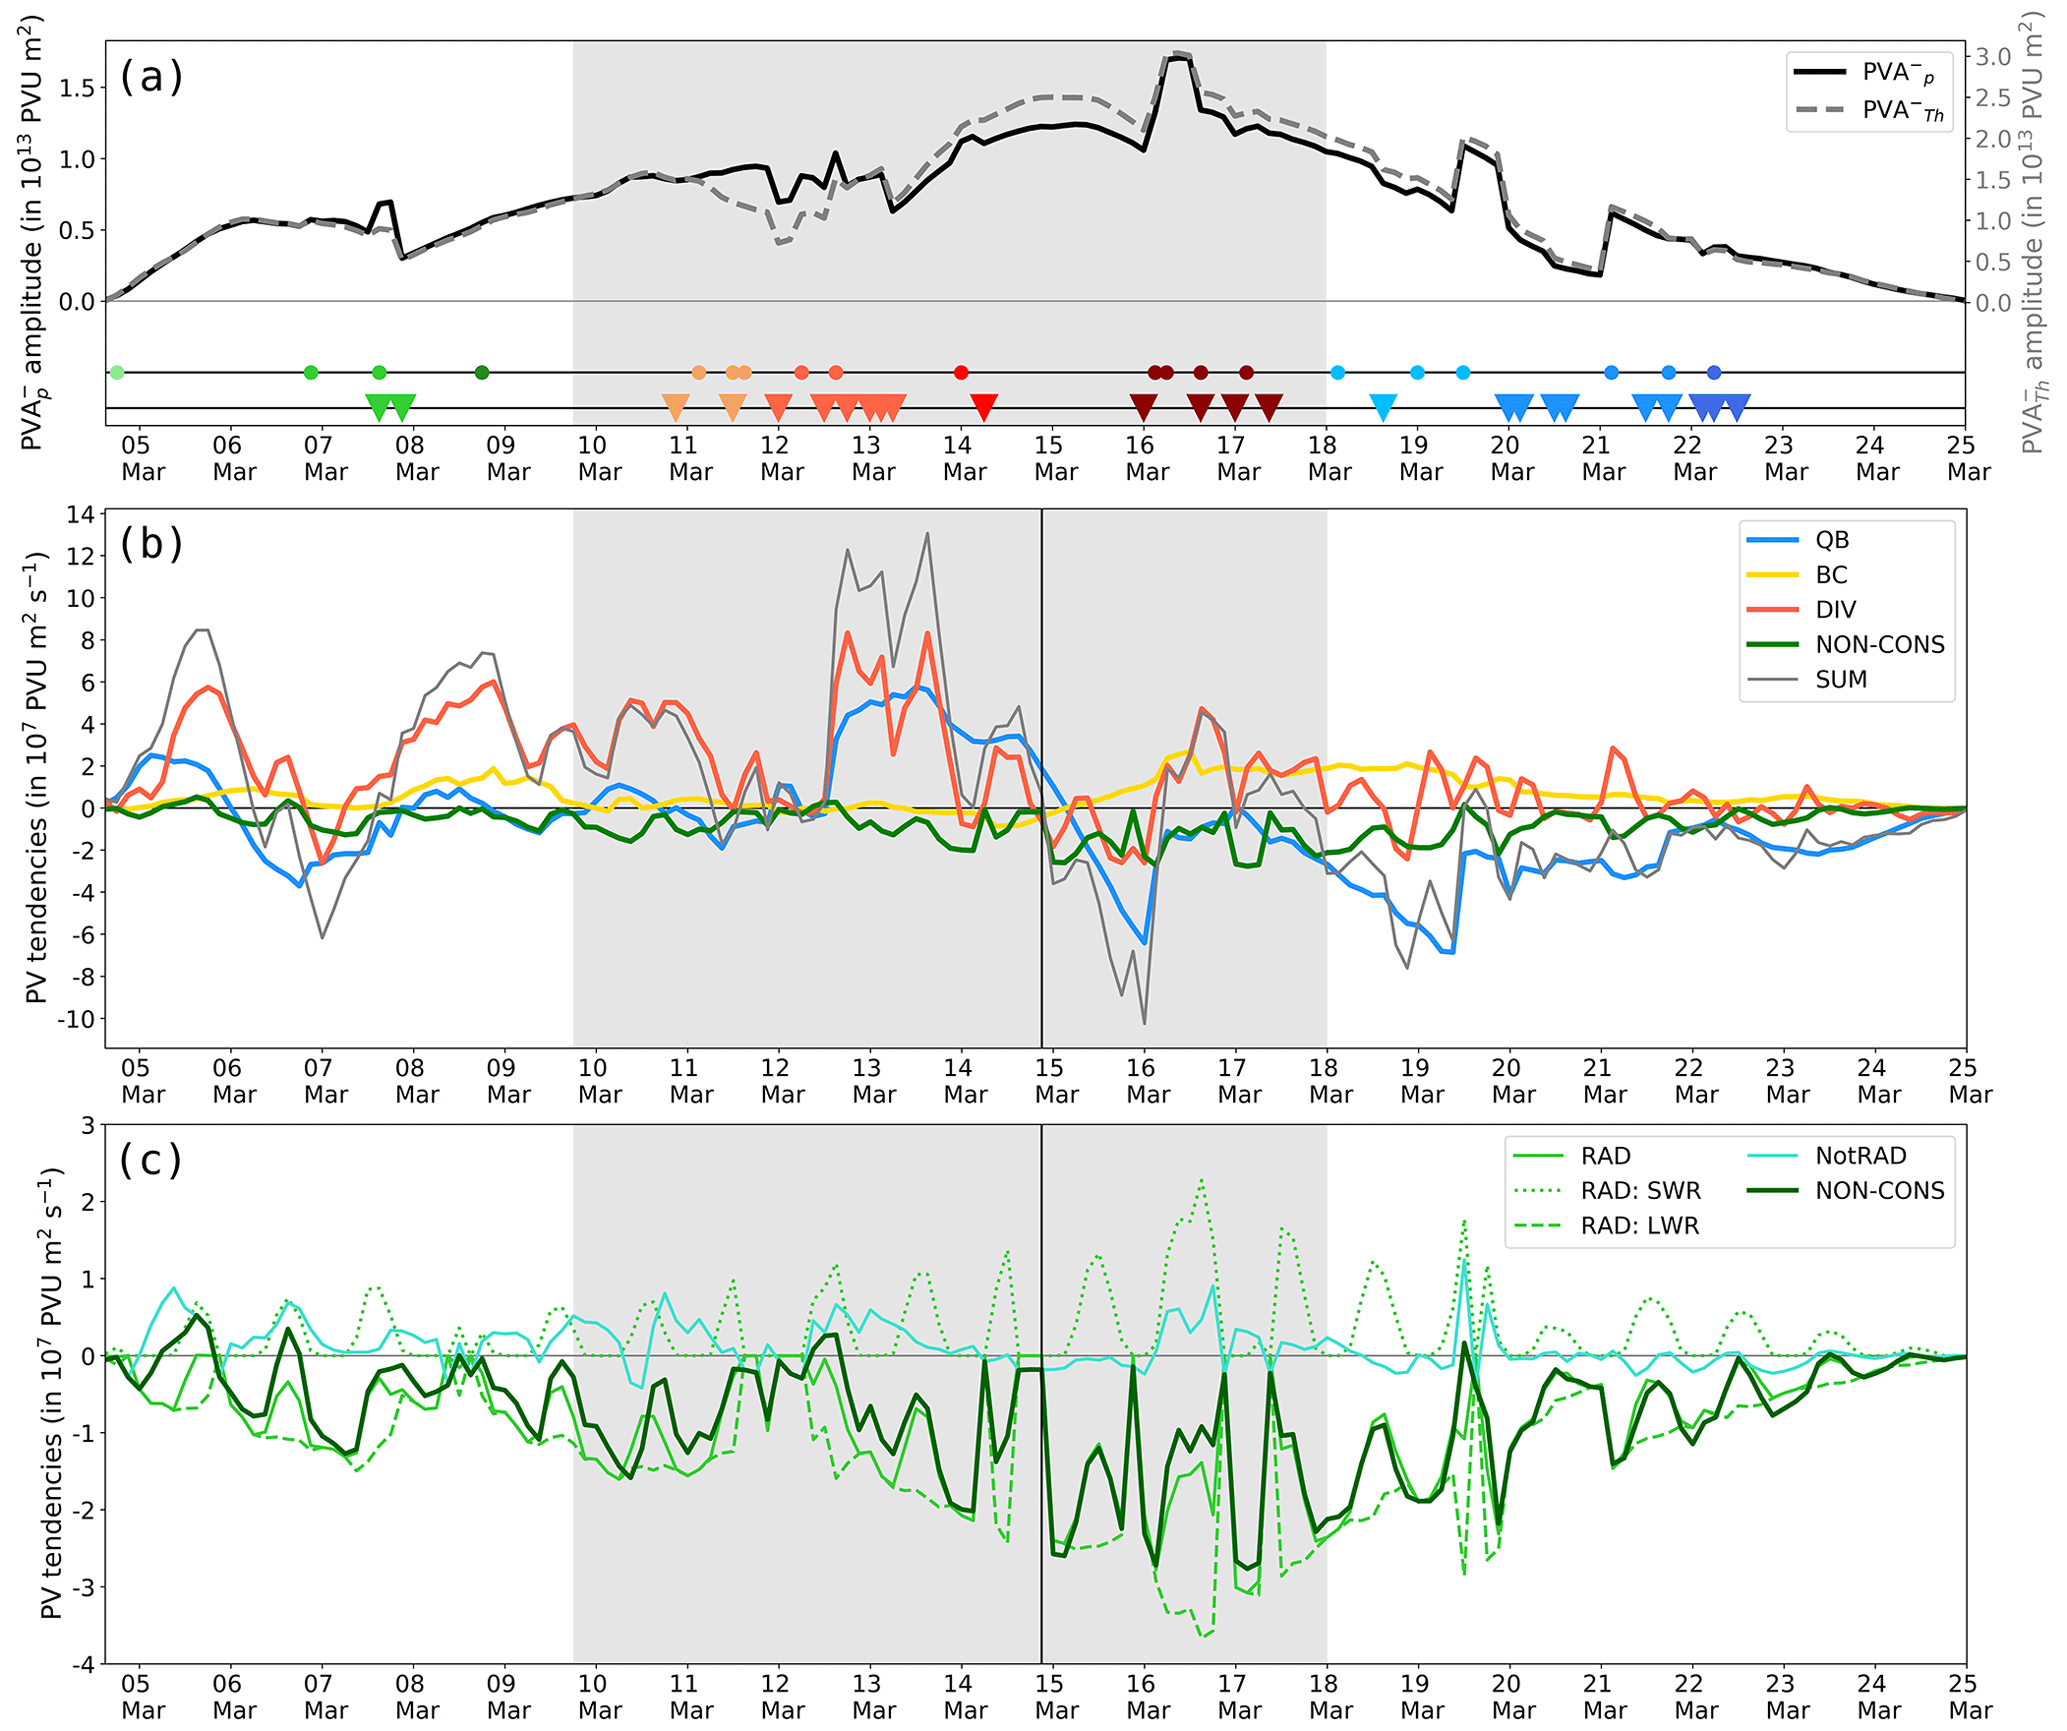
Figure 10Process contributions to the amplitude evolution of the main associated with the EuBL episode in March 2016. (a) Integrated amplitude in terms of isentropic layer average (315–325 K, dashed gray) and pressure layer average (500–150 hPa, solid black) for the lifetime of the . Colored symbols along the two horizontal lines in the lower half of the panel mark the occurrence of splitting (triangles) and merging (dots) events. The color of the markers points to the timing of these events (see color bar in Figs. 8 or 9). (b) Integrated PV tendency terms for that contribute to the amplitude evolution: quasi-barotropic term (QB, blue), baroclinic term (BC, yellow), divergent term (DIV, red), non-conservative term (NON-CONS, green), and the sum of all terms mentioned before (SUM = QB + BC + DIV + NON-CONS, gray). (c) Division of the non-conservative PV tendency term (NON-CONS, solid dark green) into its various components: non-radiative part (NotRAD, solid turquoise) and radiative part (RAD, solid light green). The radiative term is further partitioned into the non-conservative PV tendency by shortwave radiation (RAD: SWR, dotted light green) and by longwave radiation (RAD: LWR, dashed light green). Note the sign convention here is that positive tendencies signify a strengthening of amplitude. The period of the active EuBL life cycle is shown in all panels in gray shading, and the vertical black line in panels (b) and (c) marks the date used to split up the EuBL life cycle in two episodes for the analysis presented in Fig. 11. Note the different y-axis ranges between panels (b) and (c).

Figure 11Net effect of PV tendencies on the amplitude evolution of the for different periods within the lifetime. All contributing PV tendency terms from Eq. (9) (except ) are summed up over four different periods (from left to right): (a) before EuBL onset (4 March, 15:00 UTC–9 March, 15:00 UTC), (b) active EuBL life cycle part I (9 March, 18:00 UTC–14 March, 21:00 UTC), (c) active EuBL life cycle part II (15 March, 00:00 UTC–18 March, 00:00 UTC), and (d) after EuBL decay (18 March, 03:00 UTC–25 March, 00:00 UTC). To account for the different lengths of the periods, we divide the sums by the number of time steps in the period. Note that the PV tendency term of Eq. (9) is not shown here because it is so small that it does not affect the amplitude change.
4.2.2 Amplitude evolution
To quantify the processes that govern the amplitude evolution of , Eq. (9) is evaluated on isentropic levels. Following Teubler and Riemer (2016, 2021), we will particularly focus on the four PV tendency terms on the first row in Eq. (9) when we discuss the temporal evolution in the following. However, for the sake of completeness, the temporal evolution of the remaining terms in Eq. (9) (second row) is shown in the Appendix (Fig. B1). The net effect of all individual PV tendency terms on the amplitude evolution for different phases is illustrated in Fig. 11.
Overall, the quantitative agreement between the amplitude evolution of evaluated on the pressure levels between 500 and 150 hPa and the isentropic levels between 315 and 325 K is very good (Fig. 10a). The amplitude increases from 4–16 March, with a peak in the amplitude in the last third of the EuBL regime life cycle. Subsequently, the amplitude weakens until the end of its life cycle on 25 March. Abrupt changes in the amplitude are due to splitting and merging events (marked at the bottom of Fig. 10a). Small qualitative differences in the evolution occur around 7–12 March, when the is located far north of the higher latitudes. These differences occur because the data set used for isentropic amplitude evolution is limited to 80∘ N (see Sect. 2.2), whereas the data set used for the pressure-level-based amplitude evolution does not face these limitations. Around peak amplitude and early during the decay (14–20 March), the isentropic-based amplitude is more pronounced than the pressure-based , which suggests that the chosen isentropic layer encloses (in particular) the strong core of the more accurately than the layer based on pressure levels.
We define the first phase of the 's life cycle as the period before the onset of the blocked regime, i.e., from 4–9 March. A net amplification is evident during this phase (Fig. 10b), which is by and large dominated by divergent PV tendencies (Figs. 10b and 11a). Two distinct episodes of intensification due to the divergent tendency occur on 4–6 and 7–9 March (see WCB intersection points in Fig. 5a and b), both associated additionally with local maxima in the baroclinic tendencies. This signature indicates moist-baroclinic coupling (Teubler and Riemer, 2021). As further discussed in Sect. 4.3, both episodes are associated with prominent WCB activity of an extratropical cyclone upstream, providing some evidence that the pronounced amplification due to the divergent tendency is in this case indeed coupled with latent heat release and can thus be considered as an indirect diabatic impact. Quasi-barotropic PV tendencies govern the very early amplification of the (Fig. 10b), suggesting that the trough sitting over the eastern part of the US makes an important contribution to the formation of the incipient through northward advection of low-PV air into the downstream region. The net impact of the quasi-barotropic tendencies during the first phase, however, is small and negative (Fig. 11a), which is due to the period of negative tendencies around 7 March (Fig. 10b). The net impact of the boundary term BND during the first phase is slightly negative (Fig. 11a). Although the area is growing and experiences various merging events from its first detection until the EuBL onset, the aforementioned splitting event on 7 March (Fig. 8b, green triangle with the label “A”) seems to dominate the net effect (Fig. 11a).
We define the second phase of the life cycle as the first part of the active EuBL life cycle from 9 March, 18:00 UTC–14 March, 21:00 UTC. Our motivation to define 14 March, 21:00 UTC as the end of this period is that (i) there is still an amplification of the amplitude, (ii) the sum of diagnosed processes in Fig. 10b turns generally negative after that time, and (iii) this choice delineates two periods with several splitting and merging events within the active regime life cycle. In general, this first part of the active regime life cycle is associated with a further general amplification of the (Figs. 10b and 11b). Same as before the onset, two major episodes occur, during which the sum of the diagnosed processes indicates prominent amplification. The first episode occurs just after the onset of the regime life cycle (10–11 March) and the other from 13–15 March (Fig. 10b). Again, the divergent PV tendency term highly dominates both amplification episodes. However, the quasi-barotropic PV tendency makes an important additional contribution to the already strongly pronounced divergent PV tendencies in the second episode (13–15 March). Throughout the entire life cycle, both tendency terms show a clear maximum contribution from 13–15 March. The net effect of both divergent and quasi-barotropic PV tendencies is positive, with a distinct stronger net effect in the divergent PV tendencies pointing to the importance of moist processes in the first part of the active EuBL regime life cycle (Fig. 11b). The baroclinic PV tendency has a negligible impact in this phase with no net effect at all. The net effect of BND is again negative and rather small as for the first phase prior to the onset. A variety of splitting and merging events take place (Figs. 8b and 10a) that lead to huge values in the second term within BND that describes the area change by the movement of the boundary. The major splitting event on 13 March (Fig. 8b, the orange triangle with the label “B”) is most probably responsible for the net weakening effect of BND. Note that the rather high signal of RES might be attributed to the fact that the area extends north of the PV inversion region, where marginal effects of the piecewise PV inversion arise (Figs. 11b and B1b).
The second part of the active blocked regime life cycle (15–18 March) is characterized by a negative net impact of the diagnosed tendencies (Figs. 10b and 11c). This net impact heralds the eventual decay of the . In contrast with the first part of the active life cycle, the quasi-barotropic tendency now makes a major contribution to the weakening of the . The baroclinic tendency, negligible during the first part of the active life cycle, turns persistently positive after the quasi-barotropic tendency turns negative on 15 March and thus constitutes the main contribution to counteracting the weakening of the (Fig. 10b) in the second part of the regime life cycle. This positive contribution of baroclinic PV tendencies leading to the amplification of indicates incipient downstream moist-baroclinic development (more on this in Sects. 5.1 and 5.2 in Teubler and Riemer, 2021). The divergent PV tendency is of less importance than before but still shows a small positive net impact (Fig. 11c). The term that describes the advection of background PV with the background wind (labeled as BGA) has a negligible but consistently positive effect on the amplitude (Fig. B1b), resulting in an overall positive net effect on the strengthening of the amplitude. In contrast with the two phases before, BND has a strong negative net effect on the second part of the active regime life cycle (Fig. 11c). Generally, strong deformation of the that is accompanied by several splitting and merging events, which contribute to sudden noticeable changes in amplitude but also to substantial relative changes in the area of the between 30 % and 50 % (in particular the two splitting events C1 and C2 and the merging event D in Fig. 8b), occurs during this phase (not shown).
In the final decay phase of the (18–25 March), most of the tendencies exhibit similar characteristics as during the second part of the active life cycle. The quasi-barotropic tendency contributes strongly to the weakening, most probably because of the beginning deformation of the after the regime decay. The divergent and, in particular, the baroclinic tendencies make positive contributions, which decay strongly in the last days before the end of the life cycle (Figs. 10b 11d). The BND term again exhibits a strong negative net effect after regime decay, pointing to a degrading contribution as the decreases in size towards the end of the life cycle (not shown). Several splitting and merging events take place, with the number of splitting events being predominant (Fig. 8b).
4.2.3 Direct diabatic impact
The direct diabatic tendency, i.e., the direct impact of non-conservative processes, is predominately negative, and the absolute value is in general smaller than that of the advective PV tendencies throughout the life cycle (Fig. 10b). Longwave radiation dominates this direct diabatic weakening of the (Fig. 10c), as expected from idealized considerations (Zierl and Wirth, 1997) and consistent with the impact of longwave radiative cooling on ridges within Rossby wave packets (Teubler and Riemer, 2021). Teubler and Riemer (2021) provided a rough estimate that one-third of the longwave radiative tendencies may be associated with cloud-radiative effects, whereas the majority of the signal was interpreted as a large-scale “background” signal. In addition, these authors demonstrated that the longwave radiative tendency roughly scales with the amplitude of the PVA, which is consistent with the observed minimum of the tendencies at the peak time of during the second part of the active EuBL regime life cycle. Shortwave radiation counteracts the weakening and, unsurprisingly, exhibits a distinct diurnal cycle.
The non-radiative diabatic tendencies are mostly positive. The dominant amplifying diabatic tendencies within the ridges are due to latent heat release (e.g., Chagnon et al., 2013; Teubler and Riemer, 2021), suggesting that latent heat release also has a (small) positive direct impact on the onset of the EuBL regime life cycle in March 2016. The overall net impact of all direct diabatic tendencies on the amplitude evolution is, however, negative and smaller than the net impact of the advective tendencies (Fig. 11).
4.2.4 Synopsis of the quasi-Lagrangian perspective
The main associated with the EuBL regime life cycle in March 2016 was first identified by our tracking algorithm off the US East Coast 5 d before regime onset. Moving towards northern Europe, the underwent several splitting and merging events. The net impact of these events was to weaken the amplitude of the . The divergent PV tendency term dominated all amplification episodes of the , with a further substantial contribution by the quasi-barotropic tendency within the active regime life cycle. The quasi-barotropic tendency later dominates the weakening of the , counteracted by the baroclinic tendency, which becomes most relevant during the second half of the life cycle.
The by far dominant role of the divergent PV tendency in the amplification of the before the EuBL onset quantitatively supports the findings by Magnusson (2017) and Grams et al. (2018), who argued more qualitatively that divergent WCB outflow was crucial for the onset of the block. The next section will focus in more detail on the link between the divergent PV tendency and latent heat release in WCBs from the Lagrangian perspective.
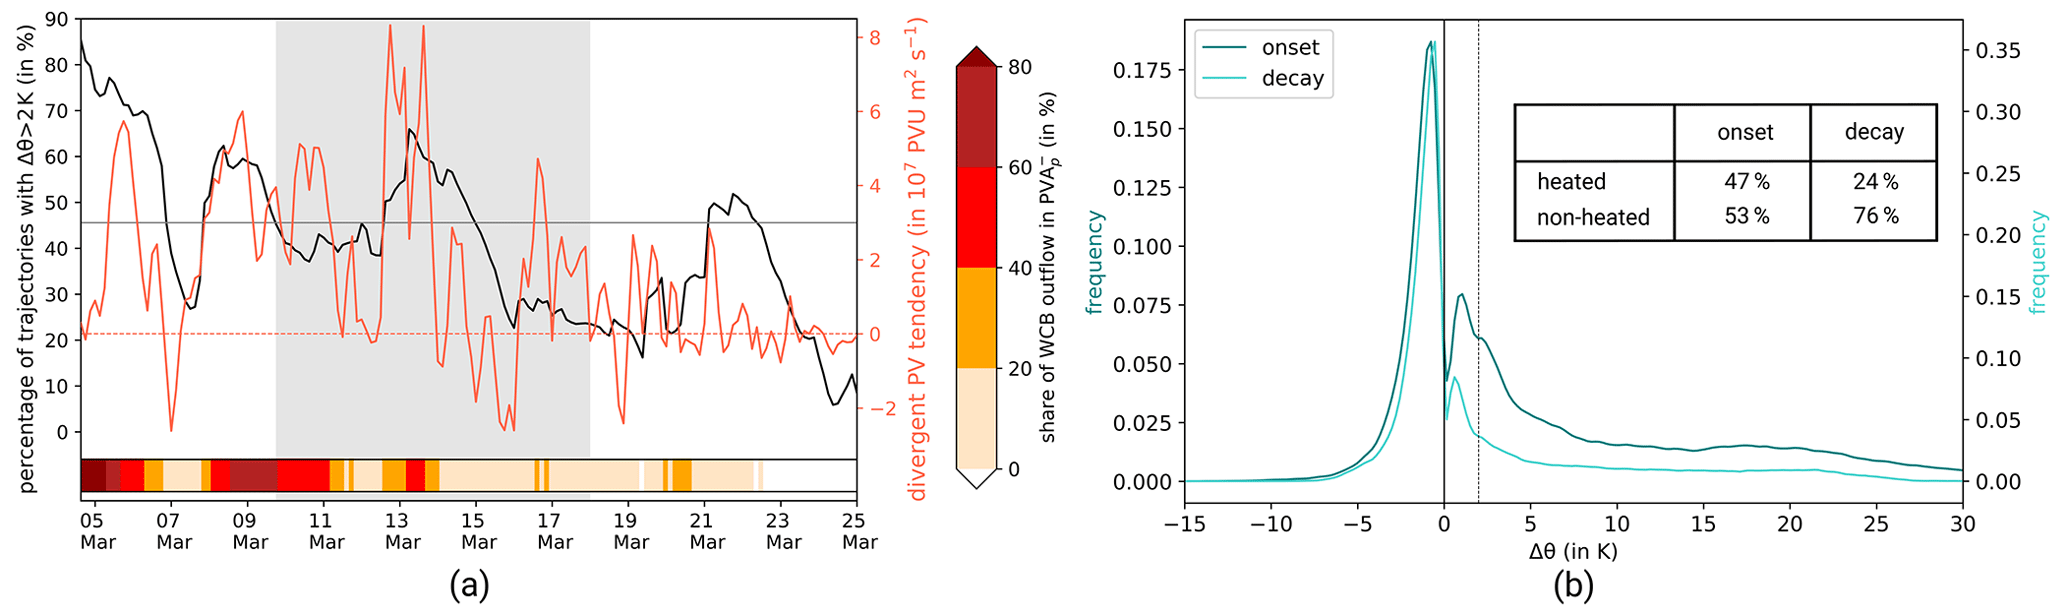
Figure 12Results of the Lagrangian perspective on the PV dynamics of the EuBL regime life cycle in March 2016. (a) Evolution of divergent PV tendencies from Fig. 10b (red line), the fraction of heated (Δθ > 2 K) 3 d backward trajectories starting in (black), and the fraction of WCB outflow within the in area (red shading, horizontal bar). Note that the divergent PV tendencies are integrated within the area for grid points with PVA < 0 PVU on the respective isentropic surfaces, while WCB outflow and the backward trajectories are included for all grid points within the area and latitudes < 80∘ N and > 25∘ N. The gray shaded area denotes the time of the active EuBL regime life cycle. See the text for the explanation of the thin gray horizontal line. (b) Frequency distribution of maximum heating and cooling rates along 3 d backward trajectories starting in ± 1 d around the onset (dark turquoise) and decay (light turquoise) of the EuBL. The vertical line (black, dashed) corresponds to the 2 K value. The table provides information on the proportion of heated (Δθ > 2 K) and non-heated (Δθ < 2 K) trajectories.
4.3 Lagrangian perspective
Here we investigate (i) the importance of WCB outflow and, more generally, (ii) the importance of latent heat release by backward trajectories starting in the from the quasi-Lagrangian perspective, following Pfahl et al. (2015) and Steinfeld and Pfahl (2019). Importance is assessed by the fraction of backward trajectories that fulfill specified criteria. The criteria that define WCB outflow are given in Sect. 2.6. For (ii), diabatically heated trajectories are defined as trajectories that experience a Δθ > 2 K. Fig. 12a compares the divergent PV tendencies from the quasi-Lagrangian perspective, integrated over the area (red) with the fraction of heated trajectories (black) and the fraction of WCB outflow (shading).
All three quantities are positively correlated over the lifetime of the , with a correlation factor between divergent PV tendencies and the fraction of heated trajectories of 0.44, between divergent tendencies and the fraction of WCB outflow of 0.57, and between the fraction of heated trajectories and the fraction of WCB outflow of 0.73. These positive correlations support the common expectation that the modification of the tropopause by upper-tropospheric divergent flow is enhanced by latent heat release in WCBs and represent a direct quantitative link between WCBs and reinforcing divergent PV tendencies within the . Most importantly, all prominent peaks of the divergent PV tendency (> 3⋅107 PVU m2 s−1, gray horizontal line in Fig. 12a) are associated with a WCB outflow fraction of at least 20 %, and vice versa. For the presented case, we can thus demonstrate with a high degree of certainty that the divergent PV tendencies are indeed an indirect moist impact and that the WCB outflow dynamically modifies the tropopause. In some periods within the life cycle (e.g., 21–23 March), we find a high fraction of heated trajectories, but the divergent PV tendency is relatively low or even contributes to amplitude weakening (Fig. 12a). One explanation is that the timing and, in particular, the exact location where diabatic heating occurs along the 3 d trajectory is essential, as this ultimately shapes the effect on the PV distribution within the . Thus, if the trajectory experiences the ascent and thus the period of maximum heating so early that it reaches the upper troposphere outside of the and migrates nearly horizontally into the PV anomaly, the effect on the amplitude amplification is much smaller than if the trajectory experiences its ascent directly in the immediate vicinity of the .
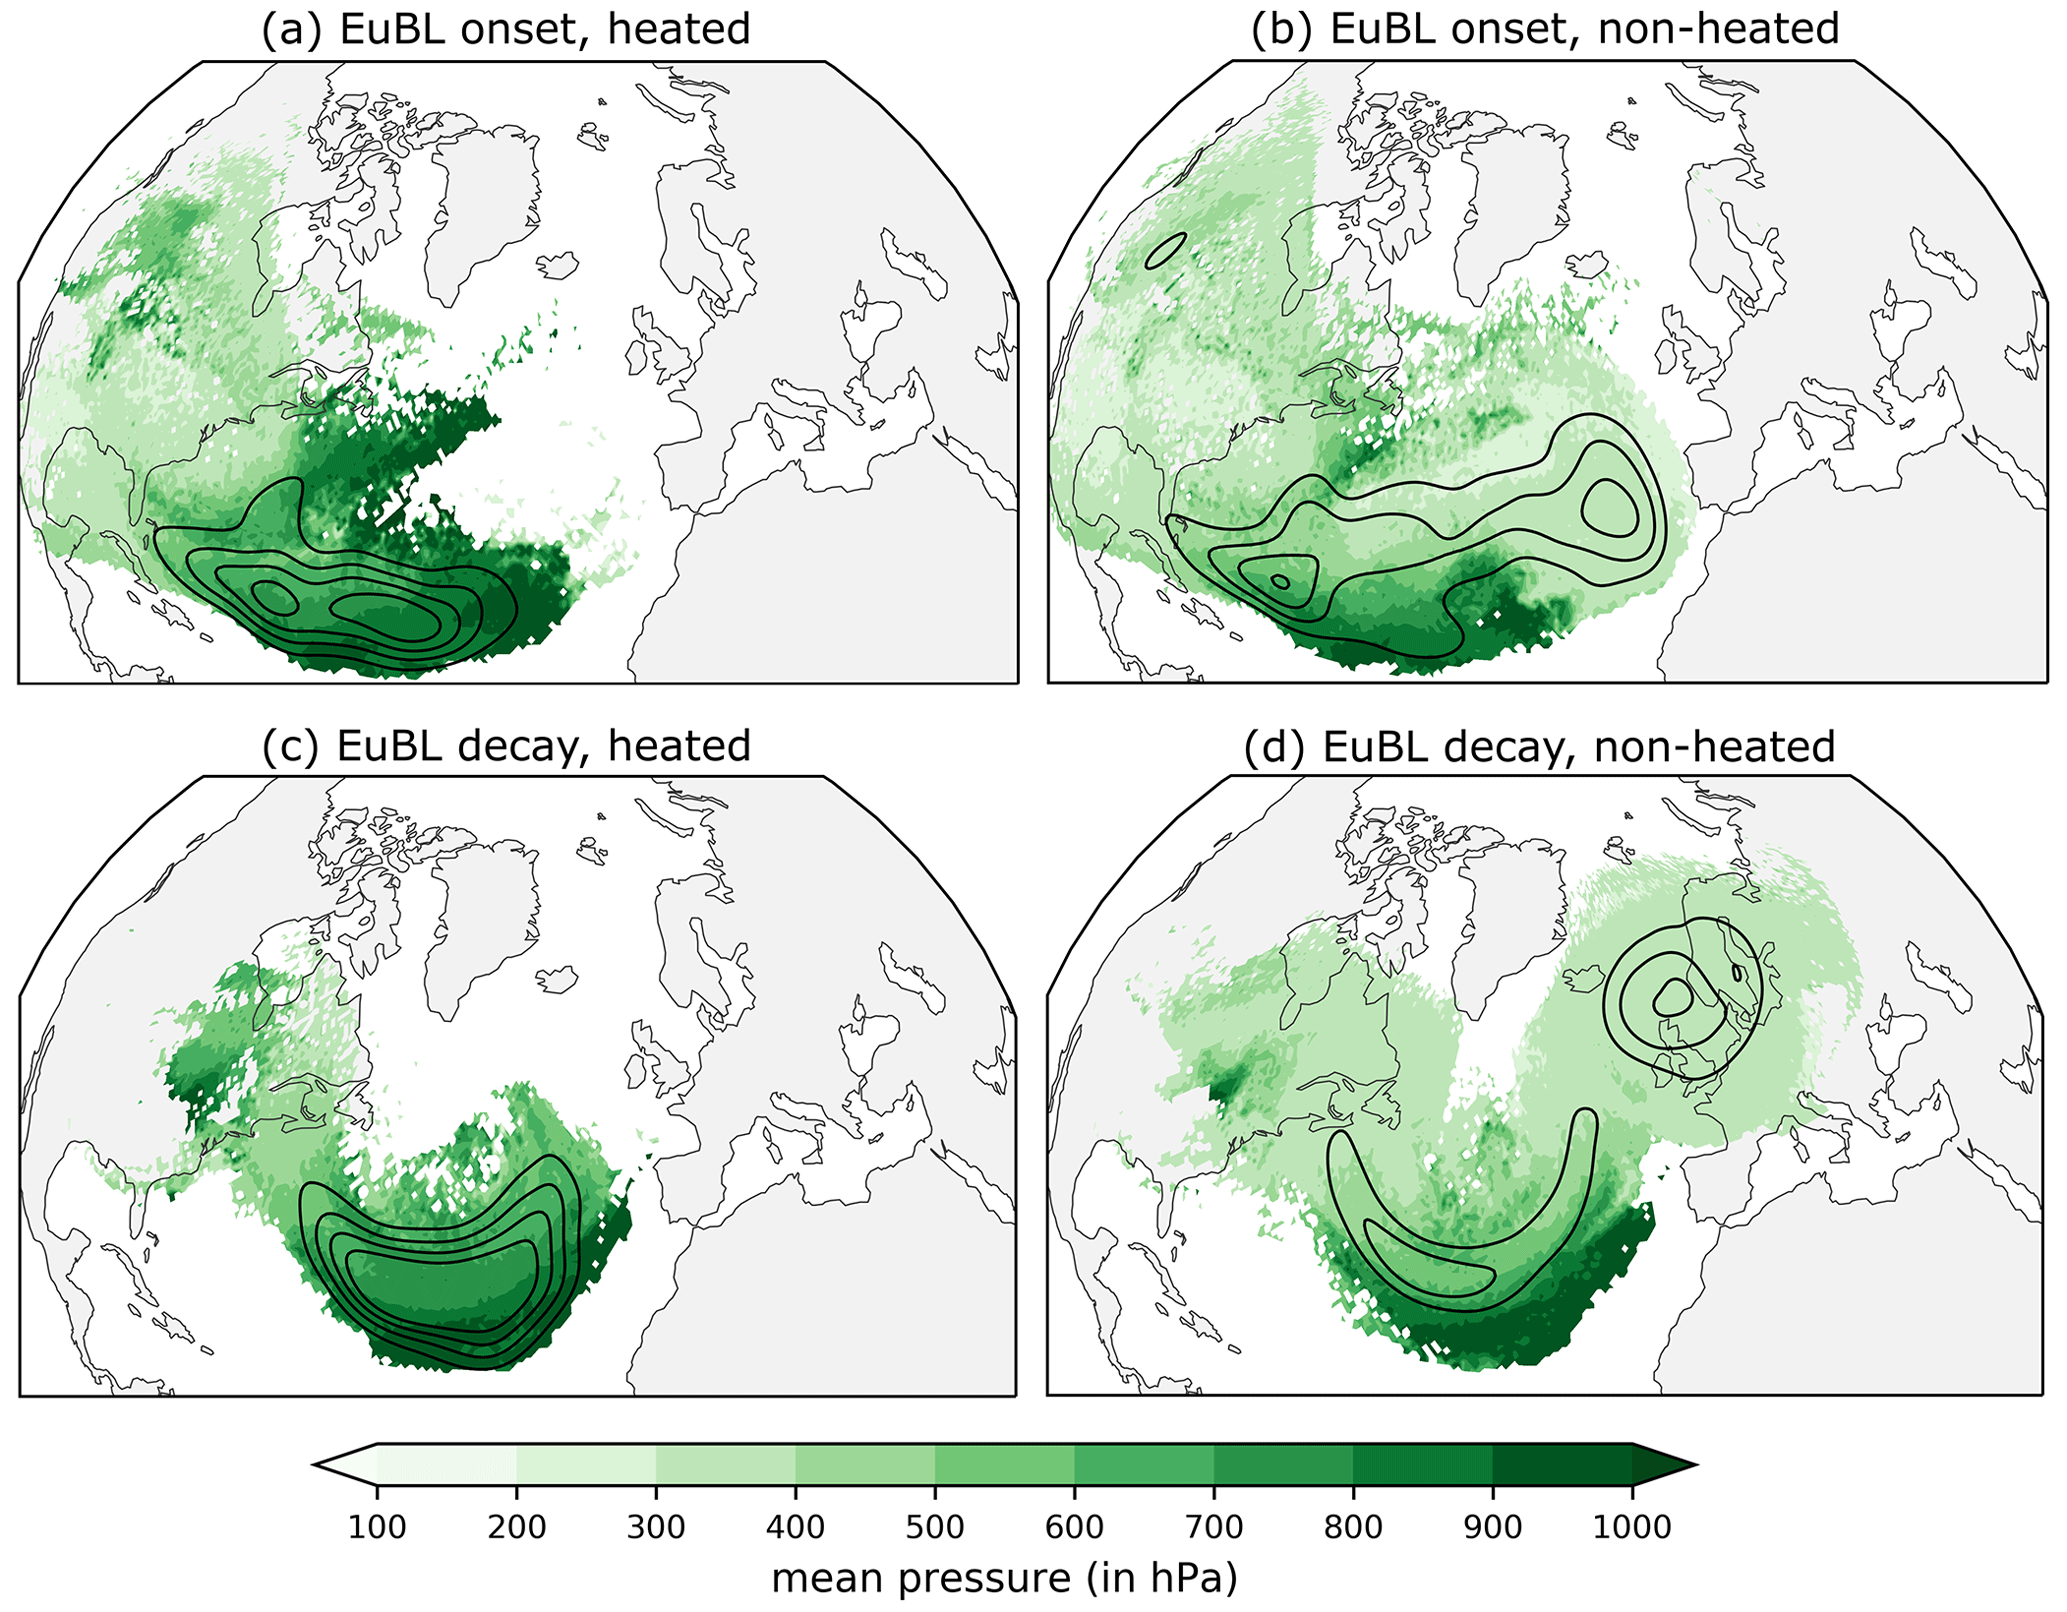
Figure 13Origin of air parcels that end up in the around the EuBL onset (upper row) and the decay (lower row). The origin of air masses is shown separately for diabatically heated trajectories (Δθ > 2 K) and non-heated trajectories. We take into account all 3 d backward trajectories out of the in the time window ± 1 d (Δt = 3 h) around the EuBL onset and decay. The pressure of the air parcels associated with the trajectory (in hPa) is shown at time t = −3 d in green shading. If there are several air parcels at the same grid point (by considering several times), we display the mean pressure. The occurrence frequency is shown in black contours for the heated trajectories in steps of 1.5, 2.5, 3.5, and 4.5 × 10⁻² and for the non-heated trajectories in steps of 1.0, 1.5, 2.0, and 2.5 × 10⁻². For a clearer visualization, the field has been Gaussian filtered with σ = 4. See Sect. 2.6 for more information on the backward trajectory calculations.
We further follow Steinfeld and Pfahl (2019) and investigate the distribution of the maximum heating and cooling rates along the 3 d backward trajectories that are started from the ± 1 d around the onset and decay of the EuBL (Fig. 12b). Additionally, we analyze the spatial origin of the diabatically heated and non-heated backward trajectories separately (Fig. 13). As in Steinfeld and Pfahl (2019), we see a broad heating regime with values as high as Δθ > 20 K within 3 d and a narrow non-heated regime with values as low as Δθ < −5 K. Most 3 d backward trajectories (53 % around the onset and 76 % around the decay) experience diabatic cooling before they arrive in the , most probably due to longwave radiative cooling. Around the EuBL onset, a high fraction of these air parcels are located upstream of the in the mid or upper troposphere and probably reach the by adiabatic advection (Fig. 13b). In comparison, we see in Fig. 13d in addition to the adiabatic advection of air parcels from upstream some recirculating air parcels in the upper troposphere that are already located within or near the .
The substantially increased fraction of heated trajectories around onset (47 %) compared to around decay (24 %) in Fig. 12b demonstrates the importance of diabatic heating for the development and strengthening of the in an earlier stage of the life cycle from the Lagrangian perspective. Concerning the spatial origin of the heated trajectories, we identify the southern North Atlantic as a key source region around the EuBL onset and decay (Fig. 13a and c). The position of air parcels upstream of the in the lower troposphere suggests that air parcels will most probably experience latent heat release on their ascent to the upper-tropospheric in the following 3 d.
The Lagrangian perspective thus complements what was learned from the quasi-Lagrangian perspective and links the amplitude-enhancing divergent PV tendency contribution from the quasi-Lagrangian perspective to the occurrence of latent heating (mostly) associated with the occurrence of WCBs, which represents an important contribution, especially around the EuBL onset.
Here we discuss the three perspectives' different insights into the dynamics of the EuBL regime life cycle in March 2016 and compare our findings to previous studies. In this context, we will bring together the perspectives combined as a novel diagnostic framework for selected regime life cycle stages.
The PVAs that compose the EuBL regime pattern are advected into the region and do not build up locally over Europe. From the Eulerian perspective, the quasi-barotropic PV tendency term is the dominant contributor in the regime onset phase. The term contains two distinct processes that describe (i) the downstream PV advection by the background flow and (ii) the propagation and advection into the region by intrinsic phase velocity. In this case, the downstream PV advection by the background flow is of greater importance. This result is in line with Michel and Rivière (2011), who investigate the processes associated with transitions between different weather regimes using a stream function tendency equation. Similarly to our case, they highlight the importance of the propagation of low-frequency anomalies for the transition from a zonal to a blocked regime. In the quasi-Lagrangian perspective, the term describing the advection of anomalies is eliminated as we follow the main associated with the regime life cycle. However, the track of the indirectly informs about advection and provides important complementary spatial information which reveals that the migrates from the US East Coast into the European region from upstream.
All three perspectives identify an amplifying role of moist dynamics in the onset of the EuBL regime life cycle. From the quasi-Lagrangian perspective, pulse-like amplification phases are associated with the divergent PV tendency term in the period from the onset of the to the regime onset, representing a strong indirect moist contribution. This is confirmed by the results of the Lagrangian perspective, which show that a high fraction of the backward trajectories have a diabatic history in which air parcels ending in the were heated in the days before. Our insights into the processes at the regime onset fit well with the results of Pfahl et al. (2015) and Steinfeld and Pfahl (2019), who investigate the role of latent heat release in atmospheric blocking. They find that moist-diabatic processes play an important role during the onset of blocking, which we can confirm for our case study. In contrast, the divergent indirect moist processes do not emerge quite as prominently in the Eulerian low-frequency perspective. Even when the regime pattern is split into negative and positive PVAs, the divergent term indicates a reinforcing contribution but does not stand out as a major contributing process. While the low-pass filtering in the Eulerian framework may contribute to these differences, the main reason, however, is that the Eulerian perspective quantifies the in situ evolution of the regime pattern over Europe such that moist dynamics occurring upstream are missing and only indirectly captured by the quasi-barotropic PV tendency term. Overall, the importance of processes on different scales fits well with the findings of Woollings et al. (2018), who point to the interplay of processes on planetary and synoptic scales in blocking onset.
The maintenance of the regime, concerning the anticyclonic anomaly, is caused, among other things, by moist synoptic activity upstream that contributes to the maintenance or even further amplification of the . A high fraction of the backward trajectories from the have a diabatic history from a Lagrangian perspective, and divergent PV tendencies contribute to an amplification of the from a quasi-Lagrangian perspective. Heating appears as an indirect effect that leads to an increase in transport of low-tropospheric, low-PV air up the WCB into the , consistent with Methven (2015). The moist processes that now occur locally near the regime mask compared to the onset (where they occur further upstream outside of the regime mask) are reflected in peaks of the divergent PV tendencies in the Eulerian perspective. These results are in good agreement with the climatological study of Steinfeld and Pfahl (2019), who point to multiple episodes of latent heating “bursts” that lead to the re-intensification and growth of an existing block during the maintenance stage of its life cycle. Baroclinic PV tendencies play a positive but subordinate role during regime onset but become more important for the maintenance. In an energy framework, and on average over many winter cases, Martineau et al. (2022) found that baroclinic energy conversion makes a leading-order contribution to the energetics of Greenland blocks. Individual tendency terms in an energy framework and a PV framework are not directly comparable (e.g., see discussion in Sect. 3f of Wirth et al., 2018), and a single case study cannot be compared to the mean results of many cases. It is worth pointing out, however, that our analysis focuses on the upper troposphere, whereas Martineau et al. (2022) find the strongest signal in the low to middle troposphere. In addition, we stress that our analysis demonstrates the importance of moist-baroclinic growth for the amplification of the before and during onset. It is the divergent outflow associated with moist processes below, however, that is most effective in amplifying the upper-level anomaly in our case study. We thus consider our results to be consistent with those of Martineau et al. (2022). The attraction and absorption of a synoptic-scale anticyclonic eddy by the block as a maintenance mechanism is a well-known concept (Yamazaki and Itoh, 2009) and is here investigated in the quasi-Lagrangian perspective. The tracking algorithm that considers splitting and merging events detects several merging 's from the southwest that amplify the existent main over Europe. More than 50 % of the merging events identified around the EuBL occur within the regime life cycle and provide evidence that these merging events are important for maintaining or re-intensifying the strength. However, a few splitting events in the maintenance stage are associated with noteworthy effects on the amplitude and area of the and dominate the net effect on the amplitude for the active life cycle stage. Nevertheless, with the novel tracking algorithm, it is possible for the first time to quantify the well-known concept of Yamazaki and Itoh (2009).
The decay of the EuBL regime pattern is associated with the advection of the out of the region and the absence of moist processes that could maintain the anticyclonic part of the regime. Slow amplitude reduction of the traced in the quasi-Lagrangian perspective starts in the second half of the regime life cycle. Here, the quasi-barotropic tendency term has the key role and leads the decay. We further assume that nonlinear processes (which are included in the eddy term in the Eulerian perspective) make a non-negligible contribution to the decay of the regime. This is in good agreement with the results of Michel and Rivière (2011), which pointed to the importance of nonlinear processes in the transition stage from blocking over the eastern North Atlantic to a blocked regime more towards the west, as we see in the case here that transitions towards an Atlantic Ridge regime. Large deformations, which can occur in the context of nonlinear processes, are often associated with splitting events. And indeed, the impacts of splitting events dominate over the merging events around the decay stage and provide an important contribution to the degradation of the . Both the Eulerian and quasi-Lagrangian perspectives show that the divergent PV tendency term plays a more minor role in the decay phase. The absence of moist processes is visible in the Lagrangian perspective by the low fraction of heated backward trajectories and matches very well with Steinfeld and Pfahl (2019), who point to reduced moist processes during the decay phase of a block. Overall, both fit the hypothesis of Hoskins (1997) that the disruption by the advection of other systems and the lack of a maintenance process can be associated with the decay of a block.
The present study introduces three different perspectives on how to quantify the PV dynamics of blocked weather regime life cycles in the North Atlantic–European region based on ERA5 reanalysis data. The Eulerian, quasi-Lagrangian, and Lagrangian perspectives on regime dynamics are applied to a EuBL regime life cycle that occurred from 9–18 March 2016. This case is motivated by the fact that its onset was associated with a forecast bust at ECMWF. We show that each of the perspectives can stand alone but that a combined usage can provide a much more complete picture of the dynamics. A particularly novel aspect is the quasi-Lagrangian perspective, which helps to bridge the gap between the Lagrangian and Eulerian perspectives through the tracking of negative, upper-tropospheric PVAs () and the use of the Eulerian PV tendencies to investigate the amplitude evolution of 's. These PV tendencies enable us to distinguish the importance of dry and moist processes in the different life cycle stages and thus provide a deeper insight into the dynamics.
The Eulerian perspective shows that the onset and maintenance of the EuBL pattern in March 2016 can be described predominantly by barotropic wave propagation, namely the advection of PVAs by the upper-tropospheric flow into the region where the block is established. A split-up into anticyclonic and cyclonic PVAs of the full patterns demonstrates the importance of the divergent PV tendency as the second-largest contribution to the establishment of anticyclonic PVAs, indicating the potential relevance of moist processes. Since the Eulerian perspective only considers the processes that occur within a specified region, it misses the processes that cause the formation of the PVAs upstream. This information is obtained from the quasi-Lagrangian perspective that identifies and follows 's. The traced that occupies the anticyclonic part of the regime pattern originates near the US East Coast 5 d prior to the regime onset and migrates northeastward. An analysis of the amplitude evolution shows the pulse-like amplification before and during the EuBL life cycle, which results almost exclusively from divergent and quasi-barotropic PV tendencies. Using the Lagrangian perspective with backward air parcel trajectories emerging from the traced , we confirm the relationship between the divergent PV tendency and the diabatic contributions to the amplitude evolution. When pulse-like amplitude amplification occurs mainly due to the divergent PV tendency, we find a high fraction of heated trajectories ending in the at the same time. In addition, it is shown that the pulse-like amplifications of the are related to WCBs, which can lead to a strong divergent outflow and the modification of the upper-tropospheric PV distribution. Hence, our results provide evidence that the divergent PV tendency term in the PV framework of Teubler and Riemer (2016) can indeed be interpreted as an indirect diabatic effect.
The Eulerian perspective has the advantage that it directly quantifies the processes leading to the weather regime index. Although it misses the synoptic activity upstream of the regime pattern, it takes into account the evolution of the full pattern, which is in contrast with the quasi-Lagrangian and Lagrangian perspectives that focus exclusively on the dominant anticyclonic regime anomaly. Hence, the multi-perspective analysis is important to understand the full regime evolution. If not considered together, some kind of consideration of the cyclonic part of the regime pattern should be included from a pure quasi-Lagrangian perspective, as it helps to obstruct the westerly flow and is therefore related to the impact of blocked regimes.
However, by unifying the three perspectives on blocked regime dynamics within the theoretical concept of PV thinking, our novel framework enables – for the first time – a holistic view of the dynamics of blocked weather regimes, in particular including a quantification of the contribution of moist processes in different life cycle stages. The perspectives introduced here form a foundation for a systematic analysis of blocked regime dynamics. The next step will be a climatological investigation of blocked regime life cycles in ERA5 which addresses the dynamics of the three different life cycle stages (onset, maximum stage, decay) from the quasi-Lagrangian perspective. Once a few adjustments have been made to the framework (such as developing a year-round threshold and sensitivity tests of the chosen parameters), it can be systematically applied to all blocked regime life cycles in ERA5. It is of interest to study which processes are important in the buildup of the negative PVA of the blocked regime and by which processes the block is maintained and kept stationary. Furthermore, we plan to address the dynamics of the decay process of blocked regime life cycle patterns. The quasi-Lagrangian perspective developed here could be the key tool to test and verify many theories of blocking dynamics (e.g., the eddy-straining idea of Shutts, 1983) for a variety of blocked regime life cycles.
This novel contour overlap tracking algorithm traces 2D structures and captures the full life cycle of the identified 's (in the quasi-Lagrangian perspective), considering the splitting and merging that occurs during the life cycle. Here the algorithm determines the number of 's that spatially overlap the object identified in the time step before. A count of zero indicates the end of the life cycle (Fig. A1a). A simple continuation of the track takes place if only one single shows an overlap (Fig. A1b). A splitting event is diagnosed when the count is greater than one (Fig. A1c). A merging event takes place if multiple 's show a spatial overlap with the same object one time step later (Fig. A1d). Since the life cycle of a should not end automatically due to these splitting and merging events, the integrated amplitude of the 's decides which object continues the tracking ID. The other involved objects get new tracking IDs (in case of splitting), or the track of a smaller, weaker feeding into a larger, stronger ends with the merging event. Simultaneous splitting and merging events are also detected by the algorithm and evaluated accordingly. The output of the tracking algorithm contains the tracks and additionally saves the information on splitting and merging events occurring along the track. This also makes it possible to determine not only the beginning of the track but also the local origin of 's.
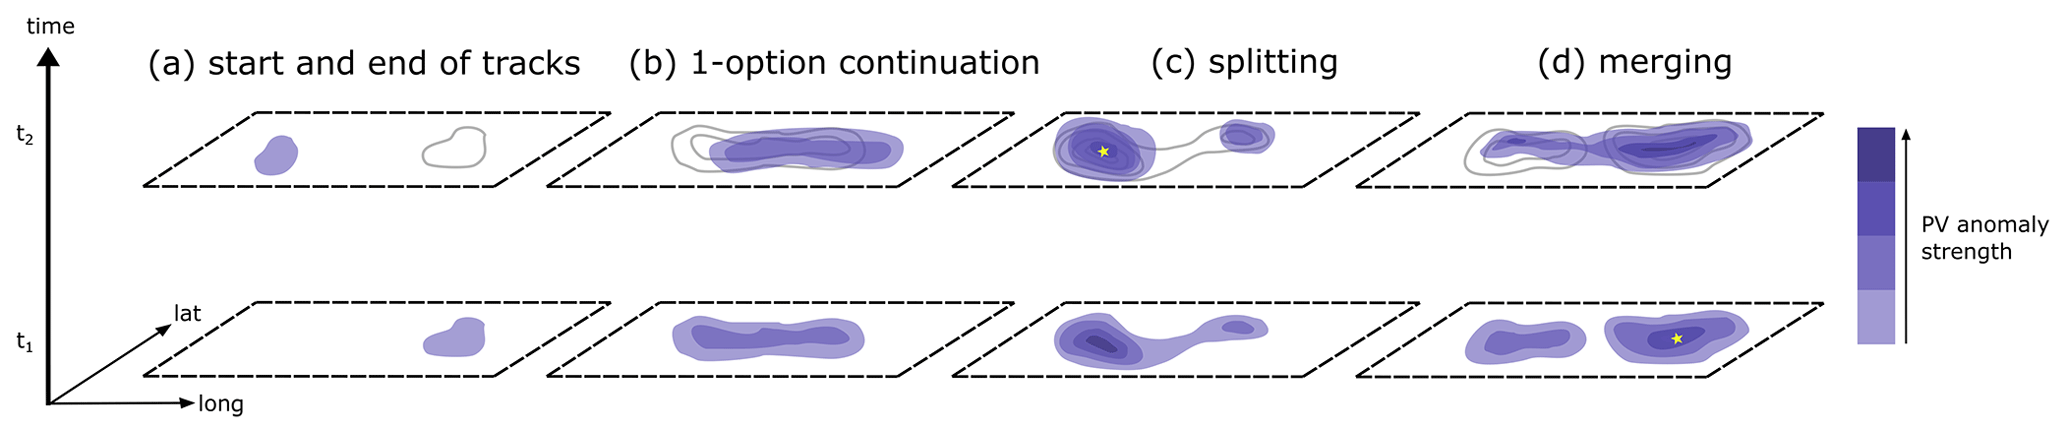
Figure A1Schematic of the 2D-tracking algorithm applied to 's in the quasi-Lagrangian perspective. The sketch demonstrates the development of a object (blue shading) from one time step (t1) to the next (t2) upwards for different situations: (a) start and end of a track, (b) one-option continuation, (c) splitting, and (d) merging. The thin gray lines in the upper row at t2 indicate the position and amplitude of the object at t1 to show the overlap more visually. Yellow dots in panels (c) and (d) indicate which tracking ID is continued between the time steps, which means that one object gets a new tracking ID (in the case of splitting) or a tracking ID ends (in the case of merging).
The second term in BND in Eq. (9) is very difficult to evaluate accurately. The movement of the boundary vs is essentially unknown, and becomes very large when merging or splitting occurs. To estimate this term, we note that ∇⋅vs signifies a change of area Δ𝒜 of the . Assuming a constant value of q′ at the boundary, we can estimate . We choose as the average of q′ along the boundary. The value for Δ𝒜 is taken from the observed area change of the .
By taking into account the sum of all tendency terms on the RHS of Eq. (9) and comparing it with the observed amplitude change, we can close our q′ budget to a very high degree (Fig. B1). Note that the missing tendency terms that are not displayed in Fig. 10 are shown for the sake of completeness in Fig. B1b. It appears that BND dominates the overall change in PVA amplitude (Fig. B1a) due to the prominent spikes in BND (Fig. B1a). These spikes indicate abrupt changes in the area, which we can assign more accurately to splitting and merging events identified by the novel quasi-Lagrangian tracking algorithm discussed in detail in Sects. 4.2 and A.
Occasionally, the diagnosed PV tendencies do not reproduce the observed evolution sufficiently well (Fig. B1a). This can occur, for example, around 7–8 March and 12–14 March when the extends northwards of 80∘ N and is partly located outside the domain to which we restrict our piecewise PV tendency diagnostic. Furthermore, splitting and merging events in quick succession make it hard to fully diagnose the amplitude change. From 23–24 March, the diagnosed tendencies systematically underestimate the decay of the . The area of the is very small at this time (not shown), which may make the spatial integration particularly sensitive to the precise location of the boundary. Overall, however, we conclude that the accuracy of our budget evaluation is sufficient and that the diagnosed tendencies presented in the main text reliably represent the relative importance of the different dynamical mechanisms.

Figure B1Comparison of observed and diagnosed amplitude change and temporal evolution of remaining PV tendency terms as an addition to Fig. 10. (a) Observed amplitude change of the (OBS, gray), full diagnosed amplitude change as of Eq. (9) (DIAG, black), and the boundary term (BND, dark red). (b) Remaining terms of Eq. (9) that are not contained in Fig. 10: advection of background PV by background wind (BGA, dark blue), advection of background PV by the residual wind field (RES, yellow-green), and the local change in the background PV within the 3 h window (, violet). The gray shading points to the active EuBL regime life cycle, and the vertical line in black indicates where the active EuBL life cycle is divided into two for the investigation of the net effect of the tendency terms in Fig. 11. Note the different y-axis extents between the panels.
The data are referenced in Sect. 2.1. ERA5 data are freely available at https://doi.org/10.24381/cds.bd0915c6 (Hersbach et al., 2018). The codes and data from this study can be provided by the authors upon request.
SH developed the quasi-Lagrangian perspective, analyzed the PV dynamics from a quasi-Lagrangian and Lagrangian perspective, and wrote the paper. FT calculated and provided the piecewise PV tendencies, developed the Eulerian perspective on the PV dynamics of blocked weather regimes, and contributed to the writing of the paper. CMG provided the year-round North Atlantic–European weather regime data based on ERA5. MR contributed to the writing. CMG, MR, and PK gave important guidance during the project and provided feedback on the paper.
At least one of the (co-)authors is a member of the editorial board of Weather and Climate Dynamics. The peer-review process was guided by an independent editor, and the authors also have no other competing interests to declare.
Publisher's note: Copernicus Publications remains neutral with regard to jurisdictional claims in published maps and institutional affiliations.
We thank the three anonymous referees for the effort and time they put into the review of this paper. All of the valuable comments and suggestions, which helped to improve the quality of the paper, are highly appreciated. ECMWF is acknowledged for granting access to the reanalysis data sets. We are grateful to the atmospheric dynamics group of ETH Zurich for providing LAGRANTO. The research leading to these results has been done within the sub-project “Dynamics and predictability of blocked regimes in the Atlantic-European region (A8)” of the Transregional Collaborative Research Center SFB/TRR 165 “Waves to Weather” (https://www.wavestoweather.de, last access: 28 April 2023).
This research has been supported by the German Research Foundation (DFG) (grant no. SFB/TRR 165, Waves to Weather). The contribution of Christian M. Grams is funded by the Helmholtz Association as part of the Young Investigator Group “Sub-seasonal Predictability: Understanding the Role of Diabatic Outflow” (SPREADOUT, grant VH-NG-1243).
This paper was edited by Juerg Schmidli and reviewed by three anonymous referees.
Alvarez-Castro, M. C., Faranda, D., and Yiou, P.: Atmospheric Dynamics Leading to West European Summer Hot Temperatures since 1851, Complexity, 2018, 2494509, https://doi.org/10.1155/2018/2494509, 2018. a
Austin, J. F.: The blocking of middle latitude westerly winds by planetary waves, Q. J. Roy. Meteorol. Soc., 106, 327–350, https://doi.org/10.1002/qj.49710644807, 1980. a
Benedict, J. J., Lee, S., and Feldstein, S. B.: Synoptic view of the North Atlantic Oscillation, J. Atmos. Sci., 61, 121–144, https://doi.org/10.1175/1520-0469(2004)061<0121:SVOTNA>2.0.CO;2, 2004. a
Buehler, T., Raible, C. C., and Stocker, T. F.: The relationship of winter season North Atlantic blocking frequencies to extreme cold or dry spells in the ERA-40, Tellus A, 63, 212–222, https://doi.org/10.1111/j.1600-0870.2010.00492.x, 2011. a
Cassou, C.: Intraseasonal interaction between the Madden-Julian Oscillation and the North Atlantic Oscillation, Nature, 455, 523–527, https://doi.org/10.1038/nature07286, 2008. a
Chagnon, J. M., Gray, S. L., and Methven, J.: Diabatic processes modifying potential vorticity in a North Atlantic cyclone, Q. J. Roy. Meteorol. Soc., 139, 1270–1282, https://doi.org/10.1002/qj.2037, 2013. a
Charney, J.: The Use of the Primitive Equations of Motion in Numerical Prediction, Tellus, 7, 22–26, https://doi.org/10.1111/j.2153-3490.1955.tb01138.x, 1955. a
Charney, J. G. and DeVore, J. G.: Multiple Flow Equilibria in the Atmosphere and Blocking, J. Atmos. Sci., 36, 1205–1216, https://doi.org/10.1175/1520-0469(1979)036<1205:MFEITA>2.0.CO;2, 1979. a
Cortesi, N., Torralba, V., Lledó, L., Manrique-Suñén, A., Gonzalez-Reviriego, N., Soret, A., and Doblas-Reyes, F. J.: Yearly evolution of Euro-Atlantic weather regimes and of their sub-seasonal predictability (Climate Dynamics, (2021), 56, 11–12, (3933–3964), https://doi.org/10.1007/s00382-021-05679-y), Clim. Dynam., 56, 3965, https://doi.org/10.1007/s00382-021-05750-8, 2021. a
Davis, C. A.: Piecewise Potential Vorticity Inversion, J. Atmos. Sci., 49, 1397–1411, https://doi.org/10.1175/1520-0469(1992)049<1397:PPVI>2.0.CO;2, 1992. a
Davis, C. A. and Emanuel, K. A.: Potential Vorticity Diagnostics of Cyclogenesis, Mon. Weather Rev., 119, 1929–1953, https://doi.org/10.1175/1520-0493(1991)119<1929:PVDOC>2.0.CO;2, 1991. a
Donat, M. G., Leckebusch, G. C., Pinto, J. G., and Ulbrich, U.: Examination of wind storms over Central Europe with respect to circulation weather types and NAO phases, Int. J. Climatol., 30, 1289–1300, https://doi.org/10.1002/joc.1982, 2010. a
Duchon, C. E.: Lanczos Filtering in One and Two Dimensions, J. Appl. Meteorol. Clim., 18, 1016–1022, https://doi.org/10.1175/1520-0450(1979)018<1016:LFIOAT>2.0.CO;2, 1979. a
Ertel, H.: Ein neuer hydrodynamischer Erhaltungssatz, Naturwissenschaften, 30, 543–544, https://doi.org/10.1007/BF01475602, 1942. a, b
Feldstein, S. B.: The dynamics of NAO teleconnection pattern growth and decay, Q. J. Roy. Meteorol. Soc., 129, 901–924, https://doi.org/10.1256/qj.02.76, 2003. a, b
Ferranti, L., Corti, S., and Janousek, M.: Flow-dependent verification of the ECMWF ensemble over the Euro–Atlantic sector, Q. J. Roy. Meteorol. Soc., 141, 916–924, https://doi.org/10.1002/qj.2411, 2015. a
Ferranti, L., Magnusson, L., Vitart, F., and Richardson, D. S.: How far in advance can we predict changes in large-scale flow leading to severe cold conditions over Europe?, Q. J. Roy. Meteorol. Soc., 144, 1788–1802, https://doi.org/10.1002/qj.3341, 2018. a
Grams, C. M., Wernli, H., Böttcher, M., Čampa, J., Corsmeier, U., Jones, S. C., Keller, J. H., Lenz, C.-J., and Wiegand, L.: The key role of diabatic processes in modifying the upper-tropospheric wave guide: a North Atlantic case-study, Q. J. Roy. Meteorol. Soc., 137, 2174–2193, https://doi.org/10.1002/qj.891, 2011. a
Grams, C. M., Beerli, R., Pfenninger, S., Staffell, I., and Wernli, H.: Balancing Europe's wind power output through spatial deployment informed by weather regimes, Nat. Clim. Change, 7, 557–562, https://doi.org/10.1038/nclimate3338, 2017. a, b, c, d, e, f, g
Grams, C. M., Magnusson, L., and Madonna, E.: An Atmospheric Dynamics Perspective on the Amplification and Propagation of Forecast Error in Numerical Weather Prediction Models: A Case Study, Q. J. Roy. Meteorol. Soc., 144, 2577–2591, https://doi.org/10.1002/qj.3353, 2018. a, b, c, d
Grose, W. L. and Hoskins, B. J.: On the Influence of Orography on Large-Scale Atmospheric Flow, J. Atmos. Sci., 36, 223–234, https://doi.org/10.1175/1520-0469(1979)036<0223:OTIOOO>2.0.CO;2, 1979. a
Henderson, S. A., Maloney, E. D., and Barnes, E. A.: The influence of the Madden–Julian oscillation on Northern Hemisphere winter blocking, J. Climate, 29, 4597–4616, https://doi.org/10.1175/JCLI-D-15-0502.1, 2016. a
Hersbach, H., Bell, B., Berrisford, P., Biavati, G., Horányi, A., Muñoz Sabater, J., Nicolas, J., Peubey, C., Radu, R., Rozum, I., Schepers, D., Simmons, A., Soci, C., Dee, D., and Thépaut, J.-N.: ERA5 hourly data on pressure levels from 1940 to present, Copernicus Climate Change Service (C3S) Climate Data Store (CDS) [data set], https://doi.org/10.24381/cds.bd0915c6, 2018. a
Hersbach, H., Bell, B., Berrisford, P., Hirahara, S., Horányi, A., Muñoz-Sabater, J., Nicolas, J., Peubey, C., Radu, R., Schepers, D., Simmons, A., Soci, C., Abdalla, S., Abellan, X., Balsamo, G., Bechtold, P., Biavati, G., Bidlot, J., Bonavita, M., De Chiara, G., Dahlgren, P., Dee, D., Diamantakis, M., Dragani, R., Flemming, J., Forbes, R., Fuentes, M., Geer, A., Haimberger, L., Healy, S., Hogan, R. J., Hólm, E., Janisková, M., Keeley, S., Laloyaux, P., Lopez, P., Lupu, C., Radnoti, G., de Rosnay, P., Rozum, I., Vamborg, F., Villaume, S., and Thépaut, J.-N.: The ERA5 global reanalysis, Q. J. Roy. Meteorol. Soc., 146, 1999–2049, https://doi.org/10.1002/qj.3803, 2020. a
Hong, C.-C., Hsu, H.-H., Lin, N.-H., and Chiu, H.: Roles of European blocking and tropical-extratropical interaction in the 2010 Pakistan flooding, Geophys. Res. Lett., 38, L13806, https://doi.org/10.1029/2011GL047583, 2011. a
Hoskins, B.: A potential vorticity view of synoptic development, Meteorol. Appl., 4, 325–334, https://doi.org/10.1017/S1350482797000716, 1997. a
Hoskins, B. J., McIntyre, M. E., and Robertson, A. W.: On the Use and Significance of Isentropic Potential Vorticity Maps, Q. J. Roy. Meteorol. Soc., 111, 877–946, https://doi.org/10.1002/qj.49711147002, 1985. a, b, c
Houze, R. A., Rasmussen, K. L., Medina, S., Brodzik, S. R., and Romatschke, U.: Anomalous Atmospheric Events Leading to the Summer 2010 Floods in Pakistan, B. Am. Meteorol. Soc., 92, 291–298, https://doi.org/10.1175/2010BAMS3173.1, 2011. a
Illari, L.: A Diagnostic Study of the Potential Vorticity in a Warm Blocking Anticyclone, J. Atmos. Sci., 41, 3518–3526, https://doi.org/10.1175/1520-0469(1984)041<3518:ADSOTP>2.0.CO;2, 1984. a
Kautz, L.-A., Martius, O., Pfahl, S., Pinto, J. G., Ramos, A. M., Sousa, P. M., and Woollings, T.: Atmospheric blocking and weather extremes over the Euro-Atlantic sector – a review, Weather Clim. Dynam., 3, 305–336, https://doi.org/10.5194/wcd-3-305-2022, 2022. a
Lavaysse, C., Vogt, J., Toreti, A., Carrera, M. L., and Pappenberger, F.: On the use of weather regimes to forecast meteorological drought over Europe, Nat. Hazards Earth Syst. Sci., 18, 3297–3309, https://doi.org/10.5194/nhess-18-3297-2018, 2018. a
Luo, D., Cha, J., Zhong, L., and Dai, A.: A nonlinear multiscale interaction model for atmospheric blocking: The eddy-blocking matching mechanism, Q. J. Roy. Meteorol. Soc., 140, 1785–1808, https://doi.org/10.1002/qj.2337, 2014. a
Lupo, A. R.: Atmospheric blocking events: a review, Ann. N. Y. Acad. Sci., 1504, 5–24, https://doi.org/10.1111/nyas.14557, 2021. a
Madonna, E., Wernli, H., Joos, H., and Martius, O.: Warm Conveyor Belts in the ERA-Interim Dataset (1979-2010). Part I: Climatology and Potential Vorticity Evolution, J. Climate, 27, 3–26, https://doi.org/10.1175/JCLI-D-12-00720.1, 2014. a, b
Magnusson, L.: Diagnostic methods for understanding the origin of forecast errors, Q. J. Roy. Meteorol. Soc., 143, 2129–2142, https://doi.org/10.1002/qj.3072, 2017. a, b, c
Martineau, P., Nakamura, H., Yamamoto, A., and Kosaka, Y.: Baroclinic Blocking, Geophys. Res. Lett., 49, e2022GL097791, https://doi.org/10.1029/2022GL097791, 2022. a, b, c
Matsueda, M. and Palmer, T. N.: Estimates of flow-dependent predictability of wintertime Euro-Atlantic weather regimes in medium-range forecasts, Q. J. Roy. Meteorol. Soc., 144, 1012–1027, https://doi.org/10.1002/qj.3265, 2018. a
Methven, J.: Potential vorticity in warm conveyor belt outflow, Q. J. Roy. Meteorol. Soc., 141, 1065–1071, https://doi.org/10.1002/qj.2393, 2015. a
Michel, C. and Rivière, G.: The link between rossby wave breakings and weather regime transitions, J. Atmos. Sci., 68, 1730–1748, https://doi.org/10.1175/2011JAS3635.1, 2011. a, b, c, d, e, f
Michelangeli, P. A., Vautard, R., and Legras, B.: Weather regimes: recurrence and quasi stationarity, J. Atmos. Sci., 52, 1237–1256, https://doi.org/10.1175/1520-0469(1995)052<1237:WRRAQS>2.0.CO;2, 1995. a
Miller, D. E. and Wang, Z.: Northern Hemisphere Winter Blocking: Differing Onset Mechanisms across Regions, J. Atmos. Sci., 79, 1291–1309, https://doi.org/10.1175/jas-d-21-0104.1, 2022. a
Nakamura, H. and Wallace, J. M.: Observed Changes in Baroclinic Wave Activity during the Life Cycles of Low-Frequency Circulation Anomalies, J. Atmos. Sci., 47, 1100–1116, https://doi.org/10.1175/1520-0469(1990)047<1100:OCIBWA>2.0.CO;2, 1990. a
Nakamura, H. and Wallace, J. M.: Synoptic Behavior of Baroclinic Eddies during the Blocking Onset, Mon. Weather Rev., 121, 1892–1903, https://doi.org/10.1175/1520-0493(1993)121<1892:SBOBED>2.0.CO;2, 1993. a
Nakamura, H., Nakamura, M., and Anderson, J. L.: The role of high- and low-frequency dynamics in blocking formation, Mon. Weather Rev., 125, 2074–2093, https://doi.org/10.1175/1520-0493(1997)125<2074:TROHAL>2.0.CO;2, 1997. a
Nakamura, N. and Huang, C. S. Y.: Atmospheric blocking as a traffic jam in the jet stream, Science, 361, 42–47, https://doi.org/10.1126/science.aat0721, 2018. a
Petoukhov, V., Rahmstorf, S., Petri, S., and Schellnhuber, H. J.: Quasiresonant amplification of planetary waves and recent Northern Hemisphere weather extremes, P. Natl. Acad. Sci. USA, 110, 5336–5341, https://doi.org/10.1073/pnas.1222000110, 2013. a
Pfahl, S. and Wernli, H.: Quantifying the relevance of atmospheric blocking for co-located temperature extremes in the Northern Hemisphere on (sub-)daily time scales, Geophys. Res. Lett., 39, L12807, https://doi.org/10.1029/2012GL052261, 2012. a
Pfahl, S., Schwierz, C., Croci-Maspoli, M., Grams, C. M., and Wernli, H.: Importance of latent heat release in ascending air streams for atmospheric blocking, Nat. Geosci., 8, 610–614, https://doi.org/10.1038/ngeo2487, 2015. a, b, c, d, e, f, g
Quinting, J. F. and Grams, C. M.: EuLerian Identification of ascending AirStreams (ELIAS 2.0) in numerical weather prediction and climate models – Part 1: Development of deep learning model, Geosci. Model Dev., 15, 715–730, https://doi.org/10.5194/gmd-15-715-2022, 2022. a
Rex, D. F.: Blocking Action in the Middle Troposphere and its Effect upon Regional Climate, Tellus, 2, 196–211, https://doi.org/10.1111/j.2153-3490.1950.tb00331.x, 1950. a
Rossby, C.-G.: Planetary flow patterns in the atmosphere, Q. J. Roy. Meteor. Soc., 66, 68–87, 1940. a
Röthlisberger, M., Martius, O., and Wernli, H.: Northern Hemisphere Rossby Wave Initiation Events on the Extratropical Jet—A Climatological Analysis, J. Climate, 31, 743–760, https://doi.org/10.1175/JCLI-D-17-0346.1, 2018. a
Schwierz, C., Croci-Maspoli, M., and Davies, H. C.: Perspicacious indicators of atmospheric blocking, Geophys. Res. Lett., 31, L06125, https://doi.org/10.1029/2003GL019341, 2004. a, b, c
Shutts, G. J.: The propagation of eddies in diffluent jetstreams: Eddy vorticity forcing of `blocking' flow fields, Q. J. Roy. Meteorol. Soc., 109, 737–761, https://doi.org/10.1002/qj.49710946204, 1983. a, b, c
Sillmann, J., Croci-Maspoli, M., Kallache, M., and Katz, R. W.: Extreme Cold Winter Temperatures in Europe under the Influence of North Atlantic Atmospheric Blocking, J. Climate, 24, 5899–5913, https://doi.org/10.1175/2011JCLI4075.1, 2011. a
Sprenger, M. and Wernli, H.: The LAGRANTO Lagrangian analysis tool – version 2.0, Geosci. Model Dev., 8, 2569–2586, https://doi.org/10.5194/gmd-8-2569-2015, 2015. a
Steinfeld, D. and Pfahl, S.: The Role of Latent Heating in Atmospheric Blocking Dynamics: A Global Climatology, Clim. Dynam., 53, 6159–6180, https://doi.org/10.1007/s00382-019-04919-6, 2019. a, b, c, d, e, f, g, h, i, j, k
Teubler, F. and Riemer, M.: Dynamics of Rossby Wave Packets in a Quantitative Potential Vorticity—Potential Temperature Framework, J. Atmos. Sci., 73, 1063–1081, https://doi.org/10.1175/JAS-D-15-0162.1, 2016. a, b, c, d, e, f, g, h
Teubler, F. and Riemer, M.: Potential-vorticity dynamics of troughs and ridges within Rossby wave packets during a 40-year reanalysis period, Weather Clim. Dynam., 2, 535–559, https://doi.org/10.5194/wcd-2-535-2021, 2021. a, b, c, d, e, f, g, h, i, j, k, l, m, n, o
Teubler, F., Riemer, M., Polster, C., Grams, C. M., Hauser, S., and Wirth, V.: Similarity and variability of blocked weather-regime dynamics in the Atlantic–European region, Weather Clim. Dynam., 4, 265–285, https://doi.org/10.5194/wcd-4-265-2023, 2023. a
Vautard, R.: Multiple weather regimes over the North Atlantic: analysis of precursors and successors, Mon. Weather Rev., 118, 2056–2081, https://doi.org/10.1175/1520-0493(1990)118<2056:MWROTN>2.0.CO;2, 1990. a
Vitart, F., Robertson, A. W., and Anderson, D. L. T.: Sub-seasonal to seasonal prediction: The gap between weather and climate forecasting, in: Sub-seasonal to Seasonal Prediction: The Gap Between Weather and Climate Forecasting, edited by: Robertson, A. W. and Vitart, F., Elsevier, 61, 1–585, https://doi.org/10.1016/C2016-0-01594-2, 2012. a
Wernli, H.: A Lagrangian-based analysis of extratropical cyclones. II: A detailed case-study, Q. J. Roy. Meteorol. Soc., 123, 1677–1706, https://doi.org/10.1002/qj.49712354211, 1997. a
Wirth, V., Riemer, M., Chang, E. K., and Martius, O.: Rossby wave packets on the midlatitude waveguide – A review, Mon. Weather Rev., 146, 1965–2001, https://doi.org/10.1175/MWR-D-16-0483.1, 2018. a, b, c, d
Woollings, T., Barriopedro, D., Methven, J., Son, S. W., Martius, O., Harvey, B., Sillmann, J., Lupo, A. R., and Seneviratne, S.: Blocking and its Response to Climate Change, Current Climate Change Reports, 4, 287–300, https://doi.org/10.1007/s40641-018-0108-z, 2018. a
Yamazaki, A. and Itoh, H.: Selective absorption mechanism for the maintenance of blocking, Geophys. Res. Lett., 36, 4–7, https://doi.org/10.1029/2008GL036770, 2009. a, b, c, d
Yiou, P. and Nogaj, M.: Extreme climatic events and weather regimes over the North Atlantic: When and where?, Geophys. Res. Lett., 31, L07202, https://doi.org/10.1029/2003GL019119, 2004. a
Zierl, B. and Wirth, V.: The Influence of Radiation on Tropopause Behavior and Stratosphere-Troposphere Exchange in an Upper Tropospheric Anticyclone, J. Geophys. Res.-Atmos., 102, 23883–23894, https://doi.org/10.1029/97JD01667, 1997. a
Nonlinearly balanced flow is nondivergent, and we consider the residual wind to largely stem from the decomposition of the nondivergent flow by piecewise PV inversion. We find, however, that the individual balanced flow components exhibit small but non-negligible values of horizontal divergence when evaluating on isentropic levels. We attribute this spurious divergence to numerical inaccuracies when interpolating from pressure to isentropic levels and the simplification of using the horizontal wind only for the interpolation and when evaluating divergence. For the sum of v0 + + + , however, the divergence vanishes. Therefore, we now do not further consider the spurious individual terms in our PV budget.
- Abstract
- Introduction
- Data and methods
- PV evolution of the EuBL regime life cycle in March 2016
- Three perspectives on the PV dynamics of the EuBL regime life cycle in March 2016
- Synopsis and discussion
- Concluding remarks
- Appendix A: Details on the tracking algorithm in the quasi-Lagrangian perspective
- Appendix B: Computation of the boundary term and comparison of the diagnosed and observed amplitude evolution in the quasi-Lagrangian perspective
- Code and data availability
- Author contributions
- Competing interests
- Disclaimer
- Acknowledgements
- Financial support
- Review statement
- References