the Creative Commons Attribution 4.0 License.
the Creative Commons Attribution 4.0 License.
 | 17 Oct 2024
The impact of synoptic storm likelihood on European subseasonal forecast uncertainty and their modulation by the stratosphere
Jonas Spaeth
Hilla Afargan-Gerstman
Dominik Büeler
Michael Sprenger
Thomas Birner
Weather forecasts at subseasonal-to-seasonal (S2S) timescales have little forecast skill in the troposphere: individual ensemble members are mostly uncorrelated and span a range of atmospheric evolutions that are possible for the given set of external forcings. The uncertainty of such a probabilistic forecast is then determined by this range of possible evolutions – often quantified in terms of ensemble spread. Various dynamical processes can affect the ensemble spread within a given region, including extreme events simulated in individual members. For forecasts of geopotential height at 1000 hPa (Z1000) over Europe, such extremes are mainly comprised of synoptic storms propagating along the North Atlantic storm track. We use ECMWF reforecasts from the S2S database to investigate the connection between different storm characteristics and ensemble spread in more detail. We find that the presence of storms in individual ensemble members at S2S timescales contributes about 20 % to the total Z1000 forecast uncertainty over northern Europe. Furthermore, certain atmospheric conditions associated with substantial anomalies in the North Atlantic storm track show reduced Z1000 ensemble spread over northern Europe. For example, during periods with a weak stratospheric polar vortex, the genesis frequency of Euro-Atlantic storms is reduced and their tracks are shifted equatorwards. As a result, we find weaker storm magnitudes and lower storm counts, and hence anomalously low subseasonal ensemble spread, over northern Europe.
- Article
(4831 KB) - Full-text XML
- BibTeX
- EndNote


Weather prediction at subseasonal-to-seasonal (S2S) timescales remains a significant challenge in meteorology, particularly for forecasts of the extratropical troposphere (e.g. White et al., 2017). Forecast skill is highly limited at these timescales, and ensemble forecasts typically aim to model the distribution of possibilities into which the real atmosphere can evolve for a given set of external forcings and boundary conditions. Here, boundary conditions and forcings can refer to, for example, prescribed or initialized sea surface temperatures or greenhouse gas concentrations, which set the outcoming distributions of possible dynamic evolutions of the atmosphere. However, boundary conditions of a sub-system, like the troposphere, can also be given by the time-evolving state of a different sub-system if they evolve on different timescales. For example, the typically slowly evolving stratosphere may be thought of an upper boundary condition for the more quickly evolving troposphere. In that sense, initial conditions of certain sub-systems may effectively serve as boundary conditions to other sub-systems.
The ensemble spread of a probabilistic S2S forecast provides a measure of the predictability of the system in a specific situation, assuming that model errors are small. Forecasts with large spreads correspond to situations with a wide range of possible scenarios and are hence associated with high uncertainty about the evolution of the system, while forecasts with small spreads are more certain about how the system will evolve. Various physical and dynamical processes associated with different spatial scales can act as sources of S2S variability (or uncertainty) in the Euro-Atlantic sector. On large scales, the dominant mode of variability in that region is the North Atlantic Oscillation (NAO) (e.g. Hurrell et al., 2003; Benedict et al., 2004). Differences in NAO phase between ensemble members are associated with relative meridional shifts of the mid-latitude jet and its associated strong pressure gradients. The presence of such a strong gradient leads to a potential for large ensemble spread in mid-latitude forecasts, e.g. if different ensemble members predict the position of this gradient (and hence the associated jet) at different latitudes. On synoptic-to-planetary spatial scales, a major source of subseasonal variability is given by Rossby waves developing, propagating and breaking on the mid-latitude jet. Dispersion in the phase or magnitude during the linear propagation stage of these waves among different ensemble members can increase the ensemble spread of the S2S forecast.
On more regional scales, the ensemble spread is strongly influenced by the development of extratropical cyclones (in this study simply referred to as storms). Such storms are typically generated and amplified over the baroclinic regions in the western North Atlantic and travel eastward towards Europe, where they tend to decay. The aggregated paths of storms form the North Atlantic storm track. The present study aims to analyse the contribution of storms to the spread of S2S ensemble forecasts over the Euro-Atlantic sector.
The above dynamical sources of subseasonal ensemble variability are strongly coupled to each other. For example, the NAO is strongly coupled to the position and strength of the North Atlantic storm track and different NAO phases influence the development and evolution of North Atlantic storms. Generally, a positive NAO phase is linked to a poleward shift of the storm track and a higher number of extreme cyclones (Pinto et al., 2009; Donat et al., 2010), while a negative NAO phase is associated with an equatorward shift of the storm track and more frequent storm extremes in Southern Europe, especially over the Iberian Peninsula (Merino et al., 2016). Further, storms can often develop out of the troughs of synoptic-scale Rossby waves during their non-linear breaking phase, thereby coupling these two flow features.
By modifying the likelihood or characteristics of the dynamical processes described above, certain sets of initial and boundary conditions and external forcings can result in anomalous forecast spread. Of particular interest are situations in which the ensemble forecasts converge toward a narrower range of possible evolutions (i.e. anomalously low forecast spread), indicating a period of enhanced predictability (so-called “windows of forecast opportunity”). These windows of opportunity are often linked to specific atmospheric configurations or phenomena that temporarily reduce variability within the forecast, such as dominant weather regimes, teleconnections, or ocean–atmosphere interactions. During these periods, the forecast skill is higher, offering valuable opportunities for planning and decision-making beyond the usual limits of S2S forecasting (e.g. Mariotti et al., 2020).
One example of a teleconnection is the downward coupling of the stratosphere. It has long been known that the state of the stratospheric polar vortex (SPV) can influence the dynamics of the troposphere (Baldwin and Dunkerton, 2001). Due to the long characteristic timescales of the stratosphere, the SPV therefore acts as a source of predictability for surface weather in the Northern Hemisphere on S2S timescales (Baldwin et al., 2003; Domeisen et al., 2020). The downward influence of SPV anomalies on the Euro-Atlantic sector involves an NAO-like signal (e.g. Blessing et al., 2005) and associated latitudinal shifts in the mid-latitude jet (Maycock et al., 2020) and the North Atlantic storm track (Butler et al., 2017; Afargan-Gerstman and Domeisen, 2020; Afargan-Gerstman et al., 2024).
The described downward influence of SPV anomalies (modified NAO phase, shifting of the North Atlantic storm track) manifests robustly as average over many cases. However, anomalies in SPV strength can also modify tropospheric variability and hence be associated with windows of forecast opportunity. Recently, Spaeth et al. (2024a) have shown that periods with weak SPV are followed by reduced S2S forecast uncertainty over northern Europe in terms of 1000 hPa geopotential height (Z1000). This reduction also translates into enhanced forecast skill (Domeisen et al., 2020; Büeler et al., 2020). Spaeth et al. (2024a) suggest that the anomaly in forecast uncertainty results from a southward-shifted North Atlantic storm track and correspondingly reduced synoptic activity over northern Europe. However, a weak SPV can potentially also modify other characteristics of the North Atlantic storm track in addition to its latitudinal position (like the magnitude or the occurrence frequency of storms), which could further contribute to the modulation of forecast uncertainty over northern Europe.
Studies have further shown that blocked weather situations are often associated with a modified North Atlantic storm track (e.g. Vallis and Gerber, 2008; Yang et al., 2021) and hence might have an influence on Euro-Atlantic forecast uncertainty at S2S timescales. Spaeth et al. (2024b) found anomalies in ensemble spread of subseasonal forecasts depending on the weather regimes dominant during initialization. Regimes with a more blocked Atlantic jet were generally associated with negative Z1000 spread anomalies over northern Europe and positive spread anomalies in surface temperature, while regimes with a more zonal Atlantic jet showed the opposite signals. They further suggested differences in synoptic storm activity as the predominant driver of these spread anomalies.
Given the potential importance of synoptic storms in contributing to subseasonal forecast spread, the aim of this study is to quantify this connection in more detail. By systematically analysing the relationship between strong storm events and the variability in ensemble predictions, we provide insights into the underlying mechanisms driving forecast uncertainty. The present study is particularly motivated by the anomalies in ensemble spread following weak SPV states Spaeth et al. (2024a) but starts by analysing the connection of storms and forecast spread more generally before discussing the SPV influence.
This paper is structured as follows: Sect. 2 describes the technical details of the dataset used and how we identify and track isolated storm features. Section 3 discusses an exemplary case of how the occurrence of an individual storm at S2S timescales can contribute to ensemble spread over northern Europe, after which Sect. 4 analyses the general correlation between storm characteristics and ensemble spread. In Sect. 5 we quantify the influence of variations in the stratospheric polar vortex on storm track characteristics and demonstrate how certain persistent teleconnection patterns can affect European ensemble spread. Finally, Sect. 6 summarizes and discusses our main findings.
2.1 Subseasonal forecasts
This study uses ensemble forecasts provided by the European Centre for Medium-Range Weather Forecasts (ECMWF) as part of the S2S Prediction Project (Vitart et al., 2017). These S2S forecasts consist of two types of model runs: real-time forecasts and hindcasts. For each real-time forecast, initialized twice weekly during our study period, 20 hindcasts are launched, initialized at the same day of the year as the real-time run but during one of the previous 20 years. While the real-time forecasts are operationally used to make predictions, the hindcasts are used to construct a climatology for this run.
We use 10-member hindcasts (excluding the control member) corresponding to 25 real-time forecasts initialized regularly throughout the winter period 1 December 2020 to 28 February 2021. Each real-time initialization provides hindcasts for the previous 20 years, which gives a total of 500 hindcast ensembles covering the December-to-February (DJF) periods between 2000/2001 and 2019/2020. Within this paper, we analyse daily snapshots of 1000 hPa geopotential height (Z1000) and mean sea level pressure (MSLP) fields provided on a 2.5°×2.5° regular grid.
The use of 10-member hindcasts allows us to highlight the impact of individual storms on the ensemble spread. However, this process is equally important in larger ensembles, e.g. 51-member real-time forecasts. S2S forecasts aim to model the distribution of possible scenarios (including the actual evolution of the atmosphere), with extreme events like strong mid-latitude storms forming the tails of this distribution. In undersampled forecasts, it is possible to obtain estimates of this distribution in situations where storms are or are not predicted within the ensemble, hence allowing for a direct comparison of potential alternative realities (with and without storms). In well-sampled forecasts, situations where no storm is predicted within an ensemble are rare, but the general impact of the tail of the underlying probability distribution on the corresponding forecast spread remains the same. Throughout this paper, we use ensemble spread in terms of ensemble variance to quantify forecast uncertainty.
A daily climatology of our dataset is constructed as a lead-time-dependent average over all available forecasts, without any additional smoothing. Anomaly fields for each member and for the ensemble spread are computed as deviations from this climatology within the respective field.
2.2 Cyclone identification and tracking
We use a feature-based approach to identify extratropical cyclones (here simply denoted as storms) in the subseasonal model runs. The algorithm, developed by Wernli and Schwierz (2006) and refined by Sprenger et al. (2017), detects closed contours in mean sea level pressure (MSLP), enclosing one or several local MSLP minima. A time-dependent spatial storm mask is then defined via the area enclosed by the outermost closed contour of a storm. We further define a corresponding storm centre as the location of minimum MSLP within this closed contour and a storm strength as the value of this MSLP minimum (Pmin). Storm tracks (paths of the corresponding storm centres) are computed based on 6-hourly data; however, only daily values are used to match the available Z1000 data. To neglect weak and short-lived storms, we only consider storms with a total lifetime of at least 36 h and peak storm strength of Pmin<985 hPa along the track. For further information on the detection algorithm, see Sprenger et al. (2017). For an in-depth analysis of the biases in 6-hourly cyclone tracks in S2S forecasts, see Büeler et al. (2024).
2.3 Stratospheric polar vortex states
The stratospheric polar vortex state associated with a forecast is defined based on the zonal mean zonal wind at 10 hPa and 60° N ( index) in the initial conditions. Forecasts with the lowest and highest 20 % of initial are classified as weak and strong vortex forecasts, respectively. The remaining 60 % of forecasts are classified as having a moderate vortex.
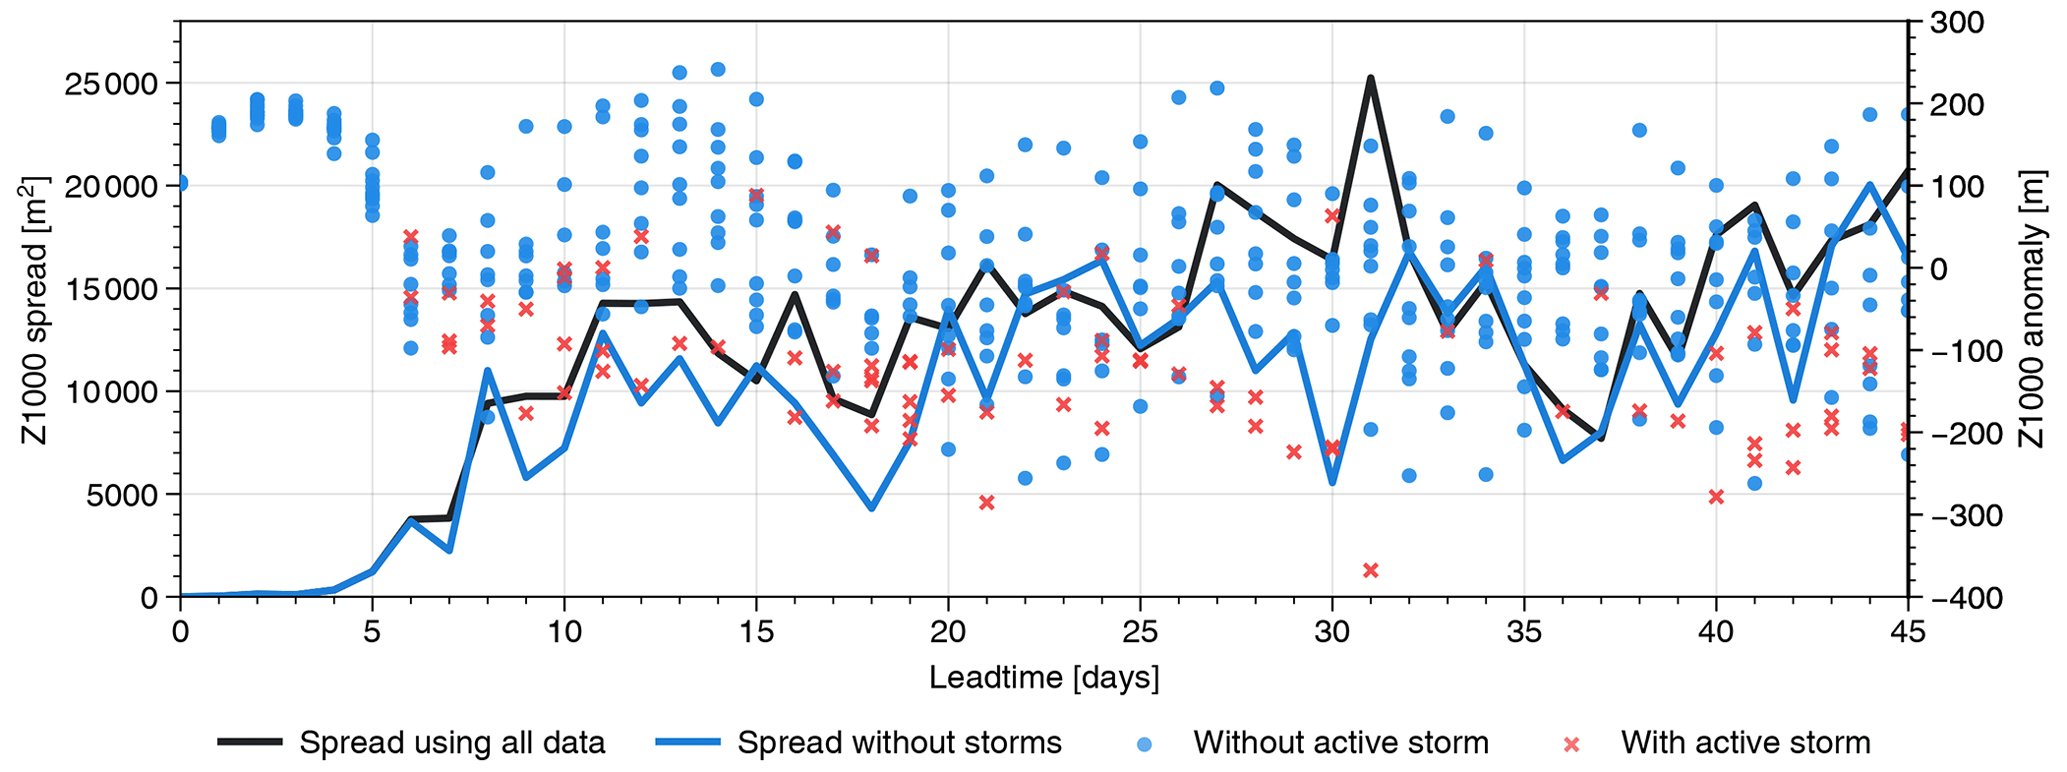
Figure 1Evolution of Z1000 anomalies and associated ensemble spread averaged over northern Europe (thick green box in Fig. 2) for the hindcast with initial conditions from 31 December 2007. Blue and red markers show Z1000 anomalies for each member and lead time, with red crosses indicating member–lead time combinations that exhibit a strong storm in the vicinity of the target region (thin green box in Fig. 2). The black line shows the ensemble spread of the full 10-member ensemble, while the blue line shows the spread of the ensemble without accounting for storms (i.e. without red crosses). Note the strong storm with large negative Z1000 anomaly in member 6 on day 31.
Intense extratropical cyclones (or storms) and their associated fronts are devastating natural hazards and represent extremes of synoptic variability over the Euro-Atlantic sector. They can be associated with negative MSLP anomalies of several tens of hectopascals and Z1000 anomalies of several hundred metres, especially during winter months. Hence, atmospheric conditions involving a strong active storm generally form extreme outliers and fall within the negative tail of the climatological Z1000 distribution over Europe.
At subseasonal-to-seasonal (S2S) timescales, tropospheric mid-latitude ensemble forecasts show very limited skill. However, the distribution of ensemble members at those lead times can, based on a perfect-model assumption, be interpreted as the distribution of possible atmospheric states for the given set of boundary conditions and external forcings. In the mid-latitudes, extreme storms occur within the heavy negative tail of this Z1000 distribution. Hence, when one or a few members in the ensemble simulate strong storms, these ensemble forecasts tend to be associated with a large ensemble spread, i.e. large uncertainty, in that region. Thus, the occurrence likelihood of storms generally couples to the forecast uncertainty.
To highlight the connection between the occurrence of strong storms and the associated uncertainty in subseasonal Z1000 forecasts over Europe, in Fig. 1 we consider, as an example, the Z1000 forecast initialized on 31st December 2007 and the evolution of the associated forecast spread in terms of ensemble variance as. Our target area is northern Europe (55–67.5° N and 0–20° E), motivated by the region of reduced ensemble spread following weak stratospheric polar vortex events found by Spaeth et al. (2024a). At early lead times ensemble spread (and hence uncertainty) of Z1000 increases rapidly until saturation after approximately 2 weeks, although some variability persists due to insufficient sampling within the 10-member ensemble. The small ensemble size allows us to further highlight the impact of storms forming within individual ensemble members, as can be seen on lead time day 31. Here, a single ensemble member (member 6) develops a strong storm over the target region in northern Europe, leading to Z1000 anomalies of about −400 m, while all other members show Z1000 anomalies of ±200 m. This outlier produced by the presence of a storm leads to a sharp peak in ensemble spread, exceeding 25 000 m2. Figure 1 further indicates which ensemble members model an active storm in the vicinity of the target domain (within 5° around the border) at given lead time days (shown as red crosses). If we remove all those member–lead time combinations associated with an active strong storm (i.e. essentially creating a dataset without storms), the ensemble variance is significantly smaller on day 31. We further see an overall reduction in spread when removing storms from the forecast. Note that we also find situations where removing storms slightly increases the spread. These are typically associated with storms for which the storm centre lies at the very edge of the target area but the corresponding Z1000 anomaly mostly lies outside. The associated ensemble member can then have a Z1000 anomaly inside the target area close to the ensemble mean and removing it might increase the spread.
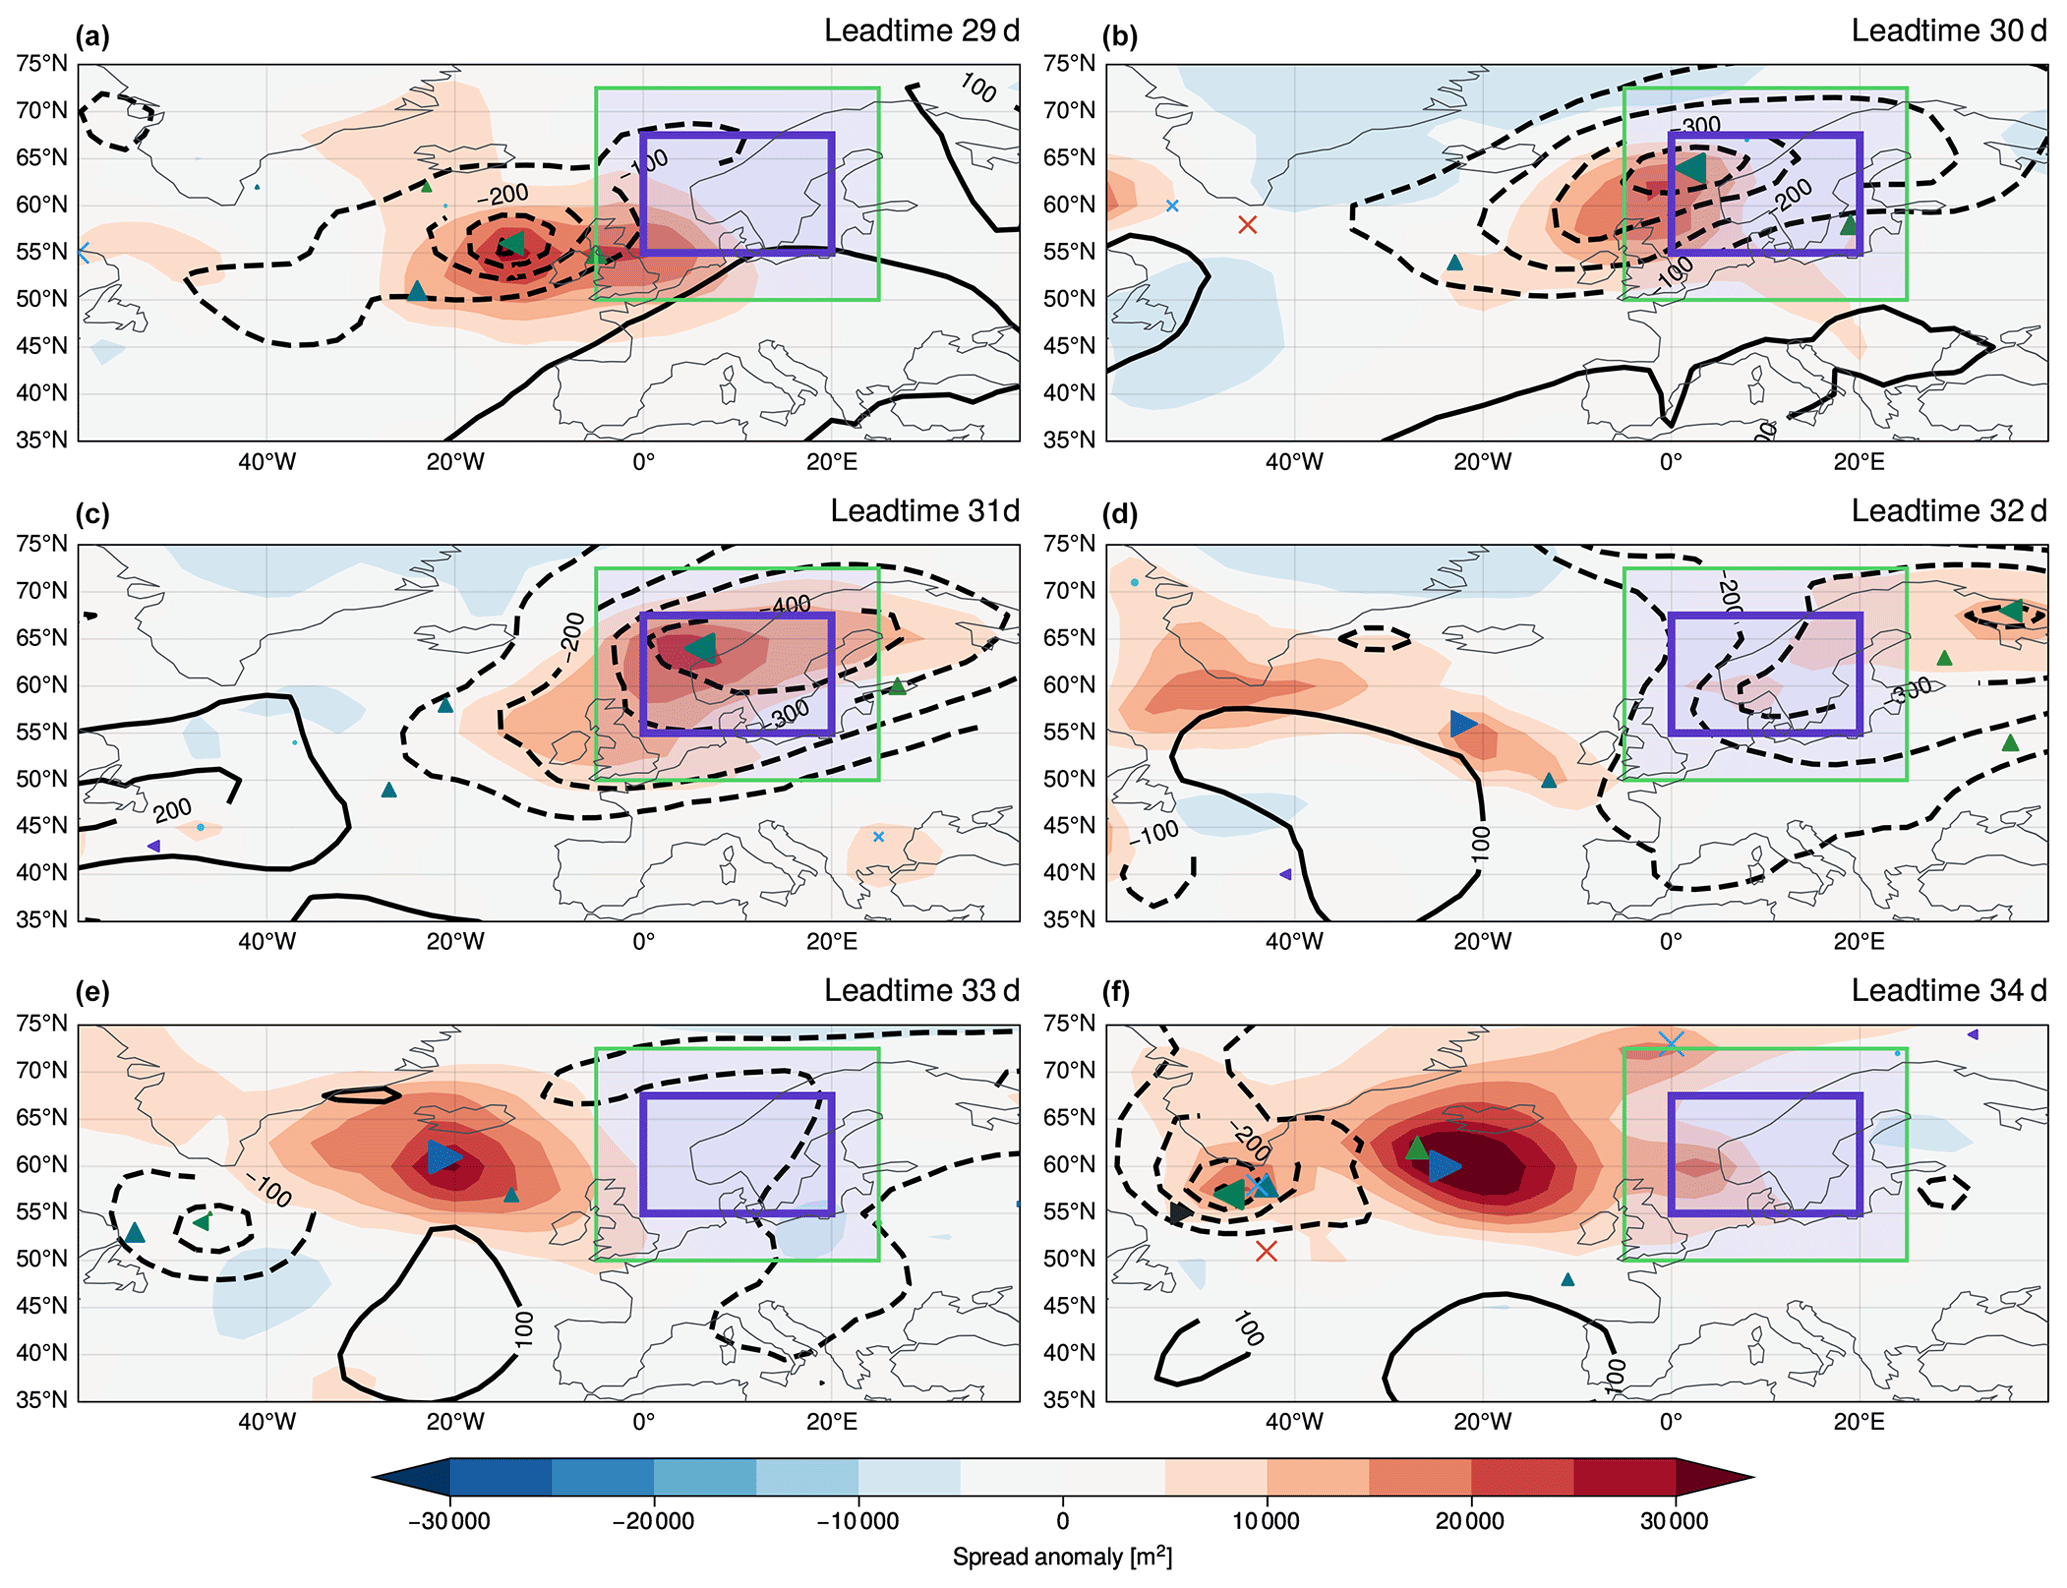
Figure 2Z1000 anomalies (contours) and associated spread anomalies (shading) over the Euro-Atlantic sector during selected lead time days in member 6 of the hindcast with initial conditions from 31 December 2007. Anomalies calculated as deviations from climatology (average over all ensembles; see Sect. 2). Markers indicate the centre location of strong storms in all of the members, with storms in different members shown as different marker shapes and colours. Marker sizes scaled with storm strength (Pmin). The thick purple box indicates the northern European region that Fig. 1 is averaged over. The thin green box shows the region used to identify members with active storms.
To further understand the dynamical processes associated with the reduction in Z1000 ensemble spread in the case study discussed above and its connection to the synoptic storm occurrence, we analyse the spatial distribution of Z1000 and ensemble spread anomalies in member 6 of the forecast at different lead times (Fig. 2). Member 6 simulates a strong storm (left-facing green triangle) on day 29 at around 55° N and 25° W. The storm is characterized by a pronounced Z1000 anomaly minimum of roughly 400 m magnitude during its peak (also seen in Fig. 1). This feature in the single member results in large spread across all ensemble members: the vicinity of the member 6 storm is characterized by a clear positive ensemble variance anomaly of about 25 000 m2 magnitude. Over the next few days, the storm propagates eastward through our target region (purple box) over northern Europe, with the spread signal closely following the storm. Figures 1 and 2 suggest that the ensemble variance would be substantially smaller if this one member did not develop a strong storm. On day 32, a new strong storm develops in a different member (right-facing blue triangle) around 55° N and 20° W, gradually strengthening over the next few days and again accompanied by a strong ensemble spread signature.
In the previous section, a connection of strong mid-latitude storms with increased Z1000 ensemble spread over northern Europe has been analysed for a specific case (Sect. 3). Here, we establish a more general connection between the occurrence of storms within an ensemble and anomalies in ensemble spread. To this end, Fig. 3a shows a storm-centred composite averaged over all strong storms detected within the Euro-Atlantic sector (30–80° N and 80° W–40° E). On average, strong storms (defined as in Sect. 3) have length scales of about 2000 km and magnitudes of around 200 m geopotential height anomaly. These large Z1000 anomalies lead to a heavy negative tail of the corresponding probability distribution. Within our 10-member ensembles, a single storm centre is therefore associated, on average, with an increase in ensemble spread of about 50 % relative to the climatological spread (i.e. spread averaged over all available ensembles).
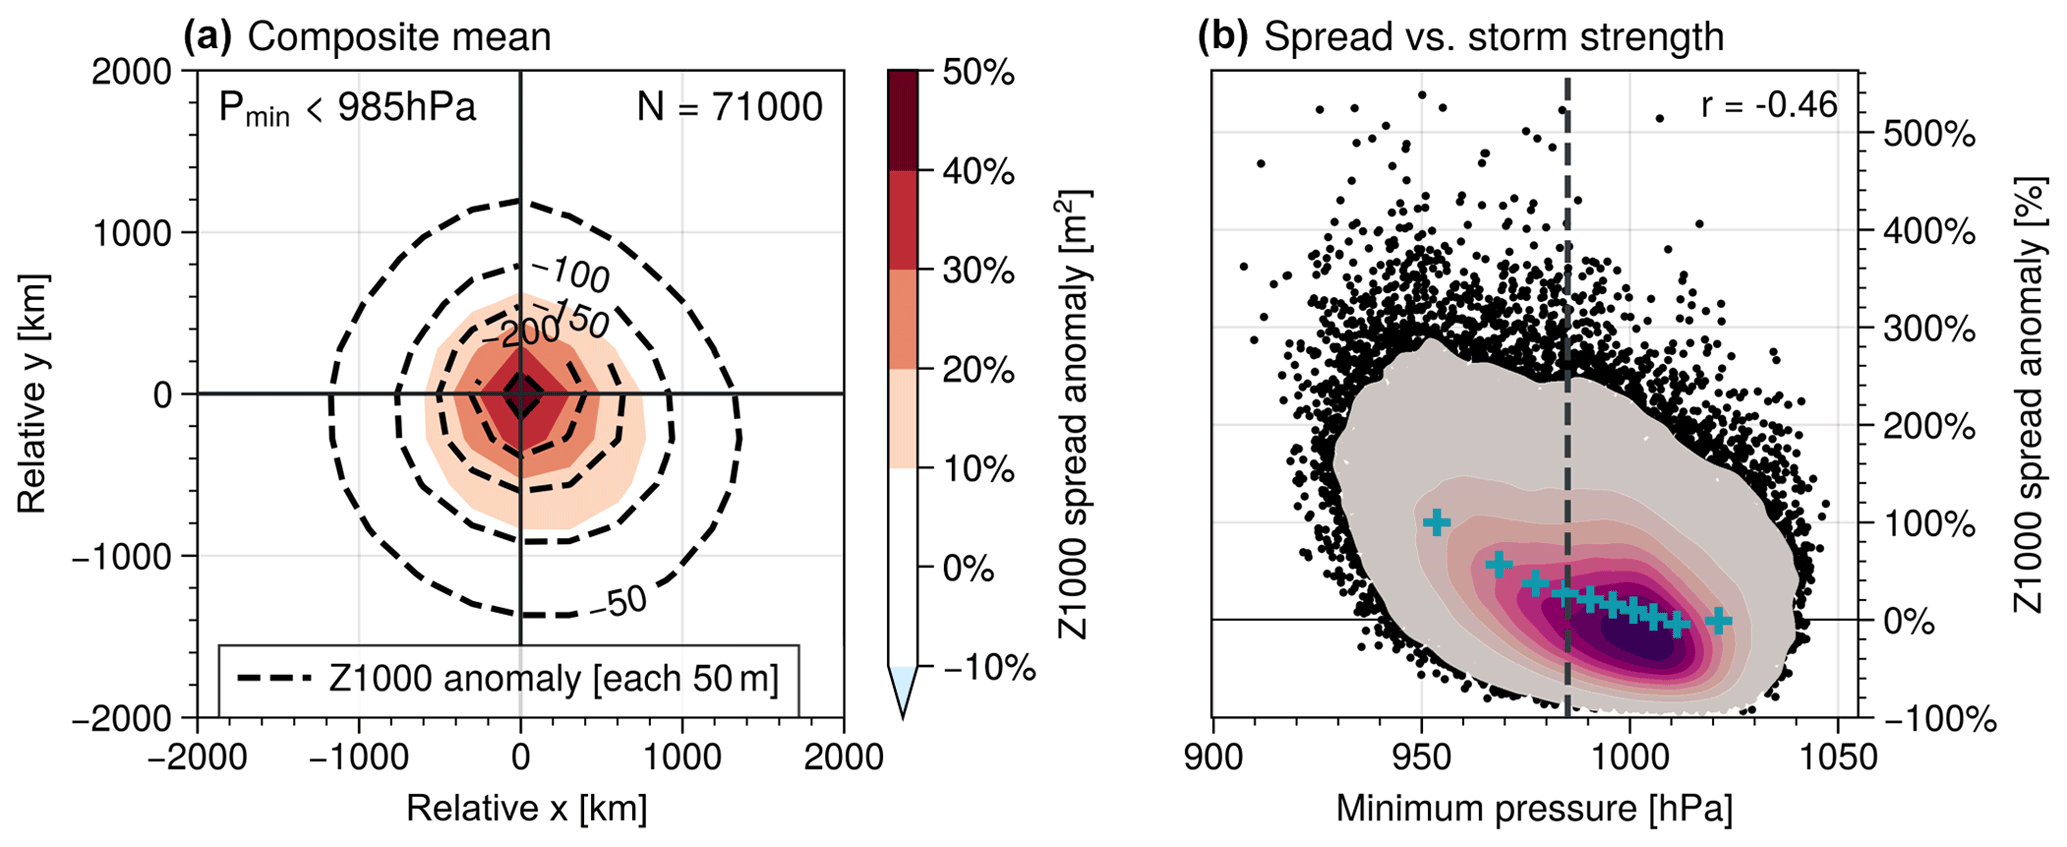
Figure 3(a) Storm-centred composite, averaged over 71 000 strong storms within the Euro-Atlantic sector during their day of maximum strength (i.e. minimum Pmin). The composite is calculated in terms of zonal (x) and meridional (y) distance from the storm centre. Contours show Z1000 anomalies, while shading shows spread anomaly relative to the climatological spread. (b) Scatter plot of Z1000 ensemble spread anomaly at the storm centre relative to climatology vs. corresponding storm strength as Pmin. All storms in the Euro-Atlantic sector are considered. Black dots correspond to individual storms, shading visualizes the distribution. Blue crosses show averages of subsets given by 10 quantiles in Pmin, i.e. along the x axis. The correlation coefficient of is based on all black points. The vertical dashed line indicates the threshold of 985 hPa used to classify strong storms.
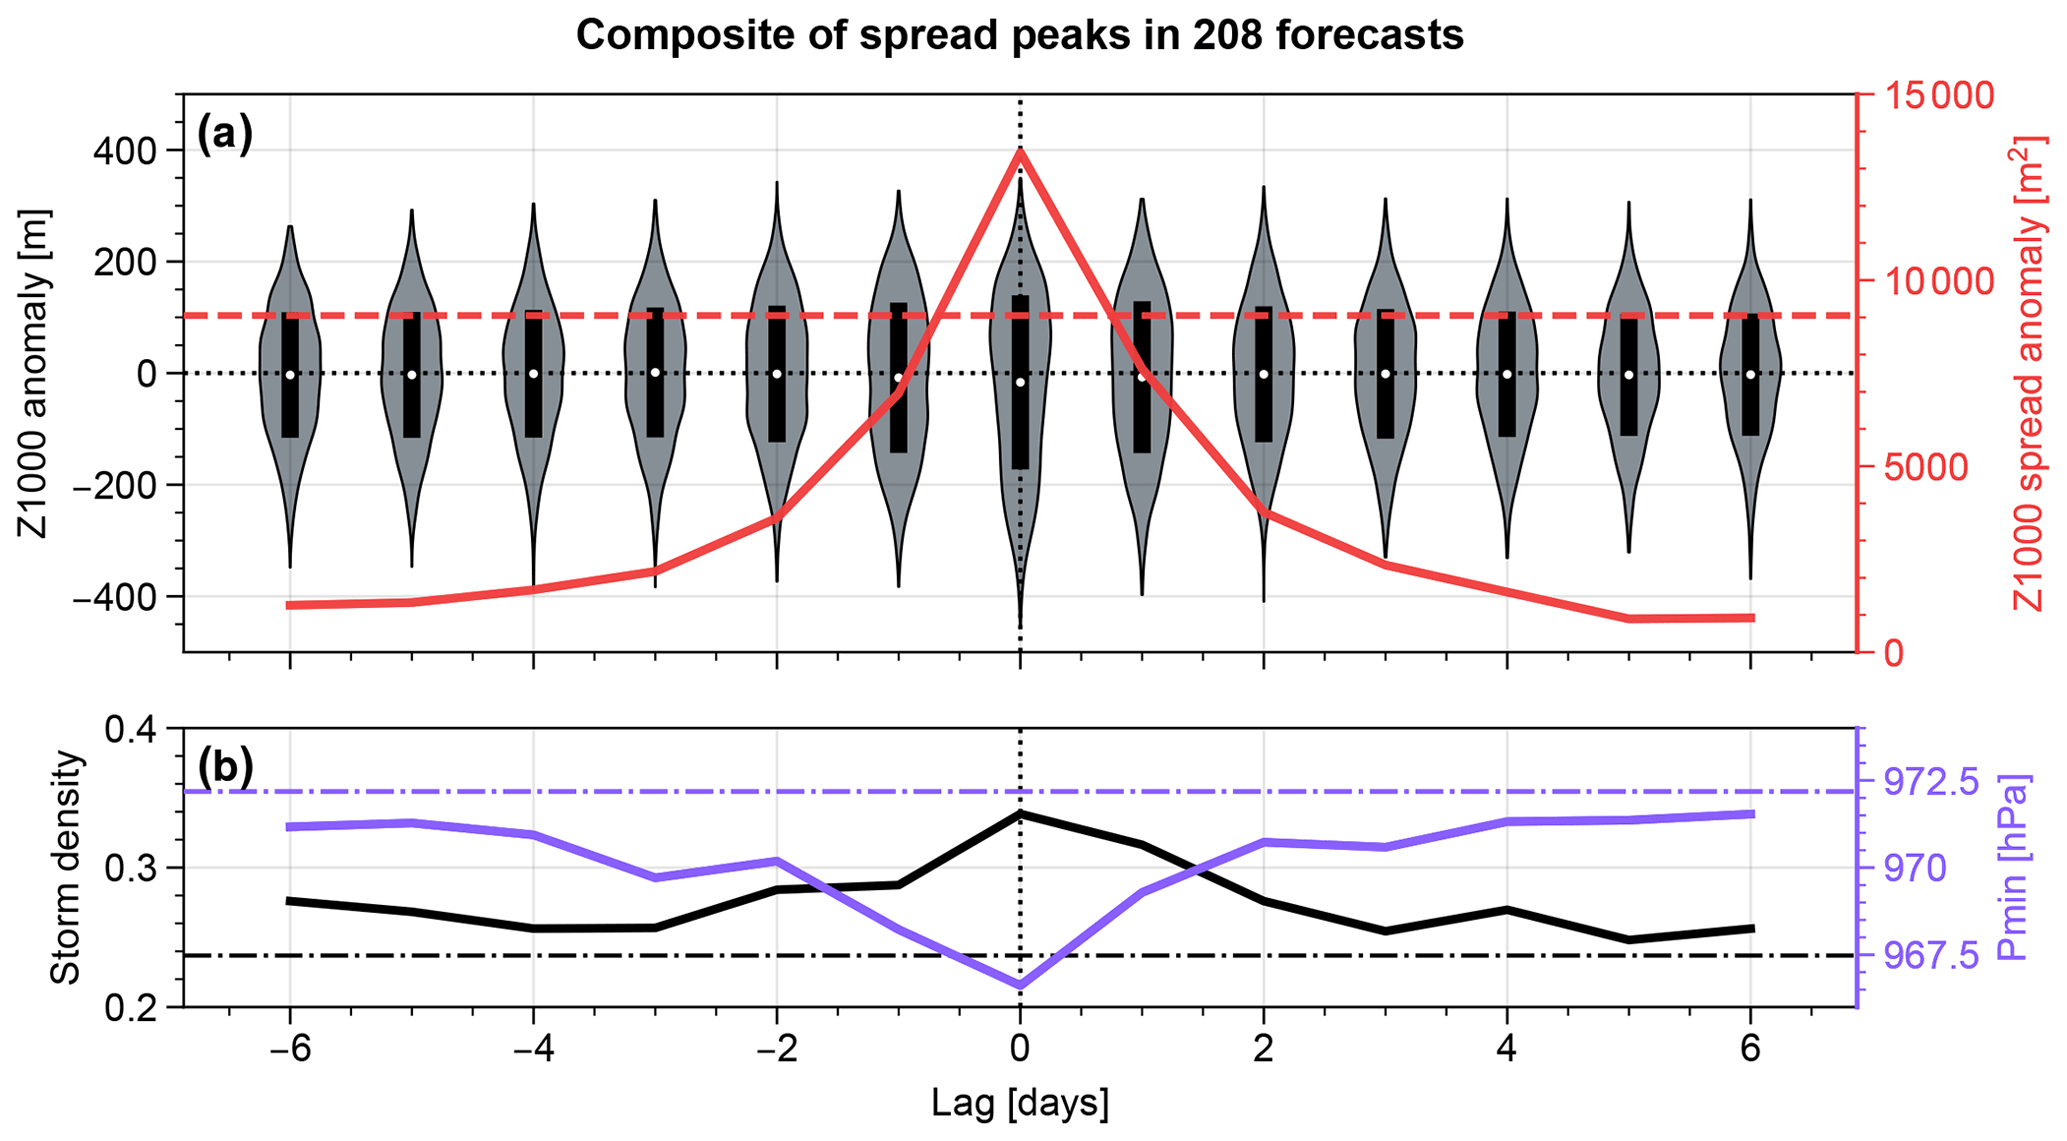
Figure 4Lag composite over 208 peaks in ensemble spread of Z1000 averaged over northern Europe (purple box in Fig. 2). (a) The distributions of Z1000 anomalies are shown as violin plots, while the mean ensemble spread is shown as a solid red line. The horizontal dashed line indicates the climatological 95th percentile of the spread. (b) Composite mean evolution of storm density (in storms per member and day) and mean strength (as Pmin) of storms (within the green box in Fig. 2). The horizontal dashed–dotted lines indicate climatological mean values.
While Fig. 3a illustrates the average effect of individual storms on the ensemble spread, Fig. 3b shows that the strength of this effect correlates with the strength of the storms (correlation coefficient ). Stronger storms generally form larger negative tails in the Z1000 distribution and are therefore associated with increased spread anomaly. Figure 3b further shows that the effect is only present for strong storms that form extreme values in Z1000.
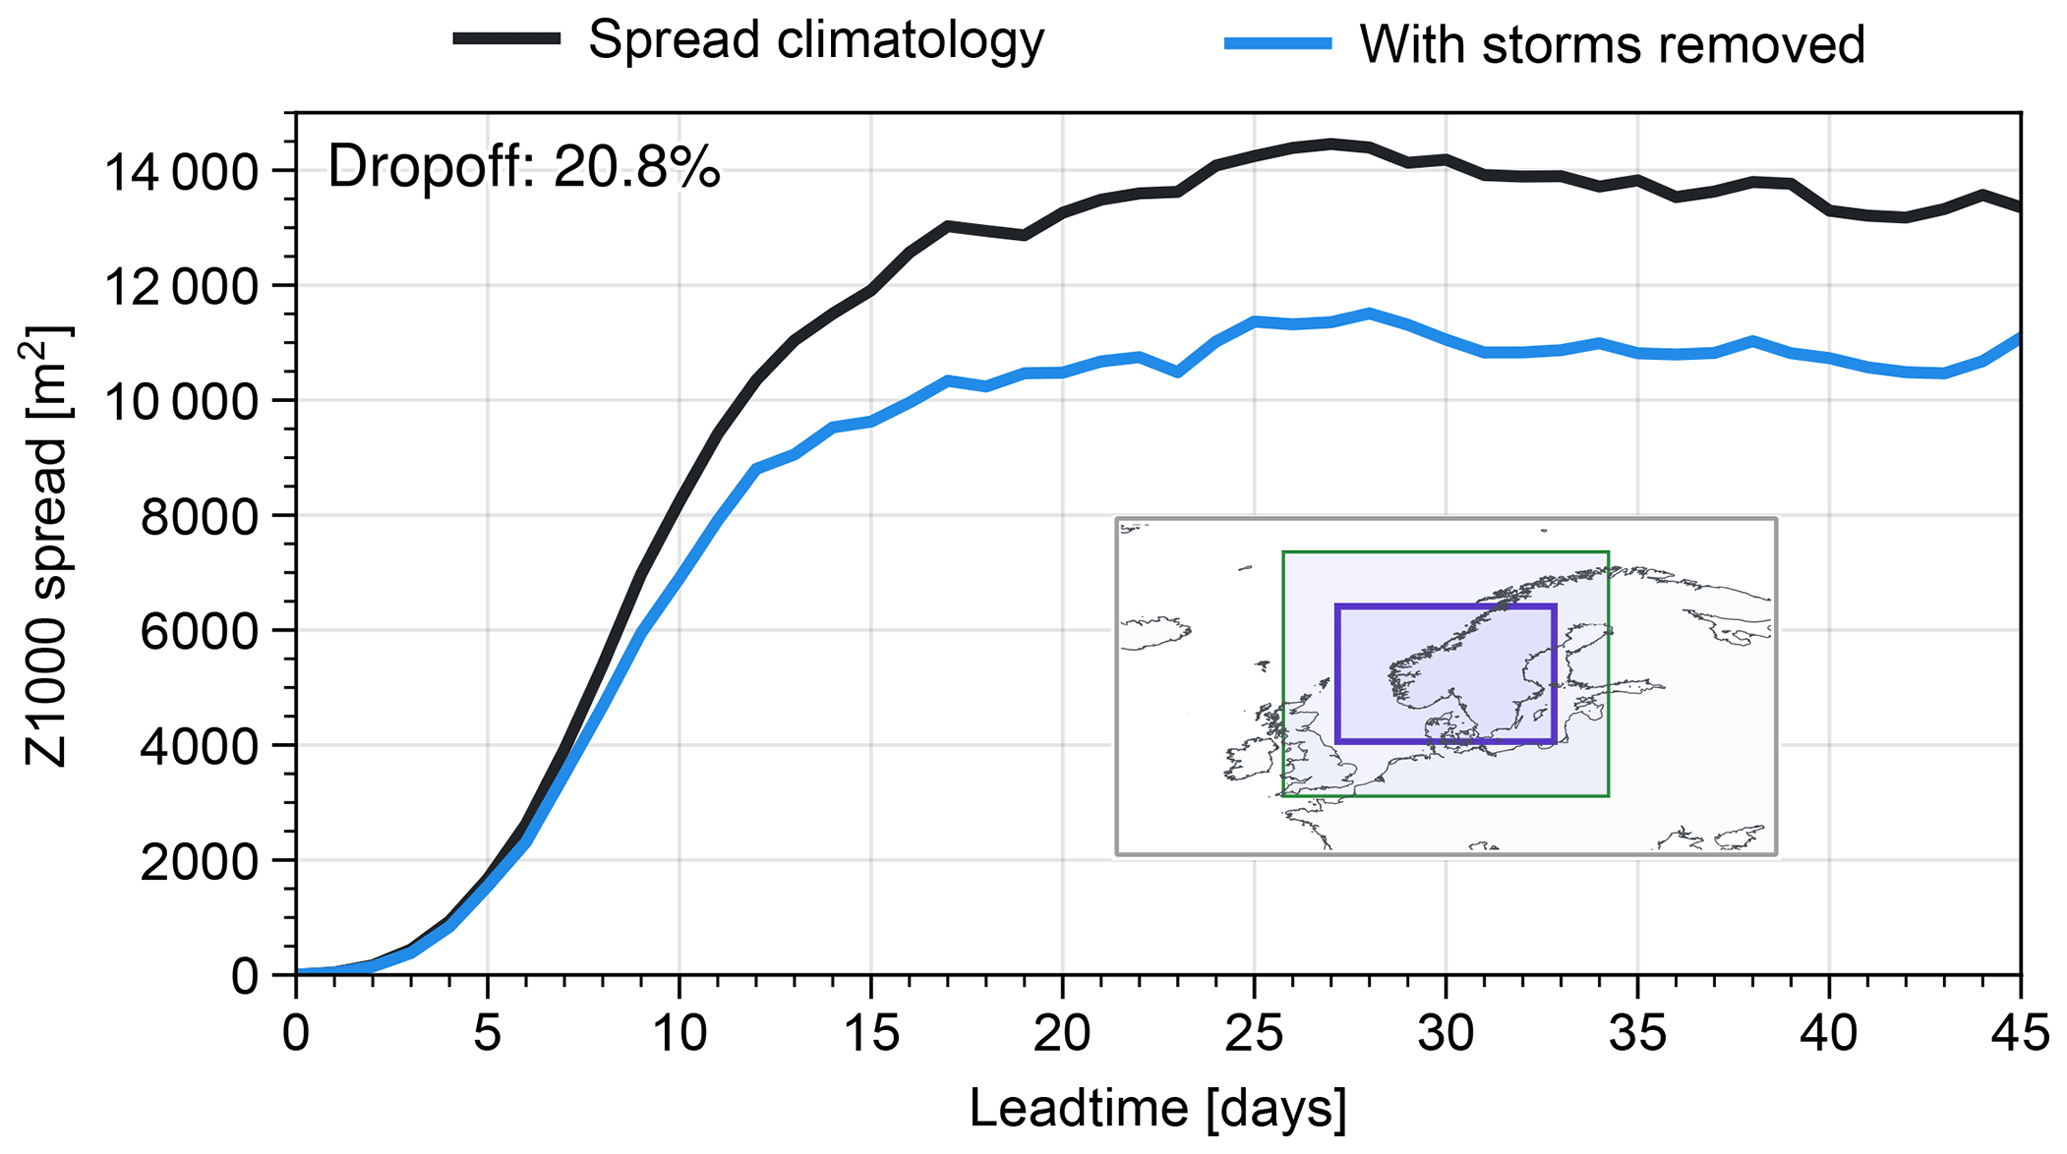
Figure 5Evolution of Z1000 ensemble spread averaged over northern Europe (purple box) and over all forecasts. Here we show the spread computed based on all available data (climatology) and a dataset where member–lead time combinations with an active strong storm over northern Europe (green box) are removed. Removing storms leads to a significant drop-off (about 20 %) in the spread during lead time days 20–40.
The extreme Z1000 signature of storms is intuitively related to the spread within ensemble forecasts. However, it is not clear how strong this effect is and what its quantitative contribution is to the overall spread. To gain further insights into the connection of extreme spread and storms, we apply an event composite approach. We identify events with large Z1000 ensemble spread over northern Europe, similar to the event on lead time day 31 of the case study shown in Fig. 1. The central day of an event is defined as the time of maximum ensemble variance within a forecast, given that the variance exceeds the 95th climatological percentile. Figure 4a shows a lag composite of the 208 large-spread events identified in our dataset. While the increase in ensemble spread at lag day 0 is per construction, the associated Z1000 anomaly distribution is strongly skewed and associated with a heavy tail at extreme negative values. At the same time, Fig. 4b shows the likelihood of storm occurrences over northern Europe to be increased substantially and storms to be even stronger (lower Pmin) during these large-spread events. The signals in storm density and strength suggest increased storm activity to be a significant contributor to such events with extreme spread.
Figure 3a and b indicate a substantial contribution of synoptic storm activity to the formation of spread extremes. But how much impact do storms have on the overall mean spread within a subseasonal forecast? To answer this question, Fig. 5 shows two versions of forecast spread evaluation over northern Europe averaged over all available hindcasts: a version as a simple climatology including all data and a version where all storms are disregarded when computing the spread. Storms are “removed” by not accounting for a certain data point if the corresponding member contains an active strong storm around our target region at the corresponding lead time (as also shown in Fig. 1 for a single forecast). Without storms, the northern European Z1000 ensemble spread drops by more than 20 % at subseasonal lead times.
We have established a systematic connection between storm activity and ensemble spread in northern European Z1000 forecasts on S2S timescales, with storm activity contributing about 20 % to the overall spread during winter. As a result, processes that modify the characteristics of the storm track (e.g. its position or shape) or individual storms (e.g. strength or occurrence frequency) should also project on the forecast uncertainty. In particular, this connection holds for large-scale teleconnections or climate change.
For example, Spaeth et al. (2024a) found a systematic reduction in Z1000 ensemble spread over northern Europe in S2S forecasts initialized during a weak phase of the stratospheric polar vortex. They further suggested that this reduction primarily results from a southward shift of the mid-latitude jet and associated North Atlantic storm track. Such an equatorward shift in the storm track is consistent with the negative phase of the NAO that is part of the canonical weak vortex signature (e.g. Afargan-Gerstman et al., 2024). In this section, we investigate in more detail if and how changes in storm tracks and the likelihood distributions of individual storms can contribute to the negative spread anomaly found over Europe following weak stratospheric polar vortex periods.
Figure 6a illustrates the changes in northern European Z1000 ensemble spread depending on the stratospheric polar vortex state in S2S forecasts during initialization. Weak polar vortex states are associated with substantially lower spread compared to strong polar vortex states. At the same time, Fig. 6b and c shows that fewer and weaker storms reach northern Europe following periods with weak polar vortex, while a strong polar vortex leads to more and stronger storms. As we have shown in Sect. 4, both storm density and strength can affect the Z1000 ensemble spread. All three quantities (Z1000 spread, storm density and storm strength over northern Europe) show significantly larger differences between initializations with weak and neutral polar vortexes than between initializations with neutral and strong vortexes. This asymmetry could point to a fundamental difference in the downward influence of positive and negative polar vortex anomalies.
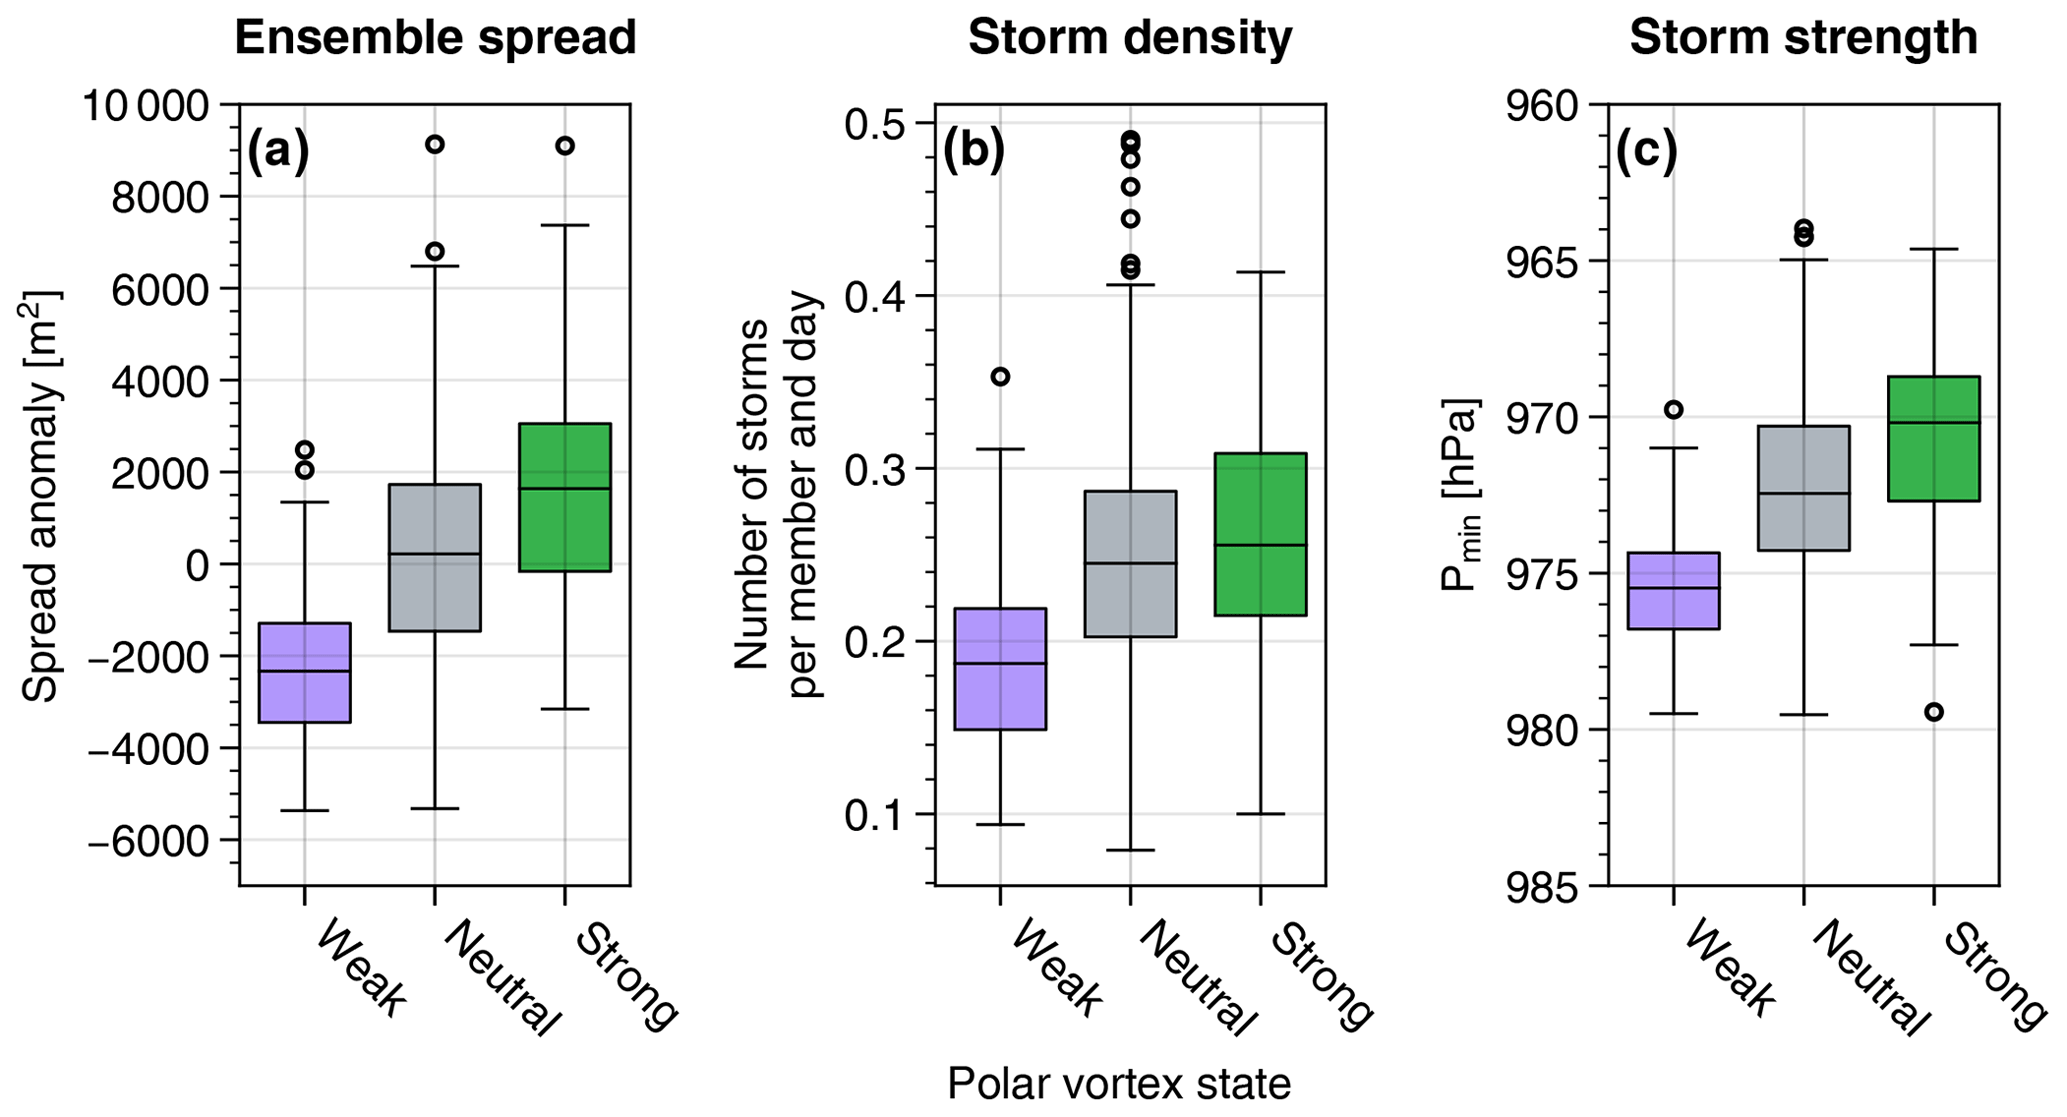
Figure 6Boxplots showing the mean Z1000 ensemble spread anomaly (a), storm density (b) and storm strength (c) over northern Europe (green box in Fig. 2) for hindcasts with varying stratospheric polar vortex strength. Hindcasts are classified as having a weak or strong polar vortex if their index at initialization lies within the lowest or highest 20 %, respectively, and a neutral vortex otherwise. Note the orientation of the y axis in (c).
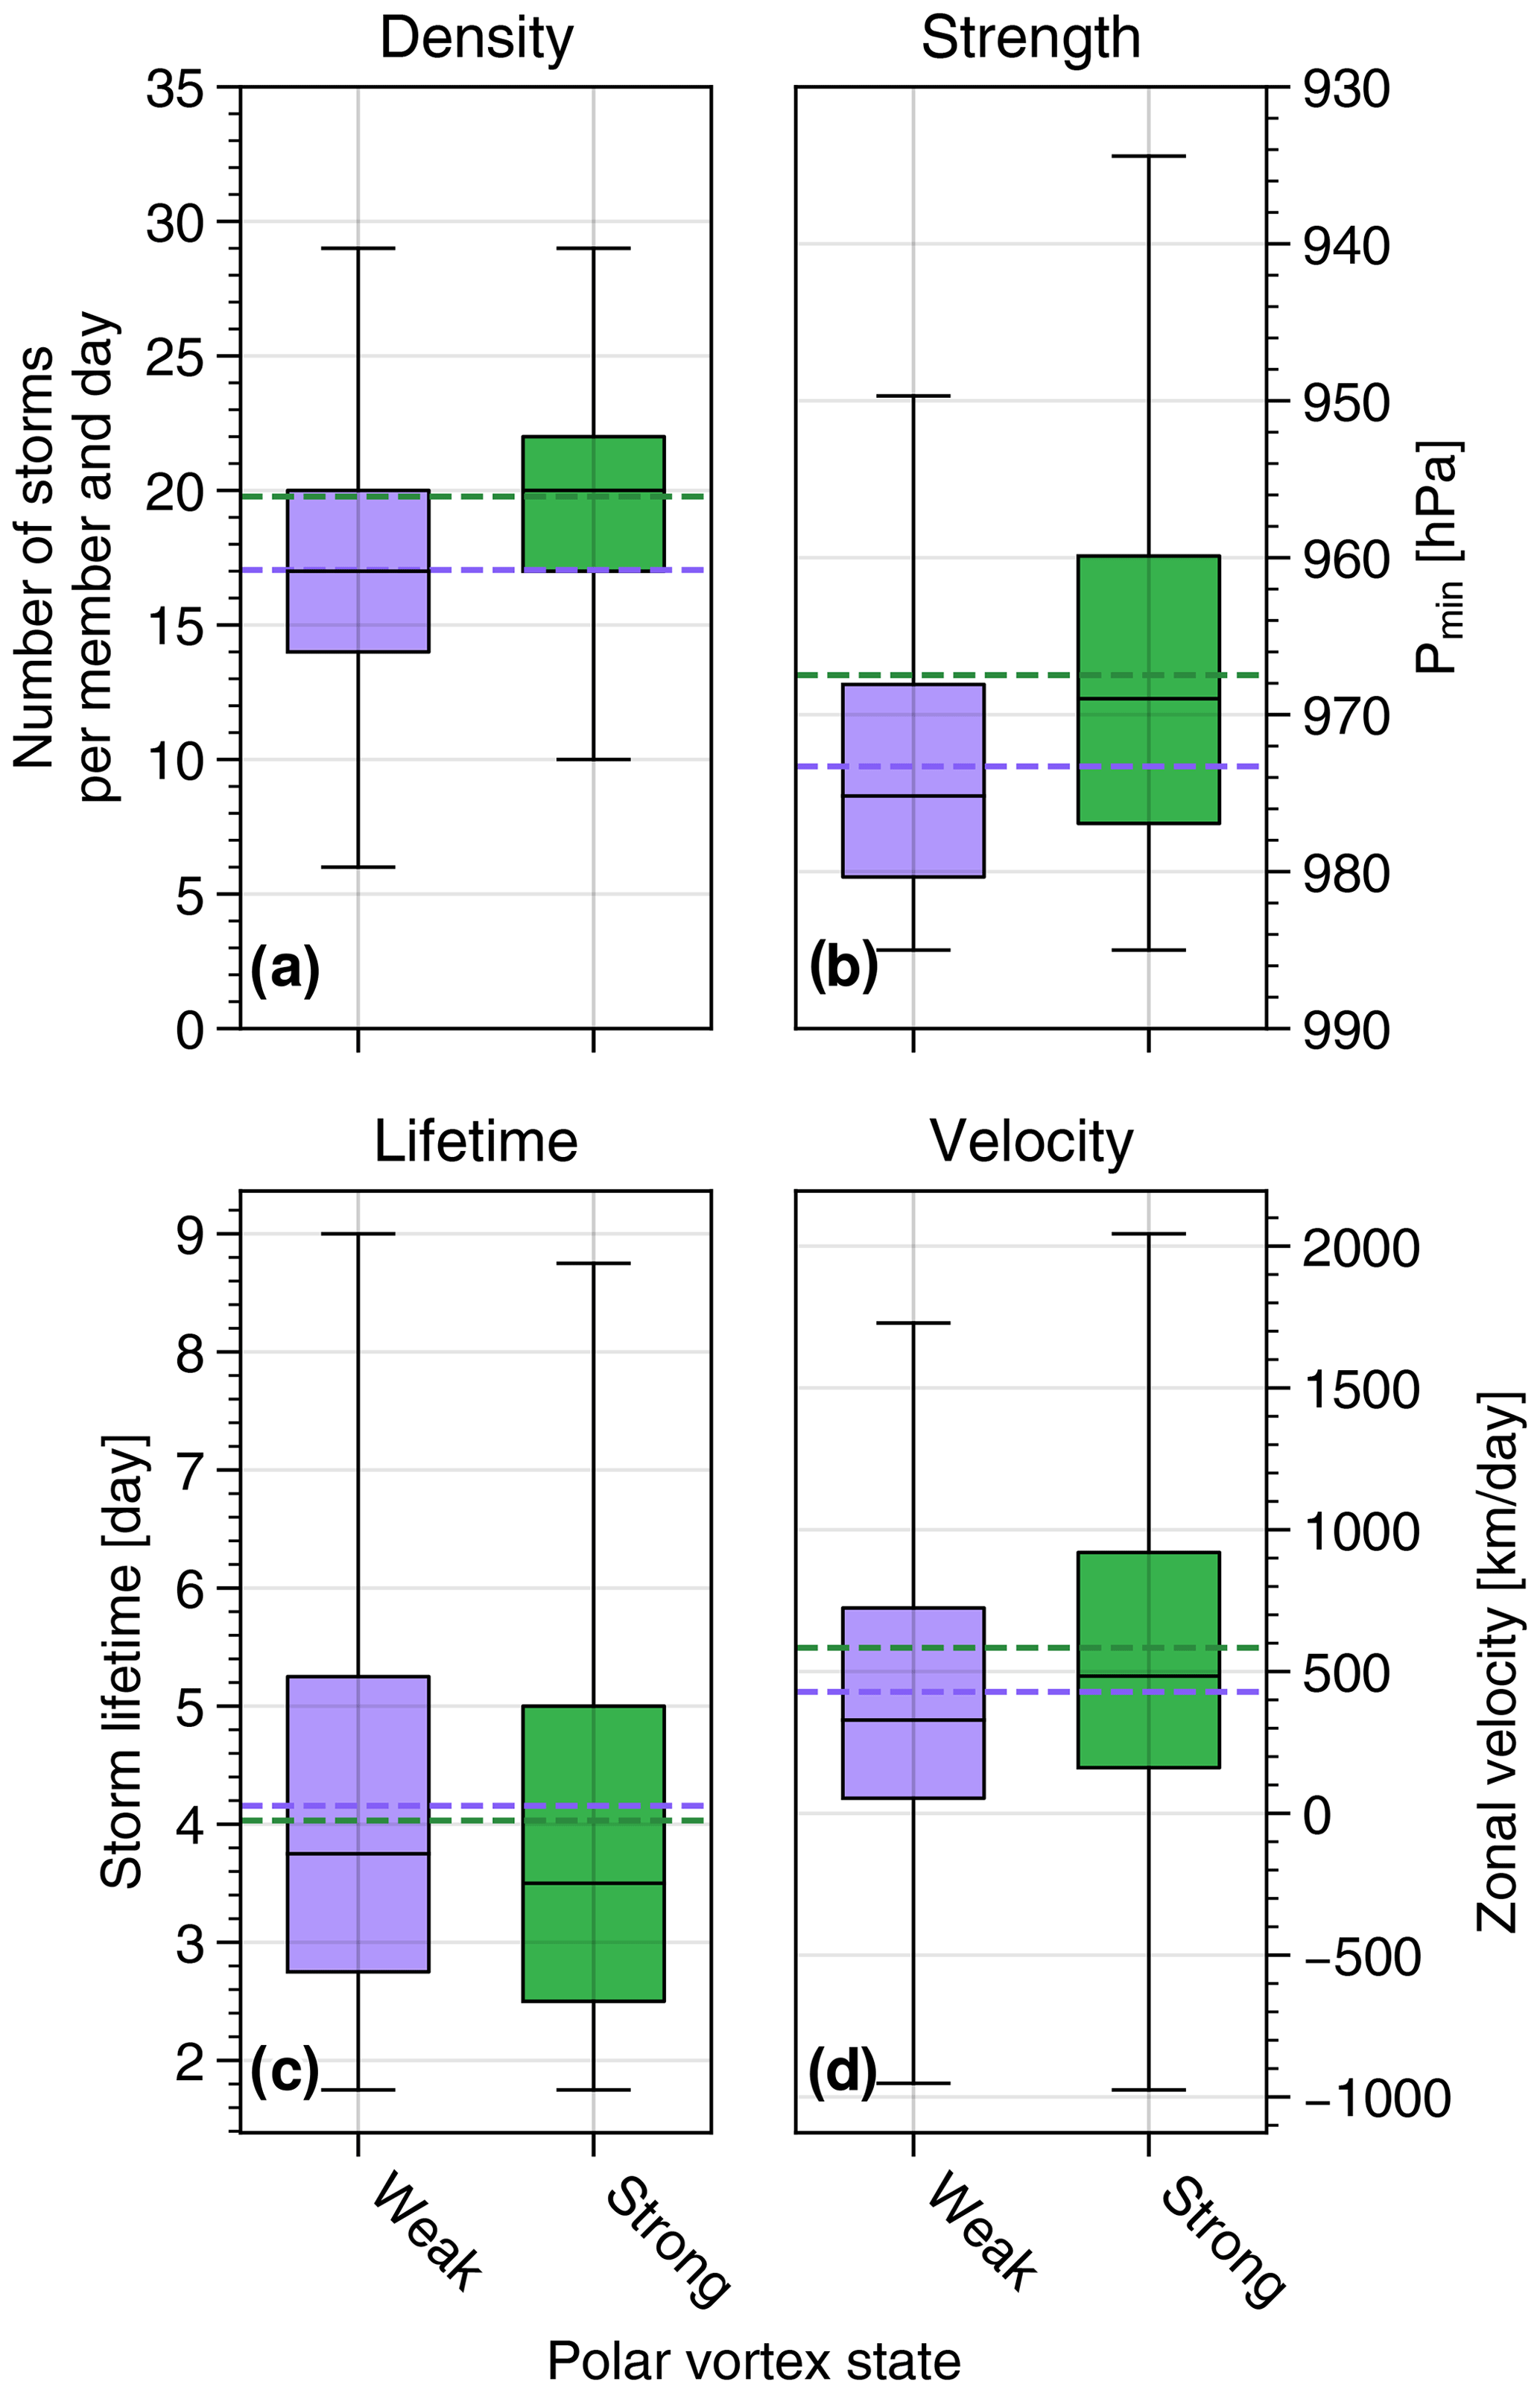
Figure 7Different characteristics of strong storms within the Euro-Atlantic sector (30–80° N and 80° W–40° E) within ensembles initialized with a weak or strong stratospheric polar vortex, defined as in Fig. 6. The distributions of storm density, strength, lifetime, and velocity are shown. Storm strength is computed by the minimum pressure along the track, lifetime by the total number of days the storm was identified, and velocity via a linear fit of the distance in zonal direction the storm travelled within each 6 h time step. All quantities are given for lead times 20 to 40 and averaged over the total number of members within each group. Horizontal dashed lines show the means of the corresponding distributions. Note the orientation of the y axis in panel (b).
The reduction in storm density over northern Europe during weak polar vortex periods (Fig. 6b) arises in part due to a reduction in the total frequency of storm genesis over the Euro-Atlantic sector (Fig. 7). In fact, the average number of strong storms developing per member and day over the Atlantic differs between weak and strong polar vortex initializations with 17.0 and 19.8 storms, respectively (Fig. 7a). Furthermore, Euro-Atlantic storms are generally weaker (Fig. 7b) and slightly reduced in zonal velocity (Fig. 7d) after periods with weak polar vortex.
To obtain more insights into how the stratosphere can influence the North Atlantic storm tracks, Fig. 8a visualizes the overall density of storms in forecasts at subseasonal lead times. The storm track clearly extends across the whole North Atlantic. Figure 8b and c further show the location of storm genesis and lysis (i.e. the regions where storm tracks start or end). Storms tend to be generated along the US East Coast and dissipate on their way to northern Europe. A hotspot of both genesis and lysis is visible near Southeast Greenland, likely due to interactions of the flow with prominent geographical features in that area (e.g. Schwierz and Davies, 2003; Skeie et al., 2006). Figure 8d shows the change in storm activity due to weak SPV conditions. Following weak vortex conditions, a clear anomalous dipole structure is visible, indicating a southward shift of the climatological storm track. Figure 8e and f further support a similar pattern, with a more southward genesis and lysis of the midlatitude storm track.
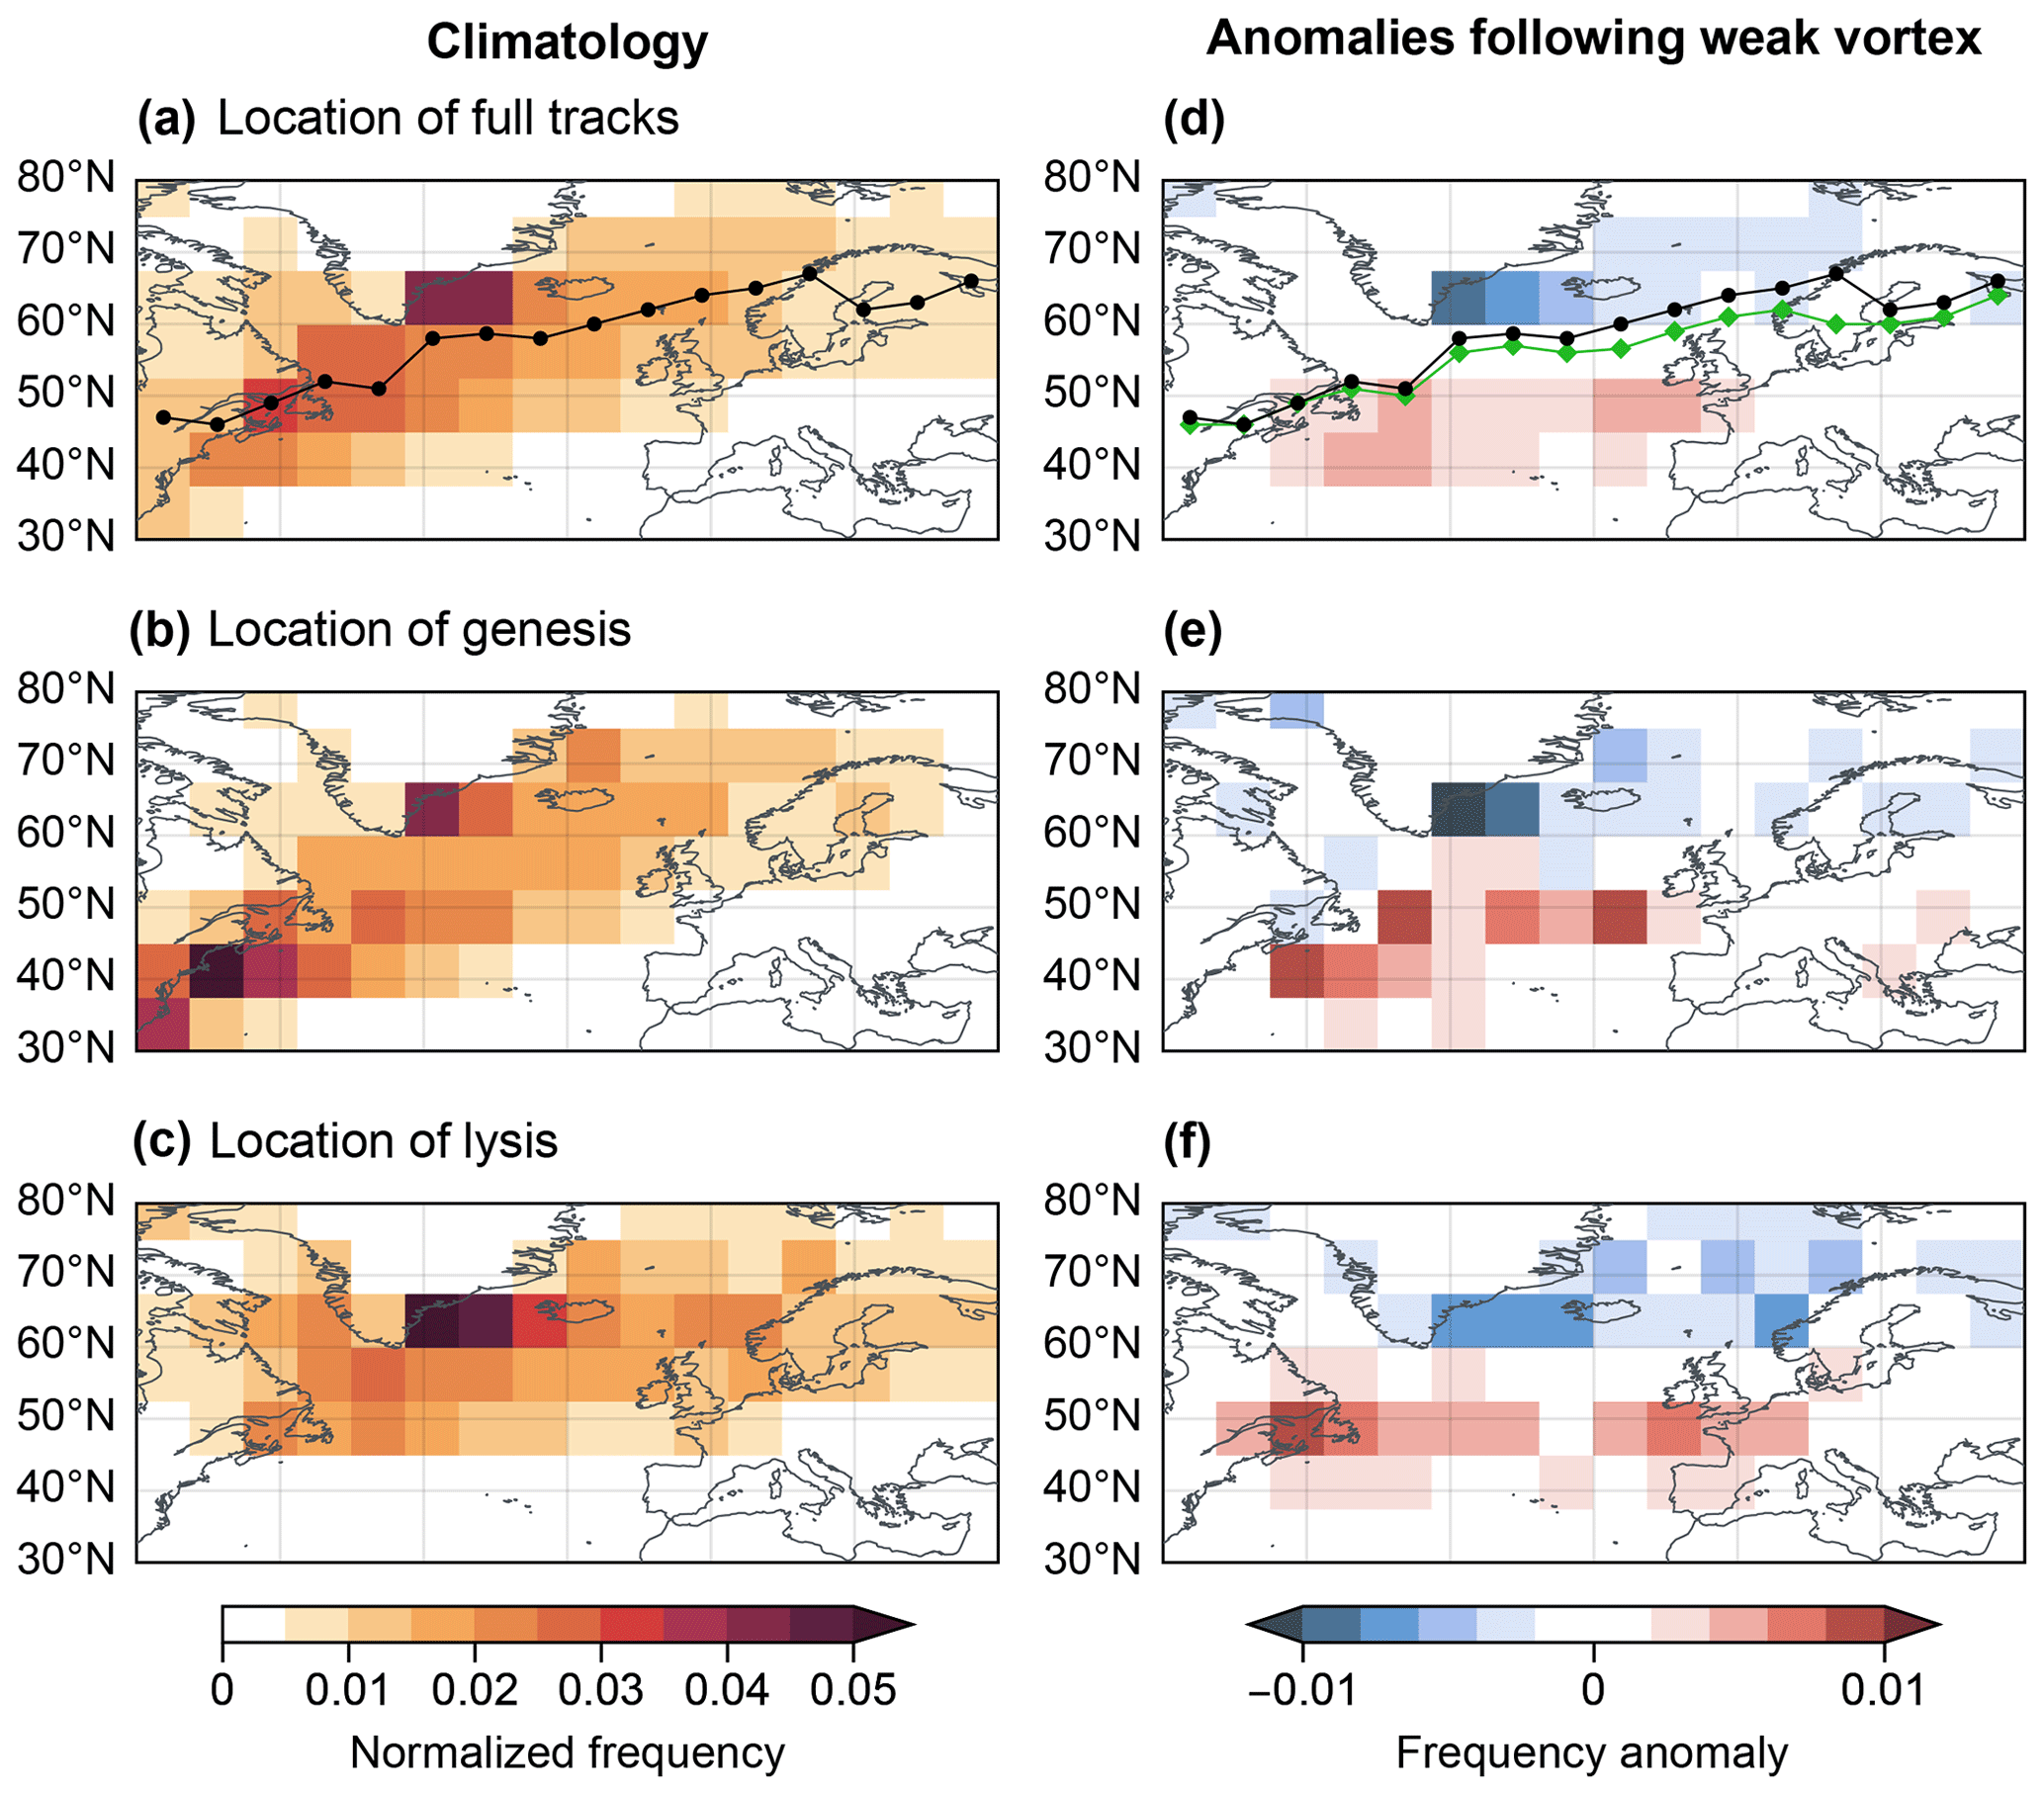
Figure 8Density of storm centre locations during lead time days 20 to 40. (a) Density of the full tracks (all time steps combined), with the black line indicating the mean track (mean latitude for each longitude bin); (b) density of the genesis location (first step of each track); and (c) lysis location (last step of each track). Densities are given as fractions of storms within 7.5°×7.5° bin compared to the total number of storms. Panels (d)–(f) show the differences between densities computed based on all ensembles (climatology) and ensembles initialized with a weak stratospheric polar vortex. The green line in (d) indicates the mean track during weak polar vortex conditions.
This study systematically quantifies the influence of synoptic storm characteristics of ensemble spread over northern Europe on subseasonal-to-seasonal (S2S) timescales. We find that strong storms contribute approximately 20 % to the mean Z1000 (geopotential height at 1000 hPa) ensemble spread over northern Europe, indicating their substantial role in determining forecast uncertainty. This contribution underscores the importance of understanding processes associated with changes in the North Atlantic storm track or the characteristics of individual storms, as these factors also project onto forecast uncertainty in this region. For an unbiased model, a uncertainty reduction can in general translate into improved predictions. Indeed, Spaeth et al. (2024b) showed in their supporting information that the northern European Z1000 spread correlates well with forecast errors in the ECMWF model.
Our analysis reveals that both the occurrence frequency and intensity of mid-latitude storms are crucial in increasing ensemble spread, with stronger storms associated with a heavier negative tail in the Z1000 probability distribution. Additionally, specific atmospheric conditions, such as weak stratospheric polar vortex (SPV) states, lead to decreased storm activity over northern Europe (consistent with Afargan-Gerstman et al., 2024), resulting in reduced ensemble spread. This reduction is primarily due to a southward shift of the North Atlantic storm track, combined with a general decrease in storm strength and sparser storm genesis over the North Atlantic. Besides changes in strength and frequency, we do not find the storm lifetime to depend on different stratospheric states. However, there is a reduction in the average zonal velocity of storms by about 25 % from 580 km d−1 following strong vortex conditions to 430 km d−1 following weak vortex conditions (Fig. 7d). This could indicate a general shortening of the storm track during weak vortex periods, although Fig. 8c does not clearly indicate a shortening in terms of more westward cyclolysis.
Over northern Europe, the weakening, southward shift and potential shortening of the North Atlantic storm track are all consistent with a reduction in storm count and strength, as shown in Fig. 6b and c. The results of Sect. 4 suggest a clear connection between storm activity and ensemble spread. The identified changes in storm track characteristics following weak polar vortex states likely contribute to the anomaly in forecast spread over northern Europe (Fig. 6a). These findings align with previous studies, such as those by Spaeth et al. (2024a), and suggest that the state of the SPV significantly influences the predictability of weather patterns over northern Europe, creating “windows of opportunity” where forecast uncertainty is notably reduced.
As discussed in Sect. 2, we used 10-member ensembles to highlight the influence of individual storms on forecast uncertainty. The influence of a single storm (such as in Fig. 3a) generally depends on ensemble size, with larger ensembles reducing the likelihood of forecasting no storms or only a few storms on a certain day. However, the total influence of all storms within the system (as in Fig. 5) should be insensitive to ensemble size, as it primarily depends on the shape of the underlying probability distribution for the given set of boundary conditions and external forcings. A sensitivity analysis where we considered only 5 of the 10 members in each ensemble (not shown) confirmed that the results in Fig. 5 are robust.
Beyond the SPV, other sources of S2S predictability at mid-latitudes stem from the coupling between tropical and extratropical regions. Modes of variability like the El Niño–Southern Oscillation (ENSO; e.g. Brönnimann, 2007; Zheng et al., 2019; Huang et al., 1998; Moron and Plaut, 2003), the Madden–Julian oscillation (MJO; e.g. Cassou, 2008), and the quasi-biennial oscillation (QBO; e.g. Wang et al., 2018; Anstey et al., 2022) can persistently modify mid-latitude circulation patterns. If these changes affect the storm track, they are likely to be associated with variations in forecast uncertainty. Furthermore, anthropogenic climate change is expected to increase the likelihood and magnitude of strong storms over northern Europe (e.g. Knippertz et al., 2000; Pinto et al., 2007; Priestley and Catto, 2022), potentially leading to larger forecast uncertainty at S2S timescales.
In addition to extratropical storms, other dynamical features can in principle contribute to forecast uncertainty. For instance, the magnitudes and phases of synoptic-scale linear Rossby waves propagating along the mid-latitude jet are often uncorrelated among different ensemble members at S2S timescales. This superposition of troughs and ridges contributes to overall system variability and acts as a source of Z1000 ensemble spread. However, Z1000 anomalies associated with Rossby waves tend to be less extreme than those associated with strong storms, making their effects on ensemble spread more challenging to isolate.
Our analyses assume a good representation of mid-latitude circulation, particularly the North Atlantic storm track, within the considered model. Under an ideal model assumption, signals in ensemble spread correspond to proportional signals in forecast errors. However, if the model fails to accurately represent the storm track, the spread error proportionality may not hold, and spread anomalies might reflect model overconfidence or under-confidence. For example, Büeler et al. (2024) demonstrated that the ECMWF model (see Sect. 2) exhibits small biases in cyclone frequency during boreal winter but shows significant biases over the Atlantic during summer months. Our results suggest that such model biases in storm track intensity or position could contribute to anomalies in ensemble spread and associated forecast errors at S2S lead times.
In conclusion, this study highlights the significant role of synoptic storms in shaping S2S forecast uncertainty over Europe. The connection between storm characteristics and forecast spread, particularly in the context of stratospheric variability, provides important insights into the interpretation of S2S forecast skill. As climate change continues to influence storm patterns, understanding these dynamics will be crucial for enhancing the accuracy and reliability of future forecasts.
The forecasts used in this study are available via the S2S database hosted by ECMWF under https://apps.ecmwf.int/datasets/data/s2s (ECMWF, 2024). Cyclone frequency datasets and other diagnostic codes are available from the corresponding authors upon request.
PR performed the main analyses and wrote the first version of this paper. JS contributed to the analyses and the interpretation of results. HAG and TB assisted with conceptualization and interpretation. DB and MS computed the storm tracks and provided assistance with their interpretation. All co-authors contributed to the revision of the original manuscript.
At least one of the (co-)authors is a member of the editorial board of Weather and Climate Dynamics. The peer-review process was guided by an independent editor, and the authors also have no other competing interests to declare.
Publisher's note: Copernicus Publications remains neutral with regard to jurisdictional claims made in the text, published maps, institutional affiliations, or any other geographical representation in this paper. While Copernicus Publications makes every effort to include appropriate place names, the final responsibility lies with the authors.
This research has been supported by the German Research Foundation (DFG) under grant no. SFB/TRR 165 (Waves to Weather). This project has received funding from the European Research Council (ERC) under the European Union's Horizon 2020 research and innovation programme (grant agreement no. 847456). Hilla Afargan-Gerstman acknowledges funding from the European Union's Horizon 2020 research and innovation programme under the Marie Skłodowska-Curie Actions (grant agreement no. 891514). Dominik Büeler acknowledges funding from the Swiss National Science Foundation (grant no. 205419) and the Center for Climate Systems Modeling (C2SM).
This research has been supported by the German Research Foundation (DFG) under grant no. SFB/TRR 165 (Waves to Weather). This project has received funding from the European Research Council (ERC) under the European Union's Horizon 2020 research and innovation programme (grant agreement no. 847456). HAG received funding from the European Union's Horizon 2020 research and innovation programme under the Marie Skłodowska-Curie Actions (grant agreement no. 891514). Dominik Büeler received funding from the Swiss National Science Foundation (grant no. 205419) and the Center for Climate Systems Modeling (C2SM).
This paper was edited by Helen Dacre and reviewed by two anonymous referees.
Afargan-Gerstman, H. and Domeisen, D. I.: Pacific modulation of the North Atlantic storm track response to sudden stratospheric warming events, Geophys. Res. Lett., 47, e2019GL085007, https://doi.org/10.1029/2019GL085007, 2020. a
Afargan-Gerstman, H., Büeler, D., Wulff, C. O., Sprenger, M., and Domeisen, D. I. V.: Stratospheric influence on the winter North Atlantic storm track in subseasonal reforecasts, Weather Clim. Dynam., 5, 231–249, https://doi.org/10.5194/wcd-5-231-2024, 2024. a, b, c
Anstey, J. A., Simpson, I. R., Richter, J. H., Naoe, H., Taguchi, M., Serva, F., Gray, L. J., Butchart, N., Hamilton, K., Osprey, S., Bellprat, O., Braesicke, P., Bushell, A. C.,Cagnazzo, C., Chen, C.-C., Chun, H.-Y., Garcia, R. R., Holt, L., Kawatani, Y., Kerzenmacher, T., Kim, Y.-H., Lott, F., McLandress, C., Scinocca, J., Stockdale, T. N., Versick, S., Watanabe, S., Yoshida, K., and Yukimoto, S.: Teleconnections of the quasi-biennial oscillation in a multi-model ensemble of QBO-resolving models, Q. J. Roy. Meteorol. Soc., 148, 1568–1592, 2022. a
Baldwin, M. P. and Dunkerton, T. J.: Stratospheric harbingers of anomalous weather regimes, Science, 294, 581–584, 2001. a
Baldwin, M. P., Stephenson, D. B., Thompson, D. W., Dunkerton, T. J., Charlton, A. J., and O'Neill, A.: Stratospheric memory and skill of extended-range weather forecasts, Science, 301, 636–640, 2003. a
Benedict, J. J., Lee, S., and Feldstein, S. B.: Synoptic view of the North Atlantic oscillation, J. Atmos. Sci., 61, 121–144, 2004. a
Blessing, S., Fraedrich, K., Junge, M., Kunz, T., and Lunkeit, F.: Daily North-Atlantic Oscillation (NAO) index: Statistics and its stratospheric polar vortex dependence, Meteorol. Z., 14, 763–770, 2005. a
Brönnimann, S.: Impact of El Niño–southern oscillation on European climate, Rev. Geophys., 45, RG3003, https://doi.org/10.1029/2006RG000199, 2007. a
Büeler, D., Beerli, R., Wernli, H., and Grams, C. M.: Stratospheric influence on ECMWF sub-seasonal forecast skill for energy-industry-relevant surface weather in European countries, Q. J. Roy. Meteorol. Soc., 146, 3675–3694, 2020. a
Büeler, D., Sprenger, M., and Wernli, H.: Northern Hemisphere extratropical cyclone biases in ECMWF subseasonal forecasts, Q. J. Roy. Meteorol. Soc., 150, 1096–1123, https://doi.org/10.1002/qj.4638, 2024. a, b
Butler, A. H., Sjoberg, J. P., Seidel, D. J., and Rosenlof, K. H.: A sudden stratospheric warming compendium, Earth Syst. Sci. Data, 9, 63–76, https://doi.org/10.5194/essd-9-63-2017, 2017. a
Cassou, C.: Intraseasonal interaction between the Madden–Julian oscillation and the North Atlantic Oscillation, Nature, 455, 523–527, 2008. a
Domeisen, D. I., Butler, A. H., Charlton-Perez, A. J., Ayarzagüena, B., Baldwin, M. P., Dunn-Sigouin, E., Furtado, J. C., Garfinkel, C. I., Hitchcock, P., Karpechko, A. Y., Kim, H., Knight, J., Lang, A. L., Lim, E.-P., Marshall, A., Roff, G., Schwartz, C., Simpson, I. R., Son, S.-W., and Taguchi, M.: The role of the stratosphere in subseasonal to seasonal prediction: 2. Predictability arising from stratosphere-troposphere coupling, J. Geophys. Res.-Atmos., 125, e2019JD030923, https://doi.org/10.1029/2019JD030923, 2020. a, b
Donat, M. G., Leckebusch, G. C., Pinto, J. G., and Ulbrich, U.: Examination of wind storms over Central Europe with respect to circulation weather types and NAO phases, Int. J. Climatol., 30, 1289–1300, 2010. a
ECMWF: S2S forecast database, ECMWF [data set], https://apps.ecmwf.int/datasets/data/s2s (last access: 15 October 2024), 2015. a
Huang, J., Higuchi, K., and Shabbar, A.: The relationship between the North Atlantic Oscillation and El Niño–Southern Oscillation, Geophys. Res. Lett., 25, 2707–2710, 1998. a
Hurrell, J. W., Kushnir, Y., Ottersen, G., and Visbeck, M.: An overview of the North Atlantic oscillation, American Geophysical Union, Geophys. Monogr., 134, 1–36, 2003. a
Knippertz, P., Ulbrich, U., and Speth, P.: Changing cyclones and surface wind speeds over the North Atlantic and Europe in a transient GHG experiment, Clim. Res., 15, 109–122, 2000. a
Mariotti, A., Baggett, C., Barnes, E. A., Becker, E., Butler, A., Collins, D. C., Dirmeyer, P. A., Ferranti, L., Johnson, N. C., Jones, J., Kirtman, B. P., Lang, A. L., Molod, A., Newman, M., Robertson, A. W., Schubert, S., Waliser, D. E., and Albers, J.: Windows of opportunity for skillful forecasts subseasonal to seasonal and beyond, B. Am. Meteorol. Soc., 101, E608–E625, 2020. a
Maycock, A. C., Masukwedza, G. I., Hitchcock, P., and Simpson, I. R.: A regime perspective on the North Atlantic eddy-driven jet response to sudden stratospheric warmings, J. Climate, 33, 3901–3917, 2020. a
Merino, A., Fernández-Vaquero, M., López, L., Fernández-González, S., Hermida, L., Sánchez, J. L., García-Ortega, E., and Gascón, E.: Large-scale patterns of daily precipitation extremes on the Iberian Peninsula, Int. J. Climatol., 36, 3873–3891, 2016. a
Moron, V. and Plaut, G.: The impact of El Niño–Southern Oscillation upon weather regimes over Europe and the North Atlantic during boreal winter, Int. J. Climatol., 23, 363–379, 2003. a
Pinto, J. G., Fröhlich, E. L., Leckebusch, G. C., and Ulbrich, U.: Changing European storm loss potentials under modified climate conditions according to ensemble simulations of the ECHAM5/MPI-OM1 GCM, Nat. Hazards Earth Syst. Sci., 7, 165–175, https://doi.org/10.5194/nhess-7-165-2007, 2007. a
Pinto, J. G., Zacharias, S., Fink, A. H., Leckebusch, G. C., and Ulbrich, U.: Factors contributing to the development of extreme North Atlantic cyclones and their relationship with the NAO, Clim. Dynam., 32, 711–737, 2009. a
Priestley, M. D. K. and Catto, J. L.: Future changes in the extratropical storm tracks and cyclone intensity, wind speed, and structure, Weather Clim. Dynam., 3, 337–360, https://doi.org/10.5194/wcd-3-337-2022, 2022. a
Schwierz, C. B. and Davies, H. C.: Evolution of a synoptic-scale vortex advecting toward a high mountain, Tellus A, 55, 158–172, 2003. a
Skeie, R. B., Kristjansson, J. E., Ólafsson, H., and Rosting, B.: Dynamical processes related to cyclone development near Greenland, Meteorol. Z., 15, 147, https://doi.org/10.1127/0941-2948/2006/0114, 2006. a
Spaeth, J., Rupp, P., Garny, H., and Birner, T.: Stratospheric impact on subseasonal forecast uncertainty in the Northern extratropics, Commun. Earth Environ., 5, 126, https://doi.org/10.1038/s43247-024-01292-z, 2024a. a, b, c, d, e, f
Spaeth, J., Rupp, P., Osman, M., Grams, C. M., and Birner, T.: Flow-Dependence of Ensemble Spread of Subseasonal Forecasts Explored via North Atlantic-European Weather Regimes, Geophys. Res. Lett., 51, e2024GL109733, https://doi.org/10.1029/2024GL109733, 2024b. a, b
Sprenger, M., Fragkoulidis, G., Binder, H., Croci-Maspoli, M., Graf, P., Grams, C. M., Knippertz, P., Madonna, E., Schemm, S., Škerlak, B., and Wernli, H.: Global climatologies of Eulerian and Lagrangian flow features based on ERA-Interim, B. Am. Meteorol. Soc., 98, 1739–1748, 2017. a, b
Vallis, G. K. and Gerber, E. P.: Local and hemispheric dynamics of the North Atlantic Oscillation, annular patterns and the zonal index, Dynam. Atmos. Oceans, 44, 184–212, 2008. a
Vitart, F., Ardilouze, C., Bonet, A., Brookshaw, A., Chen, M., Codorean, C., Déqué, M., Ferranti, L., Fucile, E., Fuentes, M., Hendon, H., Hodgson, J., Kang, H.-S., Kumar, A., Lin, H., Liu, G., Liu, X., Malguzzi, P., Mallas, I., Manoussakis, M., Mastrangelo, D., MacLachlan, C., McLean, P., Minami, A., Mladek, R., Nakazawa, T., Najm, S., Nie, Y., Rixen, M., Robertson, A. W., Ruti, P., Sun, C., Takaya, Y., Tolstykh, M., Venuti, F., Waliser, D., Woolnough, S., Wu, T., Won, D.-J., Xiao, H., Zaripov, R., and Zhang, L.: The subseasonal to seasonal (S2S) prediction project database, B. Am. Meteorol. Soc., 98, 163–173, 2017. a
Wang, J., Kim, H.-M., Chang, E. K., and Son, S.-W.: Modulation of the MJO and North Pacific storm track relationship by the QBO, J. Geophys. Res.-Atmos., 123, 3976–3992, 2018. a
Wernli, H. and Schwierz, C.: Surface cyclones in the ERA-40 dataset (1958–2001). Part I: Novel identification method and global climatology, J. Atmos. Sci., 63, 2486–2507, 2006. a
White, C. J., Carlsen, H., Robertson, A. W., Klein, R. J., Lazo, J. K., Kumar, A., Vitart, F., Coughlan de Perez, E., Ray, A. J., Murray, V., Bharwani, S., MacLeod, D., James, R., Fleming, L., Morse, A. P., Eggen, B., Graham, R., Kjellström, E., Becker, E., Pegion, K. V., Holbrook, N. J., McEvoy, D., Depledge, M., Perkins-Kirkpatrick, S., Brown, T. J., Street, R., Jones, L., Remenyi, T. A., Hodgson-Johnston, I., Buontempo, C., Lamb, R., Meinke, H., Arheimer, B., and Zebiak, S. E.: Potential applications of subseasonal-to-seasonal (S2S) predictions, Meteorol. Appl., 24, 315–325, 2017. a
Yang, M., Luo, D., Shi, W., Yao, Y., Li, X., and Chen, X.: Contrasting interannual impacts of European and Greenland blockings on the winter North Atlantic storm track, Environ. Res. Lett., 16, 104036, https://doi.org/10.1088/1748-9326/ac2934, 2021. a
Zheng, C., Chang, E. K.-M., Kim, H., Zhang, M., and Wang, W.: Subseasonal to seasonal prediction of wintertime Northern Hemisphere extratropical cyclone activity by S2S and NMME models, J. Geophys. Res.-Atmos., 124, 12057–12077, 2019. a
- Abstract
- Introduction
- Model and data
- Case study of the connection between storms and forecast spread
- Systematic contribution of North Atlantic storms to forecast spread
- Influence of the stratospheric polar vortex on the North Atlantic storm track and Z1000 spread
- Discussion and conclusions
- Data availability
- Author contributions
- Competing interests
- Disclaimer
- Acknowledgements
- Financial support
- Review statement
- References