the Creative Commons Attribution 4.0 License.
the Creative Commons Attribution 4.0 License.
 | 19 Jan 2024
Warm conveyor belt activity over the Pacific: modulation by the Madden–Julian Oscillation and impact on tropical–extratropical teleconnections
Julian F. Quinting
Christian M. Grams
Edmund Kar-Man Chang
Stephan Pfahl
Heini Wernli
Research in the last few decades has revealed that rapidly ascending airstreams in extratropical cyclones – so-called warm conveyor belts (WCBs) – play an important role in extratropical atmospheric dynamics. However on the subseasonal timescale, the modulation of their occurrence frequency, henceforth referred to as WCB activity, has so far received little attention. Also, it is not yet clear whether WCB activity may affect tropospheric teleconnection patterns, which constitute a source of predictability on this subseasonal timescale. Using reanalysis data, this study analyzes the modulation of WCB activity by the Madden–Julian Oscillation (MJO). A key finding is that WCB activity increases significantly over the western North Pacific when the convection of the MJO is located over the Indian Ocean. This increased WCB activity, which is stronger during La Niña conditions, is related to enhanced poleward moisture fluxes driven by the circulation of subtropical Rossby gyres associated with the MJO. In contrast, when the convection of the MJO is located over the western North Pacific, WCB activity increases significantly over the eastern North Pacific. This increase stems from a southward shift and eastward extension of the North Pacific jet stream. However, while these mean increases are significant, individual MJO events exhibit substantial variability, with some events even exhibiting anomalously low WCB activity. Individual events of the same MJO phase with anomalously low WCB activity over the North Pacific tend to be followed by the known canonical teleconnection patterns in the Atlantic–European region; i.e., the occurrence frequency of the positive phase of the North Atlantic Oscillation (NAO) is enhanced when convection of the MJO is located over the Indian Ocean and similarly for the negative phase of the NAO when MJO convection is over the western North Pacific. However, the canonical teleconnection patterns are modified when individual events of the same MJO phase are accompanied by anomalously high WCB activity over the North Pacific. In particular, the link between MJO and the negative phase of the NAO weakens considerably. Reanalysis data and experiments with an idealized general circulation model reveal that this is related to anomalous ridge building over western North America favored by enhanced WCB activity. Overall, our study highlights the potential role of WCBs in shaping tropical–extratropical teleconnection patterns and underlines the importance of representing them adequately in numerical weather prediction models in order to fully exploit the sources of predictability emerging from the tropics.
- Article
(17086 KB) - Full-text XML
-
Supplement
(19015 KB) - BibTeX
- EndNote


The dominant mode of tropical intraseasonal variability with a period of 30–90 d is the Madden–Julian Oscillation (MJO; Madden and Julian, 1971; Zhang, 2005). The MJO is characterized by coupled atmospheric circulation and convection anomalies that propagate eastward across the tropical Indian and Pacific oceans. Due to the strong diabatic heating anomalies associated with the convection, the MJO generates a strong response not only in the tropics but also in the midlatitudes to high latitudes. During boreal winter, the influence of tropical heating on the extratropical circulation has long been noticed as teleconnection patterns (Wallace and Gutzler, 1981) and interpreted in terms of barotropic Rossby wave dispersion (Hoskins and Karoly, 1981). These teleconnection patterns are the most pronounced when the convective activity of the MJO is located west of the dateline (Simmons et al., 1983; Stan et al., 2017). During phases with active convection over the Indian Ocean (phases 2 and 3 according to the Real-Time Multivariate MJO Index; Wheeler and Hendon, 2004), the teleconnection pattern is characterized by an upper-tropospheric anticyclonic anomaly over the central North Pacific (e.g., Knutson and Weickmann, 1987; Moore et al., 2010; Tseng et al., 2019). This anticyclonic anomaly marks the beginning of a low-frequency anomalous Rossby wave train. It stretches across North America towards the North Atlantic where it eventually favors the conditions of the positive phase of the North Atlantic Oscillation (NAO) roughly 1–2 weeks later through anticyclonic synoptic-scale wave breaking events (e.g., Benedict et al., 2004; Cassou, 2008; Lin et al., 2009; Michel and Rivière, 2011). Conversely, MJO phases with active convection over the western to central North Pacific (phases 6 and 7) are characterized by a cyclonic anomaly over the central North Pacific and an anticyclonic anomaly over western North America (Knutson and Weickmann, 1987; Moore et al., 2010). The anticyclonic anomaly may become stationary and form a blocking anticyclone (Henderson et al., 2016). Further downstream, there is an increased occurrence frequency of the negative phase of the NAO. However, the physical processes linking the MJO and the negative phase of the NAO are still not fully understood (Cassou, 2008; Lin et al., 2009; Jiang et al., 2017; Fromang and Rivière, 2020).
In contrast to early studies that mostly focused on large-scale teleconnection patterns forced by the heating of the MJO, recent studies have started to examine the MJO influence on midlatitude weather systems such as extratropical cyclones (Deng and Jiang, 2011; Lee and Lim, 2012; Takahashi and Shirooka, 2014; Guo et al., 2017) or atmospheric rivers (ARs; Guan et al., 2012; Mundhenk et al., 2016; Zhou et al., 2021). For the North Pacific, these studies found a dipole of enhanced and suppressed cyclone and AR activity propagating northeastward as the convection of the MJO moves from the eastern Indian Ocean to the western-central Pacific. During phases with enhanced convection over the Indian Ocean, the cyclone and AR activity tend to be enhanced over the far western North Pacific and suppressed over the central to eastern North Pacific. On the other hand, later stages of an MJO lifecycle with enhanced convection over the western to central Pacific are characterized by suppressed cyclone and AR activity over the western North Pacific and enhanced cyclone and AR activity over the eastern North Pacific. The variations in cyclone activity have largely been attributed to changes in the upper-tropospheric flow associated with the MJO (Guo et al., 2017). Enhanced cyclone activity is often accompanied by a stronger extratropical upper-tropospheric jet, while reduced cyclone activity can be linked to a weakened jet. Further, the MJO is linked to moisture variations that extend to the extratropics over the western and central North Pacific. As increased moisture supply can invigorate midlatitude cyclones through enhanced diabatic heating in the rising warm air ahead of the cyclones (Binder et al., 2016), Guo et al. (2017) hypothesized that moisture variations related to the MJO need to be considered in order to explain the observed variations in cyclone activity.
A weather system that has not yet been linked to the MJO but is related to the occurrence of extratropical cyclones and atmospheric rivers is the so-called warm conveyor belt (Browning et al., 1973; Harrold, 1973; Carlson, 1980). Warm conveyor belts (WCBs) are rapidly, mostly poleward ascending airstreams within extratropical cyclonic systems (Eckhardt et al., 2004; Madonna et al., 2014). These airstreams, which are typically identified as coherent bundles of kinematic air parcel trajectories (Wernli and Davies, 1997), have their origin in the boundary layer in the warm sector of extratropical cyclones. From there, they ascend, typically across the cyclones' warm front, and reach the upper troposphere within 2 d (two days). The modulation of their activity is of interest for two reasons. First, WCBs are dominant contributors to the mean and extreme extratropical rainfall (Pfahl et al., 2014). For example, around 50 % of the total precipitation and 80 % of extreme precipitation events over East Asia are associated with WCBs. Thus, advance notice of periods with unusually high (and low) WCB activity may help economic sectors such as agriculture, energy production, resource management, and insurance companies to prepare for anomalously wet (or dry) conditions. Second, WCBs have a major effect on the dynamics (e.g., Wernli and Davies, 1997; Pomroy and Thorpe, 2000; Grams et al., 2011; Binder et al., 2016) and predictability of the atmosphere (e.g., Lamberson et al., 2016; Martínez-Alvarado et al., 2016; Grams et al., 2018; Maddison et al., 2019; Pickl et al., 2023). For instance, the latent heat release in WCBs contributes to the intensification of extratropical cyclones (Binder et al., 2016). Thus, a modulation of lower-tropospheric moisture by the MJO, as shown by Guo et al. (2017), may influence the amount of latent heat release, which then affects the cyclone intensity. The latent heat release also leads to a cross-isentropic transport of lower-tropospheric air into the upper troposphere. This injection and its associated upper-tropospheric divergent outflow can contribute to the amplification of upper-tropospheric ridges (Pomroy and Thorpe, 2000; Grams et al., 2011), trigger the development of baroclinic Rossby wave packets (Röthlisberger et al., 2018), and affect the onset and maintenance of potentially long-lasting blocking anticyclones (Pfahl et al., 2015; Steinfeld and Pfahl, 2019). Accordingly, periods with enhanced WCB activity may project onto long-lasting circulation anomalies and thus modulate teleconnection patterns typically attributed to the heating of the MJO.
The three central questions of this study therefore are the following:
-
In what way is WCB activity modulated by the MJO?
-
How is the WCB modulation linked to circulation anomalies associated with the MJO?
-
How does a potential modulation of WCB activity interact with known teleconnection patterns towards North America and Europe?
The data and methods to address these questions are introduced in Sect. 2. In Sect. 3, we show the modulation of WCB activity conditioned on the MJO phase and its relation to the state of the El Niño–Southern Oscillation, and we highlight how the modulation of WCB activity is linked to circulation anomalies associated with the MJO. The link between WCB activity and known teleconnection patterns is discussed thereafter. The study ends with a concluding discussion in Sect. 4.
2.1 ERA-Interim data set
The majority of the results in this study are based on ECMWF's interim reanalysis data (ERA-Interim; Dee et al., 2011a) for the Northern Hemisphere extended winter (NDJFM) in the period from 1 November 1979 to 31 March 2018. Although ECMWF's ERA5 data (Hersbach et al., 2020) were already available when this work was carried out, we choose ERA-Interim reanalyses because the computationally expensive trajectory-based WCB data had already been calculated on the basis of ERA-Interim (Madonna et al., 2014; Sprenger et al., 2017); see also Sect. 2.2. The reanalysis data are retrieved 6-hourly at all available model levels and at a selection of pressure levels (1000, 925, 850, 700, 500, 300, and 200 hPa), which are necessary to objectively identify WCBs with two different approaches (see Sect. 2.2 and 2.3). All ERA-Interim data are remapped from their native T255 spectral resolution to a regular latitude–longitude grid spacing of 1∘ × 1∘. Composites of different atmospheric variables and their anomalies are also based on ERA-Interim at the same temporal and spatial resolution. All anomalies shown in this study are relative to a 30 d running mean climatology calculated over the same period from 1979 to 2018.
2.2 Trajectory-based WCB data set
The trajectory-based WCB data set of Madonna et al. (2014) and Sprenger et al. (2017) is based on 48 h kinematic forward trajectories computed with the LAGRangian ANalysis TOol (LAGRANTO; Wernli and Davies, 1997; Sprenger and Wernli, 2015) from the horizontal and vertical wind components on all available model levels in ERA-Interim. The seeding points of the trajectories are on a global 80 km × 80 km equidistant grid in the horizontal and vertically every 20 hPa from 1050 to 790 hPa if the corresponding pressure level is located above the Earth's surface. After calculating the forward trajectories from all seeding points, WCBs are defined as all trajectories that ascend by at least 600 hPa in 48 h and are collocated with an extratropical cyclone mask, taken as the outermost closed contour around local sea-level pressure minima (Wernli and Schwierz, 2006), at least once during the 48 h period. To avoid the inclusion of rapidly ascending trajectories related to tropical cyclones, all cyclones between 25∘ S and 25∘ N are excluded. Instead of analyzing the raw trajectories, we focus in this study on two-dimensional and binary WCB masks, which are obtained by binning all identified WCB parcel locations at a given time into three vertical layers following the definition of Schäfler et al. (2014). WCB inflow includes the air parcels located below 800 hPa, ascent refers to all air parcels between 800 and 400 hPa, and outflow includes all air parcels above 400 hPa. The binary masks are obtained by gridding air parcel locations in each of the two layers on a regular 1∘ × 1∘ latitude–longitude grid. Grid points without/with a WCB air parcel are labeled , yielding two-dimensional binary footprints for each of the three layers, which are henceforth referred to as the WCB inflow, ascent, and outflow stages.
2.3 Deep-learning-based WCB data set
In addition to the trajectory-based data set, we employ a deep-learning-based WCB data set, which is derived with the methodology introduced by Quinting and Grams (2022). The intention is to provide a baseline for addressing the overarching questions raised in Sect. 1 in data sets that do not easily allow trajectory calculations in future studies. These could be hindcasts from the subseasonal to seasonal prediction project (Vitart et al., 2017) or climate model projections (Eyring et al., 2016). The results based on the deep-learning-based data set can thus serve as a reference for such future studies.
In short, Quinting and Grams (2022) developed separate convolutional neural network (CNN) models with variants of the UNet architecture (Ronneberger et al., 2015) for each of the three WCB stages. The CNN models take five atmospheric variables as predictors and provide conditional probabilities of occurrence for each WCB stage as output. Four of the predictors, which are characteristic of each of the WCB stages (Quinting and Grams, 2021a), are derived from temperature, geopotential height, specific humidity, and the horizontal wind components at the 1000, 925, 850, 700, 500, 300, and 200 hPa isobaric surfaces. The climatological occurrence frequency distribution determined with the trajectory-based data set is the fifth predictor for WCB ascent. In contrast, the fifth predictor for WCB inflow/outflow is the conditional probability of WCB ascent predicted by the CNN models 24 h later/earlier than the corresponding inflow/outflow time. The conditional probabilities predicted by the CNNs are converted to two-dimensional binary footprints for each of the WCB stages by applying grid-point-specific decision thresholds. For more details on the methodology, the interested reader is referred to Quinting and Grams (2022).
2.4 Madden–Julian Oscillation
Composites are created for different MJO phases using the Real-time Multivariate MJO (RMM) indices of Wheeler and Hendon (2004, http://www.bom.gov.au/climate/mjo/, last access: 22 December 2023), where each of in total eight phases represents the approximate longitudinal location of enhanced and suppressed MJO convection anomalies. The two RMM indices, known as RMM1 and RMM2, are derived from the two empirical orthogonal functions of near-equatorially averaged zonal wind at 850 and 200 hPa and outgoing longwave radiation anomalies. The phase of the MJO is then defined by assigning the angle tan−1(RMM2/RMM1) to the nearest of the eight quadrants in the RMM1–RMM2 phase space. In this study, a particular focus is given to phases 2, 3, 6, and 7 since, after these phases, the modulation of midlatitude weather systems is the strongest (Deng and Jiang, 2011; Zhou et al., 2021), and the large-scale teleconnection patterns are the most pronounced (e.g., Cassou, 2008; Lin et al., 2009; Tseng et al., 2019). Phases 2 and 3 are associated with enhanced MJO convection over the eastern Indian Ocean and suppressed convection over the western to central Pacific. Conversely, phases 6 and 7 represent suppressed convection over the eastern Indian Ocean and enhanced convection over the western to central Pacific. In line with previous studies (e.g., Henderson et al., 2016; Vitart et al., 2017), we only consider active MJO phases, i.e., phases when the so-called RMM index amplitude of the MJO is greater than 1. Anomalies associated with the different MJO phases are shown as pentad means (i.e., 5 d averages). Pentad 0 indicates the average of days 0–4 following each day in the considered period with an RMM index amplitude greater than 1, pentad 1 corresponds to days 5–9, and so on.
2.5 El Niño–Southern Oscillation
As the state of the El Niño–Southern Oscillation (ENSO) alters the extratropical response to the MJO (Lee et al., 2019), we further condition MJO-relative composites on the state of ENSO. Its conditions are characterized by the monthly Oceanic Niño Index (ONI), which is based on detrended 3-month-running mean sea surface temperature anomalies in the Niño 3.4 region extending from 170 to 120∘ W and 5∘ S to 5∘ N. The sea surface temperature data are taken from Huang et al. (2017). La Niña/El Niño conditions of ENSO are defined as the months when the respective ONI is below −0.5/above 0.5 standard deviations of the ONI time series.
2.6 Atlantic–European weather regimes
To investigate potential changes in MJO–extratropical teleconnection patterns towards Europe, four Atlantic–European weather regimes originally introduced by Vautard (1990) are identified. The regimes are based on 500 hPa geopotential height fields from ERA-Interim following the procedure of Grams et al. (2017). In a first step, 6-hourly geopotential height anomalies are calculated relative to a centered 91 d running mean calendar date climatology. Second, the anomalies are filtered with a 5 d low-pass filter and seasonally normalized. We then calculate the seven leading empirical orthogonal functions of the filtered anomalies for the region 80∘ W to 40∘ E and 30 to 90∘ N, which explain roughly 70 % of the total variance. A fuzzy clustering applied to the anomalies then yields four clusters representing four weather regimes. With the focus of this study being on extended winter, only four instead of the year-round seven regimes introduced by Grams et al. (2017) are considered. In a final step, the instantaneous normalized filtered anomalies are projected onto the weather regime mean anomalies following the method of Michel and Rivière (2011), which yields a non-dimensional regime index. For each time step, an active weather regime is then defined based on the maximum value of the non-dimensional regime index. Following Cassou (2008), the four regimes are named NAO+, NAO–, the Scandinavian blocking, and the Atlantic Ridge.
2.7 Statistical significance and robustness
We determine the statistical significance of the results via a Monte Carlo approach. For each MJO phase, consecutive days when the RMM index amplitude exceeds 1 are defined as one MJO event. Based on these MJO events, we randomly generate 1000 series of dates that include the same number of events with each of the events having the same duration as in the original MJO time series. By doing so, we account for the autocorrelation of the MJO time series. The dates are composed of a randomly chosen year from the 1979 to 2018 period and a randomly chosen day from a 14 d period around the corresponding date in the original MJO time series. By choosing the day from a 14 d window around the dates of the original MJO time series, we account for seasonal variability in the random series of dates. From the 1000 series of dates we create 1000 composites of anomalies and determine their 5 % and 95 % percentiles. Anomalies of the MJO-based composites that either exceed the 95 % percentile or fall below the 5 % percentile are considered to be statistically significant. Further, we assess the robustness of the MJO-based composites by resampling the original MJO time series for each phase 1000 times with replacement (Domeisen et al., 2020). As for the significance testing, entire MJO events are considered in order to account for the autocorrelation of the MJO time series. The interdecile range (between the 10 % and 90 % percentiles) of the randomized composites yields information on the variability in the MJO-based composites. The MJO-based composite is considered robust when the interdecile range of the 1000 randomly sampled composite anomalies is smaller than the MJO-based composite anomalies. For composite anomalies conditioned on the state of ENSO, the same approaches are employed.
2.8 Nonlinear baroclinic primitive-equation model and diabatic heating
To better understand the potential role of diabatic heating associated with WCBs for MJO–extratropical teleconnections, we employ a nonlinear baroclinic primitive-equation model, previously used by Chang (2006, 2009) and Zheng and Chang (2019). This dry dynamical model is based on the dynamical core of the Geophysical Fluid Dynamics Laboratory global spectral model (Held and Suarez, 1994). We run the model with 20 evenly spaced sigma levels in the vertical and a spectral resolution of T42 (∼ 2.8∘). Orography is smoothed to model resolution, and a land–sea mask is used with stronger friction over land. The only other forcing is Newtonian cooling to a radiative equilibrium temperature profile. This fixed cooling profile is iteratively determined (see Chang, 2006, 2009) so that the model climatology, in terms of the three-dimensional mean temperature distribution, is close to the winter climatology derived based on reanalysis data. As discussed in Chang (2009), the model not only simulates the mean circulation well, but also provides a reasonable simulation of the winter Northern Hemisphere storm track.
As in Zheng and Chang (2019), heating anomalies have been added into the idealized setup to investigate the extratropical response to tropical heating anomalies during certain MJO phases and to extratropical heating anomalies mostly related to synoptic eddies. The imposed heating mimics the diabatic heating derived from ERA-Interim precipitation anomalies. Anomalies are calculated relative to a 30 d running mean climatology and averaged over 5 d following each MJO phase. The tropical heating covers all longitudes and a latitudinal belt between 20∘ S to 20∘ N. The extratropical heating is imposed at all longitudes but poleward of 20∘ N and 20∘ S, respectively. By applying heating in all areas with positive precipitation anomalies, we intend to represent the heating anomalies as realistically as possible rather than focusing only on the region of the active MJO. The anomalous heating extends from sigma = 0.8 to sigma = 0.3 (roughly 800 to 300 hPa) such that the vertically integrated heating rate corresponds to the precipitation anomalies derived from ERA-Interim data.
A critical aspect is to ensure statistical significance of the model experiments. Therefore, we run the model with 100 ensemble members. To generate the initial condition for the ensemble members, we run the model for 3000 d without additional anomalous heating imposed. Then all the model states from day 30 onwards at 30 d intervals are taken as the initial conditions of the ensemble members. After that, we run the model ensembles out to 15 d with the anomalous heating added only during the first 5 d of each model run and switched off afterwards.
3.1 Modulation of WCB activity by the MJO
The modulation of WCB activity as determined with the trajectory-based approach (Sect. 2.2) is initially investigated for a time lag of 0–4 d (pentad 0) after each day with active MJO. We first focus on MJO phases 2, 3, 6, and 7, which are followed by significant changes in the frequency of other midlatitude synoptic weather systems such as atmospheric rivers or extratropical cyclones (e.g., Moore et al., 2010; Guo et al., 2017; Zhou et al., 2021). We focus on the WCB inflow and outflow stages, though qualitatively similar results are found for WCB ascent.
Over the North Pacific, the composites reveal a dipole of positive and negative WCB inflow and outflow frequency anomalies, which reverse sign from phases 2 and 3 to phases 6 and 7 (Fig. 1). This dipole is consistent with previous studies that have looked at the relationship between the MJO and North Pacific storm-track activity in terms of band-pass-filtered statistics (Deng and Jiang, 2011; Takahashi and Shirooka, 2014) or cyclone activity (Guo et al., 2017). In pentad 0 of phases 2 and 3, the WCB inflow frequency is significantly enhanced over the western North Pacific (120 to 170∘ E) and reduced over the central to eastern North Pacific (east of 170∘ E) (Fig. 1a and d). The enhanced inflow frequency anomalies occur in the equatorward entrance region of the North Pacific jet (Fig. 1c), a region of quasi-geostrophic forcing of ascent. The corresponding WCB outflow anomalies, which are particularly pronounced in phase 3, are located northeast of the main WCB inflow regions (Fig. 1b and e) and in the exit region of the North Pacific jet. Collocated with and downstream of the anomalous positive WCB outflow regions is a positive geopotential height anomaly centered on the date line (Fig. 1c and f). This corresponds to the well-known MJO–midlatitude teleconnection pattern (e.g., Moore et al., 2010; Vitart et al., 2017). Overall, the relative location of WCB inflow, outflow, and geopotential height anomalies in pentad 0 of phases 2 and 3 corresponds to the conceptual picture of predominantly poleward-ascending WCBs whose outflow is directed downstream into upper-tropospheric anticyclonic anomalies.
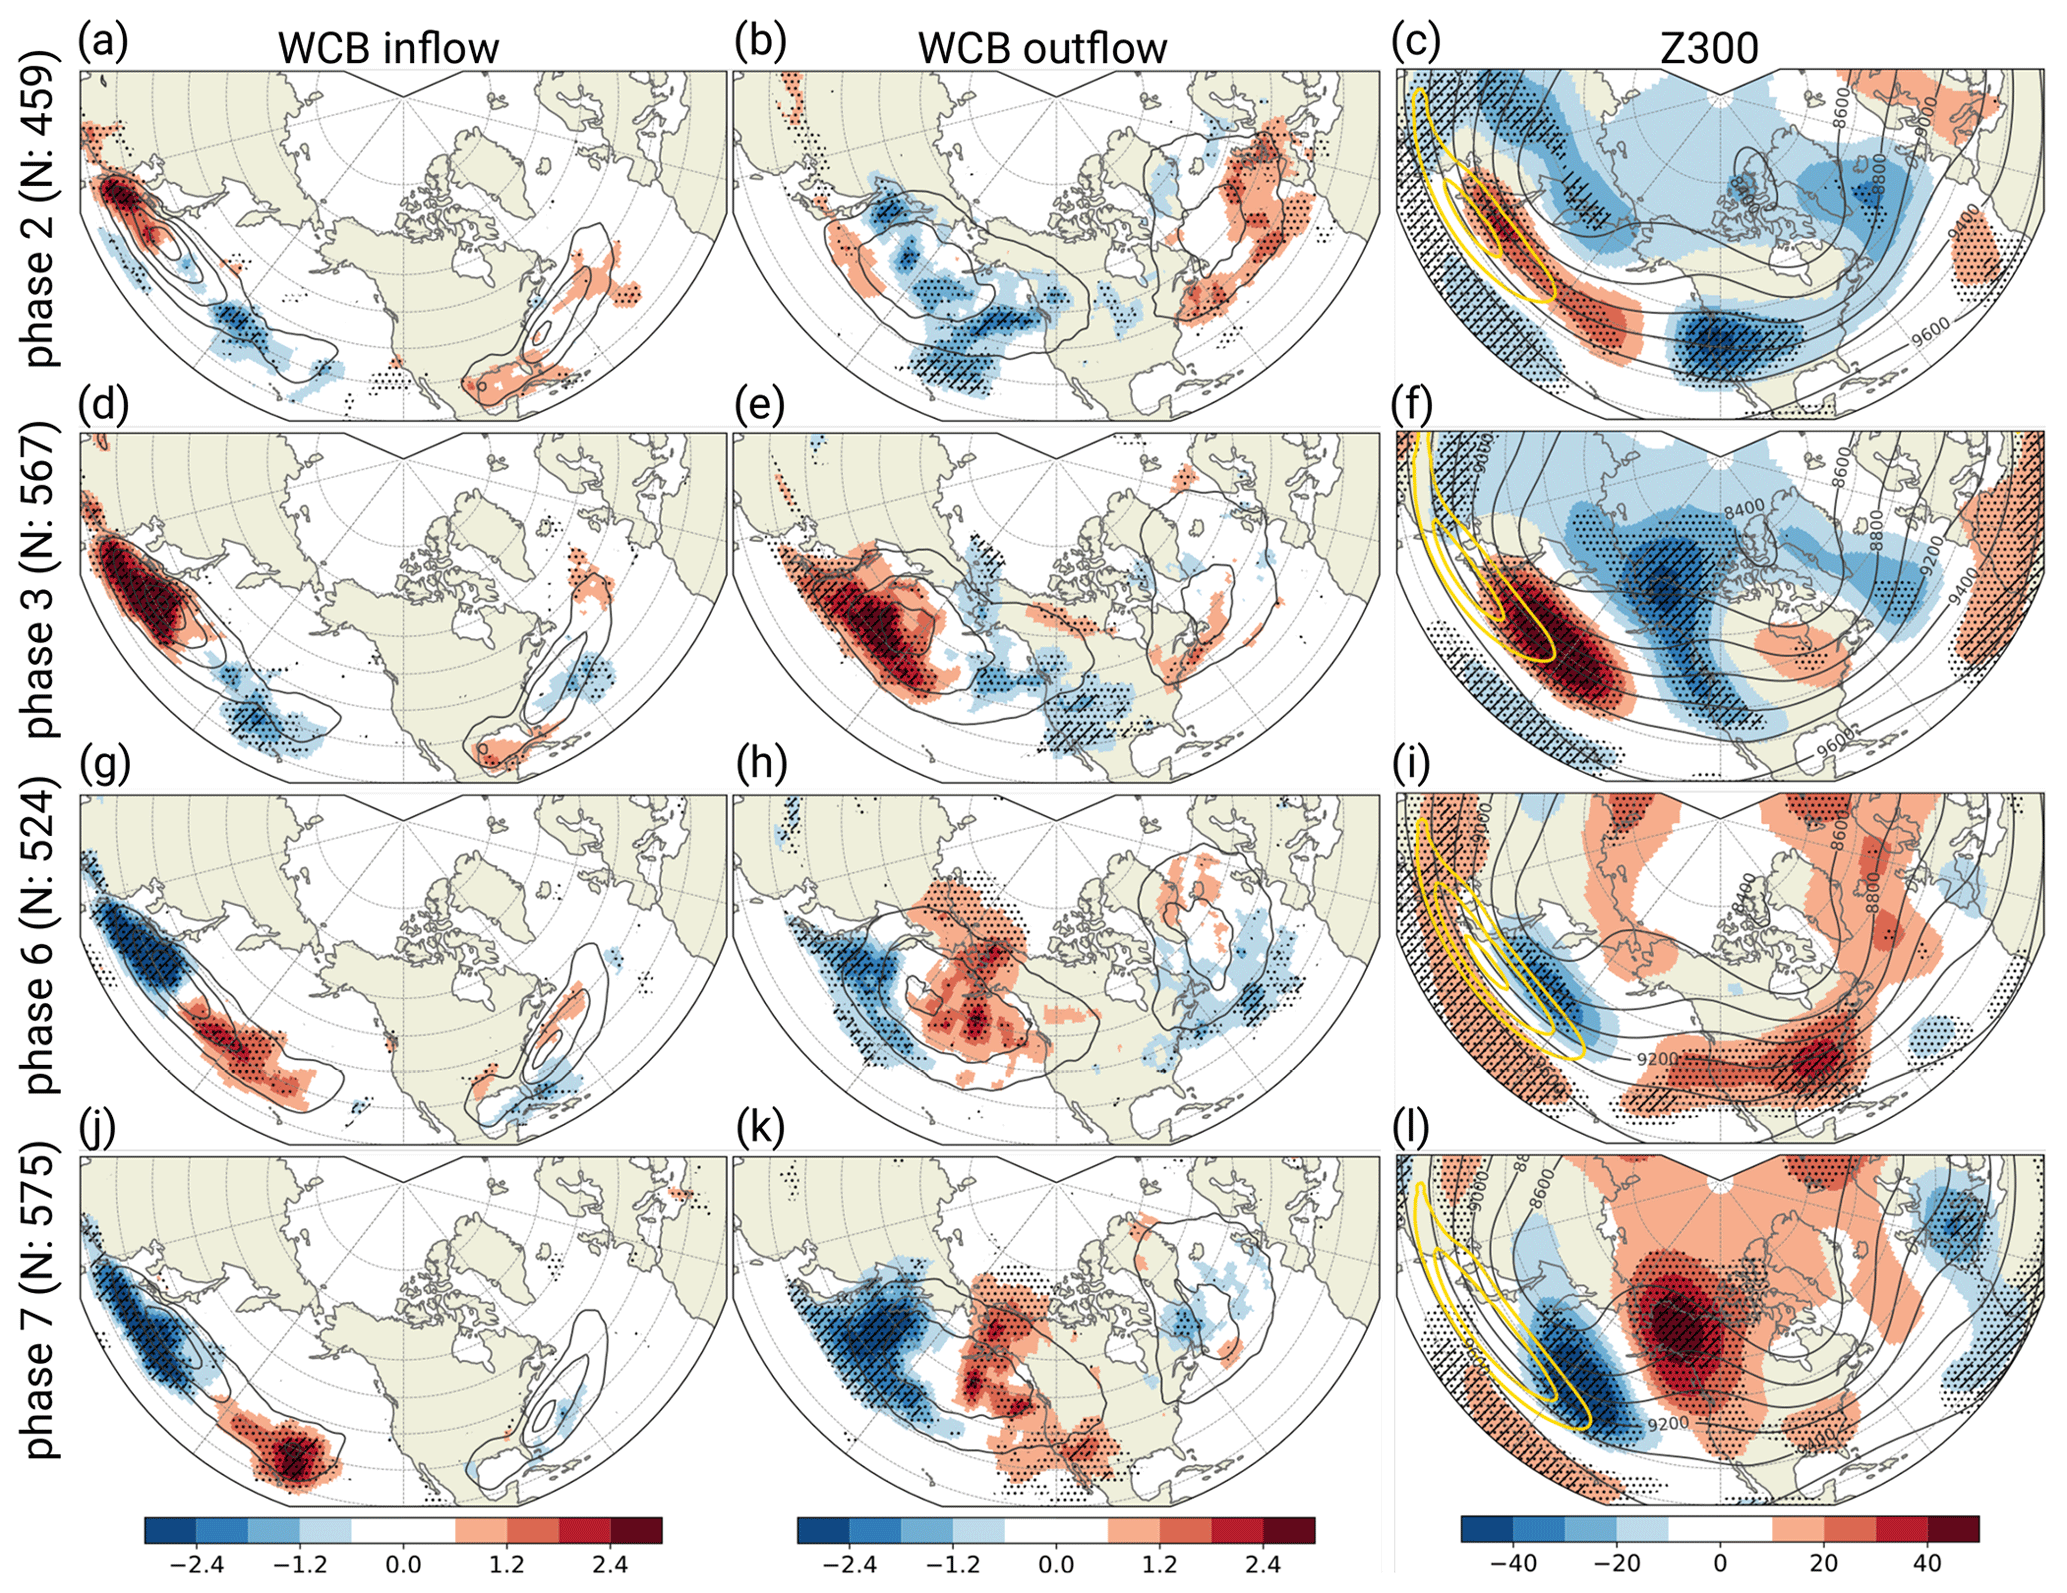
Figure 1Composites of trajectory-based (a, d, g, j) WCB inflow and (b, e, h, k) WCB outflow frequency anomalies (shading in %) and mean absolute frequencies (contours every 5 %) for pentad 0 of MJO phases 2, 3, 6, and 7. (c, f, i, l) The 300 hPa geopotential height anomalies (shading in gpm), mean 300 hPa geopotential height (dark contours every 200 gpm from 8400 to 9600 gpm), and 300 hPa mean wind speed (yellow contours at 40, 50, and 60 m s−1). Significant anomalies are indicated by stippling, and robust anomalies are indicated by hatching. N represents the total number of active MJO days in each phase during the entire period.
The WCB inflow and outflow frequency anomalies change sign in pentad 0 of MJO phases 6 and 7 (Fig. 1g, h, j, k). WCB inflow and outflow are suppressed over the western to central North Pacific (120 to 180∘ E) and significantly enhanced in the exit region of an eastward-extended jet over the eastern North Pacific (Fig. 1i and l). Positive WCB outflow anomalies cover large parts of the eastern North Pacific and reach poleward towards the high latitudes (Fig. 1h and k). In pentad 0 of phase 7, the enhanced WCB inflow and outflow activity is linked to a dipole pattern in geopotential height with below-average geopotential over the central North Pacific and anomalously high geopotential over western North America (Fig. 1l). This again corresponds to a teleconnection pattern that has been documented in previous studies (e.g., Vitart et al., 2017). The enhanced WCB inflow activity southeast of a negative geopotential height anomaly is likely due to a jet extension, which enhances baroclinic instability in this region and thus increases the frequency and/or intensity of extratropical cyclones (Moore et al., 2010; Wang et al., 2018). The collocation of positive WCB outflow frequency anomalies and positive geopotential height anomalies over western North America after phase 7 indicates a possible contribution of cross-isentropically ascending air and divergent outflow to the amplitude of the geopotential height anomaly.
After all four phases considered here, the WCB activity exhibits weak but locally significant anomalies also over the North Atlantic. Pentad 0 of MJO phases 2 and 3 tends to be associated with enhanced WCB outflow activity (Fig. 1b, e). This is in line with an increased frequency of NAO+ after phases 2 and 3 (Cassou, 2008; Lin et al., 2009), which generally tends to enhance the North Atlantic extratropical cyclone frequency (Serreze et al., 1997; Pinto et al., 2009) and the WCB activity (Eckhardt et al., 2004) accordingly. In contrast, the increased frequency of NAO– acts to reduce cyclone activity (Pinto et al., 2009), which is reflected by below-average WCB outflow activity after MJO phases 6 and 7 (Fig. 1h and k).
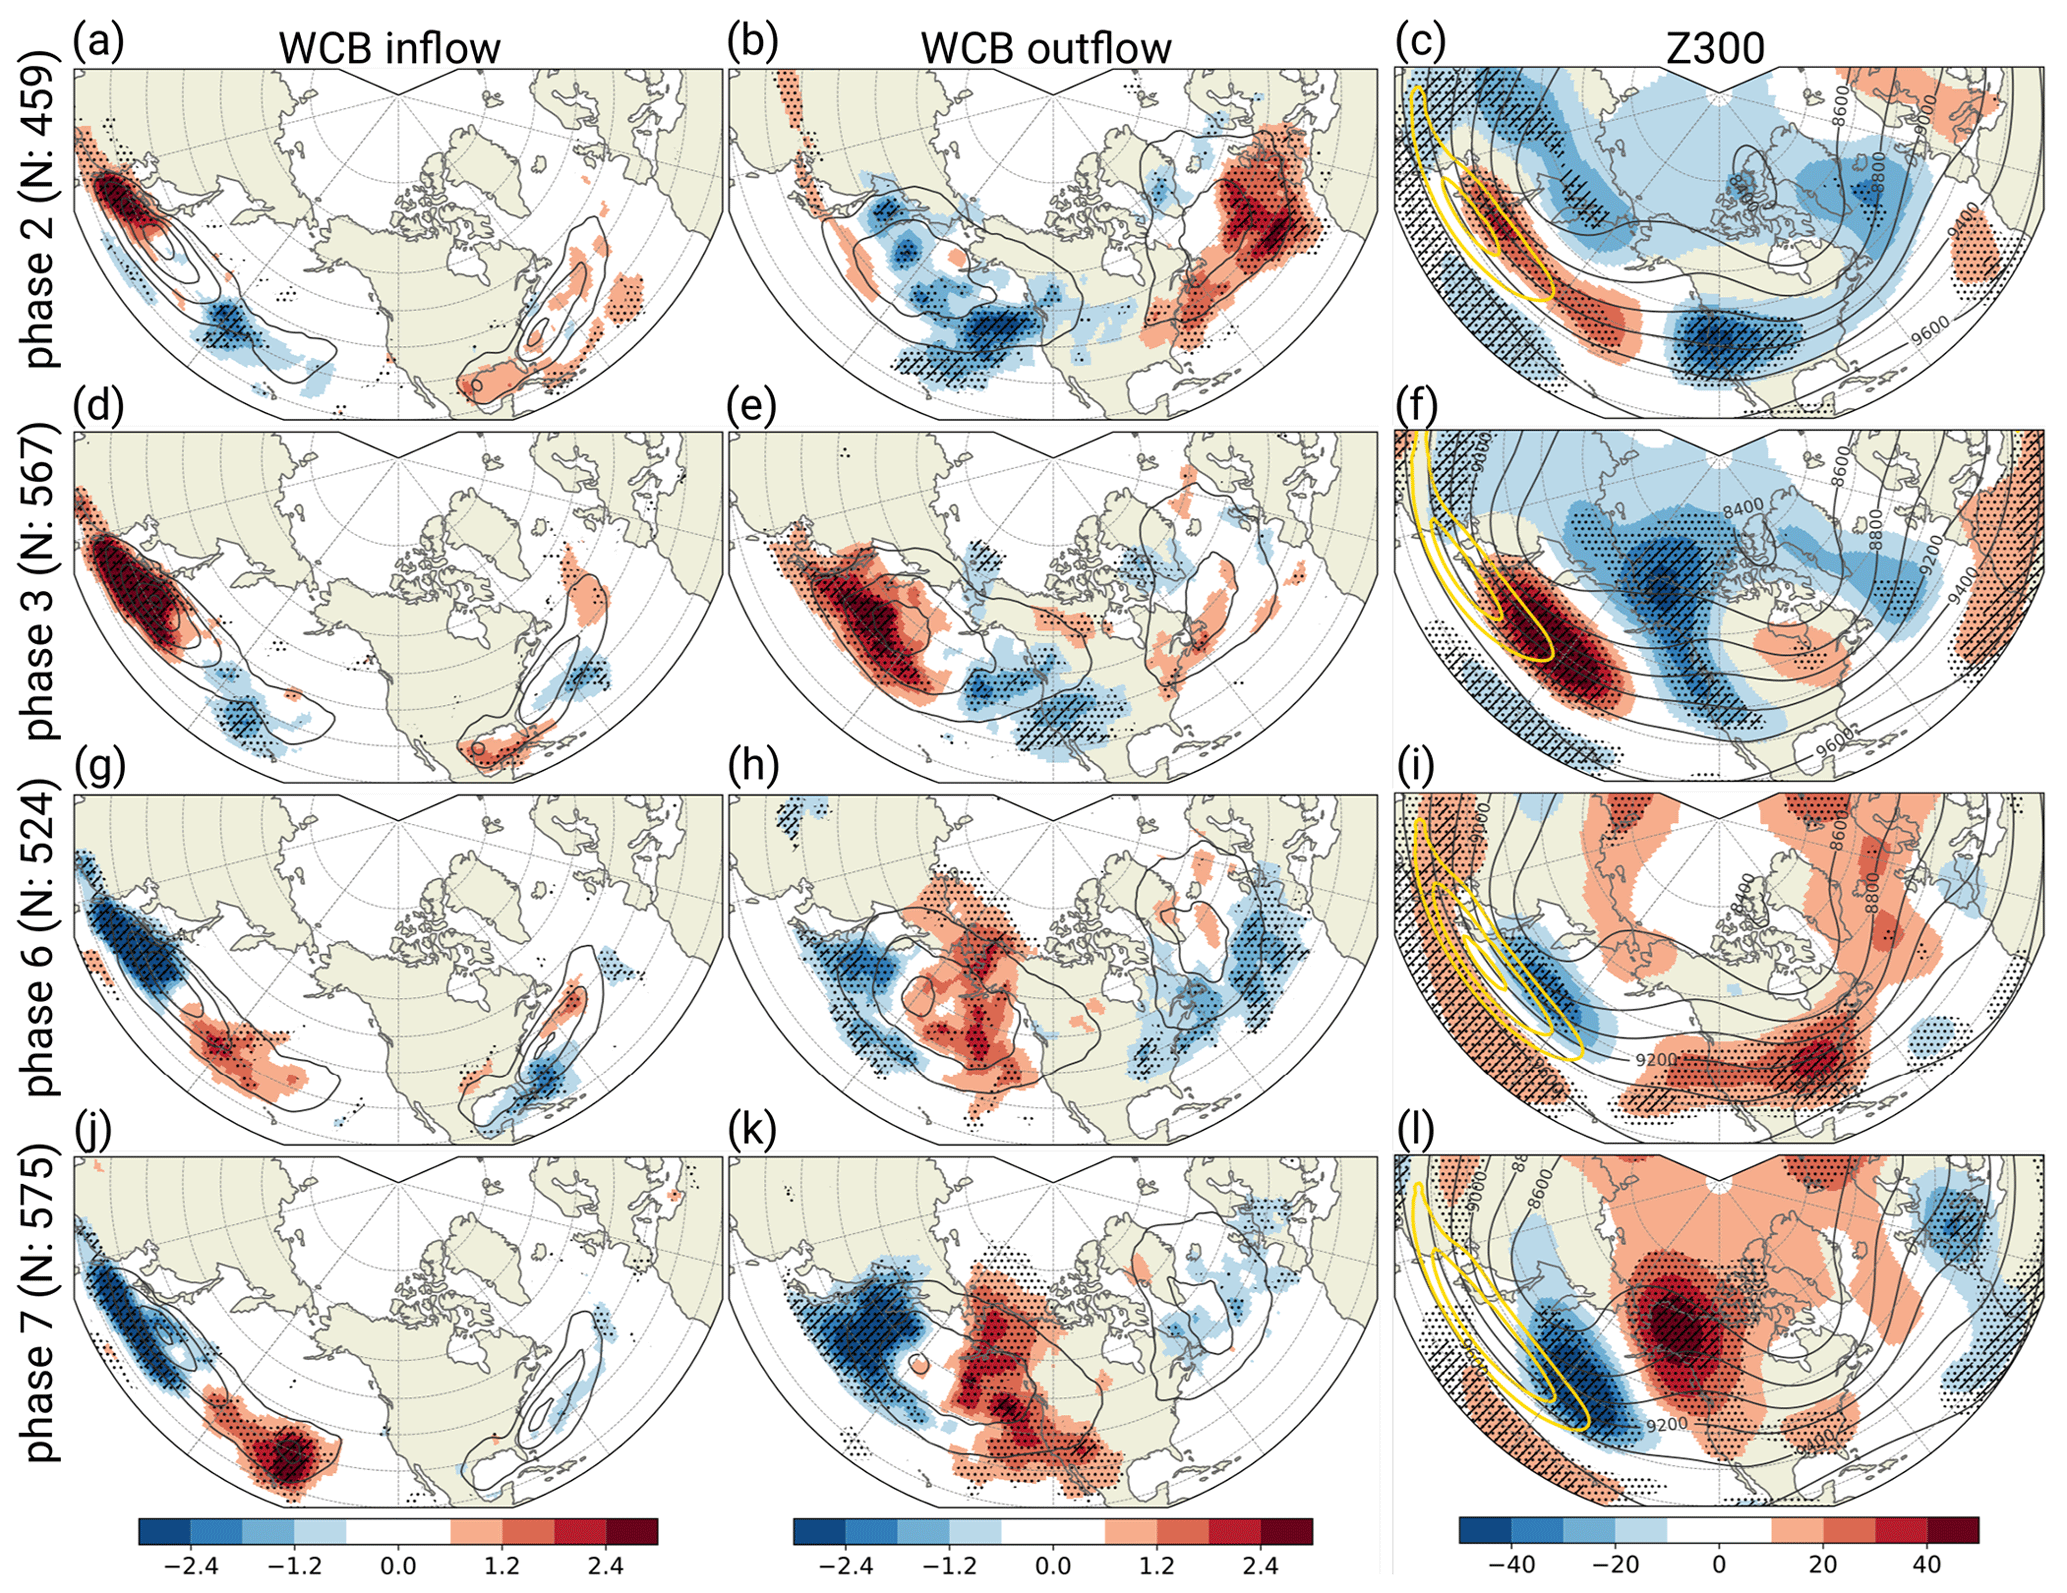
Figure 2Composites of CNN-based (a, c, e, g) WCB inflow and (b, d, f, h) WCB outflow frequency anomalies (shading in %) and mean absolute frequencies (contours every 5 %) for pentad 0 of MJO phases 2, 3, 6, and 7. (c, f, i, l) The 300 hPa geopotential height anomalies (shading in gpm), mean 300 hPa geopotential height (dark contours every 200 gpm from 8400 to 9600 gpm), and 300 hPa mean wind speed (yellow contours at 40, 50, and 60 m s−1). Significant anomalies are indicated by stippling, and robust anomalies are indicated by hatching. The dashed and solid polygons in panels (a), (c), (e), and (g) denote sub-regions over the western and eastern North Pacific, respectively. N represents the total number of active MJO days in each phase during the entire period.
So far, the WCB activity has been analyzed with the trajectory-based data set. Qualitatively and quantitatively similar results are found with the CNN-based WCB data (Sect. 2.3); see Fig. 2. WCB inflow and outflow activity is anomalously high over the western to central Pacific and anomalously low over the eastern North Pacific during MJO phases 2 and 3 (Fig. 2a–d). A dipole of opposite anomalies is found over the North Pacific during MJO phases 6 and 7 (Fig. 2e–h). Also for the North Atlantic, the WCB frequency anomalies are qualitatively the same with enhanced WCB activity after MJO phases 2–3 and suppressed WCB activity after phases 6–7. Only after MJO phases 2 and 6 do the outflow anomalies show a greater amplitude. We attribute this to the fact that the CNN models do not explicitly match WCB candidates with extratropical cyclone masks (Quinting and Grams, 2022), which the trajectory approach does (Madonna et al., 2014). Accordingly, the CNN models may also identify some WCB outflow objects that do not overlap with a cyclone mask and are therefore filtered out in the trajectory-based WCB data set. Still, due to the overall agreement of the composites obtained with the two methods, the CNN-based approach seems to be a suitable and computationally inexpensive diagnostic, which we employ for the remaining analyses in this study. The main reason is that the modulations of WCB activity shown here will serve as a baseline for the evaluation of subseasonal hindcast data in a follow-up study.
We expand our analysis to all MJO phases by focusing on two sub-regions over the North Pacific, where the modulation of WCB inflow frequency is the most pronounced. The first sub-region (dashed polygon in Fig. 2a, c, e, g) extends from 120 to 170∘ E and 20 to 45∘ N over the western North Pacific, and the second sub-region (solid polygon in Fig. 2a, c, e, g) extends from 170∘ E to 140∘ W and 20 to 45∘ N over the central to eastern North Pacific. The area-weighted mean anomalies of WCB inflow frequency, their statistical significance, and their robustness are shown in Fig. 3. For the western North Pacific, two coherent structures of above- and below-normal WCB inflow activity are found (Fig. 3a). WCB inflow activity is enhanced during the days following phases 2–4 and reduced during the days following phases 6–8. The anomalies are continuously significant and robust for up to 10 d, which is considerably longer than the typical duration of a single MJO phase of 5–6 d. Accordingly, the modulations of WCB inflow frequency are similar for about two consecutive MJO phases. Two coherent structures of above- and below-normal WCB inflow activity are also found over the central to eastern North Pacific but with opposite signs (Fig. 3b). Though the amplitude of the anomalies is generally weaker due to an overall lower climatological occurrence frequency in this region (see Fig. 2), the modulations are still partly significant and robust with below-normal WCB inflow activity after phases 2–3 and above-normal WCB inflow activity after phases 5–7. Over this region, the only phases that are not followed by significant anomalies in WCB inflow activity are MJO phases 1 and 4.
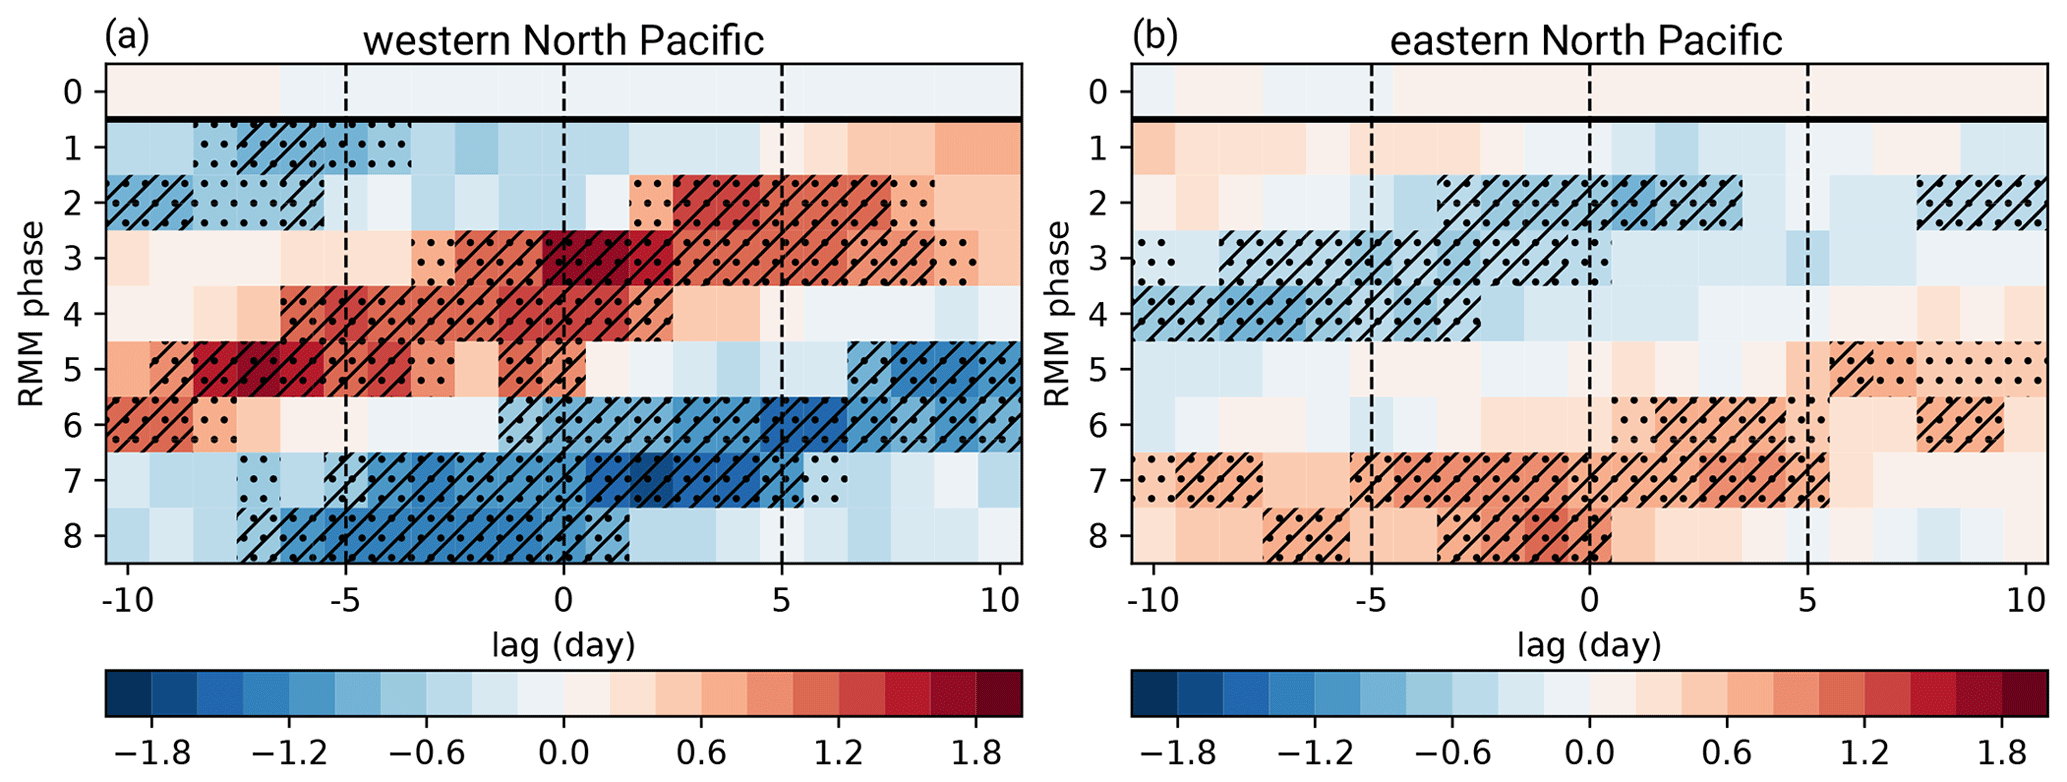
Figure 3Time-lagged analysis of CNN-based WCB inflow frequency anomalies (shading in %) over (a) the western North Pacific (see text for a definition of the domain) and (b) the eastern North Pacific preceding and following all MJO phases and inactive MJO phases (indicated as phase 0) with a lag of –10 to 10 d. Significant anomalies are indicated by stippling, and robust anomalies are indicated by hatching.
3.2 Modulation of WCB activity by the MJO conditioned on ENSO
Though the MJO is the dominant mode of tropical intraseasonal convective variability, its effect on midlatitude weather may be significantly modulated by even slower-evolving climate modes such as ENSO (e.g., Lee et al., 2019; Arcodia et al., 2020). Accordingly, we further analyze the modulation of WCB activity conditioned on positive and negative phases of the monthly ENSO indices, again focusing on the two sub-regions over the western and central to eastern North Pacific.
Generally speaking for the western North Pacific, El Niño conditions during inactive MJO are associated with weakly suppressed WCB inflow activity (RMM phase 0 in Fig. 4a) and La Niña conditions during inactive MJO with slightly enhanced WCB inflow activity (RMM phase 0 in Fig. 4c). Still, the general patterns of WCB inflow frequency anomalies under the different ENSO conditions are qualitatively similar to the pattern for all MJO events (Fig. 3a). The most notable difference during El Niño conditions is that positive WCB inflow frequency anomalies over the western North Pacific are weaker and less persistent (Fig. 4a) than during all MJO days (Fig. 3a). Conversely, the negative WCB inflow frequency anomalies following MJO phases 6–8 are more pronounced. During La Niña, the generally enhanced WCB inflow activity leads to strong positive anomalies after phases 2–4 and slightly weaker negative anomalies after phases 6–8 (Fig. 4c). In particular, the marked increase in WCB activity during La Niña is in line with anomalously wet conditions (Moon et al., 2011) and an enhanced synoptic activity (Takahashi and Shirooka, 2014) in the same region.
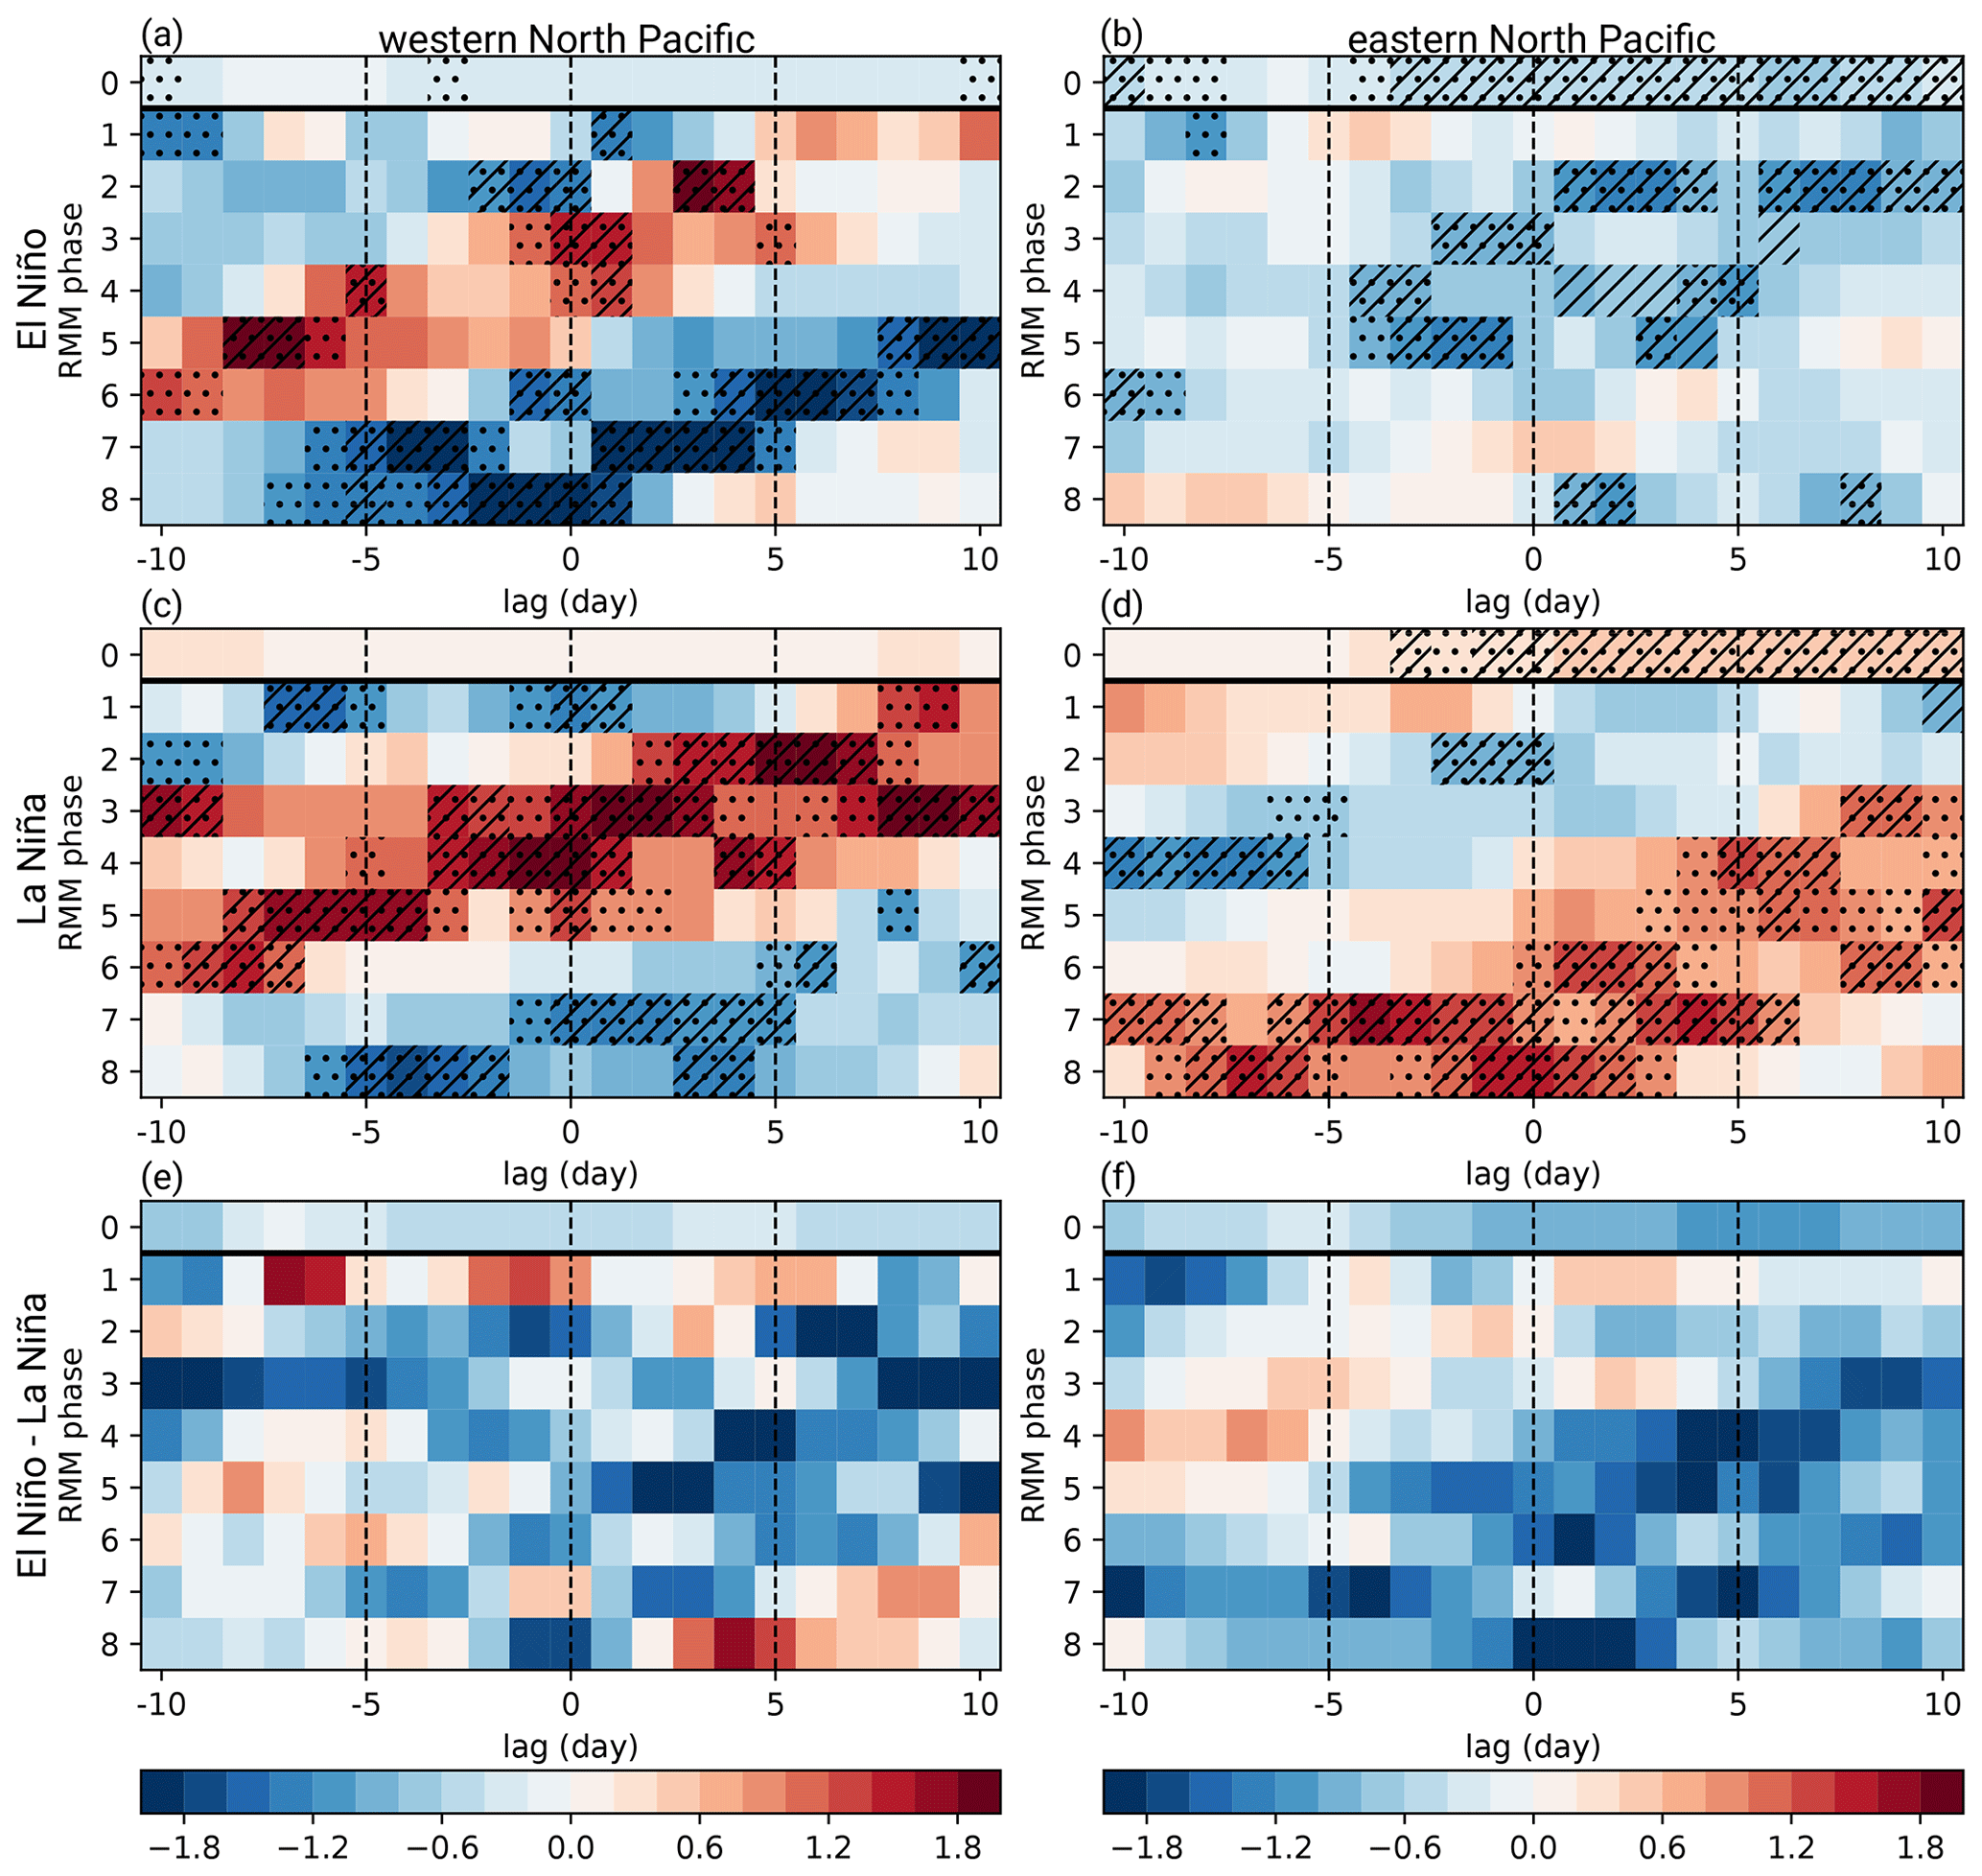
Figure 4The same as Fig. 3 but for (a) the western and (b) eastern North Pacific during El Niño, (c) the western and (d) eastern North Pacific during La Niña, and the difference between El Niño and La Niña for (e) the western and (f) eastern North Pacific.
For the sub-region over the central to eastern North Pacific, El Niño conditions are characterized by a significant suppression of WCB inflow activity (RMM phase 0 in Fig. 4b). Accordingly, negative frequency anomalies after phases 2–4 exhibit a higher amplitude, and the significant increase following MJO phases 6–8 does not occur any longer. This increase, however, is significantly enhanced during La Niña due to a generally enhanced WCB inflow activity over the eastern North Pacific (RMM phase 0 in Fig. 4d).
In summary, MJO-related WCB activity anomalies over the North Pacific are suppressed during El Niño and enhanced during La Niña. Accordingly, the modulation of WCB activity by the MJO is primarily linearly influenced by ENSO, as can be seen by mostly negative values in Fig. 4e and f. This response is in line with previous studies establishing the link between MJO, ENSO, and North Pacific storm-track activity (Takahashi and Shirooka, 2014).
3.3 Intra-phase variability of WCB modulation
Upon analysis of the modulation of WCB activity by the MJO, we found a substantial intra-phase variability ranging from pentads with substantially suppressed WCB activity to pentads with greatly increased WCB activity (Fig. 5). In the following, we aim to identify reasons for this intra-phase variability and to investigate the link of this intra-phase variability to tropical–extratropical teleconnections (Sect. 3.4). We do so by first computing area-mean WCB inflow frequency anomalies in the sub-region over the western Pacific (dashed polygon in Fig. 2) during pentad 0 of phases 2 and 3 and in the sub-region over the central to eastern Pacific (solid polygon in Fig. 2) during pentad 0 of phases 6 and 7. The locations of the boxes are chosen such that they roughly encompass the positive WCB inflow frequency anomalies discussed previously (Sect. 3.1). In line with the positive frequency anomalies over the western Pacific during phases 2 and 3 (Fig. 2a and c) and over the eastern Pacific during phases 6 and 7 (Fig. 2e and g), the distributions of the area-mean WCB inflow frequency anomaly are skewed towards positive values (Fig. 5). Still, there is a substantial variability, with more than one-third of the pentads exhibiting negative WCB inflow frequency anomalies (dashed vertical lines in Fig. 5). For the analysis of the intra-phase variability, we differentiate between MJO events with anomalously low and high WCB activity during pentad 0 by determining the lower and upper tercile of the WCB inflow frequency anomalies (dashed vertical lines in Fig. 5). The lower terciles are consistently characterized by negative WCB inflow frequency anomalies, and the upper terciles only include pentads with above-average WCB inflow frequency anomalies.
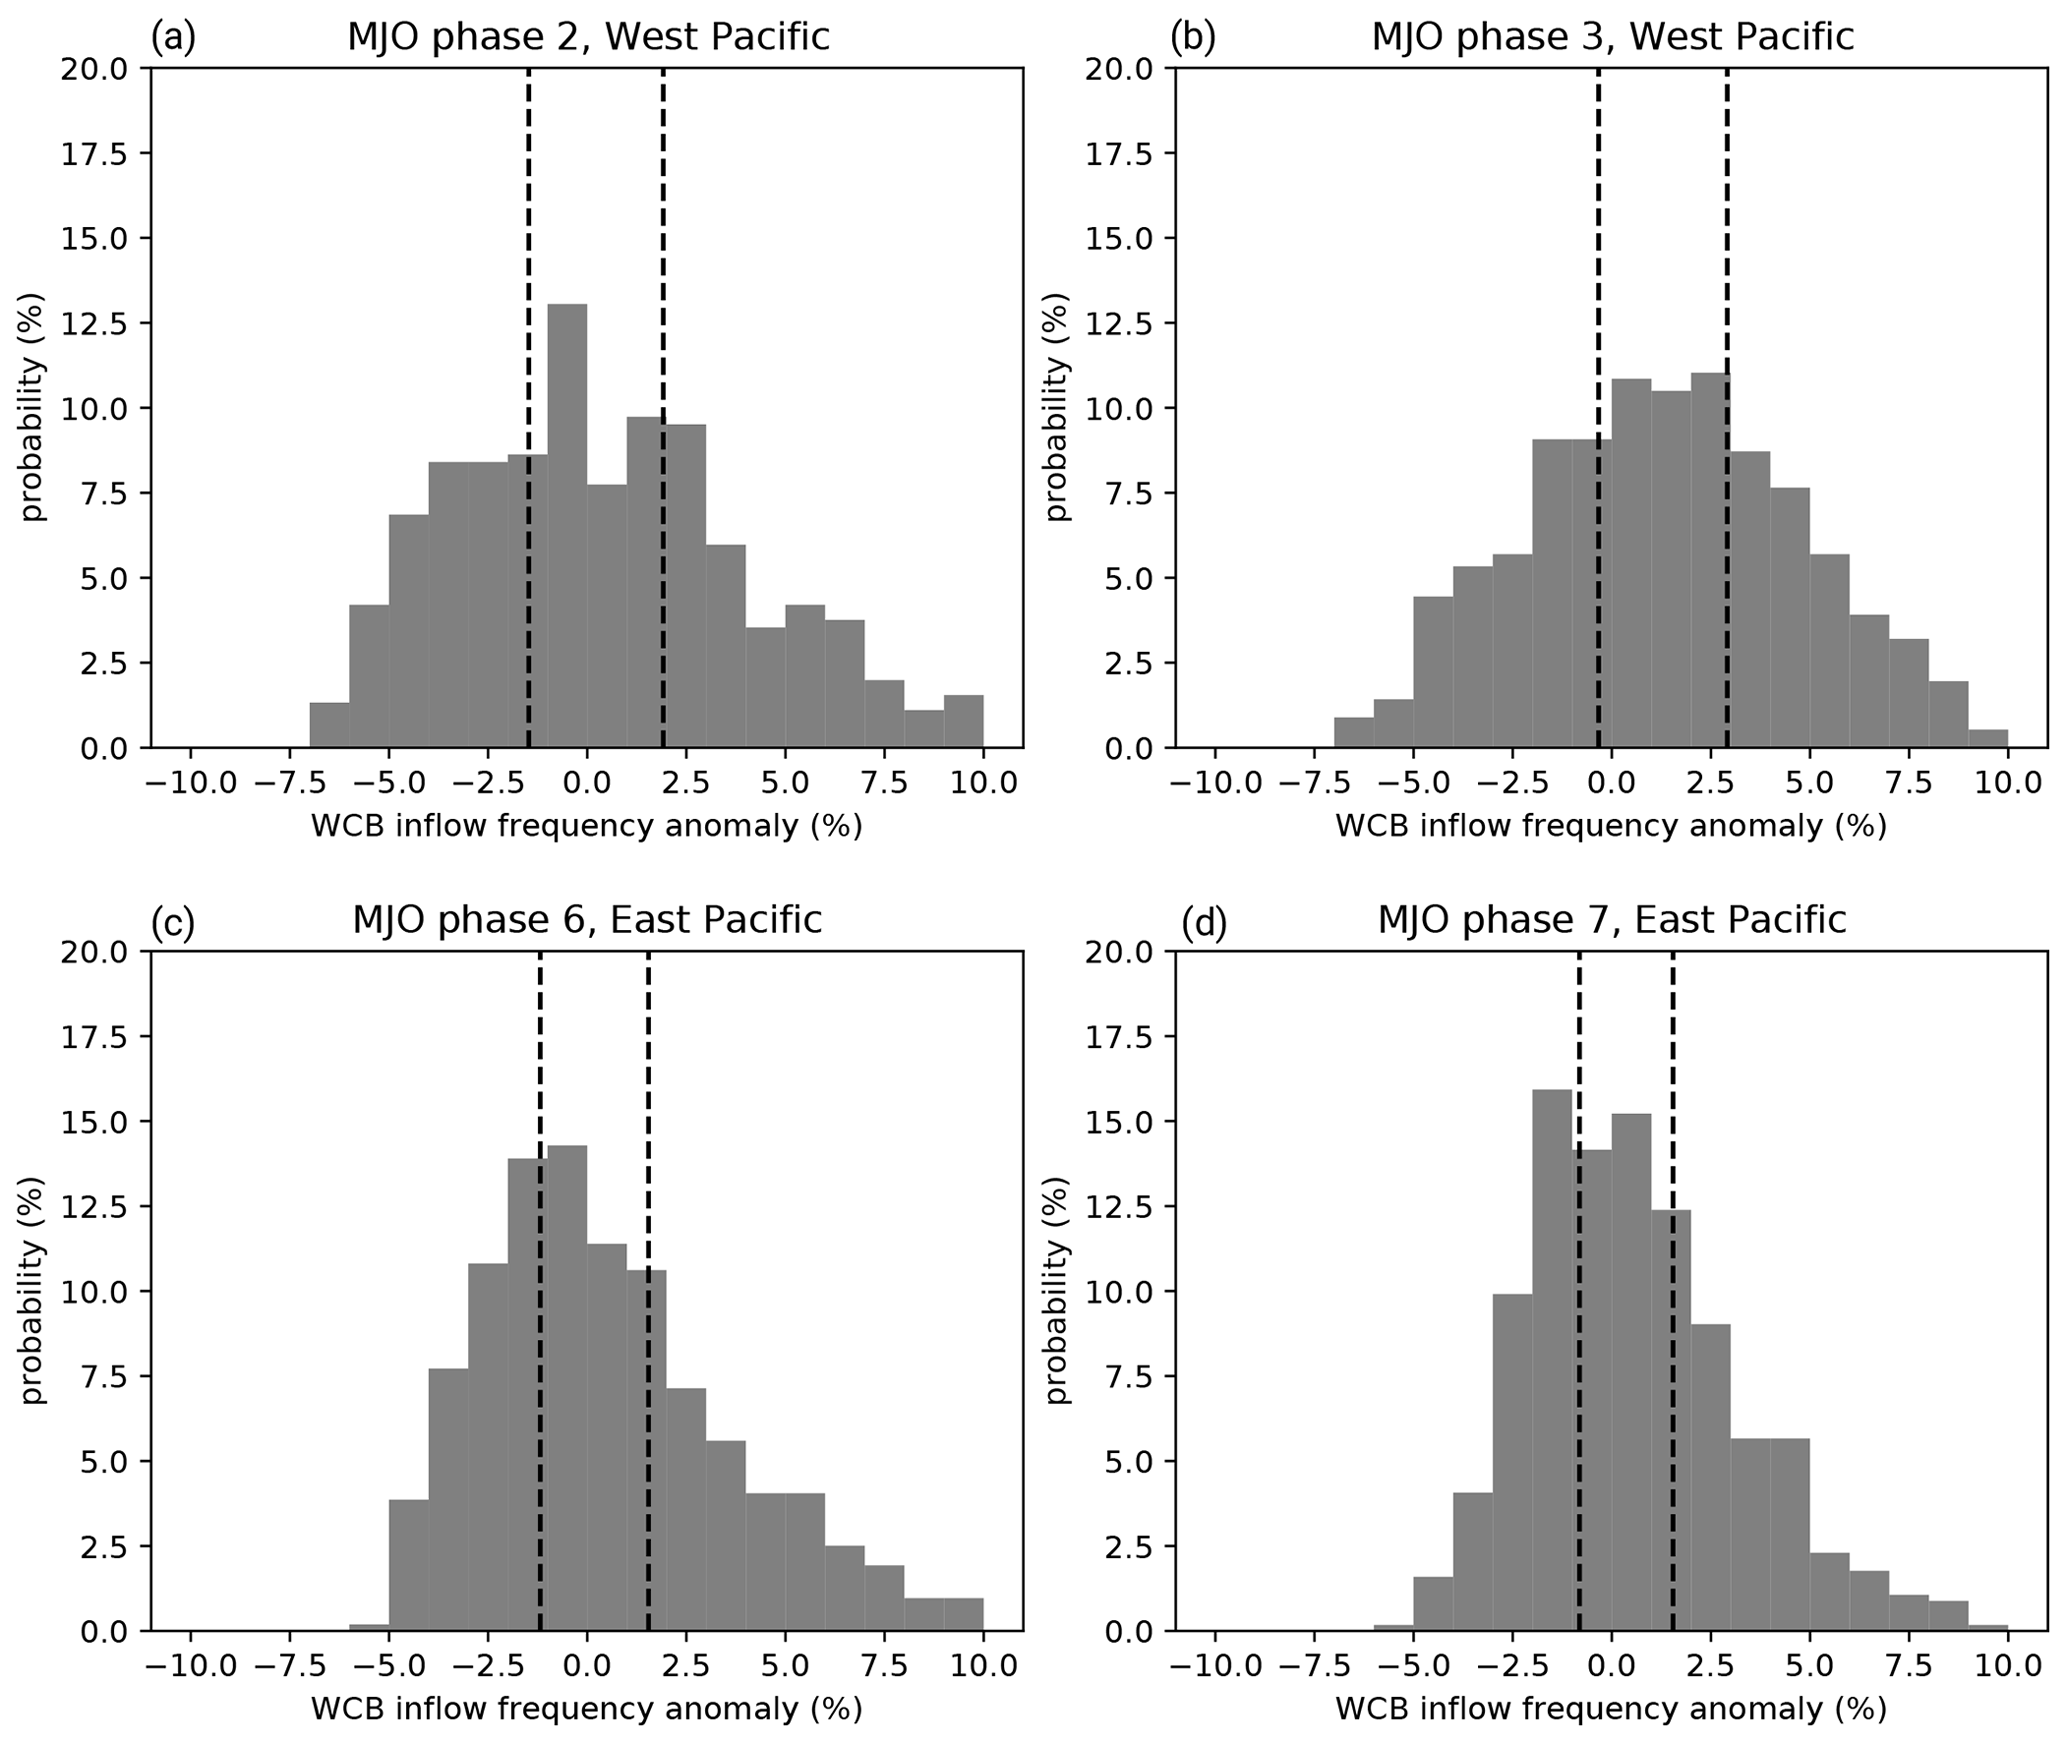
Figure 5Distribution of CNN-based WCB inflow frequency anomalies over (a, b) the western North Pacific (dashed polygon in Fig. 2) during pentad 0 of MJO phases 2 and 3 and (c, d) the eastern North Pacific (solid polygon in Fig. 2) during pentad 0 of MJO phases 6 and 7. The dashed vertical lines indicate the boundaries between the terciles.
The inflow stage of WCBs is typically characterized by bands of high horizontal water vapor transport that supply moisture to the base of the WCB (e.g., Wernli and Davies, 1997; Dacre et al., 2019).1 Accordingly, the 850 hPa horizontal moisture flux is an important predictor variable for the CNN models (Quinting and Grams, 2021a, 2022). Further, WCB air masses are located in regions of quasi-geostrophic forcing for ascent (Binder et al., 2016), which, according to the quasi-geostrophic omega equation, arises from warm thermal advection or cyclonic vorticity advection increasing with height (e.g., Davies, 2015). Accordingly, the 700 hPa thickness advection is another important predictor for WCB inflow. A diagnostic quantity that combines the moisture flux and the thickness and thermal advection is the so-called baroclinic moisture flux B (McTaggart-Cowan et al., 2017). Large values of B indicate regions in which the horizontal moisture flux is parallel to the horizontal temperature gradient. In its integral form and using a fixed reference frame, the baroclinic moisture flux is defined as
with the gravitational acceleration g, the density ρ, dry static stability σ, the gas constant for dry air R, temperature T, pressure p, the horizontal wind vector V, and specific humidity q. The vertical integration is performed between pb=850 hPa and pt=250 hPa. To establish a link between the anomalous WCB activity and circulation anomalies, in the following we investigate composites of baroclinic moisture flux anomalies and 850 hPa moisture transport anomalies.
Pentad 0 of MJO phases 2 and 3 with high WCB inflow activity is associated with an anticyclonic circulation anomaly and corresponding moisture flux anomalies over the subtropical western North Pacific (Fig. 6b and d). As the anticyclonic anomaly is centered between 15 to 20∘ N, it likely reflects the anticyclonic Rossby gyre that forms in response to the diabatic heating associated with the MJO (Matsuno, 1966; Gill, 1980; Kim et al., 2006; Jeong et al., 2008). The Rossby gyre induces northward- to northeastward-directed moisture flux anomalies over East Asia and the western North Pacific, which strengthen the climatological mean moisture flux in these regions (not shown). Most notably, the moisture flux anomalies are considerably stronger than in phases with weak WCB activity (Fig. 6a and c). The northward- to northeastward-directed moisture flux anomalies are collocated with a broad region of positive B anomalies, extending from east China to the central North Pacific. It is this region which is also characterized by positive WCB inflow frequency anomalies. This clearly indicates that the increased WCB inflow activity during phases 2 and 3 is related to stronger anticyclonic Rossby gyres, which enhance northward-directed moisture flux along sloping isentropic surfaces. Once the air masses start to ascend and cool adiabatically, moist diabatic processes further enhance the ascent frequency of WCBs.
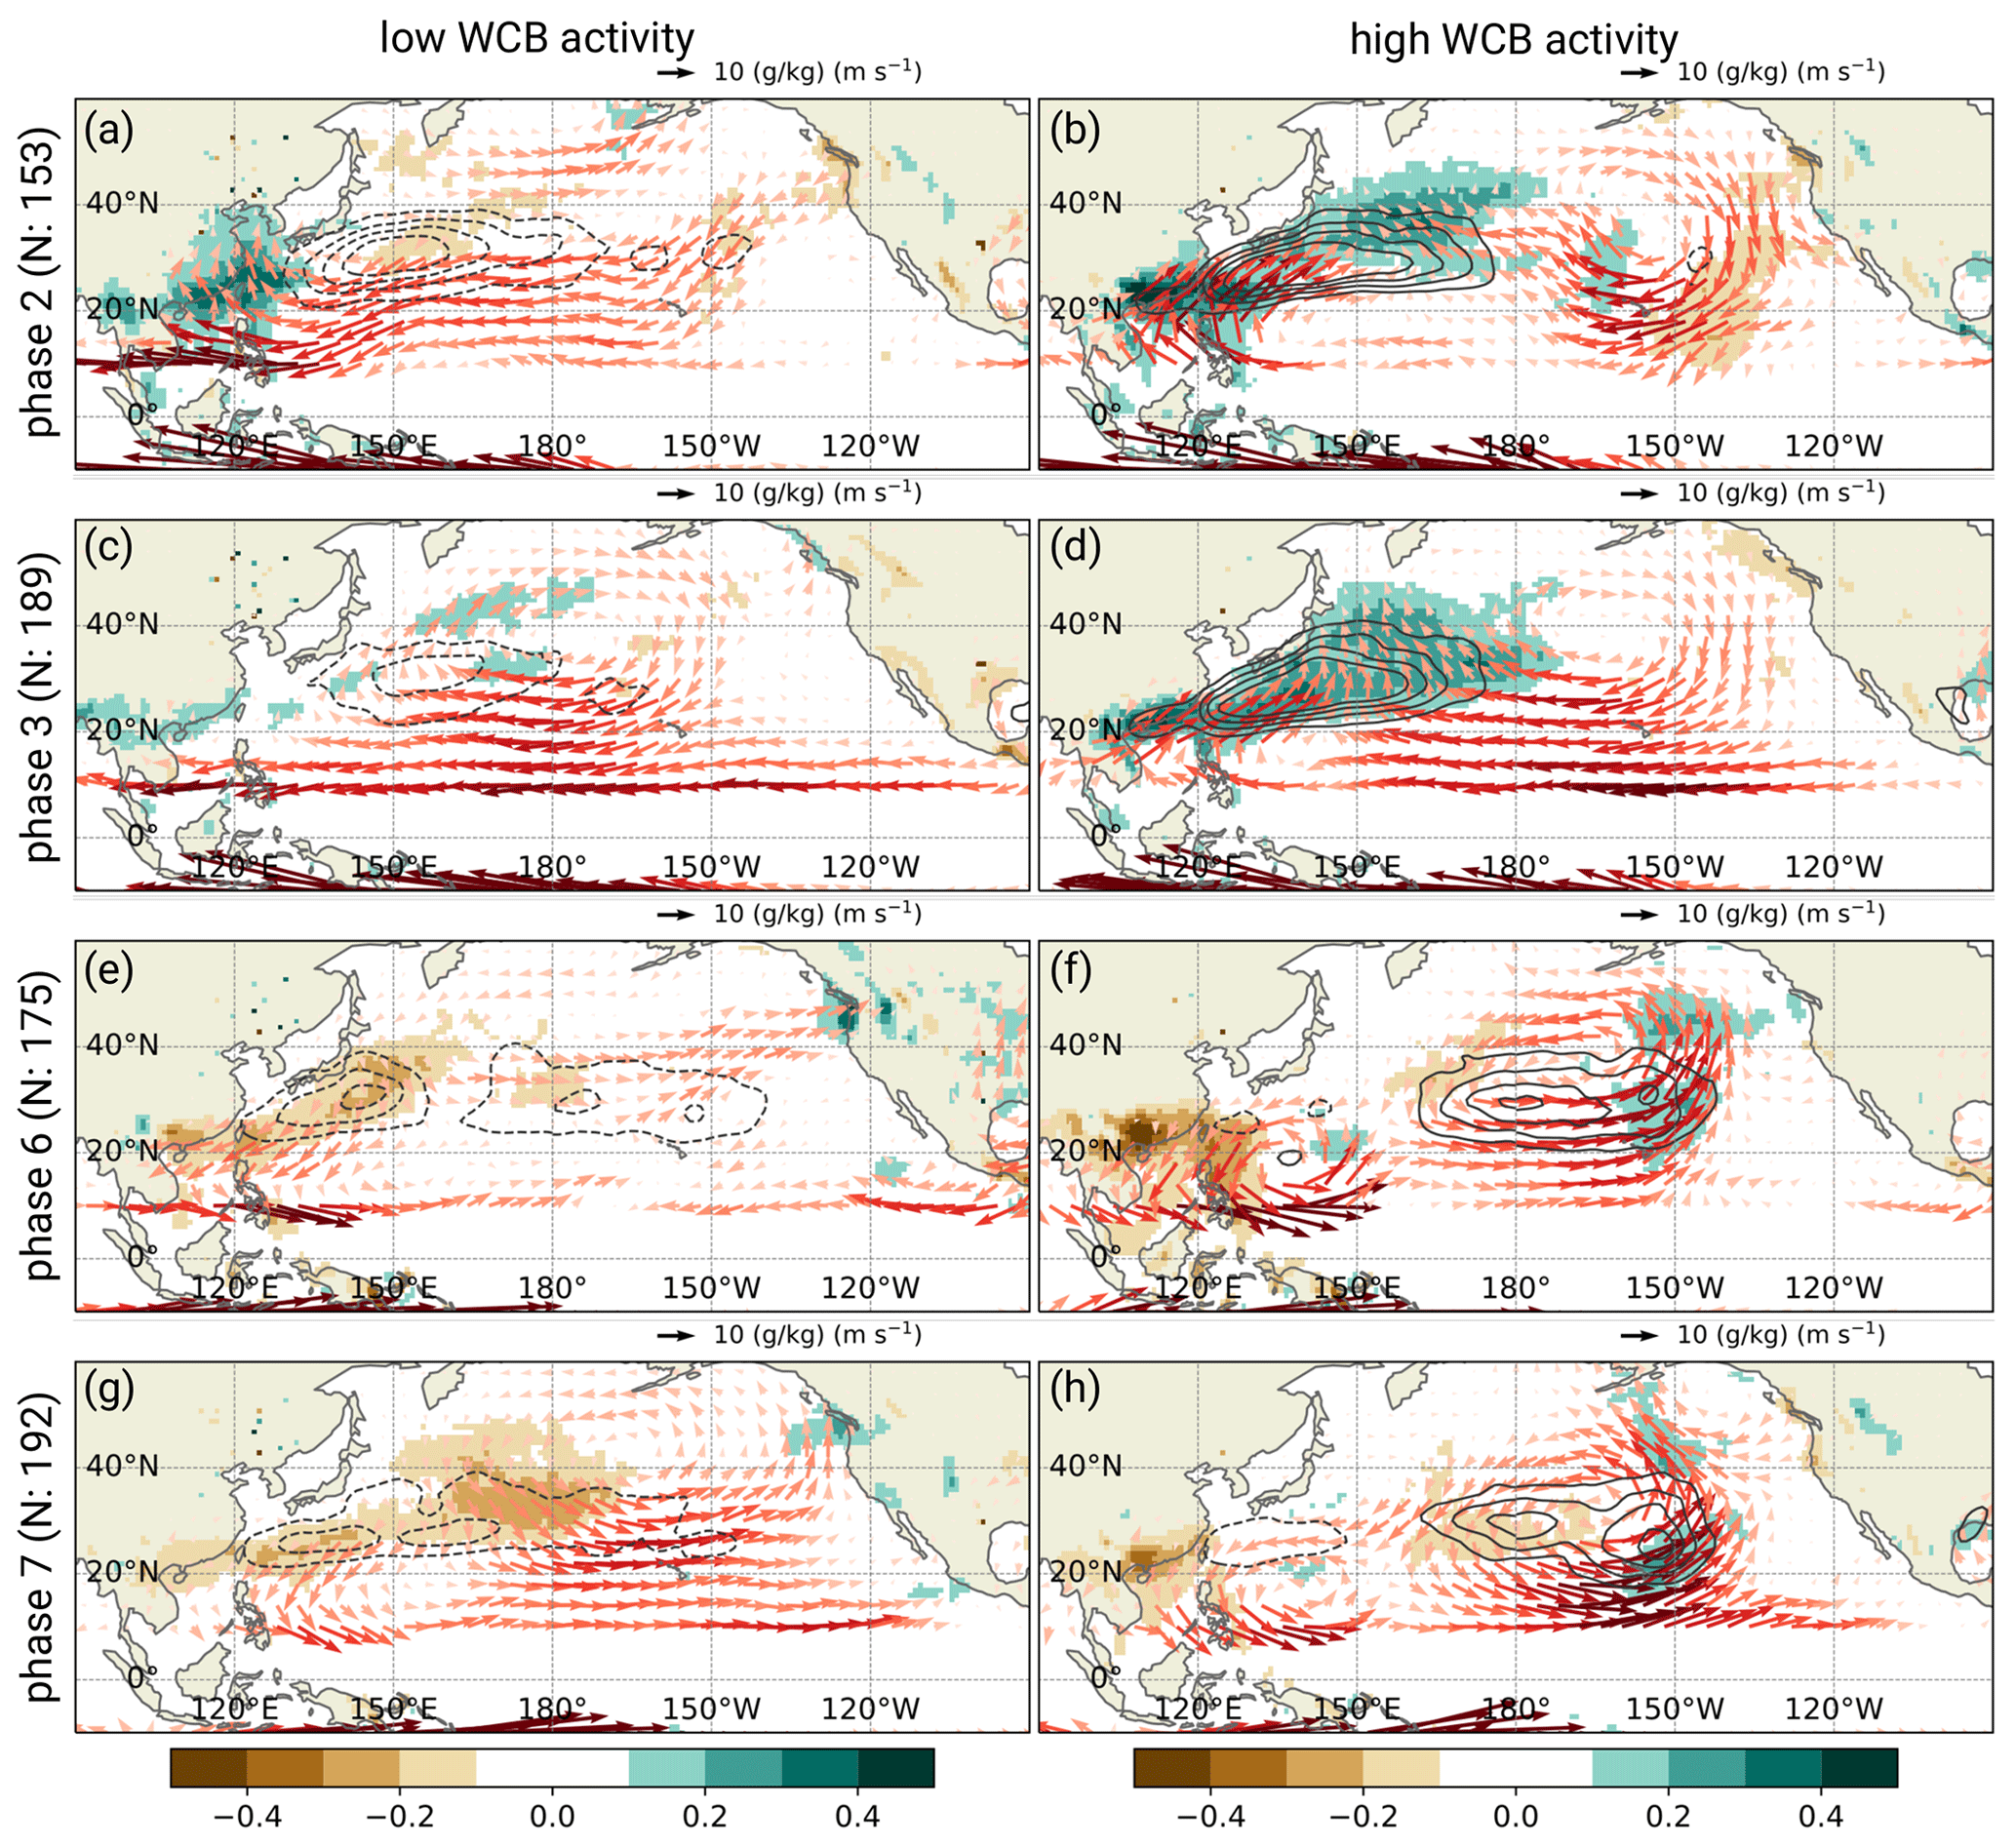
Figure 6Composites of baroclinic moisture flux anomalies (shading 10−4 m2 s−1), 850 hPa moisture flux anomalies (red arrows; vector lengths scaled according to the reference vector), and CNN-based WCB inflow frequency anomalies (contours every ±2 % starting at ±2 %) during pentad 0 of MJO phases 2, 3, 6, and 7 with (a, c, e, g) low WCB activity and (b, d, f, h) high WCB activity. N represents the total number of active MJO days in each tercile. Moisture flux vectors are not shown between 10∘ S to 10∘ N.
Pentad 0 of MJO phases 6 and 7 is generally characterized by cyclonic circulation anomalies over the central to eastern North Pacific (Fig. 6e–h) that act to strengthen the climatological mean moisture transport (not shown). In cases with suppressed WCB inflow activity in this region, a weak cyclonic anomaly is centered at 45∘ N and 170∘ W (Fig. 6e and g). As the associated moisture flux is directed parallel to the temperature gradient in this region (not shown), B is close to climatology. Pentad 0 with high WCB inflow activity is also characterized by a cyclonic anomaly over the central to eastern North Pacific (Fig. 6f). However, the cyclonic anomaly is stronger, and the circulation is centered further south at 40∘ N during phase 6 and at 30∘ N during phase 7. As its circulation reaches into the subtropics with climatologically high moisture content (not shown), it is accompanied by strong eastward and northward moisture fluxes on its southern and eastern flanks, respectively. The poleward moisture fluxes are directed across the temperature gradient, leading to positive B anomalies as well as enhanced WCB inflow and ascent frequency (not shown). Rather surprisingly, positive WCB inflow frequency anomalies are also found on the western flank of the cyclonic anomaly in a region of weak negative B anomalies. Still, the positive frequency anomaly is located in a region of near-normal and climatologically strong moisture flux, which provides moisture in the WCB inflow region.
3.4 Modulation of MJO–midlatitude teleconnections after phases with anomalous WCB activity
Due to the overall importance of WCBs for the midlatitude large-scale dynamics (see Sect. 1), we hypothesize that pentads with anomalously low and high WCB activity during the same MJO phase as identified in Sect. 3.3 are followed by different downstream teleconnection patterns. In a first step, we address this hypothesis with time-lagged composites of 500 hPa geopotential height anomalies during pentad 1 (days 5–9) following MJO phases 2, 3, 6, and 7 with suppressed and enhanced WCB activity. Pentad 1 is chosen here to allow enough time for the effect of the additional diabatic heating by WCBs to become visible on the large scale.
For both low and high WCB activity over the western North Pacific during MJO phases 2 and 3, pentad 1 is characterized by a positive height anomaly over the central North Pacific (Fig. 7a–f). Accordingly, the pattern is similar to that shown in Fig. 1c and f. Still, after phases with high WCB inflow activity, the positive geopotential height anomalies are stronger and extend further north (Fig. 7b and e) compared to the phases followed with low WCB inflow activity (Fig. 7a and d). This suggests that WCB-related diabatic heating in conjunction with divergent outflow and the net transport of lower-tropospheric low-potential-vorticity air contribute to the amplitude of the anomalous anticyclonic anomaly. The amplified positive geopotential height anomaly over the North Pacific during phases with high WCB activity seems to have a comparably small effect on the downstream midlatitude flow over North America. Both phases with low and high WCB activity tend to be followed by negative height anomalies over western North America and positive height anomalies over eastern North America with slight variations in the latitudinal position. Except for events with high WCB activity after phase 2, a negative height anomaly over the North Atlantic projects on the positive NAO pattern. After phases 2 and 3 with low WCB activity, a positive height anomaly over the Iberian Peninsula indicates an eastward extension of the Azores High (Fig. 7a and d), whereas a significant positive anomaly emerges over Scandinavia after phase 2 with high WCB activity (Fig. 7b).
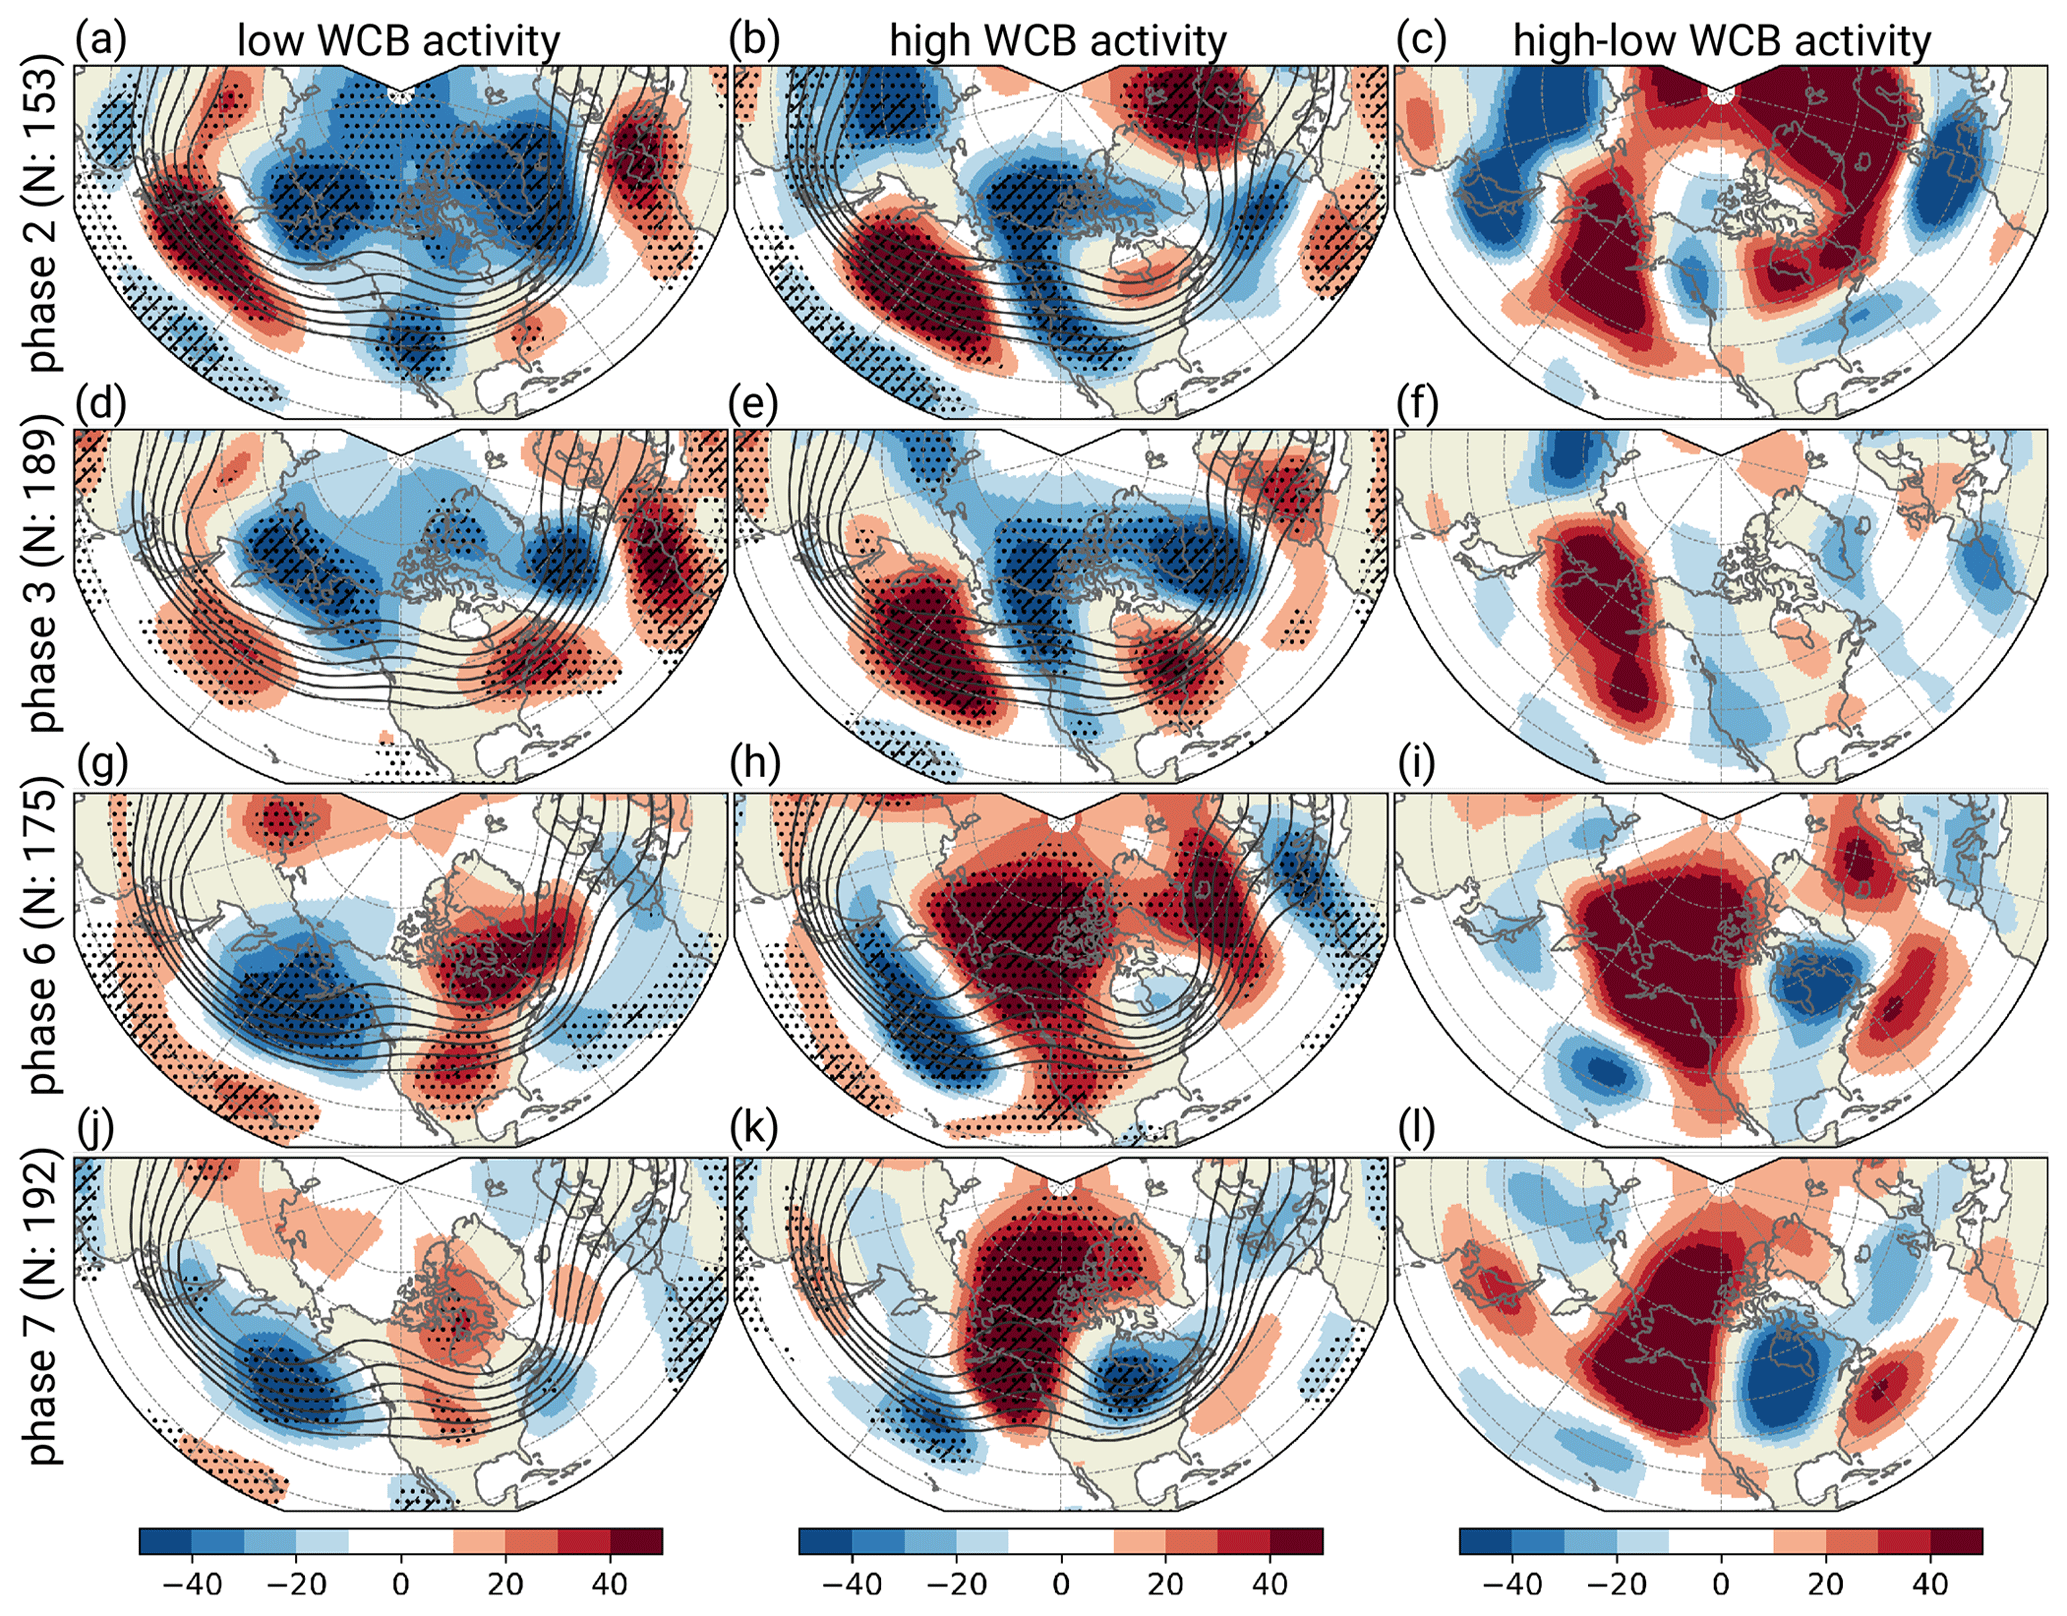
Figure 7Composites of 300 hPa geopotential height anomalies (shading in gpm) and mean geopotential height (contours at 8700, 8800, 8900, 9000, 9100, and 9200 gpm) during pentad 1 of MJO phases 2, 3, 6, and 7 with (a, d, g, j) low WCB activity and (b, e, h, k) high WCB activity. Significant anomalies are indicated by stippling, and robust anomalies are indicated by hatching. Panels (c), (f), (i), and (l) show the difference in 300 hPa geopotential height anomalies (shading in gpm) between high and low WCB activity.
To provide a more quantitative view on the differences over the North Atlantic and the European region depending on WCB activity, we follow Cassou (2008) and determine the occurrence frequency changes of the four dominant Atlantic–European weather regimes following MJO phases with suppressed and enhanced WCB activity. As already indicated by the composites of geopotential height anomalies and in line with Cassou (2008), MJO phases 2 and 3 are in general followed by an increased occurrence frequency of the NAO+ regime and the Scandinavian blocking regime (Fig. 8a). The occurrence frequency of the Atlantic Ridge and NAO– regime is significantly reduced. This canonical regime response can in general be seen following phases 2 and 3 with pentads of both low and high WCB activity (Fig. 8b and c). However, the timing of the anomalous weather regime occurrence frequency differs with WCB activity: the frequency of NAO+ is significantly enhanced after MJO phase 2 with pentads of low WCB activity but close to climatology after pentads with high WCB activity. Conversely, phase 3 with pentads of low WCB activity is hardly followed by significant occurrence frequency changes in NAO+, but pentads with high WCB activity are characterized by a significant increase in NAO+. A remarkable change in preferred regime occurrence occurs after phase 2: although the occurrence frequency of Scandinavian blocking is close to climatology after phase 2 with pentads of low WCB activity and the canonically expected NAO+ response is the most frequent, Scandinavian blocking is significantly enhanced after MJO pentads with high WCB activity and NAO+ close to climatology. This coincides well with the positive geopotential height anomaly over Scandinavia after phase 2 with high WCB activity (Fig. 7b). Thus modulated WCB activity in the western North Pacific following phase 2 goes along with a marked shift in the regime response over Europe.
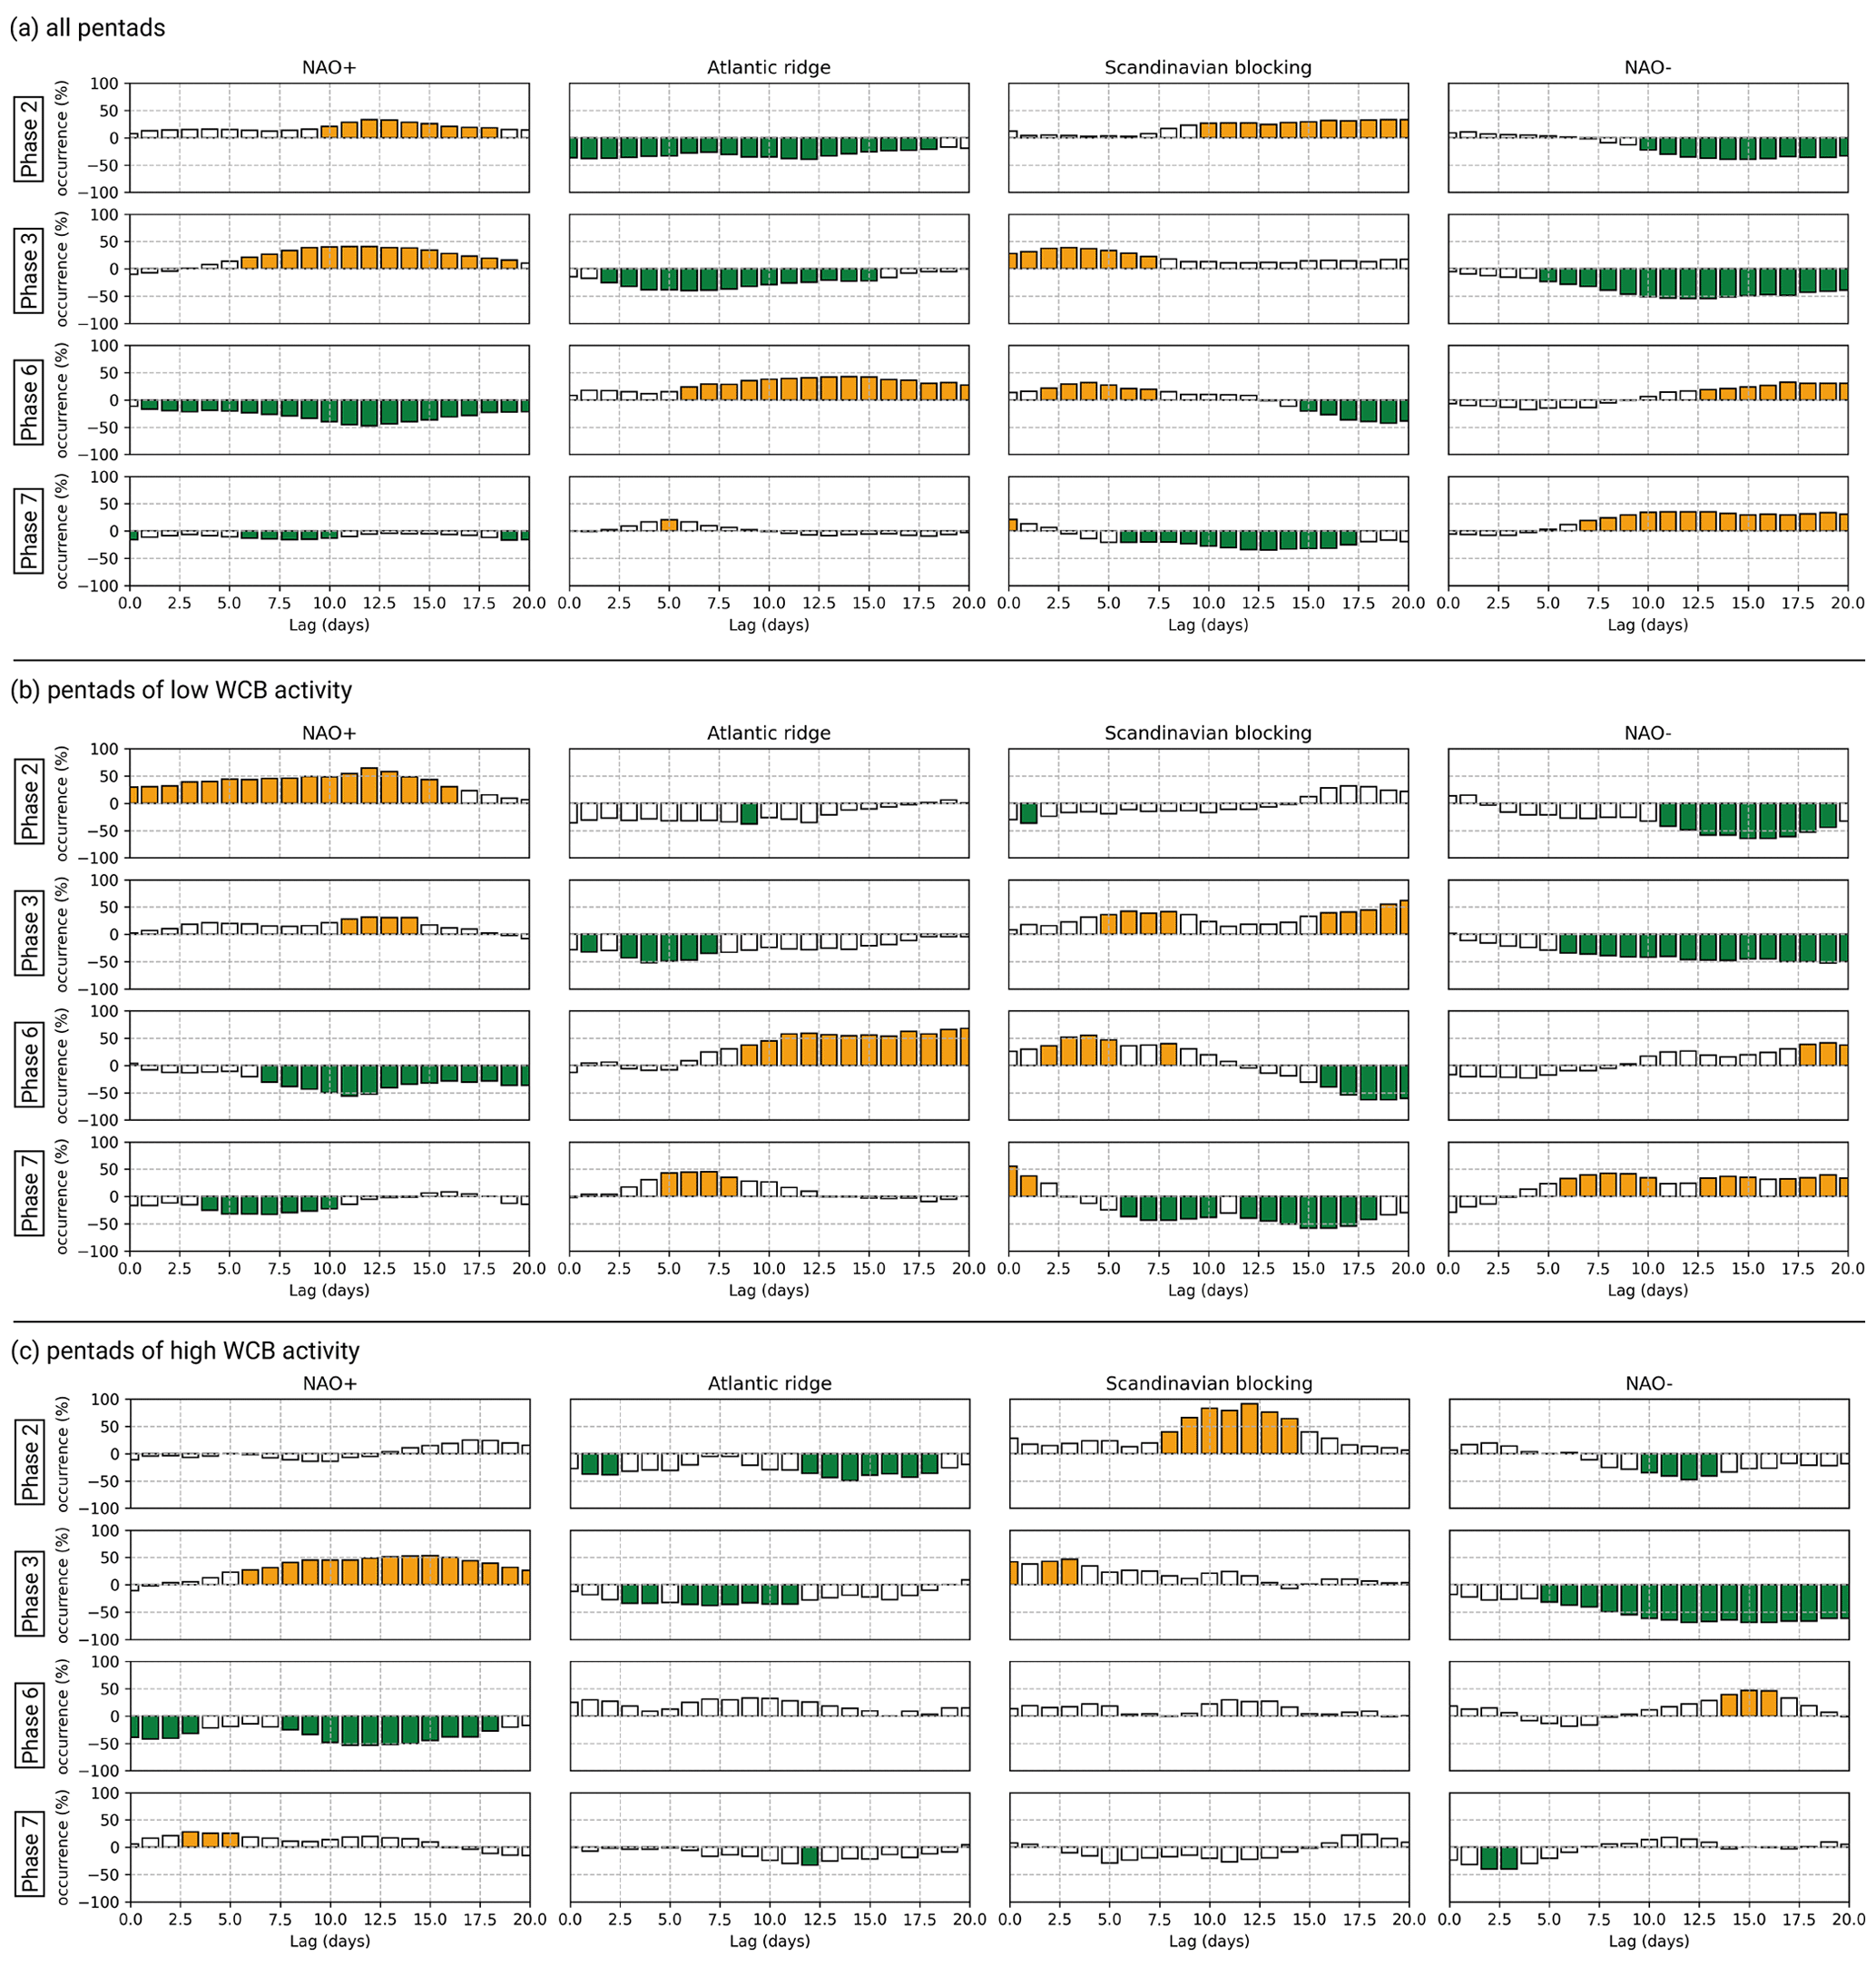
Figure 8Lagged relationship between pentad 0 of MJO phases 2, 3, 6, and 7 and the four North Atlantic–European weather regimes (a) independent of WCB activity, (b) with low WCB activity, and (c) with high WCB activity. For each MJO phase, we plot the anomalous percentage occurrence of a given regime as a function of lag in days (with regimes lagging MJO phases). A value of 100 % means that this regime occurs twice as frequently as its climatological mean. The orange and green bars show where the regimes occur significantly more or less frequently, respectively, than their climatological occurrences.
After MJO phases 6 and 7, whether the well-known canonical teleconnection pattern is established or not depends strongly on the WCB activity over the eastern North Pacific. Pentad 1 after phases 6 and 7 with low WCB activity is characterized by a negative geopotential height anomaly over the central North Pacific (Fig. 7e and g). Although this anomaly coincides with the canonical teleconnection pattern (Fig. 1), the typical ridge building over western North America does not occur in the case of low WCB activity. Instead, the geopotential height is close to the climatological mean. Focusing on phases with high WCB activity, the teleconnection pattern differs markedly (Fig. 7f and h). Both MJO phases 6 and 7 are now associated with a negative geopotential height anomaly over the central Pacific, which is located further south than the negative anomaly during periods with weak WCB inflow activity. Accordingly, the North Pacific jet extends eastward and is shifted southward compared to the climatological mean (not shown). Most importantly, the anomalously high WCB activity is associated with a highly amplified ridge over western North America, which even extends into the high latitudes. The eastern flank of the ridge is followed by a negative geopotential height anomaly over central to eastern North America, indicating downstream development. The observed differences between pentads of low and high WCB activity are not limited to the North Pacific and North America. The canonical relationship to European weather regimes strongly depends on the WCB activity in the considered region because only if this activity is low does the known response establish itself (cf. Fig. 8a and b). This canonical relationship between MJO phases 6 and 7 and European weather regimes weakens considerably when these phases are associated with pentads of high WCB activity (Fig. 8c). Neither the occurrence frequency of the Atlantic Ridge regime nor that of Scandinavian blocking is significantly enhanced following MJO phase 6 with pentads of high activity. The occurrence frequency of NAO– following MJO phase 7 with pentads of high activity is also not significantly enhanced. These results suggest that differences in WCB activity can significantly modify the extratropical teleconnections forced by tropical heating associated with the MJO.
3.5 Modulation of MJO–extratropical teleconnections in an idealized general circulation model
The reanalysis-based investigations indicate a potential modulation of MJO–midlatitude teleconnections depending on the WCB activity. This is likely due to the latent heat being released during WCB ascent, in addition to the tropical forcing imposed by the MJO. To theoretically underpin the statistical findings based on reanalyses, we evaluate experiments performed with the idealized general circulation model. Separate simulations are conducted for MJO phases 2, 3, 6, and 7, with heating rates mimicking the diabatic heating derived from global ERA-Interim precipitation anomalies averaged over pentad 0 (see Sect. 2.8). Due to this averaging, the heating exhibits a longer temporal scale and a smaller amplitude than that associated with actual WCBs. In ERA-Interim, the precipitation anomalies and accordingly the magnitude of the heating clearly differ over the North Pacific with increased (decreased) precipitation after pentads with high (low) WCB activity (Figs. S5–S8). In the following, we focus only on MJO phases 2 and 6, though qualitatively similar results are found for phases 3 and 7.
Overall, the patterns of the geopotential height anomalies qualitatively resemble those found in reanalysis data (cf. Figs. 7 and 9), while the modeled amplitudes are considerably weaker. When applying heating in all areas with positive precipitation anomalies in ERA-Interim (see Sect. 2.8), a high-pressure anomaly occurs over the western to central North Pacific in pentad 1 after phase 2 (Fig. 9a and b). Though the geopotential height anomaly exhibits a similar magnitude over the western North Pacific for pentads with both high and low WCB activity, it is more than 16 m stronger over the central North Pacific when WCB activity is high (Fig. 9c). Further downstream, a negative height anomaly emerges over the central North Atlantic, representing the positive phase of the NAO. In line with reanalyses (Sect. 3.4), this negative geopotential height anomaly occurs independently of the WCB activity but is more pronounced after phases with low WCB activity. Towards pentad 2 after phase 2, a Rossby wave train develops downstream with geopotential height anomalies, which are in phase with those observed in ERA-Interim (not shown). In particular, there is a negative geopotential height anomaly over western North America that resembles the canonical extratropical MJO response found in reanalyses. Since global heating rates were determined separately for the two subsets with low and high WCB activity during pentad 0, heating rates in the tropics for these two subsets are not necessarily identical. To better understand whether some of the differences in Fig. 9c are due to differences in the tropical heating associated with the MJO, we performed additional simulations for the low and high WCB activity subsets driven by tropical heating (i.e., between 20∘ S to 20∘ N) only. During phase 2, the differences between the two subsets with tropical heating only (black contours in Fig. 9c) are in phase with the differences found with the full forcing (shading in Fig. 9c). However, the differences are considerably weaker when forcing is only applied in the tropics. Thus, the differences in WCB activity over the central North Pacific and the resulting differences in heating prominently alter the MJO–extratropical teleconnection patterns.
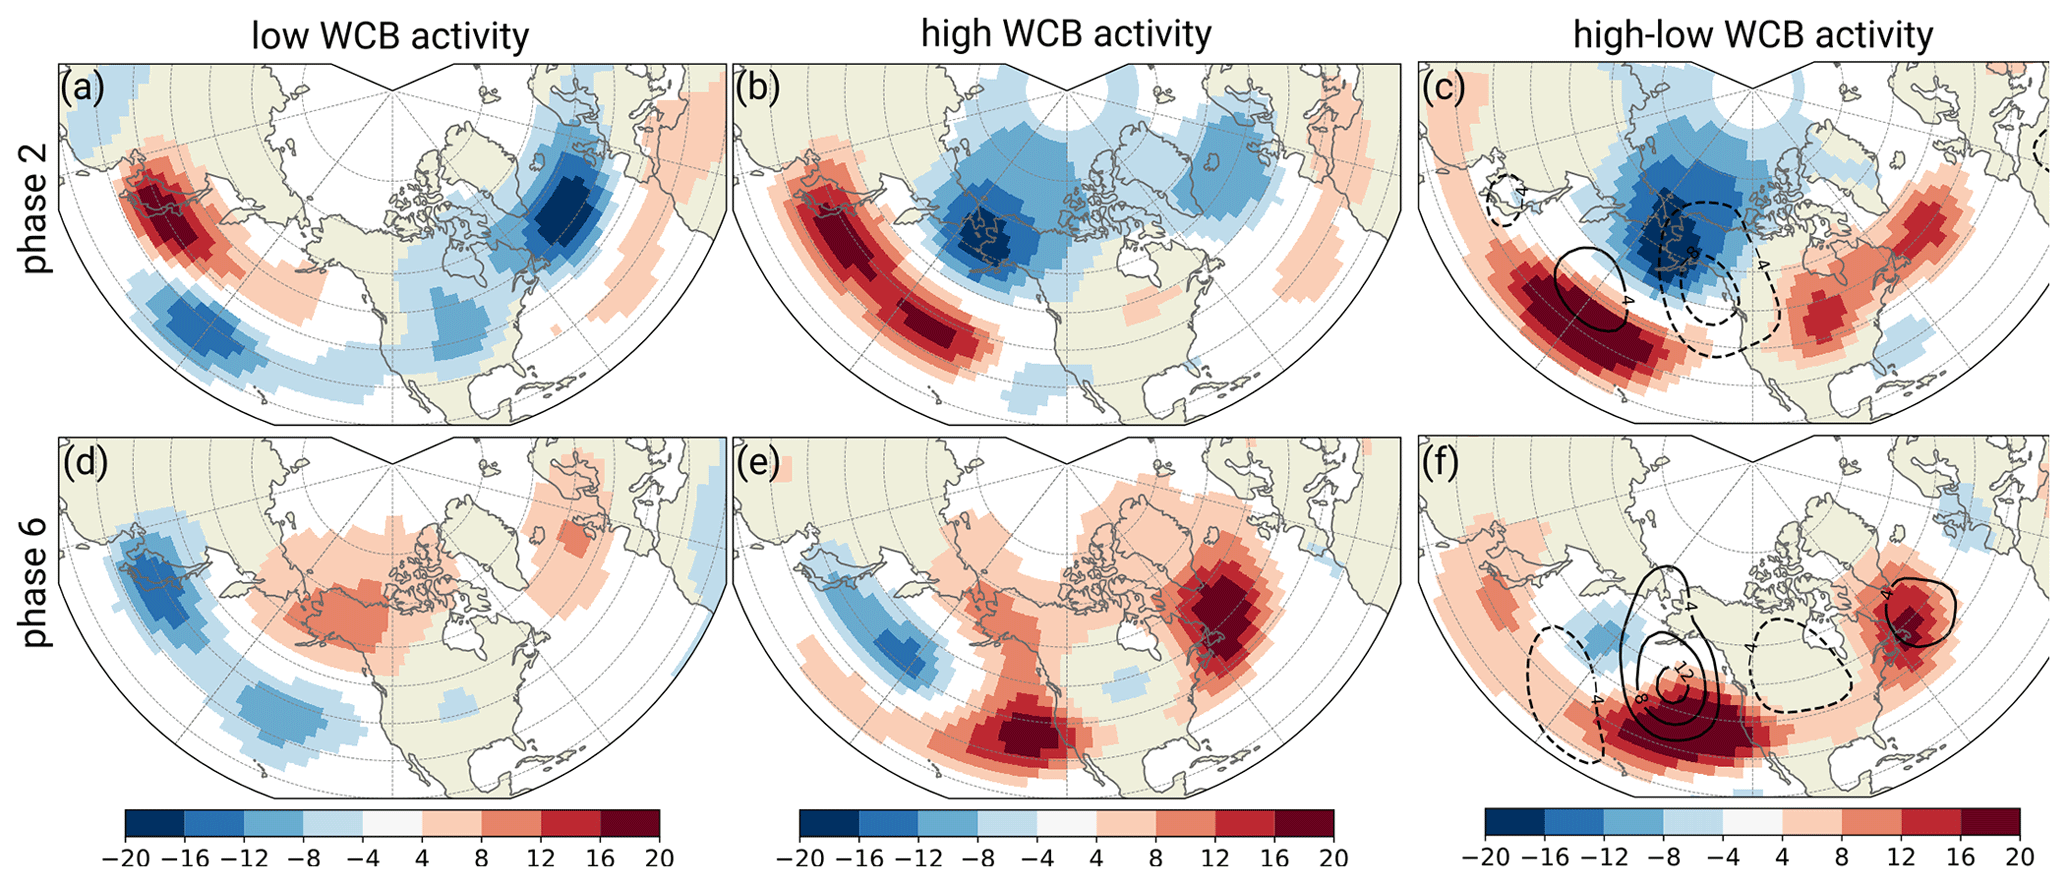
Figure 9Idealized general circulation model 300 hPa geopotential height anomalies (shading in gpm) during pentad 1 of MJO phases 2 and 6 with (a, d) low WCB activity and (b, e) high WCB activity and (c, f) the difference between phases with high and low activity, forced with heating derived from ERA-Interim precipitation anomalies. The black contours in panels (c) and (f) show the difference in 300 hPa geopotential height anomalies (contours in gpm) between high and low activity subsets when forced only with tropical heating.
Focusing on MJO phase 6, a generally similar conclusion can be drawn. With heating from both the tropics and the extratropics, a stronger geopotential height anomaly develops over the eastern North Pacific after days with high WCB activity than after days with low WCB activity (Fig. 9d and e). However, the ensemble mean positive anomaly does not extend as far poleward as in ERA-Interim (see Figs. 7h and 9e). Nevertheless, for individual members of the ensemble experiments, positive geopotential height anomalies are observed over western North America with similar magnitude to that seen in ERA-Interim (not shown). The comparably weak ensemble mean response is most likely due to internal atmospheric variability and the fact that the state of the extratropical flow at the initial time of the idealized experiments is different from the observations. The different state may result from preceding tropical or extratropical heating anomalies, which is not accounted for in this idealized setup. Despite this difference to observations, a pronounced positive geopotential height anomaly develops downstream over the North Atlantic in pentad 1 after phase 6 with high WCB activity. Although located further west than in the observations, the similarity indicates that the positive anomaly evolves in response to the heating of the MJO and WCBs. As for phase 2, we performed additional simulations for the low and high WCB activity subsets driven by tropical heating only. In this case, the observed differences also weaken when forcing is limited to the tropics (black contours in Fig. 9f). In these experiments the northward extension of the ridge over the eastern North Pacific is more pronounced in the subset with days of high WCB activity. Again, we conclude that differences between the two experiments are mostly attributable to differences in WCB activity rather than to differences in the heating imposed by the MJO.
This study analyses the modulation of WCB activity in response to the MJO and the link of WCB activity to tropical–extratropical teleconnection patterns using reanalysis data and experiments with an idealized general circulation model. Coming back to the first research question (In what way is WCB activity modulated by the MJO?), we find a significant modulation of WCB activity over the North Pacific, in particular after MJO phases 2, 3, 6, and 7. When the active MJO is located over the eastern Indian Ocean (phases 2 and 3), WCB inflow and outflow activity is enhanced over the western to central Pacific and suppressed over the eastern Pacific in the following pentad. In contrast, MJO phases 6 and 7 are followed by suppressed WCB activity over the western Pacific and enhanced WCB activity over the eastern Pacific. This modulation of WCB activity in response to the MJO shares similarities with the modulation of atmospheric river frequency, extratropical cyclone frequency, and precipitation anomalies reported in previous studies – which is intuitive given the direct relationship of WCBs with cyclones (Madonna et al., 2014; Binder et al., 2016) and atmospheric rivers (Sodemann et al., 2020) and their relevance for precipitation (Pfahl et al., 2014).
Following MJO phases 2 and 3, the atmospheric river frequency increases significantly over the Bay of Bengal, the western North Pacific, and to the south of Japan (Mundhenk et al., 2016; Zhou et al., 2021). The collocation of regions with increased atmospheric river frequency and regions with increased WCB inflow activity suggests that atmospheric rivers provide moisture to the WCBs, which then ascend poleward over East Asia and the western North Pacific, in agreement with the discussion in Sodemann et al. (2020). In line with the ascending WCBs, moisture flux convergence and precipitation are anomalously high over East Asia during MJO phases 2 and 3 (Arcodia et al., 2020; Jeong et al., 2008), suggesting an overall contribution of WCBs to the anomalous rainfall. By definition, but also dynamically, WCBs are directly linked to the occurrence of extratropical cyclones (Madonna et al., 2014; Binder et al., 2016). This connection is reflected by an increased frequency of extratropical cyclones over the western to central North Pacific when the active convection of the MJO is located over the Indian Ocean (Moore et al., 2010; Guo et al., 2017).
MJO phases 6 and 7 are associated with enhanced atmospheric river frequency over the central to eastern North Pacific (Zhou et al., 2021) and western North America where they significantly intensify precipitation and snow accumulation in California (Guan et al., 2012; Payne and Magnusdottir, 2014). As for MJO phases 2 and 3, the positive atmospheric river frequencies are collocated with anomalous WCB inflow frequencies, which suggests that they supply moisture to the base of the WCB. A dynamically consistent picture involving weather systems of the midlatitudes is completed by an increased extratropical cyclone frequency over the eastern North Pacific following active MJO convection over the western tropical Pacific (Moore et al., 2010; Guo et al., 2017). Our results indicate that the outflow of WCBs deposits low-potential-vorticity air over the eastern North Pacific, which can reinforce blocking anticyclones, potentially contributing to the significantly enhanced blocking frequency over this region after phases 6 and 7 (Henderson et al., 2016). The effect of the MJO on WCB activity over the eastern North Pacific is modulated by the state of ENSO. During La Niña and after MJO phases 6 and 7, WCB activity is even further enhanced in this region. This is in line with findings by Takahashi and Shirooka (2014), Mundhenk et al. (2016), and Schneidereit et al. (2017), who concluded that the large-scale conditions set by La Niña and MJO phase 7 provide a favorable environment for increased extratropical cyclones and atmospheric river frequency over the central to eastern North Pacific.
The intra-phase variability of the MJO modulation of WCB activity is substantial. While the mean modulation of WCB activity by the MJO is significant, there is substantial event-to-event spread in WCB anomalies, with some events exhibiting WCB anomalies that are of the opposite sign to the mean modulation. To address the second central research question (How is the WCB modulation linked to circulation anomalies associated with the MJO?), we systematically distinguish between individual MJO events of the same phase followed by pentads of abnormally low and high WCB activity. With regard to circulation anomalies directly associated with the MJO, subtropical anticyclonic Rossby gyres form over the western Pacific in response to the heating of MJO phases 2 and 3. These induce a poleward moisture transport over the western Pacific seen in previous studies (Zhou et al., 2021). This moisture transport is stronger during events with high WCB activity. Once the moist air masses start to ascend along sloping isentropic surfaces, moist diabatic processes further enhance the ascent of WCBs. WCB activity during phases 6 and 7 appears to depend on the structure of the midlatitude flow over the eastern Pacific. After phases 6 and 7 with high WCB activity, an intense cyclonic anomaly over the eastern Pacific is associated with an eastward extension and equatorward shift of the North Pacific jet. This situation is predisposed to baroclinic cyclone developments and anomalous poleward moisture transport on the eastern flank of the cyclonic anomaly where the highest WCB anomalies are found. After phases 6 and 7 with low WCB activity, the cyclonic anomaly is considerably weaker and displaced poleward.
We also use the same subsets of MJO events with abnormally low and high WCB activity to answer the third central question – how does a potential modulation of WCB activity interact with known teleconnection patterns towards North America and Europe? Previous studies have shown that the diabatically enhanced outflow of WCBs contributes to the amplification of upper-tropospheric ridges (Pomroy and Thorpe, 2000; Pfahl et al., 2015; Steinfeld and Pfahl, 2019). The reason for this amplification is the net transport of lower-tropospheric low-potential-vorticity air into the upper-troposphere as well as irrotational winds that impinge on the upper-tropospheric potential vorticity gradient and thus constitute a Rossby wave source (Grams et al., 2011). In line with these studies, individual MJO events of phases 2 and 3 (6 and 7) with high WCB activity are followed by stronger positive geopotential height anomalies over the central (eastern) North Pacific than those of the same phases with low WCB activity. This clearly indicates that latent heat release associated with WCBs affects the canonical MJO teleconnection pattern. To theoretically underpin this rather statistic-based finding, we conduct experiments with a dry nonlinear baroclinic primitive-equation model forced by global heating, mimicking the diabatic heating derived from ERA-Interim-based precipitation anomalies. Subsets with low WCB activity are characterized by below-normal precipitation anomalies and a weaker heating. Accordingly, subsets with high WCB activity feature a stronger midlatitude heating. The idealized experiments exhibit a stronger positive geopotential height anomaly over the central North Pacific following MJO phase 2 with high WCB activity. Likewise, experiments forced during MJO phase 6 with high WCB activity show a considerably stronger positive geopotential height anomaly over the eastern North Pacific. To corroborate the causal relationship between differences in WCB activity and the different teleconnection patterns and to exclude the possibility that differences in tropical diabatic heating have a decisive influence, we conduct two more experiments but only with heating in the tropics. The differences between these two experiments are small in terms of the teleconnection patterns. This confirms that the different teleconnection patterns found in reanalysis data after periods of high and low WCB activity are indeed due to heating of the WCBs and not due to differences in tropical heating.
Notably, the modulation of MJO-related teleconnection patterns by differences in WCB activity is not limited to the North Pacific. After MJO phase 2, WCB activity in the western North Pacific changes the prevailing regime patterns in the North Atlantic region: after MJO phase 2 with suppressed WCB activity, NAO+ is more likely to occur; however after MJO phase 2 with enhanced WCB activity, Scandinavian blocking is the most likely regime. A striking finding of the present study is that the canonical NAO– response (Cassou, 2008; Lin et al., 2009) establishes preferentially after MJO phases 6 and 7 with low WCB activity. This increased frequency of NAO– is hardly found after phases with anomalously high WCB activity over the eastern North Pacific. This breakdown of the canonical relation between MJO phases 6 and 7 and the negative phase of the NAO is in line with previous studies by Drouard et al. (2015) and Schemm et al. (2018), although they did not establish the link to WCBs. They concluded that an anomalously strong ridge over western North America is associated with a rather equatorward propagation of transient eddies across North America and the North Atlantic, resulting in more anticyclonic wave breaking. Momentum flux convergence associated with the wave breaking tends to push the North Atlantic jet stream poleward, resembling NAO+ rather than NAO– conditions. In the results of this study, there is no clear tendency for either NAO+ or NAO– conditions after MJO phases 6 and 7 with high WCB activity. The inconclusive weather regime response and the breakdown of the canonical relationship indicate that in a statistical sense predictability may be reduced after MJO phases 6 and 7 with high WCB activity.
Given that the MJO modulates the occurrence frequency of WCBs and that they affect MJO–extratropical teleconnection patterns, the question of what this means for predictions on the subseasonal timescale emerges. Therefore, a future study will address the question of how the modulation of WCB activity by the MJO is represented in state-of-the-art subseasonal prediction models and whether a misrepresentation of this modulation might explain the too-weak relation between the MJO and NAO in the majority of these models (Vitart et al., 2017).
ERA-Interim data are freely available at https://doi.org/10.24381/cds.f2f5241d (Dee et al., 2011b). RMM data can be retrieved from http://www.bom.gov.au/climate/mjo/graphics/rmm.74toRealtime.txt (Bureau of Meteorology, 2023), and the ONI is available from https://psl.noaa.gov/data/correlation/oni.data (NOAA/PSL, 2023). The LAGRANTO documentation and information on how to access the source code are provided in Sprenger and Wernli (2015). The deep learning models for WCB identification are provided via the repository at https://doi.org/10.5281/zenodo.5154980 (Quinting and Grams, 2022b).
The supplement related to this article is available online at: https://doi.org/10.5194/wcd-5-65-2024-supplement.
JFQ conducted the analysis of the MJO–WCB linkage based on ERA-Interim. CMG identified the Atlantic–European weather regimes. EKMC performed the simulations with the baroclinic primitive-equation model. All authors jointly discussed and interpreted the results and prepared the paper.
At least one of the (co-)authors is a member of the editorial board of Weather and Climate Dynamics. The peer-review process was guided by an independent editor, and the authors also have no other competing interests to declare.
Publisher’s note: Copernicus Publications remains neutral with regard to jurisdictional claims made in the text, published maps, institutional affiliations, or any other geographical representation in this paper. While Copernicus Publications makes every effort to include appropriate place names, the final responsibility lies with the authors.
The authors acknowledge support by the state of Baden-Württemberg through bwHPC. ECMWF, Deutscher Wetterdienst, and MeteoSwiss are acknowledged for granting access to the ERA-Interim data set. We are thankful to Magdalena Balmaseda, Chris Roberts, and Frédéric Vitart for helpful discussions. The authors gratefully acknowledge the valuable feedback by Sugata Narsey and the one anonymous reviewer.
This research has been supported by the Helmholtz-Gemeinschaft (grant no. VH-NG-1243) and the National Oceanic and Atmospheric Administration (grant no. NA22OAR4310605).
This paper was edited by Juliane Schwendike and reviewed by Sugata Narsey and one anonymous referee.
Arcodia, M. C., Kirtman, B. P., and Siqueira, L. S. P.: How MJO Teleconnections and ENSO Interference Impacts U.S. Precipitation, J. Climate, 33, 4621–4640, https://doi.org/10.1175/JCLI-D-19-0448.1, 2020. a, b
Benedict, J. J., Lee, S., and Feldstein, S. B.: Synoptic View of the North Atlantic Oscillation, J. Atmos. Sci., 61, 121–144, https://doi.org/10.1175/1520-0469(2004)061<0121:SVOTNA>2.0.CO;2, 2004. a
Binder, H., Boettcher, M., Joos, H., and Wernli, H.: The role of warm conveyor belts for the intensification of extratropical cyclones in Northern Hemisphere winter, J. Atmos. Sci., 73, 3997–4020, https://doi.org/10.1175/JAS-D-15-0302.1, 2016. a, b, c, d, e, f
Browning, K. A., Hardman, M. E., Harrold, T. W., and Pardoe, C. W.: The structure of rainbands within a mid‐latitude depression, Q. J. Roy. Meteor. Soc., 99, 215–231, https://doi.org/10.1002/qj.49709942002, 1973. a
Bureau of Meteorology: Madden-Julian Oscillation monitoring, Bureau of Meteorology [data set], http://www.bom.gov.au/climate/mjo/graphics/rmm.74toRealtime.txt (last access: 22 December 2023), 2023. a
Carlson, T. N.: Airflow through midlatitude cyclones and the comma cloud pattern, Mon. Weather Rev., 108, 1498–1509, https://doi.org/10.1175/1520-0493(1980)108<1498:ATMCAT>2.0.CO;2, 1980. a
Cassou, C.: Intraseasonal interaction between the Madden-Julian Oscillation and the North Atlantic Oscillation, Nature, 455, 523–527, https://doi.org/10.1038/nature07286, 2008. a, b, c, d, e, f, g, h
Chang, E. K. M.: An Idealized Nonlinear Model of the Northern Hemisphere Winter Storm Tracks, J. Atmos. Sci., 63, 1818–1839, https://doi.org/10.1175/JAS3726.1, 2006. a, b
Chang, E. K. M.: Diabatic and Orographic Forcing of Northern Winter Stationary Waves and Storm Tracks, J. Climate, 22, 670–688, https://doi.org/10.1175/2008JCLI2403.1, 2009. a, b, c
Dacre, H. F., Martínez-Alvarado, O., and Mbengue, C. O.: Linking Atmospheric Rivers and Warm Conveyor Belt Airflows, J. Hydrometeor., 20, 1183–1196, https://doi.org/10.1175/JHM-D-18-0175.1, 2019. a
Davies, H. C.: The Quasigeostrophic Omega Equation: Reappraisal, Refinements, and Relevance, Mon. Weather Rev., 143, 3–25, https://doi.org/10.1175/MWR-D-14-00098.1, 2015. a
Dee, D. P., Uppala, S. M., Simmons, A. J., Berrisford, P., Poli, P., Kobayashi, S., Andrae, U., Balmaseda, M. A., Balsamo, G., Bauer, P., Bechtold, P., Beljaars, A. C., van de Berg, L., Bidlot, J., Bormann, N., Delsol, C., Dragani, R., Fuentes, M., Geer, A. J., Haimberger, L., Healy, S. B., Hersbach, H., Hólm, E. V., Isaksen, L., Kållberg, P., Köhler, M., Matricardi, M., Mcnally, A. P., Monge-Sanz, B. M., Morcrette, J. J., Park, B. K., Peubey, C., de Rosnay, P., Tavolato, C., Thépaut, J. N., and Vitart, F.: The ERA-Interim reanalysis: Configuration and performance of the data assimilation system, Q. J. Roy. Meteor. Soc., 137, 553–597, https://doi.org/10.1002/qj.828, 2011a. a
Dee, D. P., Uppala, S. M., Simmons, A. J., Berrisford, P., Poli, P., Kobayashi, S., Andrae, U., Balmaseda, M. A., Balsamo, G., Bauer, P., Bechtold, P., Beljaars, A. C. M., van de Berg, L., Bidlot, J., Bormann, N., Delsol, C., Dragani, R., Fuentes, M., Geer, A. J., Haimberger, L., Healy, S. B., Hersbach, H., Hólm, E. V., Isaksen, L., Kållberg, P., Köhler, M., Matricardi, M., McNally, A. P., Monge-Sanz, B. M., Morcrette, J. J., Park, B. K., Peubey, C., de Rosnay, P., Tavolato, C., Thépaut, J. N., and Vitart, F.: ERA-Interim global atmospheric reanalysis, Copernicus Climate Change Service (C3S) Climate Data Store (CDS) [data set], https://doi.org/10.24381/cds.f2f5241d, 2011b. a
Deng, Y. and Jiang, T.: Intraseasonal modulation of the North Pacific storm track by tropical convection in boreal winter, J. Climate, 24, 1122–1137, https://doi.org/10.1175/2010JCLI3676.1, 2011. a, b, c
Domeisen, D. I. V., Grams, C. M., and Papritz, L.: The role of North Atlantic–European weather regimes in the surface impact of sudden stratospheric warming events, Weather Clim. Dynam., 1, 373–388, https://doi.org/10.5194/wcd-1-373-2020, 2020. a
Drouard, M., Rivière, G., and Arbogast, P.: The Link between the North Pacific Climate Variability and the North Atlantic Oscillation via Downstream Propagation of Synoptic Waves, J. Climate, 28, 3957–3976, https://doi.org/10.1175/JCLI-D-14-00552.1, 2015. a
Eckhardt, S., Stohl, A., Wernli, H., James, P., Forster, C., and Spichtinger, N.: A 15-Year Climatology of Warm Conveyor Belts, J. Climate, 17, 218–237, https://doi.org/10.1175/1520-0442(2004)017<0218:AYCOWC>2.0.CO;2, 2004. a, b
Eyring, V., Bony, S., Meehl, G. A., Senior, C. A., Stevens, B., Stouffer, R. J., and Taylor, K. E.: Overview of the Coupled Model Intercomparison Project Phase 6 (CMIP6) experimental design and organization, Geosci. Model Dev., 9, 1937–1958, https://doi.org/10.5194/gmd-9-1937-2016, 2016. a
Fromang, S. and Rivière, G.: The Effect of the Madden–Julian Oscillation on the North Atlantic Oscillation Using Idealized Numerical Experiments, J. Atmos. Sci., 77, 1613–1635, https://doi.org/10.1175/JAS-D-19-0178.1, 2020. a
Gill, A. E.: Some simple solutions for heat-induced tropical circulation, Q. J. Roy. Meteor. Soc., 106, 447–462, https://doi.org/10.1002/qj.49710644905, 1980. a
Grams, C. M., Wernli, H., Böttcher, M., Čampa, J., Corsmeier, U., Jones, S. C., Keller, J. H., Lenz, C. J., and Wiegand, L.: The key role of diabatic processes in modifying the upper-tropospheric wave guide: A North Atlantic case-study, Q. J. Roy. Meteor. Soc., 137, 2174–2193, https://doi.org/10.1002/qj.891, 2011. a, b, c
Grams, C. M., Beerli, R., Pfenninger, S., Staffell, I., and Wernli, H.: Balancing Europe's wind-power output through spatial deployment informed by weather regimes, Nat. Clim. Change, 7, 557–562, https://doi.org/10.1038/nclimate3338, 2017. a, b
Grams, C. M., Magnusson, L., and Madonna, E.: An atmospheric dynamics perspective on the amplification and propagation of forecast error in numerical weather prediction models: A case study, Q. J. Roy. Meteor. Sco., 144, 2577–2591, https://doi.org/10.1002/qj.3353, 2018. a
Guan, B., Waliser, D. E., Molotch, N. P., Fetzer, E. J., and Neiman, P. J.: Does the Madden-Julian oscillation influence wintertime atmospheric rivers and snowpack in the sierra nevada?, Mon. Weather Rev., 140, 325–342, https://doi.org/10.1175/MWR-D-11-00087.1, 2012. a, b
Guo, Y., Shinoda, T., Lin, J., and Chang, E. K.: Variations of Northern Hemisphere storm track and extratropical cyclone activity associated with the Madden-Julian oscillation, J. Climate, 30, 4799–4818, https://doi.org/10.1175/JCLI-D-16-0513.1, 2017. a, b, c, d, e, f, g, h
Harrold, T. W.: Mechanisms influencing the distribution of precipitation within baroclinic disturbances, Q. J. Roy. Meteor. Soc., 99, 232–251, https://doi.org/10.1002/qj.49709942003, 1973. a
Held, I. M. and Suarez, M. J.: A Proposal for the Intercomparison of the Dynamical Cores of Atmospheric General Circulation Models, B. Am. Meteorol. Soc., 75, 1825–1830, https://doi.org/10.1175/1520-0477(1994)075<1825:APFTIO>2.0.CO;2, 1994. a
Henderson, S. A., Maloney, E. D., and Barnes, E. A.: The Influence of the Madden–Julian Oscillation on Northern Hemisphere Winter Blocking, J. Climate, 29, 4597–4616, https://doi.org/10.1175/JCLI-D-15-0502.1, 2016. a, b, c
Hersbach, H., Bell, B., Berrisford, P., Hirahara, S., Horányi, A., Muñoz-Sabater, J., Nicolas, J., Peubey, C., Radu, R., Schepers, D., Simmons, A., Soci, C., Abdalla, S., Abellan, X., Balsamo, G., Bechtold, P., Biavati, G., Bidlot, J., Bonavita, M., De Chiara, G., Dahlgren, P., Dee, D., Diamantakis, M., Dragani, R., Flemming, J., Forbes, R., Fuentes, M., Geer, A., Haimberger, L., Healy, S., Hogan, R. J., Hólm, E., Janisková, M., Keeley, S., Laloyaux, P., Lopez, P., Lupu, C., Radnoti, G., de Rosnay, P., Rozum, I., Vamborg, F., Villaume, S., and Thépaut, J. N.: The ERA5 global reanalysis, Q. J. Roy. Meteor. Soc., 146, 1999–2049, https://doi.org/10.1002/qj.3803, 2020. a
Hoskins, B. J. and Karoly, D. J.: The Steady Linear Response of a Spherical Atmosphere to Thermal and Orographic Forcing, J. Atmos. Sci., 38, 1179–1196, https://doi.org/10.1175/1520-0469(1981)038<1179:TSLROA>2.0.CO;2, 1981. a
Huang, B., Thorne, P. W., Banzon, V. F., Boyer, T., Chepurin, G., Lawrimore, J. H., Menne, M. J., Smith, T. M., Vose, R. S., and Zhang, H.-M.: Extended Reconstructed Sea Surface Temperature, Version 5 (ERSSTv5): Upgrades, Validations, and Intercomparisons, J. Climate, 30, 8179–8205, https://doi.org/10.1175/JCLI-D-16-0836.1, 2017. a
Jeong, J. H., Kim, B. M., Ho, C. H., and Noh, Y. H.: Systematic variation in wintertime precipitation in East Asia by MJO-induced extratropical vertical motion, J. Climate, 21, 788–801, https://doi.org/10.1175/2007JCLI1801.1, 2008. a, b
Jiang, Z., Feldstein, S. B., and Lee, S.: The relationship between the Madden–Julian Oscillation and the North Atlantic Oscillation, Q. J. Roy. Meteor. Soc., 143, 240–250, https://doi.org/10.1002/qj.2917, 2017. a
Kim, B.-M., Lim, G.-H., and Kim, K.-Y.: A new look at the midlatitude–MJO teleconnection in the northern hemisphere winter, Q. J. Roy. Meteor. Soc., 132, 485–503, https://doi.org/10.1256/qj.04.87, 2006. a
Knutson, T. R. and Weickmann, K. M.: 30–60 Day Atmospheric Oscillations: Composite Life Cycles of Convection and Circulation Anomalies, Mon. Weather Rev., 115, 1407–1436, https://doi.org/10.1175/1520-0493(1987)115<1407:DAOCLC>2.0.CO;2, 1987. a, b
Lamberson, W. S., Torn, R. D., Bosart, L. F., and Magnusson, L.: Diagnosis of the source and evolution of medium-range forecast errors for extratropical Cyclone Joachim, Weather Forecast., 31, 1197–1214, https://doi.org/10.1175/WAF-D-16-0026.1, 2016. a
Lee, R. W., Woolnough, S. J., Charlton-Perez, A. J., and Vitart, F.: ENSO Modulation of MJO Teleconnections to the North Atlantic and Europe, Geophys. Res. Lett., 46, 13535–13545, https://doi.org/10.1029/2019GL084683, 2019. a, b
Lee, Y. Y. and Lim, G. H.: Dependency of the North Pacific winter storm tracks on the zonal distribution of MJO convection, J. Geophys. Res.-Atmos., 117, 1–12, https://doi.org/10.1029/2011JD016417, 2012. a
Lin, H., Brunet, G., and Derome, J.: An observed connection between the North Atlantic oscillation and the Madden-Julian oscillation, J. Climate, 22, 364–380, https://doi.org/10.1175/2008JCLI2515.1, 2009. a, b, c, d, e
Madden, R. A. and Julian, P. R.: Detection of a 40–50 Day Oscillation in the Zonal Wind in the Tropical Pacific, J. Atmos. Sci., 28, 702–708, https://doi.org/10.1175/1520-0469(1971)028<0702:DOADOI>2.0.CO;2, 1971. a
Maddison, J. W., Gray, S. L., Martínez-Alvarado, O., and Williams, K. D.: Upstream cyclone influence on the predictability of block onsets over the Euro-Atlantic region, Mon. Weather Rev., 147, 1277–1296, https://doi.org/10.1175/MWR-D-18-0226.1, 2019. a
Madonna, E., Wernli, H., Joos, H., and Martius, O.: Warm conveyor belts in the ERA-Interim Dataset (1979–2010). Part I: Climatology and potential vorticity evolution, J. Climate, 27, 3–26, https://doi.org/10.1175/JCLI-D-12-00720.1, 2014. a, b, c, d, e, f
Martínez-Alvarado, O., Madonna, E., Gray, S. L., and Joos, H.: A route to systematic error in forecasts of Rossby waves, Q. J. Roy. Meteor. Soc., 142, 196–210, https://doi.org/10.1002/qj.2645, 2016. a
Matsuno, T.: Quasi-Geostrophic Motions in the Equatorial Area, J. Meteor. Soc. Jpn. Ser. II, 44, 25–43, https://doi.org/10.2151/jmsj1965.44.1_25, 1966. a
McTaggart-Cowan, R., Gyakum, J. R., and Moore, R. W.: The Baroclinic Moisture Flux, Mon. Weather Rev., 145, 25–47, https://doi.org/10.1175/MWR-D-16-0153.1, 2017. a
Michel, C. and Rivière, G.: The Link between Rossby Wave Breakings and Weather Regime Transitions, J. Atmos. Sci., 68, 1730–1748, https://doi.org/10.1175/2011JAS3635.1, 2011. a, b
Moon, J.-Y., Wang, B., and Ha, K.-J.: ENSO regulation of MJO teleconnection, Clim. Dynam., 37, 1133–1149, https://doi.org/10.1007/s00382-010-0902-3, 2011. a
Moore, R. W., Martius, O., and Spengler, T.: The Modulation of the Subtropical and Extratropical Atmosphere in the Pacific Basin in Response to the Madden–Julian Oscillation, Mon. Weather Rev., 138, 2761–2779, https://doi.org/10.1175/2010MWR3194.1, 2010. a, b, c, d, e, f, g
Mundhenk, B. D., Barnes, E. A., and Maloney, E. D.: All-season climatology and variability of atmospheric river frequencies over the North Pacific, J. Climate, 29, 4885–4903, https://doi.org/10.1175/JCLI-D-15-0655.1, 2016. a, b, c
NOAA/PSL: Ocean Nino Index, ascii text (1950–present), based on ERSSTv5, NOAA [data set], https://psl.noaa.gov/data/correlation/oni.data (last access: 22 December 2023), 2023. a
Payne, A. E. and Magnusdottir, G.: Dynamics of landfalling atmospheric rivers over the North Pacific in 30 years of MERRA reanalysis, J. Climate, 27, 7133–7150, https://doi.org/10.1175/JCLI-D-14-00034.1, 2014. a
Pfahl, S., Madonna, E., Boettcher, M., Joos, H., and Wernli, H.: Warm conveyor belts in the ERA-Interim Dataset (1979–2010). Part II: Moisture origin and relevance for precipitation, J. Climate, 27, 27–40, https://doi.org/10.1175/JCLI-D-13-00223.1, 2014. a, b
Pfahl, S., Schwierz, C., Croci-Maspoli, M., Grams, C. M., and Wernli, H.: Importance of latent heat release in ascending air streams for atmospheric blocking, Nat. Geosci., 8, 610–614, https://doi.org/10.1038/ngeo2487, 2015. a, b
Pickl, M., Quinting, J. F., and Grams, C. M.: Warm conveyor belts as amplifiers of forecast uncertainty, Q. J. Roy. Meteor. Soc., 149, 3064–3085, https://doi.org/10.1002/qj.4546, 2023. a
Pinto, J. G., Zacharias, S., Fink, A. H., Leckebusch, G. C., and Ulbrich, U.: Factors contributing to the development of extreme North Atlantic cyclones and their relationship with the NAO, Clim. Dynam., 32, 711–737, https://doi.org/10.1007/s00382-008-0396-4, 2009. a, b
Pomroy, H. R. and Thorpe, A. J.: The evolution and dynamical role of reduced upper-tropospheric potential vorticity in intensive observing period one of FASTEX, Mon. Weather Rev., 128, 1817–1834, https://doi.org/10.1175/1520-0493(2000)128<1817:TEADRO>2.0.CO;2, 2000. a, b, c
Quinting, J. F. and Grams, C. M.: Toward a Systematic Evaluation of Warm Conveyor Belts in Numerical Weather Prediction and Climate Models. Part I: Predictor Selection and Logistic Regression Model, J. Atmos. Sci., 78, 1465–1485, https://doi.org/10.1175/JAS-D-20-0139.1, 2021a. a, b
Quinting, J. F. and Grams, C. M.: EuLerian Identification of ascending AirStreams (ELIAS 2.0) in Numerical Weather Prediction and Climate Models, Zenodo [code], https://doi.org/10.5281/zenodo.5154980, 2021b. a
Quinting, J. F. and Grams, C. M.: EuLerian Identification of ascending AirStreams (ELIAS 2.0) in numerical weather prediction and climate models – Part 1: Development of deep learning model, Geosci. Model Dev., 15, 715–730, https://doi.org/10.5194/gmd-15-715-2022, 2022. a, b, c, d, e
Ronneberger, O., Fischer, P., and Brox, T.: U-net: Convolutional networks for biomedical image segmentation, Lecture Notes in Computer Science (including subseries Lecture Notes in Artificial Intelligence and Lecture Notes in Bioinformatics), Springer, 9351, 234–241, https://doi.org/10.1007/978-3-319-24574-4_28, 2015. a
Röthlisberger, M., Martius, O., and Wernli, H.: Northern Hemisphere Rossby Wave initiation events on the extratropical jet-A climatological analysis, J. Climate, 31, 743–760, https://doi.org/10.1175/JCLI-D-17-0346.1, 2018. a
Schäfler, A., Boettcher, M., Grams, C. M., Rautenhaus, M., Sodemann, H., and Wernli, H.: Planning aircraft measurements within a warm conveyor belt, Weather, 69, 161–166, https://doi.org/10.1002/wea.2245, 2014. a
Schemm, S., Rivière, G., Ciasto, L. M., and Li, C.: Extratropical Cyclogenesis Changes in Connection with Tropospheric ENSO Teleconnections to the North Atlantic: Role of Stationary and Transient Waves, J. Atmos. Sci., 75, 3943–3964, https://doi.org/10.1175/JAS-D-17-0340.1, 2018. a
Schneidereit, A., Peters, D. H. W., Grams, C. M., Quinting, J. F., Keller, J. H., Wolf, G., Teubler, F., Riemer, M., and Martius, O.: Enhanced Tropospheric Wave Forcing of Two Anticyclones in the Prephase of the January 2009 Major Stratospheric Sudden Warming Event, Mon. Weather Rev., 145, 1797–1815, https://doi.org/10.1175/MWR-D-16-0242.1, 2017. a
Serreze, M. C., Carse, F., Barry, R. G., and Rogers, J. C.: Icelandic low cyclone activity: Climatological features, linkages with the NAO, and relationships with recent changes in the Northern Hemisphere circulation, J. Climate, 10, 453–464, https://doi.org/10.1175/1520-0442(1997)010<0453:ILCACF>2.0.CO;2, 1997. a
Simmons, A. J., Wallace, J. M., and Branstator, G. W.: Barotropic Wave Propagation and Instability, and Atmospheric Teleconnection Patterns, J. Atmos. Sci., 40, 1363–1392, https://doi.org/10.1175/1520-0469(1983)040<1363:BWPAIA>2.0.CO;2, 1983. a
Sodemann, H., Wernli, H., Knippertz, P., Cordeira, J. M., Dominguez, F., Guan, B., Hu, H., Ralph, F. M., and Stohl, A.: Structure, process, and mechanism, in: Atmospheric Rivers, edited by: Ralph, F. M., Dettinger, M. D., Rutz, J. J., and Waliser, D. E., Springer, Cham, 15–44, https://doi.org/10.1007/978-3-030-28906-5_2, 2020. a, b, c
Sprenger, M. and Wernli, H.: The LAGRANTO Lagrangian analysis tool – version 2.0, Geosci. Model Dev., 8, 2569–2586, https://doi.org/10.5194/gmd-8-2569-2015, 2015. a, b
Sprenger, M., Fragkoulidis, G., Binder, H., Croci-Maspoli, M., Graf, P., Grams, C. M., Knippertz, P., Madonna, E., Schemm, S., Škerlak, B., and Wernli, H.: Global climatologies of Eulerian and Lagrangian flow features based on ERA-Interim, B. Am. Meteorol. Soc., 98, 1739–1748, https://doi.org/10.1175/BAMS-D-15-00299.1, 2017. a, b
Stan, C., Straus, D. M., Frederiksen, J. S., Lin, H., Maloney, E. D., and Schumacher, C.: Review of Tropical-Extratropical Teleconnections on Intraseasonal Time Scales, Rev. Geophys., 55, 902–937, https://doi.org/10.1002/2016RG000538, 2017. a
Steinfeld, D. and Pfahl, S.: The role of latent heating in atmospheric blocking dynamics: a global climatology, Clim. Dynam., 53, 6159–6180, https://doi.org/10.1007/s00382-019-04919-6, 2019. a, b
Takahashi, C. and Shirooka, R.: Storm track activity over the North Pacific associated with the Madden-Julian Oscillation under ENSO conditions during boreal winter, J. Geophys. Res., 119, 10663–10683, https://doi.org/10.1002/2014JD021973, 2014. a, b, c, d, e
Tseng, K.-C., Maloney, E., and Barnes, E.: The Consistency of MJO Teleconnection Patterns: An Explanation Using Linear Rossby Wave Theory, J. Climate, 32, 531–548, https://doi.org/10.1175/JCLI-D-18-0211.1, 2019. a, b
Vautard, R.: Multiple Weather Regimes over the North Atlantic: Analysis of Precursors and Successors, Mon. Weather Rev., 118, 2056–2081, https://doi.org/10.1175/1520-0493(1990)118<2056:MWROTN>2.0.CO;2, 1990. a
Vitart, F., Ardilouze, C., Bonet, A., Brookshaw, A., Chen, M., Codorean, C., Déqué, M., Ferranti, L., Fucile, E., Fuentes, M., Hendon, H., Hodgson, J., Kang, H. S., Kumar, A., Lin, H., Liu, G., Liu, X., Malguzzi, P., Mallas, I., Manoussakis, M., Mastrangelo, D., MacLachlan, C., McLean, P., Minami, A., Mladek, R., Nakazawa, T., Najm, S., Nie, Y., Rixen, M., Robertson, A. W., Ruti, P., Sun, C., Takaya, Y., Tolstykh, M., Venuti, F., Waliser, D., Woolnough, S., Wu, T., Won, D. J., Xiao, H., Zaripov, R., and Zhang, L.: The subseasonal to seasonal (S2S) prediction project database, B. Am. Meteorol. Soc., 98, 163–173, https://doi.org/10.1175/BAMS-D-16-0017.1, 2017. a, b, c, d, e
Wallace, J. M. and Gutzler, D. S.: Teleconnections in the Geopotential Height Field during the Northern Hemisphere Winter, Mon. Weather Rev., 109, 784–812, https://doi.org/10.1175/1520-0493(1981)109<0784:TITGHF>2.0.CO;2, 1981. a
Wang, J., Kim, H.-M., Chang, E. K. M., and Son, S.-W.: Modulation of the MJO and North Pacific Storm Track Relationship by the QBO, J. Geophys. Res.-Atmos., 123, 3976–3992, https://doi.org/10.1029/2017JD027977, 2018. a
Wernli, H. and Davies, H. C.: A Lagrangian-based analysis of extratropical cyclones. I: The method and some applications, Q. J. Roy. Meteor. Soc., 123, 467–489, https://doi.org/10.1256/smsqj.53810, 1997. a, b, c, d
Wernli, H. and Schwierz, C.: Surface cyclones in the ERA-40 dataset (1958-2001). Part I: Novel identification method and global climatology, J. Atmos. Sci., 63, 2486–2507, https://doi.org/10.1175/JAS3766.1, 2006. a
Wheeler, M. C. and Hendon, H. H.: An All-Season Real-Time Multivariate MJO Index: Development of an Index for Monitoring and Prediction, Mon. Weather Rev., 132, 1917–1932, https://doi.org/10.1175/1520-0493(2004)132<1917:AARMMI>2.0.CO;2, 2004. a, b
Zhang, C.: Madden–Julian Oscillation, Rev. Geophys., 43, RG2003, https://doi.org/10.1029/2004RG000158, 2005. a
Zheng, C. and Chang, E. K.: The Role of MJO Propagation, Lifetime, and Intensity on Modulating the Temporal Evolution of the MJO Extratropical Response, J. Geophys. Res.-Atmos., 124, 5352–5378, https://doi.org/10.1029/2019JD030258, 2019. a, b
Zhou, Y., Kim, H., and Waliser, D. E.: Atmospheric River Lifecycle Responses to the Madden-Julian Oscillation, Geophys. Res. Lett., 48, 1–10, https://doi.org/10.1029/2020GL090983, 2021. a, b, c, d, e, f
It should be noted that the regions of high horizontal vapor transport are not necessarily atmospheric rivers: only 13 % of all WCBs occur at the same location and time as atmospheric rivers (Sodemann et al., 2020).