the Creative Commons Attribution 4.0 License.
the Creative Commons Attribution 4.0 License.
 | 29 Oct 2025
Escalating typhoon risks in Shanghai amid shifting tracks driven by urbanization and sea surface temperature warming
Shuguang Liu
Zhengzheng Zhou
Nadav Peleg
Tropical cyclones (TC) in the western North Pacific, known as typhoons, cause significant socioeconomic damage in East and Southeast Asian countries. The city of Shanghai in China is highly vulnerable to TC damages. For example, Typhoons Bebinca and Pulasan recently (September 2024) struck the city, resulting in widespread flooding, power outages, and the evacuation of more than half a million residents, while also breaking local rainfall records. Despite these threats, there is limited knowledge about the variability and mechanisms of TC activities in this region under climate change and urbanization. Here, we use the Weather Research and Forecasting (WRF) convection-permitting model to simulate five TC events that made landfall along the southeastern coast of China and severely impacted Shanghai between 2018 and 2022. Different scenarios are conducted, including considering a future expansion of Shanghai's urban area and increases in sea surface temperature (SST) by 1, 2, and 3 °C. The results indicate that while SST warming significantly shifts TC tracks away from the city, the local risk continues to increase due to substantial enhancement of rainfall intensity and wind velocity. Warmer SST increases air temperature and decreases sea level pressure, thereby facilitating the formation and development of TC sizes and intensities. Furthermore, we find a consistent southward shift of the TC tracks that can be linked to the Fujiwhara effect, a phenomenon that occurs when two typhoons interact, causing a mutual counterclockwise rotation. Compared to SST changes, urbanization has a limited influence on TC tracks and structures. The increase in surface roughness due to urban expansion reduces wind velocity but enhances the rainfall intensity within Shanghai, further exacerbating local risk. These findings could improve our understanding of typhoon variability under the combined effects of urbanization and climate change, as well as the risks they pose to Shanghai and other megacities in TC-prone regions.
- Article
(8127 KB) - Full-text XML
-
Supplement
(9715 KB) - BibTeX
- EndNote


Tropical cyclones (TC) are accompanied by heavy precipitation, strong winds, and storm surge. They are one of the most devastating natural disasters in the world, which can result in widespread pluvial, fluvial, and coastal flooding (Peduzzi et al., 2012; Rappaport, 2000; Qin et al., 2024; Geiger et al., 2024). China is highly vulnerable to TC hazards, also known as typhoons; in fact, the western North Pacific (WNP) region accounts for almost one-third of the world's annual TC (Huang et al., 2022) and is characterized by the highest occurrences of TC landfall in the world (Fudeyasu and Wang, 2011). From 1979 to 2018, a total of 303 typhoons were generated in WNP and made landfall in China (Li et al., 2022). On average, China is affected by 7–8 TCs yr−1 (Li et al., 2022), with about USD 9.1 billion of direct economic losses annually (Qin et al., 2024). Typhoons in China predominantly occur between June and October, peaking from July to September, aligning with the East Asian monsoon season, when elevated sea surface temperatures in the Western Pacific Ocean drive TC development (Chang et al., 2012; Zhao et al., 2024). Over recent decades, the population of China has been rapidly moving to coastal cities compounded by fast urban expansion, and this trend is predicted to continue (Qin et al., 2024). Hence, the escalating risk in these coastal cities from typhoon-induced hazards demands urgent attention.
Shanghai is the largest city on the southeast coast of China, with a population exceeding 24 million. On average, Shanghai experiences about two to three typhoons per year (Shi and Cui, 2012). Although it is relatively uncommon for TC to pass directly over the city (Fogarty et al., 2006), Shanghai still encounters substantial costs when TC directly strikes or indirectly threatens. For example, typhoon Chan-Hom in 2015 made landfall in Shanghai with wind speeds exceeding 160 km h−1, causing the evacuation of over 850 000 people as a precaution, with damage costs estimated at around USD 1.5 billion (Liang et al., 2016). Recently, in September 2024, Shanghai was directly impacted by two typhoons within 4 d. These typhoons, Bebinca and Pulasan, with the former being the strongest landfall typhoon in Shanghai since 1949, caused severe flooding, extensive power outages, and the evacuation of over 500 000 residents (Hall and Woo, 2024; The Straits Times, 2024). Notably, typhoon Pulasan broke local rainfall records, with some meteorological stations in Shanghai receiving up to 300 mm of rain within 6 h (Xinhua News, 2024). Shanghai has experienced rapid growth in both urban areas and population over the last 30 years, nearly doubling its population since the 1990s and expanding its urban footprint significantly due to extensive economic development and urbanization (from 11 to 25 million during 1978–2022, Shanghai Statistics Bureau, 2022). As the city is expected to expand further, the risk of exposure to TC damages is likely to increase.
Although there is not much evidence that supports an increasing trend in global TC occurrences in recent decades (Knutson et al., 2021), there are some indications that climate warming is contributing to TC intensification, with a greater likelihood in severe (i.e., category 3-5) TC events (Kossin et al., 2020). Guzman and Jiang (2022) reported a 21 % increased TC rainfall in the Northern Hemisphere from 1998 to 2016, and Pérez-Alarcón et al. (2023) projected a further increase of 9.5 %–17 % in TC rainfall by 2071–2100 following the future Shared Socioeconomic Pathways (SSPs) SSP2-4.5 and SSP5-8.5 climate scenarios. Moreover, Tran et al. (2024) stressed an amplified rainfall increase in the TC inner core under the SSP2-4.5 and SSP3-7.0 scenarios.
Sea surface temperature (SST) is one of the most important predictors that affect TC activities in response to global climate change (Knutson et al., 2013; Stansfield and Reed, 2023). A high SST of 26 °C is considered the global threshold for TC formation (Defforge and Merlis, 2017). SST has been reported to correlate strongly with TC intensification: Holland (1997) showed that large sensible and latent heat fluxes caused by high SST contribute to the generation and intensification of TC; Tao and Zhang (2014) found that higher SST and moisture allow TC to form faster and resist stronger shear; Kanada et al. (2017) revealed that high SST facilitates deep and intense updrafts inside the radius of maximum wind speed, leading to storm intensification; and Lin et al. (2015) showed that TC rainfall area is controlled by its environmental SST relative to the tropical mean SST (so-called relative SST), while rainfall rate increases with absolute SST. SST in most oceans and seas is experiencing pronounced changes due to global warming (Tang et al., 2020). According to the IPCC Sixth Assessment Report (IPCC, 2023), global mean SST increased by 0.88 °C from 1850–1900 to 2011–2020, with 0.6 °C of this increase occurring between 1980 and 2020. The SST in the East China Sea has increased rapidly since the 1970s, rising at five times the global mean SST during the warming acceleration period (Tan et al., 2016). Understanding how continued warming SST impacts TC is essential for future hazard projections.
Urban expansion is another key fact that has had a significant influence on rainfall patterns (Torelló-Sentelles et al., 2024, 2025; Zhuang et al., 2024b). Based on a meta-analysis of 85 studies, Liu and Niyogi (2019) summarized that cities act to increase rainfall amounts by 11 %–22 % in comparison with their surroundings. The mechanisms through which urban areas impact rainfall include: (i) the urban heat island (UHI) effect, which increases moisture convergence and convection (Shem and Shepherd, 2009; Shepherd et al., 2010); (ii) urban surface roughness, which facilitates atmospheric convergence (Niu et al., 2011); and (iii) aerosol concentrations that operate as cloud condensation nuclei (Van den Heever and Cotton, 2007). However, most of these mechanisms have been studied based on non-TC rainfall. Focusing on TC rainfall, Wu et al. (2024) found that the urbanization process enhances rainfall rates after the TC landfall, while Ao et al. (2022) reported that urban-enhanced dynamics are not enough to intensify the TC rainfall. These contradicting findings point out that our understanding of urbanization's impacts on TC activities is still limited.
To address the above-mentioned gaps in projecting future typhoon patterns, we use a convection-permitting model to investigate how TC events change under different SST warming scenarios over the southeast coast of China and urbanization scenarios in Shanghai. Here we are not questioning how the frequency of TC will change in this region but rather how future increases in SST and further expansion of the city will affect typhoon strength (i.e., rainfall intensity and near-surface wind velocities) and trajectories, and how this will impact the risk exposure in Shanghai. Furthermore, we will also discuss the contribution and underlying mechanisms of urban expansion, the effects of SST on TCs, and the implications for coastal cities beyond Shanghai.
As mentioned above, Shanghai is the largest metropolis on the southeastern coast of China and is highly exposed to typhoon risks (Wang et al., 2018; Yin et al., 2021). With the compounding effects of rapid urbanization and ongoing climate change, there is a considerable increase in Shanghai's risk of exposure to typhoon-related hazards. Here we only consider the main city area of Shanghai as the study area (marked in Fig. 1), excluding Chongming Island and other small islands nearby.
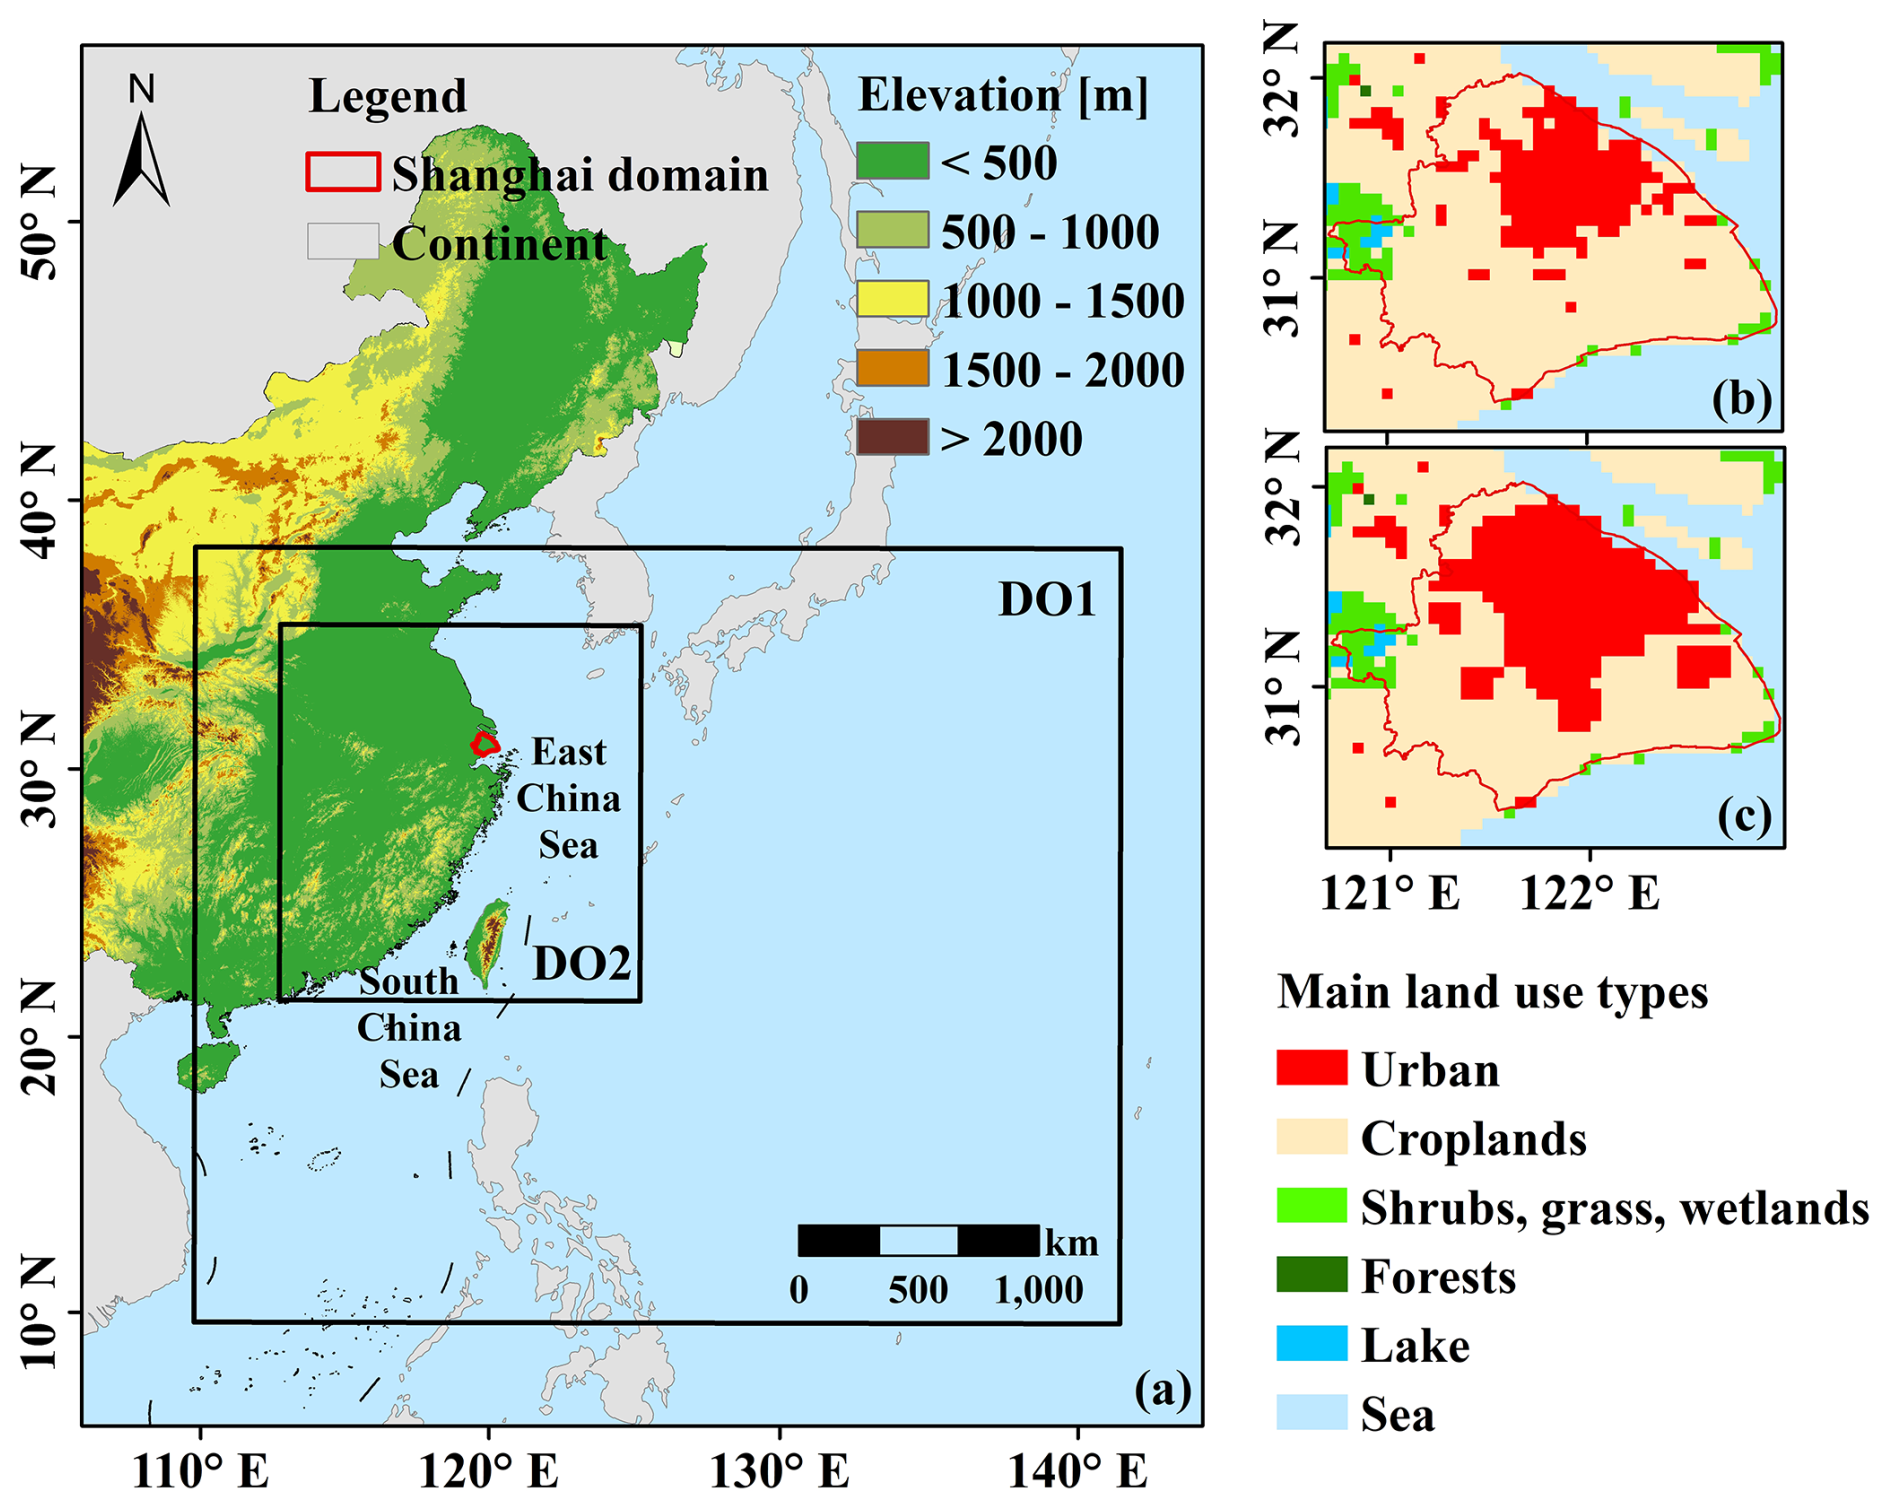
Figure 1(a) Map of the two nested WRF simulation domains (DO1 and DO2). Main Land use and land cover within Shanghai domain for the (b) present urban and (c) future urban scenarios.
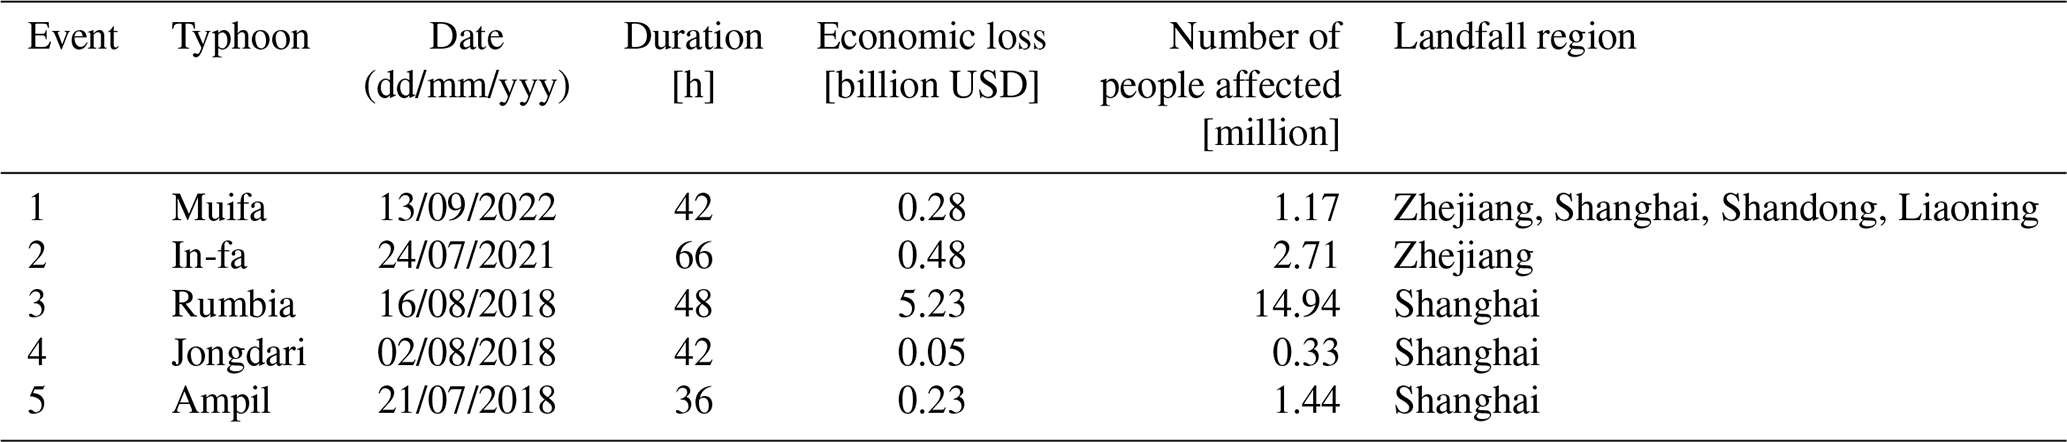
Among the TCs affecting Shanghai, particularly those that make landfall in the city in recent years, five were selected for in-depth analysis, summarized in Table 1. These typhoons are chosen based on the following criteria: (i) their landfalls directly impact Shanghai or have a noticeable effect on the city; (ii) their occurrences are during the main TC season (July to September); and (iii) their tracks generally move northwestward, which is the prevailing trajectory for TCs that make landfall in southeastern China (Shan and Yu, 2021). Since 1990, only seven typhoons (including Fung-Wong in 2014, Bebinca in 2024, and Co-may in 2025, in addition to those listed in Table 1) have made landfall in Shanghai. After applying the above selection criteria, the cases selected here provide an effective representation of all major typhoon landfalls affecting the city.
Observed TC data provided at 3 h intervals, including the TC center location, minimum sea level pressure (SLPmin [hPa]), and maximum 10 m wind speed ( [m s−1]), are obtained from the China Meteorological Administration Tropical Cyclone Database (Ying et al., 2014; Lu et al., 2021). In the following section, we describe the data that is required for the model setting.
3.1 Model set up and experimental design
We use the convection-permitting Weather Research and Forecasting model (WRF, Skamarock et al., 2021) to simulate TCs at 3 km and 1 h resolutions. The model initial and boundary conditions are provided by the National Centers for Global Forecast System product (GFS, DOC/NOAA/NWS/NCEP, 2015), with a horizontal and temporal resolution of 0.25° and 6 h, respectively. The Moderate Resolution Imaging Spectroradiometer (MODIS) land cover product at 15 s spatial resolution (Broxton et al., 2014) defines the land use and cover. Daily SST data are obtained from the Group for High Resolution Sea Surface Temperature (GHRSST) global Level 4 dataset, with a resolution of 0.25° (NOAA National Centers for Environmental Information, 2020) and are updated during the WRF simulations.
Two domains of WRF (one-way nesting) are shown in Fig. 1: DO1 with a spatial resolution of 9 km (430 × 362 horizontal grids) and DO2 with 3 km (526 × 535). The inner domain covers southern and southeastern China and part of the WNP region (East- and South China Sea). Vertically, the domains stretch up to 50 hPa, comprising 45 layers and using hybrid (sigma-pressure) grids. The WRF Single-Moment 6-Class (WSM6) graupel scheme (Hong and Lim, 2006), Yonsei University (YSU) scheme (Hong et al., 2004), and Old Fifth-Generation Penn State/NCAR Mesoscale Model (MM5) scheme (Grell et al., 1994) are used to account for radiation, microphysics, planetary boundary layer, and surface layer processes, respectively. The Kain-Fritsch (new Eta) convection parameterization scheme is only applied to domain DO1. Details of the physical parameterization schemes are given in Table 2. The first 18 h of simulation are used as a spin-up and are not considered in the following analysis.
(Hong and Lim, 2006)(Mlawer et al., 1997)(Kain, 2004)(Niu et al., 2011)(Martilli et al., 2002)(Hong et al., 2004)(Grell et al., 1994)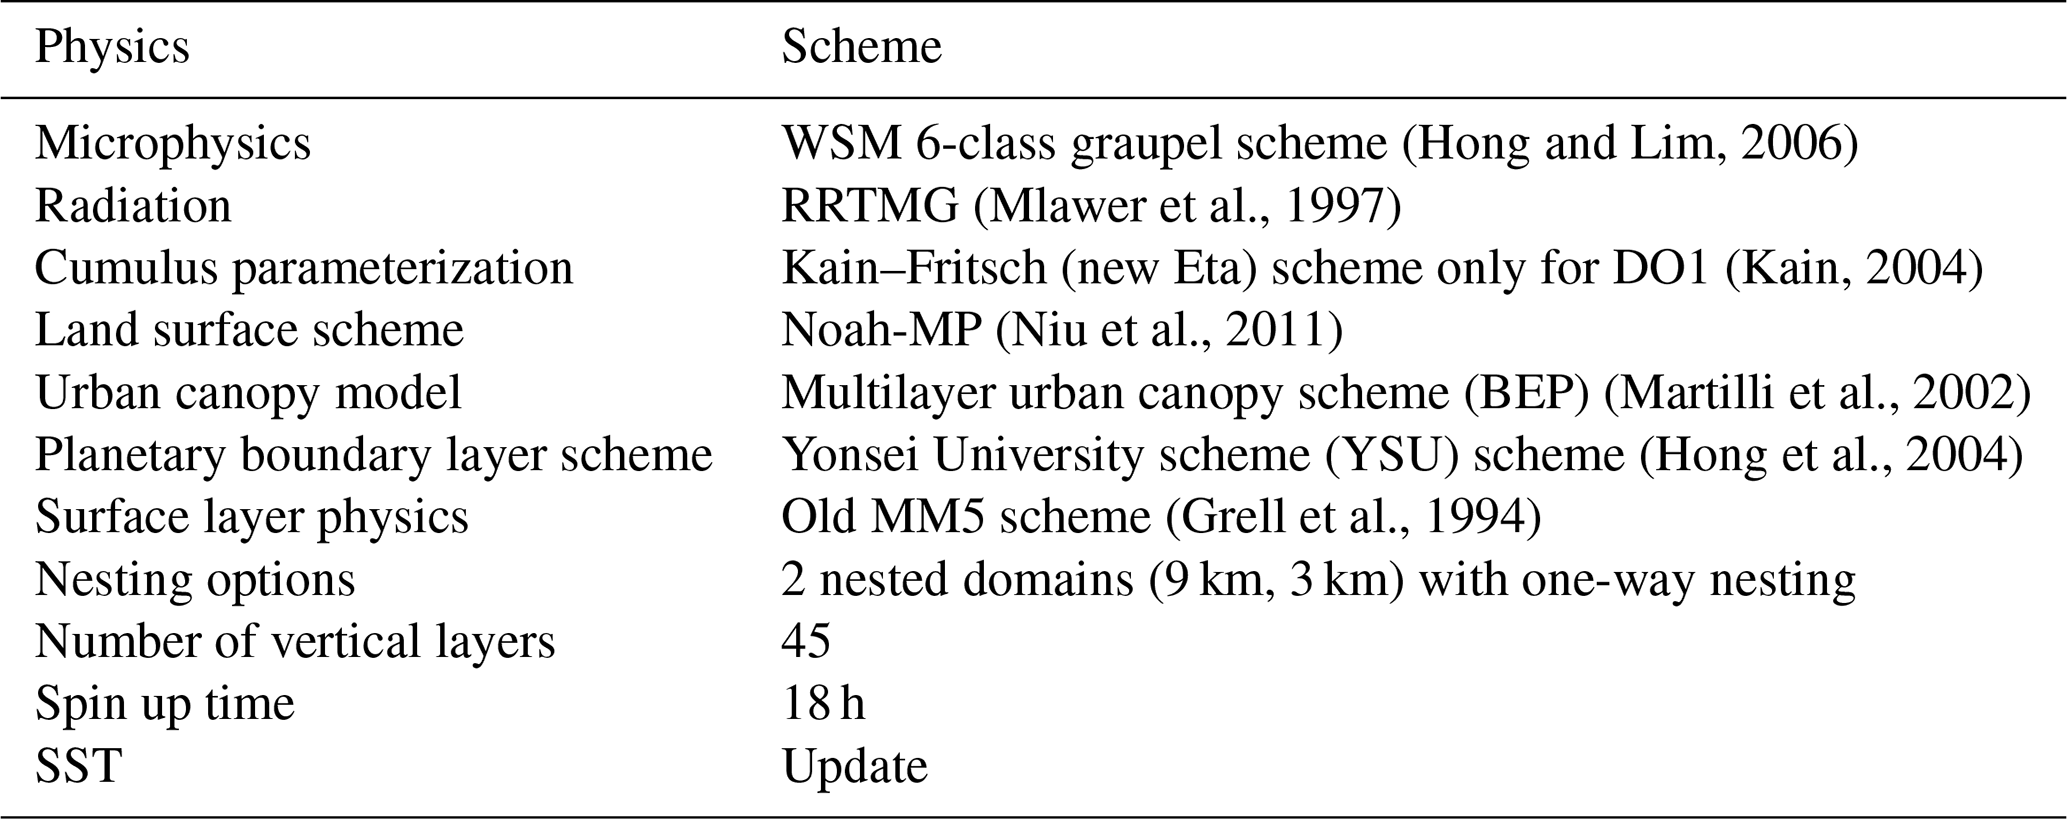
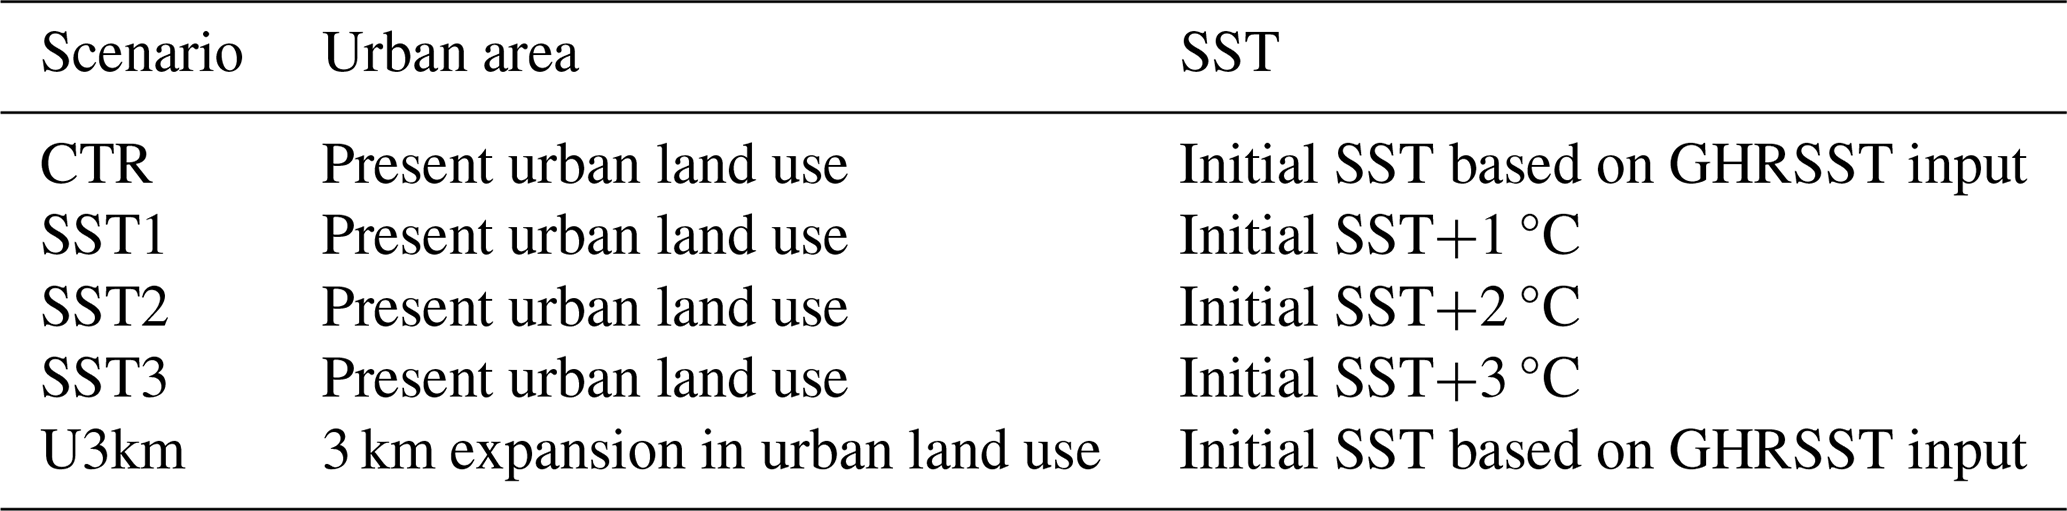
Five scenarios (Table 3) are conducted to investigate the impact of urbanization and SST changes on TC. The control experiment (referred to as “CTR”) uses the current urban extent of Shanghai (Fig. 1b). A future urban expansion scenario is shown in Fig. 1c, where grids within 3 km outside the Shanghai city boundary are replaced with urban land cover grids (“U3km” scenario). This scenario is equivalent to the projection of the city's growth (Chen et al., 2020) by 2040 under SSP1 (i.e., low urban development in the future), or by 2030 under SSP5 (i.e., high urban development). Regarding the SST, we perform an analysis comparing the average SST during the typhoon season (July to September) between the historical (1984–2014) and future (2070–2100) periods, using 28 climate model outputs from the CMIP6 historical and SSP-8.5 high-emission scenarios simulations (Iturbide et al., 2022; IPCC, 2023). We found that SST is projected to rise sharply in the future, with an increase of about 3.5 °C between the present period and the end of the century in DO1 (Fig. S1 in the Supplement). Hence, we establish three scenarios increasing the initial SST over both DO1 and DO2 by 1, 2, and 3 °C coupled with the present urban land use (labeled “SST1”, “SST2”, and “SST3”, respectively) to explore the impacts of expected changes in SST along the century. The initial SST conditions for five simulated TC events are shown in Fig. S2.
3.2 TC indices
To identify and investigate differences in TC trajectories and structures due to increasing SST and urbanization, we conduct the following: (i) we identify the center of the WRF-simulated TC according to the SLPmin, with the location of SLPmin at the first time step in DO2 set as the initial TC center. For the i time step (i > 1), the SLPmin is searched within a “maximum possible radius” of the previous time step (i − 1) TC center. The radius is calculated based on the TC movement speed multiplied by WRF output interval (1 h in our case) and hence is set to 0.5° h−1 (1° h−1) if the TC center at i − 1 is south (north) of 30° N (Yamaguchi et al., 2020); (ii) we compute the TC rainfall period as the time during which the typhoon center is located within a 600 km distance of Shanghai and the averaged rainfall within a 300 km radius of TC centers is greater than 1 mm h−1 (the range marked with red dotted lines in Fig. 2a); (iii) we define the radius of the TC (R [km]) as the distance from the typhoon center to the location where the hourly mean rainfall drops below 2 mm h−1 (similar method used by Hu et al., 2023, Fig. 2b); (iv) for each time step, the maximum rainfall intensity (Imax [mm h−1]) and maximum 10 m wind speed ( [m s−1]) within radius R are computed as the indicators of TC structures. Last, the duration in which the radius of the typhoon is within the area of Shanghai is defined as the TC-affected time (D [h]). For example, in Fig. 2c, considering the trajectory of the typhoon, the solid circle represents a single hourly time step in which the TC radius is within the city area, while the dotted circles are not included in the TC-affected duration.
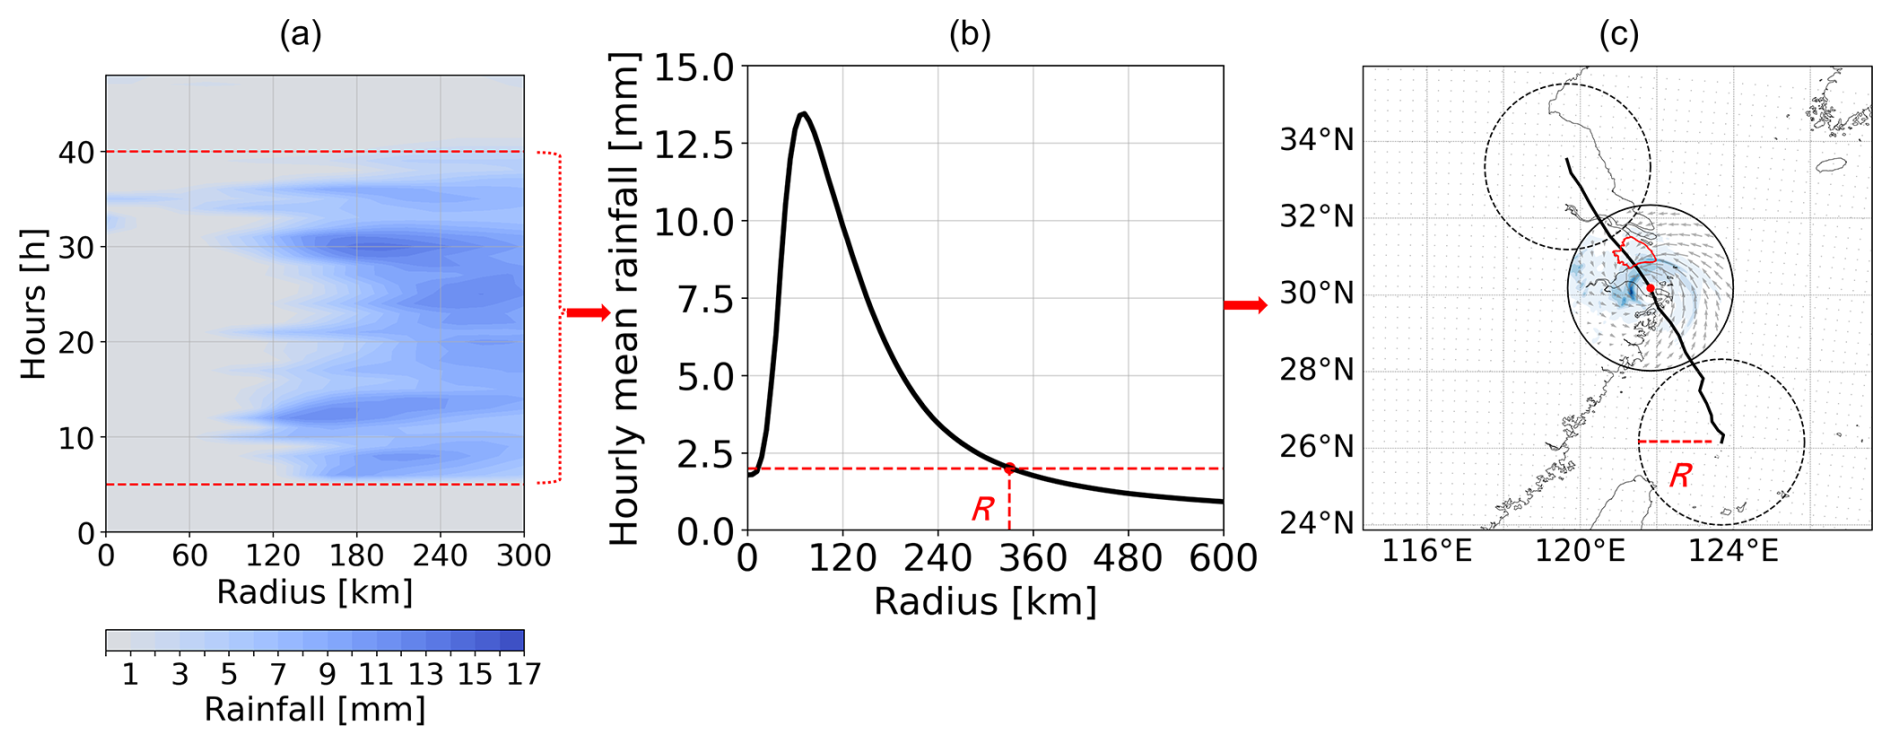
Figure 2An illustration of TC indices. (a) A heat map of the mean hourly TC rainfall as a function of the distance to the TC center (radius) and time from the initial time of simulations. The TC rainfall period (i.e., 35 h) is presented by the dotted red lines. (b) An example of the mean hourly TC rainfall as a function of distance from the typhoon center (radius). The red dashed line marks the threshold used for the identification of TC size R. (c) An example of a typhoon trajectory, including 3 time steps with a typhoon moving northwestward, passing the area of Shanghai delineated by a red polygon. The second time step, marked with a solid black line, is counted for the time calculation of the TC-affected duration index.
3.3 Model validation
Figure S3 presents an illustrative example of several 6 h time steps for a typhoon (rainfall and 850 hPa wind fields) simulated at 3 km spatial and 1 h temporal resolution for the five above-mentioned scenarios. We estimate the model performance by comparing the TC center location, SLPmin, and between CTR simulations and the TC observed dataset. As presented in Fig. 3, the model accurately replicates the typhoon trajectories, rainfall intensity, and wind speed for the five simulated TCs. The mean bias of the trajectories of the center of the typhoons is as low as 55 km, while the bias of the sea-level atmospheric pressure and 10 m wind velocities are only 5.7 hPa (equivalent to 0.6 % bias comparing mean values) and 4.3 m s−1 (0.4 % bias), respectively. Beyond comparing the means, both the TC tracks and intensities are well simulated. As expected, the SLPmin increases when the TCs move from the ocean toward the land. Furthermore, the time and location of the simulated typhoons making landfall are successfully reproduced.
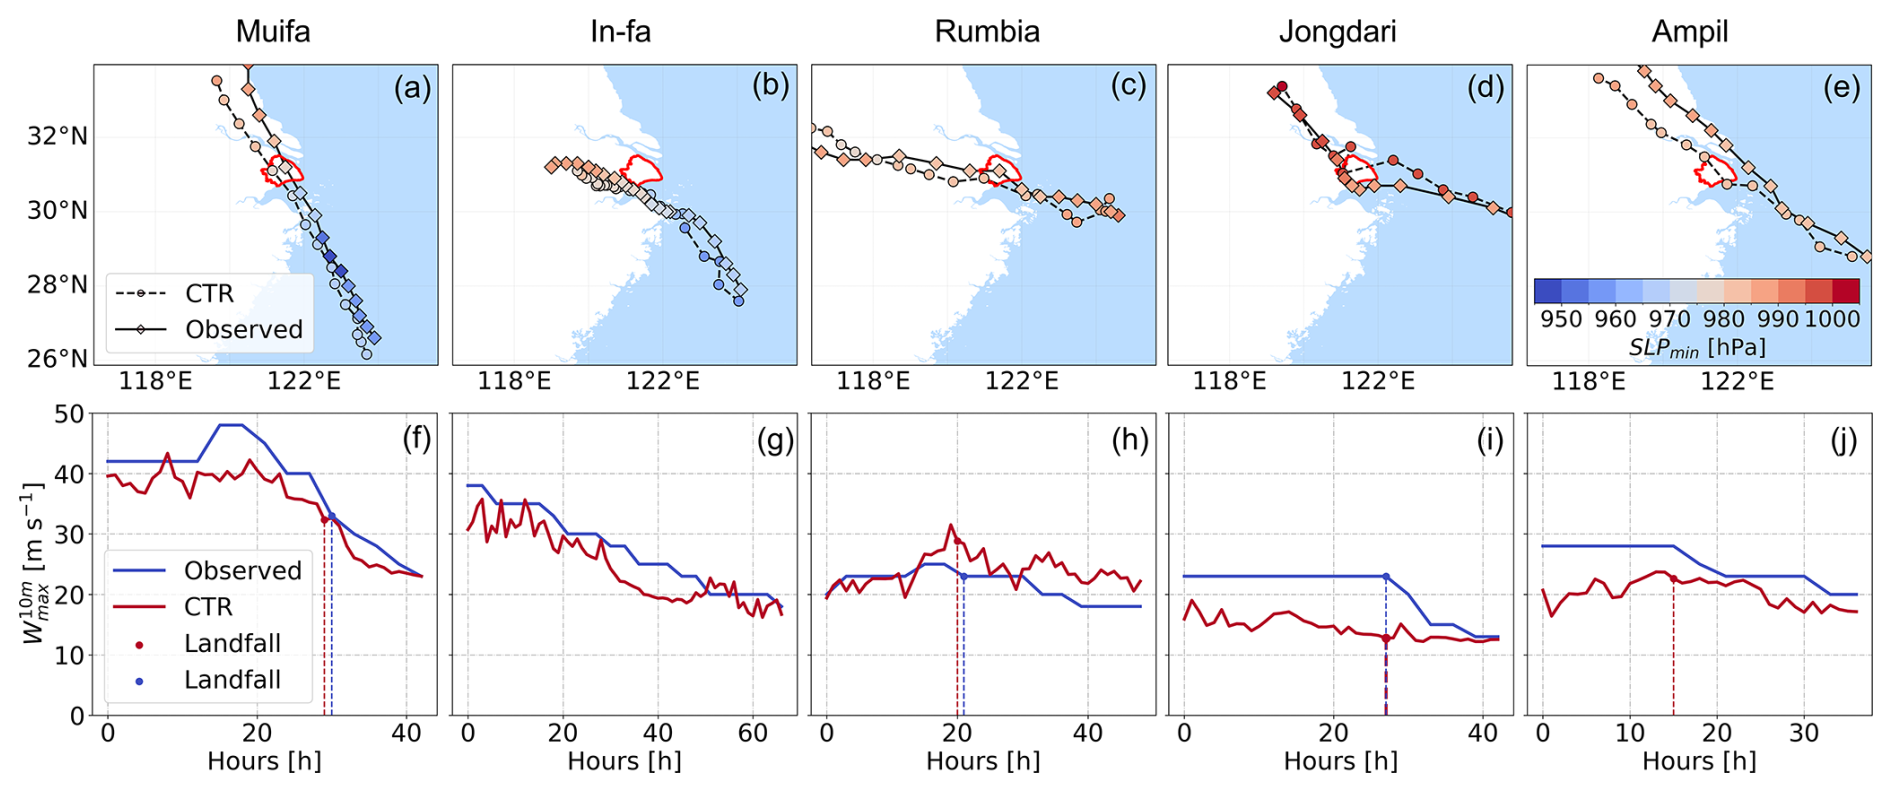
Figure 3Comparison of the TC center location (upper row), minimum sea level pressure (SLPmin [hPa], represented by dots' colors in the upper row), and the maximum 10 m wind speed ( [m s−1], in the lower row) between CTR-simulated events and the records in the tracking dataset. Shanghai area is marked in red in the upper row. The dots in the lower row indicate the time when TC made landfall in Shanghai.
4.1 Displacements of typhoon tracks with increased SST
We first analyze how the trajectories of TCs change with the increase in the urban area of Shanghai and SST scenarios compared to the CTR run (Fig. 4). The TCs exhibit a consistent southeast-to-northwest trajectory in all simulations. With SST warming, there is a noticeable change in the TC trajectories (Fig. 4a–e). The tracks shift southward or southwestward, moving away from Shanghai. Typhoon In-fa shows the most considerable track deviation (Fig. 4b), with an average distance difference of 195 km and a maximum of 399 km under the SST3 scenario (compared to CTR). Typhoon Ampil displays the smallest shift, with an average difference of 37 km (Fig. 4e) between SST3 and CTR. In contrast, urban growth has a limited impact on the TC trajectories. The CTR and U3km simulations exhibit a high agreement both in their landfall locations and trajectories (Fig. 4f-j). On average, there is a minor difference of 23 km between CTR and U3km for all TCs, with typhoon Muifa having the smallest difference of 11 km and typhoon Jongdari showing the largest difference of 37 km (due to a “Z”-shaped trajectory fluctuations; see Fig. 4i).
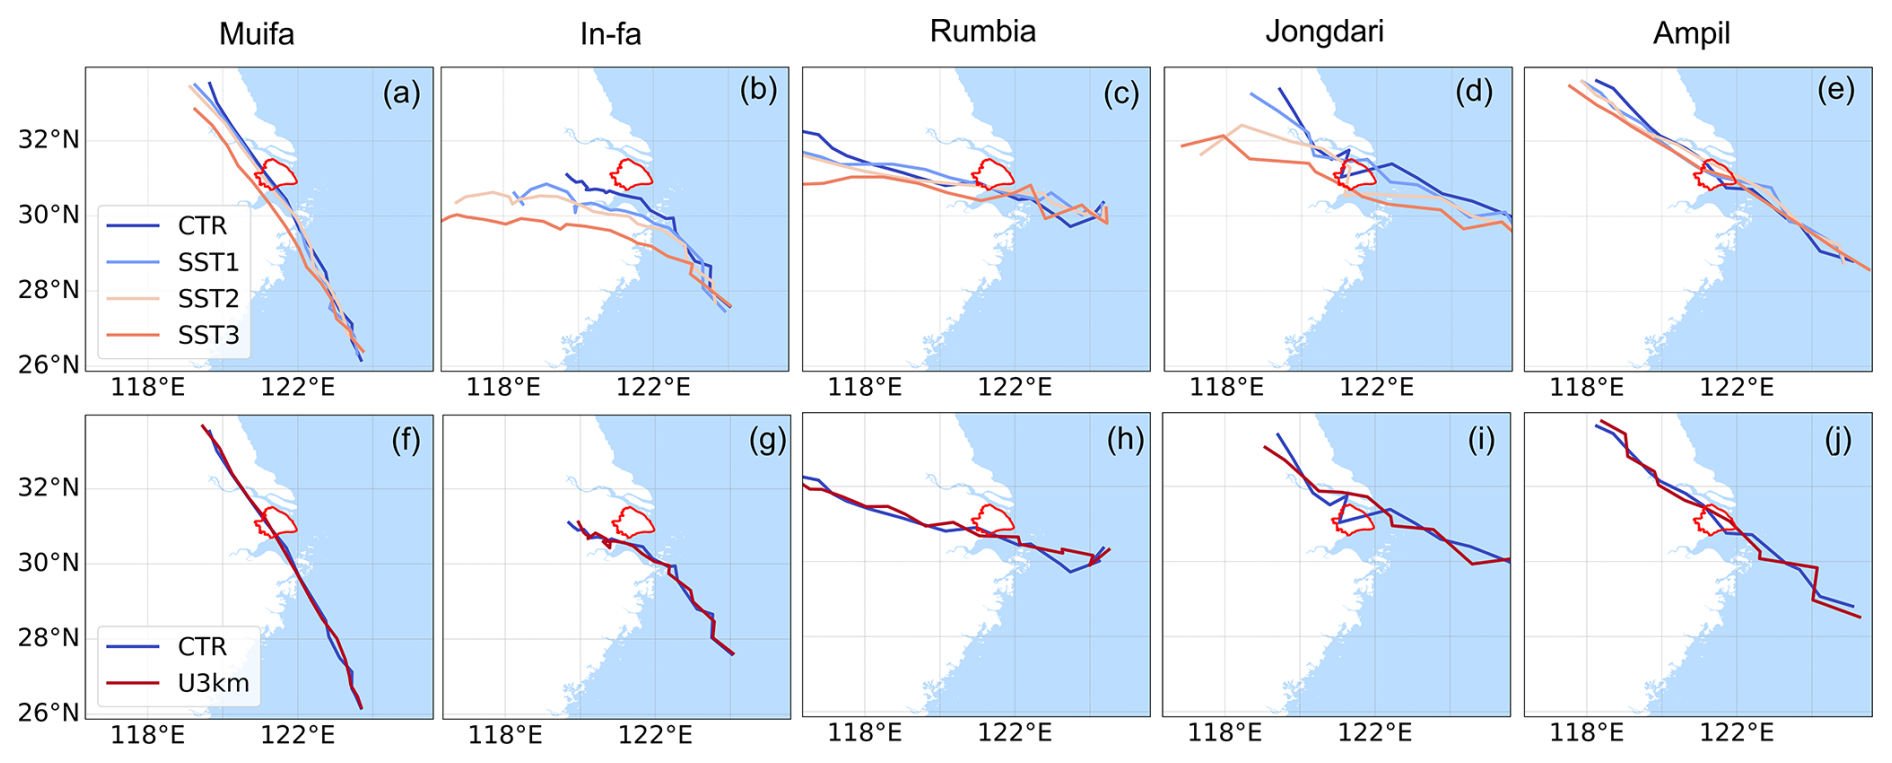
Figure 4TC track changes under effects of SST (upper row) and urbanization (lower row) for the five simulated typhoons. Shanghai area is marked by a red polygon.
4.2 Changes in typhoon properties with SST and urbanization
We next quantify the changes in TC properties: radius of the TC (R [km]), TC-affected time (D [h]), maximum rainfall intensity (Imax [mm h−1]), and maximum 10 m wind speed ( [m s−1]) (Fig. 5). As the SST increases from 1 to 3 °C, we find a consistent rise in R (Fig. 5a); the radius of typhoon Jongdari expands 3 times its original size under the SST3 scenario, while the other cases increase by 23 %–54 % compared to the CTR simulations. This strong positive correlation is not surprising and has also been reported by Lin et al. (2015) and Radu et al. (2014).
It is evident that as R increases with increasing temperatures, Shanghai's exposure time to typhoons extends, as shown by the growth of D from CTR to SST3 scenarios in Fig. 4b. The one exceptional decrease of D occurs with typhoon In-fa under the SST3 scenario, resulting from a larger deviation in its track (Fig. 4b) than its increase in size (Fig. 5a), leading it to miss Shanghai for part of the time. Generally, we conclude that even if TC deviates further from Shanghai with increasing temperatures, its duration of impact on the city will be extended as it grows in size.
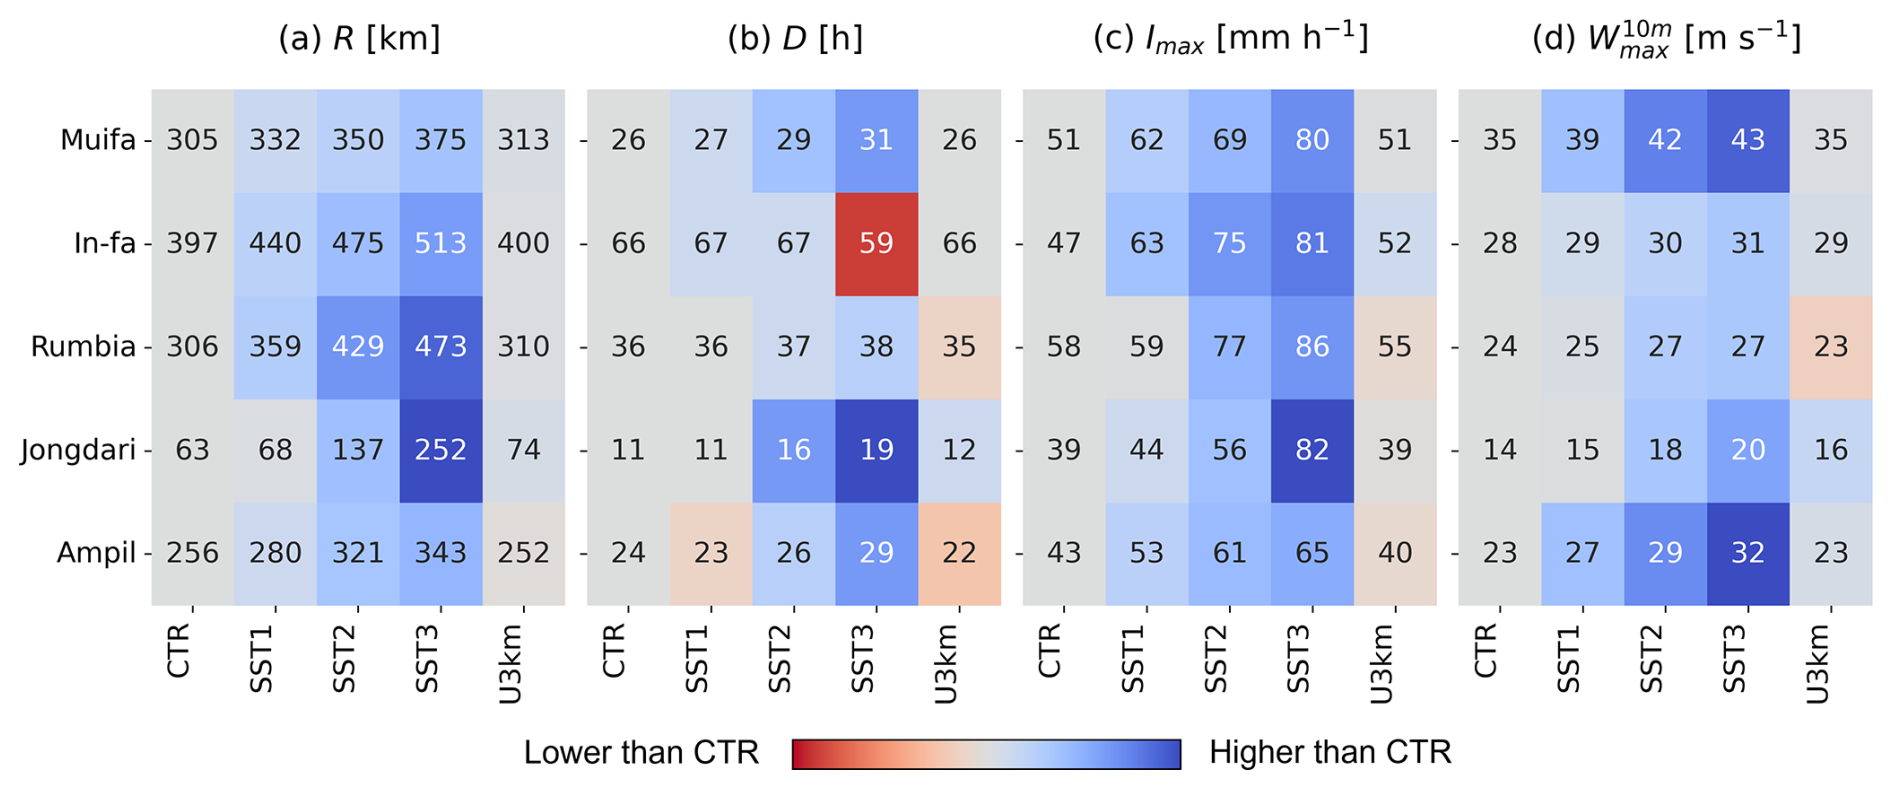
Figure 5Heat maps of the five simulated typhoons for their (a) size R [km], (b) TC-affected duration D [h], (c) maximum rainfall intensity Imax [mm h−1], and (d) maximum near-surface wind velocity [m s−1], for the control and other scenario simulations. The values in the figure are averaged over all time steps, with the maxima (i.e., Imax, and ) identified within the typhoon radius R at each time step. Colors represent the percentage change relative to the control value of each TC, with color intensity scaled to the magnitude of the change (blue: positive change; red: negative change).
Furthermore, the intensity of rainfall (Fig. 5c) and wind velocity (Fig. 5d) impacting the city is also increasing considerably, especially near the typhoon's inner-core area (not shown here), i.e., within 150 km of the TC centers, consistent with the reports by Tran et al. (2024). Compared to the enhancement in wind velocities, the intensification of rainfall is more severe. The increase in Imax ranges from 48 % to 110 %, while increases by 11 % to 43 % in SST3 simulations compared to CTR.
Similarly with the urban growth effects on the TC trajectories, the TC properties are not notably changed due to urbanization. Although R of four TCs increase from 3 to 11 km when comparing CTR and SST3 simulations, D, Imax, and do not exhibit considerable changes, and in fact, intensities are even a bit suppressed in two of the simulated typhoons.
In addition to investigating the changes in TC properties on a large scale, we also analyze how the different scenarios affect the local rainfall and wind velocities within the Shanghai urban area (marked by a red polygon in Fig. 1). Generally, Shanghai will likely be impacted more heavily by typhoons, as both rainfall intensities (Imax, Fig. 6a) and maximum wind velocities (, Fig. 6b) are enhanced with SST warming, consistent with the changes to TC properties found at the large scale. The wind velocities affecting Shanghai show steady and consistent growth as SST increases from 1 to 3 °C (Fig. 6b), while the changes in maximum rainfall intensities affecting the city show less consistent intensification and higher variability (for example, the typhoon In-fa in Fig. 6a). This could be attributed to the shifting TC tracks and the irregular, asymmetric distribution of TC rain bands. As these tracks shift, the rain bands – far from being evenly distributed – rotate as well. This rotation can lead to inconsistent and spatially varied rainfall intensities impacting Shanghai as different portions of the rain bands pass over the city. When comparing the U3km and CTR simulations, urban growth leads to a consistent increase in Imax (Fig. 6a) and a noticeable decline in (Fig. 6b). This suggests that urbanization can enhance local TC-induced rainfall while reducing wind velocity.
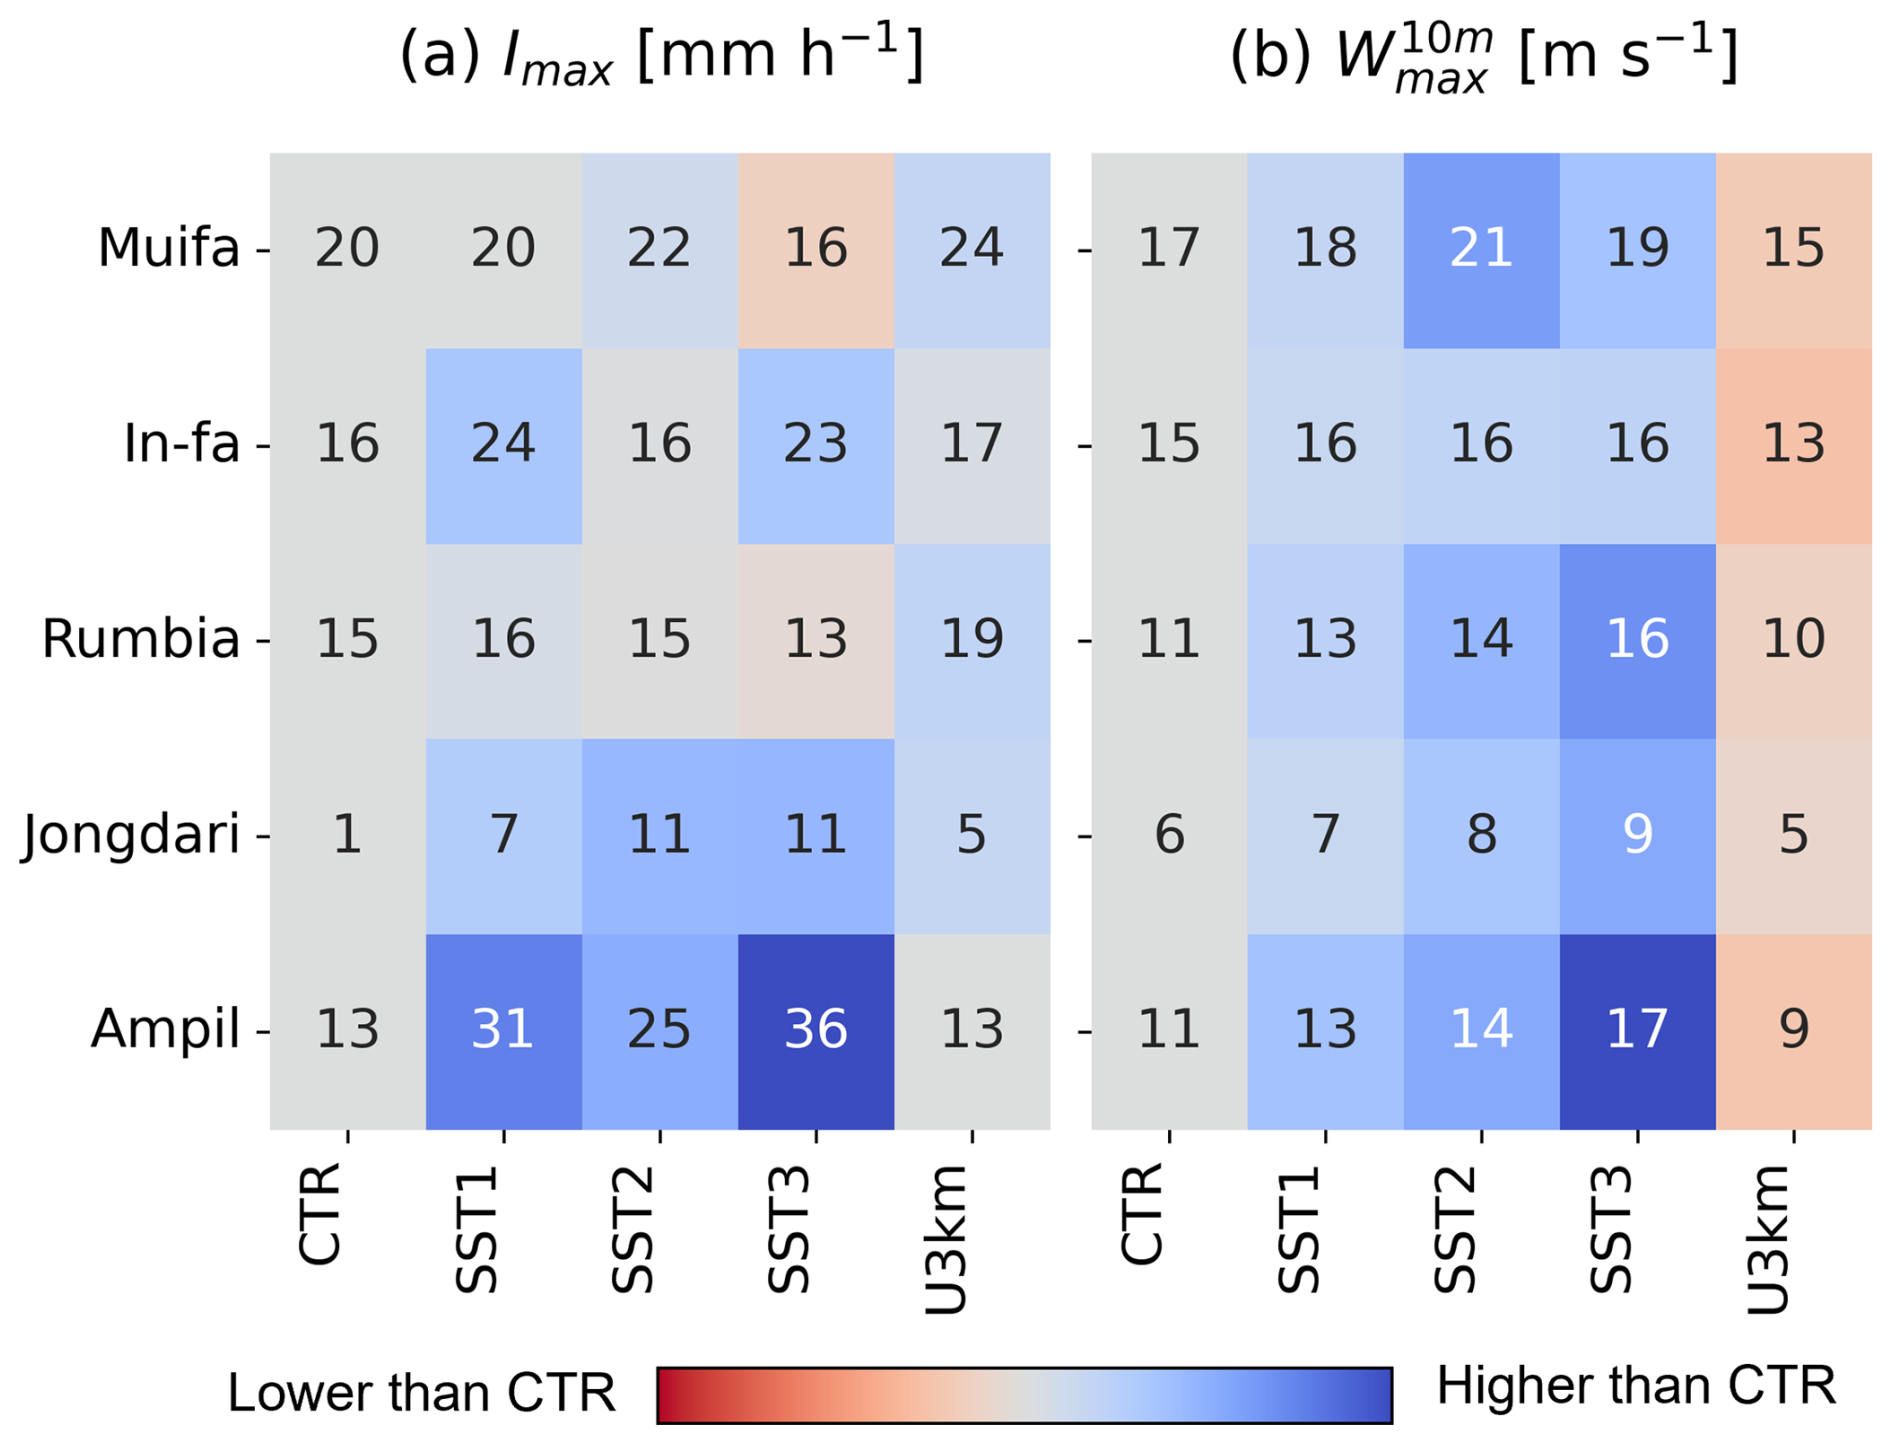
Figure 6Heat maps of (a) maximum rainfall intensity (Imax [mm h−1]) and (b) 10 m wind speed ( [m s−1]) within Shanghai domain under different scenarios. The values in the figure are averaged over all time steps, with the maxima (i.e., Imax, and ) identified within the Shanghai city at each time step. Colors represent the percentage change relative to the control value of each TC, with color intensity scaled to the magnitude of the change (blue: positive change; red: negative change).
Furthermore, considering that typhoons behave differently over sea and land, we investigate the changes in TC properties before and after landfall for the four events that make landfall in Shanghai. As shown in Fig. 7, rainfall and wind velocities primarily intensify with SST warming over the sea before reaching land. Elevated SST leads to a stronger increase in wind velocities over the sea, but not necessarily over the land; typhoons Ampil and Jongdari experience similar enhancement trends over both sea and land, while typhoons Rumbia and Muifa are enhanced over the sea but not over the land (lower panels in Fig. 7). Similarly, there is a more pronounced rainfall intensification over the sea (upper panels in Fig. 7). This is consistent with the fact that TCs develop over the sea, and their energy weakens and dissipates after landfall. However, typhoon Jongdari exhibits a considerable enhancement of rainfall both before and after landfall, indicating it decays slowly after reaching land, threatening areas further inland with the SST increase (Li and Chakraborty, 2020). The scenario of urban growth shows a clear decreasing trend in both rainfall and wind velocities after the TC landfall.
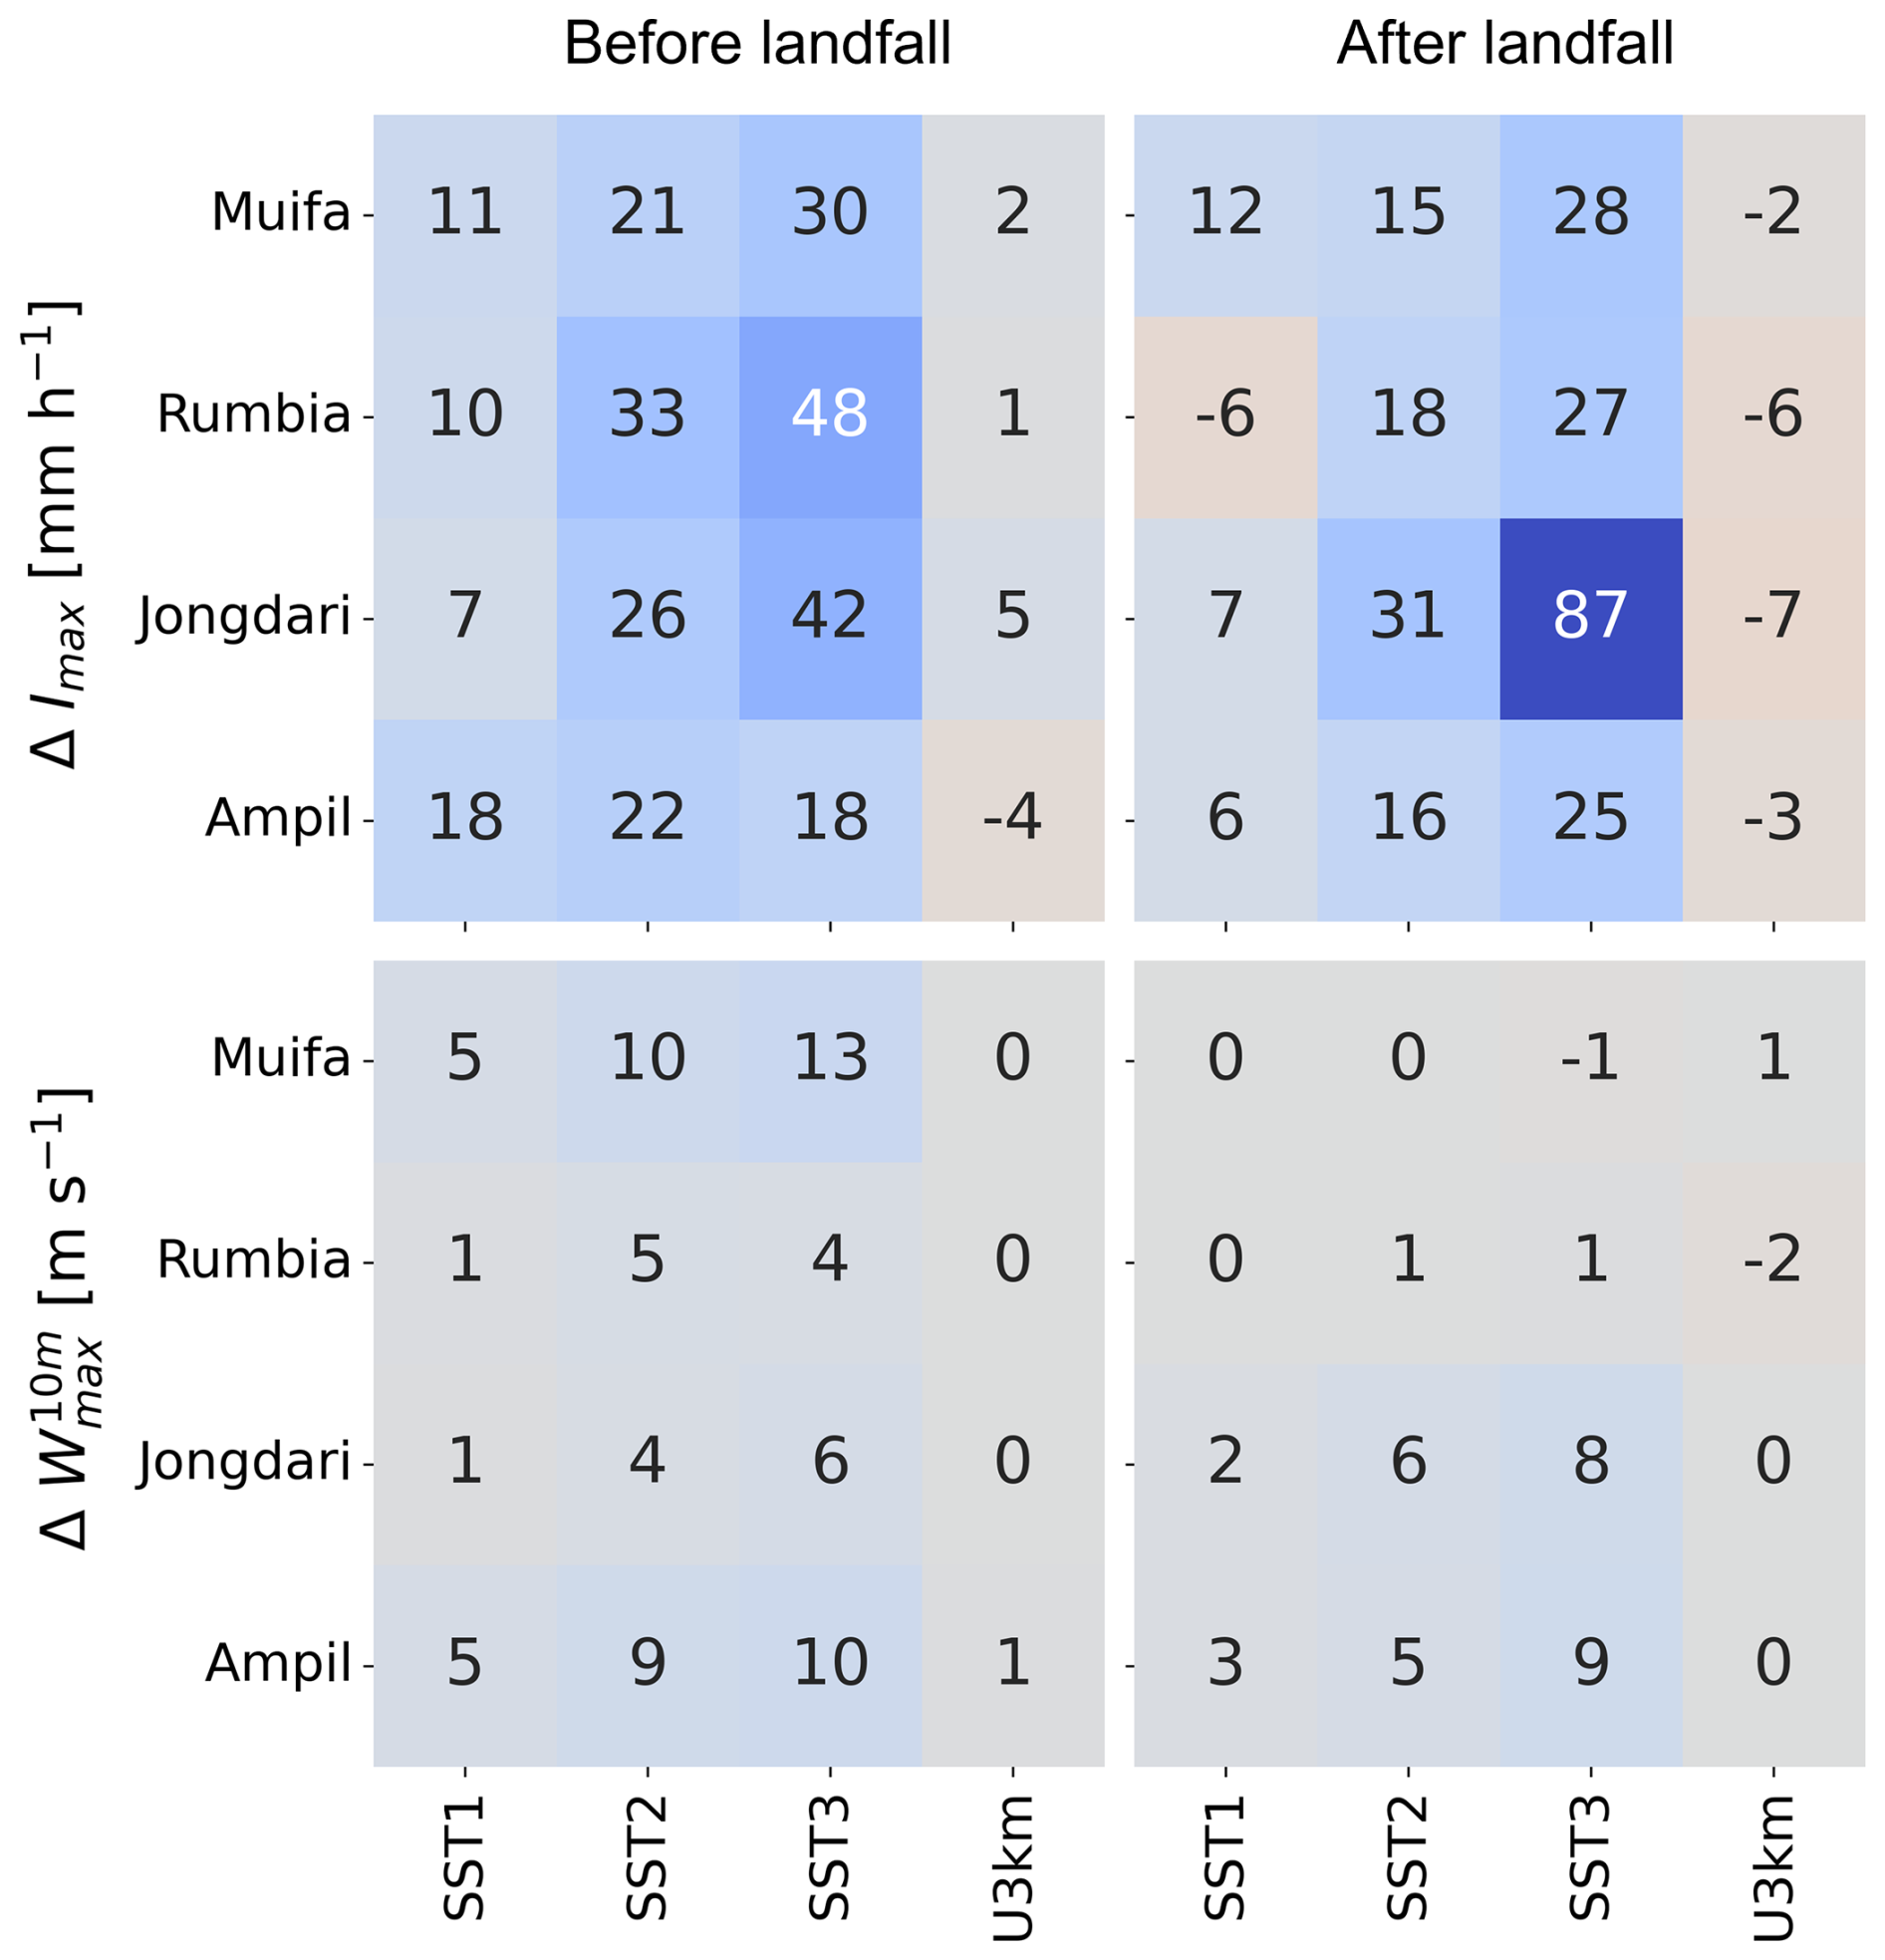
Figure 7Heat maps comparing the difference of the maximum rainfall intensity (Imax [mm h−1]) and 10 m wind speed ( [m s−1]) before and after TCs made landfall in Shanghai between CTR and other scenarios. The maxima are identified within the typhoon radius R, as in Fig. 5. Landfall time is defined as the initial time step when the typhoon radius reaches Shanghai. “Before landfall” encompasses all simulation steps preceding this event, whereas “after landfall” includes all subsequent steps. Typhoon In-fa is removed here because it does not make landfall in Shanghai.
4.3 Thermodynamic and dynamic analysis
To understand the mechanisms behind the changes in TC trajectories and properties, we compare the fields of mean sea level pressure (MSLP [hPa]), air temperature at 850 hPa (T850 [°C]), and wind velocity at 850 hPa height (W850 [m s−1]) in DO1 between different scenarios. Here we only present typhoon In-fa (Fig. 8), which exhibits the largest track shifts with SST changes (Fig. 4b). We find that there is a steady increase in T850 with SST warming, particularly over the sea. As SST increases from 1 to 3 °C, there is a decrease of around −4 to −8 hPa in MSLP at TC centers, associated with an increase of W850 around it. This suggests that an increase in SST enhances the thermodynamic energy, strengthens the vortex of the TC systems, and ultimately leads to an increase in the TC size and intensity. This is consistent with the mechanism observed in other TC systems (Lin et al., 2015; Tao and Zhang, 2014; Srinivasa et al., 2017).
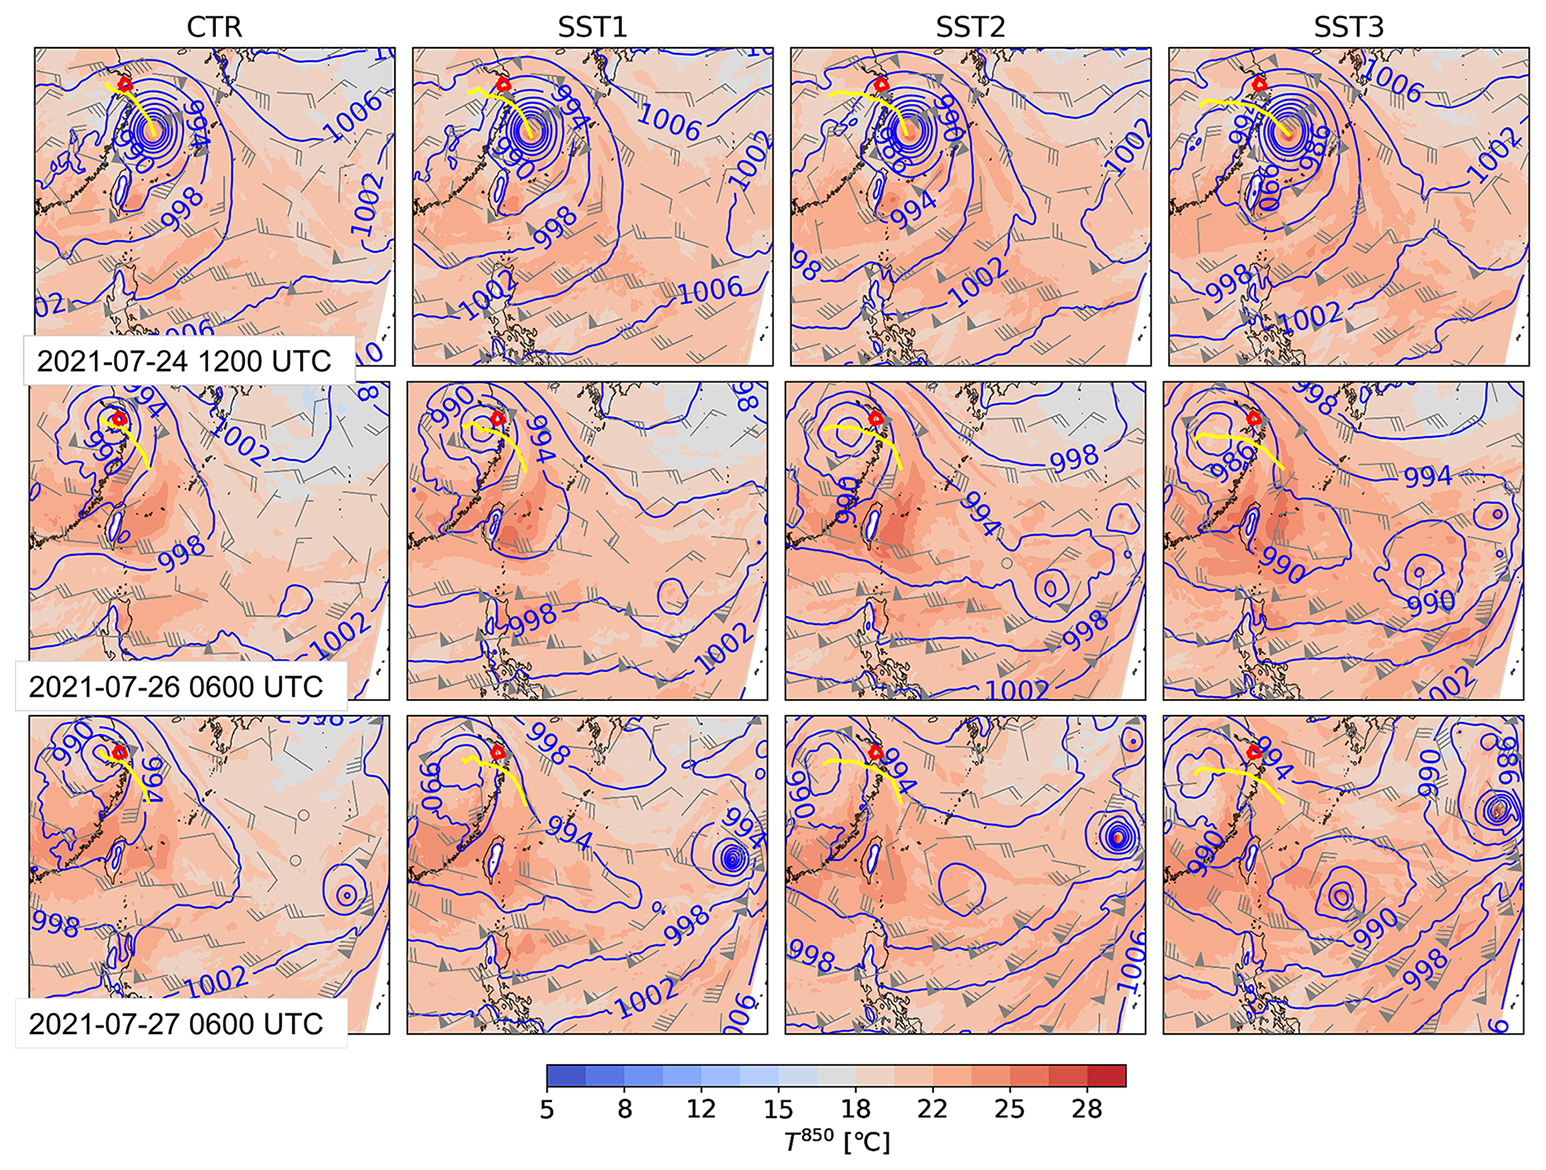
Figure 8Mean sea level pressure (MSLP [hPa], blue contour lines), 850 hPa air temperature (T850 [°C], background colors), and 850 hPa wind velocity (W850 [m s−1], wind barbs) between different SST scenarios for several time steps of typhoon In-fa. The coastline is marked with a black line, and Shanghai is delineated with a red line. The yellow lines represent the typhoon tracks.
On 24 July at 12:00 UTC (upper panels in Fig. 8), there is only one clear intensifying low-pressure center in the DO1 domain. On 26 July at 06:00 UTC, a second low-pressure center emerges over the sea, southeast to the In-fa typhoon, which is also strengthened with SST warming (from CTR to SST3 scenarios). These two TCs become equivalent in intensity with SST warming (indicated by MSLP shown in SST2, and SST3 on 26 July 2021, 06:00 UTC; in CTR and SST1, they reach comparable intensities at later times) and are separated by a distance of less than about 1500 km. At such a distance, the two TCs can influence each other (Liu et al., 2015) as their outer wind fields tend to combine and form a large counterclockwise vortex. The eastern typhoon accelerates and maintains its northeastward trajectory, while the western typhoon (In-fa) begins to move southward or southwestward, resulting in a mutually rotating pattern between the two TCs known as the Fujiwhara effect (Fujiwhara, 1921). As SST warms, two intensified low-pressure systems lead to larger outer wind fields and increased water vapor convergence, thereby resulting in stronger interactions between them (see also Lee et al., 2023). This accelerates the Fujiwhara effect, as evidenced by a significantly stronger counterclockwise rotation of two TCs, resulting in a southerly shift of typhoon In-fa and a northward movement of the eastern one. Furthermore, under the SST2 and SST3 scenarios, a third low-pressure center forms between two TCs on 27 July, 06:00 UTC (lower panels in Fig. 8). As the second low-pressure center (that emerged on the 26th) moves farther northeast in DO1, the third low-pressure center (that emerged on the 27th), located inside the counterclockwise vortex, grows stronger, facilitating a more intense vortex and continues to affect the typhoon In-fa. As a result, typhoon In-fa has the most significant southern track shift relative to the other simulated TC events (Fig. 4). Notably, the Fujiwhara effect occurs in all five simulated events and plays an active role in the trajectory changes reported above. A video of another simulated TC, typhoon Rumbia (Video supplement, Zhuang et al., 2024a), illustrates clearly the movement of two TCs due to the Fujiwhara effect in DO1 and the associated changes in rainfall in DO2 under various SST scenarios.
Typhoons in the Northern Hemisphere have been found to move northward under climate change (Shen et al., 2018; Liu et al., 2019; Wang and Toumi, 2021; Tamarin-Brodsky and Kaspi, 2017). However, in our study, we observed a southward shift in TC tracks, which seems to be a typical result of the Fujiwhara effect (Shimokawa et al., 2011). Our findings do not suggest an increase in the frequency of double-TCs but rather indicate stronger interaction when such systems are already present, leading to a more pronounced Fujiwhara effect. Notably, from 1960 to 2017, there were 255 instances of double-TC activities affecting China, with an average of 4.4 pairs yr−1, accounting for 60.6 % of the total number of typhoons in the WNP region (Xie et al., 2020). In light of the frequency with which this phenomenon occurs, we anticipate an increase in the southward movement of typhoon trajectories in this region in the future, possibly greater than what was observed in the five TCs that we simulated.
Comparing the CTR and U3km scenarios of typhoon In-fa (Fig. 9) reveals that the urban growth has no substantial impact on T850, MSLP, and W850, resulting in limited changes in both intensity and trajectory of the typhoon. Urbanization has little impact on the other TCs as well (e.g., see Fig. S4 for typhoon Jongdari, which made direct landfall in Shanghai). However, as mentioned above, urbanization still contributes to modifying the local rainfall and wind velocities. Based on the time series analysis, we present in Fig. S5 that the simulated typhoons consistently exhibit a higher hourly rainfall peak within the Shanghai area under U3km scenarios compared to CTR (also recall Fig. 6a). TC systems are favorable for raising the amount of water vapor, however, in Shanghai the increase in urban areas slightly suppresses it. All U3km simulations point to a minor decline in the W850 (Fig. 8) and 10 m wind velocities (last column in Fig. S5, also recall Fig. 6b); the latter can be attributed to the higher urban roughness effect in U3km compared to CTR (Wever, 2012). Therefore, the increased rainfall intensity in Shanghai due to urban growth is primarily caused by the higher urban surface roughness, which promotes low-level convergence and enhances upward vertical air movement (Au-Yeung and Chan, 2010), while the urban thermal effect is weak during the TC activities. A similar conclusion could also be found in Hu et al. (2023) and Du et al. (2023).
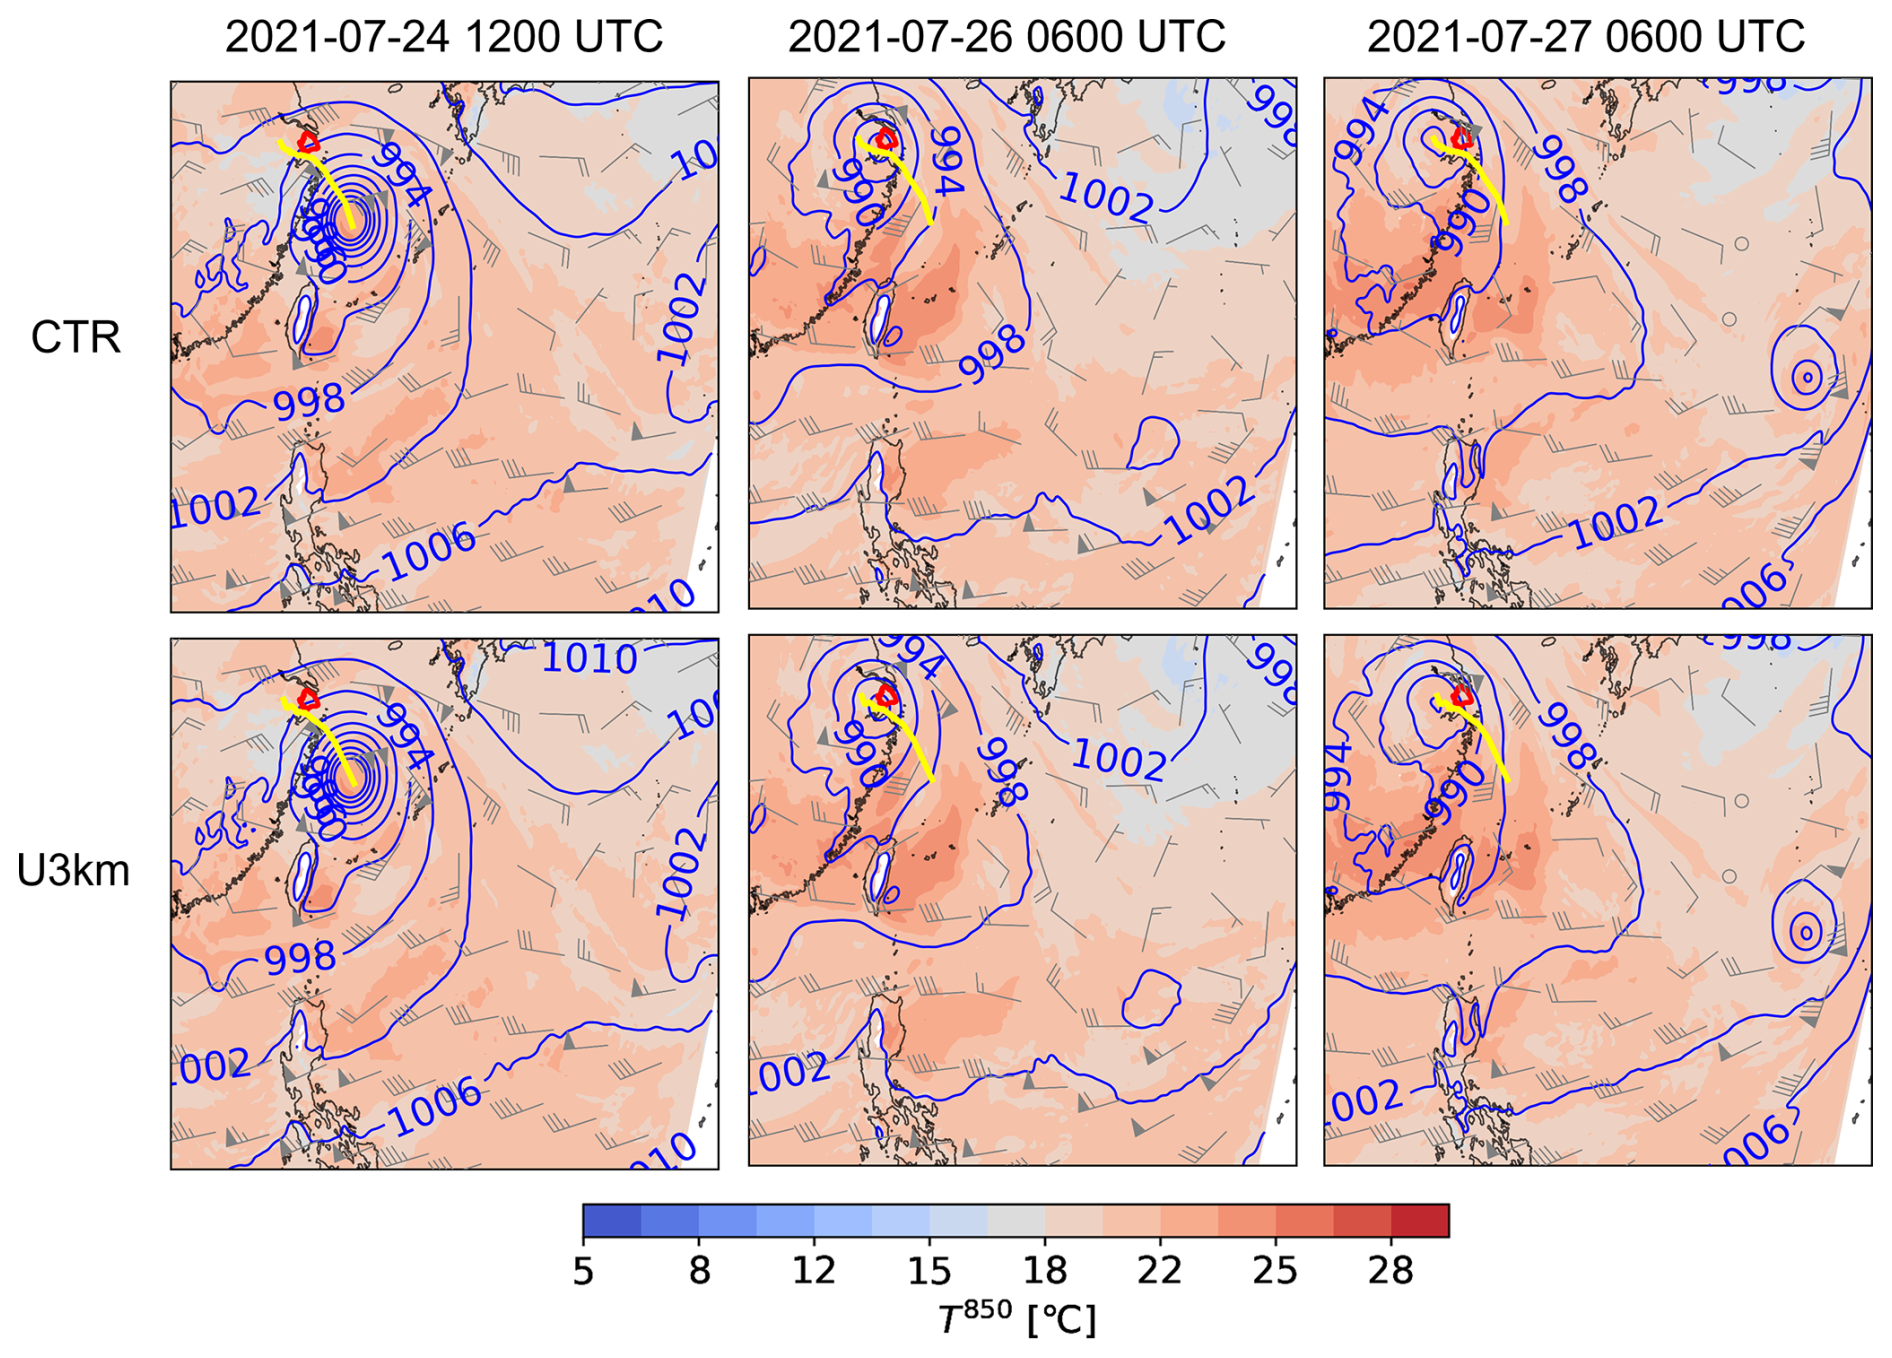
Figure 9Same as Fig. 8 but presenting the CTR and U3km scenarios.
Coastal cities in tropical and subtropical climates like Shanghai are particularly prone to TC hazards. Typhoons in such cities can lead to three major types of hazards (Zong and Chen, 1999): (i) wind damages occur when TC directly strikes Shanghai; (ii) compound fluvial-coastal flooding hazards arise due to TC-induced extreme rainfall, combined with astronomical high tides and storm surges; and (iii) waterlogging damages, particularly in highly urbanized areas or as a result of poor pumping system management. For example, Typhoon Muifa is identified by fast movement and strong energy, making landfall in China four times, which sets a new record for the number of landfalls by an individual typhoon (Wang et al., 2023). Consequently, it induced heavy wind and waterlogging damages within the city, flooding 70 roads and 7 underpasses, falling or breaking 3137 trees, collapsing 73 billboards, and causing 65 power outages (Pengpai News, 2021). In contrast, typhoon In-fa, a slow-moving system, broke records by remaining on land for 95 h (Huang et al., 2023). In-fa caused heavy rainfall and flooding, which were more deadly than previous typhoons. It resulted in long rainfall periods affecting Shanghai, with an accumulated rainfall of 402 mm associated with storm surges reaching 1 to 2.2 m that occurred along the coasts. Furthermore, In-fa enhanced atmospheric moisture transport to Henan Province, contributing to the disastrous flood killing at least 302 people during the Zhengzhou flooding event in July 2021 (Nie and Sun, 2022).
The risks posed by TCs in Shanghai are exacerbated by both rapid urban expansion (Sun et al., 2022) and the effects of climate change (Liang et al., 2022). The city's increasing population density and expansion of impervious surfaces will further reduce its natural drainage capacity, making it highly susceptible to waterlogging during TC events, especially if the existing urban drainage system is not adjusted. Climate change further intensifies these vulnerabilities, as warmer sea surface temperatures lead to stronger and larger typhoons, along with more intense rainfall and stronger winds, as presented above. Although warming SSTs may shift TC tracks southward, our findings indicate that the overall risk to the city remains high. First, typhoons that would previously have passed north of Shanghai may shift southward and make direct landfall, resulting in greater wind and rainfall hazards for the city. Second, even for typhoons whose tracks shift further south and do not make direct landfall in Shanghai, the increased size and intensity of these storms under warmer SSTs may still expose Shanghai to substantial impacts from strong winds, heavy rainfall, flooding, and storm surges. Furthermore, the rising sea levels under climate change enhance the risks from storm surges (Tian et al., 2023; Yin et al., 2021), potentially overwhelming existing flood defenses and further increasing the likelihood of compound flooding events. The combined effects of sea surface warming and sea level rise have been shown to exacerbate typhoon-induced hazards, resulting in significantly greater inundation risks for coastal regions (Yin et al., 2021). Additionally, anomalously warmer SST, so-called El Niño, significantly influences typhoons on a large scale. Numerous studies have reported that El Niño can alter the frequency, genesis location, and intensity of TCs in the WNP. For example, Wang and Chan (2002) reported that El Niño summers and autumns are associated with increased TC formation in the southeastern WNP and decreased activity in the northwest, while Wu et al. (2004) detected enhanced TC landfalls in East and Southeast Asia during La Niña. El Niño has also been shown to discharge heat into the WNP after its winter peak, intensifying TCs (Jin et al., 2014), and its influence is particularly pronounced for super typhoons (Kang et al., 2019). In our case, the recent El Niño onset was on 4 July 2023 (WMO, 2023) driving an increase in SST levels (Jiang et al., 2024) that can be likely linked to the increase in typhoon severity the following year (see mechanisms discussed by Camargo and Sobel, 2005; Jin et al., 2014), especially linked to typhoons Bebinca and Pulasan impacting Shanghai in September 2024. These factors underscore the urgent need for integrated risk management strategies that address both urban planning and climate resilience to mitigate the growing TC risks in Shanghai.
While we focused on the specific changes and impacts of TCs in Shanghai, it is important to recognize that similar analyses are needed for other large coastal cities that are vulnerable to TC activities (such as New York, United States; Tokyo, Japan; and Visakhapatnam, India; Peduzzi et al., 2012). The results presented here are localized to Shanghai and cannot be generalized to other cities. Given the complex interactions between urbanization, sea surface temperature warming, and typhoon dynamics, other cities may experience different patterns of intensification and track shifts. In fact, for some coastal cities, the risk could be even greater if future climate conditions cause TCs to shift closer, potentially increasing the frequency and severity of direct landfalls. Conducting city-specific assessments is crucial for understanding how climate change will uniquely affect tropical cyclone behavior in each region and for developing tailored risk mitigation strategies.
In our numerical experiment, we uniformly increased SST within DO1 and DO2, whereas in reality, SST changes will vary spatially (Bulgin et al., 2020). As indicated in Fig. S1, future SST warming in the East China Sea is projected to be greater than that in the South China Sea, and this spatial variability could lead to even greater intensification of TCs, as certain areas may experience more pronounced warming (Sun et al., 2013). Additionally, we did not account for the changes in atmospheric temperature, anthropogenic heat, and aerosol emissions that would occur under future climate change scenarios and continued urbanization, which could also contribute to the modification of cyclone dynamics (Wang et al., 2014; Shultz et al., 2014). Despite these constraints, our study offers a robust framework for understanding key mechanisms of TCs intensification and trajectory changes in response to urbanization and warming seas, and the insights provided are valuable and can serve as a basis for more refined future studies that incorporate these additional complexities.
We used a convection-permitting WRF model to investigate the potential impacts and mechanisms of urban expansion (by 3 km of the current city size) and increase in sea surface temperature (by 1 to 3 °C) on five typical landfalling typhoons over the southeast coast of China. The results highlight the impact of warming SST on TC tracks and properties (i.e., increase in size, intensity, and TC-affected duration) in the future. Although typhoon trajectories are projected to deviate away from the city of Shanghai with increasing SST, the risks emerging from future typhoons will increase due to the enhanced TC size associated with rainfall intensification and stronger wind velocities. Urban growth, on the other hand, influences local thermodynamics rather than general TC systems. It facilitates an enhancement in local rainfall intensity while decreasing wind velocity within the city area due to the higher urban surface roughness effect. Furthermore, we found that if two TCs coexist, the Fujiwhara effect that is responsible for the shift in trajectories away from Shanghai will be strengthened by increasing SST, and future typhoons will be further diverted. These potential mechanisms could be beneficial in the Western North Pacific region, where two-TC systems frequently occur. Given that the combined effects of continued urbanization and climate warming will intensify TCs in the future, we suggest re-assessing the hazards and risks from typhoons in Shanghai to investigate potential adaptation measures. Furthermore, we recommend conducting this type of analysis in all large cities that are likely to be affected by TC hazards.
The observed “best track dataset” of typhoons was obtained from the China Meteorological Administration Tropical Cyclone Database (https://tcdata.typhoon.org.cn, last access: 19 June 2024). The NCEP GFS 0.25 Degree Global Forecast dataset is available at https://doi.org/10.5065/D65D8PWK (DOC/NOAA/NWS/NCEP, 2015). The SST is obtained from the Group for High Resolution Sea Surface Temperature (GHRSST) global Level 4 dataset at https://doi.org/10.5067/GHAAO-4BC21 (NOAA National Centers for Environmental Information, 2020). The MODIS data can be downloaded at https://www2.mmm.ucar.edu/wrf/users/download/get_sources_wps_geog.html (last access: 2 March 2023).
A video illustrating the evolution of Typhoon Rumbia under different SST warming scenarios, showing enhanced typhoon intensity and typhoon rainfall with increasing SST, as well as the strengthened interaction with a coexisting tropical cyclone (Fujiwara effect), is available at https://doi.org/10.5446/68890 (Zhuang et al., 2024a).
The supplement related to this article is available online at https://doi.org/10.5194/wcd-6-1267-2025-supplement.
Conceptualization: QZ, MK, NP. Modeling: QZ, MK. Formal analysis: QZ, MK, NP. Visualization: QZ. Funding acquisition: NP. Project Administration: NP. Supervision: NP. Writing – original draft: QZ. Writing – review and editing: MK, SL, ZZ, NP.
The contact author has declared that none of the authors has any competing interests.
Publisher’s note: Copernicus Publications remains neutral with regard to jurisdictional claims made in the text, published maps, institutional affiliations, or any other geographical representation in this paper. While Copernicus Publications makes every effort to include appropriate place names, the final responsibility lies with the authors. Views expressed in the text are those of the authors and do not necessarily reflect the views of the publisher.
Qi Zhuang acknowledges the support of the China Scholarship Council grant (CSC; grant number: 202206260164). Marika Koukoula and Nadav Peleg are supported by the Swiss National Science Foundation (SNSF), Grant 194649 (“Rainfall and floods in future cities”). Shuguang Liu and Zhengzheng Zhou acknowledge the support from the National Natural Science Foundation of China (NSFC), Grant 42271031, 42371030, respectively.
This research has been supported by the Schweizerischer Nationalfonds zur Förderung der Wissenschaftlichen Forschung (grant no. 194649).
This paper was edited by Pedram Hassanzadeh and reviewed by two anonymous referees.
Ao, X., Yue, C., Yang, X., Lin, D., and Huang, W.: Urbanization Effects on Rainfall Processes Induced by Landfalling Typhoon Lekima (2019) over the Shanghai Metropolitan Area, J. Hydrometeorol., 23, 1075–1090, https://doi.org/10.1175/JHM-D-21-0170.1, 2022. a
Au-Yeung, A. Y. M. and Chan, J. C. L.: The Effect of a River Delta and Coastal Roughness Variation on a Landfalling Tropical Cyclone, J. Geophys. Res.-Atmos., 115, https://doi.org/10.1029/2009JD013631, 2010. a
Broxton, P. D., Zeng, X., Sulla-Menashe, D., and Troch, P. A.: A global land cover climatology using MODIS data, J. Appl. Meteorol. Clim., 53, 1593–1605, https://doi.org/10.1175/JAMC-D-13-0270.1, 2014. a
Bulgin, C. E., Merchant, C. J., and Ferreira, D.: Tendencies, variability and persistence of sea surface temperature anomalies, Scientific Reports, 10, 7986, https://doi.org/10.1038/s41598-020-64785-9, 2020. a
Camargo, S. J. and Sobel, A. H.: Western North Pacific tropical cyclone intensity and ENSO, J. Climate, 18, 2996–3006, https://doi.org/10.1175/JCLI3457.1, 2005. a
Chang, C.-P., Lei, Y., Sui, C.-H., Lin, X., and Ren, F.: Tropical cyclone and extreme rainfall trends in East Asian summer monsoon since mid-20th century, Geophys. Res. Lett., 39, https://doi.org/10.1029/2012GL052945, 2012. a
Chen, G., Li, X., Liu, X., Chen, Y., Liang, X., Leng, J., Xu, X., Liao, W., Qiu, Y., Wu, Q., and Huang, K.: Global projections of future urban land expansion under shared socioeconomic pathways, Nat. Commun., 11, 537, https://doi.org/10.1038/s41467-020-14386-x, 2020. a
Defforge, C. L. and Merlis, T. M.: Evaluating the Evidence of a Global Sea Surface Temperature Threshold for Tropical Cyclone Genesis, J. Climate, 30, 9133–9145, https://doi.org/10.1175/JCLI-D-16-0737.1, 2017. a
DOC/NOAA/NWS/NCEP: NCEP GFS 0.25 Degree Global Forecast Grids Historical Archive, updated daily, NSF National Center for Atmospheric Research [data set], https://doi.org/10.5065/D65D8PWK, 2015. a, b
Du, X., Chen, H., Li, Q., and Ge, X.: Urban Impact on Landfalling Tropical Cyclone Precipitation: A Numerical Study of Typhoon Rumbia (2018), Adv. Atmos. Sci., 40, 988–1004, https://doi.org/10.1007/s00376-022-2100-8, 2023. a
Fogarty, E. A., Elsner, J. B., Jagger, T. H., biu Liu, K., and sheun Louie, K.: Variations in typhoon landfalls over China, Adv. Atmos. Sci., 23, 665–677, https://doi.org/10.1007/s00376-006-0665-2, 2006. a
Fudeyasu, H. and Wang, Y.: Balanced Contribution to the Intensification of a Tropical Cyclone Simulated in TCM4: Outer-Core Spinup Process, J. Atmos. Sci., 68, 430–449, https://doi.org/10.1175/2010JAS3523.1, 2011. a
Fujiwhara, S.: The natural tendency towards symmetry of motion and its application as a principle in meteorology, Q. J. Roy. Meteor. Soc., 47, 287–292, https://doi.org/10.1002/qj.49704720010, 1921. a
Geiger, T., Gütschow, J., Bresch, D. N., Emanuel, K., and Frieler, K.: Global population profile of tropical cyclone exposure from 2002 to 2019, Nature, 626, 549–554, https://doi.org/10.1038/s41586-023-06963-z, 2024. a
Grell, A. G., Dudhia, J., and Stauffer, D. R.: A description of the fifth-generation Penn State/NCAR Mesoscale Model (MM5), Tech. rep., NSF National Center for Atmospheric Research, https://opensky.ucar.edu/system/files/2024-08/technotes_170.pdf (last access: 28 October 2025), 1994. a, b
Guzman, O. and Jiang, H.: Global increase in tropical cyclone rain rate, Nat. Commun., 12, 5344, https://doi.org/10.1038/s41467-021-25685-2, 2022. a
Hall, C. and Woo, R.: Typhoon Bebinca lashes Shanghai in strongest storm to hit city since 1949, https://www.reuters.com/world/china/typhoon-bebinca-lands- shanghai-strongest-storm-hit-city-since-1949-2024-09-15/ (last access: 16 September 2024), 2024. a
Holland, G. J.: The Maximum Potential Intensity of Tropical Cyclones, J. Atmos. Sci., 54, 2519–2541, https://doi.org/10.1175/1520-0469(1997)054<2519:TMPIOT>2.0.CO;2, 1997. a
Hong, S. and Lim, J.-O. J.: The WRF Single-Moment 6-Class Microphysics Scheme (WSM6), Asia-Pac. J. Atmos. Sci., 42, 129–151, https://api.semanticscholar.org/CorpusID:120362377 (last access: 23 October 2025), 2006. a, b
Hong, S.-Y., Dudhia, J., and Chen, S.-H.: A Revised Approach to Ice Microphysical Processes for the Bulk Parameterization of Clouds and Precipitation, Mon. Weather Rev., 132, 103–120, https://doi.org/10.1175/1520-0493(2004)132<0103:ARATIM>2.0.CO;2, 2004. a, b
Hu, C., Tam, C.-Y., Loi, C. L., Cheung, K. K. W., Li, Y., Yang, Z.-L., Au-Yeung, Y. M., Fang, X., and Niyogi, D.: Urbanization Impacts on Tropical Cyclone Rainfall Extremes-Inferences From Observations and Convection-Permitting Model Experiments Over South China, J. Geophys. Res.-Atmos., 128, e2023JD038813, https://doi.org/10.1029/2023JD038813, 2023. a, b
Huang, M., Wang, Q., Liu, M., Lin, N., Wang, Y., Jing, R., Sun, J., Murakami, H., and Lou, W.: Increasing typhoon impact and economic losses due to anthropogenic warming in Southeast China, Scientific Reports, 12, 14048, https://doi.org/10.1038/s41598-022-17323-8, 2022. a
Huang, X., Chan, J. C. L., Zhan, R., Yu, Z., and Wan, R.: Record-breaking rainfall accumulations in eastern China produced by Typhoon In-fa (2021), Atmos. Sci. Lett., 24, e1153, https://doi.org/10.1002/asl.1153, 2023. a
IPCC: Climate Change 2021 – The Physical Science Basis: Working Group I Contribution to the Sixth Assessment Report of the Intergovernmental Panel on Climate Change, chap. 10, Cambridge University Press, https://doi.org/10.1017/9781009157896.021, 2023. a, b
Iturbide, M., Fernández, J., Gutiérrez, J. M., Pirani, A., Huard, D., Khourdajie, A. A., Baño-Medina, J., Bedia, J., Casanueva, A., Cimadevilla, E., Cofiño, A., Felice, M. D., Diez-Sierra, J., García-Díez, M., Goldie, J., Herrera, D. A., Herrera, S., Manzanas, R., and Milovac, J.: Implementation of FAIR principles in the IPCC: the WGI AR6 Atlas repository, Scientific Data, 9, 629, https://doi.org/10.1038/s41597-022-01739-y, 2022. a
Jiang, N., Zhu, C., Hu, Z.-Z., McPhaden, M. J., Chen, D., Liu, B., Ma, S., Yan, Y., Zhou, T., Qian, W., Luo, J., Yang, X., Liu, F., and Zhu, Y.: Enhanced risk of record-breaking regional temperatures during the 2023–24 El Niño, Scientific Reports, 14, 2521, https://doi.org/10.1038/s41598-024-52846-2, 2024. a
Jin, F. F., Boucharel, J., and Lin, I. I.: Eastern Pacific tropical cyclones intensified by El Niño delivery of subsurface ocean heat, Nature, 516, 82–85, https://doi.org/10.1038/nature13958, 2014. a, b
Kain, J. S.: The Kain–Fritsch Convective Parameterization: An Update, J. Appl. Meteorol., 43, 170–181, https://doi.org/10.1175/1520-0450(2004)043<0170:TKCPAU>2.0.CO;2, 2004. a
Kanada, S., Tsujino, S., Aiki, H., Yoshioka, M. K., Miyazawa, Y., Tsuboki, K., and Takayabu, I.: Impacts of SST Patterns on Rapid Intensification of Typhoon Megi (2010), J. Geophys. Res.-Atmos., 122, 13245–13262, https://doi.org/10.1002/2017JD027252, 2017. a
Kang, N.-Y., Kim, D., and Elsner, J. B.: The contribution of super typhoons to tropical cyclone activity in response to ENSO, Scientific reports, 9, 5046, https://doi.org/10.1038/s41598-019-41561-y, 2019. a
Knutson, T. R., Sirutis, J. J., Vecchi, G. A., Garner, S., Zhao, M., Kim, H.-S., Bender, M., Tuleya, R. E., Held, I. M., and Villarini, G.: Dynamical Downscaling Projections of Twenty-First-Century Atlantic Hurricane Activity: CMIP3 and CMIP5 Model-Based Scenarios, J. Climate, 26, 6591–6617, https://doi.org/10.1175/JCLI-D-12-00539.1, 2013. a
Knutson, T. R., Chung, M. V., Vecchi, G., Sun, J., Hsieh, T.-L., and Smith, A. J.: Climate change is probably increasing the intensity of tropical cyclones, Tyndall Centre for Climate Change Research, Zenodo, https://doi.org/10.5281/zenodo.4570334, 2021. a
Kossin, J. P., Knapp, K. R., Olander, T. L., and Velden, C. S.: Global increase in major tropical cyclone exceedance probability over the past four decades, P. Natl. Acad. Sci. USA, 117, 11975–11980, https://doi.org/10.1073/pnas.1920849117, 2020. a
Lee, J.-D., Ito, K., and Chan, J. C.: Importance of self-induced vertical wind shear and diabatic heating on the Fujiwhara effect, Q. J. Roy. Meteor. Soc., 149, 1197–1212, 2023. a
Li, G., Li, Q., Xu, Y., Xu, P., Wang, W., Huang, D., Wu, Y., and He, L.: Changes of Tropical Cyclones Landfalling in China From 1979 to 2018, J. Geophys. Res.-Atmos., 127, e2022JD036701, https://doi.org/10.1029/2022JD036701, 2022. a, b
Li, L. and Chakraborty, P.: Slower decay of landfalling hurricanes in a warming world, Nature, 587, https://doi.org/10.1038/s41586-020-2867-7, 2020. a
Liang, J., Wu, L., Gu, G., and Liu, Q.: Rapid weakening of Typhoon Chan-Hom (2015) in a monsoon gyre, J. Geophys. Res.-Atmos., 121, 9508–9520, https://doi.org/10.1002/2016JD025214, 2016. a
Liang, P., Yan, Z.-W., and Li, Z.: Climatic warming in Shanghai during 1873–2019 based on homogenised temperature records, Advances in Climate Change Research, 13, 496–506, https://doi.org/10.1016/j.accre.2022.05.006, 2022. a
Lin, Y., Zhao, M., and Zhang, M.: Tropical cyclone rainfall area controlled by relative sea surface temperature, Nat. Commun., 6, 6591, https://doi.org/10.1038/ncomms7591, 2015. a, b, c
Liu, J. and Niyogi, D.: Meta-analysis of urbanization impact on rainfall modification, Scientific Reports, 9, 7301, https://doi.org/10.1038/s41598-019-42494-2, 2019. a
Liu, J.-C., Liou, Y.-A., Wu, M.-X., Lee, Y.-J., Cheng, C.-H., Kuei, C.-P., and Hong, R.-M.: Analysis of interactions among two tropical depressions and typhoons Tembin and Bolaven (2012) in Pacific Ocean by using satellite cloud images, IEEE T. Geosci. Remote, 53, 1394–1402, https://doi.org/10.1109/TGRS.2014.2339220, 2015. a
Liu, Q., Peng, W. Z. M., and Li, T.: Factors controlling northward and north-eastward moving tropical cyclones near the coast of East Asia, Frontiers of Earth Science, 13, 778–790, https://doi.org/10.1007/s11707-019-0797-1, 2019. a
Lu, X., Yu, H., Ying, M., Zhao, B., Zhang, S., Lin, L., Bai, L., and Wan, R.: Western North Pacific Tropical Cyclone Database Created by the China Meteorological Administration, Adv. Atmos. Sci., 38, 690–699, https://doi.org/10.1007/s00376-020-0211-7, 2021. a
Martilli, A., Clappier, A., and Rotach, M. W.: An urban surface exchange parameterisation for mesoscale models, Bound.-Lay. Meteorol., 104, 261–304, https://doi.org/10.1023/A:1016099921195, 2002. a
Mlawer, E. J., Taubman, S. J., Brown, P. D., Iacono, M. J., and Clough, S. A.: Radiative transfer for inhomogeneous atmospheres: RRTM, a validated correlated-k model for the longwave, Journal of Geophysical Res.-Atmos., 102, 16663–16682, https://doi.org/10.1029/97JD00237, 1997. a
Nie, Y. and Sun, J.: Moisture Sources and Transport for Extreme Precipitation Over Henan in July 2021, Geophys. Res. Lett., 49, e2021GL097446, https://doi.org/10.1029/2021GL097446, 2022. a
Niu, G.-Y., Yang, Z.-L., Mitchell, K. E., Chen, F., Ek, M. B., Barlage, M., Kumar, A., Manning, K., Niyogi, D., Rosero, E., Tewari, M., and Xia, Y.: The community Noah land surface model with multiparameterization options (Noah-MP): 1. Model description and evaluation with local-scale measurements, J. Geophys. Res.-Atmos., 116, D12109, https://doi.org/10.1029/2010JD015139, 2011. a, b
NOAA National Centers for Environmental Information: GHRSST Level 4 AVHRR_OI Global Blended Sea Surface Temperature Analysis (GDS2) from NCEI (AVHRR_OI-NCEI-L4-GLOB-v2.1), Ver. 2.1, PO.DAAC [data set], CA, USA, https://doi.org/10.5067/GHAAO-4BC21, 2020. a, b
Peduzzi, P., Chatenoux, B., Dao, H., Bono, A. D., Herold, C., Kossin, J., Mouton, F., and Nordbeck, O.: Global trends in tropical cyclone risk, Nat. Clim. Change, 2, 289–294, https://doi.org/10.1038/nclimate1410, 2012. a, b
Pengpai News: The maximum rainfall was 437.3 mm. The water level in five places exceeded the historical record. No one was injured or killed in Shanghai due to “fireworks”. Does the “Magic City” have a “barrier”? Is the “barrier” soft or solid?, https://www.thepaper.cn/newsDetail_forward_13784206 (last access: 23 October 2025), 28 July 2021 (in Chinese). a
Pérez-Alarcón, A., Fernández-Alvarez, J. C., and Coll-Hidalgo, P.: Global Increase of the Intensity of Tropical Cyclones under Global Warming Based on their Maximum Potential Intensity and CMIP6 Models, Environmental Processes, 10, 36, https://doi.org/10.1007/s40710-023-00649-4, 2023. a
Qin, L., Zhu, L., Liao, X., Meng, C., Han, Q., Li, Z., Shen, S., Xu, W., and Chen, J.: Recent northward shift of tropical cyclone economic risk in China, npj Natural Hazards, 1, 8, https://doi.org/10.1038/s44304-024-00008-9, 2024. a, b, c
Radu, R., Toumi, R., and Phau, J.: Influence of atmospheric and sea surface temperature on the size of hurricane Catarina, Q. J. Roy. Meteor. Soc., 140, 1778–1784, https://doi.org/10.1002/qj.2232, 2014. a
Rappaport, E. N.: Loss of Life in the United States Associated with Recent Atlantic Tropical Cyclones, B. Am. Meteorol. Soc., 81, 2065–2074, https://doi.org/10.1175/1520-0477(2000)081<2065:LOLITU>2.3.CO;2, 2000. a
Shan, K. and Yu, X.: Variability of Tropical Cyclone Landfalls in China, J. Climate, 34, 9235–9247, https://doi.org/10.1175/JCLI-D-21-0031.1, 2021. a
Shanghai Statistics Bureau: Shanghai Statistical Yearbook, https://tjj.sh.gov.cn/ (last access: 23 October 2025), 2022. a
Shem, W. and Shepherd, M.: On the impact of urbanization on summertime thunderstorms in Atlanta: Two numerical model casestudies, Atmos. Res., 92, 172–189, https://doi.org/10.1016/j.atmosres.2008.09.013, 2009. a
Shen, Y., Sun, Y., Zhong, Z., Liu, K., and Shi, J.: Sensitivity Experiments on the Poleward Shift of Tropical Cyclones over the Western North Pacific under Warming Ocean Conditions, J. Meteorol. Res.-PRC, 32, 560–570, https://doi.org/10.1007/s13351-018-8047-0, 2018. a
Shepherd, J. M., Carter, M., Manyin, M., Messen, D., and Burlan, S.: The impact of urbanization on current and future coastal precipitation: A case study for Houston, Environ. Plann. B, 37, 284–304, https://doi.org/10.1068/b34102t, 2010. a
Shi, J. and Cui, L.: Characteristics of high impact weather and meteorological disaster in Shanghai, China, Nat. Hazards, 60, 951–969, https://doi.org/10.1007/s11069-011-9877-6, 2012. a
Shimokawa, S., Iizuka, S., Kayahara, T., Suzuki, S., and Murakami, T.: Fujiwhara effect; the interaction between T0917 and T0918, Natural Disaster Research Report, 45, 23–26, 2011. a
Shultz, J. M., Shepherd, J. M., Bagrodia, R., and Espinel, Z.: Tropical cyclones in a year of rising global temperatures and a strengthening El Niño, Disaster Health, 2, 151–162, https://doi.org/10.1080/21665044.2014.1111722, 2014. a
Skamarock, W. C., Klemp, J. B., Dudhia, J., Gill, D. O., Liu, Z., Berner, J., and Huang, X.: A description of the advanced research WRF model version 4, Tech. rep., NCAR Technical Notes NCAR/TN-556+STR, https://doi.org/10.5065/1dfh-6p97, 2021. a
Srinivasa, C. V., Mohan, G. M., Rao, D. V. B., Baskaran, R., and Venkatraman, B.: Numerical Simulations with WRF to Study the Impact of Sea Surface Temperature on the Evolution of Tropical Cyclones Over Bay of Bengal, Springer International Publishing, Cham, 259–271, https://doi.org/10.1007/978-3-319-40576-6_18, 2017. a
Stansfield, A. M. and Reed, K. A.: Global tropical cyclone precipitation scaling with sea surface temperature, npj Climate and Atmospheric Science, 6, 60, https://doi.org/10.1038/s41612-023-00391-6, 2023. a
Sun, Q., Fang, J., Dang, X., Xu, K., Fang, Y., Li, X., and Liu, M.: Multi-scenario urban flood risk assessment by integrating future land use change models and hydrodynamic models, Nat. Hazards Earth Syst. Sci., 22, 3815–3829, https://doi.org/10.5194/nhess-22-3815-2022, 2022. a
Sun, Y., Zhong, Z., Ha, Y., Wang, Y., and Wang, X.: The dynamic and thermodynamic effects of relative and absolute sea surface temperature on tropical cyclone intensity, Acta Meteorol. Sin., 27, 40–49, https://doi.org/10.1007/s13351-013-0105-z, 2013. a
Tamarin-Brodsky, T. and Kaspi, Y.: Enhanced poleward propagation of storms under climate change, Nat. Geosci., 10, 908–913, https://doi.org/10.1038/s41561-017-0001-8, 2017. a
Tan, H., Cai, R., and Huang, R.: Enhanced Responses of Sea Surface Temperature over Offshore China to Global Warming and Hiatus, Climate Change Research, 12, 500–507, https://doi.org/10.12006/j.issn.1673-1719.2016.038, 2016 (in Chinese). a
Tang, Y., Huangfu, J., Huang, R., and Chen, W.: Surface warming reacceleration in offshore China and its interdecadal effects on the East Asia–Pacific climate, Scientific Reports, 10, 14811, https://doi.org/10.1038/s41598-020-71862-6, 2020. a
Tao, D. and Zhang, F.: Effect of environmental shear, sea-surface temperature, and ambient moisture on the formation and predictability of tropical cyclones: An ensemble-mean perspective, J. Adv. Model. Earth Sy., 6, 384–404, https://doi.org/10.1002/2014MS000314, 2014. a, b
The Straits Times: Shanghai hit by second typhoon days after historic storm, https://www.straitstimes.com/asia/east-asia/shanghai-hit-by-second-typhoon-days-after-historic-storm (last access: 23 October 2025), 2024. a
Tian, Z., Ramsbottom, D., Sun, L., Huang, Y., Zou, H., and Liu, J.: Dynamic adaptive engineering pathways for mitigating flood risks in Shanghai with regret theory, Nature Water, 1, 198–208, https://doi.org/10.1038/s44221-022-00017-w, 2023. a
Torelló-Sentelles, H., Marra, F., Koukoula, M., Villarini, G., and Peleg, N.: Intensification and changing spatial extent of heavy rainfall in urban areas, Earth's Future, 12, e2024EF004505, https://doi.org/10.1029/2024EF004505, 2024. a
Torelló-Sentelles, H., Villarini, G., Koukoula, M., and Peleg, N.: Impacts of urban dynamics and thermodynamics on convective rainfall across different urban forms, Urban Climate, 62, 102499, https://doi.org/10.1016/j.uclim.2025.102499, 2025. a
Tran, T. L., Ritchie, E. A., Perkins-Kirkpatrick, S. E., Bui, H., and Luong, T. M.: Variations in Rainfall Structure of Western North Pacific Landfalling Tropical Cyclones in the Warming Climates, Earth's Future, 12, e2024EF004808, https://doi.org/10.1029/2024EF004808, 2024. a, b
Van den Heever, S. C. and Cotton, W. R.: Urban aerosol impacts on downwind convective storms, J. Appl. Meteorol. Clim., 46, 828–850, https://doi.org/10.1175/JAM2492.1, 2007. a
Wang, B. and Chan, J. C.: How strong ENSO events affect tropical storm activity over the western North Pacific, J. Climate, 15, 1643–1658, 2002. a
Wang, J., Yi, S., Li, M., Wang, L., and Song, C.: Effects of sea level rise, land subsidence, bathymetric change and typhoon tracks on storm flooding in the coastal areas of Shanghai, Sci. Total Environ., 621, 228–234, https://doi.org/10.1016/j.scitotenv.2017.11.224, 2018. a
Wang, Q., Qian, C., Dong, L., Xiang, C., Xu, Y., Zhang, L., and Li, X.: Analysis on main characteristics of Typhoon Muifa (2022) and difficulties in its track forecast, J. Mar. Meteor, 43, 52–62, https://doi.org/10.19513/j.cnki.issn2096-3599.2023.01.005, 2023 (in Chinese). a
Wang, S. and Toumi, R.: Recent migration of tropical cyclones toward coasts, Science, 371, 514–517, https://doi.org/10.1126/science.abb9038, 2021. a
Wang, Y., Lee, K.-H., Lin, Y., Levy, M., and Zhang, R.: Distinct effects of anthropogenic aerosols on tropical cyclones, Nat. Clim. Change, 4, 368–373, https://doi.org/10.1038/nclimate2144, 2014. a
Wever, N.: Quantifying trends in surface roughness and the effect on surface wind speed observations, J. Geophys. Res.-Atmos., 117, https://doi.org/10.1029/2011JD017118, 2012. a
WMO: World Meteorological Organization declares onset of El Niño conditions, https://wmo.int/news/media-centre/world-meteorological-organization-declares-onset-of-el-nino- conditions#:~:text=A new Update from the World (last access: 23 October 2025), 4 July 2023. a
Wu, J., Gao, L., Meng, Q., and Wang, H.: Effect of land cover pattern on rainfall during a landfalling typhoon: A simulation of Typhoon Hato, Atmos. Res., 303, 107329, https://doi.org/10.1016/j.atmosres.2024.107329, 2024. a
Wu, M., Chang, W., and Leung, W.: Impacts of El Niño–Southern Oscillation events on tropical cyclone landfalling activity in the western North Pacific, J. Climate, 17, 1419–1428, 2004. a
Xie, Y., Ren, F., Li, G., Wang, M., and Yang, H.: Climatic characteristics of influencing China binary tropical cyclones, Advances in Earth Science, 35, 101, https://doi.org/10.11867/j.issn.1001-8166.2020.007, 2020 (in Chinese). a
Xinhua News: Shanghai evacuates hundreds of thousands as Typhoon Pulasan triggers heavy rainfall, https://english.news.cn/20240920/9018b674675b4124b9f38ea5c60fb333/c.html (last access: 20 September 2024), 2024. a
Yamaguchi, M., Chan, J. C. L., Moon, I.-J., Yoshida, K., and Mizuta, R.: Global warming changes tropical cyclone translation speed, Nat. Commun., 11, 47, https://doi.org/10.1038/s41467-019-13902-y, 2020. a
Yin, J., Lin, N., Yang, Y., Pringle, W. J., Tan, J., Westerink, J. J., and Yu, D.: Hazard Assessment for Typhoon-Induced Coastal Flooding and Inundation in Shanghai, China, J. Geophys. Res.-Oceans, 126, e2021JC017319, https://doi.org/10.1029/2021JC017319, 2021. a, b, c
Ying, M., Zhang, W., Yu, H., Lu, X., Feng, J., Fan, Y., Zhu, Y., and Chen, D.: An Overview of the China Meteorological Administration Tropical Cyclone Database, J. Atmos. Ocean. Tech., 31, 287–301, https://doi.org/10.1175/JTECH-D-12-00119.1, 2014. a
Zhao, Y., Liu, R., Yao, C., Li, S., Wu, Z., Gong, Z., and Feng, G.: The relationship between the South China Sea summer monsoon onset and North Pacific meridional sea surface temperature anomalies, Int. J. Climatol., 44, 3483–3498, https://doi.org/10.1002/joc.8534, 2024. a
Zhuang, Q., Koukoula, M., and Peleg, N.: Numerical experiment in Shanghai: Variability of typhoon Rumbia (2018) with SST increase, TIB AV-Portal [video], https://doi.org/10.5446/68890, 2024a. a, b
Zhuang, Q., Koukoula, M., Liu, S., Zhou, Z., Gao, L., and Peleg, N.: Contradictory influences of urbanization on intense convective rainfall in a subtropical city, Environ. Res. Lett., 19, 104020, https://doi.org/10.1088/1748-9326/ad7277, 2024b. a
Zong, Y. and Chen, X.: Typhoon Hazards in the Shanghai Area, Disasters, 23, 66–80, https://doi.org/10.1111/1467-7717.00105, 1999. a
- Abstract
- Introduction
- Study area, typhoon events, and data
- Methods
- Results
- The increase in TC hazards and their implications for risk assessments
- Conclusions
- Data availability
- Video supplement
- Author contributions
- Competing interests
- Disclaimer
- Acknowledgements
- Financial support
- Review statement
- References
- Supplement